Tag Archives: Routing Security

A framework for measuring Internet resilience

Post Syndicated from Vasilis Giotsas original https://blog.cloudflare.com/a-framework-for-measuring-internet-resilience/

On July 8, 2022, a massive outage at Rogers, one of Canada’s largest telecom providers, knocked out Internet and mobile services for over 12 million users. Why did this single event have such a catastrophic impact? And more importantly, why do some networks crumble in the face of disruption while others barely stumble?

The answer lies in a concept we call Internet resilience: a network’s ability not just to stay online, but to withstand, adapt to, and rapidly recover from failures.

It’s a quality that goes far beyond simple “uptime.” True resilience is a multi-layered capability, built on everything from the diversity of physical subsea cables to the security of BGP routing and the health of a competitive market. It’s an emergent property much like psychological resilience: while each individual network must be robust, true resilience only arises from the collective, interoperable actions of the entire ecosystem. In this post, we’ll introduce a data-driven framework to move beyond abstract definitions and start quantifying what makes a network resilient. All of our work is based on public data sources, and we’re sharing our metrics to help the entire community build a more reliable and secure Internet for everyone.

What is Internet resilience?

In networking, we often talk about “reliability” (does it work under normal conditions?) and “robustness” (can it handle a sudden traffic surge?). But resilience is more dynamic. It’s the ability to gracefully degrade, adapt, and most importantly, recover. For our work, we’ve adopted a pragmatic definition:

Internet resilience is the measurable capability of a national or regional network ecosystem to maintain diverse and secure routing paths in the face of challenges, and to rapidly restore connectivity following a disruption.

This definition links the abstract goal of resilience to the concrete, measurable metrics that form the basis of our analysis.

Local decisions have global impact

The Internet is a global system but is built out of thousands of local pieces. Every country depends on the global Internet for economic activity, communication, and critical services, yet most of the decisions that shape how traffic flows are made locally by individual networks.

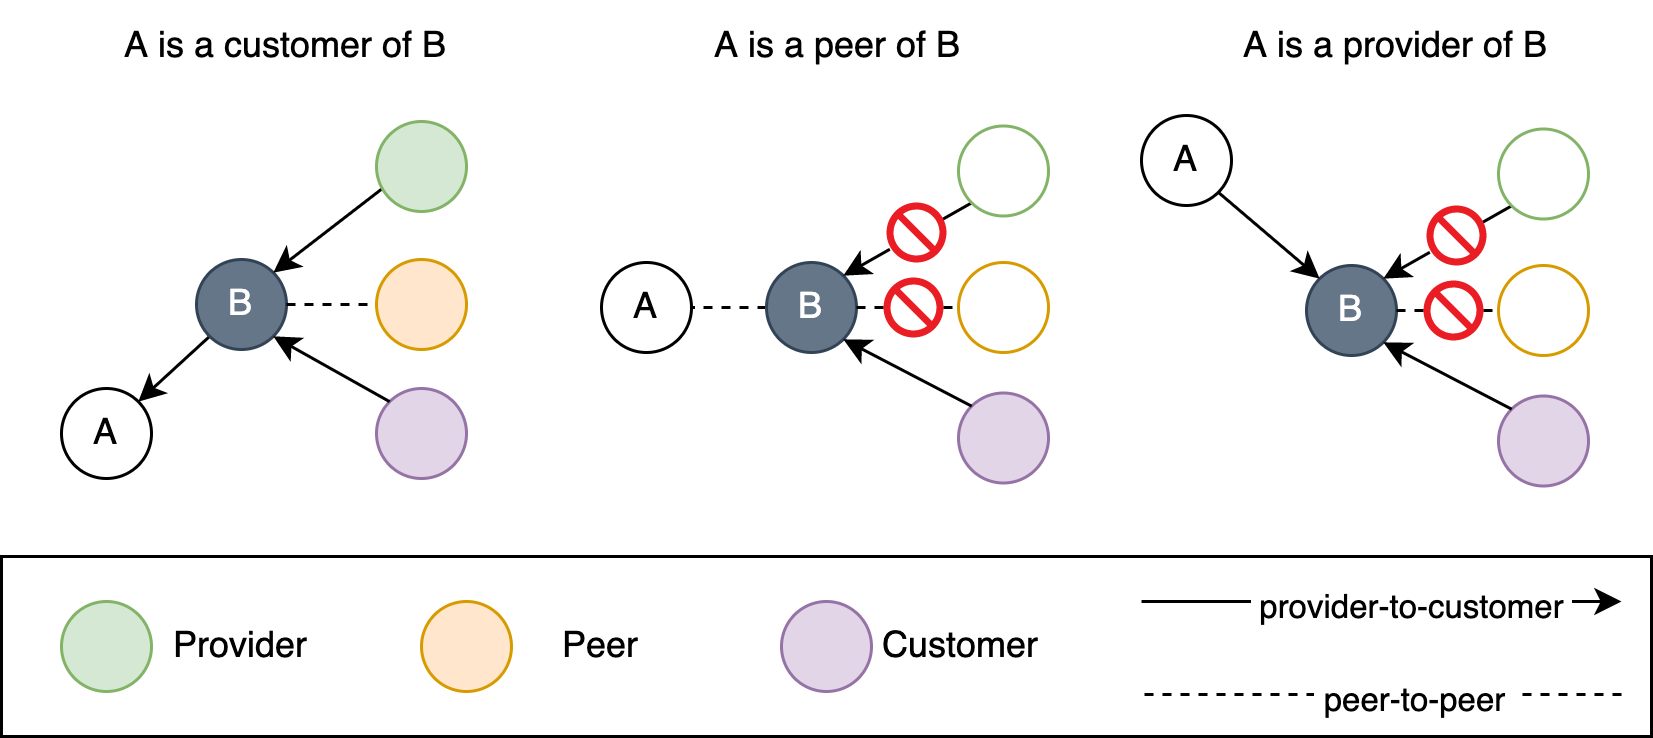
In most national infrastructures like water or power grids, a central authority can plan, monitor, and coordinate how the system behaves. The Internet works very differently. Its core building blocks are Autonomous Systems (ASes), which are networks like ISPs, universities, cloud providers or enterprises. Each AS controls autonomously how it connects to the rest of the Internet, which routes it accepts or rejects, how it prefers to forward traffic, and with whom it interconnects. That’s why they’re called Autonomous Systems in the first place! There’s no global controller. Instead, the Internet’s routing fabric emerges from the collective interaction of thousands of independent networks, each optimizing for its own goals.

This decentralized structure is one of the Internet’s greatest strengths: no single failure can bring the whole system down. But it also makes measuring resilience at a country level tricky. National statistics can hide local structures that are crucial to global connectivity. For example, a country might appear to have many international connections overall, but those connections could be concentrated in just a handful of networks. If one of those fails, the whole country could be affected.

For resilience, the goal isn’t to isolate national infrastructure from the global Internet. In fact, the opposite is true: healthy integration with diverse partners is what makes both local and global connectivity stronger. When local networks invest in secure, redundant, and diverse interconnections, they improve their own resilience and contribute to the stability of the Internet as a whole.

This perspective shapes how we design and interpret resilience metrics. Rather than treating countries as isolated units, we look at how well their networks are woven into the global fabric: the number and diversity of upstream providers, the extent of international peering, and the richness of local interconnections. These are the building blocks of a resilient Internet.

Route hygiene: Keeping the Internet healthy

The Internet is constructed according to a layered model, by design, so that different Internet components and features can evolve independent of the others. The Physical layer stores, carries, and forwards, all the bits and bytes transmitted in packets between devices. It consists of cables, routers and switches, but also buildings that house interconnection facilities. The Application layer sits above all others and has virtually no information about the network so that applications can communicate without having to worry about the underlying details, for example, if a network is ethernet or Wi-Fi. The application layer includes web browsers, web servers, as well as caching, security, and other features provided by Content Distribution Networks (CDNs). Between the physical and application layers is the Network layer responsible for Internet routing. It is ‘logical’, consisting of software that learns about interconnection and routes, and makes (local) forwarding decisions that deliver packets to their destinations. 

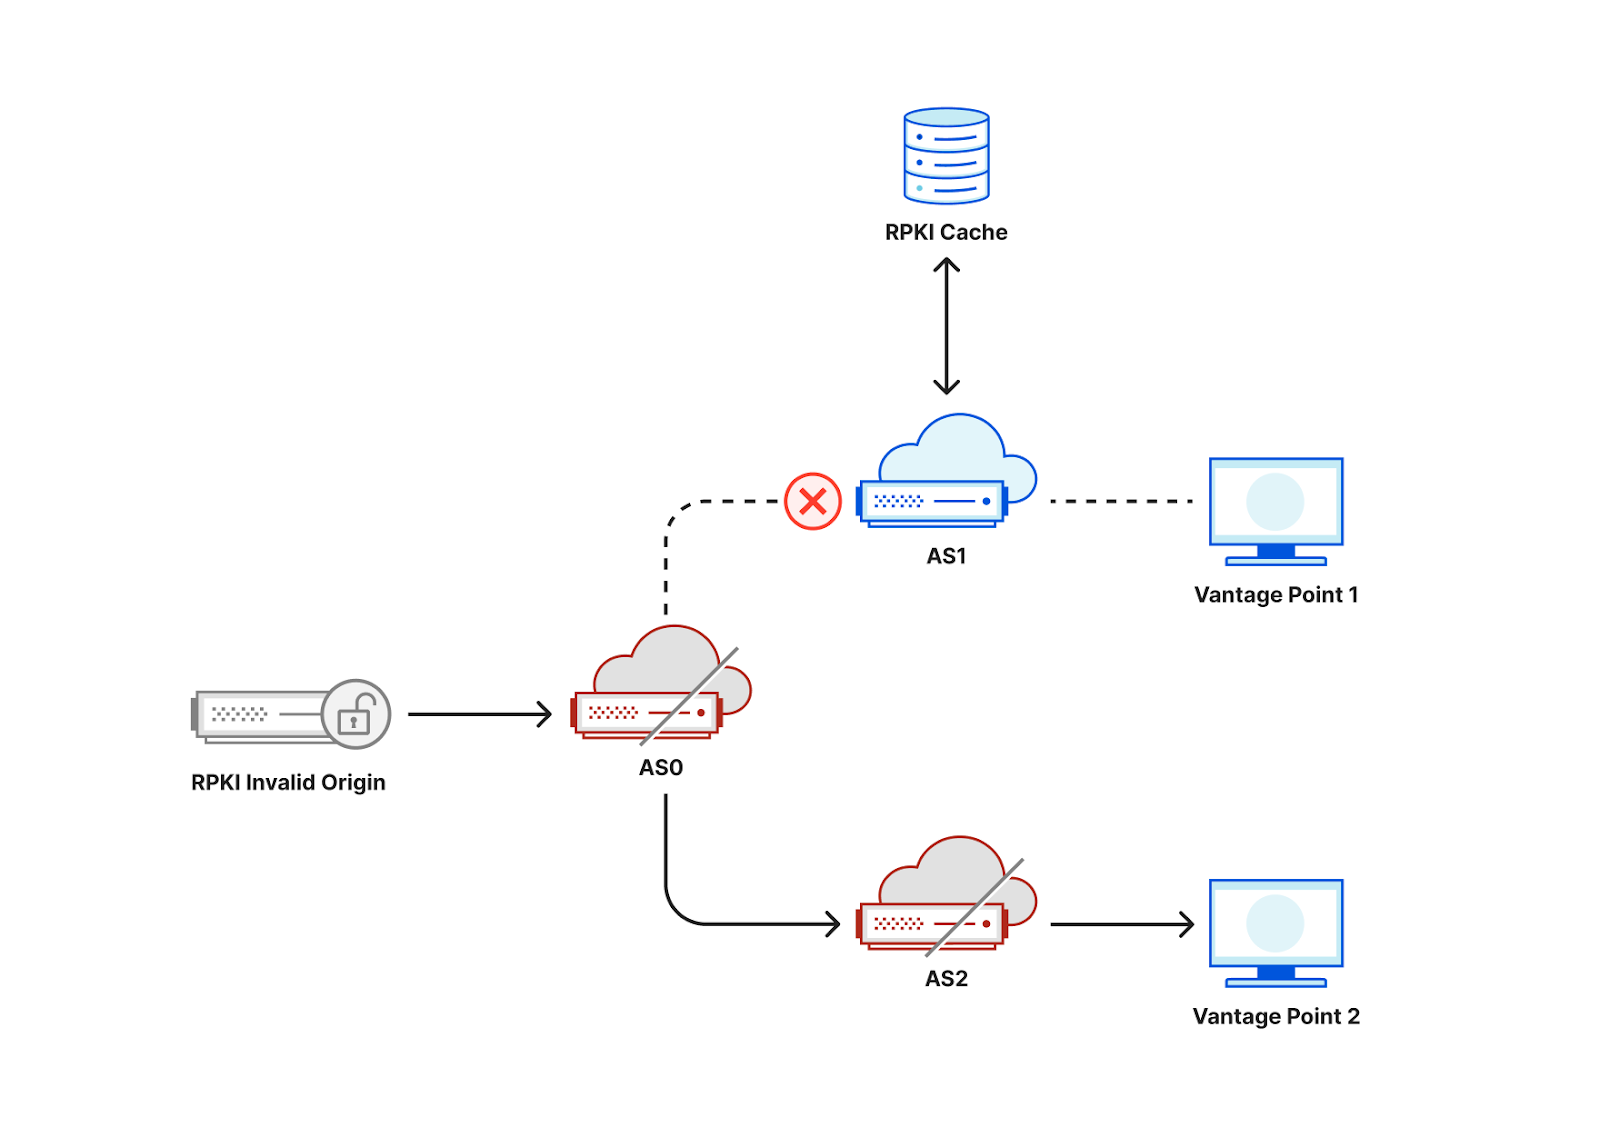
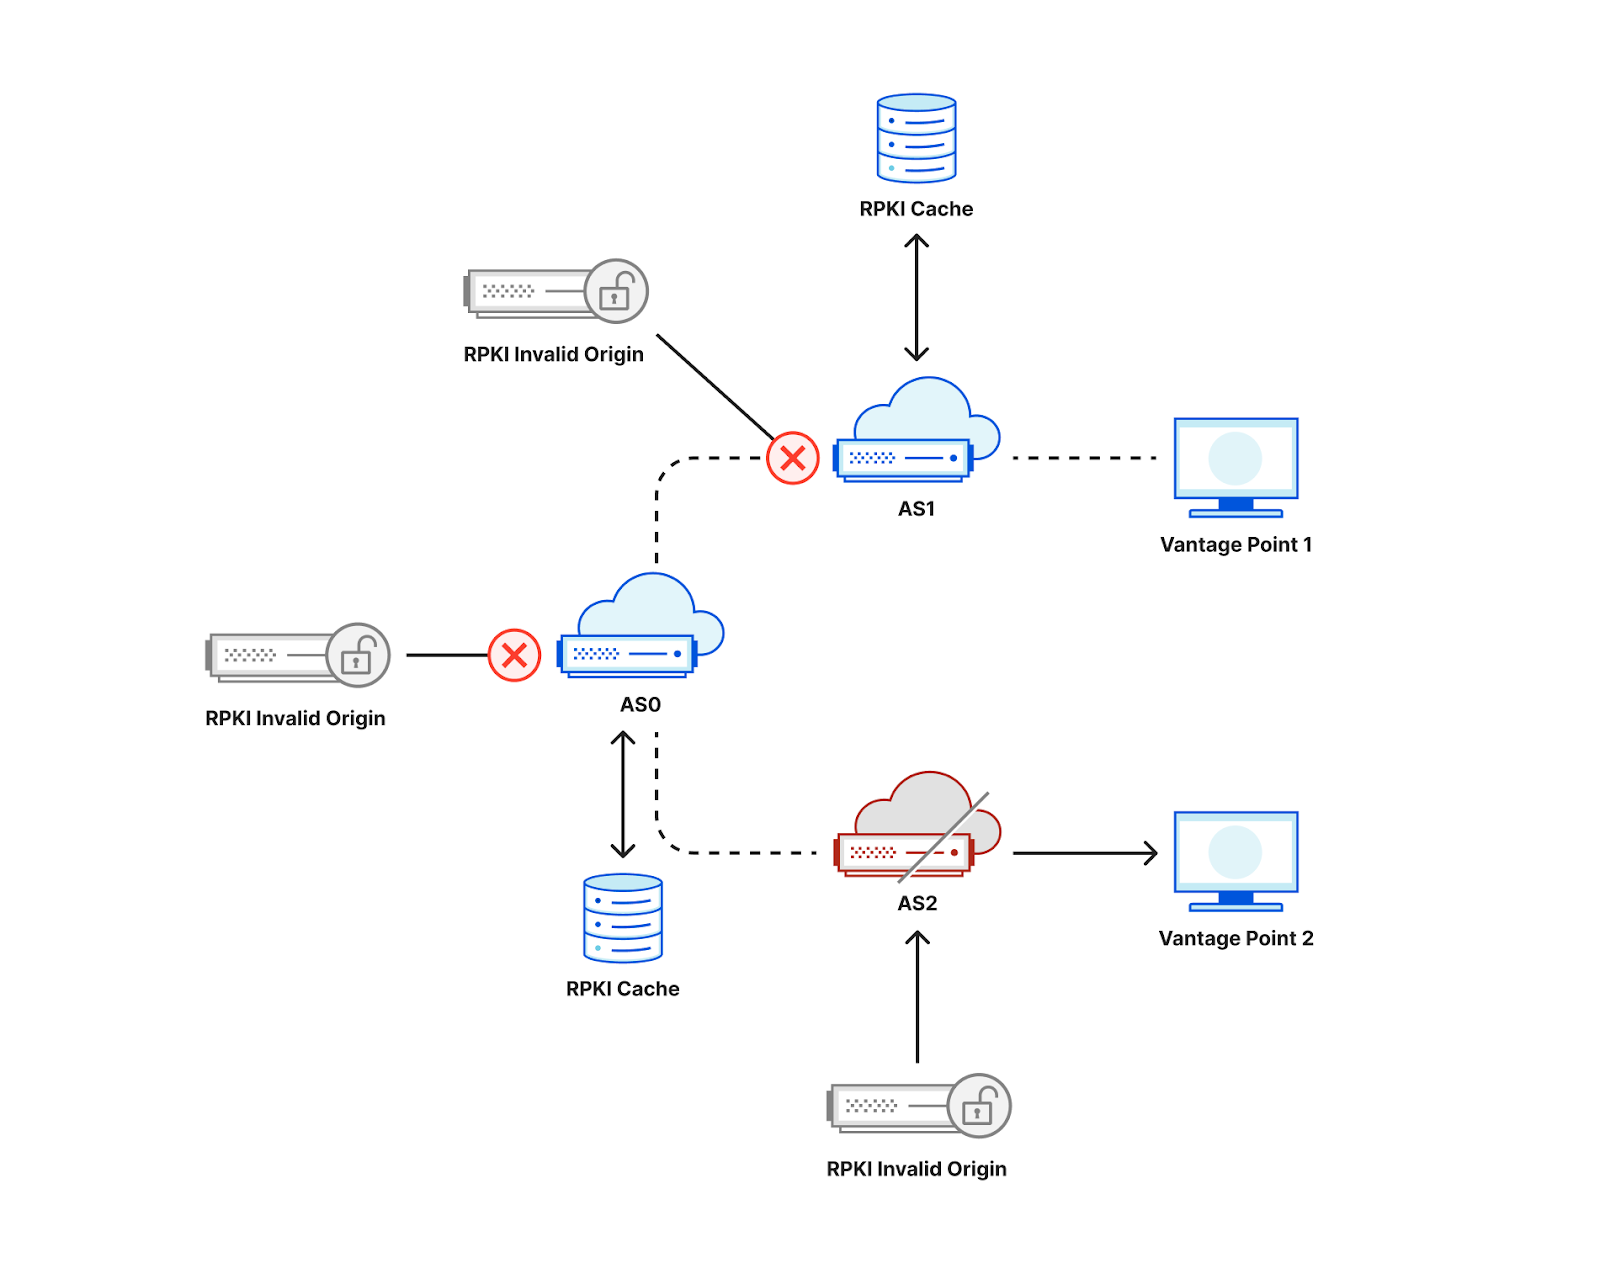
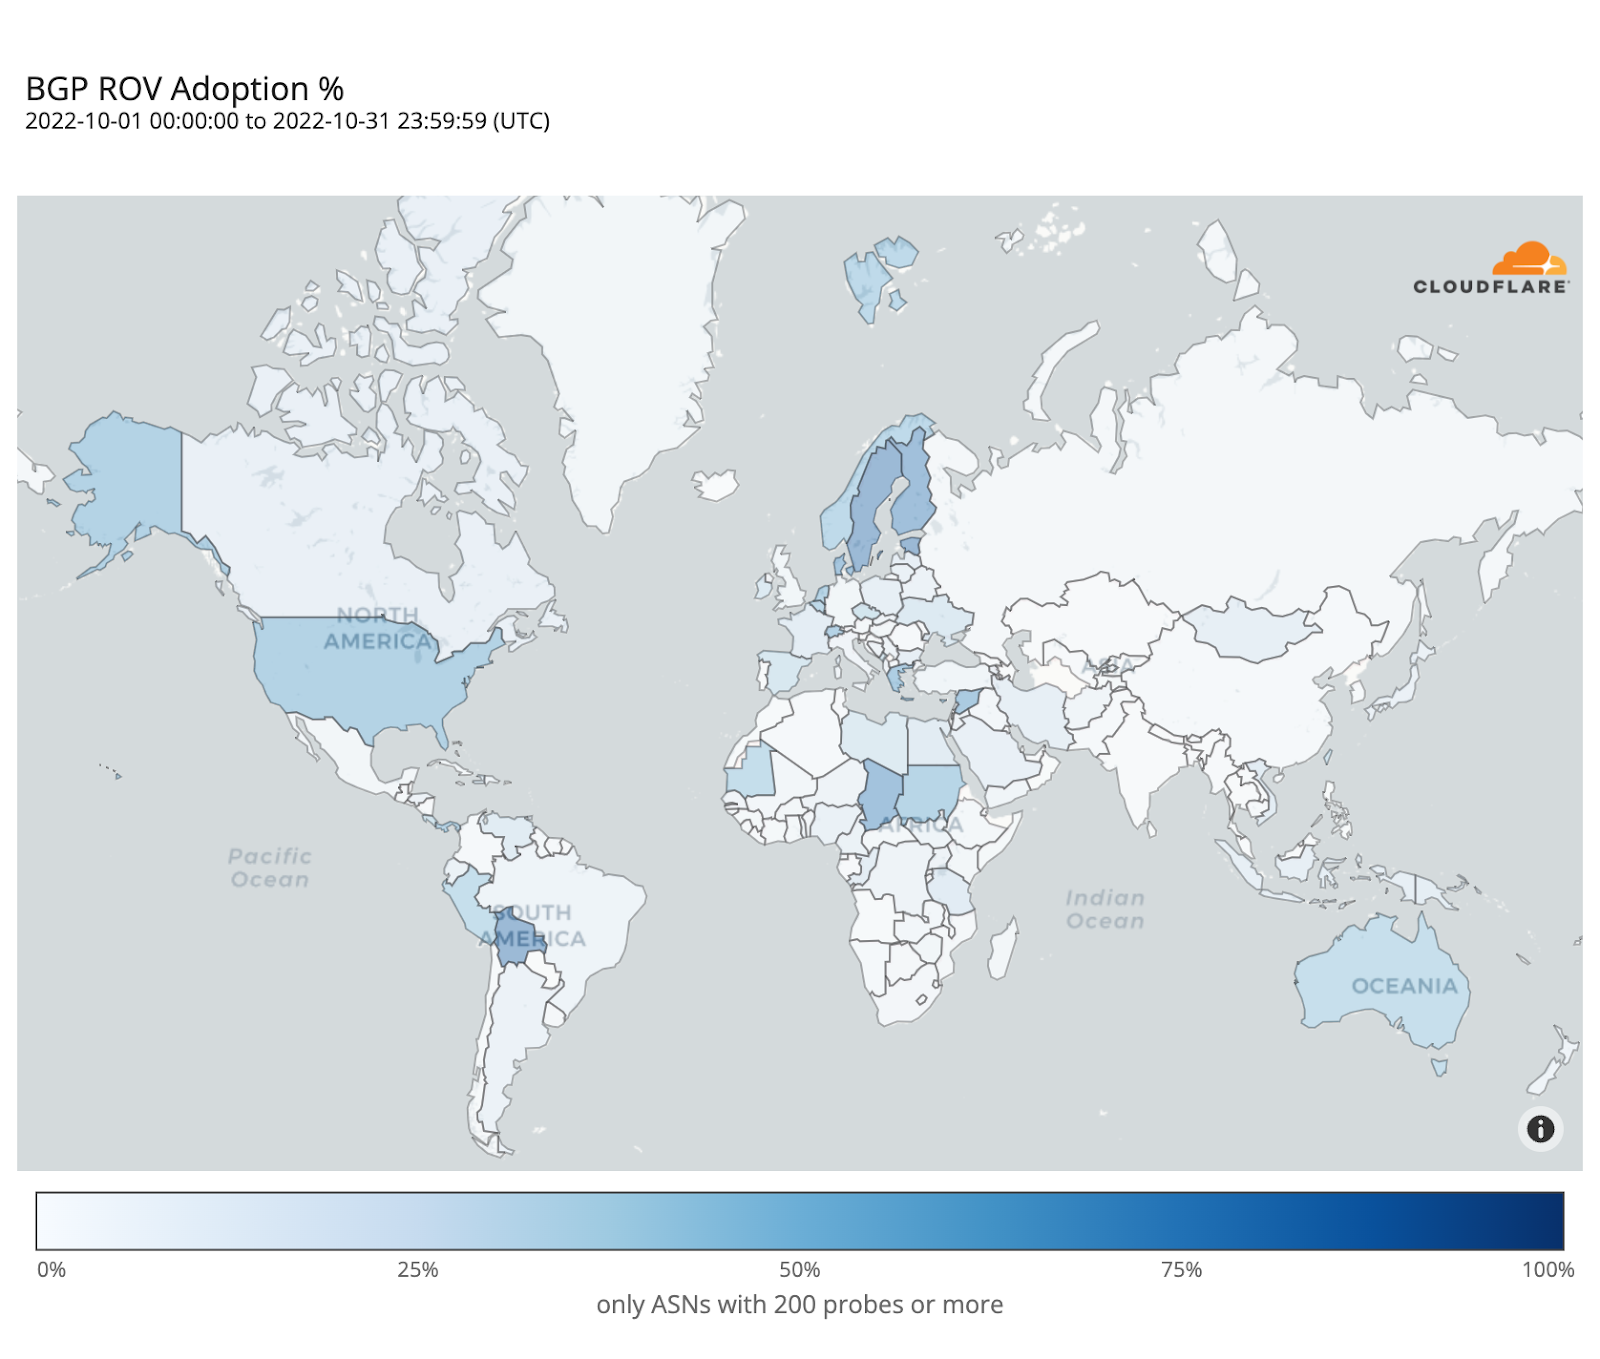
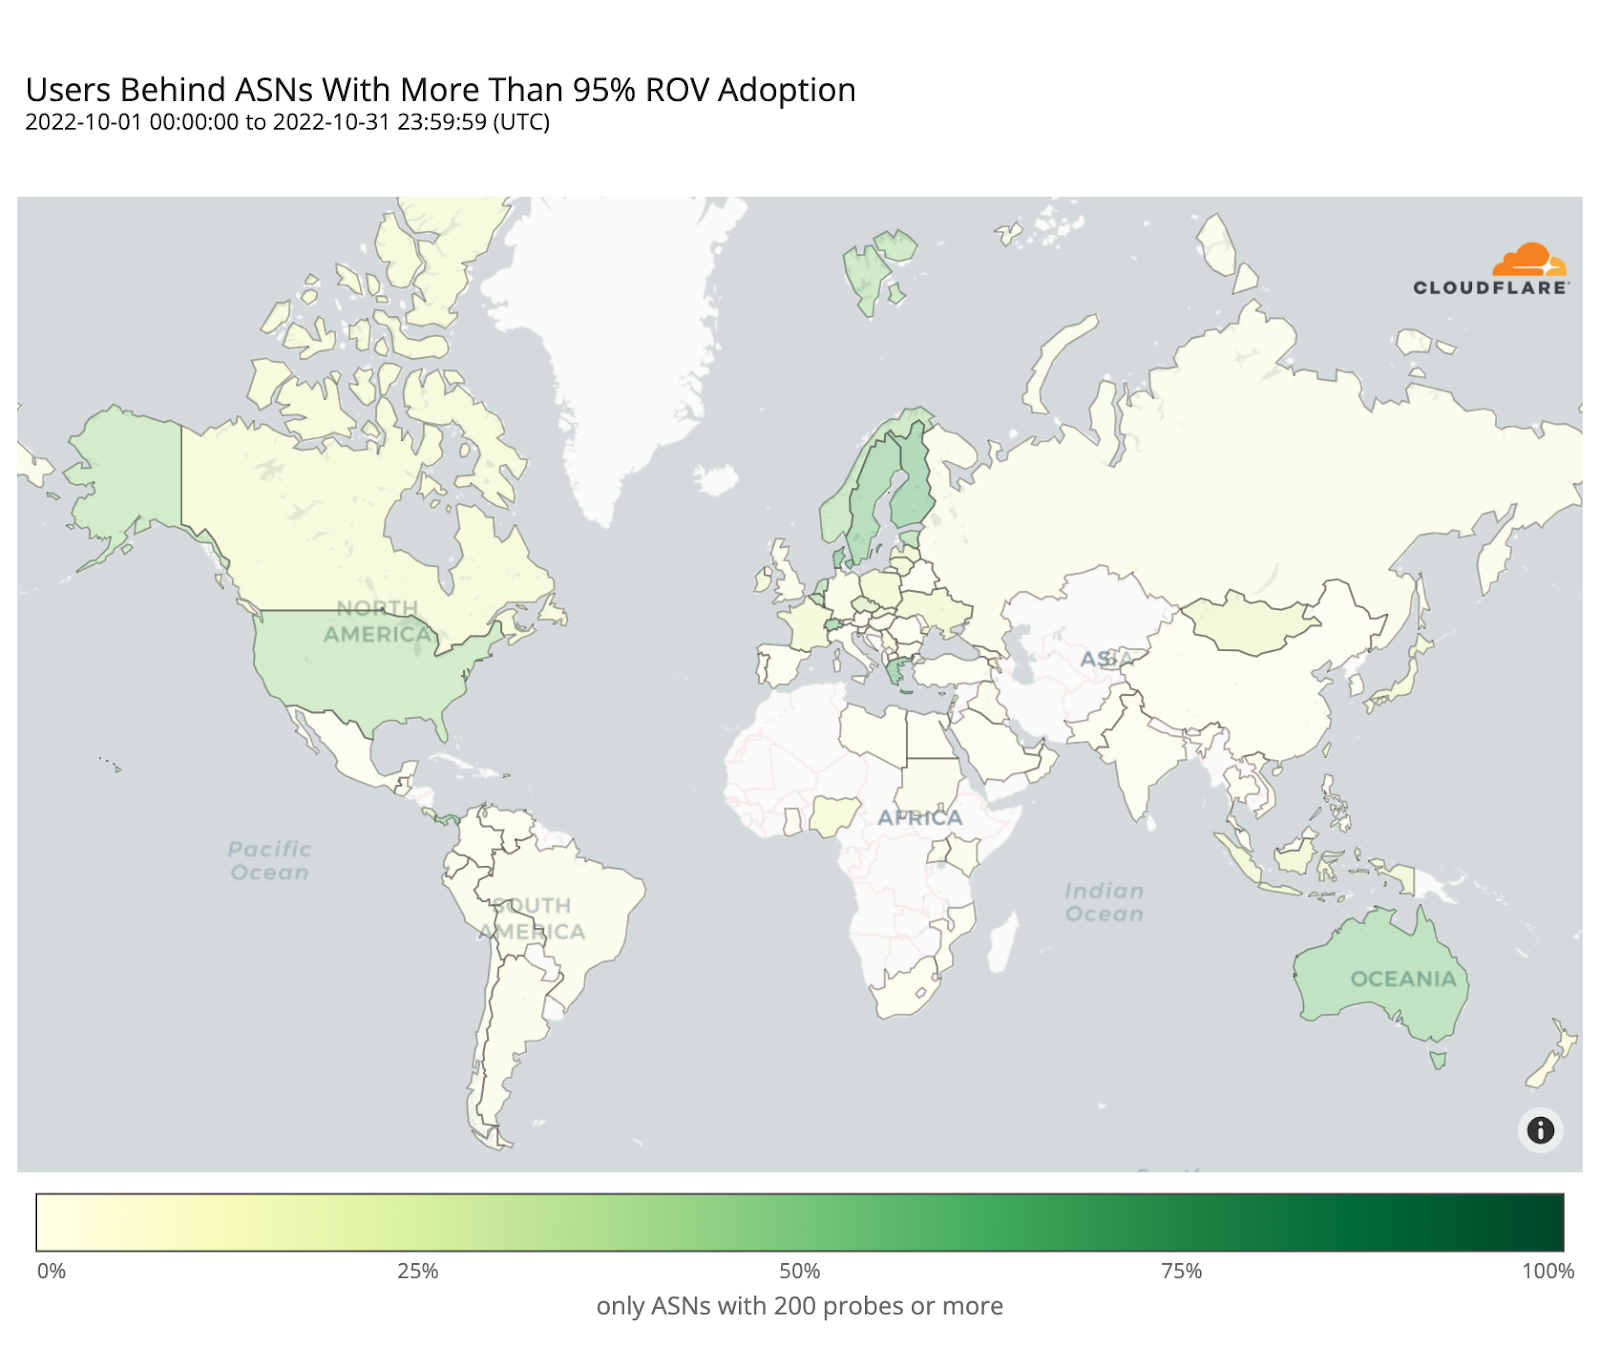
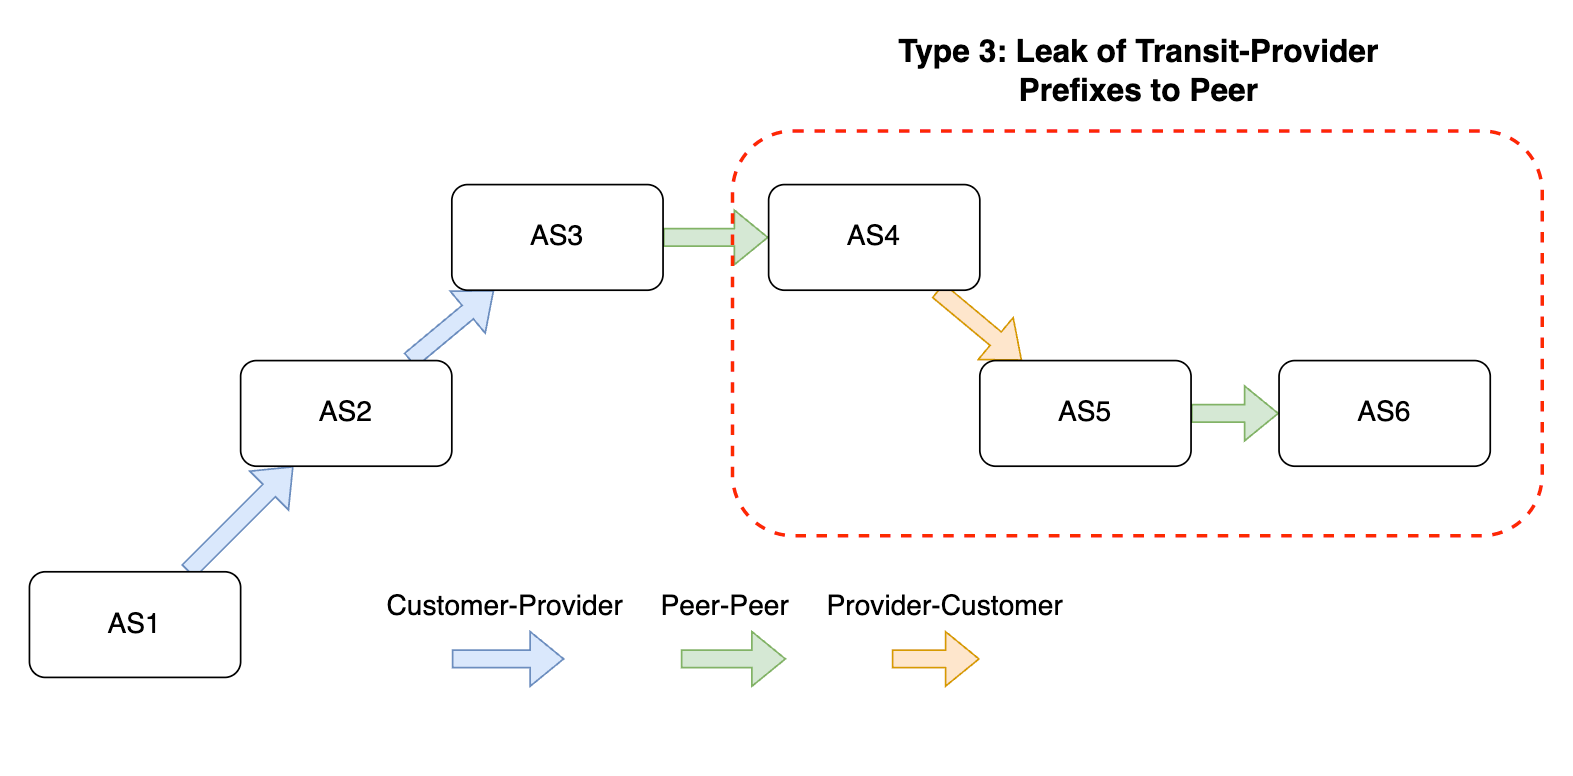
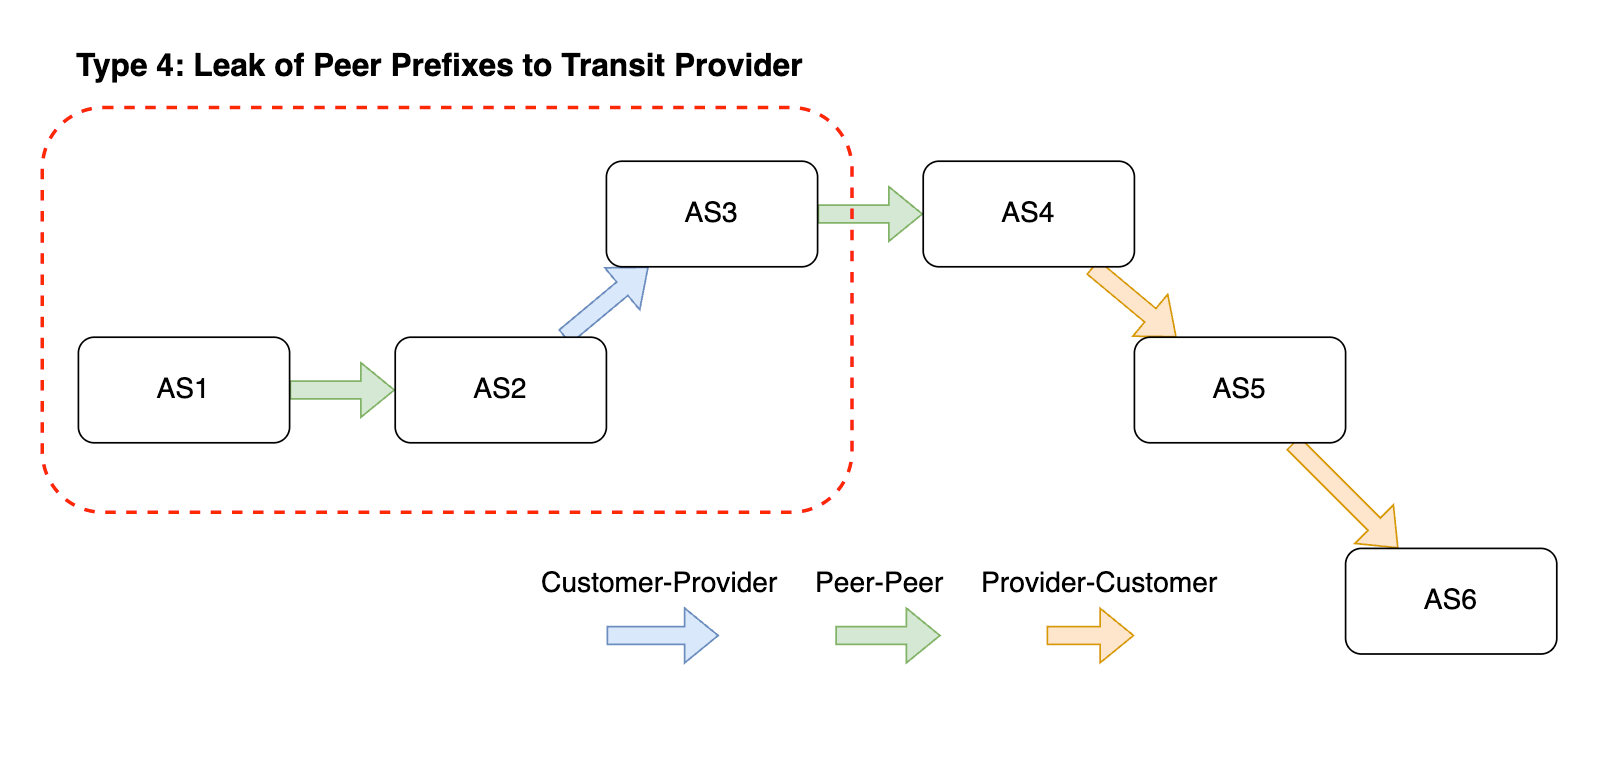
Good route hygiene works like personal hygiene: it prevents problems before they spread. The Internet relies on the Border Gateway Protocol (BGP) to exchange routes between networks, but BGP wasn’t built with security in mind. A single bad route announcement, whether by mistake or attack, can send traffic the wrong way or cause widespread outages.

Two practices help stop this: The RPKI (Resource Public Key Infrastructure) lets networks publish cryptographic proof that they’re allowed to announce specific IP prefixes. ROV (Route Origin Validation) checks those proofs before accepting routes.

Together, they act like passports and border checks for Internet routes, helping filter out hijacks and leaks early.

Hygiene doesn’t just happen in the routing table – it spans multiple layers of the Internet’s architecture, and weaknesses in one layer can ripple through the rest. At the physical layer, having multiple, geographically diverse cable routes ensures that a single cut or disaster doesn’t isolate an entire region. For example, distributing submarine landing stations along different coastlines can protect international connectivity when one corridor fails. At the network layer, practices like multi-homing and participation in Internet Exchange Points (IXPs) give operators more options to reroute traffic during incidents, reducing reliance on any single upstream provider. At the application layer, Content Delivery Networks (CDNs) and caching keep popular content close to users, so even if upstream routes are disrupted, many services remain accessible. Finally, policy and market structure also play a role: open peering policies and competitive markets foster diversity, while dependence on a single ISP or cable system creates fragility.

Resilience emerges when these layers work together. If one layer is weak, the whole system becomes more vulnerable to disruption.

The more networks adopt these practices, the stronger and more resilient the Internet becomes. We actively support the deployment of RPKI, ROV, and diverse routing to keep the global Internet healthy.

Measuring resilience is harder than it sounds

The biggest hurdle in measuring resilience is data access. The most valuable information, like internal network topologies, the physical paths of fiber cables, or specific peering agreements, is held by private network operators. This is the ground truth of the network.

However, operators view this information as a highly sensitive competitive asset. Revealing detailed network maps could expose strategic vulnerabilities or undermine business negotiations. Without access to this ground truth data, we’re forced to rely on inference, approximation, and the clever use of publicly available data sources. Our framework is built entirely on these public sources to ensure anyone can reproduce and build upon our findings.

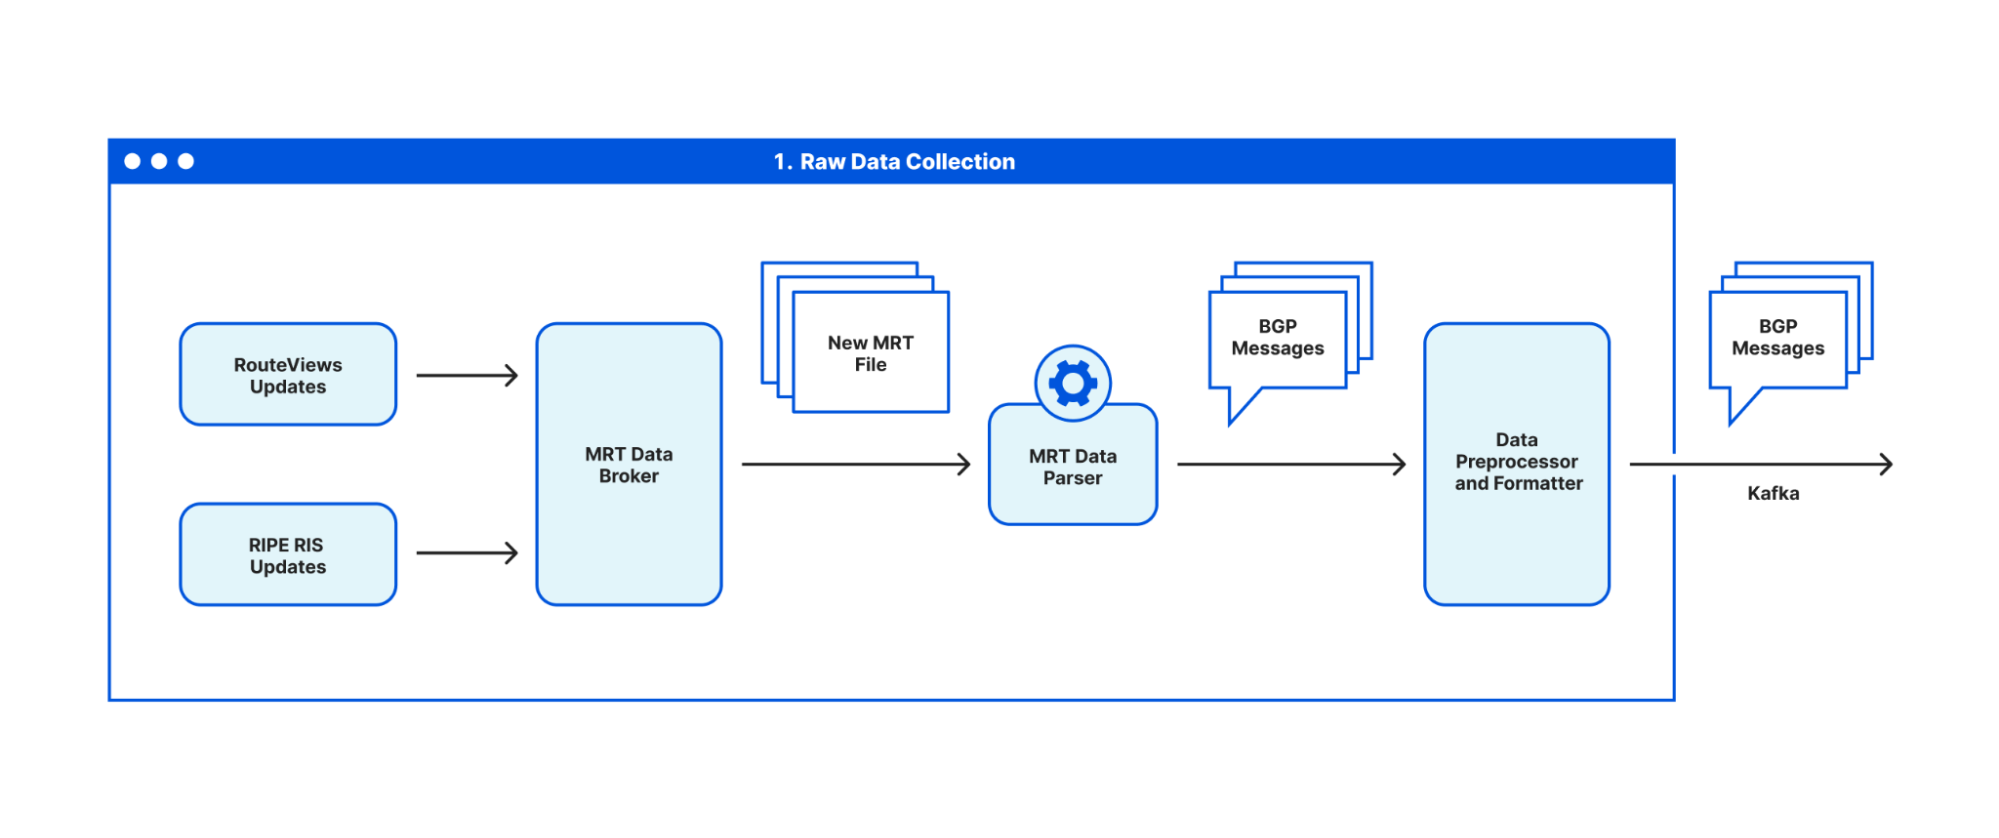
Projects like RouteViews and RIPE RIS collect BGP routing data that shows how networks connect. Traceroute measurements reveal paths at the router level. IXP and submarine cable maps give partial views of the physical layer. But each of these sources has blind spots: peering links often don’t appear in BGP data, backup paths may remain hidden, and physical routes are hard to map precisely. This lack of a single, complete dataset means that resilience measurement relies on combining many partial perspectives, a bit like reconstructing a city map from scattered satellite images, traffic reports, and public utility filings. It’s challenging, but it’s also what makes this field so interesting.

Translating resilience into quantifiable metrics

Once we understand why resilience matters and what makes it hard to measure, the next step is to translate these ideas into concrete metrics. These metrics give us a way to evaluate how well different parts of the Internet can withstand disruptions and to identify where the weak points are. No single metric can capture Internet resilience on its own. Instead, we look at it from multiple angles: physical infrastructure, network topology, interconnection patterns, and routing behavior. Below are some of the key dimensions we use. Some of these metrics are inspired from existing research, like the ISOC Pulse framework. All described methods rely on public data sources and are fully reproducible. As a result, in our visualizations we intentionally omit country and region names to maintain focus on the methodology and interpretation of the results. 

IXPs and colocation facilities

Networks primarily interconnect in two types of physical facilities: colocation facilities (colos), and Internet Exchange Points (IXPs) often housed within the colos. Although symbiotically linked, they serve distinct functions in a nation’s digital ecosystem. A colocation facility provides the foundational infrastructure —- secure space, power, and cooling – for network operators to place their equipment. The IXP builds upon this physical base to provide the logical interconnection fabric, a role that is transformative for a region’s Internet development and resilience. The networks that connect at these facilities are its members. 

Metrics that reflect resilience include:

  • Number and distribution of IXPs, normalized by population or geography. A higher IXP count, weighted by population or geographic coverage, is associated with improved local connectivity.

  • Peering participation rates — the percentage of local networks connected to domestic IXPs. This metric reflects the extent to which local networks rely on regional interconnection rather than routing traffic through distant upstream providers.

  • Diversity of IXP membership, including ISPs, CDNs, and cloud providers, which indicates how much critical content is available locally, making it accessible to domestic users even if international connectivity is severely degraded.

Resilience also depends on how well local networks connect globally:

  • How many local networks peer at international IXPs, increasing their routing options

  • How many international networks peer at local IXPs, bringing content closer to users

A balanced flow in both directions strengthens resilience by ensuring multiple independent paths in and out of a region.

The geographic distribution of IXPs further enhances resilience. A resilient IXP ecosystem should be geographically dispersed to serve different regions within a country effectively, reducing the risk of a localized infrastructure failure from affecting the connectivity of an entire country. Spatial distribution metrics help evaluate how infrastructure is spread across a country’s geography or its population. Key spatial metrics include:

  • Infrastructure per Capita: This metric – inspired by teledensity  – measures infrastructure relative to population size of a sub-region, providing a per-person availability indicator. A low IXP-per-population ratio in a region suggests that users there rely on distant exchanges, increasing the bit-risk miles.

  • Infrastructure per Area (Density): This metric evaluates how infrastructure is distributed per unit of geographic area, highlighting spatial coverage. Such area-based metrics are crucial for critical infrastructures to ensure remote areas are not left inaccessible.

These metrics can be summarized using the Location Quotient (LQ). The location quotient is a widely used geographic index that measures a region’s share of infrastructure relative to its share of a baseline (such as population or area).


For example, the figure above represents US states where a region hosts more or less infrastructure that is expected for its population, based on its LQ score. This statistic illustrates how even for the states with the highest number of facilities this number is still lower than would be expected given the population size of those states.

Economic-weighted metrics

While spatial metrics capture the physical distribution of infrastructure, economic and usage-weighted metrics reveal how infrastructure is actually used. These account for traffic, capacity, or economic activity, exposing imbalances that spatial counts miss. Infrastructure Utilization Concentration measures how usage is distributed across facilities, using indices like the Herfindahl–Hirschman Index (HHI). HHI sums the squared market shares of entities, ranging from 0 (competitive) to 10,000 (highly concentrated). For IXPs, market share is defined through operational metrics such as:

  • Peak/Average Traffic Volume (Gbps/Tbps): indicates operational significance

  • Number of Connected ASNs: reflects network reach

  • Total Port Capacity: shows physical scale

The chosen metric affects results. For example, using connected ASNs yields an HHI of 1,316 (unconcentrated) for a Central European country, whereas using port capacity gives 1,809 (moderately concentrated).

The Gini coefficient measures inequality in resource or traffic distribution (0 = equal, 1 = fully concentrated). The Lorenz curve visualizes this: a straight 45° line indicates perfect equality, while deviations show concentration.


The chart on the left suggests substantial geographical inequality in colocation facility distribution across the US states. However, the population-weighted analysis in the chart on the right demonstrates that much of that geographic concentration can be explained by population distribution.

Submarine cables

Internet resilience, in the context of undersea cables, is defined by the global network’s capacity to withstand physical infrastructure damage and to recover swiftly from faults, thereby ensuring the continuity of intercontinental data flow. The metrics for quantifying this resilience are multifaceted, encompassing the frequency and nature of faults, the efficiency of repair operations, and the inherent robustness of both the network’s topology and its dedicated maintenance resources. Such metrics include:

  • Number of landing stations, cable corridors, and operators. The goal is to ensure that national connectivity should withstand single failure events, be they natural disaster, targeted attack, or major power outage. A lack of diversity creates single points of failure, as highlighted by incidents in Tonga where damage to the only available cable led to a total outage.

  • Fault rates and mean time to repair (MTTR), which indicate how quickly service can be restored. These metrics measure a country’s ability to prevent, detect, and recover from cable incidents, focusing on downtime reduction and protection of critical assets. Repair times hinge on vessel mobilization and government permits, the latter often the main bottleneck.

  • Availability of satellite backup capacity as an emergency fallback. While cable diversity is essential, resilience planning must also cover worst-case outages. The Non-Terrestrial Backup System Readiness metric measures a nation’s ability to sustain essential connectivity during major cable disruptions. LEO and MEO satellites, though costlier and lower capacity than cables, offer proven emergency backup during conflicts or disasters. Projects like HEIST explore hybrid space-submarine architectures to boost resilience. Key indicators include available satellite bandwidth, the number of NGSO providers under contract (for diversity), and the deployment of satellite terminals for public and critical infrastructure. Tracking these shows how well a nation can maintain command, relief operations, and basic connectivity if cables fail.

Inter-domain routing

The network layer above the physical interconnection infrastructure governs how traffic is routed across the Autonomous Systems (ASes). Failures or instability at this layer – such as misconfigurations, attacks, or control-plane outages – can disrupt connectivity even when the underlying physical infrastructure remains intact. In this layer, we look at resilience metrics that characterize the robustness and fault tolerance of AS-level routing and BGP behavior.

AS Path Diversity measures the number and independence of AS-level routes between two points. High diversity provides alternative paths during failures, enabling BGP rerouting and maintaining connectivity. Low diversity leaves networks vulnerable to outages if a critical AS or link fails. Resilience depends on upstream topology.

  • Single-homed ASes rely on one provider, which is cheaper and simpler but more fragile.

  • Multi-homed ASes use multiple upstreams, requiring BGP but offering far greater redundancy and performance at higher cost.

The share of multi-homed ASes reflects an ecosystem’s overall resilience: higher rates signal greater protection from single-provider failures. This metric is easy to measure using public BGP data (e.g., RouteViews, RIPE RIS, CAIDA). Longitudinal BGP monitoring helps reveal hidden backup links that snapshots might miss.

Beyond multi-homing rates, the distribution of single-homed ASes per transit provider highlights systemic weak points. For each provider, counting customer ASes that rely exclusively on it reveals how many networks would be cut off if that provider fails.


The figure above shows Canadian transit providers for July 2025: the x-axis is total customer ASes, the y-axis is single-homed customers. Canada’s overall single-homing rate is 30%, with some providers serving many single-homed ASes, mirroring vulnerabilities seen during the 2022 Rogers outage, which disrupted over 12 million users.

While multi-homing metrics provide a valuable, static view of an ecosystem’s upstream topology, a more dynamic and nuanced understanding of resilience can be achieved by analyzing the characteristics of the actual BGP paths observed from global vantage points. These path-centric metrics move beyond simply counting connections to assess the diversity and independence of the routes to and from a country’s networks. These metrics include:

  • Path independence measures whether those alternative routes truly avoid shared bottlenecks. Multi-homing only helps if upstream paths are truly distinct. If two providers share upstream transit ASes, redundancy is weak. Independence can be measured with the Jaccard distance between AS paths. A stricter path disjointness score calculates the share of path pairs with no common ASes, directly quantifying true redundancy.

  • Transit entropy measures how evenly traffic is distributed across transit providers. High Shannon entropy signals a decentralized, resilient ecosystem; low entropy shows dependence on few providers, even if nominal path diversity is high.

  • International connectivity ratios evaluate the share of domestic ASes with direct international links. High percentages reflect a mature, distributed ecosystem; low values indicate reliance on a few gateways.

The figure below encapsulates the aforementioned AS-level resilience metrics into single polar pie charts. For the purpose of exposition we plot the metrics for infrastructure from two different nations with very different resilience profiles.


To pinpoint critical ASes and potential single points of failure, graph centrality metrics can provide useful insights. Betweenness Centrality (BC) identifies nodes lying on many shortest paths, but applying it to BGP data suffers from vantage point bias. ASes that provide BGP data to the RouteViews and RIS collectors appear falsely central. AS Hegemony, developed by Fontugne et al., corrects this by filtering biased viewpoints, producing a 0–1 score that reflects the true fraction of paths crossing an AS. It can be applied globally or locally to reveal Internet-wide or AS-specific dependencies.

Customer cone size developed by CAIDA offers another perspective, capturing an AS’s economic and routing influence via the set of networks it serves through customer links. Large cones indicate major transit hubs whose failure affects many downstream networks. However, global cone rankings can obscure regional importance, so country-level adaptations give more accurate resilience assessments.

Impact-Weighted Resilience Assessment

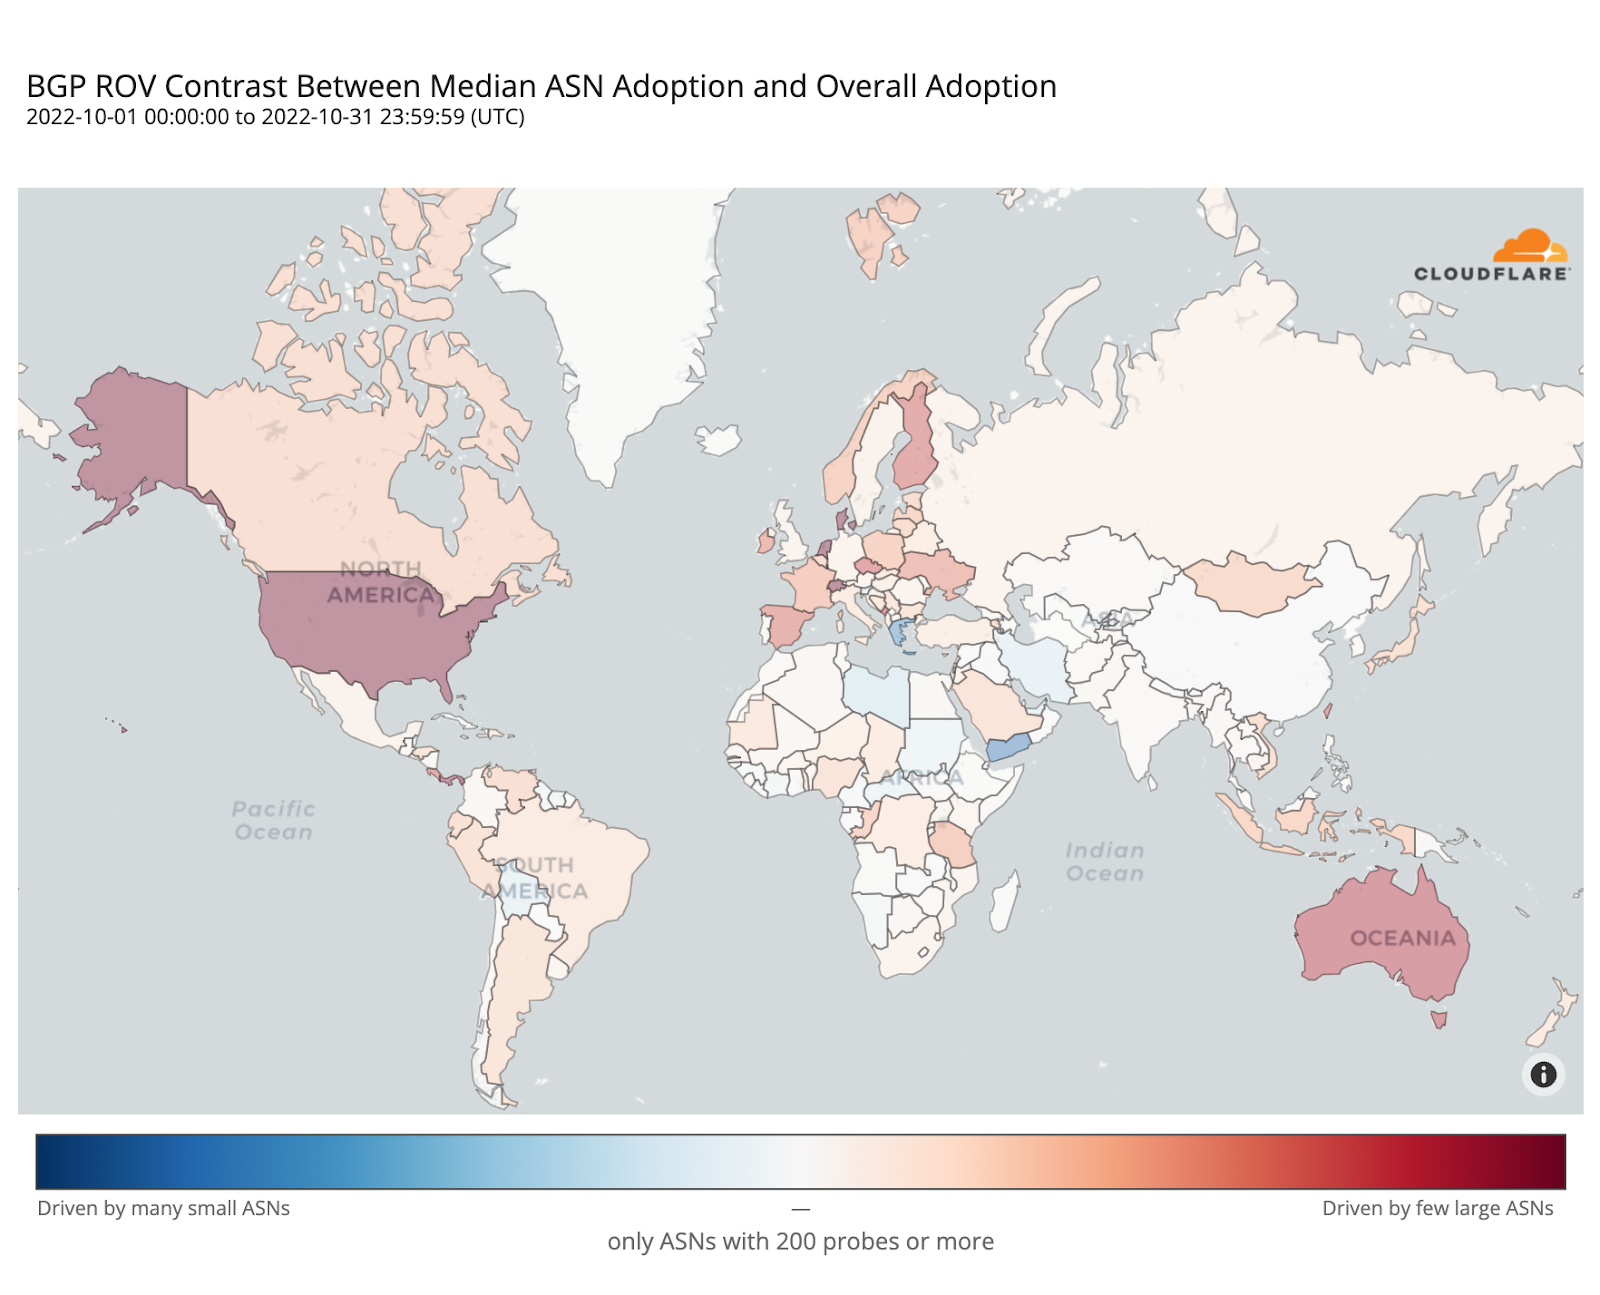
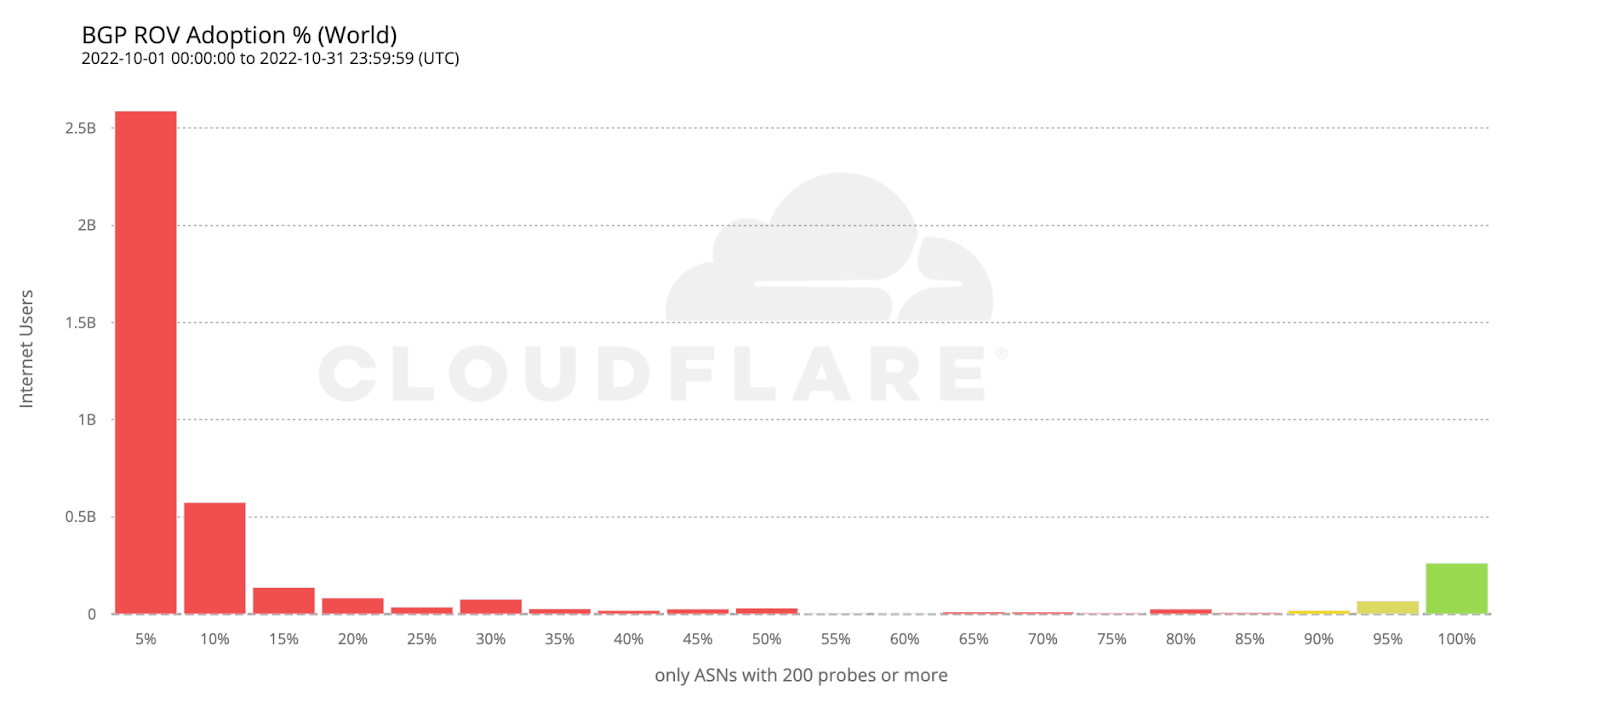
Not all networks have the same impact when they fail. A small hosting provider going offline affects far fewer people than if a national ISP does. Traditional resilience metrics treat all networks equally, which can mask where the real risks are. To address this, we use impact-weighted metrics that factor in a network’s user base or infrastructure footprint. For example, by weighting multi-homing rates or path diversity by user population, we can see how many people actually benefit from redundancy — not just how many networks have it. Similarly, weighting by the number of announced prefixes highlights networks that carry more traffic or control more address space.

This approach helps separate theoretical resilience from practical resilience. A country might have many multi-homed networks, but if most users rely on just one single-homed ISP, its resilience is weaker than it looks. Impact weighting helps surface these kinds of structural risks so that operators and policymakers can prioritize improvements where they matter most.

Metrics of network hygiene

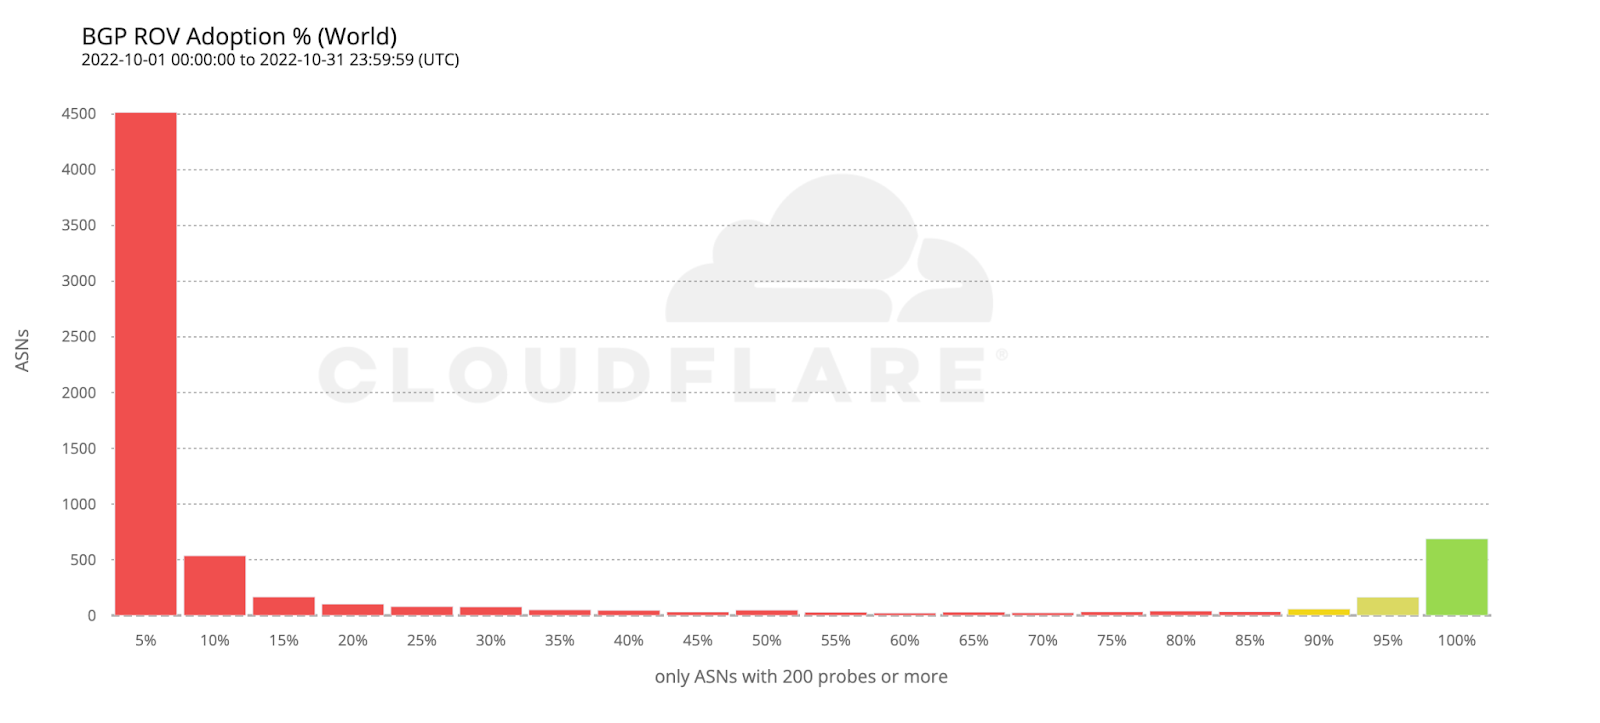
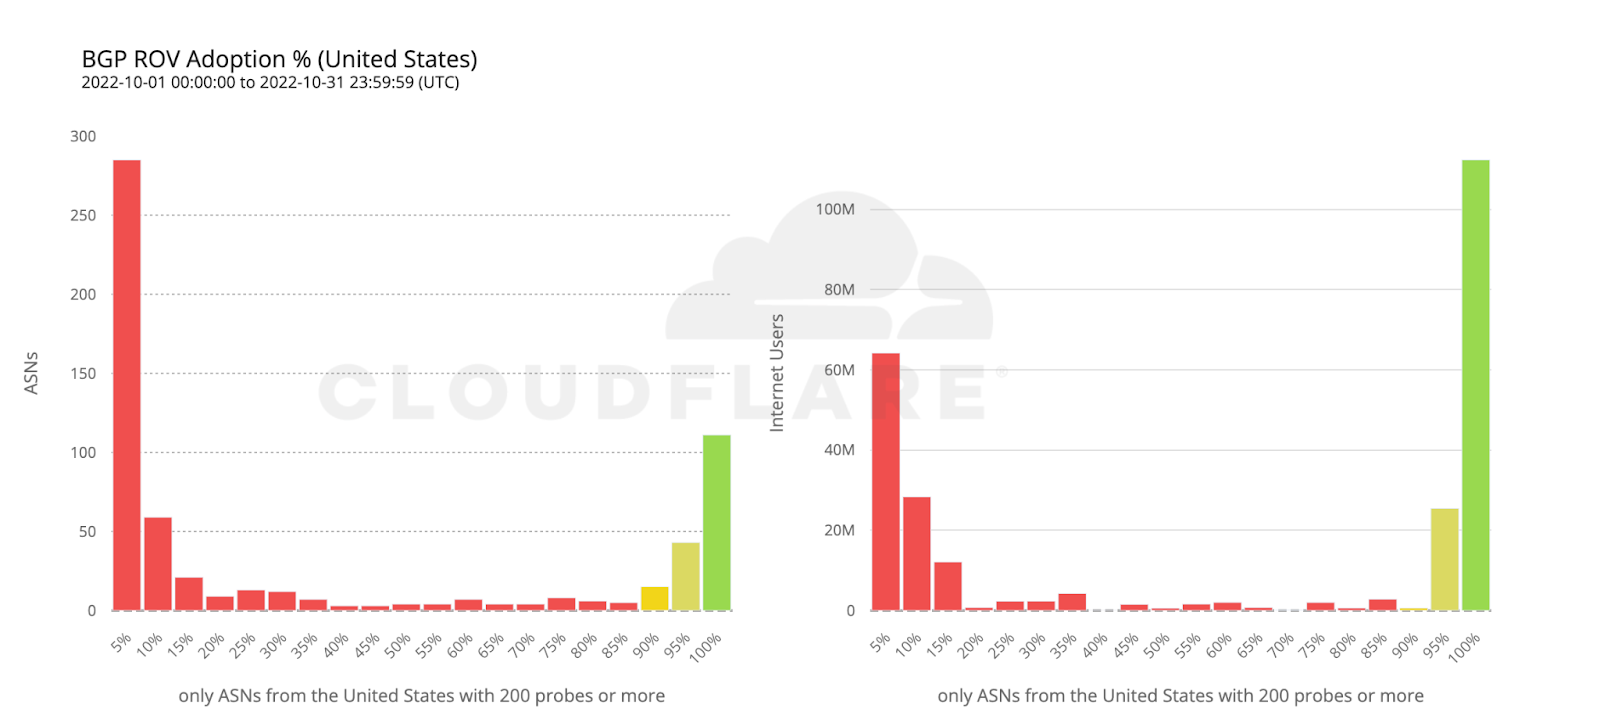
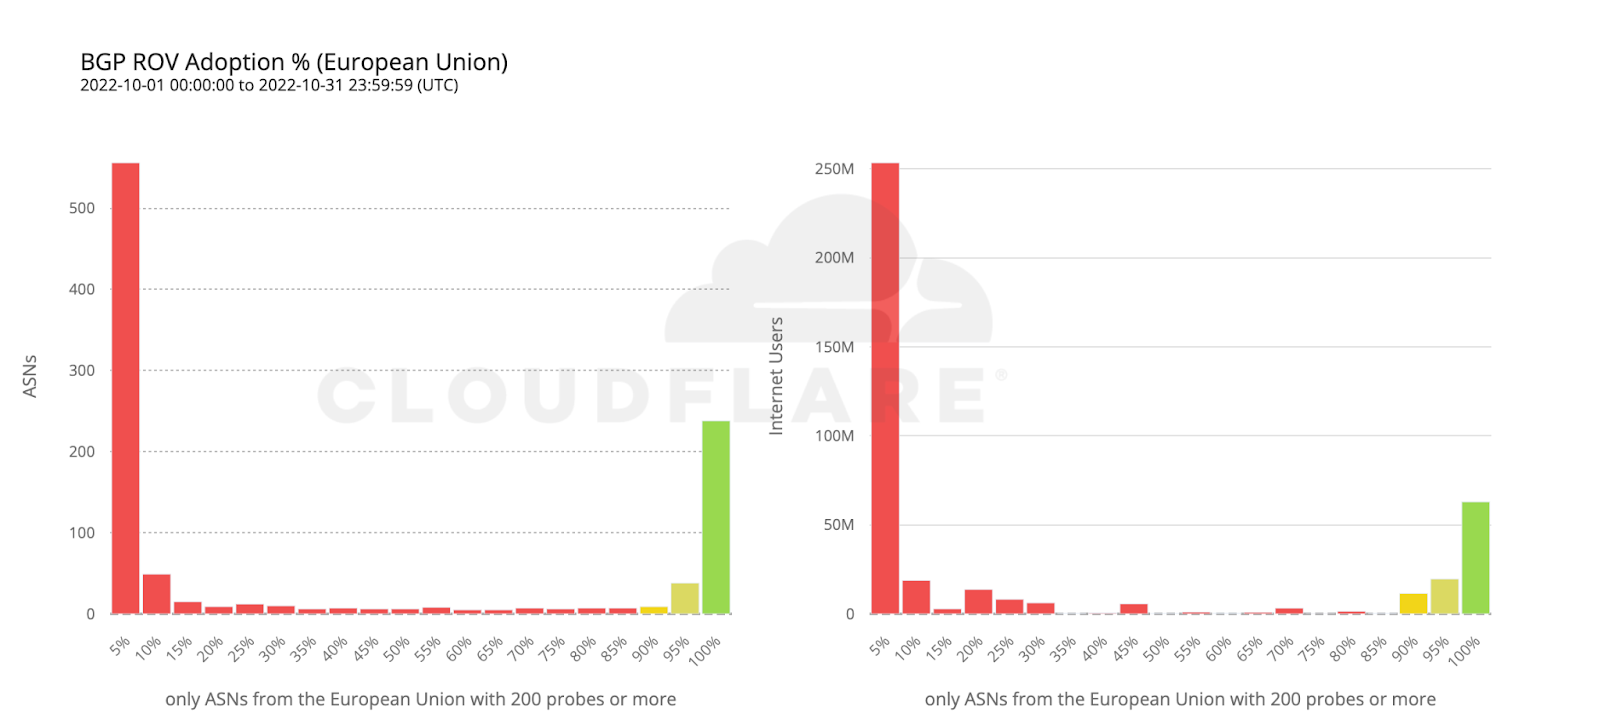
Large Internet outages aren’t always caused by cable cuts or natural disasters — sometimes, they stem from routing mistakes or security gaps. Route hijacks, leaks, and spoofed announcements can disrupt traffic on a national scale. How well networks protect themselves against these incidents is a key part of resilience, and that’s where network hygiene comes in.

Network hygiene refers to the security and operational practices that make the global routing system more trustworthy. This includes:

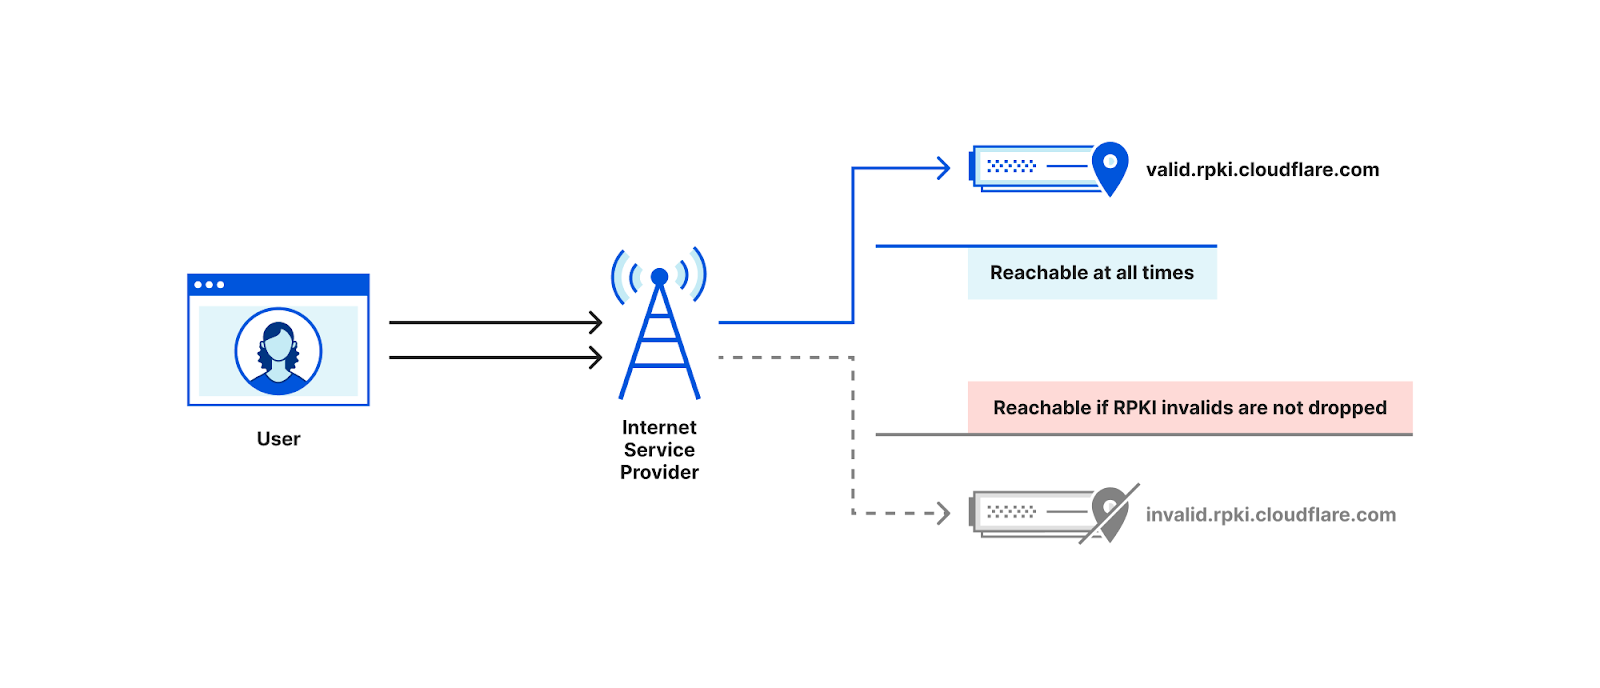
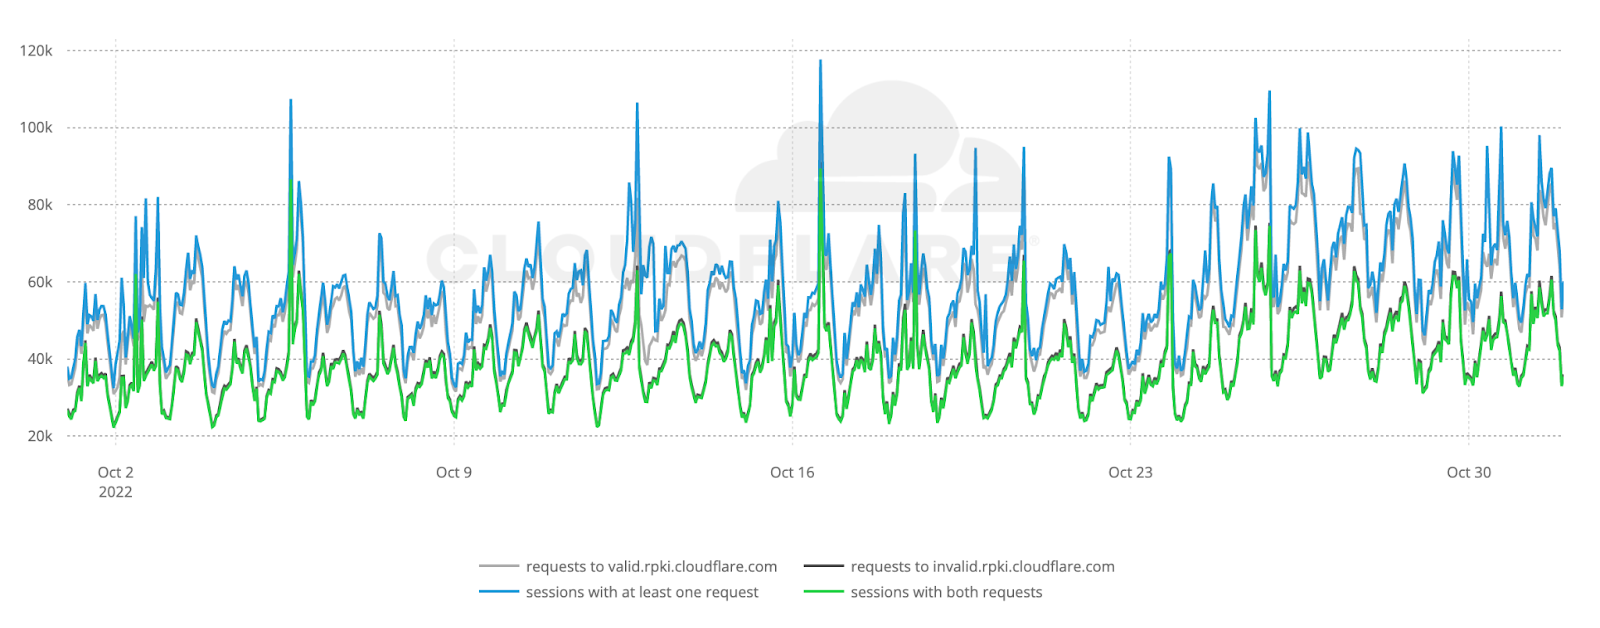
  • Cryptographic validation, like RPKI, to prevent unauthorized route announcements. ROA Coverage measures the share of announced IPv4/IPv6 space with valid Route Origin Authorizations (ROAs), indicating participation in the RPKI ecosystem. ROV Deployment gauges how many networks drop invalid routes, but detecting active filtering is difficult. Policymakers can improve visibility by supporting independent measurements, data transparency, and standardized reporting.

  • Filtering and cooperative norms, where networks block bogus routes and follow best practices when sharing routing information.

  • Consistent deployment across both domestic networks and their international upstreams, since traffic often crosses multiple jurisdictions.

Strong hygiene practices reduce the likelihood of systemic routing failures and limit their impact when they occur. We actively support and monitor the adoption of these mechanisms, for instance through crowd-sourced measurements and public advocacy, because every additional network that validates routes and filters traffic contributes to a safer and more resilient Internet for everyone.

Another critical aspect of Internet hygiene is mitigating DDoS attacks, which often rely on IP address spoofing to amplify traffic and obscure the attacker’s origin. BCP-38, the IETF’s network ingress filtering recommendation, addresses this by requiring operators to block packets with spoofed source addresses, reducing a region’s role as a launchpad for global attacks. While BCP-38 does not prevent a network from being targeted, its deployment is a key indicator of collective security responsibility. Measuring compliance requires active testing from inside networks, which is carried out by the CAIDA Spoofer Project. Although the global sample remains limited, these metrics offer valuable insight into both the technical effectiveness and the security engagement of a nation’s network community, complementing RPKI in strengthening the overall routing security posture.

Measuring the collective security posture

Beyond securing individual networks through mechanisms like RPKI and BCP-38, strengthening the Internet’s resilience also depends on collective action and visibility. While origin validation and anti-spoofing reduce specific classes of threats, broader frameworks and shared measurement infrastructures are essential to address systemic risks and enable coordinated responses.

The Mutually Agreed Norms for Routing Security (MANRS) initiative promotes Internet resilience by defining a clear baseline of best practices. It is not a new technology but a framework fostering collective responsibility for global routing security. MANRS focuses on four key actions: filtering incorrect routes, anti-spoofing, coordination through accurate contact information, and global validation using RPKI and IRRs. While many networks implement these independently, MANRS participation signals a public commitment to these norms and to strengthening the shared security ecosystem.

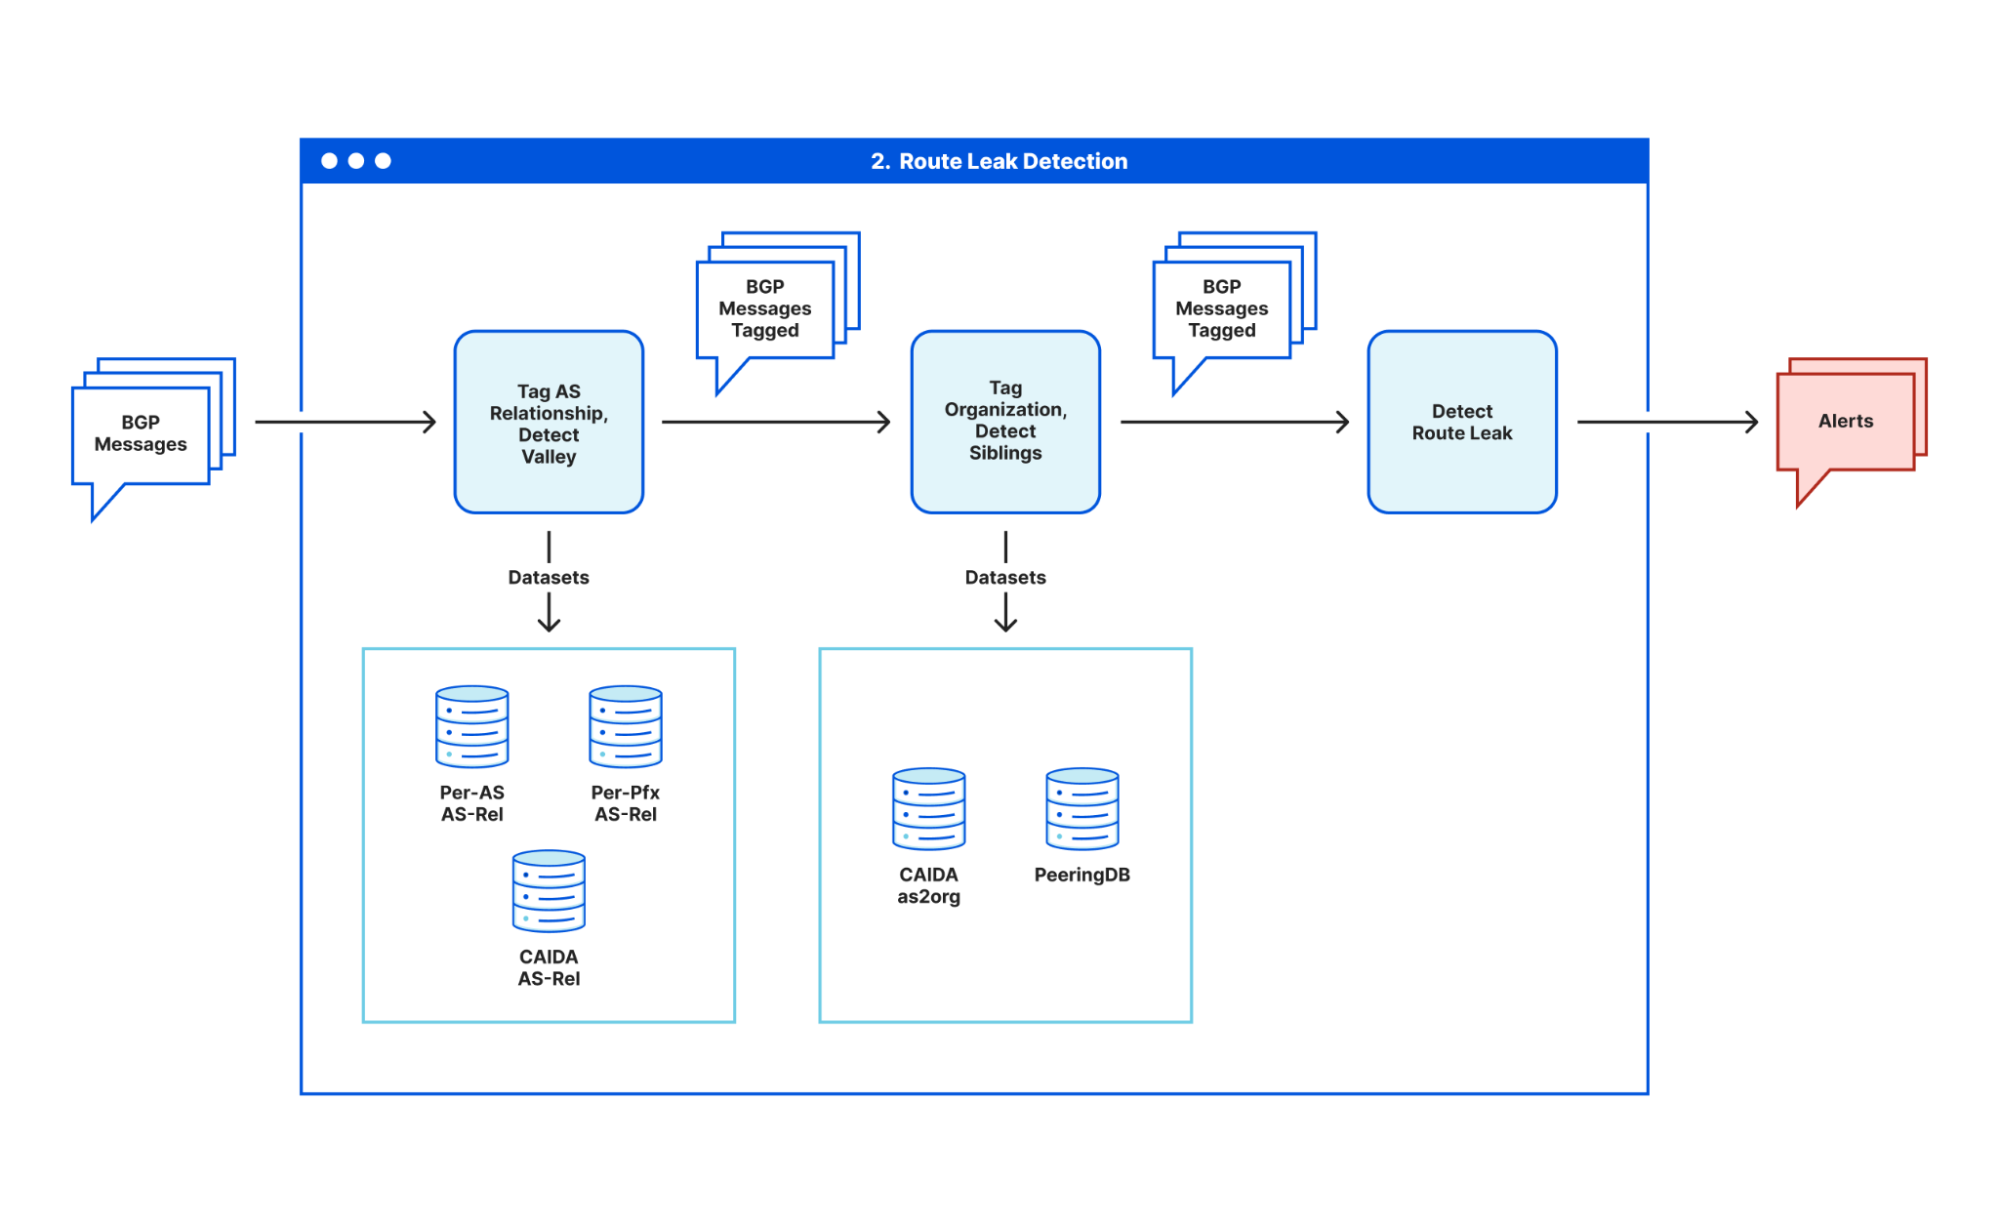
Additionally, a region’s participation in public measurement platforms reflects its Internet observability, which is essential for fault detection, impact assessment, and incident response. RIPE Atlas and CAIDA Ark provide dense data-plane measurements; RouteViews and RIPE RIS collect BGP routing data to detect anomalies; and PeeringDB documents interconnection details, reflecting operational maturity and integration into the global peering fabric. Together, these platforms underpin observatories like IODA and GRIP, which combine BGP and active data to detect outages and routing incidents in near real time, offering critical visibility into Internet health and security.

Building a more resilient Internet, together

Measuring Internet resilience is complex, but it’s not impossible. By using publicly available data, we can create a transparent and reproducible framework to identify strengths, weaknesses, and single points of failure in any network ecosystem.

This isn’t just a theoretical exercise. For policymakers, this data can inform infrastructure investment and pro-competitive policies that encourage diversity. For network operators, it provides a benchmark to assess their own resilience and that of their partners. And for everyone who relies on the Internet, it’s a critical step toward building a more stable, secure, and reliable global network.

For more details of the framework, including a full table of the metrics and links to source code, please refer to the full paper:  Regional Perspectives for Route Resilience in a Global Internet: Metrics, Methodology, and Pathways for Transparency published at TPRC23.

Helping build a safer Internet by measuring BGP RPKI Route Origin Validation

Post Syndicated from Carlos Rodrigues original https://blog.cloudflare.com/rpki-updates-data/

Helping build a safer Internet by measuring BGP RPKI Route Origin Validation

Helping build a safer Internet by measuring BGP RPKI Route Origin Validation

The Border Gateway Protocol (BGP) is the glue that keeps the entire Internet together. However, despite its vital function, BGP wasn’t originally designed to protect against malicious actors or routing mishaps. It has since been updated to account for this shortcoming with the Resource Public Key Infrastructure (RPKI) framework, but can we declare it to be safe yet?

If the question needs asking, you might suspect we can’t. There is a shortage of reliable data on how much of the Internet is protected from preventable routing problems. Today, we’re releasing a new method to measure exactly that: what percentage of Internet users are protected by their Internet Service Provider from these issues. We find that there is a long way to go before the Internet is protected from routing problems, though it varies dramatically by country.

Why RPKI is necessary to secure Internet routing

The Internet is a network of independently-managed networks, called Autonomous Systems (ASes). To achieve global reachability, ASes interconnect with each other and determine the feasible paths to a given destination IP address by exchanging routing information using BGP. BGP enables routers with only local network visibility to construct end-to-end paths based on the arbitrary preferences of each administrative entity that operates that equipment. Typically, Internet traffic between a user and a destination traverses multiple AS networks using paths constructed by BGP routers.

BGP, however, lacks built-in security mechanisms to protect the integrity of the exchanged routing information and to provide authentication and authorization of the advertised IP address space. Because of this, AS operators must implicitly trust that the routing information exchanged through BGP is accurate. As a result, the Internet is vulnerable to the injection of bogus routing information, which cannot be mitigated by security measures at the client or server level of the network.

An adversary with access to a BGP router can inject fraudulent routes into the routing system, which can be used to execute an array of attacks, including:

  • Denial-of-Service (DoS) through traffic blackholing or redirection,
  • Impersonation attacks to eavesdrop on communications,
  • Machine-in-the-Middle exploits to modify the exchanged data, and subvert reputation-based filtering systems.

Additionally, local misconfigurations and fat-finger errors can be propagated well beyond the source of the error and cause major disruption across the Internet.

Such an incident happened on June 24, 2019. Millions of users were unable to access Cloudflare address space when a regional ISP in Pennsylvania accidentally advertised routes to Cloudflare through their capacity-limited network. This was effectively the Internet equivalent of routing an entire freeway through a neighborhood street.

Traffic misdirections like these, either unintentional or intentional, are not uncommon. The Internet Society’s MANRS (Mutually Agreed Norms for Routing Security) initiative estimated that in 2020 alone there were over 3,000 route leaks and hijacks, and new occurrences can be observed every day through Cloudflare Radar.

The most prominent proposals to secure BGP routing, standardized by the IETF focus on validating the origin of the advertised routes using Resource Public Key Infrastructure (RPKI) and verifying the integrity of the paths with BGPsec. Specifically, RPKI (defined in RFC 7115) relies on a Public Key Infrastructure to validate that an AS advertising a route to a destination (an IP address space) is the legitimate owner of those IP addresses.

RPKI has been defined for a long time but lacks adoption. It requires network operators to cryptographically sign their prefixes, and routing networks to perform an RPKI Route Origin Validation (ROV) on their routers. This is a two-step operation that requires coordination and participation from many actors to be effective.

The two phases of RPKI adoption: signing origins and validating origins

RPKI has two phases of deployment: first, an AS that wants to protect its own IP prefixes can cryptographically sign Route Origin Authorization (ROA) records thereby attesting to be the legitimate origin of that signed IP space. Second, an AS can avoid selecting invalid routes by performing Route Origin Validation (ROV, defined in RFC 6483).

With ROV, a BGP route received by a neighbor is validated against the available RPKI records. A route that is valid or missing from RPKI is selected, while a route with RPKI records found to be invalid is typically rejected, thus preventing the use and propagation of hijacked and misconfigured routes.

One issue with RPKI is the fact that implementing ROA is meaningful only if other ASes implement ROV, and vice versa. Therefore, securing BGP routing requires a united effort and a lack of broader adoption disincentivizes ASes from commiting the resources to validate their own routes. Conversely, increasing RPKI adoption can lead to network effects and accelerate RPKI deployment. Projects like MANRS and Cloudflare’s isbgpsafeyet.com are promoting good Internet citizenship among network operators, and make the benefits of RPKI deployment known to the Internet. You can check whether your own ISP is being a good Internet citizen by testing it on isbgpsafeyet.com.

Measuring the extent to which both ROA (signing of addresses by the network that controls them) and ROV (filtering of invalid routes by ISPs) have been implemented is important to evaluating the impact of these initiatives, developing situational awareness, and predicting the impact of future misconfigurations or attacks.

Measuring ROAs is straightforward since ROA data is readily available from RPKI repositories. Querying RPKI repositories for publicly routed IP prefixes (e.g. prefixes visible in the RouteViews and RIPE RIS routing tables) allows us to estimate the percentage of addresses covered by ROA objects. Currently, there are 393,344 IPv4 and 86,306 IPv6 ROAs in the global RPKI system, covering about 40% of the globally routed prefix-AS origin pairs1.

Measuring ROV, however, is significantly more challenging given it is configured inside the BGP routers of each AS, not accessible by anyone other than each router’s administrator.

Measuring ROV deployment

Although we do not have direct access to the configuration of everyone’s BGP routers, it is possible to infer the use of ROV by comparing the reachability of RPKI-valid and RPKI-invalid prefixes from measurement points within an AS2.

Consider the following toy topology as an example, where an RPKI-invalid origin is advertised through AS0 to AS1 and AS2. If AS1 filters and rejects RPKI-invalid routes, a user behind AS1 would not be able to connect to that origin. By contrast, if AS2 does not reject RPKI invalids, a user behind AS2 would be able to connect to that origin.

While occasionally a user may be unable to access an origin due to transient network issues, if multiple users act as vantage points for a measurement system, we would be able to collect a large number of data points to infer which ASes deploy ROV.

Helping build a safer Internet by measuring BGP RPKI Route Origin Validation

If, in the figure above, AS0 filters invalid RPKI routes, then vantage points in both AS1 and AS2 would be unable to connect to the RPKI-invalid origin, making it hard to distinguish if ROV is deployed at the ASes of our vantage points or in an AS along the path. One way to mitigate this limitation is to announce the RPKI-invalid origin from multiple locations from an anycast network taking advantage of its direct interconnections to the measurement vantage points as shown in the figure below. As a result, an AS that does not itself deploy ROV is less likely to observe the benefits of upstream ASes using ROV, and we would be able to accurately infer ROV deployment per AS3.

Note that it’s also important that the IP address of the RPKI-invalid origin should not be covered by a less specific prefix for which there is a valid or unknown RPKI route, otherwise even if an AS filters invalid RPKI routes its users would still be able to find a route to that IP.

Helping build a safer Internet by measuring BGP RPKI Route Origin Validation

The measurement technique described here is the one implemented by Cloudflare’s isbgpsafeyet.com website, allowing end users to assess whether or not their ISPs have deployed BGP ROV.

The isbgpsafeyet.com website itself doesn’t submit any data back to Cloudflare, but recently we started measuring whether end users’ browsers can successfully connect to invalid RPKI origins when ROV is present. We use the same mechanism as is used for global performance data4. In particular, every measurement session (an individual end user at some point in time) attempts a request to both valid.rpki.cloudflare.com, which should always succeed as it’s RPKI-valid, and invalid.rpki.cloudflare.com, which is RPKI-invalid and should fail when the user’s ISP uses ROV.

This allows us to have continuous and up-to-date measurements from hundreds of thousands of browsers on a daily basis, and develop a greater understanding of the state of ROV deployment.

The state of global ROV deployment

The figure below shows the raw number of ROV probe requests per hour during October 2022 to valid.rpki.cloudflare.com and invalid.rpki.cloudflare.com. In total, we observed 69.7 million successful probes from 41,531 ASNs.

Helping build a safer Internet by measuring BGP RPKI Route Origin Validation

Based on APNIC’s estimates on the number of end users per ASN, our weighted5 analysis covers 96.5% of the world’s Internet population. As expected, the number of requests follow a diurnal pattern which reflects established user behavior in daily and weekly Internet activity6.

We can also see that the number of successful requests to valid.rpki.cloudflare.com (gray line) closely follows the number of sessions that issued at least one request (blue line), which works as a smoke test for the correctness of our measurements.

As we don’t store the IP addresses that contribute measurements, we don’t have any way to count individual clients and large spikes in the data may introduce unwanted bias. We account for that by capturing those instants and excluding them.

Helping build a safer Internet by measuring BGP RPKI Route Origin Validation

Overall, we estimate that out of the four billion Internet users, only 261 million (6.5%) are protected by BGP Route Origin Validation, but the true state of global ROV deployment is more subtle than this.

The following map shows the fraction of dropped RPKI-invalid requests from ASes with over 200 probes over the month of October. It depicts how far along each country is in adopting ROV but doesn’t necessarily represent the fraction of protected users in each country, as we will discover.

Helping build a safer Internet by measuring BGP RPKI Route Origin Validation

Sweden and Bolivia appear to be the countries with the highest level of adoption (over 80%), while only a few other countries have crossed the 50% mark (e.g. Finland, Denmark, Chad, Greece, the United States).

ROV adoption may be driven by a few ASes hosting large user populations, or by many ASes hosting small user populations. To understand such disparities, the map below plots the contrast between overall adoption in a country (as in the previous map) and median adoption over the individual ASes within that country. Countries with stronger reds have relatively few ASes deploying ROV with high impact, while countries with stronger blues have more ASes deploying ROV but with lower impact per AS.

Helping build a safer Internet by measuring BGP RPKI Route Origin Validation

In the Netherlands, Denmark, Switzerland, or the United States, adoption appears mostly driven by their larger ASes, while in Greece or Yemen it’s the smaller ones that are adopting ROV.

The following histogram summarizes the worldwide level of adoption for the 6,765 ASes covered by the previous two maps.

Helping build a safer Internet by measuring BGP RPKI Route Origin Validation

Most ASes either don’t validate at all, or have close to 100% adoption, which is what we’d intuitively expect. However, it’s interesting to observe that there are small numbers of ASes all across the scale. ASes that exhibit partial RPKI-invalid drop rate compared to total requests may either implement ROV partially (on some, but not all, of their BGP routers), or appear as dropping RPKI invalids due to ROV deployment by other ASes in their upstream path.

To estimate the number of users protected by ROV we only considered ASes with an observed adoption above 95%, as an AS with an incomplete deployment still leaves its users vulnerable to route leaks from its BGP peers.

If we take the previous histogram and summarize by the number of users behind each AS, the green bar on the right corresponds to the 261 million users currently protected by ROV according to the above criteria (686 ASes).

Helping build a safer Internet by measuring BGP RPKI Route Origin Validation

Looking back at the country adoption map one would perhaps expect the number of protected users to be larger. But worldwide ROV deployment is still mostly partial, lacking larger ASes, or both. This becomes even more clear when compared with the next map, plotting just the fraction of fully protected users.

Helping build a safer Internet by measuring BGP RPKI Route Origin Validation

To wrap up our analysis, we look at two world economies chosen for their contrasting, almost symmetrical, stages of deployment: the United States and the European Union.

Helping build a safer Internet by measuring BGP RPKI Route Origin Validation

112 million Internet users are protected by 111 ASes from the United States with comprehensive ROV deployments. Conversely, more than twice as many ASes from countries making up the European Union have fully deployed ROV, but end up covering only half as many users. This can be reasonably explained by end user ASes being more likely to operate within a single country rather than span multiple countries.

Conclusion

Probe requests were performed from end user browsers and very few measurements were collected from transit providers (which have few end users, if any). Also, paths between end user ASes and Cloudflare are often very short (a nice outcome of our extensive peering) and don’t traverse upper-tier networks that they would otherwise use to reach the rest of the Internet.

In other words, the methodology used focuses on ROV adoption by end user networks (e.g. ISPs) and isn’t meant to reflect the eventual effect of indirect validation from (perhaps validating) upper-tier transit networks. While indirect validation may limit the “blast radius” of (malicious or accidental) route leaks, it still leaves non-validating ASes vulnerable to leaks coming from their peers.

As with indirect validation, an AS remains vulnerable until its ROV deployment reaches a sufficient level of completion. We chose to only consider AS deployments above 95% as truly comprehensive, and Cloudflare Radar will soon begin using this threshold to track ROV adoption worldwide, as part of our mission to help build a better Internet.

When considering only comprehensive ROV deployments, some countries such as Denmark, Greece, Switzerland, Sweden, or Australia, already show an effective coverage above 50% of their respective Internet populations, with others like the Netherlands or the United States slightly above 40%, mostly driven by few large ASes rather than many smaller ones.

Worldwide we observe a very low effective coverage of just 6.5% over the measured ASes, corresponding to 261 million end users currently safe from (malicious and accidental) route leaks, which means there’s still a long way to go before we can declare BGP to be safe.

……
1https://rpki.cloudflare.com/
2Gilad, Yossi, Avichai Cohen, Amir Herzberg, Michael Schapira, and Haya Shulman. "Are we there yet? On RPKI’s deployment and security." Cryptology ePrint Archive (2016).
3Geoff Huston. “Measuring ROAs and ROV”. https://blog.apnic.net/2021/03/24/measuring-roas-and-rov/
4Measurements are issued stochastically when users encounter 1xxx error pages from default (non-customer) configurations.
5Probe requests are weighted by AS size as calculated from Cloudflare’s worldwide HTTP traffic.
6Quan, Lin, John Heidemann, and Yuri Pradkin. "When the Internet sleeps: Correlating diurnal networks with external factors." In Proceedings of the 2014 Conference on Internet Measurement Conference, pp. 87-100. 2014.

How we detect route leaks and our new Cloudflare Radar route leak service

Post Syndicated from Mingwei Zhang original https://blog.cloudflare.com/route-leak-detection-with-cloudflare-radar/

How we detect route leaks and our new Cloudflare Radar route leak service

How we detect route leaks and our new Cloudflare Radar route leak service

Today we’re introducing Cloudflare Radar’s route leak data and API so that anyone can get information about route leaks across the Internet. We’ve built a comprehensive system that takes in data from public sources and Cloudflare’s view of the Internet drawn from our massive global network. The system is now feeding route leak data on Cloudflare Radar’s ASN pages and via the API.

This blog post is in two parts. There’s a discussion of BGP and route leaks followed by details of our route leak detection system and how it feeds Cloudflare Radar.

About BGP and route leaks

Inter-domain routing, i.e., exchanging reachability information among networks, is critical to the wellness and performance of the Internet. The Border Gateway Protocol (BGP) is the de facto routing protocol that exchanges routing information among organizations and networks. At its core, BGP assumes the information being exchanged is genuine and trust-worthy, which unfortunately is no longer a valid assumption on the current Internet. In many cases, networks can make mistakes or intentionally lie about the reachability information and propagate that to the rest of the Internet. Such incidents can cause significant disruptions of the normal operations of the Internet. One type of such disruptive incident is route leaks.

We consider route leaks as the propagation of routing announcements beyond their intended scope (RFC7908). Route leaks can cause significant disruption affecting millions of Internet users, as we have seen in many past notable incidents. For example, in June 2016 a misconfiguration in a small network in Pennsylvania, US (AS396531 – Allegheny Technologies Inc) accidentally leaked a Cloudflare prefix to Verizon, which proceeded to propagate the misconfigured route to the rest of its peers and customers. As a result, the traffic of a large portion of the Internet was squeezed through the limited-capacity links of a small network. The resulting congestion caused most of Cloudflare traffic to and from the affected IP range to be dropped.

A similar incident in November 2018 caused widespread unavailability of Google services when a Nigerian ISP (AS37282 – Mainone) accidentally leaked a large number of Google IP prefixes to its peers and providers violating the valley-free principle.

These incidents illustrate not only that route leaks can be very impactful, but also the snowball effects that misconfigurations in small regional networks can have on the global Internet.

Despite the criticality of detecting and rectifying route leaks promptly, they are often detected only when users start reporting the noticeable effects of the leaks. The challenge with detecting and preventing route leaks stems from the fact that AS business relationships and BGP routing policies are generally undisclosed, and the affected network is often remote to the root of the route leak.

In the past few years, solutions have been proposed to prevent the propagation of leaked routes. Such proposals include RFC9234 and ASPA, which extends the BGP to annotate sessions with the relationship type between the two connected AS networks to enable the detention and prevention of route leaks.

An alternative proposal to implement similar signaling of BGP roles is through the use of BGP Communities; a transitive attribute used to encode metadata in BGP announcements. While these directions are promising in the long term, they are still in very preliminary stages and are not expected to be adopted at scale soon.

At Cloudflare, we have developed a system to detect route leak events automatically and send notifications to multiple channels for visibility. As we continue our efforts to bring more relevant data to the public, we are happy to announce that we are starting an open data API for our route leak detection results today and integrate results to Cloudflare Radar pages.

How we detect route leaks and our new Cloudflare Radar route leak service

Route leak definition and types

Before we jump into how we design our systems, we will first do a quick primer on what a route leak is, and why it is important to detect it.

We refer to the published IETF RFC7908 document “Problem Definition and Classification of BGP Route Leaks” to define route leaks.

> A route leak is the propagation of routing announcement(s) beyond their intended scope.

The intended scope is often concretely defined as inter-domain routing policies based on business relationships between Autonomous Systems (ASes). These business relationships are broadly classified into four categories: customers, transit providers, peers and siblings, although more complex arrangements are possible.

In a customer-provider relationship the customer AS has an agreement with another network to transit its traffic to the global routing table. In a peer-to-peer relationship two ASes agree to free bilateral traffic exchange, but only between their own IPs and the IPs of their customers. Finally, ASes that belong under the same administrative entity are considered siblings, and their traffic exchange is often unrestricted.  The image below illustrates how the three main relationship types translate to export policies.

How we detect route leaks and our new Cloudflare Radar route leak service

By categorizing the types of AS-level relationships and their implications on the propagation of BGP routes, we can define multiple phases of a prefix origination announcements during propagation:

  • upward: all path segments during this phase are customer to provider
  • peering: one peer-peer path segment
  • downward: all path segments during this phase are provider to customer

An AS path that follows valley-free routing principle will have upward, peering, downward phases, all optional but have to be in that order. Here is an example of an AS path that conforms with valley-free routing.

How we detect route leaks and our new Cloudflare Radar route leak service

In RFC7908, “Problem Definition and Classification of BGP Route Leaks”, the authors define six types of route leaks, and we refer to these definitions in our system design. Here are illustrations of each of the route leak types.

Type 1: Hairpin Turn with Full Prefix

> A multihomed AS learns a route from one upstream ISP and simply propagates it to another upstream ISP (the turn essentially resembling a hairpin).  Neither the prefix nor the AS path in the update is altered.

An AS path that contains a provider-customer and customer-provider segment is considered a type 1 leak. The following example: AS4 → AS5 → AS6 forms a type 1 leak.

How we detect route leaks and our new Cloudflare Radar route leak service

Type 1 is the most recognized type of route leaks and is very impactful. In many cases, a customer route is preferable to a peer or a provider route. In this example, AS6 will likely prefer sending traffic via AS5 instead of its other peer or provider routes, causing AS5 to unintentionally become a transit provider. This can significantly affect the performance of the traffic related to the leaked prefix or cause outages if the leaking AS is not provisioned to handle a large influx of traffic.

In June 2015, Telekom Malaysia (AS4788), a regional ISP, leaked over 170,000 routes learned from its providers and peers to its other provider Level3 (AS3549, now Lumin). Level3 accepted the routes and further propagated them to its downstream networks, which in turn caused significant network issues globally.

Type 2: Lateral ISP-ISP-ISP Leak

Type 2 leak is defined as propagating routes obtained from one peer to another peer, creating two or more consecutive peer-to-peer path segments.

Here is an example: AS3 → AS4 → AS5 forms a  type 2 leak.

How we detect route leaks and our new Cloudflare Radar route leak service

One example of such leaks is more than three very large networks appearing in sequence. Very large networks (such as Verizon and Lumin) do not purchase transit from each other, and having more than three such networks on the path in sequence is often an indication of a route leak.

However, in the real world, it is not unusual to see multiple small peering networks exchanging routes and passing on to each other. Legit business reasons exist for having this type of network path. We are less concerned about this type of route leak as compared to type 1.

Type 3 and 4: Provider routes to peer; peer routes to provider

These two types involve propagating routes from a provider or a peer not to a customer, but to another peer or provider. Here are the illustrations of the two types of leaks:

How we detect route leaks and our new Cloudflare Radar route leak service

As in the previously mentioned example, a Nigerian ISP who peers with Google accidentally leaked its route to its provider AS4809, and thus generated a type 4 route leak. Because routes via customers are usually preferred to others, the large provider (AS4809) rerouted its traffic to Google via its customer, i.e. the leaking ASN, overwhelmed the small ISP and took down Google for over one hour.

Route leak summary

So far, we have looked at the four types of route leaks defined in RFC7908. The common thread of the four types of route leaks is that they’re all defined using AS-relationships, i.e., peers, customers, and providers. We summarize the types of leaks by categorizing the AS path propagation based on where the routes are learned from and propagate to. The results are shown in the following table.

Routes from / propagates to To provider To peer To customer
From provider Type 1 Type 3 Normal
From peer Type 4 Type 2 Normal
From customer Normal Normal Normal

We can summarize the whole table into one single rule: routes obtained from a non-customer AS can only be propagated to customers.

Note: Type 5 and type 6 route leaks are defined as prefix re-origination and announcing of private prefixes. Type 5 is more closely related to prefix hijackings, which we plan to expand our system to as the next steps, while type 6 leaks are outside the scope of this work. Interested readers can refer to sections 3.5 and 3.6 of RFC7908 for more information.

The Cloudflare Radar route leak system

Now that we know what a  route leak is, let’s talk about how we designed our route leak detection system.

From a very high level, we compartmentalize our system into three different components:

  1. Raw data collection module: responsible for gathering BGP data from multiple sources and providing BGP message stream to downstream consumers.
  2. Leak detection module: responsible for determining whether a given AS-level path is a route leak, estimate the confidence level of the assessment, aggregating and providing all external evidence needed for further analysis of the event.
  3. Storage and notification module: responsible for providing access to detected route leak events and sending out notifications to relevant parties. This could also include building a dashboard for easy access and search of the historical events and providing the user interface for high-level analysis of the event.

Data collection module

There are three types of data input we take into consideration:

  1. Historical: BGP archive files for some time range in the past
    a. RouteViews and RIPE RIS BGP archives
  2. Semi-real-time: BGP archive files as soon as they become available, with a 10-30 minute delay.
    a. RouteViews and RIPE RIS archives with data broker that checks new files periodically (e.g. BGPKIT Broker)
  3. Real-time: true real-time data sources
    a. RIPE RIS Live
    b. Cloudflare internal BGP sources

How we detect route leaks and our new Cloudflare Radar route leak service

For the current version, we use the semi-real-time data source for the detection system, i.e., the BGP updates files from RouteViews and RIPE RIS. For data completeness, we process data from all public collectors from these two projects (a total of 63 collectors and over 2,400 collector peers) and implement a pipeline that’s capable of handling the BGP data processing as the data files become available.

For data files indexing and processing, we deployed an on-premises BGPKIT Broker instance with Kafka feature enabled for message passing, and a custom concurrent MRT data processing pipeline based on BGPKIT Parser Rust SDK. The data collection module processes MRT files and converts results into a BGP messages stream at over two billion BGP messages per day (roughly 30,000 messages per second).

Route leak detection

The route leak detection module works at the level of individual BGP announcements. The detection component investigates one BGP message at a time, and estimates how likely a given BGP message is a result of a route leak event.

How we detect route leaks and our new Cloudflare Radar route leak service

We base our detection algorithm mainly on the valley-free model, which we believe can capture most of the notable route leak incidents. As mentioned previously, the key to having low false positives for detecting route leaks with the valley-free model is to have accurate AS-level relationships. While those relationship types are not publicized by every AS, there have been over two decades of research on the inference of the relationship types using publicly observed BGP data.

While state-of-the-art relationship inference algorithms have been shown to be highly accurate, even a small margin of errors can still incur inaccuracies in the detection of route leaks. To alleviate such artifacts, we synthesize multiple data sources for inferring AS-level relationships, including CAIDA/UCSD’s AS relationship data and our in-house built AS relationship dataset. Building on top of the two AS-level relationships, we create a much more granular dataset at the per-prefix and per-peer levels. The improved dataset allows us to answer the question like what is the relationship between AS1 and AS2 with respect to prefix P observed by collector peer X. This eliminates much of the ambiguity for cases where networks have multiple different relationships based on prefixes and geo-locations, and thus helps us reduce the number of false positives in the system. Besides the AS-relationships datasets, we also apply the AS Hegemony dataset from IHR IIJ to further reduce false positives.

Route leak storage and presentation

After processing each BGP message, we store the generated route leak entries in a database for long-term storage and exploration. We also aggregate individual route leak BGP announcements and group relevant leaks from the same leak ASN within a short period together into route-leak events. The route leak events will then be available for consumption by different downstream applications like web UIs, an API, or alerts.

How we detect route leaks and our new Cloudflare Radar route leak service

Route leaks on Cloudflare Radar

At Cloudflare, we aim to help build a better Internet, and that includes sharing our efforts on monitoring and securing Internet routing. Today, we are releasing our route leak detection system as public beta.

Starting today, users going to the Cloudflare Radar ASN pages will now find the list of route leaks that affect that AS. We consider that an AS is being affected when the leaker AS is one hop away from it in any direction, before or after.

The Cloudflare Radar ASN page is directly accessible via https://radar.cloudflare.com/as{ASN}. For example, one can navigate to https://radar.cloudflare.com/as174 to view the overview page for Cogent AS174. ASN pages now show a dedicated card for route leaks detected relevant to the current ASN within the selected time range.

How we detect route leaks and our new Cloudflare Radar route leak service

Users can also start using our public data API to lookup route leak events with regards to any given ASN.  Our API supports filtering route leak results by time ranges, and ASes involved. Here is a screenshot of the route leak events API documentation page on the newly updated API docs site.

How we detect route leaks and our new Cloudflare Radar route leak service

More to come on routing security

There is a lot more we are planning to do with route-leak detection. More features like a global view page, route leak notifications, more advanced APIs, custom automations scripts, and historical archive datasets will begin to ship on Cloudflare Radar over time. Your feedback and suggestions are also very important for us to continue improving on our detection results and serve better data to the public.

Furthermore, we will continue to expand our work on other important topics of Internet routing security, including global BGP hijack detection (not limited to our customer networks), RPKI validation monitoring, open-sourcing tools and architecture designs, and centralized routing security web gateway. Our goal is to provide the best data and tools for routing security to the communities so that we can build a better and more secure Internet together.

In the meantime, we opened a Radar room on our Developers Discord Server. Feel free to join and talk to us; the team is eager to receive feedback and answer questions.

Visit Cloudflare Radar for more Internet insights. You can also follow us on Twitter for more Radar updates.