Post Syndicated from Suleman Ahmad original https://blog.cloudflare.com/measuring-network-connections-at-scale/
Every interaction on the Internet—including loading a web page, streaming a video, or making an API call—starts with a connection. These fundamental logical connections consist of a stream of packets flowing back and forth between devices.
Various aspects of these network connections have captured the attention of researchers and practitioners for as long as the Internet has existed. The interest in connections even predates the label, as can be seen in the seminal 1991 paper, “Characteristics of wide-area TCP/IP conversations.” By any name, the Internet measurement community has been steeped in characterizations of Internet communication for decades, asking everything from “how long?” and “how big?” to “how often?” – and those are just to start.
Surprisingly, connection characteristics on the wider Internet are largely unavailable. While anyone can use tools (e.g., Wireshark) to capture data locally, it’s virtually impossible to measure connections globally because of access and scale. Moreover, network operators generally do not share the characteristics they observe — assuming that non-trivial time and energy is taken to observe them.
In this blog post, we move in another direction by sharing aggregate insights about connections established through our global CDN. We present characteristics of TCP connections—which account for about 70% of HTTP requests to Cloudflare—providing empirical insights that are difficult to obtain from client-side measurements alone.
Characterizing system behavior helps us predict the impact of changes. In the context of networks, consider a new routing algorithm or transport protocol: how can you measure its effects? One option is to deploy the change directly on live networks, but this is risky. Unexpected consequences could disrupt users or other parts of the network, making a “deploy-first” approach potentially unsafe or ethically questionable.
A safer alternative to live deployment as a first step is simulation. Using simulation, a designer can get important insights about their scheme without having to build a full version. But simulating the whole Internet is challenging, as described by another highly seminal work, “Why we don’t know how to simulate the Internet”.
To run a useful simulation, we need it to behave like the real system we’re studying. That means generating synthetic data that mimics real-world behavior. Often, we do this by using statistical distributions — mathematical descriptions of how the real data behaves. But before we can create those distributions, we first need to characterize the data — to measure and understand its key properties. Only then can our simulation produce realistic results.
The value of any data depends on its collection mechanism. Every dataset has blind spots, biases, and limitations, and ignoring these can lead to misleading conclusions. By examining the finer details — how the data was gathered, what it represents, and what it excludes — we can better understand its reliability and make informed decisions about how to use it. Let’s take a closer look at our collected telemetry.

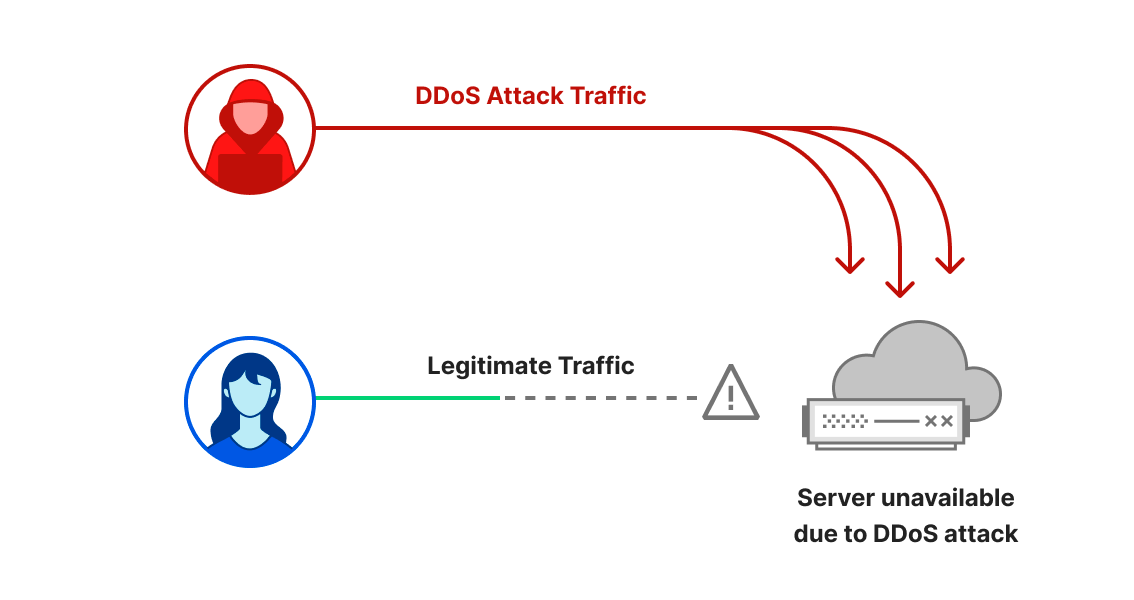
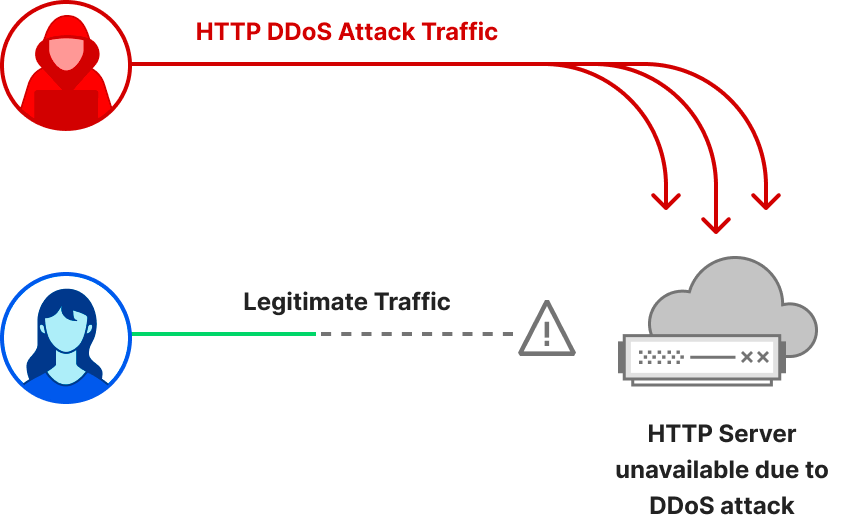
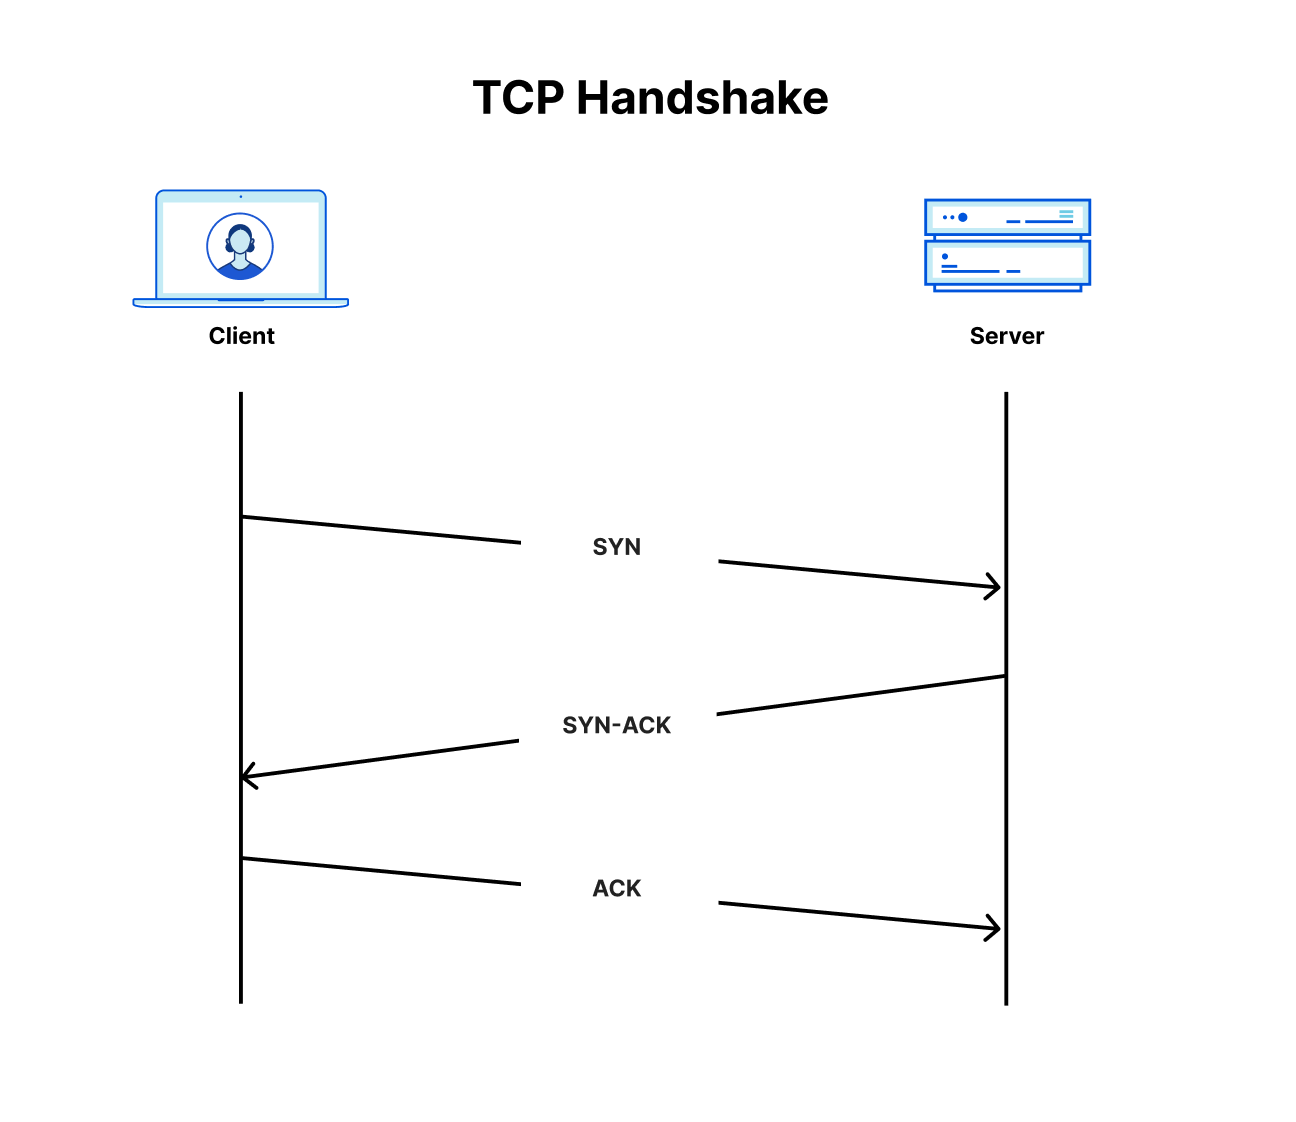
Dataset Overview. The data describes TCP connections, labeled Visitor to Cloudflare in the above diagram, which serve requests via HTTP 1.0, 1.1, and 2.0 that make up about 70% of all 84 million HTTP requests per second, on average, received at our global CDN servers.
Sampling. The passively collected snapshot of data is drawn from a uniformly sampled 1% of all TCP connections to Cloudflare between October 7 and October 15, 2025. Sampling takes place at each individual client-facing server to mitigate biases that may appear by sampling at the datacenter level.
Diversity. Unlike many large operators, whose traffic is primarily their own and dominated by a few services such as search, social media, or streaming video, the vast majority of Cloudflare’s workload comes from our customers, who choose to put Cloudflare in front of their websites to help protect, improve performance, and reduce costs. This diversity of customers brings a wide variety of web applications, services, and users from around the world. As a result, the connections we observe are shaped by a broad range of client devices and application-specific behaviors that are constantly evolving.
What we log. Each entry in the log consists of socket-level metadata captured via the Linux kernel’s TCP_INFO struct, alongside the SNI and the number of requests made during the connection. The logs exclude individual HTTP requests, transactions, and details. We restrict our use of the logs to connection metadata statistics such as duration and number of packets transmitted, as well as the number of HTTP requests processed.
Data capture. We have elected to represent ‘useful’ connections in our dataset that have been fully processed, by characterizing only those connections that close gracefully with a FIN packet. This excludes connections intercepted by attack mitigations, or that timeout, or that abort because of a RST packet.
Since a graceful close does not in itself indicate a ‘useful’ connection, we additionally require at least one successful HTTP request during the connection to filter out idle or non-HTTP connections from this analysis — interestingly, these make up 11% of all TCP connections to Cloudflare that close with a FIN packet.
If you’re curious, we’ve also previously blogged about the details of Cloudflare’s overall logging mechanism and post-processing pipeline.
Although networks are inherently dynamic and trends can change over time, the large-scale patterns we observe across our global infrastructure remain remarkably consistent over time. While our data offers a global view of connection characteristics, distributions can still vary according to regional traffic patterns.
In our visualizations we represent characteristics with cumulative distribution function (CDF) graphs, specifically their empirical equivalents. CDFs are particularly useful for gaining a macroscopic view of the distribution. They give a clear picture of both common and extreme cases in a single view. We use them in the illustrations below to make sense of large-scale patterns. To better interpret the distributions, we also employ log-scaled axes to account for the presence of extreme values common to networking data.
A long-standing question about Internet connections relates to “Elephants and Mice”; practitioners and researchers are entirely aware that most flows are small and some are huge, yet little data exists to inform the lines that divide them. This is where our presentation begins.
Let’s start by taking a look at the distribution of the number of response packets sent in connections by Cloudflare servers back to the clients.

On the graph, the x-axis represents the number of response packets sent in log-scale, while the y-axis shows the cumulative fraction of connections below each packet count. The average response consists of roughly 240 packets, but the distribution is highly skewed. The median is 12 packets, which indicates that 50% of Internet connections consist of very few packets. Extending further to the 90th percentile, connections carry only 107 packets.
This stark contrast highlights the heavy-tailed nature of Internet traffic: while a few connections transport massive amounts of data—like video streams or large file transfers—most interactions are tiny, delivering small web objects, microservice traffic, or API responses.

The above plot breaks down the packet count distribution by HTTP protocol version. For HTTP/1.X (both HTTP 1.0 and 1.1 combined) connections, the median response consists of just 10 packets, and 90% of connections carry fewer than 63 response packets. In contrast, HTTP/2 connections show larger responses, with a median of 16 packets and a 90th percentile of 170 packets. This difference likely reflects how HTTP/2 multiplexes multiple streams over a single connection, often consolidating more requests and responses into fewer connections, which increases the total number of packets exchanged per connection. HTTP/2 connections also have additional control-plane frames and flow-control messages that increase response packet counts.
Despite these differences, the combined view displays the same heavy-tailed pattern: a small fraction of connections carry enormous volumes of data (elephant flows), extending to millions of packets, while most remain lightweight (mice flows).
So far, we’ve focused on the total number of packets sent from our servers to clients, but another important dimension of connection behavior is the balance between packets sent and received, illustrated below.

The x-axis shows the ratio of packets sent by our servers to packets received from clients, visualized as a CDF. Across all connections, the median ratio is 0.91, meaning that in half of connections, clients send slightly more packets than the server responds with. This excess of client-side packets primarily reflects TLS handshake initiation (ClientHello), HTTP control request headers, and data acknowledgements (ACKs), causing the client to typically transmit more packets than the server returns with the content payload — particularly for low-volume connections that dominate the distribution.
The mean ratio is higher, at 1.28, due to a long tail of client-heavy connections, such as large downloads typical of CDN workloads. Most connections fall within a relatively narrow range: 10% of connections have a ratio below 0.67, and 90% are below 1.85. However, the long-tailed behavior highlights the diversity of Internet traffic: extreme values arise from both upload-heavy and download-heavy connections. The variance of 3.71 reflects these asymmetric flows, while the bulk of connections maintain a roughly balanced upload-to-download exchange.
Another dimension to look at the data is using bytes sent by our servers to clients, which captures the actual volume of data delivered over each connection. This metric is derived from tcpi_bytes_sent, also covering (re)transmitted segment payloads while excluding the TCP header, as defined in linux/tcp.h and aligned with RFC 4898 (TCP Extended Statistics MIB).

The plots above break down bytes sent by HTTP protocol version. The x-axis represents the total bytes sent by our servers over each connection. The patterns are generally consistent with what we observed in the packet count distributions.
For HTTP/1.X, the median response delivers 4.8 KB, and 90% of connections send fewer than 51 KB. In contrast, HTTP/2 connections show slightly larger responses, with a median of 6 KB and a 90th percentile of 146 KB. The mean is much higher—224 KB for HTTP/1.x and 390 KB for HTTP/2—reflecting a small number of very large transfers. These long-tailed extreme flows can reach tens of gigabytes per connection, while some very lightweight connections carry minimal payloads: the minimum for HTTP/1.X is 115 bytes and for HTTP/2 it is 202 bytes.

By making use of the tcpi_bytes_received metric, we can now look at the ratio of bytes sent to bytes received per connection to better understand the balance of data exchange. This ratio captures how asymmetric each connection is — essentially, how much data our servers send compared to what they receive from clients. Across all connections, the median ratio is 3.78, meaning that in half of all cases, servers send nearly four times more data than they receive. The average is far higher at 81.06, showing a strong long tail driven by download-heavy flows. Again we see the heavy long-tailed distribution, a small fraction of extreme cases push the ratio into the millions, with more extreme values of data transfers towards clients.
While packet and byte counts capture how much data is exchanged, connection duration provides insight into how that exchange unfolds over time.

The CDF above shows the distribution of connection durations (lifetimes) in seconds. A reminder that the x-axis is log-scale. Across all connections, the median duration is just 4.7 seconds, meaning half of connections complete in under five seconds. The mean is much higher at 96 seconds, reflecting a small number of long-lived connections that skew the average. Most connections fall within a window of 0.1 seconds (10th percentile) to 300 seconds (90th percentile). We also observe some extremely long-lived connections lasting multiple days, possibly maintained via keep-alives for connection reuse without hitting our default idle timeout limits. These long-lived connections typically represent persistent sessions or multimedia traffic, while the majority of web traffic remains short, bursty, and transient.
A single connection can carry multiple HTTP requests for web traffic. This reveals patterns about connection multiplexing.

The above shows the number of HTTP requests (in log-scale) that we see on a single connection, broken down by HTTP protocol version. Right away, we can see that for both HTTP/1.X (mean 3 requests) and HTTP/2 (mean 8 requests) connections, the median number of requests is just 1, reinforcing the prevalence of limited connection reuse. However, because HTTP/2 supports multiplexing multiple streams over a single connection, the 90th percentile rises to 10 requests, with occasional extreme cases carrying thousands of requests, which can be amplified due to connection coalescing. In contrast, HTTP/1.X connections have much lower request counts. This aligns with protocol design: HTTP/1.0 followed a “one request per connection” philosophy, while HTTP/1.1 introduced persistent connections — even combining both versions, it’s rare to see HTTP/1.X connections carrying more than two requests at the 90th percentile.
The prevalence of short-lived connections can be partly explained by automated clients or scripts that tend to open new connections rather than maintaining long-lived sessions. To explore this intuition, we split the data between traffic originating from data centers (likely automated) and typical user traffic (user-driven), using client ASNs as a proxy.

The plot above shows that non-DC (user-driven) traffic has slightly higher request counts per connection, consistent with browsers or apps fetching multiple resources over a single persistent connection, with a mean of 5 requests and a 90th percentile of 5 requests per connection. In contrast, DC-originated traffic has a mean of roughly 3 requests and a 90th percentile of 2, validating our expectation. Despite these differences, the median number of requests remains 1 for both groups highlighting that, regardless of origin of connections, most are genuinely brief.
Connection-level measurements can also provide insights into underlying path characteristics. Let’s examine this in more detail.
The maximum transmission unit (MTU) along the network path is often referred to as the Path MTU (PMTU). PMTU determines the largest packet size that can traverse a connection without fragmentation or packet drop, affecting throughput, efficiency, and latency. The Linux TCP stack on our servers tracks the largest segment size that can be sent without fragmentation along the path for a connection, as part of Path MTU discovery.
From that data we saw that the median (and the 90th percentile!) PMTU was 1500 bytes, which aligns with the typical Ethernet MTU and is considered standard for most Internet paths. Interestingly, the 10th percentile sits at 1,420 bytes, reflecting cases where paths include network links with slightly smaller MTUs—common in some VPNs, IPv6tov4 tunnels, or older networking equipment that impose stricter limits to avoid fragmentation. At the extreme, we have seen MTU as small as 552 bytes for IPv4 connections which relates to the minimum allowed PMTU value by the Linux kernel.
A key parameter in transport protocols is the congestion window (CWND), which is the number of packets that can be transmitted without waiting for an acknowledgement from the receiver. We call these packets or bytes “in-flight.” During a connection, the congestion window evolves dynamically throughout a connection.
However, the initial congestion window (ICWND) at the start of a data transfer can have an outsized impact, especially for short-lived connections, which dominate Internet traffic as we’ve seen above. If the ICWND is set too low, small and medium transfers take additional round-trip times to reach bottleneck bandwidth, slowing delivery. Conversely, if it’s too high, the sender risks overwhelming the network, causing unnecessary packet loss and retransmissions — potentially for all connections that share the bottleneck link.
A reasonable estimate of the ICWND can be taken as the congestion window size at the instant the TCP sender transitions out of slow start. This transition marks the point at which the sender shifts from exponential growth to congestion-avoidance, having inferred that further growth may risk congestion. The figure below shows the distribution of congestion window sizes at the moment slow start exits — as calculated by BBR. The median is roughly 464 KB, which corresponds to about 310 packets per connection with a typical 1,500-byte MTU, while extreme flows carry tens of megabytes in flight. This variance reflects the diversity of TCP connections and the dynamically evolving nature of the networks carrying traffic.

It’s important to emphasize that these values reflect a mix of network paths, including not only paths between Cloudflare and end users, but also between Cloudflare and neighboring datacenters, which are typically well provisioned and offer higher bandwidth.
Our initial inspection of the above distribution left us doubtful, because the values seem very high. We then realized the numbers are an artifact of behaviour specific to BBR, in which it sets the congestion window higher than its estimate of the path’s available capacity, bandwidth delay product (BDP). The inflated value is by design. To prove the hypothesis, we re-plot the distribution from above in the figure below alongside BBR’s estimate of BDP. The difference is clear between BBR’s congestion window of unacknowledged packets and its BDP estimate.

The above plot adds the computed BDP values in context with connection telemetry. The median BDP comes out to be roughly 77 KB, which is roughly 50 packets. If we compare this to the congestion window distribution taken from above, we see BDP estimations from recently closed connections are much more stable.
We are using these insights to help identify reasonable initial congestion window sizes and the circumstances for them. Our own experiments internally make clear that ICWND sizes can affect performance by as much as 30-40% for smaller connections. Such insights will potentially help to revisit efforts to find better initial congestion window values, which has been a default of 10 packets for more than a decade.
We observed that Internet connections are highly heterogeneous, confirming decades-long observations of strong heavy-tail characteristics consistent with “elephants and mice” phenomenon. Ratios of upload to download bytes are unsurprising for larger flows, but surprisingly small for short flows, highlighting the asymmetric nature of Internet traffic. Understanding these connection characteristics continues to inform ways to improve connection performance, reliability, and user experience.
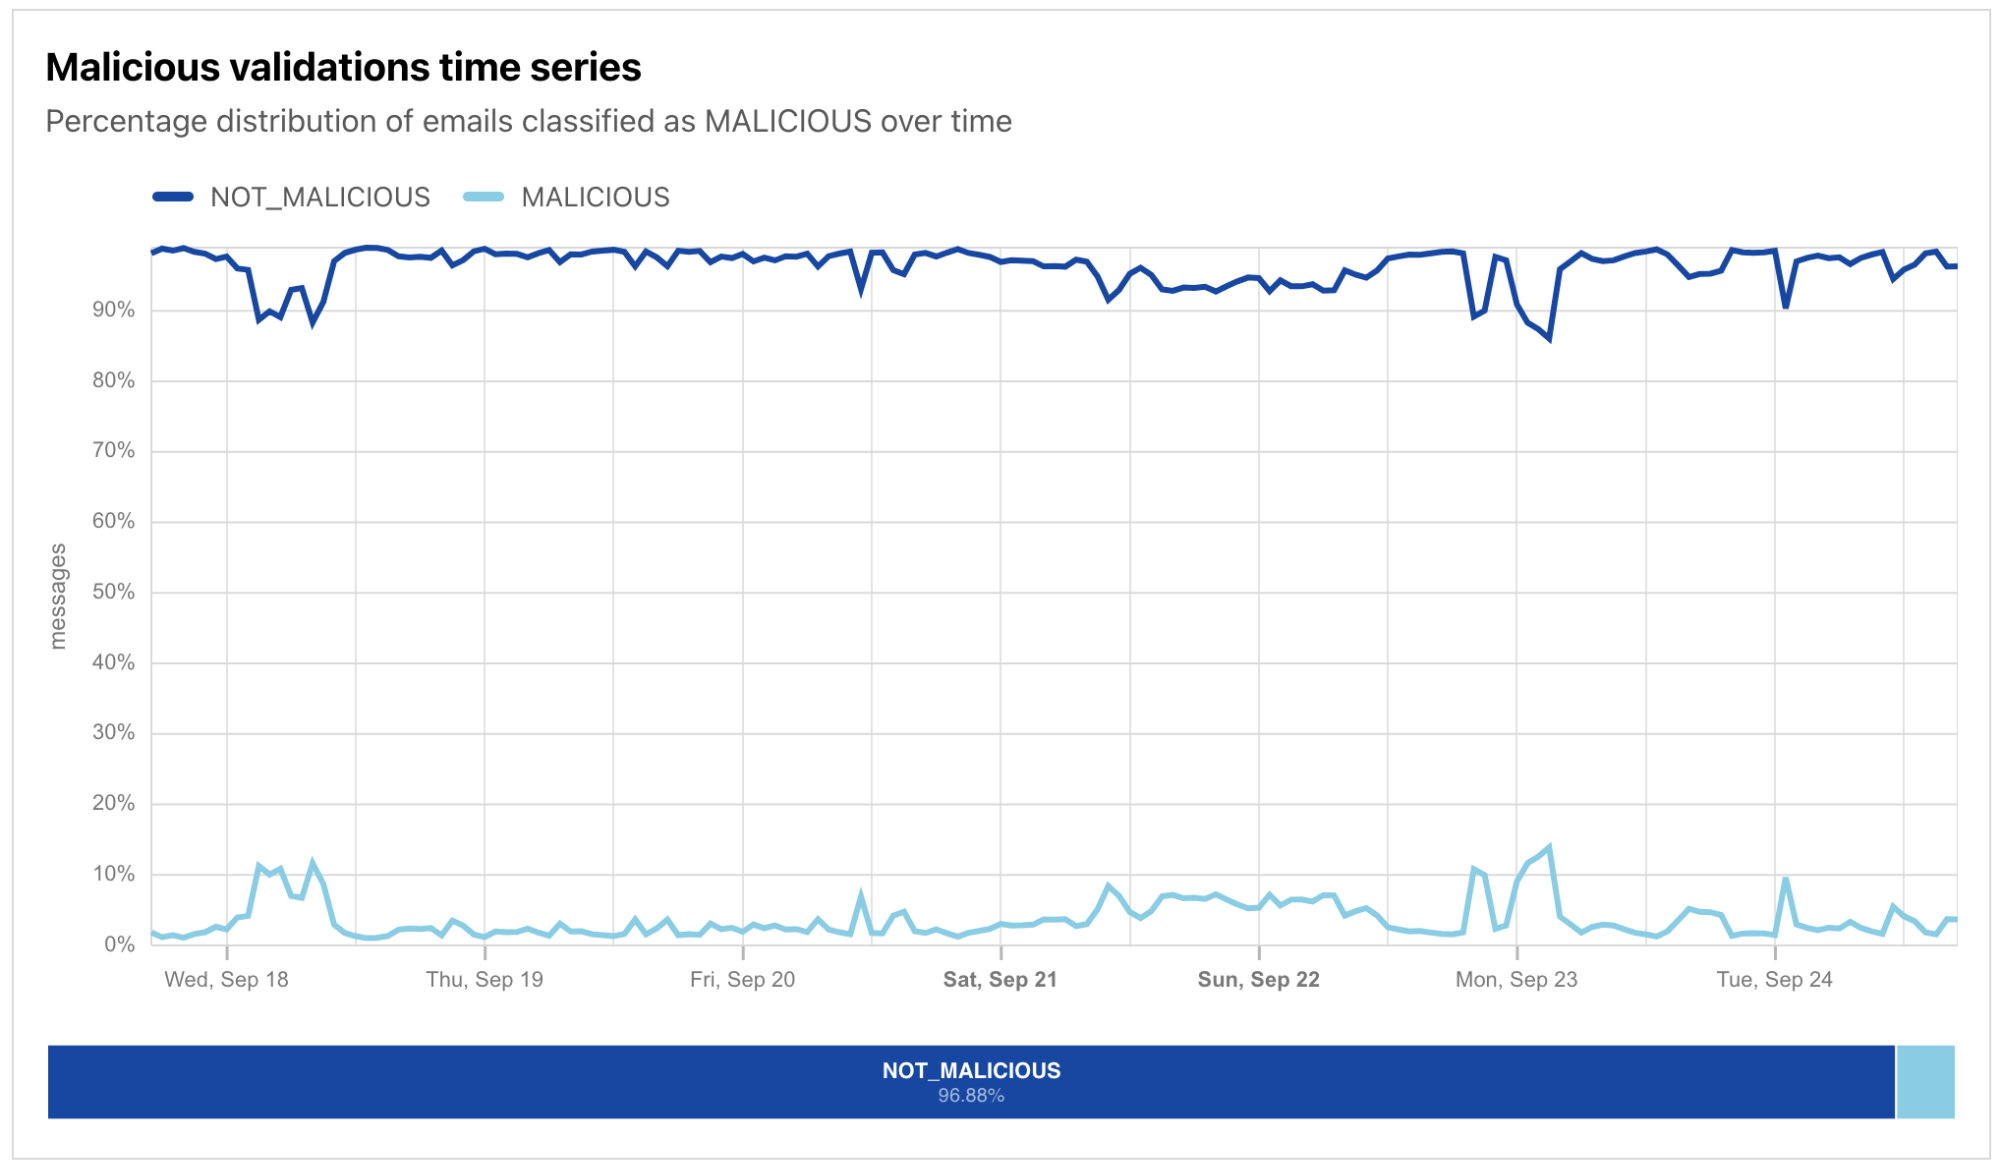
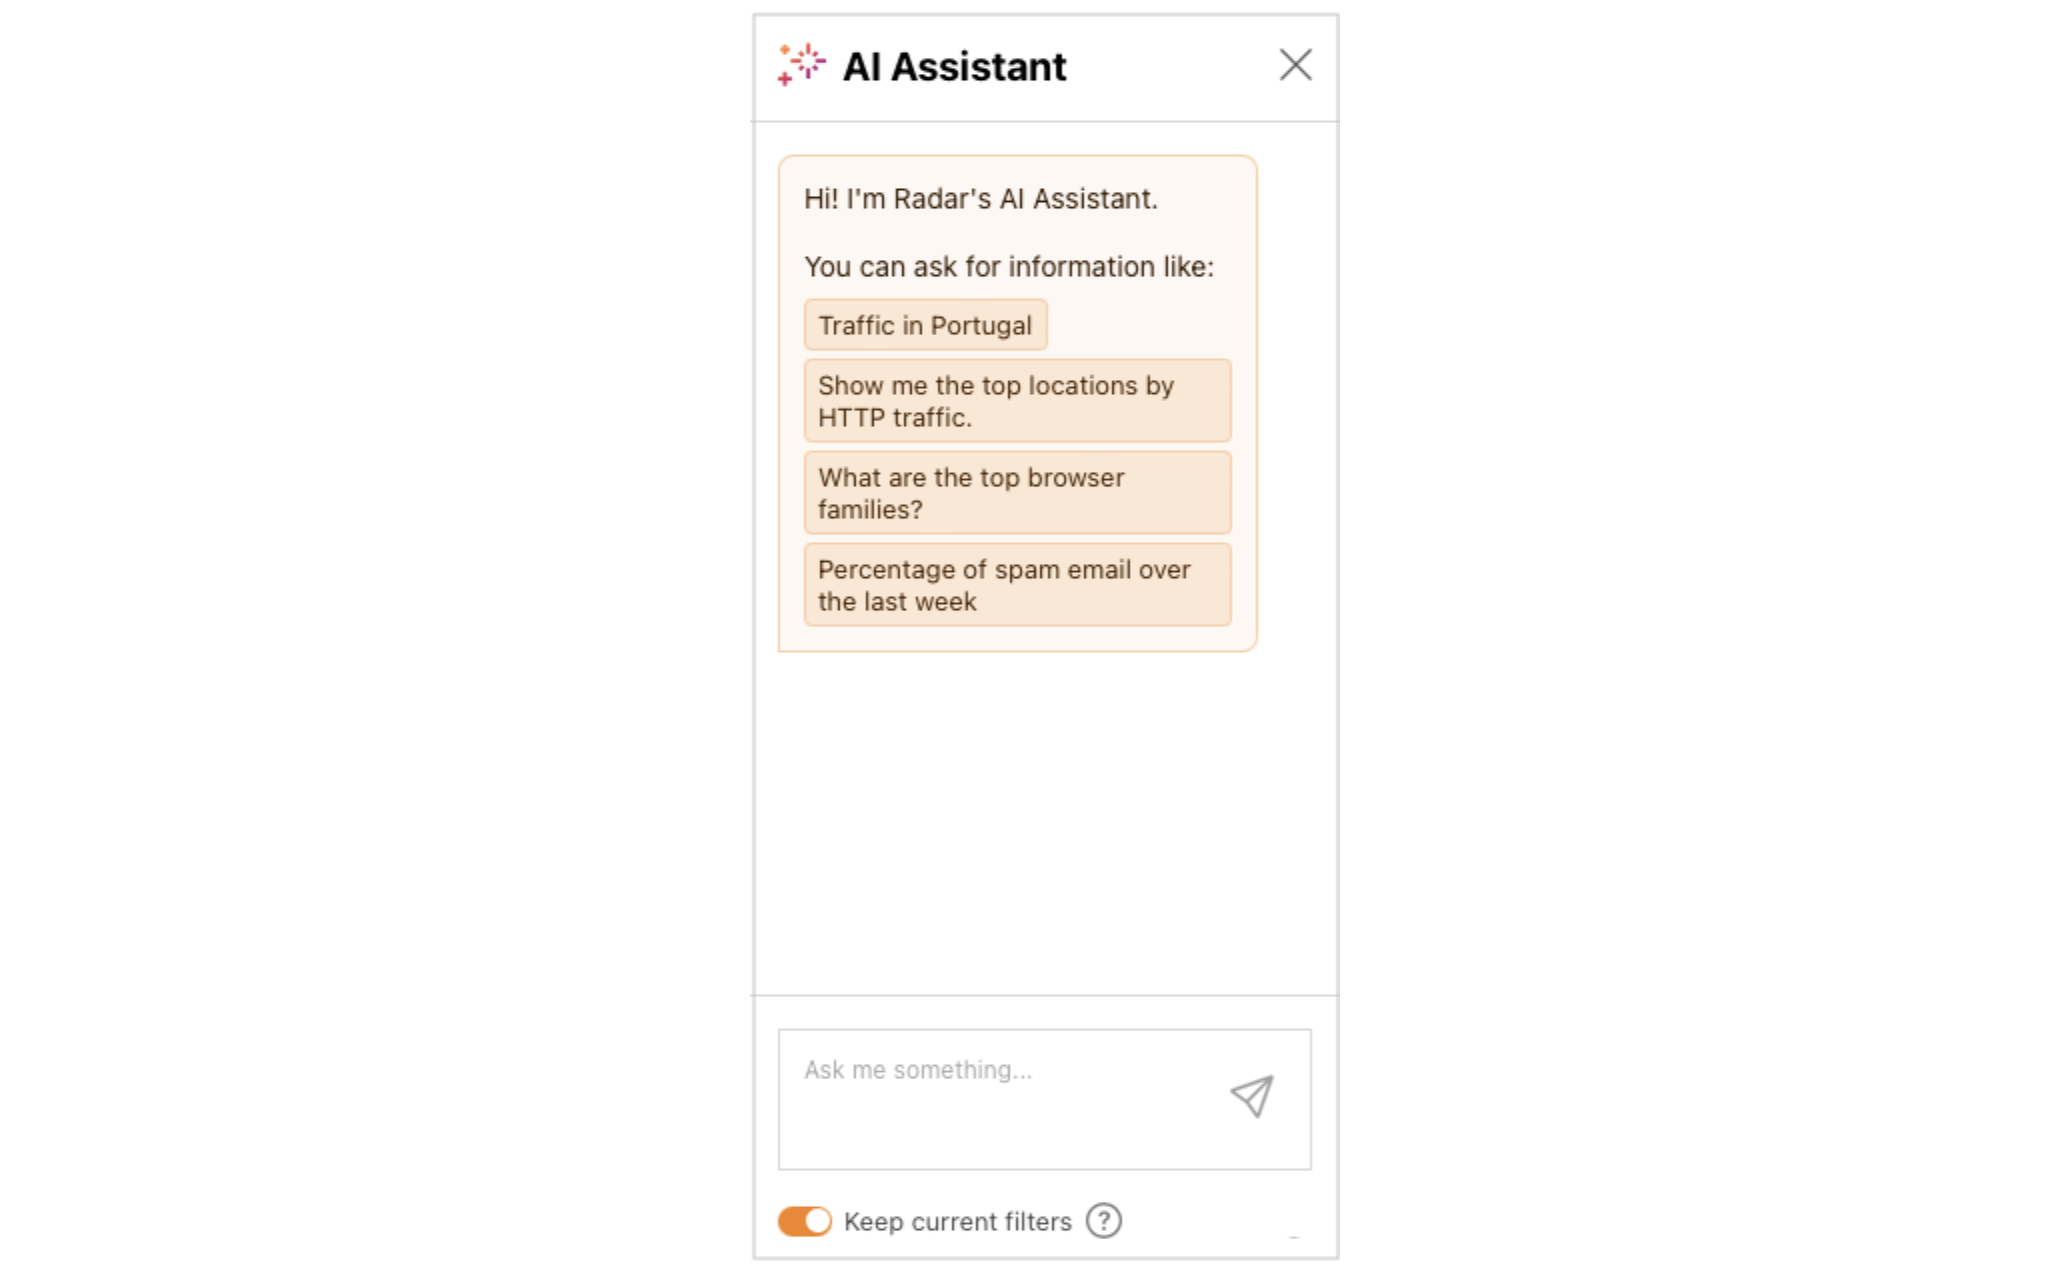
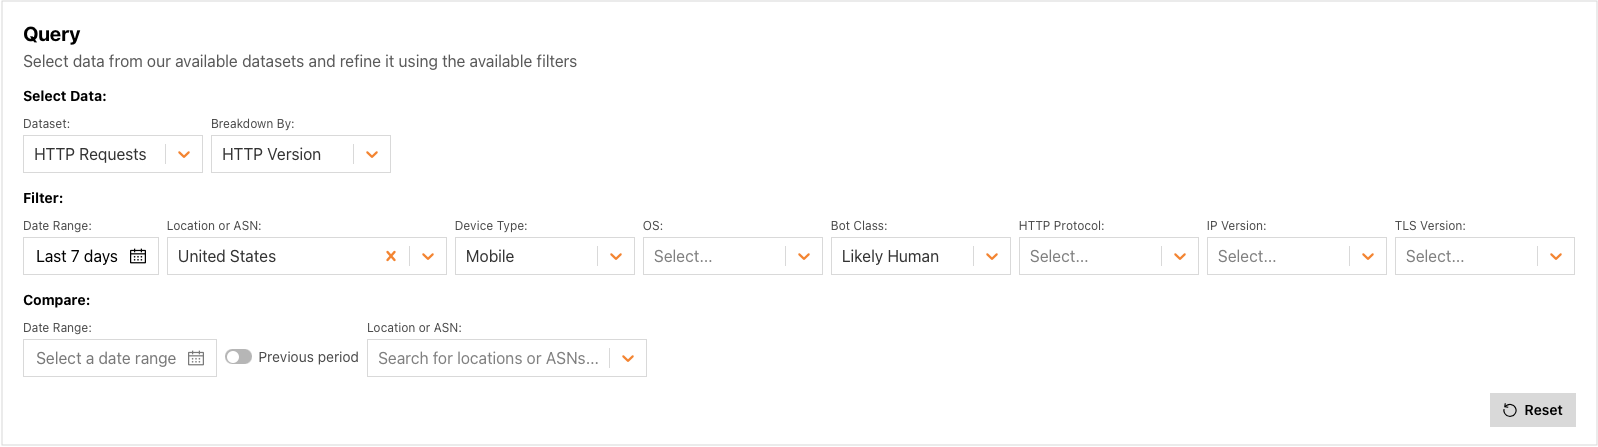
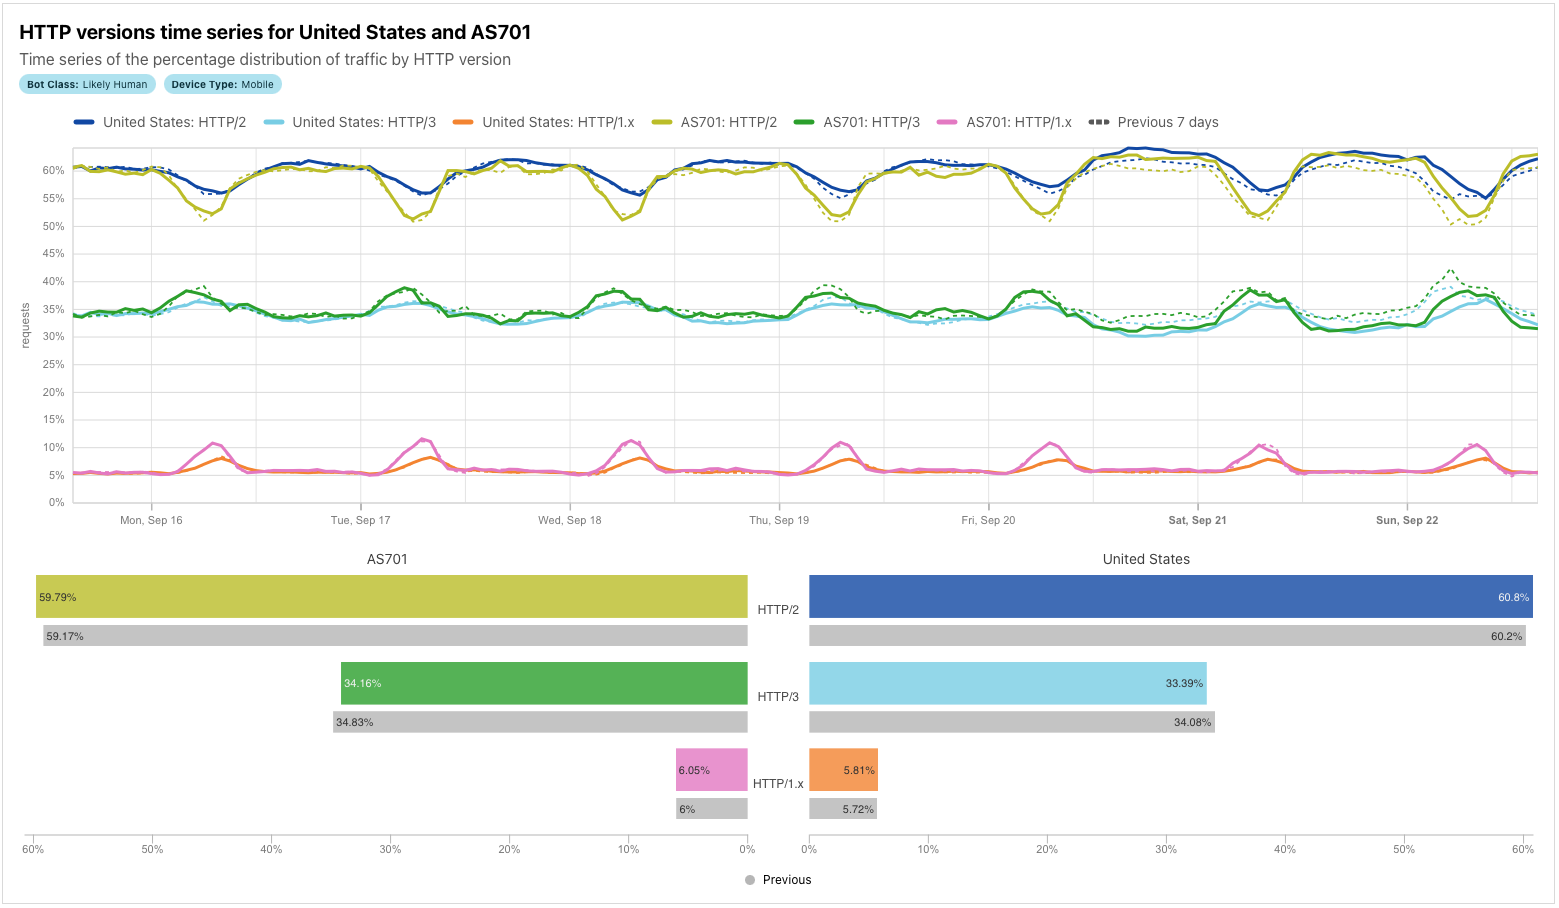
We will continue to build on this work, and plan to publish connection-level statistics on Cloudflare Radar so that others can similarly benefit.
Our work on improving our network is ongoing, and we welcome researchers, academics, interns, and anyone interested in this space to reach out at [email protected]. By sharing knowledge and working together, we all can continue to make the Internet faster, safer, and more reliable for everyone.