Tag Archives: Better Internet

One IP address, many users: detecting CGNAT to reduce collateral effects

Post Syndicated from Vasilis Giotsas original https://blog.cloudflare.com/detecting-cgn-to-reduce-collateral-damage/

IP addresses have historically been treated as stable identifiers for non-routing purposes such as for geolocation and security operations. Many operational and security mechanisms, such as blocklists, rate-limiting, and anomaly detection, rely on the assumption that a single IP address represents a cohesive, accountable entity or even, possibly, a specific user or device.

But the structure of the Internet has changed, and those assumptions can no longer be made. Today, a single IPv4 address may represent hundreds or even thousands of users due to widespread use of Carrier-Grade Network Address Translation (CGNAT), VPNs, and proxy middleboxes. This concentration of traffic can result in significant collateral damage – especially to users in developing regions of the world – when security mechanisms are applied without taking into account the multi-user nature of IPs.

This blog post presents our approach to detecting large-scale IP sharing globally. We describe how we build reliable training data, and how detection can help avoid unintentional bias affecting users in regions where IP sharing is most prevalent. Arguably it’s those regional variations that motivate our efforts more than any other. 

Why this matters: Potential socioeconomic bias

Our work was initially motivated by a simple observation: CGNAT is a likely unseen source of bias on the Internet. Those biases would be more pronounced wherever there are more users and few addresses, such as in developing regions. And these biases can have profound implications for user experience, network operations, and digital equity.

The reasons are understandable for many reasons, not least because of necessity. Countries in the developing world often have significantly fewer available IPs, and more users. The disparity is a historical artifact of how the Internet grew: the largest blocks of IPv4 addresses were allocated decades ago, primarily to organizations in North America and Europe, leaving a much smaller pool for regions where Internet adoption expanded later. 

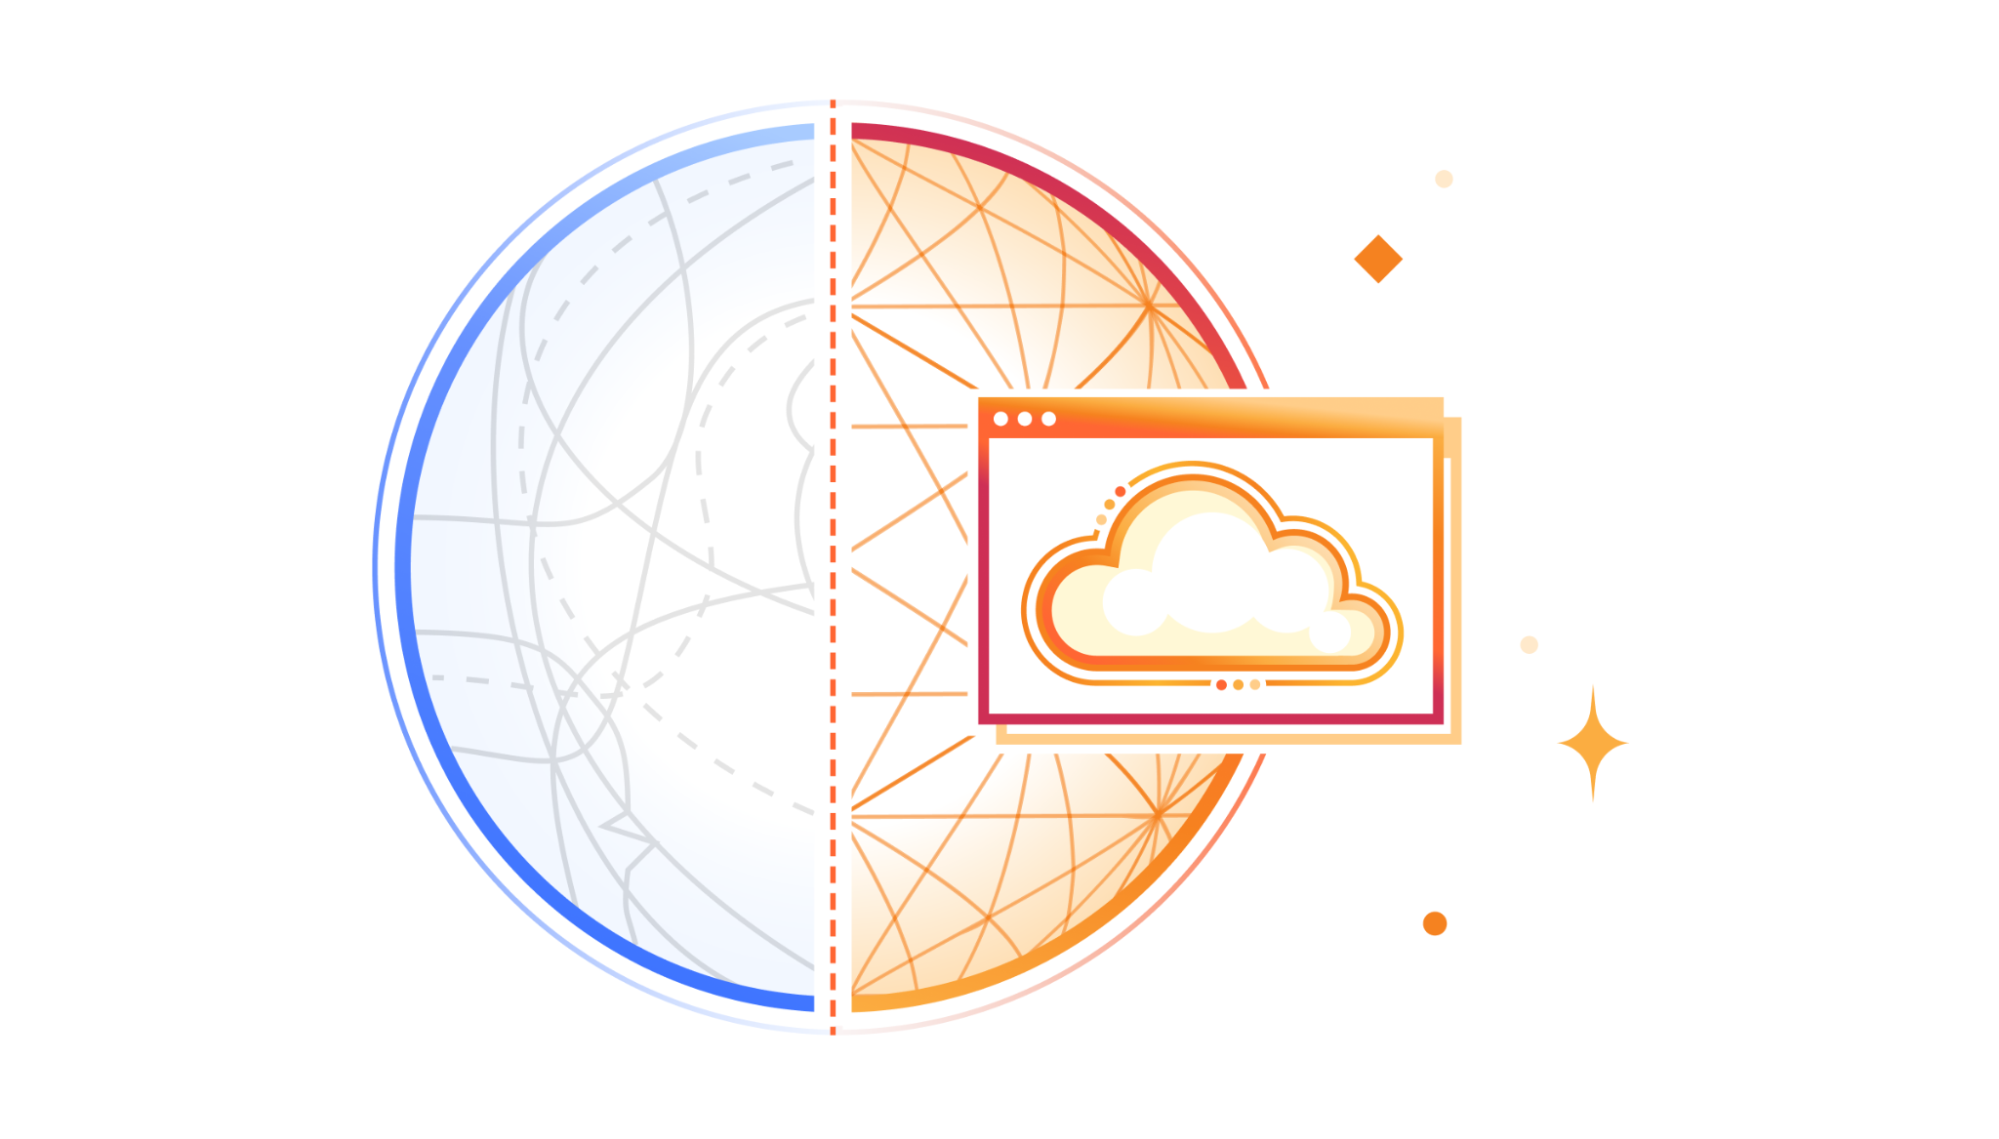
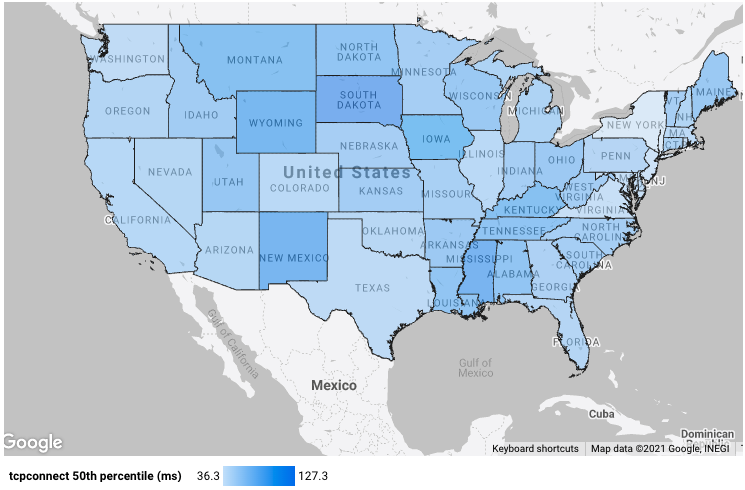
To visualize the IPv4 allocation gap, we plot country-level ratios of users to IP addresses in the figure below. We take online user estimates from the World Bank Group and the number of IP addresses in a country from Regional Internet Registry (RIR) records. The colour-coded map that emerges shows that the usage of each IP address is more concentrated in regions that generally have poor Internet penetration. For example, large portions of Africa and South Asia appear with the highest user-to-IP ratios. Conversely, the lowest user-to-IP ratios appear in Australia, Canada, Europe, and the USA — the very countries that otherwise have the highest Internet user penetration numbers.


The scarcity of IPv4 address space means that regional differences can only worsen as Internet penetration rates increase. A natural consequence of increased demand in developing regions is that ISPs would rely even more heavily on CGNAT, and is compounded by the fact that CGNAT is common in mobile networks that users in developing regions so heavily depend on. All of this means that actions known to be based on IP reputation or behaviour would disproportionately affect developing economies. 

Cloudflare is a global network in a global Internet. We are sharing our methodology so that others might benefit from our experience and help to mitigate unintended effects. First, let’s better understand CGNAT.

When one IP address serves multiple users

Large-scale IP address sharing is primarily achieved through two distinct methods. The first, and more familiar, involves services like VPNs and proxies. These tools emerge from a need to secure corporate networks or improve users’ privacy, but can be used to circumvent censorship or even improve performance. Their deployment also tends to concentrate traffic from many users onto a small set of exit IPs. Typically, individuals are aware they are using such a service, whether for personal use or as part of a corporate network.

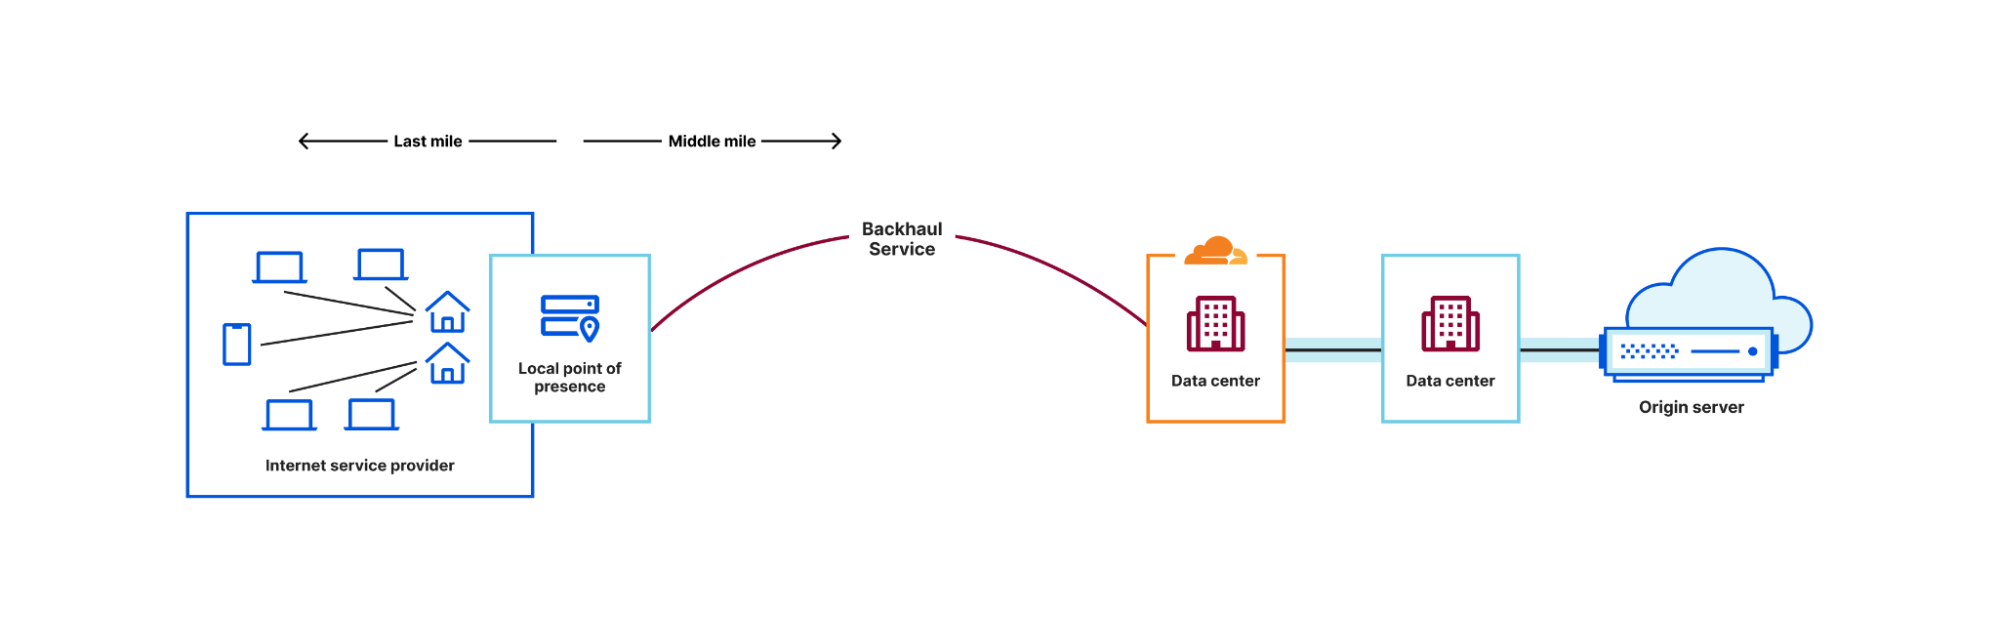
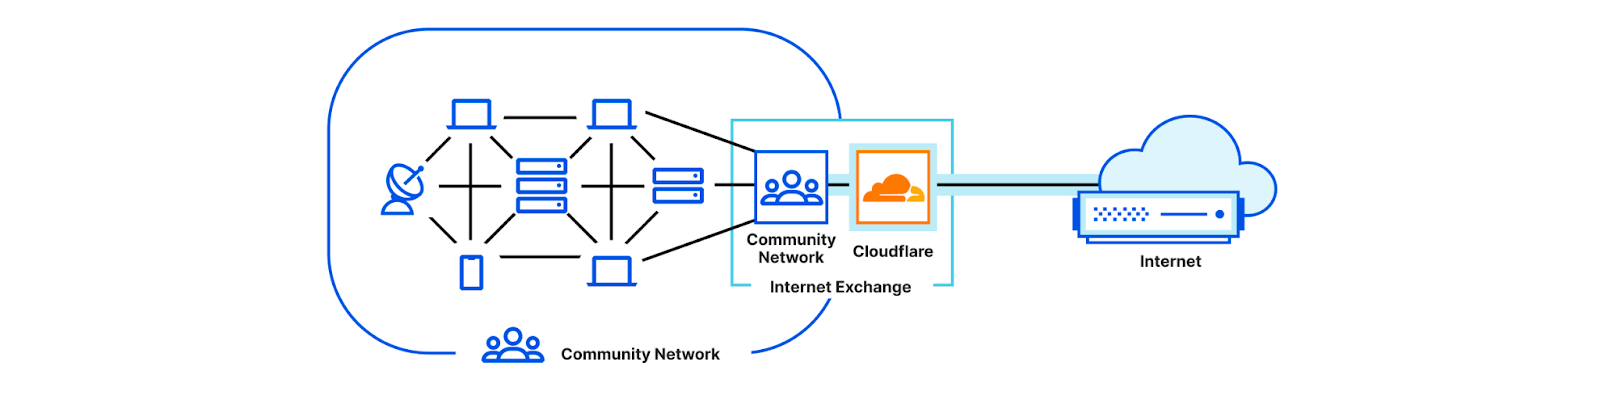
Separately, another form of large-scale IP sharing often goes unnoticed by users: Carrier-Grade NAT (CGNAT). One way to explain CGNAT is to start with a much smaller version of network address translation (NAT) that very likely exists in your home broadband router, formally called a Customer Premises Equipment (or CPE), which translates unseen private addresses in the home to visible and routable addresses in the ISP. Once traffic leaves the home, an ISP may add an additional enterprise-level address translation that causes many households or unrelated devices to appear behind a single IP address.

The crucial difference between large-scale IP sharing is user choice: carrier-grade address sharing is not a user choice, but is configured directly by Internet Service Providers (ISPs) within their access networks. Users are not aware that CGNATs are in use. 

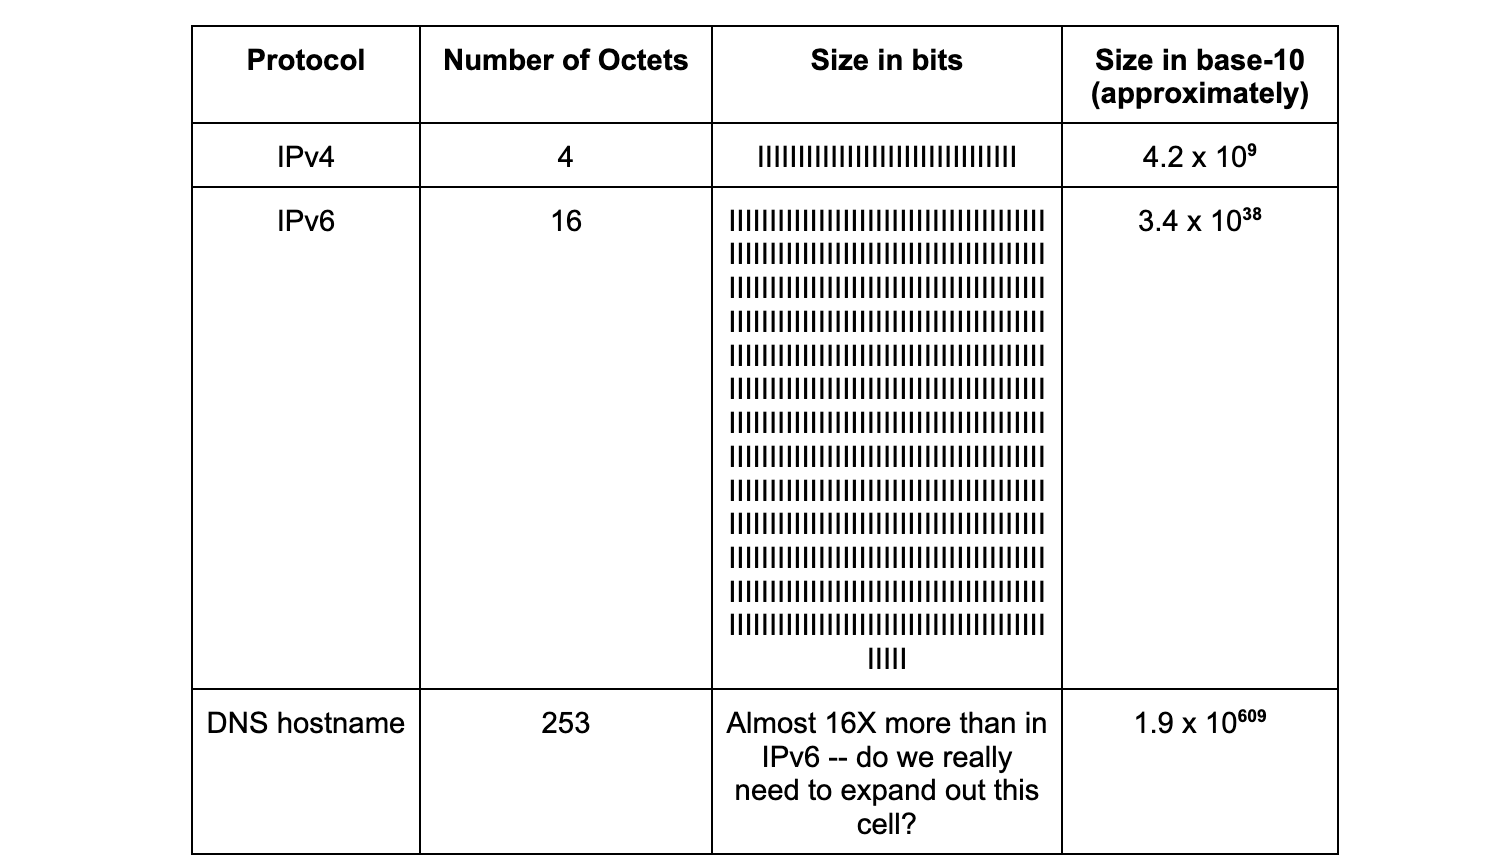
The primary driver for this technology, understandably, is the exhaustion of the IPv4 address space. IPv4’s 32-bit architecture supports only 4.3 billion unique addresses — a capacity that, while once seemingly vast, has been completely outpaced by the Internet’s explosive growth. By the early 2010s, Regional Internet Registries (RIRs) had depleted their pools of unallocated IPv4 addresses. This left ISPs unable to easily acquire new address blocks, forcing them to maximize the use of their existing allocations.

While the long-term solution is the transition to IPv6, CGNAT emerged as the immediate, practical workaround. Instead of assigning a unique public IP address to each customer, ISPs use CGNAT to place multiple subscribers behind a single, shared IP address. This practice solves the problem of IP address scarcity. Since translated addresses are not publicly routable, CGNATs have also had the positive side effect of protecting many home devices that might be vulnerable to compromise. 

CGNATs also create significant operational fallout stemming from the fact that hundreds or even thousands of clients can appear to originate from a single IP address. This means an IP-based security system may inadvertently block or throttle large groups of users as a result of a single user behind the CGNAT engaging in malicious activity.

This isn’t a new or niche issue. It has been recognized for years by the Internet Engineering Task Force (IETF), the organization that develops the core technical standards for the Internet. These standards, known as Requests for Comments (RFCs), act as the official blueprints for how the Internet should operate. RFC 6269, for example, discusses the challenges of IP address sharing, while RFC 7021 examines the impact of CGNAT on network applications. Both explain that traditional abuse-mitigation techniques, such as blocklisting or rate-limiting, assume a one-to-one relationship between IP addresses and users: when malicious activity is detected, the offending IP address can be blocked to prevent further abuse.

In shared IPv4 environments, such as those using CGNAT or other address-sharing techniques, this assumption breaks down because multiple subscribers can appear under the same public IP. Blocking the shared IP therefore penalizes many innocent users along with the abuser. In 2015 Ofcom, the UK’s telecommunications regulator, reiterated these concerns in a report on the implications of CGNAT where they noted that, “In the event that an IPv4 address is blocked or blacklisted as a source of spam, the impact on a CGNAT would be greater, potentially affecting an entire subscriber base.” 

While the hope was that CGNAT was only a temporary solution until the eventual switch to IPv6, as the old proverb says, nothing is more permanent than a temporary solution. While IPv6 deployment continues to lag, CGNAT deployments have become increasingly common, and so do the related problems. 

CGNAT detection at Cloudflare

To enable a fairer treatment of users behind CGNAT IPs by security techniques that rely on IP reputation, our goal is to identify large-scale IP sharing. This allows traffic filtering to be better calibrated and collateral damage minimized. Additionally, we want to distinguish CGNAT IPs from other large-scale sharing (LSS) IP technologies, such as VPNs and proxies, because we may need to take different approaches to different kinds of IP-sharing technologies.

To do this, we decided to take advantage of Cloudflare’s extensive view of the active IP clients, and build a supervised learning classifier that would distinguish CGNAT and VPN/proxy IPs from IPs that are allocated to a single subscriber (non-LSS IPs), based on behavioural characteristics. The figure below shows an overview of our supervised classifier: 


While our classification approach is straightforward, a significant challenge is the lack of a reliable, comprehensive, and labeled dataset of CGNAT IPs for our training dataset.

Detecting CGNAT using public data sources 

Detection begins by building an initial dataset of IPs believed to be associated with CGNAT. Cloudflare has vast HTTP and traffic logs. Unfortunately there is no signal or label in any request to indicate what is or is not a CGNAT. 

To build an extensive labelled dataset to train our ML classifier, we employ a combination of network measurement techniques, as described below. We rely on public data sources to help disambiguate an initial set of large-scale shared IP addresses from others in Cloudflare’s logs.   

Distributed Traceroutes

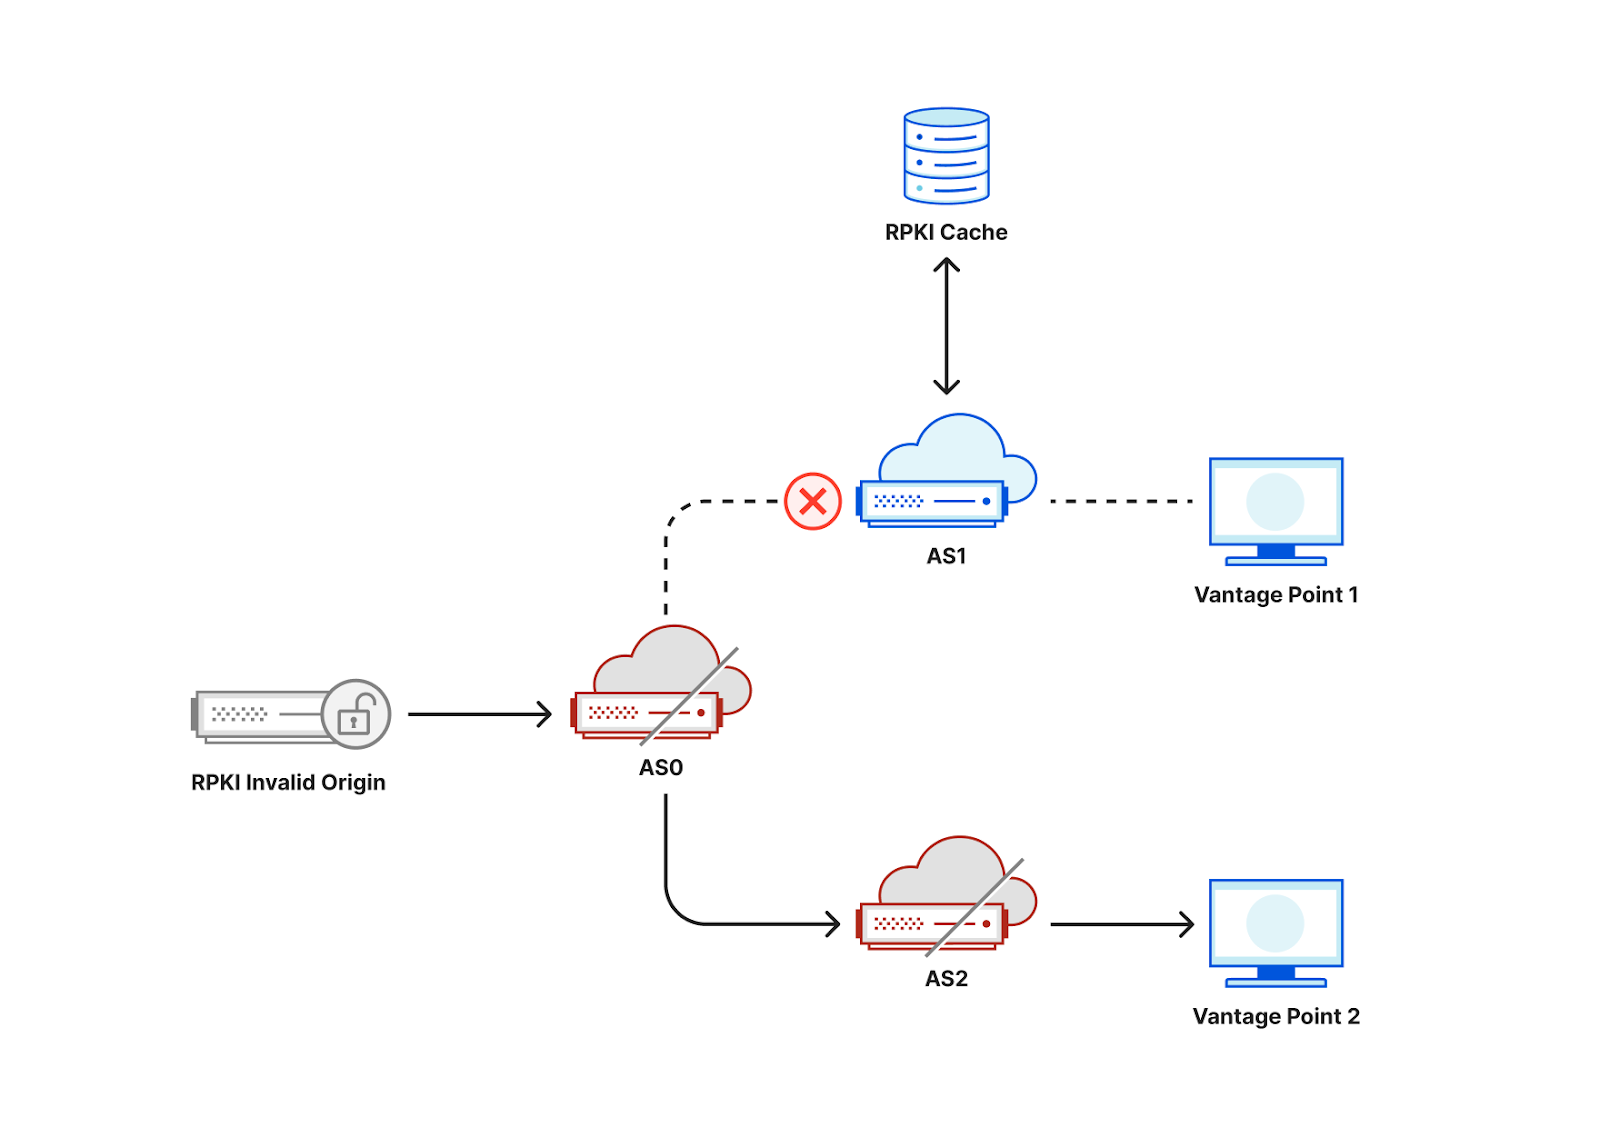
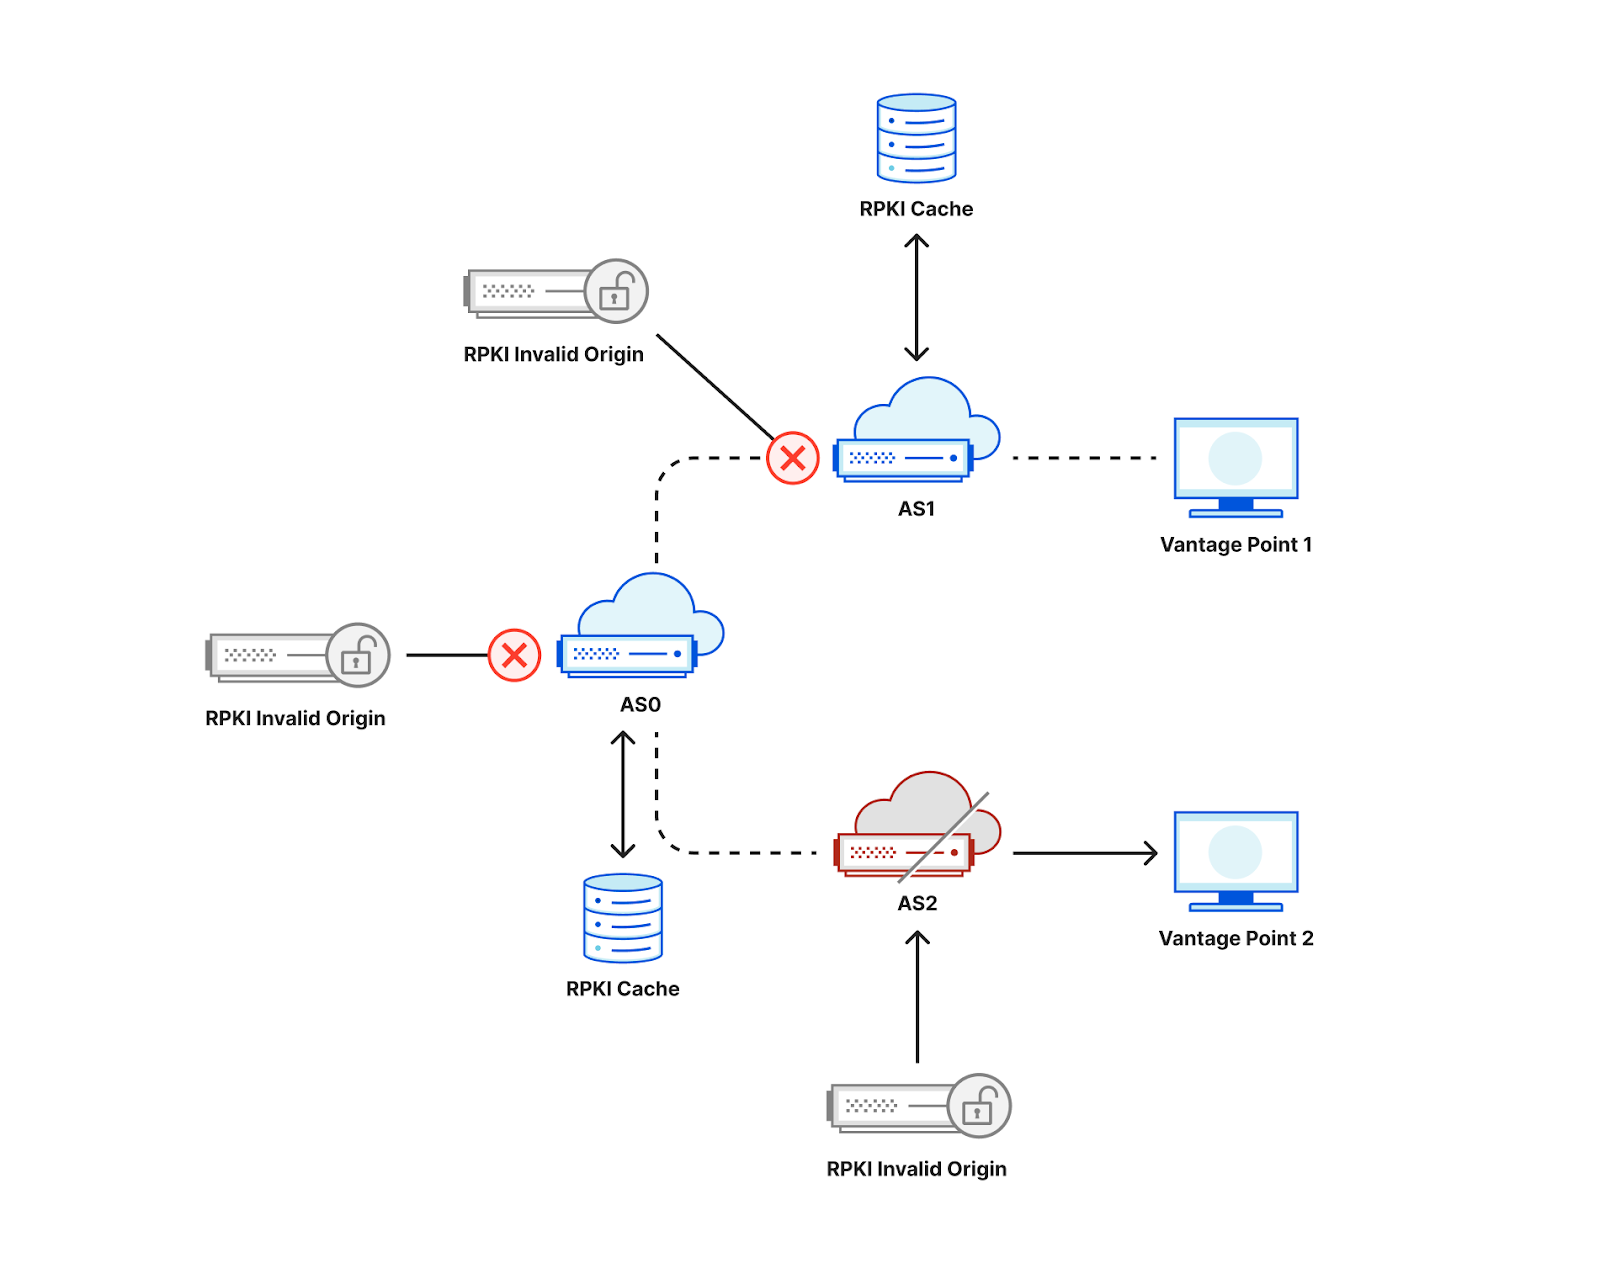
The presence of a client behind CGNAT can often be inferred through traceroute analysis. CGNAT requires ISPs to insert a NAT step that typically uses the Shared Address Space (RFC 6598) after the customer premises equipment (CPE). By running a traceroute from the client to its own public IP and examining the hop sequence, the appearance of an address within 100.64.0.0/10 between the first private hop (e.g., 192.168.1.1) and the public IP is a strong indicator of CGNAT.

Traceroute can also reveal multi-level NAT, which CGNAT requires, as shown in the diagram below. If the ISP assigns the CPE a private RFC 1918 address that appears right after the local hop, this indicates at least two NAT layers. While ISPs sometimes use private addresses internally without CGNAT, observing private or shared ranges immediately downstream combined with multiple hops before the public IP strongly suggests CGNAT or equivalent multi-layer NAT.


Although traceroute accuracy depends on router configurations, detecting private and shared IP ranges is a reliable way to identify large-scale IP sharing. We apply this method to distributed traceroutes from over 9,000 RIPE Atlas probes to classify hosts as behind CGNAT, single-layer NAT, or no NAT.

Scraping WHOIS and PTR records

Many operators encode metadata about their IPs in the corresponding reverse DNS pointer (PTR) record that can signal administrative attributes and geographic information. We first query the DNS for PTR records for the full IPv4 space and then filter for a set of known keywords from the responses that indicate a CGNAT deployment. For example, each of the following three records matches a keyword (cgnat, cgn or lsn) used to detect CGNAT address space:

node-lsn.pool-1-0.dynamic.totinternet.net
103-246-52-9.gw1-cgnat.mobile.ufone.nz
cgn.gsw2.as64098.net

WHOIS and Internet Routing Registry (IRR) records may also contain organizational names, remarks, or allocation details that reveal whether a block is used for CGNAT pools or residential assignments. 

Given that both PTR and WHOIS records may be manually maintained and therefore may be stale, we try to sanitize the extracted data by validating the fact that the corresponding ISPs indeed use CGNAT based on customer and market reports. 

Collecting VPN and proxy IPs 

Compiling a list of VPN and proxy IPs is more straightforward, as we can directly find such IPs in public service directories for anonymizers. We also subscribe to multiple VPN providers, and we collect the IPs allocated to our clients by connecting to a unique HTTP endpoint under our control. 

Modeling CGNAT with machine learning

By combining the above techniques, we accumulated a dataset of labeled IPs for more than 200K CGNAT IPs, 180K VPNs & proxies and close to 900K IPs allocated that are not LSS IPs. These were the entry points to modeling with machine learning.

Feature selection

Our hypothesis was that aggregated activity from CGNAT IPs is distinguishable from activity generated from other non-CGNAT IP addresses. Our feature extraction is an evaluation of that hypothesis — since networks do not disclose CGNAT and other uses of IPs, the quality of our inference is strictly dependent on our confidence in the training data. We claim the key discriminator is diversity, not just volume. For example, VM-hosted scanners may generate high numbers of requests, but with low information diversity. Similarly, globally routable CPEs may have individually unique characteristics, but with volumes that are less likely to be caught at lower sampling rates.

In our feature extraction, we parse a 1% sampled HTTP requests log for distinguishing features of IPs compiled in our reference set, and the same features for the corresponding /24 prefix (namely IPs with the same first 24 bits in common). We analyse the features for each of the VPNs, proxies, CGNAT, or non LSS IP. We find that features from the following broad categories are key discriminators for the different types of IPs in our training dataset:

  • Client-side signals: We analyze the aggregate properties of clients connecting from an IP. A large, diverse user base (like on a CGNAT) naturally presents a much wider statistical variety of client behaviors and connection parameters than a single-tenant server or a small business proxy.

  • Network and transport-level behaviors: We examine traffic at the network and transport layers. The way a large-scale network appliance (like a CGNAT) manages and routes connections often leaves subtle, measurable artifacts in its traffic patterns, such as in port allocation and observed network timing.

  • Traffic volume and destination diversity: We also model the volume and “shape” of the traffic. An IP representing thousands of independent users will, on average, generate a higher volume of requests and target a much wider, less correlated set of destinations than an IP representing a single user.

Crucially, to distinguish CGNAT from VPNs and proxies (which is absolutely necessary for calibrated security filtering), we had to aggregate these features at two different scopes: per-IP and per /24 prefixes. CGNAT IPs are typically allocated large blocks of IPs, whereas VPNs IPs are more scattered across different IP prefixes. 

Classification results

We compute the above features from HTTP logs over 24-hour intervals to increase data volume and reduce noise due to DHCP IP reallocation. The dataset is split into 70% training and 30% testing sets with disjoint /24 prefixes, and VPN and proxy labels are merged due to their similarity and lower operational importance compared to CGNAT detection.

Then we train a multi-class XGBoost model with class weighting to address imbalance, assigning each IP to the class with the highest predicted probability. XGBoost is well-suited for this task because it efficiently handles large feature sets, offers strong regularization to prevent overfitting, and delivers high accuracy with limited parameter tuning. The classifier achieves 0.98 accuracy, 0.97 weighted F1, and 0.04 log loss. The figure below shows the confusion matrix of the classification.


Our model is accurate for all three labels. The errors observed are mainly misclassifications of VPN/proxy IPs as CGNATs, mostly for VPN/proxy IPs that are within a /24 prefix that is also shared by broadband users outside of the proxy service. We also evaluate the prediction accuracy using k-fold cross validation, which provides a more reliable estimate of performance by training and validating on multiple data splits, reducing variance and overfitting compared to a single train–test split. We select 10 folds and we evaluate the Area Under the ROC Curve (AUC) and the multi-class logloss. We achieve a macro-average AUC of 0.9946 (σ=0.0069) and log loss of 0.0429 (σ=0.0115). Prefix-level features are the most important contributors to classification performance.

Users behind CGNAT are more likely to be rate limited

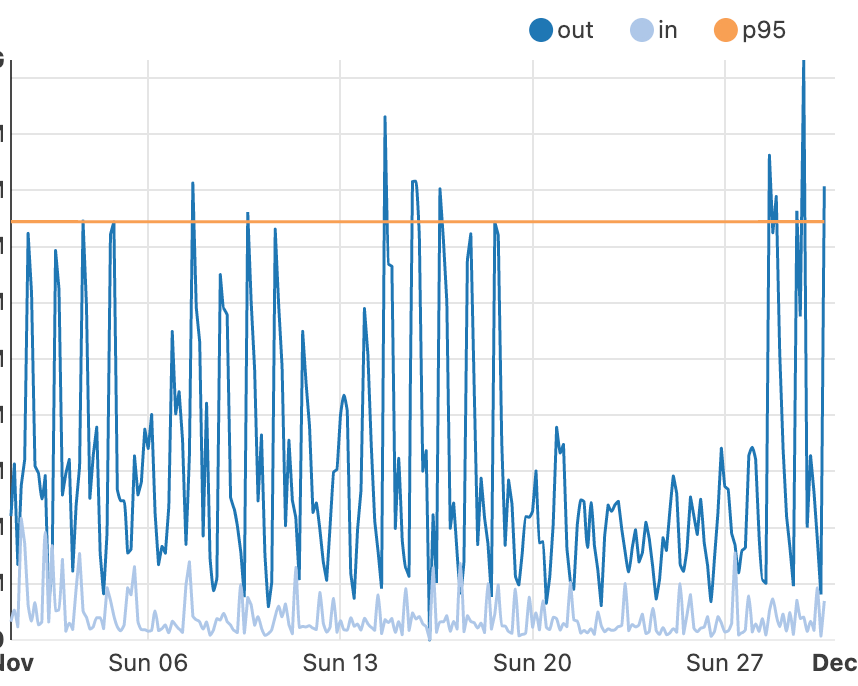
The figure below shows the daily number of CGNAT IP inferences generated by our CDN-deployed detection service between December 17, 2024 and January 9, 2025. The number of inferences remains largely stable, with noticeable dips during weekends and holidays such as Christmas and New Year’s Day. This pattern reflects expected seasonal variations, as lower traffic volumes during these periods lead to fewer active IP ranges and reduced request activity.


Next, recall that actions that rely on IP reputation or behaviour may be unduly influenced by CGNATs. One such example is bot detection. In an evaluation of our systems, we find that bot detection is resilient to those biases. However, we also learned that customers are more likely to rate limit IPs that we find are CGNATs.

We analyze bot labels by analyzing how often requests from CGNAT and non-CGNAT IPs are labeled as bots. Cloudflare assigns a bot score to each HTTP request using CatBoost models trained on various request features, and these scores are then exposed through the Web Application Firewall (WAF), allowing customers to apply filtering rules. The median bot rate is nearly identical for CGNAT (4.8%) and non-CGNAT (4.7%) IPs. However, the mean bot rate is notably lower for CGNATs (7%) than for non-CGNATs (13.1%), indicating different underlying distributions. Non-CGNAT IPs show a much wider spread, with some reaching 100% bot rates, while CGNAT IPs cluster mostly below 15%. This suggests that non-CGNAT IPs tend to be dominated by either human or bot activity, whereas CGNAT IPs reflect mixed behavior from many end users, with human traffic prevailing.

Interestingly, despite bot scores that indicate traffic is more likely to be from human users, CGNAT IPs are subject to rate limiting three times more often than non-CGNAT IPs. This is likely because multiple users share the same public IP, increasing the chances that legitimate traffic gets caught by customers’ bot mitigation and firewall rules.

This tells us that users behind CGNAT IPs are indeed susceptible to collateral effects, and identifying those IPs allows us to tune mitigation strategies to disrupt malicious traffic quickly while reducing collateral impact on benign users behind the same address.

A global view of the CGNAT ecosystem

One of the early motivations of this work was to understand if our knowledge about IP addresses might hide a bias along socio-economic boundaries—and in particular if an action on an IP address may disproportionately affect populations in developing nations, often referred to as the Global South. Identifying where different IPs exist is a necessary first step.

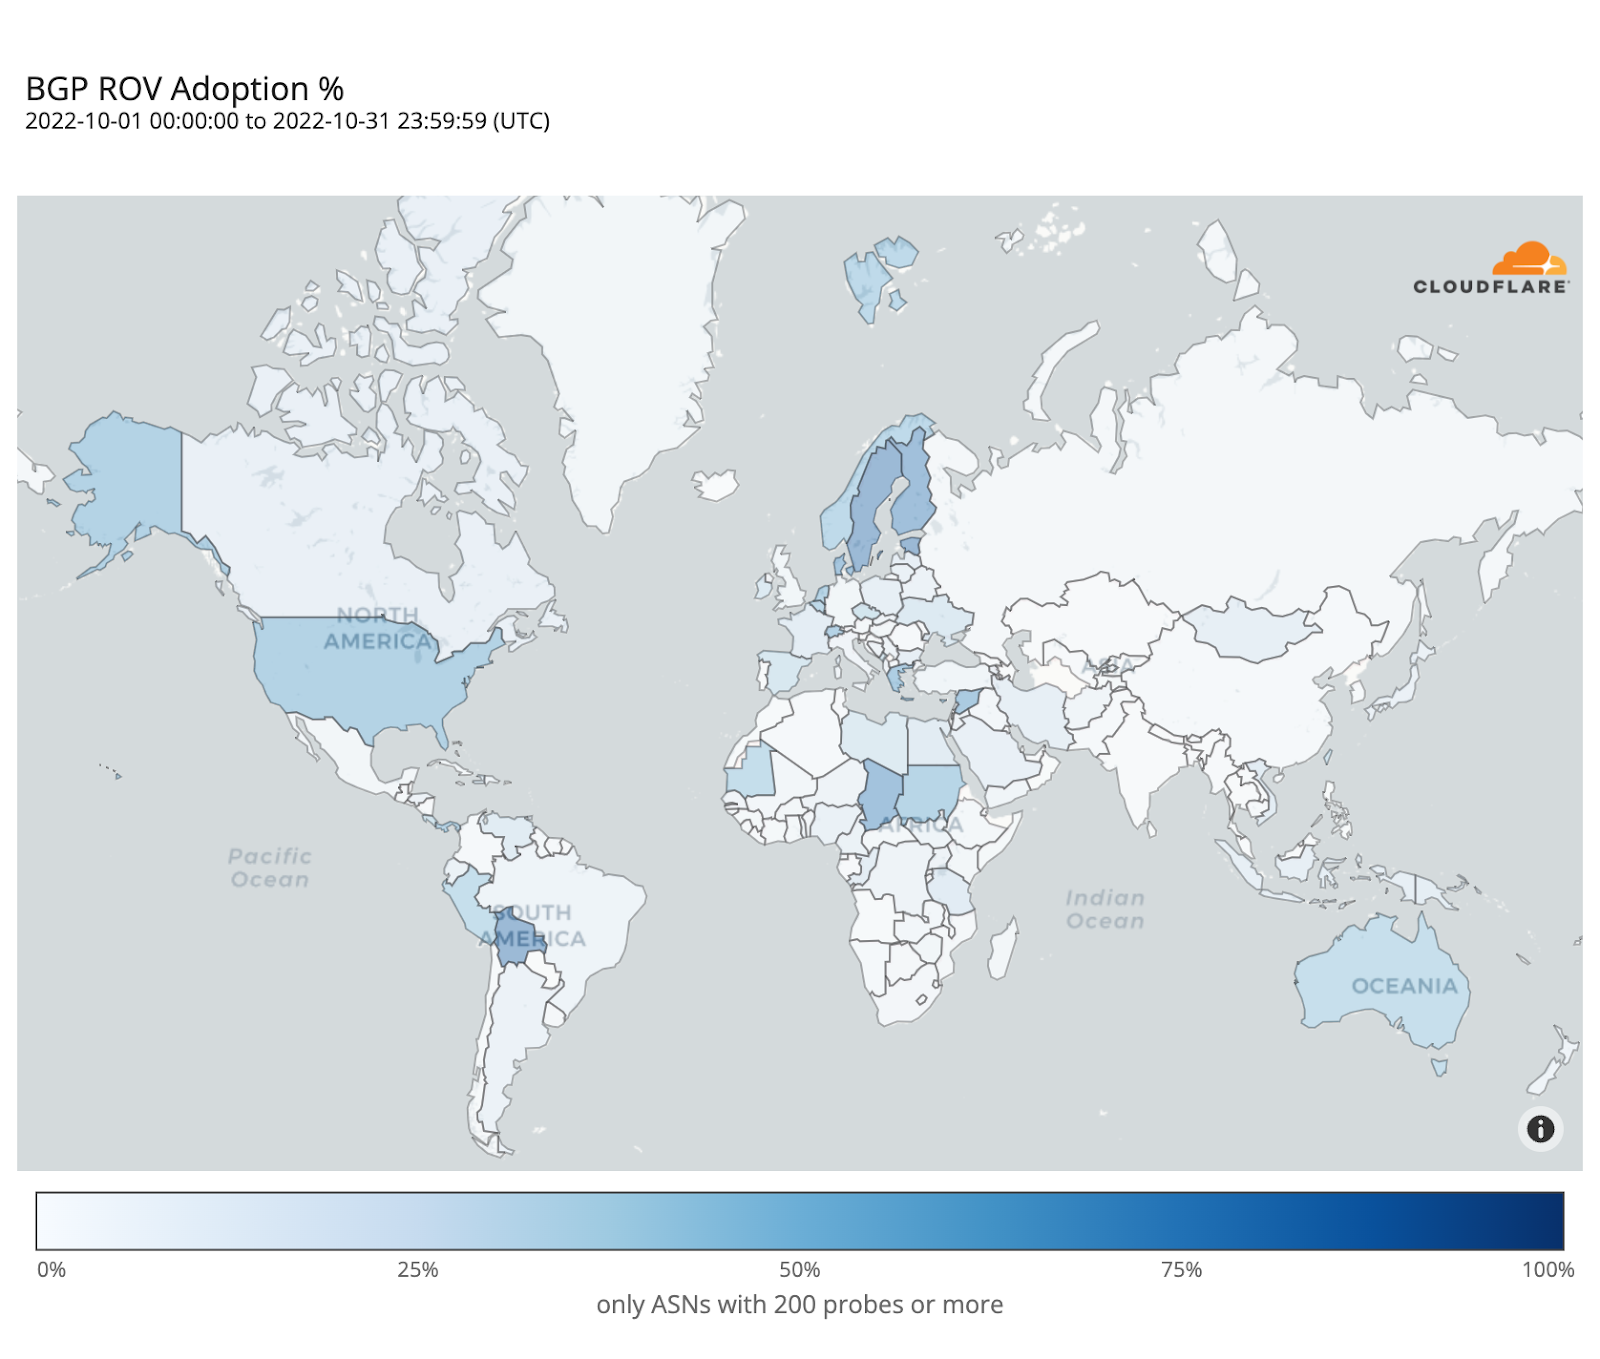
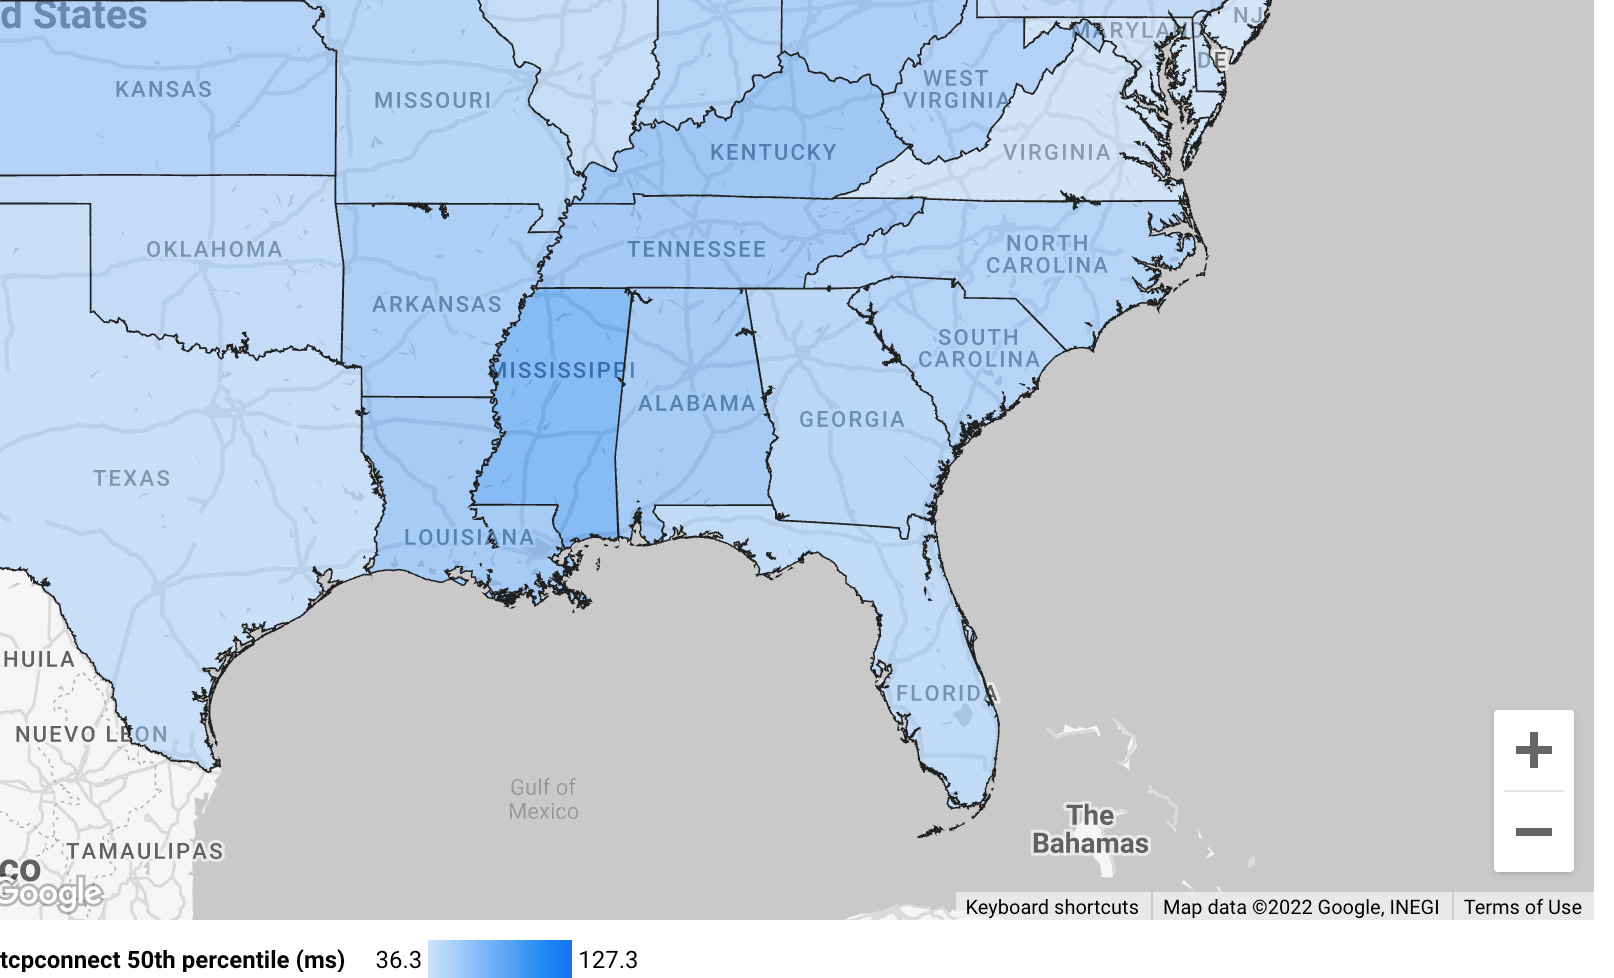
The map below shows the fraction of a country’s inferred CGNAT IPs over all IPs observed in the country. Regions with a greater reliance on CGNAT appear darker on the map. This view highlights the geodiversity of CGNATs in terms of importance; for example, much of Africa and Central and Southeast Asia rely on CGNATs. 


As further evidence of continental differences, the boxplot below shows the distribution of distinct user agents per IP across /24 prefixes inferred to be part of a CGNAT deployment in each continent. 


Notably, Africa has a much higher ratio of user agents to IP addresses than other regions, suggesting more clients share the same IP in African ASNs. So, not only do African ISPs rely more extensively on CGNAT, but the number of clients behind each CGNAT IP is higher. 

While the deployment rate of CGNAT per country is consistent with the users-per-IP ratio per country, it is not sufficient by itself to confirm deployment. The scatterplot below shows the number of users (according to APNIC user estimates) and the number of IPs per ASN for ASNs where we detect CGNAT. ASNs that have fewer available IP addresses than their user base appear below the diagonal. Interestingly the scatterplot indicates that many ASNs with more addresses than users still choose to deploy CGNAT. Presumably, these ASNs provide additional services beyond broadband, preventing them from dedicating their entire address pool to subscribers. 


What this means for everyday Internet users

Accurate detection of CGNAT IPs is crucial for minimizing collateral effects in network operations and for ensuring fair and effective application of security measures. Our findings underscore the potential socio-economic and geographical variations in the use of CGNATs, revealing significant disparities in how IP addresses are shared across different regions. 

At Cloudflare we are going beyond just using these insights to evaluate policies and practices. We are using the detection systems to improve our systems across our application security suite of features, and working with customers to understand how they might use these insights to improve the protections they configure.

Our work is ongoing and we’ll share details as we go. In the meantime, if you’re an ISP or network operator that operates CGNAT and want to help, get in touch at [email protected]. Sharing knowledge and working together helps make better and equitable user experience for subscribers, while preserving web service safety and security.

Measuring characteristics of TCP connections at Internet scale

Post Syndicated from Suleman Ahmad original https://blog.cloudflare.com/measuring-network-connections-at-scale/

Every interaction on the Internet—including loading a web page, streaming a video, or making an API call—starts with a connection. These fundamental logical connections consist of a stream of packets flowing back and forth between devices.

Various aspects of these network connections have captured the attention of researchers and practitioners for as long as the Internet has existed. The interest in connections even predates the label, as can be seen in the seminal 1991 paper, “Characteristics of wide-area TCP/IP conversations.” By any name, the Internet measurement community has been steeped in characterizations of Internet communication for decades, asking everything from “how long?” and “how big?” to “how often?” – and those are just to start.

Surprisingly, connection characteristics on the wider Internet are largely unavailable. While anyone can  use tools (e.g., Wireshark) to capture data locally, it’s virtually impossible to measure connections globally because of access and scale. Moreover, network operators generally do not share the characteristics they observe — assuming that non-trivial time and energy is taken to observe them.

In this blog post, we move in another direction by sharing aggregate insights about connections established through our global CDN. We present characteristics of TCP connections—which account for about 70% of HTTP requests to Cloudflare—providing empirical insights that are difficult to obtain from client-side measurements alone.

Why connection characteristics matter

Characterizing system behavior helps us predict the impact of changes. In the context of networks, consider a new routing algorithm or transport protocol: how can you measure its effects? One option is to deploy the change directly on live networks, but this is risky. Unexpected consequences could disrupt users or other parts of the network, making a “deploy-first” approach potentially unsafe or ethically questionable.

A safer alternative to live deployment as a first step is simulation. Using simulation, a designer can get important insights about their scheme without having to build a full version. But simulating the whole Internet is challenging, as described by another highly seminal work, “Why we don’t know how to simulate the Internet”.

To run a useful simulation, we need it to behave like the real system we’re studying. That means generating synthetic data that mimics real-world behavior. Often, we do this by using statistical distributions — mathematical descriptions of how the real data behaves. But before we can create those distributions, we first need to characterize the data — to measure and understand its key properties. Only then can our simulation produce realistic results.

Unpacking the dataset

The value of any data depends on its collection mechanism. Every dataset has blind spots, biases, and limitations, and ignoring these can lead to misleading conclusions. By examining the finer details — how the data was gathered, what it represents, and what it excludes — we can better understand its reliability and make informed decisions about how to use it. Let’s take a closer look at our collected telemetry.


Dataset Overview. The data describes TCP connections, labeled Visitor to Cloudflare in the above diagram, which serve requests via HTTP 1.0, 1.1, and 2.0 that make up about 70% of all 84 million HTTP requests per second, on average, received at our global CDN servers.

Sampling. The passively collected snapshot of data is drawn from a uniformly sampled 1% of all TCP connections to Cloudflare between October 7 and October 15, 2025. Sampling takes place at each individual client-facing server to mitigate biases that may appear by sampling at the datacenter level.

Diversity. Unlike many large operators, whose traffic is primarily their own and dominated by a few services such as search, social media, or streaming video, the vast majority of Cloudflare’s workload comes from our customers, who choose to put Cloudflare in front of their websites to help protect, improve performance, and reduce costs. This diversity of customers brings a wide variety of web applications, services, and users from around the world. As a result, the connections we observe are shaped by a broad range of client devices and application-specific behaviors that are constantly evolving.

What we log. Each entry in the log consists of socket-level metadata captured via the Linux kernel’s TCP_INFO struct, alongside the SNI and the number of requests made during the connection. The logs exclude individual HTTP requests, transactions, and details. We restrict our use of the logs to connection metadata statistics such as duration and number of packets transmitted, as well as the number of HTTP requests processed.

Data capture. We have elected to represent ‘useful’ connections in our dataset that have been fully processed, by characterizing only those connections that close gracefully with a FIN packet. This excludes connections intercepted by attack mitigations, or that timeout, or that abort because of a RST packet.

Since a graceful close does not in itself indicate a ‘useful’ connection, we additionally require at least one successful HTTP request during the connection to filter out idle or non-HTTP connections from this analysis — interestingly, these make up 11% of all TCP connections to Cloudflare that close with a FIN packet.

If you’re curious, we’ve also previously blogged about the details of Cloudflare’s overall logging mechanism and post-processing pipeline.  

Visualizing connection characteristics

Although networks are inherently dynamic and trends can change over time, the large-scale patterns we observe across our global infrastructure remain remarkably consistent over time. While our data offers a global view of connection characteristics, distributions can still vary according to regional traffic patterns.

In our visualizations we represent characteristics with cumulative distribution function (CDF) graphs, specifically their empirical equivalents. CDFs are particularly useful for gaining a macroscopic view of the distribution. They give a clear picture of both common and extreme cases in a single view. We use them in the illustrations below to make sense of large-scale patterns. To better interpret the distributions, we also employ log-scaled axes to account for the presence of extreme values common to networking data.

A long-standing question about Internet connections relates to “Elephants and Mice”; practitioners and researchers are entirely aware that most flows are small and some are huge, yet little data exists to inform the lines that divide them. This is where our presentation begins.

Packet Counts

Let’s start by taking a look at the distribution of the number of response packets sent in connections by Cloudflare servers back to the clients.


On the graph, the x-axis represents the number of response packets sent in log-scale, while the y-axis shows the cumulative fraction of connections below each packet count. The average response consists of roughly 240 packets, but the distribution is highly skewed. The median is 12 packets, which indicates that 50% of Internet connections consist of very few packets. Extending further to the 90th percentile, connections carry only 107 packets.

This stark contrast highlights the heavy-tailed nature of Internet traffic: while a few connections transport massive amounts of data—like video streams or large file transfers—most interactions are tiny, delivering small web objects, microservice traffic, or API responses.


The above plot breaks down the packet count distribution by HTTP protocol version. For HTTP/1.X (both HTTP 1.0 and 1.1 combined) connections, the median response consists of just 10 packets, and 90% of connections carry fewer than 63 response packets. In contrast, HTTP/2 connections show larger responses, with a median of 16 packets and a 90th percentile of 170 packets. This difference likely reflects how HTTP/2 multiplexes multiple streams over a single connection, often consolidating more requests and responses into fewer connections, which increases the total number of packets exchanged per connection. HTTP/2 connections also have additional control-plane frames and flow-control messages that increase response packet counts.

Despite these differences, the combined view displays the same heavy-tailed pattern: a small fraction of connections carry enormous volumes of data (elephant flows), extending to millions of packets, while most remain lightweight (mice flows).

So far, we’ve focused on the total number of packets sent from our servers to clients, but another important dimension of connection behavior is the balance between packets sent and received, illustrated below.


The x-axis shows the ratio of packets sent by our servers to packets received from clients, visualized as a CDF. Across all connections, the median ratio is 0.91, meaning that in half of connections, clients send slightly more packets than the server responds with. This excess of client-side packets primarily reflects TLS handshake initiation (ClientHello), HTTP control request headers, and data acknowledgements (ACKs), causing the client to typically transmit more packets than the server returns with the content payload — particularly for low-volume connections that dominate the distribution.

The mean ratio is higher, at 1.28, due to a long tail of client-heavy connections, such as large downloads typical of CDN workloads. Most connections fall within a relatively narrow range: 10% of connections have a ratio below 0.67, and 90% are below 1.85. However, the long-tailed behavior highlights the diversity of Internet traffic: extreme values arise from both upload-heavy and download-heavy connections. The variance of 3.71 reflects these asymmetric flows, while the bulk of connections maintain a roughly balanced upload-to-download exchange.

Bytes sent

Another dimension to look at the data is using bytes sent by our servers to clients, which captures the actual volume of data delivered over each connection. This metric is derived from tcpi_bytes_sent, also covering (re)transmitted segment payloads while excluding the TCP header, as defined in linux/tcp.h and aligned with RFC 4898 (TCP Extended Statistics MIB).


The plots above break down bytes sent by HTTP protocol version. The x-axis represents the total bytes sent by our servers over each connection. The patterns are generally consistent with what we observed in the packet count distributions.

For HTTP/1.X, the median response delivers 4.8 KB, and 90% of connections send fewer than 51 KB. In contrast, HTTP/2 connections show slightly larger responses, with a median of 6 KB and a 90th percentile of 146 KB. The mean is much higher—224 KB for HTTP/1.x and 390 KB for HTTP/2—reflecting a small number of very large transfers. These long-tailed extreme flows can reach tens of gigabytes per connection, while some very lightweight connections carry minimal payloads: the minimum for HTTP/1.X is 115 bytes and for HTTP/2 it is 202 bytes.


By making use of the tcpi_bytes_received metric, we can now look at the ratio of bytes sent to bytes received per connection to better understand the balance of data exchange. This ratio captures how asymmetric each connection is — essentially, how much data our servers send compared to what they receive from clients. Across all connections, the median ratio is 3.78, meaning that in half of all cases, servers send nearly four times more data than they receive. The average is far higher at 81.06, showing a strong long tail driven by download-heavy flows. Again we see the heavy long-tailed distribution, a small fraction of extreme cases push the ratio into the millions, with more extreme values of data transfers towards clients.

Connection duration

While packet and byte counts capture how much data is exchanged, connection duration provides insight into how that exchange unfolds over time.


The CDF above shows the distribution of connection durations (lifetimes) in seconds. A reminder that the x-axis is log-scale. Across all connections, the median duration is just 4.7 seconds, meaning half of connections complete in under five seconds. The mean is much higher at 96 seconds, reflecting a small number of long-lived connections that skew the average. Most connections fall within a window of 0.1 seconds (10th percentile) to 300 seconds (90th percentile). We also observe some extremely long-lived connections lasting multiple days, possibly maintained via keep-alives for connection reuse without hitting our default idle timeout limits. These long-lived connections typically represent persistent sessions or multimedia traffic, while the majority of web traffic remains short, bursty, and transient.

Request counts

A single connection can carry multiple HTTP requests for web traffic. This reveals patterns about connection multiplexing.


The above shows the number of HTTP requests (in log-scale) that we see on a single connection, broken down by HTTP protocol version. Right away, we can see that for both HTTP/1.X (mean 3 requests) and HTTP/2 (mean 8 requests) connections, the median number of requests is just 1, reinforcing the prevalence of limited connection reuse. However, because HTTP/2 supports multiplexing multiple streams over a single connection, the 90th percentile rises to 10 requests, with occasional extreme cases carrying thousands of requests, which can be amplified due to connection coalescing. In contrast, HTTP/1.X connections have much lower request counts. This aligns with protocol design: HTTP/1.0 followed a “one request per connection” philosophy, while HTTP/1.1 introduced persistent connections — even combining both versions, it’s rare to see HTTP/1.X connections carrying more than two requests at the 90th percentile.

The prevalence of short-lived connections can be partly explained by automated clients or scripts that tend to open new connections rather than maintaining long-lived sessions. To explore this intuition, we split the data between traffic originating from data centers (likely automated) and typical user traffic (user-driven), using client ASNs as a proxy.


The plot above shows that non-DC (user-driven) traffic has slightly higher request counts per connection, consistent with browsers or apps fetching multiple resources over a single persistent connection, with a mean of 5 requests and a 90th percentile of 5 requests per connection. In contrast, DC-originated traffic has a mean of roughly 3 requests and a 90th percentile of 2, validating our expectation. Despite these differences, the median number of requests remains 1 for both groups highlighting that, regardless of origin of connections, most are genuinely brief.

Inferring path characteristics from connection-level data

Connection-level measurements can also provide insights into underlying path characteristics. Let’s examine this in more detail.

Path MTU

The maximum transmission unit (MTU) along the network path is often referred to as the Path MTU (PMTU). PMTU determines the largest packet size that can traverse a connection without fragmentation or packet drop, affecting throughput, efficiency, and latency. The Linux TCP stack on our servers tracks the largest segment size that can be sent without fragmentation along the path for a connection, as part of Path MTU discovery.

From that data we saw that the median (and the 90th percentile!) PMTU was 1500 bytes, which aligns with the typical Ethernet MTU and is considered standard for most Internet paths. Interestingly, the 10th percentile sits at 1,420 bytes, reflecting cases where paths include network links with slightly smaller MTUs—common in some VPNs, IPv6tov4 tunnels, or older networking equipment that impose stricter limits to avoid fragmentation. At the extreme, we have seen MTU as small as 552 bytes for IPv4 connections which relates to the minimum allowed PMTU value by the Linux kernel.

Initial congestion window

A key parameter in transport protocols is the congestion window (CWND), which is the number of packets that can be transmitted without waiting for an acknowledgement from the receiver. We call these packets or bytes “in-flight.” During a connection, the congestion window evolves dynamically throughout a connection.

However, the initial congestion window (ICWND) at the start of a data transfer can have an outsized impact, especially for short-lived connections, which dominate Internet traffic as we’ve seen above. If the ICWND is set too low, small and medium transfers take additional round-trip times to reach bottleneck bandwidth, slowing delivery. Conversely, if it’s too high, the sender risks overwhelming the network, causing unnecessary packet loss and retransmissions — potentially for all connections that share the bottleneck link.

A reasonable estimate of the ICWND can be taken as the congestion window size at the instant the TCP sender transitions out of slow start. This transition marks the point at which the sender shifts from exponential growth to congestion-avoidance, having inferred that further growth may risk congestion. The figure below shows the distribution of congestion window sizes at the moment slow start exits — as calculated by BBR. The median is roughly 464 KB, which corresponds to about 310 packets per connection with a typical 1,500-byte MTU, while extreme flows carry tens of megabytes in flight. This variance reflects the diversity of TCP connections and the dynamically evolving nature of the networks carrying traffic.


It’s important to emphasize that these values reflect a mix of network paths, including not only paths between Cloudflare and end users, but also between Cloudflare and neighboring datacenters, which are typically well provisioned and offer higher bandwidth.

Our initial inspection of the above distribution left us doubtful, because the values seem very high. We then realized the numbers are an artifact of behaviour specific to BBR, in which it sets the congestion window higher than its estimate of the path’s available capacity, bandwidth delay product (BDP). The inflated value is by design. To prove the hypothesis, we re-plot the distribution from above in the figure below alongside BBR’s estimate of BDP. The difference is clear between BBR’s congestion window of unacknowledged packets and its BDP estimate.


The above plot adds the computed BDP values in context with connection telemetry. The median BDP comes out to be roughly 77 KB, which is roughly 50 packets. If we compare this to the congestion window distribution taken from above, we see BDP estimations from recently closed connections are much more stable.

We are using these insights to help identify reasonable initial congestion window sizes and the circumstances for them. Our own experiments internally make clear that ICWND sizes can affect performance by as much as 30-40% for smaller connections. Such insights will potentially help to revisit efforts to find better initial congestion window values, which has been a default of 10 packets for more than a decade.

Deeper understanding, better performance

We observed that Internet connections are highly heterogeneous, confirming decades-long observations of strong heavy-tail characteristics consistent with “elephants and mice” phenomenon. Ratios of upload to download bytes are unsurprising for larger flows, but surprisingly small for short flows, highlighting the asymmetric nature of Internet traffic. Understanding these connection characteristics continues to inform ways to improve connection performance, reliability, and user experience.

We will continue to build on this work, and plan to publish connection-level statistics on Cloudflare Radar so that others can similarly benefit.

Our work on improving our network is ongoing, and we welcome researchers, academics, interns, and anyone interested in this space to reach out at [email protected]. By sharing knowledge and working together, we all can continue to make the Internet faster, safer, and more reliable for everyone.

A framework for measuring Internet resilience

Post Syndicated from Vasilis Giotsas original https://blog.cloudflare.com/a-framework-for-measuring-internet-resilience/

On July 8, 2022, a massive outage at Rogers, one of Canada’s largest telecom providers, knocked out Internet and mobile services for over 12 million users. Why did this single event have such a catastrophic impact? And more importantly, why do some networks crumble in the face of disruption while others barely stumble?

The answer lies in a concept we call Internet resilience: a network’s ability not just to stay online, but to withstand, adapt to, and rapidly recover from failures.

It’s a quality that goes far beyond simple “uptime.” True resilience is a multi-layered capability, built on everything from the diversity of physical subsea cables to the security of BGP routing and the health of a competitive market. It’s an emergent property much like psychological resilience: while each individual network must be robust, true resilience only arises from the collective, interoperable actions of the entire ecosystem. In this post, we’ll introduce a data-driven framework to move beyond abstract definitions and start quantifying what makes a network resilient. All of our work is based on public data sources, and we’re sharing our metrics to help the entire community build a more reliable and secure Internet for everyone.

What is Internet resilience?

In networking, we often talk about “reliability” (does it work under normal conditions?) and “robustness” (can it handle a sudden traffic surge?). But resilience is more dynamic. It’s the ability to gracefully degrade, adapt, and most importantly, recover. For our work, we’ve adopted a pragmatic definition:

Internet resilience is the measurable capability of a national or regional network ecosystem to maintain diverse and secure routing paths in the face of challenges, and to rapidly restore connectivity following a disruption.

This definition links the abstract goal of resilience to the concrete, measurable metrics that form the basis of our analysis.

Local decisions have global impact

The Internet is a global system but is built out of thousands of local pieces. Every country depends on the global Internet for economic activity, communication, and critical services, yet most of the decisions that shape how traffic flows are made locally by individual networks.

In most national infrastructures like water or power grids, a central authority can plan, monitor, and coordinate how the system behaves. The Internet works very differently. Its core building blocks are Autonomous Systems (ASes), which are networks like ISPs, universities, cloud providers or enterprises. Each AS controls autonomously how it connects to the rest of the Internet, which routes it accepts or rejects, how it prefers to forward traffic, and with whom it interconnects. That’s why they’re called Autonomous Systems in the first place! There’s no global controller. Instead, the Internet’s routing fabric emerges from the collective interaction of thousands of independent networks, each optimizing for its own goals.

This decentralized structure is one of the Internet’s greatest strengths: no single failure can bring the whole system down. But it also makes measuring resilience at a country level tricky. National statistics can hide local structures that are crucial to global connectivity. For example, a country might appear to have many international connections overall, but those connections could be concentrated in just a handful of networks. If one of those fails, the whole country could be affected.

For resilience, the goal isn’t to isolate national infrastructure from the global Internet. In fact, the opposite is true: healthy integration with diverse partners is what makes both local and global connectivity stronger. When local networks invest in secure, redundant, and diverse interconnections, they improve their own resilience and contribute to the stability of the Internet as a whole.

This perspective shapes how we design and interpret resilience metrics. Rather than treating countries as isolated units, we look at how well their networks are woven into the global fabric: the number and diversity of upstream providers, the extent of international peering, and the richness of local interconnections. These are the building blocks of a resilient Internet.

Route hygiene: Keeping the Internet healthy

The Internet is constructed according to a layered model, by design, so that different Internet components and features can evolve independent of the others. The Physical layer stores, carries, and forwards, all the bits and bytes transmitted in packets between devices. It consists of cables, routers and switches, but also buildings that house interconnection facilities. The Application layer sits above all others and has virtually no information about the network so that applications can communicate without having to worry about the underlying details, for example, if a network is ethernet or Wi-Fi. The application layer includes web browsers, web servers, as well as caching, security, and other features provided by Content Distribution Networks (CDNs). Between the physical and application layers is the Network layer responsible for Internet routing. It is ‘logical’, consisting of software that learns about interconnection and routes, and makes (local) forwarding decisions that deliver packets to their destinations. 

Good route hygiene works like personal hygiene: it prevents problems before they spread. The Internet relies on the Border Gateway Protocol (BGP) to exchange routes between networks, but BGP wasn’t built with security in mind. A single bad route announcement, whether by mistake or attack, can send traffic the wrong way or cause widespread outages.

Two practices help stop this: The RPKI (Resource Public Key Infrastructure) lets networks publish cryptographic proof that they’re allowed to announce specific IP prefixes. ROV (Route Origin Validation) checks those proofs before accepting routes.

Together, they act like passports and border checks for Internet routes, helping filter out hijacks and leaks early.

Hygiene doesn’t just happen in the routing table – it spans multiple layers of the Internet’s architecture, and weaknesses in one layer can ripple through the rest. At the physical layer, having multiple, geographically diverse cable routes ensures that a single cut or disaster doesn’t isolate an entire region. For example, distributing submarine landing stations along different coastlines can protect international connectivity when one corridor fails. At the network layer, practices like multi-homing and participation in Internet Exchange Points (IXPs) give operators more options to reroute traffic during incidents, reducing reliance on any single upstream provider. At the application layer, Content Delivery Networks (CDNs) and caching keep popular content close to users, so even if upstream routes are disrupted, many services remain accessible. Finally, policy and market structure also play a role: open peering policies and competitive markets foster diversity, while dependence on a single ISP or cable system creates fragility.

Resilience emerges when these layers work together. If one layer is weak, the whole system becomes more vulnerable to disruption.

The more networks adopt these practices, the stronger and more resilient the Internet becomes. We actively support the deployment of RPKI, ROV, and diverse routing to keep the global Internet healthy.

Measuring resilience is harder than it sounds

The biggest hurdle in measuring resilience is data access. The most valuable information, like internal network topologies, the physical paths of fiber cables, or specific peering agreements, is held by private network operators. This is the ground truth of the network.

However, operators view this information as a highly sensitive competitive asset. Revealing detailed network maps could expose strategic vulnerabilities or undermine business negotiations. Without access to this ground truth data, we’re forced to rely on inference, approximation, and the clever use of publicly available data sources. Our framework is built entirely on these public sources to ensure anyone can reproduce and build upon our findings.

Projects like RouteViews and RIPE RIS collect BGP routing data that shows how networks connect. Traceroute measurements reveal paths at the router level. IXP and submarine cable maps give partial views of the physical layer. But each of these sources has blind spots: peering links often don’t appear in BGP data, backup paths may remain hidden, and physical routes are hard to map precisely. This lack of a single, complete dataset means that resilience measurement relies on combining many partial perspectives, a bit like reconstructing a city map from scattered satellite images, traffic reports, and public utility filings. It’s challenging, but it’s also what makes this field so interesting.

Translating resilience into quantifiable metrics

Once we understand why resilience matters and what makes it hard to measure, the next step is to translate these ideas into concrete metrics. These metrics give us a way to evaluate how well different parts of the Internet can withstand disruptions and to identify where the weak points are. No single metric can capture Internet resilience on its own. Instead, we look at it from multiple angles: physical infrastructure, network topology, interconnection patterns, and routing behavior. Below are some of the key dimensions we use. Some of these metrics are inspired from existing research, like the ISOC Pulse framework. All described methods rely on public data sources and are fully reproducible. As a result, in our visualizations we intentionally omit country and region names to maintain focus on the methodology and interpretation of the results. 

IXPs and colocation facilities

Networks primarily interconnect in two types of physical facilities: colocation facilities (colos), and Internet Exchange Points (IXPs) often housed within the colos. Although symbiotically linked, they serve distinct functions in a nation’s digital ecosystem. A colocation facility provides the foundational infrastructure —- secure space, power, and cooling – for network operators to place their equipment. The IXP builds upon this physical base to provide the logical interconnection fabric, a role that is transformative for a region’s Internet development and resilience. The networks that connect at these facilities are its members. 

Metrics that reflect resilience include:

  • Number and distribution of IXPs, normalized by population or geography. A higher IXP count, weighted by population or geographic coverage, is associated with improved local connectivity.

  • Peering participation rates — the percentage of local networks connected to domestic IXPs. This metric reflects the extent to which local networks rely on regional interconnection rather than routing traffic through distant upstream providers.

  • Diversity of IXP membership, including ISPs, CDNs, and cloud providers, which indicates how much critical content is available locally, making it accessible to domestic users even if international connectivity is severely degraded.

Resilience also depends on how well local networks connect globally:

  • How many local networks peer at international IXPs, increasing their routing options

  • How many international networks peer at local IXPs, bringing content closer to users

A balanced flow in both directions strengthens resilience by ensuring multiple independent paths in and out of a region.

The geographic distribution of IXPs further enhances resilience. A resilient IXP ecosystem should be geographically dispersed to serve different regions within a country effectively, reducing the risk of a localized infrastructure failure from affecting the connectivity of an entire country. Spatial distribution metrics help evaluate how infrastructure is spread across a country’s geography or its population. Key spatial metrics include:

  • Infrastructure per Capita: This metric – inspired by teledensity  – measures infrastructure relative to population size of a sub-region, providing a per-person availability indicator. A low IXP-per-population ratio in a region suggests that users there rely on distant exchanges, increasing the bit-risk miles.

  • Infrastructure per Area (Density): This metric evaluates how infrastructure is distributed per unit of geographic area, highlighting spatial coverage. Such area-based metrics are crucial for critical infrastructures to ensure remote areas are not left inaccessible.

These metrics can be summarized using the Location Quotient (LQ). The location quotient is a widely used geographic index that measures a region’s share of infrastructure relative to its share of a baseline (such as population or area).


For example, the figure above represents US states where a region hosts more or less infrastructure that is expected for its population, based on its LQ score. This statistic illustrates how even for the states with the highest number of facilities this number is still lower than would be expected given the population size of those states.

Economic-weighted metrics

While spatial metrics capture the physical distribution of infrastructure, economic and usage-weighted metrics reveal how infrastructure is actually used. These account for traffic, capacity, or economic activity, exposing imbalances that spatial counts miss. Infrastructure Utilization Concentration measures how usage is distributed across facilities, using indices like the Herfindahl–Hirschman Index (HHI). HHI sums the squared market shares of entities, ranging from 0 (competitive) to 10,000 (highly concentrated). For IXPs, market share is defined through operational metrics such as:

  • Peak/Average Traffic Volume (Gbps/Tbps): indicates operational significance

  • Number of Connected ASNs: reflects network reach

  • Total Port Capacity: shows physical scale

The chosen metric affects results. For example, using connected ASNs yields an HHI of 1,316 (unconcentrated) for a Central European country, whereas using port capacity gives 1,809 (moderately concentrated).

The Gini coefficient measures inequality in resource or traffic distribution (0 = equal, 1 = fully concentrated). The Lorenz curve visualizes this: a straight 45° line indicates perfect equality, while deviations show concentration.


The chart on the left suggests substantial geographical inequality in colocation facility distribution across the US states. However, the population-weighted analysis in the chart on the right demonstrates that much of that geographic concentration can be explained by population distribution.

Submarine cables

Internet resilience, in the context of undersea cables, is defined by the global network’s capacity to withstand physical infrastructure damage and to recover swiftly from faults, thereby ensuring the continuity of intercontinental data flow. The metrics for quantifying this resilience are multifaceted, encompassing the frequency and nature of faults, the efficiency of repair operations, and the inherent robustness of both the network’s topology and its dedicated maintenance resources. Such metrics include:

  • Number of landing stations, cable corridors, and operators. The goal is to ensure that national connectivity should withstand single failure events, be they natural disaster, targeted attack, or major power outage. A lack of diversity creates single points of failure, as highlighted by incidents in Tonga where damage to the only available cable led to a total outage.

  • Fault rates and mean time to repair (MTTR), which indicate how quickly service can be restored. These metrics measure a country’s ability to prevent, detect, and recover from cable incidents, focusing on downtime reduction and protection of critical assets. Repair times hinge on vessel mobilization and government permits, the latter often the main bottleneck.

  • Availability of satellite backup capacity as an emergency fallback. While cable diversity is essential, resilience planning must also cover worst-case outages. The Non-Terrestrial Backup System Readiness metric measures a nation’s ability to sustain essential connectivity during major cable disruptions. LEO and MEO satellites, though costlier and lower capacity than cables, offer proven emergency backup during conflicts or disasters. Projects like HEIST explore hybrid space-submarine architectures to boost resilience. Key indicators include available satellite bandwidth, the number of NGSO providers under contract (for diversity), and the deployment of satellite terminals for public and critical infrastructure. Tracking these shows how well a nation can maintain command, relief operations, and basic connectivity if cables fail.

Inter-domain routing

The network layer above the physical interconnection infrastructure governs how traffic is routed across the Autonomous Systems (ASes). Failures or instability at this layer – such as misconfigurations, attacks, or control-plane outages – can disrupt connectivity even when the underlying physical infrastructure remains intact. In this layer, we look at resilience metrics that characterize the robustness and fault tolerance of AS-level routing and BGP behavior.

AS Path Diversity measures the number and independence of AS-level routes between two points. High diversity provides alternative paths during failures, enabling BGP rerouting and maintaining connectivity. Low diversity leaves networks vulnerable to outages if a critical AS or link fails. Resilience depends on upstream topology.

  • Single-homed ASes rely on one provider, which is cheaper and simpler but more fragile.

  • Multi-homed ASes use multiple upstreams, requiring BGP but offering far greater redundancy and performance at higher cost.

The share of multi-homed ASes reflects an ecosystem’s overall resilience: higher rates signal greater protection from single-provider failures. This metric is easy to measure using public BGP data (e.g., RouteViews, RIPE RIS, CAIDA). Longitudinal BGP monitoring helps reveal hidden backup links that snapshots might miss.

Beyond multi-homing rates, the distribution of single-homed ASes per transit provider highlights systemic weak points. For each provider, counting customer ASes that rely exclusively on it reveals how many networks would be cut off if that provider fails.


The figure above shows Canadian transit providers for July 2025: the x-axis is total customer ASes, the y-axis is single-homed customers. Canada’s overall single-homing rate is 30%, with some providers serving many single-homed ASes, mirroring vulnerabilities seen during the 2022 Rogers outage, which disrupted over 12 million users.

While multi-homing metrics provide a valuable, static view of an ecosystem’s upstream topology, a more dynamic and nuanced understanding of resilience can be achieved by analyzing the characteristics of the actual BGP paths observed from global vantage points. These path-centric metrics move beyond simply counting connections to assess the diversity and independence of the routes to and from a country’s networks. These metrics include:

  • Path independence measures whether those alternative routes truly avoid shared bottlenecks. Multi-homing only helps if upstream paths are truly distinct. If two providers share upstream transit ASes, redundancy is weak. Independence can be measured with the Jaccard distance between AS paths. A stricter path disjointness score calculates the share of path pairs with no common ASes, directly quantifying true redundancy.

  • Transit entropy measures how evenly traffic is distributed across transit providers. High Shannon entropy signals a decentralized, resilient ecosystem; low entropy shows dependence on few providers, even if nominal path diversity is high.

  • International connectivity ratios evaluate the share of domestic ASes with direct international links. High percentages reflect a mature, distributed ecosystem; low values indicate reliance on a few gateways.

The figure below encapsulates the aforementioned AS-level resilience metrics into single polar pie charts. For the purpose of exposition we plot the metrics for infrastructure from two different nations with very different resilience profiles.


To pinpoint critical ASes and potential single points of failure, graph centrality metrics can provide useful insights. Betweenness Centrality (BC) identifies nodes lying on many shortest paths, but applying it to BGP data suffers from vantage point bias. ASes that provide BGP data to the RouteViews and RIS collectors appear falsely central. AS Hegemony, developed by Fontugne et al., corrects this by filtering biased viewpoints, producing a 0–1 score that reflects the true fraction of paths crossing an AS. It can be applied globally or locally to reveal Internet-wide or AS-specific dependencies.

Customer cone size developed by CAIDA offers another perspective, capturing an AS’s economic and routing influence via the set of networks it serves through customer links. Large cones indicate major transit hubs whose failure affects many downstream networks. However, global cone rankings can obscure regional importance, so country-level adaptations give more accurate resilience assessments.

Impact-Weighted Resilience Assessment

Not all networks have the same impact when they fail. A small hosting provider going offline affects far fewer people than if a national ISP does. Traditional resilience metrics treat all networks equally, which can mask where the real risks are. To address this, we use impact-weighted metrics that factor in a network’s user base or infrastructure footprint. For example, by weighting multi-homing rates or path diversity by user population, we can see how many people actually benefit from redundancy — not just how many networks have it. Similarly, weighting by the number of announced prefixes highlights networks that carry more traffic or control more address space.

This approach helps separate theoretical resilience from practical resilience. A country might have many multi-homed networks, but if most users rely on just one single-homed ISP, its resilience is weaker than it looks. Impact weighting helps surface these kinds of structural risks so that operators and policymakers can prioritize improvements where they matter most.

Metrics of network hygiene

Large Internet outages aren’t always caused by cable cuts or natural disasters — sometimes, they stem from routing mistakes or security gaps. Route hijacks, leaks, and spoofed announcements can disrupt traffic on a national scale. How well networks protect themselves against these incidents is a key part of resilience, and that’s where network hygiene comes in.

Network hygiene refers to the security and operational practices that make the global routing system more trustworthy. This includes:

  • Cryptographic validation, like RPKI, to prevent unauthorized route announcements. ROA Coverage measures the share of announced IPv4/IPv6 space with valid Route Origin Authorizations (ROAs), indicating participation in the RPKI ecosystem. ROV Deployment gauges how many networks drop invalid routes, but detecting active filtering is difficult. Policymakers can improve visibility by supporting independent measurements, data transparency, and standardized reporting.

  • Filtering and cooperative norms, where networks block bogus routes and follow best practices when sharing routing information.

  • Consistent deployment across both domestic networks and their international upstreams, since traffic often crosses multiple jurisdictions.

Strong hygiene practices reduce the likelihood of systemic routing failures and limit their impact when they occur. We actively support and monitor the adoption of these mechanisms, for instance through crowd-sourced measurements and public advocacy, because every additional network that validates routes and filters traffic contributes to a safer and more resilient Internet for everyone.

Another critical aspect of Internet hygiene is mitigating DDoS attacks, which often rely on IP address spoofing to amplify traffic and obscure the attacker’s origin. BCP-38, the IETF’s network ingress filtering recommendation, addresses this by requiring operators to block packets with spoofed source addresses, reducing a region’s role as a launchpad for global attacks. While BCP-38 does not prevent a network from being targeted, its deployment is a key indicator of collective security responsibility. Measuring compliance requires active testing from inside networks, which is carried out by the CAIDA Spoofer Project. Although the global sample remains limited, these metrics offer valuable insight into both the technical effectiveness and the security engagement of a nation’s network community, complementing RPKI in strengthening the overall routing security posture.

Measuring the collective security posture

Beyond securing individual networks through mechanisms like RPKI and BCP-38, strengthening the Internet’s resilience also depends on collective action and visibility. While origin validation and anti-spoofing reduce specific classes of threats, broader frameworks and shared measurement infrastructures are essential to address systemic risks and enable coordinated responses.

The Mutually Agreed Norms for Routing Security (MANRS) initiative promotes Internet resilience by defining a clear baseline of best practices. It is not a new technology but a framework fostering collective responsibility for global routing security. MANRS focuses on four key actions: filtering incorrect routes, anti-spoofing, coordination through accurate contact information, and global validation using RPKI and IRRs. While many networks implement these independently, MANRS participation signals a public commitment to these norms and to strengthening the shared security ecosystem.

Additionally, a region’s participation in public measurement platforms reflects its Internet observability, which is essential for fault detection, impact assessment, and incident response. RIPE Atlas and CAIDA Ark provide dense data-plane measurements; RouteViews and RIPE RIS collect BGP routing data to detect anomalies; and PeeringDB documents interconnection details, reflecting operational maturity and integration into the global peering fabric. Together, these platforms underpin observatories like IODA and GRIP, which combine BGP and active data to detect outages and routing incidents in near real time, offering critical visibility into Internet health and security.

Building a more resilient Internet, together

Measuring Internet resilience is complex, but it’s not impossible. By using publicly available data, we can create a transparent and reproducible framework to identify strengths, weaknesses, and single points of failure in any network ecosystem.

This isn’t just a theoretical exercise. For policymakers, this data can inform infrastructure investment and pro-competitive policies that encourage diversity. For network operators, it provides a benchmark to assess their own resilience and that of their partners. And for everyone who relies on the Internet, it’s a critical step toward building a more stable, secure, and reliable global network.

For more details of the framework, including a full table of the metrics and links to source code, please refer to the full paper:  Regional Perspectives for Route Resilience in a Global Internet: Metrics, Methodology, and Pathways for Transparency published at TPRC23.

To build a better Internet in the age of AI, we need responsible AI bot principles. Here’s our proposal.

Post Syndicated from Leah Romm original https://blog.cloudflare.com/building-a-better-internet-with-responsible-ai-bot-principles/

Cloudflare has a unique vantage point: we see not only how changes in technology shape the Internet, but also how new technologies can unintentionally impact different stakeholders. Take, for instance, the increasing reliance by everyday Internet users on AI–powered chatbots and search summaries. On the one hand, end users are getting information faster than ever before. On the other hand, web publishers, who have historically relied on human eyeballs to their website to support their businesses, are seeing a dramatic decrease in those eyeballs, which can reduce their ability to create original high-quality content. This cycle will ultimately hurt end users and AI companies (whose success relies on fresh, high-quality content to train models and provide services) alike.

We are indisputably at a point in time when the Internet needs clear “rules of the road” for AI bot behavior (a note on terminology: throughout this blog we refer to AI bots and crawlers interchangeably). We have had ongoing cross-functional conversations, both internally and with stakeholders and partners across the world, and it’s clear to us that the Internet at large needs key groups — publishers and content creators, bot operators, and Internet infrastructure and cybersecurity companies — to reach a consensus on certain principles that AI bots should follow.

Of course, agreeing on what exactly those principles are will take time and require continued discussion and collaboration, and a policy framework can’t perfectly capture every technical concern. Nevertheless, we think it’s important to start a conversation that we hope others will join. After all, a rough draft is better than a blank page.

That is why we are proposing the following responsible AI bot principles as starting points:

  1. Public disclosure: Companies should publicly disclose information about their AI bots;

  2. Self-identification: AI bots should truthfully self-identify, eventually replacing less reliable methods, like user agent and IP address verification, with cryptographic verification;

  3. Declared single purpose: AI bots should have one distinct purpose and declare it;

  4. Respect preferences: AI bots should respect and comply with preferences expressed by website operators where proportionate and technically feasible;

  5. Act with good intent: AI bots must not flood sites with excessive traffic or engage in deceptive behavior.

Each principle is discussed in greater detail below. These principles focus on AI bots because of the impact generative AI is having on the Internet, but we have already seen these practices in action with other types of (non-AI) bots as well. We believe these principles will help move the Internet in a better direction. That said, we acknowledge that they are a starting point for this conversation, which requires input from other stakeholders. The Internet has always been a collaborative place for innovation, and these principles should be seen as equally dynamic and evolving. 

Why Cloudflare is encouraging this conversation

Since declaring July 1st Content Independence Day, Cloudflare has strived to play a balanced and effective role in safeguarding the future of the Internet in the age of generative AI. We have enabled customers to charge AI crawlers for access or block them with one click, published and enforced our verified bots policy and developed the Web Bot Auth proposal, and unapologetically called out and stopped bad behavior.

While we have recently focused our attention on AI crawlers, Cloudflare has long been a leader in the bot management space, helping our customers protect their websites from unwanted — and even malicious —traffic. We also want to make sure that anyone — whether they’re our customer or not — can see which AI bots are abiding by all, some, or none of these best practices

But we aren’t ignorant to the fact that companies operating crawlers are also adapting to a new Internet landscape — and we genuinely believe that most players in this space want to do the right thing, while continuing to innovate and propel the Internet in an exciting direction. Our hope is that we can use our expertise and unique vantage point on the Internet to help bring seemingly incompatible parties together and find a path forward — continuing our mission of helping to build a better Internet for everyone.

Responsible AI bot principles

The following principles are a launchpad for a larger conversation, and we recognize that there is work to be done to address many nuanced perspectives. We envision these principles applying to AI bots but understand that technical complexity may require flexibility. Ultimately, our goal is to emphasize transparency, accountability, and respect for content access and use preferences. If these principles fall short of that — or fail to consider other important priorities — we want to know.

Principle #1: Public disclosure

Companies should publicly disclose information about their AI bots. The following information should be publicly available and easy to find:

  • Identity: information that helps external parties identify a bot, e.g., user agent, relevant IP address(es), and/or individual cryptographic identification (more on this below, in Principle #2: Self-identification).

  • Operator: the legal entity responsible for the AI bot, including a point of contact (e.g., for reporting abuse);

  • Purpose: for which purpose the accessed data will be used, i.e., search, AI-input, or training (more on this below, in Principle #3: Declared Single Purpose).

OpenAI is an example of a leading AI company that clearly discloses their bots, complete with detailed explanations of each bot’s purpose. The benefits of this disclosure are apparent in the subsequent principles. It helps website operators validate that a given request is in fact coming from OpenAI and what its purpose is (e.g., search indexing or AI model training). This, in turn, enables website operators to control access to and use of their content through preference expression mechanisms, like robots.txt files.

Principle #2: Self-identification

AI bots should truthfully self-identify. Not only should information about bots be disclosed in a publicly accessible location, this information should also be clearly communicated by bots themselves, e.g., through an HTTP request that conveys the bot’s official user agent and comes from an IP address that the bot claims to send traffic from. Admittedly, this current approach is flawed, as we discuss in more detail below. But until cryptographic verification is more widely adopted, we think relying on user agent and IP verification is better than nothing.

OpenAI’s GPTBot is an example of this principle in action. OpenAI publicly shares the expected full user-agent string for this bot and includes it in its requests. OpenAI also explains this bot’s purpose (“used to make [OpenAI’s] generative AI foundation models more useful and safe” and “to crawl content that may be used in training [their] generative AI foundation models”). And we have observed this bot sending traffic from IP addresses reported by OpenAI. Because site operators see GPTBot’s user agent and IP addresses matching what is publicly disclosed and expected, and they know information about the bot is publicly documented, they can confidently recognize the bot. This enables them to make informed decisions about whether they want to allow traffic from it.

Unfortunately, not all bots uphold this principle, making it difficult for website owners to know exactly which bot operators respect their crawl preferences, much less enforce them. For example, while Anthropic publishes its user agent alone, absent other verifiable information, it’s unclear which requests are truly from Anthropic. And xAI’s bot, grok, does not self-identify at all, making it impossible for website operators to block it. Anthropic and xAI’s lack of identification undermines trust between them and website owners, yet this could be fixed with minimal effort on their parts.

A note on cryptographic verification and the future of Principle #2

Truthful declaration of user agent and dedicated IP lists have historically been a functional way to verify. But in today’s rapidly-evolving bot climate, bots are increasingly vulnerable to being spoofed by bad actors. These bad actors, in turn, ignore robots.txt, which communicates allow/disallow preferences only on a user agent basis (so, a bad bot could spoof a permitted user agent and circumvent that domain’s preferences).

Ultimately, every AI bot should be cryptographically verified using an accepted standard. This would protect them against spoofing and ensure website operators have the accurate and reliable information they need to properly evaluate access by AI bots. At this time, we believe that Web Bot Auth is sufficient proof of compliance with Principle #2. We recognize that this standard is still in development, and, as a result, this principle may evolve accordingly.

Web Bot Auth uses cryptography to verify bot traffic; cryptographic signatures in HTTP messages are used as verification that a given request came from an automated bot. Our implementation relies on proposed IETF directory and protocol drafts. Initial reception of Web Bot Auth has been very positive, and we expect even more adoption. For example, a little over a month ago, Vercel announced that its bot verification now supports Web Bot Auth. And OpenAI’s ChatGPT agent now signs its requests using Web Bot Auth, in addition to using the HTTP Message Signatures standard.

We envision a future where cryptographic authentication becomes the norm, as we believe this will further strengthen the trustworthiness of bots.

Principle #3: Declared single purpose 

AI bots should have one distinct purpose and declare it. Today, some bots self-identify their purpose as Training, Search, or User Action (i.e., accessing a web page in response to a user’s query).

However, these purposes are sometimes combined without clear distinction. For example, content accessed for search purposes might also be used to train the AI model powering the search engine. When a bot’s purpose is unclear, website operators face a difficult decision: block it and risk undermining search engine optimization (SEO), or allow it and risk content being used in unwanted ways.

When operators deploy bots with distinct purposes, website owners are able to make clear decisions over who can access their content. What those purposes should be is up for debate, but we think the following breakdown is a starting point based on bot activity we see. We recognize this is an evolving space and changes may be required as innovation continues:

  • Search: building a search index and providing search results (e.g., returning hyperlinks and short excerpts from your website’s contents). Search does not include providing AI-generated search summaries;

  • AI-input: inputting content into one or more AI models, e.g., retrieval-augmented generation (RAG), grounding, or other real-time taking of content for generative AI search answers; and

  • Training: training or fine-tuning AI models.

Relatedly, bots should not combine purposes in a way that prevents web operators from deliberately and effectively deciding whether to allow crawling.

Let’s consider two AI bots, OAI-SearchBot and Googlebot, from the perspective of Vinny, a website operator trying to make a living on the Internet. OAI-SearchBot has a single purpose: linking to and surfacing websites in ChatGPT’s search features. If Vinny takes OpenAI at face value (which we think it makes sense to do), he can trust that OAI-SearchBot does not crawl his content for training OpenAI’s generative AI models rather, a separate bot (GPTBot, as discussed in Principle #2: Self-identification) does. Vinny can decide how he wants his content used by OpenAI, e.g., permitting its use for search but not for AI training, and feel confident that his choices are respected because OAI-SearchBot only crawls for search purposes, while GPTBot is not granted access to the content in the first place (and therefore cannot use it).

On the other hand, while Googlebot scrapes content for traditional search-indexing (not model training), it also uses that content for inference purposes, such as for AI Overviews and AI Mode. Why is this a problem for Vinny? While he almost certainly wants his content appearing in search results, which drive the human eyeballs that fund his site, Vinny is forced to also accept that his content will appear in Google’s AI-generated summaries. If eyeballs are satisfied by the summary then they never visit Vinny’s website, which leads to “zero-click” searches and undermines Vinny’s ability to financially benefit from his content.

This is a vicious cycle: creating high-quality content, which typically leads to higher search rankings, now inadvertently also reduces the chances an eyeball will visit the site because that same valuable content is surfaced in an AI Overview (if it is even referenced as a source in the summary). To prevent this, Vinny must either opt out of search completely or use snippet controls (which risks degrading how his content appears in search results). This is because the only available signal to opt-out of AI, disallowing Google-Extended, is limited to training and does not apply to AI Overview, which is attached to search. Whether by accident or by design, this setup forces an impossible choice onto website owners.

Finally, the prominent technical argument in favor of combining multiple purposes — that this reduces the crawler operator’s costs — needs to be debunked. To reason by analogy: it’s like arguing that placing one call to order two pizzas is cheaper than placing two calls to order two pizzas. In reality, the cost of the two pizzas (both of which take time and effort to make) remains the same. The extra phone call may be annoying, but its costs are negligible.

Similarly, whether one bot request is made for two purposes (e.g., search indexing and AI model training) or a separate bot request is made for each of two purposes, the costs basically remain the same. For the crawler, the cost of compute is the same because the content still needs to be processed for each purpose. And the cost of two connections (i.e., for two requests) is virtually the same as one. We know this because Cloudflare runs one of the largest networks in the world, handling on average 84 million requests per second, so we understand the cost of requests at Internet scale. (As an aside, while additional crawls incur costs on website operators, they have the ability to choose whether the crawl is worth the cost, especially when bots have a single purpose.)

Principle # 4: Respect preferences

AI bots should respect and comply with preferences expressed by website operators where proportionate and technically feasible. There are multiple options for expressing preferences. Prominent examples include the longstanding and familiar robots.txt, as well as newly emerging HTTP headers.

Given the widespread use of robots.txt files, bots should make a good faith attempt to fetch a robots.txt file first, in accordance with RFC 9309, and abide by both the access and use preferences specified therein. AI bot operators should also stay up to date on how those preferences evolve as a result of a draft vocabulary currently under development by an IETF working group. The goal of the proposed vocabulary is to improve granularity in robots.txt files, so that website operators are empowered to control how their assets are used. 

At the same time, new industry standards under discussion may involve the attachment of machine-readable preferences to different formats, such as individual files. AI bot operators should eventually be prepared to comply with these standards, too. One idea currently being explored is a way for site owners to list preferences via HTTP headers, which offer a server-level method of declaring how content should be used.

Principle #5: Act with good intent

AI bots must not flood sites with excessive traffic or engage in deceptive behavior. AI bot behavior should be benign or helpful to website operators and their users. It is also incumbent on companies that operate AI bots to monitor their networks and resources for breaches and patch vulnerabilities. Jeopardizing a website’s security or performance or engaging in harmful tactics is unacceptable.

Nor is it appropriate to appear to comply with the principles, only to secretly circumvent them. Reaffirming a long-standing principle of acceptable bot behavior, AI bots must never engage in stealth crawling or use other stealth tactics to try and dodge detection, such as modifying their user agent, changing their source ASNs to hide their crawling activity, or ignoring robots.txt files. Doing so would undermine the preceding four principles, hurting website operators and worsening the Internet for all.

The road ahead: multi-stakeholder efforts to bring these principles to life

As we continue working on these principles and soliciting feedback, we strive to find a balance: we want the wishes of content creators respected while still encouraging AI innovation. It’s a privilege to sit at the intersection of these important interests and to play a crucial role in developing an agreeable path forward.

We are continuing to engage with right holders, AI companies, policy-makers, and regulators to shape global industry standards and regulatory frameworks accordingly. We believe that the influx of generative AI use need not threaten the Internet’s place as an open source of quality content. Protecting its integrity requires agreement on workable technical standards that reflect the interests of web publishers, content creators, and AI companies alike.  

The whole ecosystem must continue to come together and collaborate towards a better Internet that truly works for everyone. Cloudflare advocates for neutral forums where all affected parties can discuss the impact of AI developments on the Internet. One such example is the IETF, which has current work focused on some of the technical aspects being considered. Those efforts attempt to address some, but not all, of the issues in an area that deserves holistic consideration. We believe the principles we have proposed are a step in the right direction — but we hope others will join this complex and important conversation, so that norms and behavior on the Internet can successfully adapt to this exciting new technological age.

Enhance your website’s security with Cloudflare’s free security.txt generator

Post Syndicated from Alexandra Moraru original https://blog.cloudflare.com/security-txt


A story of security and simplicity

Meet Georgia, a diligent website administrator at a growing e-commerce company. Every day, Georgia juggles multiple tasks, from managing server uptime to ensuring customer data security. One morning, Georgia receives an email from a security researcher who discovered a potential vulnerability on the website. The researcher struggled to find the right contact information, leading to delays in reporting the issue. Georgia realizes the need for a standardized way to communicate with security researchers, ensuring that vulnerabilities are reported swiftly and efficiently. This is where security.txt comes in.

Why security.txt matters

Security.txt is becoming a widely adopted standard among security-conscious organizations. By providing a common location and format for vulnerability disclosure information, it helps bridge the gap between security researchers and organizations. This initiative is supported by major companies and aligns with global security best practices. By offering an automated security.txt generator for free, we aim to empower all of our users to enhance their security measures without additional costs.

In 2020, Cloudflare published the Cloudflare Worker for the security.txt generator as an open-source project on GitHub, demonstrating our commitment to enhancing web security. This tool is actively used by Cloudflare to streamline vulnerability disclosure processes. However, over the past few years, we’ve observed a growing demand from our customers for an easier way to implement this standard. In response to this demand and to further support the adoption of security.txt across the Internet, we integrated it directly into our dashboard, making it simple for all our users to enhance their security practices. You can learn more about the initial release and its impact in our previous blog post here

Who can use the free Cloudflare security.txt generator

This feature is designed for any Cloudflare user who manages a website, from small business owners to large enterprises, from developers to security professionals. Whether you’re a seasoned security expert or new to website management, this tool provides an easy way to create and manage your security.txt file in your Cloudflare account, ensuring that you’re prepared to handle vulnerability reports effectively.

Technical insights: leveraging Cloudflare’s tools

Our security.txt generator is seamlessly integrated into our dashboard. Here’s how it works:


When the user enters their data in the Cloudflare Dashboard, the information is immediately stored in a highly available and geo-redundant PostgreSQL database. This ensures that all user data is securely kept and can be accessed quickly from any location within our global network.

Instead of creating a static file at the point of data entry, we use a dynamic approach. When a request for the security.txt file is made via the standard .well-known path specified by RFC 9116, our system dynamically constructs the file using the latest data from our database. This method ensures that any updates made by users are reflected in real-time without requiring manual intervention or file regeneration. The data entered by users is synchronized across Cloudflare’s global network using our Quicksilver technology. This allows for rapid propagation of changes, ensuring that any updates to the security.txt file are available almost instantaneously across all servers.

Each security.txt file includes an expiration timestamp, which is set during the initial configuration. This timestamp helps alert users when their information may be outdated, encouraging them to review and update their details regularly. For example, if a user sets an expiration date 365 days into the future, they will receive notifications as this date approaches, prompting them to refresh their information.

To ensure compliance with best practices, we also support optional fields such as encryption keys and signatures within the security.txt file. Users can link to their PGP keys for secure communications or include signatures to verify authenticity, enhancing trust with security researchers.

Users who prefer automation can manage their security.txt files through our API, allowing seamless integration with existing workflows and tools. This feature enables developers to programmatically update their security.txt configurations without manual dashboard interactions.

Users can also find a view of any missing security.txt files via Security Insights under Security Center.

Available now, and free for all Cloudflare users

By making this feature available to all our users at no cost, we aim to support the security efforts of our entire community, helping you protect your digital assets and foster trust with your audience.

With the introduction of our free security.txt generator, we’re taking a significant step towards simplifying security management for everyone. Whether you’re a small business owner or a large enterprise, this tool empowers you to adopt industry best practices and ensure that you’re ready to handle vulnerability reports effectively. Set up security.txt on your websites today!

Expanding Cloudflare’s support for open source projects with Project Alexandria

Post Syndicated from Veronica Marin original https://blog.cloudflare.com/expanding-our-support-for-oss-projects-with-project-alexandria

At Cloudflare, we believe in the power of open source. It’s more than just code, it’s the spirit of collaboration, innovation, and shared knowledge that drives the Internet forward. Open source is the foundation upon which the Internet thrives, allowing developers and creators from around the world to contribute to a greater whole.

But oftentimes, open source maintainers struggle with the costs associated with running their projects and providing access to users all over the world. We’ve had the privilege of supporting incredible open source projects such as Git and the Linux Foundation through our open source program and learned first-hand about the places where Cloudflare can help the most.

Today, we’re introducing a streamlined and expanded open source program: Project Alexandria. The ancient city of Alexandria is known for hosting a prolific library and a lighthouse that was one of the Seven Wonders of the Ancient World. The Lighthouse of Alexandria served as a beacon of culture and community, welcoming people from afar into the city. We think Alexandria is a great metaphor for the role open source projects play as a beacon for developers around the world and a source of knowledge that is core to making a better Internet. 

This project offers recurring annual credits to even more open source projects to provide our products for free. In the past, we offered an upgrade to our Pro plan, but now we’re offering upgrades tailored to the size and needs of each project, along with access to a broader range of products like Workers, Pages, and more. Our goal with Project Alexandria is to ensure every OSS project not only survives but thrives, with access to Cloudflare’s enhanced security, performance optimization, and developer tools — all at no cost.

Building a program based on your needs

We realize that open source projects have different needs. Some projects, like package repositories, may be most concerned about storage and transfer costs. Other projects need help protecting them from DDoS attacks. And some projects need a robust developer platform to enable them to quickly build and deploy scalable and secure applications.

With our new program we’ll work with your project to help unlock the following based on your needs:

  • An upgrade to a Cloudflare Pro, Business, or Enterprise plan, which will give you more flexibility with more Cloudflare Rules to manage traffic with, Image Optimization with Polish to accelerate the speed of image downloads, and enhanced security with Web Application Firewall (WAF), Security Analytics, and Page Shield, to protect projects from potential threats and vulnerabilities.

  • Increased requests to Cloudflare Workers and Pages, allowing you to handle more traffic and scale your applications globally.

  • Increased R2 storage for builds and artifacts, ensuring you have the space needed to store and access your project’s assets efficiently.

  • Enhanced Zero Trust access, including Remote Browser Isolation, no user limits, and extended activity log retention to give you deeper insights and more control over your project’s security.

Every open source project in the program will receive additional resources and support through a dedicated channel on our Discord server. And if there’s something you think we can do to help that we don’t currently offer, we’re here to figure out how to make it happen.

Many open source projects run within the limits of Cloudflare’s generous free tiers. Our mission to help build a better Internet means that cost should not be a barrier to creating, securing, and distributing your open source packages globally, no matter the size of the project. Indie or niche open source projects can still run for free without the need for credits. For larger open source projects, the annual recurring credits are available to you, so your money can continue to be reinvested into innovation, instead of paying for infrastructure to store, secure, and deliver your packages and websites. 

We’re dedicated to supporting projects that are not only innovative but also crucial to the continued growth and health of the internet. The criteria for the program remain the same:

  • Operate solely on a non-profit basis and/or otherwise align with the project mission.

  • Be an open source project with a recognized OSS license.

If you’re an open source project that meets these requirements, you can apply for the program here.

Empowering the Open Source community

We’re incredibly lucky to have open source projects that we admire, and the incredible people behind those projects, as part of our program — including the OpenJS Foundation, OpenTofu, and JuliaLang.

OpenJS Foundation

Node.js has been part of our OSS Program since 2019, and we’ve recently partnered with the OpenJS Foundation to provide technical support and infrastructure improvements to other critical JavaScript projects hosted at the foundation, including Fastify, jQuery, Electron, and NativeScript.

One prominent example of the OpenJS Foundation using Cloudflare is the Node.js CDN Worker.  It’s currently in active development by the Node.js Web Infrastructure and Build teams and aims to serve all Node.js release assets (binaries, documentations, etc.) provided on their website. 

Aaron Snell explained that these release assets are currently being served by a single static origin file server fronted by Cloudflare. This worked fine up until a few years ago when issues began to pop up with new releases. With a new release came a cache purge, meaning that all the requests for the release assets were cache misses, causing Cloudflare to go forward directly to the static file server, overloading it. Because Node.js releases nightly builds, this issue occurs every day.

The CDN Worker plans to fix this by using Cloudflare Workers and R2 to serve requests for the release assets, taking all the load off the static file server, resulting in improved availability for Node.js downloads and documentation, and ultimately making the process more sustainable in the long run.

OpenTofu

OpenTofu has been focused on building a free and open alternative to proprietary infrastructure-as-code platforms. One of their major challenges has been ensuring the reliability and scalability of their registry while keeping costs low. Cloudflare’s R2 storage and caching services provided the perfect fit, allowing OpenTofu to serve static files at scale without worrying about bandwidth or performance bottlenecks.

The OpenTofu team noted that it was paramount for OpenTofu to keep the costs of running the registry as low as possible both in terms of bandwidth and also in human cost. However, they also needed to make sure that the registry had an uptime close to 100% since thousands upon thousands of developers would be left without a means to update their infrastructure if it went down.

The registry codebase (written in Go) pre-generates all possible answers of the OpenTofu Registry API and uploads the static files to an R2 bucket. With R2, OpenTofu has been able to run the registry essentially for free with no servers and scaling issues to worry about.

JuliaLang

JuliaLang has recently joined our OSS Sponsorship Program, and we’re excited to support their critical infrastructure to ensure the smooth operation of their ecosystem. A key aspect of this support is enabling the use of Cloudflare’s services to help JuliaLang deliver packages to its user base.

According to Elliot Saba, JuliaLang had been using Amazon Lightsail as a cost-effective global CDN to serve packages to their user base. However, as their user base grew they would occasionally exceed their bandwidth limits and rack up serious cloud costs, not to mention experiencing degraded performance due to load balancer VMs getting overloaded by traffic spikes. Now JuliaLang is using Cloudflare R2, and the speed and reliability of R2 object storage has so far exceeded that of their own within-datacenter solutions, and the lack of bandwidth charges means JuliaLang is now getting faster, more reliable service for less than a tenth of their previous spend.

How can we help?

If your project fits our criteria, and you’re looking to reduce costs and eliminate surprise bills, we invite you to apply! We’re eager to help the next generation of open source projects make their mark on the internet.

For more details and to apply, visit our new Project Alexandria page. And if you know other projects that could benefit from this program, please spread the word!

Cloudflare’s 2024 Annual Founders’ Letter

Post Syndicated from Matthew Prince original https://blog.cloudflare.com/cloudflare-2024-annual-founders-letter

This week Cloudflare will celebrate the fourteenth anniversary of our launch. We think of it as our birthday. As is our tradition ever since our first anniversary, we use our Birthday Week each year to launch new products that we think of as gifts back to the Internet. For the last five years, we also take this time to write our annual Founders’ Letter reflecting on our business and the state of the Internet. This year is no different.

That said, one thing that is different is you may have noticed we’ve actually had fewer public innovation weeks over the last year than usual. That’s been because a couple of incidents nearly a year ago caused us to focus on improving our internal systems over releasing new features. We’re incredibly proud of our team’s focus to make security, resilience, and reliability the top priorities for the last year. Today, Cloudflare’s underlying platform, and the products that run on top of it, are significantly more robust than ever before.


With that work largely complete, and our platform in its strongest shape ever, we plan to pick back up the usual cadence of new product launches that we’re known for. This Birthday Week, you’ll see many as we roll out performance improvements only our Connectivity Cloud can deliver to accelerate all our customers’ websites by a mind-blowing 45 percent (automatically and for free), launch new features to make our developer platform faster and easier to use, plug the web’s last encryption hole, accelerate AI inference globally, provide new levels of support for startups and the open source community, and much much more.

This is easily our favorite week of the year because of how it allows our team to give back to the Internet and live up to our mission.

Challenges for the Internet ahead

The robustness of Cloudflare’s platform today contrasts with what feels like an Internet that has become far more fragile over the previous year. When we first articulated our mission as helping build a better Internet, we assumed that “better” meant one that was faster, more reliable, more secure, more private, and more efficient. But today it seems like something more fundamental.

The last year has been characterized by a normalization of Internet shutdowns and limits on Internet access around the world. What were once tactics reserved for authoritarian regimes have spread to even Western democratic nations, where courts and legislatures have been emboldened to restrict fundamental protocols to control perceived harms.

We’ve seen a dramatic uptick in courts of limited jurisdiction ordering sites they found objectionable blocked globally at the DNS level, nations turning off the Internet for most their citizens in the name of preventing cheating on standardized tests (while it remains on in wealthy and politically connected neighborhoods), ISPs proposing legislation to impose new taxes on content creators, and whole services being banned in countries that had previously declared that more Internet was always better than less. 

This is, unfortunately, a dark time in the history of the Internet.

AI’s Threat to Original Content Creation

At the same time, the business model of the web is eroding. The quid pro quo of the web’s last era — the search era — was that you let a company like Google scrape data from your website in exchange for them sending you traffic. In that model, content creators could then generate value from that traffic through ads, selling products, or just getting the ego boost of knowing that someone cares enough about the thing you created to take the time to view it.


That same quid pro quo does not hold up in the era we’re moving into — the AI era — where answers are delivered to questions without ever having to visit the authoritative source. And, if content creators can no longer generate value from their creations, it’s inevitable they’ll generate less content and we’ll all, including the AI companies that need original content to train their models, lose out as a result.

Picking Up the Mantle

The Internet remains a miracle, but it no longer feels inevitable. It is under attack from active adversaries and beginning to rot from benign neglect. And, with the largest tech companies distracted by their own regulatory challenges, it finds itself without a clear champion. We’re proud of our team for picking up that mantle. At Cloudflare, we believe in the Internet and we will fight for it.

That’s why we invest in our public policy team to educate lawmakers and jurists on how best to control the harms created by some limited corners of the Internet without destabilizing its underlying protocols. Why we believe it’s important to provide so many of our services for free. And it’s why this Birthday Week we’ll announce new ways for the AI systems that hunger for original content to compensate content creators in a way that is equitable. Without a new paradigm, we worry that the incentives that allowed the Internet to flourish will shrivel and its miracle will fade.

Missions matter. Ours it to help build a better Internet. We, or one of our senior executives, still talk to every candidate we hire before extending an offer because we want to ensure we communicate the importance of our mission. One of the most common questions we’re asked is how we plan to preserve Cloudflare’s culture? Our answer is always the same: the goal isn’t how to preserve our culture, it’s always how to improve it. The same has to be true for the Internet. We can’t just try to preserve the past, we need to imagine new ways to improve it.

That requires champions to stand up and imagine a better Internet. It’s been too long since you’ve read a positive story about the Internet even though it continues to be a miracle. We are proud that we have the team, platform, and mantle to not just preserve, but improve on, that miracle. It is our mission and what motivates everything we do at Cloudflare. And nowhere is that more on display than during the week ahead. If you too are inspired by our mission, we encourage you to apply to join our team.


Stay tuned for an incredible Birthday Week of new products that make progress on our mission. Thank you to our team around the world for everything you do. Cloudflare is stronger because of the work we’ve accomplished, and the Internet will be stronger because of Cloudflare.


The backbone behind Cloudflare’s Connectivity Cloud

Post Syndicated from Shozo Moritz Takaya original https://blog.cloudflare.com/backbone2024


The modern use of “cloud” arguably traces its origins to the cloud icon, omnipresent in network diagrams for decades. A cloud was used to represent the vast and intricate infrastructure components required to deliver network or Internet services without going into depth about the underlying complexities. At Cloudflare, we embody this principle by providing critical infrastructure solutions in a user-friendly and easy-to-use way. Our logo, featuring the cloud symbol, reflects our commitment to simplifying the complexities of Internet infrastructure for all our users.

This blog post provides an update about our infrastructure, focusing on our global backbone in 2024, and highlights its benefits for our customers, our competitive edge in the market, and the impact on our mission of helping build a better Internet. Since the time of our last backbone-related blog post in 2021, we have increased our backbone capacity (Tbps) by more than 500%, unlocking new use cases, as well as reliability and performance benefits for all our customers.

A snapshot of Cloudflare’s infrastructure

As of July 2024, Cloudflare has data centers in 330 cities across more than 120 countries, each running Cloudflare equipment and services. The goal of delivering Cloudflare products and services everywhere remains consistent, although these data centers vary in the number of servers and amount of computational power.

These data centers are strategically positioned around the world to ensure our presence in all major regions and to help our customers comply with local regulations. It is a programmable smart network, where your traffic goes to the best data center possible to be processed. This programmability allows us to keep sensitive data regional, with our Data Localization Suite solutions, and within the constraints that our customers impose. Connecting these sites, exchanging data with customers, public clouds, partners, and the broader Internet, is the role of our network, which is managed by our infrastructure engineering and network strategy teams. This network forms the foundation that makes our products lightning fast, ensuring our global reliability, security for every customer request, and helping customers comply with data sovereignty requirements.

Traffic exchange methods

The Internet is an interconnection of different networks and separate autonomous systems that operate by exchanging data with each other. There are multiple ways to exchange data, but for simplicity, we’ll focus on two key methods on how these networks communicate: Peering and IP Transit. To better understand the benefits of our global backbone, it helps to understand these basic connectivity solutions we use in our network.

  1. Peering: The voluntary interconnection of administratively separate Internet networks that allows for traffic exchange between users of each network is known as “peering”. Cloudflare is one of the most peered networks globally. We have peering agreements with ISPs and other networks in 330 cities and across all major Internet Exchanges (IX’s). Interested parties can register to peer with us anytime, or directly connect to our network with a link through a private network interconnect (PNI).
  2. IP transit: A paid service that allows traffic to cross or “transit” somebody else’s network, typically connecting a smaller Internet service provider (ISP) to the larger Internet. Think of it as paying a toll to access a private highway with your car.

The backbone is a dedicated high-capacity optical fiber network that moves traffic between Cloudflare’s global data centers, where we interconnect with other networks using these above-mentioned traffic exchange methods. It enables data transfers that are more reliable than over the public Internet. For the connectivity within a city and long distance connections we manage our own dark fiber or lease wavelengths using Dense Wavelength Division Multiplexing (DWDM). DWDM is a fiber optic technology that enhances network capacity by transmitting multiple data streams simultaneously on different wavelengths of light within the same fiber. It’s like having a highway with multiple lanes, so that more cars can drive on the same highway. We buy and lease these services from our global carrier partners all around the world.

Backbone operations and benefits

Operating a global backbone is challenging, which is why many competitors don’t do it. We take this challenge for two key reasons: traffic routing control and cost-effectiveness.

With IP transit, we rely on our transit partners to carry traffic from Cloudflare to the ultimate destination network, introducing unnecessary third-party reliance. In contrast, our backbone gives us full control over routing of both internal and external traffic, allowing us to manage it more effectively. This control is crucial because it lets us optimize traffic routes, usually resulting in the lowest latency paths, as previously mentioned. Furthermore, the cost of serving large traffic volumes through the backbone is, on average, more cost-effective than IP transit. This is why we are doubling down on backbone capacity in regions such as Frankfurt, London, Amsterdam, and Paris and Marseille, where we see continuous traffic growth and where connectivity solutions are widely available and competitively priced.

Our backbone serves both internal and external traffic. Internal traffic includes customer traffic using our security or performance products and traffic from Cloudflare’s internal systems that shift data between our data centers. Tiered caching, for example, optimizes our caching delivery by dividing our data centers into a hierarchy of lower tiers and upper tiers. If lower-tier data centers don’t have the content, they request it from the upper tiers. If the upper tiers don’t have it either, they then request it from the origin server. This process reduces origin server requests and improves cache efficiency. Using our backbone to transport the cached content between lower and upper-tier data centers and the origin is often the most cost-effective method, considering the scale of our network. Magic Transit is another example where we attract traffic, by means of BGP anycast, to the Cloudflare data center closest to the end user and implement our DDoS solution. Our backbone transports the clean traffic to our customer’s data center, which they connect through a Cloudflare Network Interconnect (CNI).

External traffic that we carry on our backbone can be traffic from other origin providers like AWS, Oracle, Alibaba, Google Cloud Platform, or Azure, to name a few. The origin responses from these cloud providers are transported through peering points and our backbone to the Cloudflare data center closest to our customer. By leveraging our backbone we have more control over how we backhaul this traffic throughout our network, which results in more reliability and better performance and less dependency on the public Internet.

This interconnection between public clouds, offices, and the Internet with a controlled layer of performance, security, programmability, and visibility running on our global backbone is our Connectivity Cloud.

This map is a simplification of our current backbone network and does not show all paths

Expanding our network

As mentioned in the introduction, we have increased our backbone capacity (Tbps) by more than 500% since 2021. With the addition of sub-sea cable capacity to Africa, we achieved a big milestone in 2023 by completing our global backbone ring. It now reaches six continents through terrestrial fiber and subsea cables.

Building out our backbone within regions where Internet infrastructure is less developed compared to markets like Central Europe or the US has been a key strategy for our latest network expansions. We have a shared goal with regional ISP partners to keep our data flow localized and as close as possible to the end user. Traffic often takes inefficient routes outside the region due to the lack of sufficient local peering and regional infrastructure. This phenomenon, known as traffic tromboning, occurs when data is routed through more cost-effective international routes and existing peering agreements.

Our regional backbone investments in countries like India or Turkey aim to reduce the need for such inefficient routing. With our own in-region backbone, traffic can be directly routed between in-country Cloudflare data centers, such as from Mumbai to New Delhi to Chennai, reducing latency, increasing reliability, and helping us to provide the same level of service quality as in more developed markets. We can control that data stays local, supporting our Data Localization Suite (DLS), which helps businesses comply with regional data privacy laws by controlling where their data is stored and processed.

Improved latency and performance

This strategic expansion has not only extended our global reach but has also significantly improved our overall latency. One illustration of this is that since the deployment of our backbone between Lisbon and Johannesburg, we have seen a major performance improvement for users in Johannesburg. Customers benefiting from this improved latency can be, for example, a financial institution running their APIs through us for real-time trading, where milliseconds can impact trades, or our Magic WAN users, where we facilitate site-to-site connectivity between their branch offices.

The table above shows an example where we measured the round-trip time (RTT) for an uncached origin fetch, from an end-user in Johannesburg to various origin locations, comparing our backbone and the public Internet. By carrying the origin request over our backbone, as opposed to IP transit or peering, local users in Johannesburg get their content up to 22% faster. By using our own backbone to long-haul the traffic to its final destination, we are in complete control of the path and performance. This improvement in latency varies by location, but consistently demonstrates the superiority of our backbone infrastructure in delivering high performance connectivity.

Traffic control

Consider a navigation system using 1) GPS to identify the route and 2) a highway toll pass that is valid until your final destination and allows you to drive straight through toll stations without stopping. Our backbone works quite similarly.

Our global backbone is built upon two key pillars. The first is BGP (Border Gateway Protocol), the routing protocol for the Internet, and the second is Segment Routing MPLS (Multiprotocol label switching), a technique for steering traffic across predefined forwarding paths in an IP network. By default, Segment Routing provides end-to-end encapsulation from ingress to egress routers where the intermediate nodes execute no route lookup. Instead, they forward traffic across an end-to-end virtual circuit, or tunnel, called a label-switched path. Once traffic is put on a label-switched path, it cannot detour onto the public Internet and must continue on the predetermined route across Cloudflare’s backbone. This is nothing new, as many networks will even run a “BGP Free Core” where all the route intelligence is carried at the edge of the network, and intermediate nodes only participate in forwarding from ingress to egress.

While leveraging Segment Routing Traffic Engineering (SR-TE) in our backbone, we can automatically select paths between our data centers that are optimized for latency and performance. Sometimes the “shortest path” in terms of routing protocol cost is not the lowest latency or highest performance path.

Supercharged: Argo and the global backbone

Argo Smart Routing is a service that uses Cloudflare’s portfolio of backbone, transit, and peering connectivity to find the most optimal path between the data center where a user’s request lands and your back-end origin server. Argo may forward a request from one Cloudflare data center to another on the way to an origin if the performance would improve by doing so. Orpheus is the counterpart to Argo, and routes around degraded paths for all customer origin requests free of charge. Orpheus is able to analyze network conditions in real-time and actively avoid reachability failures. Customers with Argo enabled get optimal performance for requests from Cloudflare data centers to their origins, while Orpheus provides error self-healing for all customers universally. By mixing our global backbone using Segment Routing as an underlay with Argo Smart Routing and Orpheus as our connectivity overlay, we are able to transport critical customer traffic along the most optimized paths that we have available.

So how exactly does our global backbone fit together with Argo Smart Routing? Argo Transit Selection is an extension of Argo Smart Routing where the lowest latency path between Cloudflare data center hops is explicitly selected and used to forward customer origin requests. The lowest latency path will often be our global backbone, as it is a more dedicated and private means of connectivity, as opposed to third-party transit networks.

Consider a multinational Dutch pharmaceutical company that relies on Cloudflare’s network and services with our SASE solution to connect their global offices, research centers, and remote employees. Their Asian branch offices depend on Cloudflare’s security solutions and network to provide secure access to important data from their central data centers back to their offices in Asia. In case of a cable cut between regions, our network would automatically look for the best alternative route between them so that business impact is limited.

Argo measures every potential combination of the different provider paths, including our own backbone, as an option for reaching origins with smart routing. Because of our vast interconnection with so many networks, and our global private backbone, Argo is able to identify the most performant network path for requests. The backbone is consistently one of the lowest latency paths for Argo to choose from.

In addition to high performance, we care greatly about network reliability for our customers. This means we need to be as resilient as possible from fiber cuts and third-party transit provider issues. During a disruption of the AAE-1 (Asia Africa Europe-1) submarine cable, this is what Argo saw between Singapore and Amsterdam across some of our transit provider paths vs. the backbone.

The large (purple line) spike shows a latency increase on one of our third-party IP transit provider paths due to congestion, which was eventually resolved following likely traffic engineering within the provider’s network. We saw a smaller latency increase (yellow line) over other transit networks, but still one that is noticeable. The bottom (green) line on the graph is our backbone, where round-trip time more or less remains flat throughout the event, due to our diverse backbone connectivity between Asia and Europe. Throughout the fiber cut, we remained stable at around 200ms between Amsterdam and Singapore. There was no noticeable network hiccup as was seen on the transit provider paths, so Argo actively leveraged the backbone for optimal performance.

Call to action

As Argo improves performance in our network, Cloudflare Network Interconnects (CNIs) optimize getting onto it. We encourage our Enterprise customers to use our free CNI’s as on-ramps onto our network whenever practical. In this way, you can fully leverage our network, including our robust backbone, and increase overall performance for every product within your Cloudflare Connectivity Cloud. In the end, our global network is our main product and our backbone plays a critical role in it. This way we continue to help build a better Internet, by improving our services for everybody, everywhere.

If you want to be part of our mission, join us as a Cloudflare network on-ramp partner to offer secure and reliable connectivity to your customers by integrating directly with us. Learn more about our on-ramp partnerships and how they can benefit your business here.

Automatically replacing polyfill.io links with Cloudflare’s mirror for a safer Internet

Post Syndicated from Matthew Prince original https://blog.cloudflare.com/automatically-replacing-polyfill-io-links-with-cloudflares-mirror-for-a-safer-internet


polyfill.io, a popular JavaScript library service, can no longer be trusted and should be removed from websites.

Multiple reports, corroborated with data seen by our own client-side security system, Page Shield, have shown that the polyfill service was being used, and could be used again, to inject malicious JavaScript code into users’ browsers. This is a real threat to the Internet at large given the popularity of this library.

We have, over the last 24 hours, released an automatic JavaScript URL rewriting service that will rewrite any link to polyfill.io found in a website proxied by Cloudflare to a link to our mirror under cdnjs. This will avoid breaking site functionality while mitigating the risk of a supply chain attack.

Any website on the free plan has this feature automatically activated now. Websites on any paid plan can turn on this feature with a single click.

You can find this new feature under Security ⇒ Settings on any zone using Cloudflare.

Contrary to what is stated on the polyfill.io website, Cloudflare has never recommended the polyfill.io service or authorized their use of Cloudflare’s name on their website. We have asked them to remove the false statement and they have, so far, ignored our requests. This is yet another warning sign that they cannot be trusted.

If you are not using Cloudflare today, we still highly recommend that you remove any use of polyfill.io and/or find an alternative solution. And, while the automatic replacement function will handle most cases, the best practice is to remove polyfill.io from your projects and replace it with a secure alternative mirror like Cloudflare’s even if you are a customer.

You can do this by searching your code repositories for instances of polyfill.io and replacing it with cdnjs.cloudflare.com/polyfill/ (Cloudflare’s mirror). This is a non-breaking change as the two URLs will serve the same polyfill content. All website owners, regardless of the website using Cloudflare, should do this now.

How we came to this decision

Back in February, the domain polyfill.io, which hosts a popular JavaScript library, was sold to a new owner: Funnull, a relatively unknown company. At the time, we were concerned that this created a supply chain risk. This led us to spin up our own mirror of the polyfill.io code hosted under cdnjs, a JavaScript library repository sponsored by Cloudflare.

The new owner was unknown in the industry and did not have a track record of trust to administer a project such as polyfill.io. The concern, highlighted even by the original author, was that if they were to abuse polyfill.io by injecting additional code to the library, it could cause far reaching security problems on the Internet affecting several hundreds of thousands websites. Or it could be used to perform a targeted supply-chain attack against specific websites.

Unfortunately, that worry came true on June 25, 2024 as the polyfill.io service was being used to inject nefarious code that, under certain circumstances, redirected users to other websites.

We have taken the exceptional step of using our ability to modify HTML on the fly to replace references to the polyfill.io CDN in our customers’ websites with links to our own, safe, mirror created back in February.

In the meantime, additional threat feed providers have also taken the decision to flag the domain as malicious. We have not outright blocked the domain through any of the mechanisms we have because we are concerned it could cause widespread web outages given how broadly polyfill.io is used with some estimates indicating usage on nearly 4% of all websites.

Corroborating data with Page Shield

The original report indicates that malicious code was injected that, under certain circumstances, would redirect users to betting sites. It was doing this by loading additional JavaScript that would perform the redirect, under a set of additional domains which can be considered Indicators of Compromise (IoCs):

https://www.googie-anaiytics.com/analytics.js
https://www.googie-anaiytics.com/html/checkcachehw.js
https://www.googie-anaiytics.com/gtags.js
https://www.googie-anaiytics.com/keywords/vn-keyword.json
https://www.googie-anaiytics.com/webs-1.0.1.js
https://www.googie-anaiytics.com/analytics.js
https://www.googie-anaiytics.com/webs-1.0.2.js
https://www.googie-anaiytics.com/ga.js
https://www.googie-anaiytics.com/web-1.0.1.js
https://www.googie-anaiytics.com/web.js
https://www.googie-anaiytics.com/collect.js
https://kuurza.com/redirect?from=bitget

(note the intentional misspelling of Google Analytics)

Page Shield, our client side security solution, is available on all paid plans. When turned on, it collects information about JavaScript files loaded by end user browsers accessing your website.

By looking at the database of detected JavaScript files, we immediately found matches with the IoCs provided above starting as far back as 2024-06-08 15:23:51 (first seen timestamp on Page Shield detected JavaScript file). This was a clear indication that malicious activity was active and associated with polyfill.io.

Replacing insecure JavaScript links to polyfill.io

To achieve performant HTML rewriting, we need to make blazing-fast HTML alterations as responses stream through Cloudflare’s network. This has been made possible by leveraging ROFL (Response Overseer for FL). ROFL powers various Cloudflare products that need to alter HTML as it streams, such as Cloudflare Fonts, Email Obfuscation and Rocket Loader

ROFL is developed entirely in Rust. The memory-safety features of Rust are indispensable for ensuring protection against memory leaks while processing a staggering volume of requests, measuring in the millions per second. Rust’s compiled nature allows us to finely optimize our code for specific hardware configurations, delivering performance gains compared to interpreted languages.

The performance of ROFL allows us to rewrite HTML on-the-fly and modify the polyfill.io links quickly, safely, and efficiently. This speed helps us reduce any additional latency added by processing the HTML file.

If the feature is turned on, for any HTTP response with an HTML Content-Type, we parse all JavaScript script tag source attributes. If any are found linking to polyfill.io, we rewrite the src attribute to link to our mirror instead. We map to the correct version of the polyfill service while the query string is left untouched.

The logic will not activate if a Content Security Policy (CSP) header is found in the response. This ensures we don’t replace the link while breaking the CSP policy and therefore potentially breaking the website.

Default on for free customers, optional for everyone else

Cloudflare proxies millions of websites, and a large portion of these sites are on our free plan. Free plan customers tend to have simpler applications while not having the resources to update and react quickly to security concerns. We therefore decided to turn on the feature by default for sites on our free plan, as the likelihood of causing issues is reduced while also helping keep safe a very large portion of applications using polyfill.io.

Paid plan customers, on the other hand, have more complex applications and react quicker to security notices. We are confident that most paid customers using polyfill.io and Cloudflare will appreciate the ability to virtually patch the issue with a single click, while controlling when to do so.

All customers can turn off the feature at any time.

This isn’t the first time we’ve decided a security problem was so widespread and serious that we’d enable protection for all customers regardless of whether they were a paying customer or not. Back in 2014, we enabled Shellshock protection for everyone. In 2021, when the log4j vulnerability was disclosed we rolled out protection for all customers.

Do not use polyfill.io

If you are using Cloudflare, you can remove polyfill.io with a single click on the Cloudflare dashboard by heading over to your zone ⇒ Security ⇒ Settings. If you are a free customer, the rewrite is automatically active. This feature, we hope, will help you quickly patch the issue.

Nonetheless, you should ultimately search your code repositories for instances of polyfill.io and replace them with an alternative provider, such as Cloudflare’s secure mirror under cdnjs (https://cdnjs.cloudflare.com/polyfill/). Website owners who are not using Cloudflare should also perform these steps.

The underlying bundle links you should use are:

For minified: https://cdnjs.cloudflare.com/polyfill/v3/polyfill.min.js
For unminified: https://cdnjs.cloudflare.com/polyfill/v3/polyfill.js

Doing this ensures your website is no longer relying on polyfill.io.

Patrick Finn: why I joined Cloudflare as VP Sales for the Americas

Post Syndicated from Patrick S. Finn original https://blog.cloudflare.com/patrick-finn


I’m delighted to be joining Cloudflare as Vice President of Sales in the US, Canada, and Latin America.

I’ve had the privilege of leading sales for some of the world’s most iconic tech companies, including IBM and Cisco. During my career I’ve led international teams numbering in the thousands and driving revenue in the billions of dollars while serving some of the world’s largest enterprise customers. I’ve seen first-hand the evolution of technology and what it can achieve for businesses, from robotics, automation, and data analytics, to cloud computing, cybersecurity, and AI.

I firmly believe Cloudflare is well on its way to being one of the next iconic tech companies.

Why Cloudflare

Cloudflare has a unique opportunity to help businesses navigate an enduring wave of technological change. There are few companies in the world that operate in the three most exciting fields of innovation that will continue to shape our world in the coming years: cloud computing, AI, and cybersecurity. Cloudflare is one of those companies. When I was approached for this role, I spoke to a wide range of connections across the financial sector, private companies, and government. The feedback was unanimous that Cloudflare is poised on the edge of exhilarating growth.

Driving predictable, profitable revenue

I was fortunate to join Cisco two years after its annual revenue passed the $1 billion mark and had the privilege of helping scale the business to more than $49 billion in revenue the year I left. Cloudflare passed the $1 billion milestone just last year, and I see the same potential for growth here as I saw at Cisco.

Cloudflare’s global sales organization is growing. I’m excited to help accelerate that process in a way that delivers recurring revenue for the business while ensuring we retain a very high bar in terms of the talent we bring onto the team. My experience leading complex, cross-functional sales organizations within large global companies has taught me a great deal about the common traits among highly effective sales functions.

The groups of individuals that come together to make true teams are the ones that successfully focus on a unifying goal and develop skills like communication, attitude, process, organization, consistency, collaboration, partnership, and accountability.  These teams embrace diversity and bring out of each other the best expertise, creativity, and skills, making the team stronger and keeping the goal in focus.

Making our customers our north star

We will achieve the opportunity ahead of us only as long as we have our customers as our north star. Today, the Americas represent more than half of Cloudflare’s revenue worldwide and are home to some of our largest and most strategic customers – both in the private and public sectors – including 30% of the Fortune 1000. Brands from Zendesk to Shopify and from Colgate-Palmolive to Mars rely on Cloudflare to operate their businesses in a fast, secure, and reliable way.

Whatever the technology, there are three common fundamentals I’ve found essential to creating value for customers: being the expert on their challenges, understanding how to pick the right combination of products, services, and solutions from those available, and knowing your competition.

Cloudflare already has an incredible and growing range of products and services that are helping millions of individuals and organizations maximize the opportunities presented by cloud computing and generative AI, all while staying safe from the threat of cyberattacks.

What helping to build a better Internet means to me

If it were needed, one additional deciding factor behind my excitement in joining Cloudflare is its ambitious mission to help build a better Internet. As a father, I want the Internet to be a safe and valuable resource for my family and friends and for generations to come. I don’t want my daughter to have to worry about her personal data and privacy as she’s buying Billie Eilish concert tickets online (and, yes, I’m going too).

Today Cloudflare’s connectivity cloud protects nearly 20% of all websites online and stops 209 billion cyber attacks daily. In addition to its growing customer base, Cloudflare is living up to its mission by offering its services for free to millions more individuals and small businesses, including the most vulnerable voices online through its Project Galileo initiative.

The combination of a strong mission, genuine values, a great team, and incredible technology isn’t a given in every company, but is evident at Cloudflare. I’m excited to play a part as Cloudflare continues to scale its business and help build a better Internet for everyone.

If you’re interested in learning more about what Cloudflare can do for your organization, please get in touch here. If you’re an ambitious, talented sales professional looking for your next challenging and rewarding career move, check out our open positions here.

Zero Trust WARP: tunneling with a MASQUE

Post Syndicated from Dan Hall original https://blog.cloudflare.com/zero-trust-warp-with-a-masque


Slipping on the MASQUE

In June 2023, we told you that we were building a new protocol, MASQUE, into WARP. MASQUE is a fascinating protocol that extends the capabilities of HTTP/3 and leverages the unique properties of the QUIC transport protocol to efficiently proxy IP and UDP traffic without sacrificing performance or privacy

At the same time, we’ve seen a rising demand from Zero Trust customers for features and solutions that only MASQUE can deliver. All customers want WARP traffic to look like HTTPS to avoid detection and blocking by firewalls, while a significant number of customers also require FIPS-compliant encryption. We have something good here, and it’s been proven elsewhere (more on that below), so we are building MASQUE into Zero Trust WARP and will be making it available to all of our Zero Trust customers — at WARP speed!

This blog post highlights some of the key benefits our Cloudflare One customers will realize with MASQUE.

Before the MASQUE

Cloudflare is on a mission to help build a better Internet. And it is a journey we’ve been on with our device client and WARP for almost five years. The precursor to WARP was the 2018 launch of 1.1.1.1, the Internet’s fastest, privacy-first consumer DNS service. WARP was introduced in 2019 with the announcement of the 1.1.1.1 service with WARP, a high performance and secure consumer DNS and VPN solution. Then in 2020, we introduced Cloudflare’s Zero Trust platform and the Zero Trust version of WARP to help any IT organization secure their environment, featuring a suite of tools we first built to protect our own IT systems. Zero Trust WARP with MASQUE is the next step in our journey.

The current state of WireGuard

WireGuard was the perfect choice for the 1.1.1.1 with WARP service in 2019. WireGuard is fast, simple, and secure. It was exactly what we needed at the time to guarantee our users’ privacy, and it has met all of our expectations. If we went back in time to do it all over again, we would make the same choice.

But the other side of the simplicity coin is a certain rigidity. We find ourselves wanting to extend WireGuard to deliver more capabilities to our Zero Trust customers, but WireGuard is not easily extended. Capabilities such as better session management, advanced congestion control, or simply the ability to use FIPS-compliant cipher suites are not options within WireGuard; these capabilities would have to be added on as proprietary extensions, if it was even possible to do so.

Plus, while WireGuard is popular in VPN solutions, it is not standards-based, and therefore not treated like a first class citizen in the world of the Internet, where non-standard traffic can be blocked, sometimes intentionally, sometimes not. WireGuard uses a non-standard port, port 51820, by default. Zero Trust WARP changes this to use port 2408 for the WireGuard tunnel, but it’s still a non-standard port. For our customers who control their own firewalls, this is not an issue; they simply allow that traffic. But many of the large number of public Wi-Fi locations, or the approximately 7,000 ISPs in the world, don’t know anything about WireGuard and block these ports. We’ve also faced situations where the ISP does know what WireGuard is and blocks it intentionally.

This can play havoc for roaming Zero Trust WARP users at their local coffee shop, in hotels, on planes, or other places where there are captive portals or public Wi-Fi access, and even sometimes with their local ISP. The user is expecting reliable access with Zero Trust WARP, and is frustrated when their device is blocked from connecting to Cloudflare’s global network.

Now we have another proven technology — MASQUE — which uses and extends HTTP/3 and QUIC. Let’s do a quick review of these to better understand why Cloudflare believes MASQUE is the future.

Unpacking the acronyms

HTTP/3 and QUIC are among the most recent advancements in the evolution of the Internet, enabling faster, more reliable, and more secure connections to endpoints like websites and APIs. Cloudflare worked closely with industry peers through the Internet Engineering Task Force on the development of RFC 9000 for QUIC and RFC 9114 for HTTP/3. The technical background on the basic benefits of HTTP/3 and QUIC are reviewed in our 2019 blog post where we announced QUIC and HTTP/3 availability on Cloudflare’s global network.

Most relevant for Zero Trust WARP, QUIC delivers better performance on low-latency or high packet loss networks thanks to packet coalescing and multiplexing. QUIC packets in separate contexts during the handshake can be coalesced into the same UDP datagram, thus reducing the number of receive and system interrupts. With multiplexing, QUIC can carry multiple HTTP sessions within the same UDP connection. Zero Trust WARP also benefits from QUIC’s high level of privacy, with TLS 1.3 designed into the protocol.

MASQUE unlocks QUIC’s potential for proxying by providing the application layer building blocks to support efficient tunneling of TCP and UDP traffic. In Zero Trust WARP, MASQUE will be used to establish a tunnel over HTTP/3, delivering the same capability as WireGuard tunneling does today. In the future, we’ll be in position to add more value using MASQUE, leveraging Cloudflare’s ongoing participation in the MASQUE Working Group. This blog post is a good read for those interested in digging deeper into MASQUE.

OK, so Cloudflare is going to use MASQUE for WARP. What does that mean to you, the Zero Trust customer?

Proven reliability at scale

Cloudflare’s network today spans more than 310 cities in over 120 countries, and interconnects with over 13,000 networks globally. HTTP/3 and QUIC were introduced to the Cloudflare network in 2019, the HTTP/3 standard was finalized in 2022, and represented about 30% of all HTTP traffic on our network in 2023.

We are also using MASQUE for iCloud Private Relay and other Privacy Proxy partners. The services that power these partnerships, from our Rust-based proxy framework to our open source QUIC implementation, are already deployed globally in our network and have proven to be fast, resilient, and reliable.

Cloudflare is already operating MASQUE, HTTP/3, and QUIC reliably at scale. So we want you, our Zero Trust WARP users and Cloudflare One customers, to benefit from that same reliability and scale.

Connect from anywhere

Employees need to be able to connect from anywhere that has an Internet connection. But that can be a challenge as many security engineers will configure firewalls and other networking devices to block all ports by default, and only open the most well-known and common ports. As we pointed out earlier, this can be frustrating for the roaming Zero Trust WARP user.

We want to fix that for our users, and remove that frustration. HTTP/3 and QUIC deliver the perfect solution. QUIC is carried on top of UDP (protocol number 17), while HTTP/3 uses port 443 for encrypted traffic. Both of these are well known, widely used, and are very unlikely to be blocked.

We want our Zero Trust WARP users to reliably connect wherever they might be.

Compliant cipher suites

MASQUE leverages TLS 1.3 with QUIC, which provides a number of cipher suite choices. WireGuard also uses standard cipher suites. But some standards are more, let’s say, standard than others.

NIST, the National Institute of Standards and Technology and part of the US Department of Commerce, does a tremendous amount of work across the technology landscape. Of interest to us is the NIST research into network security that results in FIPS 140-2 and similar publications. NIST studies individual cipher suites and publishes lists of those they recommend for use, recommendations that become requirements for US Government entities. Many other customers, both government and commercial, use these same recommendations as requirements.

Our first MASQUE implementation for Zero Trust WARP will use TLS 1.3 and FIPS compliant cipher suites.

How can I get Zero Trust WARP with MASQUE?

Cloudflare engineers are hard at work implementing MASQUE for the mobile apps, the desktop clients, and the Cloudflare network. Progress has been good, and we will open this up for beta testing early in the second quarter of 2024 for Cloudflare One customers. Your account team will be reaching out with participation details.

Continuing the journey with Zero Trust WARP

Cloudflare launched WARP five years ago, and we’ve come a long way since. This introduction of MASQUE to Zero Trust WARP is a big step, one that will immediately deliver the benefits noted above. But there will be more — we believe MASQUE opens up new opportunities to leverage the capabilities of QUIC and HTTP/3 to build innovative Zero Trust solutions. And we’re also continuing to work on other new capabilities for our Zero Trust customers.
Cloudflare is committed to continuing our mission to help build a better Internet, one that is more private and secure, scalable, reliable, and fast. And if you would like to join us in this exciting journey, check out our open positions.

Making home Internet faster has little to do with “speed”

Post Syndicated from Mike Conlow original https://blog.cloudflare.com/making-home-internet-faster/

Making home Internet faster has little to do with “speed”

Making home Internet faster has little to do with “speed”

More than ten years ago, researchers at Google published a paper with the seemingly heretical title “More Bandwidth Doesn’t Matter (much)”. We published our own blog showing it is faster to fly 1TB of data from San Francisco to London than it is to upload it on a 100 Mbps connection. Unfortunately, things haven’t changed much. When you make purchasing decisions about home Internet plans, you probably consider the bandwidth of the connection when evaluating Internet performance. More bandwidth is faster speed, or so the marketing goes. In this post, we’ll use real-world data to show both bandwidth and – spoiler alert! – latency impact the speed of an Internet connection. By the end, we think you’ll understand why Cloudflare is so laser focused on reducing latency everywhere we can find it.

First, we should quickly define bandwidth and latency. Bandwidth is the amount of data that can be transmitted at any single time. It’s the maximum throughput, or capacity, of the communications link between two servers that want to exchange data. Usually, the bottleneck – the place in the network where the connection is constrained by the amount of bandwidth available – is in the “last mile”, either the wire that connects a home, or the modem or router in the home itself.

If the Internet is an information superhighway, bandwidth is the number of lanes on the road. The wider the road, the more traffic can fit on the highway at any time. Bandwidth is useful for downloading large files like operating system updates and big game updates. While bandwidth, throughput and capacity are synonyms, confusingly “speed” has come to mean bandwidth when talking about Internet plans. More on this later.

We use bandwidth when streaming video, though probably less than you think. Netflix recommends 15 Mbps of bandwidth to watch a stream in 4K/Ultra HD. A 1 Gbps connection could stream more than 60 Netflix shows in 4K at the same time!

Latency, on the other hand, is how fast data is moving through the Internet. To extend our analogy, tatency is the speed at which traffic is moving on the highway. If traffic is moving quickly, you’ll get to your destination faster. Latency is measured in the number of milliseconds that it takes a packet of data to go from a client (such as your laptop computer) to a server, and then back to the client. If you’re practicing tennis against a wall, round-trip latency is the time the ball was in the air. On the Internet “backbone” data is traveling at almost 200,000 kilometers per second as it bounces off the glass on the inside of fiber optic wires. That’s fast!

While we can’t make light travel through glass much faster, we can improve latency by moving the content closer to users, shortening the distance data needs to travel. That’s the effect of our presence in more than 285 cities globally: when you’re on the Internet superhighway trying to reach Cloudflare, we want to be just off the next exit.

We know that low-latency (low delay; high speed) connections are important for gaming, where tiny bits of data, such as the change in position of players in a game, need to reach another computer quickly. And increasingly, we’re becoming aware of high latency when it makes our videoconferencing choppy and unpleasant.

But we don’t use the Internet only to play games, nor only watch streaming video. We do those, and we visit a lot of normal web pages in between.

In the 2010 paper from Google, the author simulated loading web pages while varying the throughput and latency of the connection. What he finds is that above about 5 Mbps, the page doesn’t load much faster. Increasing bandwidth from 1 Mbps to 2 Mbps is almost a 40 percent improvement in page load time. From 5 Mbps to 6 Mbps is less than a 5 percent improvement.

When he varies the latency (the Round Trip Time, or RTT), something interesting happens: there is a linear return to better latency. For every 20 milliseconds of reduced latency, the page load time improves by about 10%.

Let’s see what this looks like in real life with empirical data. Below is a chart from an excellent recent paper by two researchers from MIT. Using data from the FCC’s Measuring Broadband America program, these researchers produce a similar chart to what we expect from the 2010 simulation. Though the point of diminishing returns to more bandwidth has moved higher – to about 20 Mbps – the overall trend is exactly the same.

Making home Internet faster has little to do with “speed”

For the latency relationship, we use aggregate and anonymized data from Cloudflare’s own delivery network. It’s a familiar pattern. For every 200 milliseconds of latency we can save, we cut the page load time by over 1 second. That relationship applies when the latency is 950 milliseconds. And it applies when the latency is 50 milliseconds.

Making home Internet faster has little to do with “speed”

Let’s try to understand why this relationship exists. When you connect to a website, the first thing that your browser does is encrypt the connection and make sure the site you want to access is authenticated to be the site you think you’re accessing. This process is called the TLS establishment and SSL handshake. Before you even see a pixel of content, your browser and the website will exchange information up to seven times: three to perform TLS establishment, and three more to perform the SSL handshake.

Making home Internet faster has little to do with “speed”

On top of that, when we load a webpage after we establish encryption and verify website authority, we might be asking the browser to load hundreds of different files across dozens of different domains. Some of these files can be loaded in parallel, but others need to be loaded sequentially. As the browser races to compile all these different files, it’s the speed at which it can get to the server and back that determines how fast it can put the page together. The files are often quite small, but there’s a lot of them.

The chart below shows the beginning of what the browser does when it loads cnn.com. After a 301 redirect, the browser loads the main HTML page in step two. Only then, more than 1 second into the load, does it know about all the javascript files it needs to render the page. Files 3-19 become unblocked once the browser has the HTML file in step two, but we see more blocking later on. Files 20-27 are all blocked on earlier files. They can’t start until the browser has the previous file back from the server. There are 650 assets in this page load, and the blocking happens all the way through the page load. Here’s why this matters: better latency makes every file load faster, which in turn unblocks other files faster, and so on.

Making home Internet faster has little to do with “speed”

The browser will do its best to use all the bandwidth available, but often is using just a fraction of what’s available. It’s no wonder then that adding more bandwidth doesn’t speed up the page load, but better latency does. While developments like Early Hints help this by allowing browsers to pre-fetch files and content that don’t need to be serialized, this is still a problem for many websites on the Internet today.

Making home Internet faster has little to do with “speed”

Recently, Internet researchers have turned their attention to using our understanding of the relationship between throughput and latency to improve Internet Quality of Experience (QoE). A paper from the Broadband Internet Technical Advisory Group (BITAG) summarizes:

But we now recognize that it is not just greater throughput that matters, but also consistently low latency. Unfortunately, the way that we’ve historically understood and characterized latency was flawed, and our latency measurements and metrics were not aligned with end-user QoE.

There’s a difference between latency on an idle Internet connection and latency measured in working conditions, which we call “working latency” or “responsiveness”. Since responsiveness is what the user experiences as the speed of their Internet connection, it’s important to understand and measure this particular latency.

An Internet connection can suffer from poor responsiveness (even if it has good idle latency) when data is delayed in buffers. If you download a large file, for example an operating system update, the server sending the file might send the file with higher throughput than the Internet connection can accept. That’s ok. Extra bits of the file will sit in a buffer until it’s their turn to go through the funnel. Adding extra lanes to the highway allows more cars to pass through, and is a good strategy if we aren’t particularly concerned with the speed of the traffic.

Say for example, Christabel is watching a stream of the news while on a video meeting. When Christabel starts watching the video, her browser fetches a bunch of content and stores it in various buffers on the way from the content host to the browser. Those same buffers also contain data packets pertaining to the video meeting Christabel is currently in. If the data generated as part of a video conference sits in the same buffer as the video files, the video files will fill up the buffer and cause delay for the video meeting packets as well. That type of buffering delay is called bufferbloat, and leads to jittery video calls and delays where people speak over each other and get frustrated.

Making home Internet faster has little to do with “speed”

To help users understand the strengths and weaknesses of their connection, we recently added Aggregated Internet Measurement (AIM) scores to our own “Speed” Test. These scores remove the technical metrics and give users a real-world, plain-English understanding of what their connection will be good at, and where it might struggle. We’d also like to collect more data from our speed test to help track Page Load Times (PLT) and see how they are correlated with the reduction of lower working latency. You’ll start seeing those numbers on our speed test soon!

Making home Internet faster has little to do with “speed”

We all use our Internet connections in slightly different ways, but we share the desire for our connections to be as fast as possible. As more and more services move into the cloud – word documents, music, websites, communications, etc – the speed at which we can access those services becomes critical. While bandwidth plays a part, the latency of the connection – the real Internet “speed” – is more important.

At Cloudflare, we’re working every day to help build a more performant Internet. Want to help? Apply for one of our open engineering roles here.

Closing out 2022 with our latest Impact Report

Post Syndicated from Andie Goodwin original https://blog.cloudflare.com/impact-report-2022/

Closing out 2022 with our latest Impact Report

Closing out 2022 with our latest Impact Report

To conclude Impact Week, which has been filled with announcements about new initiatives and features that we are thrilled about, today we are publishing our 2022 Impact Report.

In short, the Impact Report is an annual summary highlighting how we are helping build a better Internet and the progress we are making on our environmental, social, and governance priorities. It is where we showcase successes from Cloudflare Impact programs, celebrate awards and recognitions, and explain our approach to fundamental values like transparency and privacy.

We believe that a better Internet is principled, for everyone, and sustainable; these are the three themes around which we constructed the report. The Impact Report also serves as our repository for disclosures consistent with our commitments for the Global Reporting Initiative (GRI), Sustainability Accounting Standards Board (SASB), and UN Global Compact (UNGC).

Check out the full report to:

  • Explore how we are expanding the value and scope of our Cloudflare Impact programs
  • Review our latest diversity statistics — and our newest employee resource group
  • Understand how we are supporting humanitarian and human rights causes
  • Read quick summaries of Impact Week announcements
  • Examine how we calculate and validate emissions data

As fantastic as 2022 has been for scaling up Cloudflare Impact and making strides toward a better Internet, we are aiming even higher in 2023. To keep up with developments throughout the year, follow us on Twitter and LinkedIn, and keep an eye out for updates on our Cloudflare Impact page.

How Cloudflare advocates for a better Internet

Post Syndicated from Christiaan Smits original https://blog.cloudflare.com/how-cloudflare-advocates-for-a-better-internet/

How Cloudflare advocates for a better Internet

How Cloudflare advocates for a better Internet

We mean a lot of things when we talk about helping to build a better Internet. Sometimes, it’s about democratizing technologies that were previously only available to the wealthiest and most technologically savvy companies, sometimes it’s about protecting the most vulnerable groups from cyber attacks and online prosecution. And the Internet does not exist in a vacuum.

As a global company, we see the way that the future of the Internet is affected by governments, regulations, and people. If we want to help build a better Internet, we have to make sure that we are in the room, sharing Cloudflare’s perspective in the many places where important conversations about the Internet are happening. And that is why we believe strongly in the value of public policy.

We thought this week would be a great opportunity to share Cloudflare’s principles and our theories behind policy engagement. Because at its core, a public policy approach needs to reflect who the company is through their actions and rhetoric. And as a company, we believe there is real value in helping governments understand how companies work, and helping our employees understand how governments and law-makers work. Especially now, during a time in which many jurisdictions are passing far-reaching laws that shape the future of the Internet, from laws on content moderation, to new and more demanding regulations on cybersecurity.

Principled, Curious, Transparent

At Cloudflare, we have three core company values: we are Principled, Curious, and Transparent. By principled, we mean thoughtful, consistent, and long-term oriented about what the right course of action is. By curious, we mean taking on big challenges and understanding the why and how behind things. Finally, by transparent, we mean being clear on why and how we decide to do things both internally and externally.

Our approach to public policy aims to integrate these three values into our engagement with stakeholders. We are thoughtful when choosing the right issues to prioritize, and are consistent once we have chosen to take a position on a particular topic. We are curious about the important policy conversations that governments and institutions around the world are having about the future of the Internet, and want to understand the different points of view in that debate. And we aim to be as transparent as possible when talking about our policy stances, by, for example, writing blogs, submitting comments to public consultations, or participating in conversations with policymakers and our peers in the industry. And, for instance with this blog, we also aim to be transparent about our actual advocacy efforts.

What makes Cloudflare different?

With approximately 20 percent of websites using our service, including those who use our free tier, Cloudflare protects a wide variety of customers from cyberattack. Our business model relies on economies of scale, and customers choosing to add products and services to our entry-level cybersecurity protections. This means our policy perspective can be broad: we are advocating for a better Internet for our customers who are Fortune 1000 companies, as well as for individual developers with hobby blogs or small business websites. It also means that our perspective is distinct: we have a business model that is unique, and therefore a perspective that often isn’t represented by others.

Strategy

We are not naive: we do not believe that a growing company can command the same attention as some of the Internet giants, or has the capacity to engage on as many issues as those bigger companies. So how do we prioritize? What’s our rule of thumb on how and when we engage?

Our starting point is to think about the policy developments that have the largest impact on our own activities. Which issues could force us to change our model? Cause significant (financial) impact? Skew incentives for stronger cybersecurity? Then we do the exercise again, this time, thinking about whether our perspective on that policy issue is dramatically different from those of other companies in the industry. Is it important to us, but we share the same perspective as other cybersecurity, infrastructure, or cloud companies? We pass. For example, while changing corporate tax rates could have a significant financial impact on our business, we don’t exactly have a unique perspective on that. So that’s off the list. But privacy? There we think we have a distinct perspective, as a company that practices privacy by design, and supports and develops standards that help ensure privacy on the Internet. And crucially: we think privacy will be critical to the future of the Internet. So on public policy ideas related to privacy we engage. And then there is our unique vantage point, derived from our global network. This often gives us important insight and data, which we can use to educate policymakers on relevant issues.

Our engagement channels

Our Public Policy team includes people who have worked in government, law firms and the tech industry before they joined Cloudflare. The informal networks, professional relationships, and expertise that they have built over the course of their careers are instrumental in ensuring that Cloudflare is involved in important policy conversations about the Internet. We do not have a Political Action Committee, and we do not make political contributions.

As mentioned, we try to focus on the issues where we can make a difference, where we have a unique interest, perspective and expertise. Nonetheless, there are many policies and regulations that could affect not only us at Cloudflare, but the entire Internet ecosystem. In order to track policy developments worldwide, and ensure that we are able to share information, we are members of a number of associations and coalitions.

Some of these advocacy groups represent a particular industry, such as software companies, or US based technology firms, and engage with lawmakers on a wide variety of relevant policy issues for their particular sector. Other groups, in contrast, focus their advocacy on a more specific policy issue.

In addition to formal trade association memberships, we will occasionally join coalitions of companies or civil society organizations assembled for particular advocacy purposes. For example, we periodically engage with the Stronger Internet coalition, to share information about policies around encryption, privacy, and free expression around the world.

It almost goes without saying that, given our commitment to transparency as a company and entirely in line with our own ethics code and legal compliance, we fully comply with all relevant rules around advocacy in jurisdictions across the world. You can also find us in transparency registers of governmental entities, where these exist. Because we want to be transparent about how we advocate for a better Internet, today we have published an overview of the organizations we work with on our website.

Helping build a safer Internet by measuring BGP RPKI Route Origin Validation

Post Syndicated from Carlos Rodrigues original https://blog.cloudflare.com/rpki-updates-data/

Helping build a safer Internet by measuring BGP RPKI Route Origin Validation

Helping build a safer Internet by measuring BGP RPKI Route Origin Validation

The Border Gateway Protocol (BGP) is the glue that keeps the entire Internet together. However, despite its vital function, BGP wasn’t originally designed to protect against malicious actors or routing mishaps. It has since been updated to account for this shortcoming with the Resource Public Key Infrastructure (RPKI) framework, but can we declare it to be safe yet?

If the question needs asking, you might suspect we can’t. There is a shortage of reliable data on how much of the Internet is protected from preventable routing problems. Today, we’re releasing a new method to measure exactly that: what percentage of Internet users are protected by their Internet Service Provider from these issues. We find that there is a long way to go before the Internet is protected from routing problems, though it varies dramatically by country.

Why RPKI is necessary to secure Internet routing

The Internet is a network of independently-managed networks, called Autonomous Systems (ASes). To achieve global reachability, ASes interconnect with each other and determine the feasible paths to a given destination IP address by exchanging routing information using BGP. BGP enables routers with only local network visibility to construct end-to-end paths based on the arbitrary preferences of each administrative entity that operates that equipment. Typically, Internet traffic between a user and a destination traverses multiple AS networks using paths constructed by BGP routers.

BGP, however, lacks built-in security mechanisms to protect the integrity of the exchanged routing information and to provide authentication and authorization of the advertised IP address space. Because of this, AS operators must implicitly trust that the routing information exchanged through BGP is accurate. As a result, the Internet is vulnerable to the injection of bogus routing information, which cannot be mitigated by security measures at the client or server level of the network.

An adversary with access to a BGP router can inject fraudulent routes into the routing system, which can be used to execute an array of attacks, including:

  • Denial-of-Service (DoS) through traffic blackholing or redirection,
  • Impersonation attacks to eavesdrop on communications,
  • Machine-in-the-Middle exploits to modify the exchanged data, and subvert reputation-based filtering systems.

Additionally, local misconfigurations and fat-finger errors can be propagated well beyond the source of the error and cause major disruption across the Internet.

Such an incident happened on June 24, 2019. Millions of users were unable to access Cloudflare address space when a regional ISP in Pennsylvania accidentally advertised routes to Cloudflare through their capacity-limited network. This was effectively the Internet equivalent of routing an entire freeway through a neighborhood street.

Traffic misdirections like these, either unintentional or intentional, are not uncommon. The Internet Society’s MANRS (Mutually Agreed Norms for Routing Security) initiative estimated that in 2020 alone there were over 3,000 route leaks and hijacks, and new occurrences can be observed every day through Cloudflare Radar.

The most prominent proposals to secure BGP routing, standardized by the IETF focus on validating the origin of the advertised routes using Resource Public Key Infrastructure (RPKI) and verifying the integrity of the paths with BGPsec. Specifically, RPKI (defined in RFC 7115) relies on a Public Key Infrastructure to validate that an AS advertising a route to a destination (an IP address space) is the legitimate owner of those IP addresses.

RPKI has been defined for a long time but lacks adoption. It requires network operators to cryptographically sign their prefixes, and routing networks to perform an RPKI Route Origin Validation (ROV) on their routers. This is a two-step operation that requires coordination and participation from many actors to be effective.

The two phases of RPKI adoption: signing origins and validating origins

RPKI has two phases of deployment: first, an AS that wants to protect its own IP prefixes can cryptographically sign Route Origin Authorization (ROA) records thereby attesting to be the legitimate origin of that signed IP space. Second, an AS can avoid selecting invalid routes by performing Route Origin Validation (ROV, defined in RFC 6483).

With ROV, a BGP route received by a neighbor is validated against the available RPKI records. A route that is valid or missing from RPKI is selected, while a route with RPKI records found to be invalid is typically rejected, thus preventing the use and propagation of hijacked and misconfigured routes.

One issue with RPKI is the fact that implementing ROA is meaningful only if other ASes implement ROV, and vice versa. Therefore, securing BGP routing requires a united effort and a lack of broader adoption disincentivizes ASes from commiting the resources to validate their own routes. Conversely, increasing RPKI adoption can lead to network effects and accelerate RPKI deployment. Projects like MANRS and Cloudflare’s isbgpsafeyet.com are promoting good Internet citizenship among network operators, and make the benefits of RPKI deployment known to the Internet. You can check whether your own ISP is being a good Internet citizen by testing it on isbgpsafeyet.com.

Measuring the extent to which both ROA (signing of addresses by the network that controls them) and ROV (filtering of invalid routes by ISPs) have been implemented is important to evaluating the impact of these initiatives, developing situational awareness, and predicting the impact of future misconfigurations or attacks.

Measuring ROAs is straightforward since ROA data is readily available from RPKI repositories. Querying RPKI repositories for publicly routed IP prefixes (e.g. prefixes visible in the RouteViews and RIPE RIS routing tables) allows us to estimate the percentage of addresses covered by ROA objects. Currently, there are 393,344 IPv4 and 86,306 IPv6 ROAs in the global RPKI system, covering about 40% of the globally routed prefix-AS origin pairs1.

Measuring ROV, however, is significantly more challenging given it is configured inside the BGP routers of each AS, not accessible by anyone other than each router’s administrator.

Measuring ROV deployment

Although we do not have direct access to the configuration of everyone’s BGP routers, it is possible to infer the use of ROV by comparing the reachability of RPKI-valid and RPKI-invalid prefixes from measurement points within an AS2.

Consider the following toy topology as an example, where an RPKI-invalid origin is advertised through AS0 to AS1 and AS2. If AS1 filters and rejects RPKI-invalid routes, a user behind AS1 would not be able to connect to that origin. By contrast, if AS2 does not reject RPKI invalids, a user behind AS2 would be able to connect to that origin.

While occasionally a user may be unable to access an origin due to transient network issues, if multiple users act as vantage points for a measurement system, we would be able to collect a large number of data points to infer which ASes deploy ROV.

Helping build a safer Internet by measuring BGP RPKI Route Origin Validation

If, in the figure above, AS0 filters invalid RPKI routes, then vantage points in both AS1 and AS2 would be unable to connect to the RPKI-invalid origin, making it hard to distinguish if ROV is deployed at the ASes of our vantage points or in an AS along the path. One way to mitigate this limitation is to announce the RPKI-invalid origin from multiple locations from an anycast network taking advantage of its direct interconnections to the measurement vantage points as shown in the figure below. As a result, an AS that does not itself deploy ROV is less likely to observe the benefits of upstream ASes using ROV, and we would be able to accurately infer ROV deployment per AS3.

Note that it’s also important that the IP address of the RPKI-invalid origin should not be covered by a less specific prefix for which there is a valid or unknown RPKI route, otherwise even if an AS filters invalid RPKI routes its users would still be able to find a route to that IP.

Helping build a safer Internet by measuring BGP RPKI Route Origin Validation

The measurement technique described here is the one implemented by Cloudflare’s isbgpsafeyet.com website, allowing end users to assess whether or not their ISPs have deployed BGP ROV.

The isbgpsafeyet.com website itself doesn’t submit any data back to Cloudflare, but recently we started measuring whether end users’ browsers can successfully connect to invalid RPKI origins when ROV is present. We use the same mechanism as is used for global performance data4. In particular, every measurement session (an individual end user at some point in time) attempts a request to both valid.rpki.cloudflare.com, which should always succeed as it’s RPKI-valid, and invalid.rpki.cloudflare.com, which is RPKI-invalid and should fail when the user’s ISP uses ROV.

This allows us to have continuous and up-to-date measurements from hundreds of thousands of browsers on a daily basis, and develop a greater understanding of the state of ROV deployment.

The state of global ROV deployment

The figure below shows the raw number of ROV probe requests per hour during October 2022 to valid.rpki.cloudflare.com and invalid.rpki.cloudflare.com. In total, we observed 69.7 million successful probes from 41,531 ASNs.

Helping build a safer Internet by measuring BGP RPKI Route Origin Validation

Based on APNIC’s estimates on the number of end users per ASN, our weighted5 analysis covers 96.5% of the world’s Internet population. As expected, the number of requests follow a diurnal pattern which reflects established user behavior in daily and weekly Internet activity6.

We can also see that the number of successful requests to valid.rpki.cloudflare.com (gray line) closely follows the number of sessions that issued at least one request (blue line), which works as a smoke test for the correctness of our measurements.

As we don’t store the IP addresses that contribute measurements, we don’t have any way to count individual clients and large spikes in the data may introduce unwanted bias. We account for that by capturing those instants and excluding them.

Helping build a safer Internet by measuring BGP RPKI Route Origin Validation

Overall, we estimate that out of the four billion Internet users, only 261 million (6.5%) are protected by BGP Route Origin Validation, but the true state of global ROV deployment is more subtle than this.

The following map shows the fraction of dropped RPKI-invalid requests from ASes with over 200 probes over the month of October. It depicts how far along each country is in adopting ROV but doesn’t necessarily represent the fraction of protected users in each country, as we will discover.

Helping build a safer Internet by measuring BGP RPKI Route Origin Validation

Sweden and Bolivia appear to be the countries with the highest level of adoption (over 80%), while only a few other countries have crossed the 50% mark (e.g. Finland, Denmark, Chad, Greece, the United States).

ROV adoption may be driven by a few ASes hosting large user populations, or by many ASes hosting small user populations. To understand such disparities, the map below plots the contrast between overall adoption in a country (as in the previous map) and median adoption over the individual ASes within that country. Countries with stronger reds have relatively few ASes deploying ROV with high impact, while countries with stronger blues have more ASes deploying ROV but with lower impact per AS.

Helping build a safer Internet by measuring BGP RPKI Route Origin Validation

In the Netherlands, Denmark, Switzerland, or the United States, adoption appears mostly driven by their larger ASes, while in Greece or Yemen it’s the smaller ones that are adopting ROV.

The following histogram summarizes the worldwide level of adoption for the 6,765 ASes covered by the previous two maps.

Helping build a safer Internet by measuring BGP RPKI Route Origin Validation

Most ASes either don’t validate at all, or have close to 100% adoption, which is what we’d intuitively expect. However, it’s interesting to observe that there are small numbers of ASes all across the scale. ASes that exhibit partial RPKI-invalid drop rate compared to total requests may either implement ROV partially (on some, but not all, of their BGP routers), or appear as dropping RPKI invalids due to ROV deployment by other ASes in their upstream path.

To estimate the number of users protected by ROV we only considered ASes with an observed adoption above 95%, as an AS with an incomplete deployment still leaves its users vulnerable to route leaks from its BGP peers.

If we take the previous histogram and summarize by the number of users behind each AS, the green bar on the right corresponds to the 261 million users currently protected by ROV according to the above criteria (686 ASes).

Helping build a safer Internet by measuring BGP RPKI Route Origin Validation

Looking back at the country adoption map one would perhaps expect the number of protected users to be larger. But worldwide ROV deployment is still mostly partial, lacking larger ASes, or both. This becomes even more clear when compared with the next map, plotting just the fraction of fully protected users.

Helping build a safer Internet by measuring BGP RPKI Route Origin Validation

To wrap up our analysis, we look at two world economies chosen for their contrasting, almost symmetrical, stages of deployment: the United States and the European Union.

Helping build a safer Internet by measuring BGP RPKI Route Origin Validation

112 million Internet users are protected by 111 ASes from the United States with comprehensive ROV deployments. Conversely, more than twice as many ASes from countries making up the European Union have fully deployed ROV, but end up covering only half as many users. This can be reasonably explained by end user ASes being more likely to operate within a single country rather than span multiple countries.

Conclusion

Probe requests were performed from end user browsers and very few measurements were collected from transit providers (which have few end users, if any). Also, paths between end user ASes and Cloudflare are often very short (a nice outcome of our extensive peering) and don’t traverse upper-tier networks that they would otherwise use to reach the rest of the Internet.

In other words, the methodology used focuses on ROV adoption by end user networks (e.g. ISPs) and isn’t meant to reflect the eventual effect of indirect validation from (perhaps validating) upper-tier transit networks. While indirect validation may limit the “blast radius” of (malicious or accidental) route leaks, it still leaves non-validating ASes vulnerable to leaks coming from their peers.

As with indirect validation, an AS remains vulnerable until its ROV deployment reaches a sufficient level of completion. We chose to only consider AS deployments above 95% as truly comprehensive, and Cloudflare Radar will soon begin using this threshold to track ROV adoption worldwide, as part of our mission to help build a better Internet.

When considering only comprehensive ROV deployments, some countries such as Denmark, Greece, Switzerland, Sweden, or Australia, already show an effective coverage above 50% of their respective Internet populations, with others like the Netherlands or the United States slightly above 40%, mostly driven by few large ASes rather than many smaller ones.

Worldwide we observe a very low effective coverage of just 6.5% over the measured ASes, corresponding to 261 million end users currently safe from (malicious and accidental) route leaks, which means there’s still a long way to go before we can declare BGP to be safe.

……
1https://rpki.cloudflare.com/
2Gilad, Yossi, Avichai Cohen, Amir Herzberg, Michael Schapira, and Haya Shulman. "Are we there yet? On RPKI’s deployment and security." Cryptology ePrint Archive (2016).
3Geoff Huston. “Measuring ROAs and ROV”. https://blog.apnic.net/2021/03/24/measuring-roas-and-rov/
4Measurements are issued stochastically when users encounter 1xxx error pages from default (non-customer) configurations.
5Probe requests are weighted by AS size as calculated from Cloudflare’s worldwide HTTP traffic.
6Quan, Lin, John Heidemann, and Yuri Pradkin. "When the Internet sleeps: Correlating diurnal networks with external factors." In Proceedings of the 2014 Conference on Internet Measurement Conference, pp. 87-100. 2014.

Introducing Cloudflare’s Third Party Code of Conduct

Post Syndicated from Andria Jones original https://blog.cloudflare.com/introducing-cloudflares-third-party-code-of-conduct/

Introducing Cloudflare's Third Party Code of Conduct

Introducing Cloudflare's Third Party Code of Conduct

Cloudflare is on a mission to help build a better Internet, and we are committed to doing this with ethics and integrity in everything that we do. This commitment extends beyond our own actions, to third parties acting on our behalf. Cloudflare has the same expectations of ethics and integrity of our suppliers, resellers, and other partners as we do of ourselves.

Our new code of conduct for third parties

We first shared publicly our Code of Business Conduct and Ethics during Cloudflare’s initial public offering in September 2019. All Cloudflare employees take legal training as part of their onboarding process, as well as an annual refresher course, which includes the topics covered in our Code, and they sign an acknowledgement of our Code and related policies as well.

While our Code of Business Conduct and Ethics applies to all directors, officers and employees of Cloudflare, it has not extended to third parties. Today, we are excited to share our Third Party Code of Conduct, specifically formulated with our suppliers, resellers, and other partners in mind. It covers such topics as:

  • Human Rights
  • Fair Labor
  • Environmental Sustainability
  • Anti-Bribery and Anti-Corruption
  • Trade Compliance
  • Anti-Competition
  • Conflicts of Interest
  • Data Privacy and Security
  • Government Contracting

But why have another Code?

We work with a wide range of third parties in all parts of the world, including countries with a high risk of corruption, potential for political unrest, and also countries that are just not governed by the same laws that we may see as standard in the United States. We wanted a Third Party Code of Conduct that serves as a statement of Cloudflare’s core values and commitments, and a call for third parties who share the same.

The following are just a few examples of how we want to ensure our third parties act with ethics and integrity on our behalf, even when we aren’t watching:

We want to ensure that the servers and other equipment in our supply chain are sourced responsibly, from manufacturers who respect human rights — free of forced or child labor, with environmental sustainability at the forefront.

We want to provide our products and services to customers based on the quality of Cloudflare, not because a third party reseller may bribe a customer to enter into an agreement.

We want to ensure there are no conflicts of interest with our third parties, that might give someone an unfair advantage.

As a government contractor, we want to ensure that we do not have telecommunications or video surveillance equipment, systems, or services from prohibited parties in our supply chain to protect national security interests.

Having a Third Party Code of Conduct is also industry standard. As Cloudflare garners an increasing number of Fortune 500 and other enterprise customers, we find ourselves reviewing and committing to their Third Party Codes of Conduct as well.

How it works

Our Third Party Code of Conduct is not meant to replace our terms of service or other contractual agreements. Rather, it is meant to supplement them, highlighting Cloudflare’s ethical commitments and encouraging our suppliers, resellers, and other partners to commit to the same. We will be cascading this new Code to all existing third parties, and include it at onboarding for all new third parties going forward. A violation of the Code, or any contractual agreements between Cloudflare and our third parties, may result in termination of the relationship.

This Third Party Code of Conduct is only one facet of Cloudflare’s third party due diligence program, and it complements the other work that Cloudflare does in this area. Cloudflare rigorously screens and vets our suppliers and partners at onboarding, and we continue to routinely monitor and audit them over time. We are always looking for ways to communicate with, educate, and learn from our third parties as well.

Join our mission

Are you a supplier, reseller or other partner who shares these values of ethics and integrity? Come work with us and join Cloudflare on its mission to help build a better, more ethical Internet.

The unintended consequences of blocking IP addresses

Post Syndicated from Alissa Starzak original https://blog.cloudflare.com/consequences-of-ip-blocking/

The unintended consequences of blocking IP addresses

The unintended consequences of blocking IP addresses

In late August 2022, Cloudflare’s customer support team began to receive complaints about sites on our network being down in Austria. Our team immediately went into action to try to identify the source of what looked from the outside like a partial Internet outage in Austria. We quickly realized that it was an issue with local Austrian Internet Service Providers.

But the service disruption wasn’t the result of a technical problem. As we later learned from media reports, what we were seeing was the result of a court order. Without any notice to Cloudflare, an Austrian court had ordered Austrian Internet Service Providers (ISPs) to block 11 of Cloudflare’s IP addresses.

In an attempt to block 14 websites that copyright holders argued were violating copyright, the court-ordered IP block rendered thousands of websites inaccessible to ordinary Internet users in Austria over a two-day period. What did the thousands of other sites do wrong? Nothing. They were a temporary casualty of the failure to build legal remedies and systems that reflect the Internet’s actual architecture.

Today, we are going to dive into a discussion of IP blocking: why we see it, what it is, what it does, who it affects, and why it’s such a problematic way to address content online.

Collateral effects, large and small

The craziest thing is that this type of blocking happens on a regular basis, all around the world. But unless that blocking happens at the scale of what happened in Austria, or someone decides to highlight it, it is typically invisible to the outside world. Even Cloudflare, with deep technical expertise and understanding about how blocking works, can’t routinely see when an IP address is blocked.

For Internet users, it’s even more opaque. They generally don’t know why they can’t connect to a particular website, where the connection problem is coming from, or how to address it. They simply know they cannot access the site they were trying to visit. And that can make it challenging to document when sites have become inaccessible because of IP address blocking.

Blocking practices are also wide-spread. In their Freedom on the Net report, Freedom House recently reported that 40 out of the 70 countries that they examined – which vary from countries like Russia, Iran and Egypt to Western democracies like the United Kingdom and Germany –  did some form of website blocking. Although the report doesn’t delve into exactly how those countries block, many of them use forms of IP blocking, with the same kind of potential effects for a partial Internet shutdown that we saw in Austria.

Although it can be challenging to assess the amount of collateral damage from IP blocking, we do have examples where organizations have attempted to quantify it. In conjunction with a case before the European Court of Human Rights, the European Information Society Institute, a Slovakia-based nonprofit, reviewed Russia’s regime for website blocking in 2017. Russia exclusively used IP addresses to block content. The European Information Society Institute concluded that IP blocking led to “collateral website blocking on a massive scale” and noted that as of June 28, 2017, “6,522,629 Internet resources had been blocked in Russia, of which 6,335,850 – or 97% – had been blocked collaterally, that is to say, without legal justification.”

In the UK, overbroad blocking prompted the non-profit Open Rights Group to create the website Blocked.org.uk. The website has a tool enabling users and site owners to report on overblocking and request that ISPs remove blocks. The group also has hundreds of individual stories about the effect of blocking on those whose websites were inappropriately blocked, from charities to small business owners. Although it’s not always clear what blocking methods are being used, the fact that the site is necessary at all conveys the amount of overblocking. Imagine a dressmaker, watchmaker or car dealer looking to advertise their services and potentially gain new customers with their website. That doesn’t work if local users can’t access the site.

One reaction might be, “Well, just make sure there are no restricted sites sharing an address with unrestricted sites.” But as we’ll discuss in more detail, this ignores the large difference between the number of possible domain names and the number of available IP addresses, and runs counter to the very technical specifications that empower the Internet. Moreover, the definitions of restricted and unrestricted differ across nations, communities, and organizations. Even if it were possible to know all the restrictions, the designs of the protocols — of the Internet, itself — mean that it is simply infeasible, if not impossible, to satisfy every agency’s constraints.

Overblocking websites is not only a problem for users; it has legal implications. Because of the effect it can have on ordinary citizens looking to exercise their rights online, government entities (both courts and regulatory bodies) have a legal obligation to make sure that their orders are necessary and proportionate, and don’t unnecessarily affect those who are not contributing to the harm.

It would be hard to imagine, for example, that a court in response to alleged wrongdoing would blindly issue a search warrant or an order based solely on a street address without caring if that address was for a single family home, a six-unit condo building, or a high rise with hundreds of separate units. But those sorts of practices with IP addresses appear to be rampant.

In 2020, the European Court of Human Rights (ECHR) – the court overseeing the implementation of the Council of Europe’s European Convention on Human Rights – considered a case involving a website that was blocked in Russia not because it had been targeted by the Russian government, but because it shared an IP address with a blocked website. The website owner brought suit over the block. The ECHR concluded that the indiscriminate blocking was impermissible, ruling that the block on the lawful content of the site “amounts to arbitrary interference with the rights of owners of such websites.” In other words, the ECHR ruled that it was improper for a government to issue orders that resulted in the blocking of sites that were not targeted.

Using Internet infrastructure to address content challenges

Ordinary Internet users don’t think a lot about how the content they are trying to access online is delivered to them. They assume that when they type a domain name into their browser, the content will automatically pop up. And if it doesn’t, they tend to assume the website itself is having problems unless their entire Internet connection seems to be broken. But those basic assumptions ignore the reality that connections to a website are often used to limit access to content online.

Why do countries block connections to websites? Maybe they want to limit their own citizens from accessing what they believe to be illegal content – like online gambling or explicit material – that is permissible elsewhere in the world. Maybe they want to prevent the viewing of a foreign news source that they believe to be primarily disinformation. Or maybe they want to support copyright holders seeking to block access to a website to limit viewing of content that they believe infringes their intellectual property.

To be clear, blocking access is not the same thing as removing content from the Internet. There are a variety of legal obligations and authorities designed to permit actual removal of illegal content. Indeed, the legal expectation in many countries is that blocking is a matter of last resort, after attempts have been made to remove content at the source.

Blocking just prevents certain viewers – those whose Internet access depends on the ISP that is doing the blocking – from being able to access websites. The site itself continues to exist online and is accessible by everyone else. But when the content originates from a different place and can’t be easily removed, a country may see blocking as their best or only approach.

We recognize the concerns that sometimes drive countries to implement blocking. But fundamentally, we believe it’s important for users to know when the websites they are trying to access have been blocked, and, to the extent possible, who has blocked them from view and why. And it’s critical that any restrictions on content should be as limited as possible to address the harm, to avoid infringing on the rights of others.

Brute force IP address blocking doesn’t allow for those things. It’s fully opaque to Internet users. The practice has unintended, unavoidable consequences on other content. And the very fabric of the Internet means that there is no good way to identify what other websites might be affected either before or during an IP block.

To understand what happened in Austria and what happens in many other countries around the world that seek to block content with the bluntness of IP addresses, we have to understand what is going on behind the scenes. That means diving into some technical details.

Identity is attached to names, never addresses

Before we even get started describing the technical realities of blocking, it’s important to stress that the first and best option to deal with content is at the source. A website owner or hosting provider has the option of removing content at a granular level, without having to take down an entire website. On the more technical side, a domain name registrar or registry can potentially withdraw a domain name, and therefore a website, from the Internet altogether.

But how do you block access to a website, if for whatever reason the content owner or content source is unable or unwilling to remove it from the Internet?  There are only three possible control points.

The first is via the Domain Name System (DNS), which translates domain names into IP addresses so that the site can be found. Instead of returning a valid IP address for a domain name, the DNS resolver could lie and respond with a code, NXDOMAIN, meaning that “there is no such name.” A better approach would be to use one of the honest error numbers standardized in 2020, including error 15 for blocked, error 16 for censored, 17 for filtered, or 18 for prohibited, although these are not widely used currently.

Interestingly, the precision and effectiveness of DNS as a control point depends on whether the DNS resolver is private or public. Private or ‘internal’ DNS resolvers are operated by ISPs and enterprise environments for their own known clients, which means that operators can be precise in applying content restrictions. By contrast, that level of precision is unavailable to open or public resolvers, not least because routing and addressing is global and ever-changing on the Internet map, and in stark contrast to addresses and routes on a fixed postal or street map. For example, private DNS resolvers may be able to block access to websites within specified geographic regions with at least some level of accuracy in a way that public DNS resolvers cannot, which becomes profoundly important given the disparate (and inconsistent) blocking regimes around the world.

The second approach is to block individual connection requests to a restricted domain name. When a user or client wants to visit a website, a connection is initiated from the client to a server name, i.e. the domain name. If a network or on-path device is able to observe the server name, then the connection can be terminated. Unlike DNS, there is no mechanism to communicate to the user that access to the server name was blocked, or why.

The third approach is to block access to an IP address where the domain name can be found. This is a bit like blocking the delivery of all mail to a physical address. Consider, for example, if that address is a skyscraper with its many unrelated and independent occupants. Halting delivery of mail to the address of the skyscraper causes collateral damage by invariably affecting all parties at that address. IP addresses work the same way.

Notably, the IP address is the only one of the three options that has no attachment to the domain name. The website domain name is not required for routing and delivery of data packets; in fact it is fully ignored. A website can be available on any IP address, or even on many IP addresses, simultaneously. And the set of IP addresses that a website is on can change at any time. The set of IP addresses cannot definitively be known by querying DNS, which has been able to return any valid address at any time for any reason, since 1995.

The idea that an address is representative of an identity is anathema to the Internet’s design, because the decoupling of address from name is deeply embedded in the Internet standards and protocols, as is explained next.

The Internet is a set of protocols, not a policy or perspective

Many people still incorrectly assume that an IP address represents a single website. We’ve previously stated that the association between names and addresses is understandable given that the earliest connected components of the Internet appeared as one computer, one interface, one address, and one name. This one-to-one association was an artifact of the ecosystem in which the Internet Protocol was deployed, and satisfied the needs of the time.

Despite the one-to-one naming practice of the early Internet, it has always been possible to assign more than one name to a server (or ‘host’). For example, a server was (and is still) often configured with names to reflect its service offerings such as mail.example.com and www.example.com, but these shared a base domain name.  There were few reasons to have completely different domain names until the need to colocate completely different websites onto a single server. That practice was made easier in 1997 by the Host header in HTTP/1.1, a feature preserved by the SNI field in a TLS extension in 2003.

Throughout these changes, the Internet Protocol and, separately, the DNS protocol, have not only kept pace, but have remained fundamentally unchanged. They are the very reason that the Internet has been able to scale and evolve, because they are about addresses, reachability, and arbitrary name to IP address relationships.

The designs of IP and DNS are also entirely independent, which only reinforces that names are separate from addresses. A closer inspection of the protocols’ design elements illuminates the misperceptions of policies that lead to today’s common practice of controlling access to content by blocking IP addresses.

By design, IP is for reachability and nothing else

Much like large public civil engineering projects rely on building codes and best practice, the Internet is built using a set of open standards and specifications informed by experience and agreed by international consensus. The Internet standards that connect hardware and applications are published by the Internet Engineering Task Force (IETF) in the form of “Requests for Comment” or RFCs — so named not to suggest incompleteness, but to reflect that standards must be able to evolve with knowledge and experience. The IETF and its RFCs are cemented in the very fabric of communications, for example, with the first RFC 1 published in 1969. The Internet Protocol (IP) specification reached RFC status in 1981.

Alongside the standards organizations, the Internet’s success has been helped by a core idea known as the end-to-end (e2e) principle, codified also in 1981, based on years of trial and error experience. The end-to-end principle is a powerful abstraction that, despite taking many forms, manifests a core notion of the Internet Protocol specification: the network’s only responsibility is to establish reachability, and every other possible feature has a cost or a risk.

The idea of “reachability” in the Internet Protocol is also enshrined in the design of IP addresses themselves. Looking at the Internet Protocol specification, RFC 791, the following excerpt from Section 2.3 is explicit about IP addresses having no association with names, interfaces, or anything else.

Addressing

    A distinction is made between names, addresses, and routes [4].   A
    name indicates what we seek.  An address indicates where it is.  A
    route indicates how to get there.  The internet protocol deals
    primarily with addresses.  It is the task of higher level (i.e.,
    host-to-host or application) protocols to make the mapping from
    names to addresses.   The internet module maps internet addresses to
    local net addresses.  It is the task of lower level (i.e., local net
    or gateways) procedures to make the mapping from local net addresses
    to routes.
                            [ RFC 791, 1981 ]

Just like postal addresses for skyscrapers in the physical world, IP addresses are no more than street addresses written on a piece of paper. And just like a street address on paper, one can never be confident about the entities or organizations that exist behind an IP address. In a network like Cloudflare’s, any single IP address represents thousands of servers, and can have even more websites and services — in some cases numbering into the millions — expressly because the Internet Protocol is designed to enable it.

Here’s an interesting question: could we, or any content service provider, ensure that every IP address matches to one and only one name? The answer is an unequivocal no, and here too, because of a protocol design — in this case, DNS.

The number of names in DNS always exceeds the available addresses

A one-to-one relationship between names and addresses is impossible given the Internet specifications for the same reasons that it is infeasible in the physical world. Ignore for a moment that people and organizations can change addresses. Fundamentally, the number of people and organizations on the planet exceeds the number of postal addresses. We not only want, but need for the Internet to accommodate more names than addresses.

The difference in magnitude between names and addresses is also codified in the specifications. IPv4 addresses are 32 bits, and IPv6 addresses are 128 bits. The size of a domain name that can be queried by DNS is as many as 253 octets, or 2,024 bits (from Section 2.3.4 in RFC 1035, published 1987). The table below helps to put those differences into perspective:

The unintended consequences of blocking IP addresses

On November 15, 2022, the United Nations announced the population of the Earth surpassed eight billion people. Intuitively, we know that there cannot be anywhere near as many postal addresses. The difference between the number of possible names on the planet, and similarly on the Internet, does and must exceed the number of available addresses.

The proof is in the pudding names!

Now that those two relevant principles about IP addresses and DNS names in the international standards are understood – that IP address and domain names serve distinct purposes and there is no one to one relationship between the two – an examination of a recent case of content blocking using IP addresses can help to see the reasons it is problematic. Take, for example, the IP blocking incident in Austria late August 2022. The goal was to restrict access to 14 target domains, by blocking 11 IP addresses (source: RTR.Telekom. Post via the Internet Archive) — the mismatch between those two numbers should have been a warning flag that IP blocking might not have the desired effect.

Analogies and international standards may explain the reasons that IP blocking should be avoided, but we can see the scale of the problem by looking at Internet-scale data. To better understand and explain the severity of IP blocking, we decided to generate a global view of domain names and IP addresses (thanks are due to a PhD research intern, Sudheesh Singanamalla, for the effort). In September 2022, we used the authoritative zone files for the top-level domains (TLDs) .com, .net, .info, and .org, together with top-1M website lists, to find a total of 255,315,270 unique names. We then queried DNS from each of five regions and recorded the set of IP addresses returned. The table below summarizes our findings:

The unintended consequences of blocking IP addresses

The table above makes clear that it takes no more than 10.7 million addresses to reach 255,315,270 million names from any region on the planet, and the total set of IP addresses for those names from everywhere is about 16 million — the ratio of names to IP addresses is nearly 24x in Europe and 16x globally.

There is one more worthwhile detail about the numbers above: The IP addresses are the combined totals of both IPv4 and IPv6 addresses, meaning that far fewer addresses are needed to reach all 255M websites.

We’ve also inspected the data a few different ways to find some interesting observations. For example, the figure below shows the cumulative distribution (CDF) of the proportion of websites that can be visited with each additional IP address. On the y-axis is the proportion of websites that can be reached given some number of IP addresses. On the x-axis, the 16M IP addresses are ranked from the most domains on the left, to the least domains on the right. Note that any IP address in this set is a response from DNS and so it must have at least one domain name, but the highest numbers of domains on IP addresses in the set number are in the 8-digit millions.

The unintended consequences of blocking IP addresses

By looking at the CDF there are a few eye-watering observations:

  • Fewer than 10 IP addresses are needed to reach 20% of, or approximately 51 million, domains in the set;
  • 100 IPs are enough to reach almost 50% of domains;
  • 1000 IPs are enough to reach 60% of domains;
  • 10,000 IPs are enough to reach 80%, or about 204 million, domains.

In fact, from the total set of 16 million addresses, fewer than half, 7.1M (43.7%), of the addresses in the dataset had one name. On this ‘one’ point we must be additionally clear: we are unable to ascertain if there was only one and no other names on those addresses because there are many more domain names than those contained only in .com, .org, .info., and .net — there might very well be other names on those addresses.

In addition to having a number of domains on a single IP address, any IP address may change over time for any of those domains.  Changing IP addresses periodically can be helpful with certain security, performance, and to improve reliability for websites. One common example in use by many operations is load balancing. This means DNS queries may return different IP addresses over time, or in different places, for the same websites. This is a further, and separate, reason why blocking based on IP addresses will not serve its intended purpose over time.

Ultimately, there is no reliable way to know the number of domains on an IP address without inspecting all names in the DNS, from every location on the planet, at every moment in time — an entirely infeasible proposition.

Any action on an IP address must, by the very definitions of the protocols that rule and empower the Internet, be expected to have collateral effects.

Lack of transparency with IP blocking

So if we have to expect that the blocking of an IP address will have collateral effects, and it’s generally agreed that it’s inappropriate or even legally impermissible to overblock by blocking IP addresses that have multiple domains on them, why does it still happen? That’s hard to know for sure, so we can only speculate. Sometimes it reflects a lack of technical understanding about the possible effects, particularly from entities like judges who are not technologists. Sometimes governments just ignore the collateral damage – as they do with Internet shutdowns – because they see the blocking as in their interest. And when there is collateral damage, it’s not usually obvious to the outside world, so there can be very little external pressure to have it addressed.

It’s worth stressing that point. When an IP is blocked, a user just sees a failed connection. They don’t know why the connection failed, or who caused it to fail. On the other side, the server acting on behalf of the website doesn’t even know it’s been blocked until it starts getting complaints about the fact that it is unavailable. There is virtually no transparency or accountability for the overblocking. And it can be challenging, if not impossible, for a website owner to challenge a block or seek redress for being inappropriately blocked.

Some governments, including Austria, do publish active block lists, which is an important step for transparency. But for all the reasons we’ve discussed, publishing an IP address does not reveal all the sites that may have been blocked unintentionally. And it doesn’t give those affected a means to challenge the overblocking. Again, in the physical world example, it’s hard to imagine a court order on a skyscraper that wouldn’t be posted on the door, but we often seem to jump over such due process and notice requirements in virtual space.

We think talking about the problematic consequences of IP blocking is more important than ever as an increasing number of countries push to block content online. Unfortunately, ISPs often use IP blocks to implement those requirements. It may be that the ISP is newer or less robust than larger counterparts, but larger ISPs engage in the practice, too, and understandably so because IP blocking takes the least effort and is readily available in most equipment.

And as more and more domains are included on the same number of IP addresses, the problem is only going to get worse.

Next steps

So what can we do?

We believe the first step is to improve transparency around the use of IP blocking. Although we’re not aware of any comprehensive way to document the collateral damage caused by IP blocking, we believe there are steps we can take to expand awareness of the practice. We are committed to working on new initiatives that highlight those insights, as we’ve done with the Cloudflare Radar Outage Center.

We also recognize that this is a whole Internet problem, and therefore has to be part of a broader effort. The significant likelihood that blocking by IP address will result in restricting access to a whole series of unrelated (and untargeted) domains should make it a non-starter for everyone. That’s why we’re engaging with civil society partners and like-minded companies to lend their voices to challenge the use of blocking IP addresses as a way of addressing content challenges and to point out collateral damage when they see it.

To be clear, to address the challenges of illegal content online, countries need legal mechanisms that enable the removal or restriction of content in a rights-respecting way. We believe that addressing the content at the source is almost always the best and the required first step. Laws like the EU’s new Digital Services Act or the Digital Millennium Copyright Act provide tools that can be used to address illegal content at the source, while respecting important due process principles. Governments should focus on building and applying legal mechanisms in ways that least affect other people’s rights, consistent with human rights expectations.

Very simply, these needs cannot be met by blocking IP addresses.

We’ll continue to look for new ways to talk about network activity and disruption, particularly when it results in unnecessary limitations on access. Check out Cloudflare Radar for more insights about what we see online.

The Montgomery, Alabama Internet Exchange is making the Internet faster. We’re happy to be there.

Post Syndicated from Mike Conlow original https://blog.cloudflare.com/montgomery-alabama-ix/

The Montgomery, Alabama Internet Exchange is making the Internet faster. We’re happy to be there.

The Montgomery, Alabama Internet Exchange is making the Internet faster. We’re happy to be there.

Part of the magic of the Internet is in tens of thousands of networks connecting to each other all across the world in an effort to share information more efficiently. Cloudflare is a member of 279 Internet Exchanges (IX for short), but today we want to highlight one such dot on the global Internet map: the Montgomery, Alabama Internet Exchange, called MGMix. Thanks to the hard work of local leaders and the participation of dozens of networks (including Cloudflare), the Internet in Alabama works better today than it did before the IX launched.

Understanding IXs

Before we talk more about Alabama in particular, let’s take a step back to understand the critical role that Internet Exchanges play in our global Internet. In a simple model of exchanging Internet traffic, one person is on their laptop and requests content on a website, uses a video conferencing application, or wants to securely connect to their workplace from home. The person, or “client” in technical terms, is generally using a traditional Internet Service Provider, who they pay to access everything on the Internet. On the other hand, whatever the user is trying to reach – the website, API endpoint, or security service – or “server” in technical terms, is usually on a different network. How the data gets from the client’s network to the server’s network is not something Internet users think much about, but at Cloudflare, we think about it a lot.

One way that a network can reach another network is by paying a 3rd party network to deliver the traffic. This is called “transit” and it’s an appealing option because it’s simple. One “Tier 1” transit provider can reach the entire Internet. Of course, the tradeoff is that convenience comes at a cost – networks pay transit providers based on the quantity of traffic passed over the connection.

At the other end, larger networks often connect directly with what are called Private Network Interconnections (PNI). If one network is consistently sending large volumes of traffic to another network, it will be less expensive to use a PNI than to send the traffic over a transit provider. In this case, the two networks string a fiber cable across the ceiling of a data center where both networks have a presence, from one network’s cage to the other’s.

The Montgomery, Alabama Internet Exchange is making the Internet faster. We’re happy to be there.

Right in the Goldilocks zone between transit providers and PNIs are Internet Exchanges. An IX brings networks together in one place, and lets them freely exchange traffic. Sometimes they’re literally called “meeting rooms”. Once a network joins an IX, they might be able to reach hundreds of other networks without incurring 3rd party transit fees. Thriving IX communities are a power-up for the Internet: they reduce the cost of delivering Internet traffic, incentivizing more networks to join, while making the Internet faster through better interconnection.

Montgomery Internet Exchange (MGMix)

Back to Alabama. Unfortunately, Alabama, and the “Deep South” in general, has some of the worst performing Internet in the country. In Alabama, 15% of locations don’t have access to home Internet with download throughput of 25 Mbps and 3 Mbps upload according to the latest FCC data. In Mississippi, it’s 20%. The national average is 7%. In terms of latency, which is how we measure the speed of the Internet, the Deep South is also well above average.

50th percentile TCP Connect Time (ms) to Major Content Delivery Networks

The Montgomery, Alabama Internet Exchange is making the Internet faster. We’re happy to be there.

One of the reasons for the poor performance is that requests for content often travel to Atlanta, Dallas, or other Internet hubs even farther away before coming all the way back to the user in Alabama or Mississippi. That’s why an IX in Montgomery is so exciting: if networks can exchange traffic in Montgomery, the data doesn’t need to travel as far, and the Internet will be faster.

A few years ago, local leaders in Montgomery started to build up the Montgomery Internet Exchange (MGMix). With the support of the mayor, and the help of city staff, and a cooperative that included the city, county, state, and a nearby Air Force base, they launched the IX in 2016.  Later they formed a technical committee and upgraded to 100 Gbps of capacity.

With a donated switch from Packet Clearing House, MGMix estimated their initial costs at $1,000 per month for data center space and connection to the Internet. At their core, an IX is just a Layer 2 switch where all the networks plug in and advertise their presence to each other. That’s not to say it’s easy. One of the hardest parts is the work to attract networks.

IX’s have a hard chicken-and-egg problem. The first network at an IX doesn’t have anyone to exchange traffic with. Conversely, once there are a lot of networks at an IX, it becomes easy to attract new ones. Additionally, networks like Cloudflare need certain types of networks – transits – to be present. In almost all cases, Cloudflare doesn’t actually host the website or service an Internet user is trying to reach; we protect them, but aren’t the original source. To get content from the original source, we need access to transit networks. The City of Montgomery did the hard work of building up the IX network by network.

MGMix now has a who’s-who of the Internet in Alabama as members. Some are ISPs like Charter, Wide Open West, Uniti Fiber, and Troy Cablevision. Some are big institutions like the State of Alabama, Alabama State University, the City of Montgomery. And still others are the providers of content and services, like Cloudflare, Meta, and Akamai.

From Cloudflare’s perspective, it was an easy decision to join MGMix. We followed the development closely, and joined soon after it opened. After all, it means better Internet performance for a group of southern states that have been historically underserved. Now that it’s established, it’s essentially maintenance-free. It’s set-it-and-forget-it for better Internet performance.

Below is a chart of our traffic through MGMix over the course of November. We see daily spikes in traffic outbound from Cloudflare to other networks that are members of the IX. Interestingly, the traffic is lower from the 20th of November through the 27th of November which is the week of Thanksgiving in the US. It looks like Internet users in Alabama were enjoying a restful week with their families and not using the Internet (as much as usual).

The Montgomery, Alabama Internet Exchange is making the Internet faster. We’re happy to be there.

It has apparently been going so well that MGMix just announced they’re expanding to Auburn, Alabama.

Steven Reed, the current mayor of Montgomery, said of the expansion: “This is a step forward to achieving digital equity across the region, benefiting individuals who live in underserved rural communities. By extending our network fabric to a datacenter in Auburn, the MGMix will improve the efficiency and resiliency of the Internet for the Montgomery area, colleges and businesses along the I-85 corridor, and the entire River Region.

We couldn’t have said it better. IXs are a critical part of a strong Internet interconnection ecosystem. We’re proud members of the MGMix, and will continue to join IXs globally where we can reach Internet users more efficiently and effectively.

Cloudflare expands Project Pangea to connect and protect (even) more community networks

Post Syndicated from Ben Ritter original https://blog.cloudflare.com/project-pangea-expansion/

Cloudflare expands Project Pangea to connect and protect (even) more community networks

Cloudflare expands Project Pangea to connect and protect (even) more community networks

In July 2021, Cloudflare announced Project Pangea to help underserved community networks get access to the Internet for free. Today, as part of Impact Week, we’re excited to expand this program to support even more communities by relaxing the technical requirements to participate.

Previously, in order to be eligible for Project Pangea, participants would need to bring at least a /24 block of IP space for Cloudflare to advertise on their behalf (referred to as “Bring Your Own IP”). But everyone should have secure, fast, and reliable access to the Internet, without being gated by costly network resources like IPv4 space. Starting now, participants no longer need to bring a /24 in order to access Pangea services: Internet connectivity, DDoS protection, network firewalling, traffic acceleration, and more, are available for free for eligible networks.

How is Project Pangea helping community networks?

The Internet Society, or ISOC, describes community networks as “when people come together to build and maintain the necessary infrastructure for Internet connection.” Most often, community networks emerge from need, and in response to the lack or absence of available Internet connectivity.

Cloudflare’s global network, which spans more than 275 cities across the world, provides us with the unique opportunity to help community networks of all shapes and sizes. Cloudflare offers community networks secure, fast, and reliable Internet access through Magic Transit, and frees up time for community network operators by mitigating malicious traffic. This empowers operators to focus more on managing the last mile connections to network users.

By placing a community network behind Cloudflare with Magic Transit, those networks are automatically protected against Distributed Denial of Service attacks which often overwhelm network and security devices, or undersized Internet connections. Beyond mitigating DDoS attacks, Cloudflare also offers Magic Firewall through Project Pangea. Magic Firewall is a firewall as a service, and enables operators to remove physical firewalls and still enforce network level firewall rules. Implementing Magic Firewall in place of a physical firewall removes a single point of failure, and another device which needs to be upgraded during a maintenance window.

As community networks grow to support more users, the bandwidth required and the exposure to attack traffic also grows. One challenge with growing a network and providing security is that on premise firewalls need to be replaced or upgraded when they hit specific bandwidth limitations. The security appliance is often an expensive bottleneck to upgrade, preventing networks from helping more users. One unique benefit to using Cloudflare for network connectivity is that unlike an on premise network firewall, operators never need to upgrade Cloudflare. Incoming traffic is distributed across hundreds of locations, allowing Cloudflare to provide security services, and block attacks across the whole Cloudflare network.

Cloudflare expands Project Pangea to connect and protect (even) more community networks
One of several possible deployment models Pangea participants can use to get connected

Pangea participant highlight: Ayva Networks

Ayva Networks is a not-for-profit Wireless Internet Service Provider that provides backbone and Internet services to approximately 400 households in the rural mountain areas west of Boulder, Colorado. In 2023, they will grow their network to provide more gigabit network access. Nick Wilson from Ayva Networks explains that “reliable Internet in our community isn’t a privilege, it’s an essential utility, and often provides the only means of communication for many homes in our region as cellular service is generally rare.

After connecting through Magic Transit, Nick shared “speeds are noticeably better on Magic Transit, especially for those who work with cloud resources” and that “our firewalls deal with a lot less background noise” due to all the attack traffic mitigated by Cloudflare.

Colorado’s environment can be pretty extreme, and present many challenges to running a Wireless Internet Service Provider. Ayva Networks responds to 100+ mph wind, massive hail, blizzards, flooding, insects, lightning, and fire. By using Magic Transit, Ayva Networks is better able “to engineer traffic flows much more granularly than we otherwise are able to with BGP alone, and has become an essential tool for us in mitigating and responding to outages.

What have we learned since launching Project Pangea?

We’ve been privileged to help a lot of great organizations like Ayva Networks connect more people to the Internet. Many community networks are passion projects, and are run by volunteers who want to make a difference in their community. Volunteers often only have limited time to contribute, and this has emphasized how simple we need to make it for organizations of any size to get up and running behind Cloudflare.

Another challenge we did not foresee is that many community networks do not have their own network IP address space. IP addresses are needed by all computers to communicate on the Internet. Until today, Magic Transit and Magic Firewall required that community networks provide their own IP addresses. We recently extended Magic Transit to support customers without their own IP address space with Magic Transit with Cloudflare IPs, and we’re excited to bring this functionality to community networks via Project Pangea.

How can my community network get involved?

Check out our landing page to learn more and apply for Project Pangea today.

The US government is working on an “Internet for all” plan. We’re on board.

Post Syndicated from Mike Conlow original https://blog.cloudflare.com/internet-for-all-us/

The US government is working on an “Internet for all” plan. We’re on board.

The US government is working on an “Internet for all” plan. We’re on board.

Recently, the United States Department of Commerce announced that all 50 states and every eligible territory had signed on to the “Internet for All” initiative. Internet for All is the US government’s $65 billion initiative to close the Digital Divide once and for all through new broadband deployment and digital equity programs. Cloudflare is on a mission to help build a better Internet, and we support initiatives like this because we want more people using the Internet on high-throughput, low-latency, resilient and affordable Internet connections. It’s been written often since the start of the pandemic because it’s true: it isn’t acceptable that students need to go to a Taco Bell parking lot to do their homework, and a good Internet connection is increasingly important for doing adult jobs as well.

The Internet for All initiative is the result of $65 billion in broadband-related funding appropriated by the US Congress as part of the Infrastructure Investment and Jobs Act (IIJA). It’s been called a “once in a generation” funding opportunity, and compared with the Rural Electrification Act which brought power lines to rural America in the 1930s. The components of the broadband portion of the Infrastructure bill are:

  • \$42.5 billion for broadband deployment – new wires and wireless radios in places that don’t have them – called the Broadband Equity, Access, and Deployment Program (BEAD).
  • \$14.2 billion to make permanent a $30 per month subsidy for low-income families to purchase a home Internet subscription.
  • \$2.75 billion to establish a grant program that will improve digital equity, which means teaching Americans how to make the most of the Internet and their home connection.
  • \$2 billion for new connectivity on tribal lands.
  • \$1 billion to establish new “middle-mile” capacity, which will connect rural communities to the Internet “backbone”.

The US should be applauded for making this kind of investment in broadband infrastructure. By appropriating federal funds, the government is able to ensure the money is used as it’s intended. For example, federal rules will require that areas with no infrastructure and disadvantaged urban areas will receive priority funding. Individual states will have the option of adding their own rules.

There’s significant work to do. According to the latest numbers from the Federal Communications Commission, 12% of Americans lack access to home broadband with throughput of at least 100 Mbps download and 20 Mbps upload.

There’s another way to think about access to broadband. A wire running near your house doesn’t do any good if the residents can’t afford it, or don’t know how to use the Internet. According to Pew Research, 23% of Americans say they don’t have an Internet connection at home. Those aren’t just rural areas without broadband infrastructure, it’s also urban areas where the connection is too expensive.

Cloudflare isn’t a disinterested observer. When Internet users don’t have access to good broadband, their experience with our services – the websites, APIs and security products we offer – won’t work as well as they should. In the map below, we use the Resource Timing API to measure the latency between Internet users and the major Content Delivery Networks (CDNs), including Cloudflare. We see rural and southern states have worse performance than the northeastern United States, with Hawaii and Alaska being off the charts in terms of their poor speed.

50th percentile TCP Connect Time (ms) to Major Content Delivery Networks

The US government is working on an “Internet for all” plan. We’re on board.
*Alaska and Hawaii have TCP Connect times of 263 and 160 respectively. 

Access technology, which is how Internet users connect to the Internet (cable, fiber, DSL, wireless, satellite), is one important part of the overall quality of their connection, but there are other, less talked about factors. Another factor is how close geographically the user is to the content and services they are accessing. Midwestern states where requests for data need to travel to Internet hubs in Chicago or Dallas are going to be slower than requests for data from Washington, DC, served by the giant Internet hub around Ashburn, Virginia. To be as close as possible to users geographically, Cloudflare has servers in 51 locations across 28 states in the US, and is still growing.

Programs that provide funding for deployment are one piece of the puzzle, but there are important non-financial initiatives as well. For example, the IIJA directed the Federal Communications Commission to come up with “broadband nutrition labels” that will be shown to consumers at the point of purchase for any Internet service. Just a few weeks ago, the FCC announced their implementation. Cloudflare filed comments with the FCC with our suggestions for how to make these labels informative, future-proof, and easy for consumers to understand. We also wrote about it here.

The US government is working on an “Internet for all” plan. We’re on board.

We’d be remiss to not also mention our own contribution to digital divide initiatives – Project Pangea. For community and non-profit networks that have invested in last-mile infrastructure but need a connection to the Internet – “transit” in industry terms – the network can connect to Cloudflare, and we’ll provide that Internet transit at no charge to the network. It’s one piece of the puzzle, and we’re always looking for additional ways to help.

One thing everyone can do is help the FCC build the most accurate broadband map possible by going to the map, entering your address, and verifying the data. The map will show your individual location and all ISPs that claim to serve your address. If there’s a problem – and there can be, it’s a new map and new process – you can file a challenge right from the FCC’s mapping site.

It’s laudable that the US government is stepping up with billions of dollars in funding for broadband networks and digital equity programs. In the shared project of helping build a better Internet, this is an important and big step.