Tag Archives: Data reliability

The Data Canary: How Netflix Validates Catalog Metadata

Post Syndicated from Netflix Technology Blog original https://medium.com/netflix-techblog/the-data-canary-how-netflix-validates-catalog-metadata-18b699d58e36

By Celina Amados

At Netflix, our catalog metadata is crucial to our member experience, and a single corrupted data state can impact millions of viewers immediately. To protect streaming reliability, we built an automated data canary system that validates data transformations using production traffic. This canary detects issues in under 10 minutes, and blocks bad data from reaching our members.
Intro

Catalog metadata is what makes Netflix functional. It defines what titles exist, where they’re available, whether they can be played, and more. This data gets transformed and distributed across our vast infrastructure near-continuously, powering everything that helps members find what they want to watch. Accurate catalog data delivers moments of joy. Corrupted catalog data breaks streaming.

What Went Wrong

A production incident revealed a critical gap in our resilience strategy. No code had been deployed. No configuration had changed. But, a manual mitigation action taken during a previous incident had inadvertently corrupted a data feed, rendering it empty for a subset of titles.

The impact was immediate: missing metadata prevented manifest generation, causing failures in our catalog service and playback issues.

Engineers were alerted immediately, but identifying the root cause took time. After intense triaging, responders pinpointed the corrupted data feed and pinned services back to a known-good state, restoring playback.

The problem? Our sophisticated code canary deployments had caught nothing. No code had changed — the data had.

This incident exposed a fundamental gap in our resiliency capabilities: we can validate code deployments, but we had no equivalent for our high-velocity data pipelines. Our catalog metadata, consisting of titles, artwork, availability, and more, was continuously transformed from multiple upstream sources and published at a regular cadence. Each upstream source had its own validation, but these checks didn’t catch corruption in the final transformed output.

We needed to treat data deployments with the same rigor as code deployments.

The Challenge: Validating Data at Short Intervals

Our catalog metadata service operates as a high-velocity data pipeline: it processes multiple input feeds, transforms them, and publishes the final catalog state that gets distributed across our infrastructure.

This creates unique validation challenges that our traditional canary analysis tools aren’t designed to handle:

Time Constraints: Our existing canary analysis tools require 30–60 minutes to reach statistical confidence. We had a much shorter window between data cycles; we needed to detect issues, make a decision, and block publishing all within a single cycle.

Emergent Issues: While each upstream data source has independent validation, problems often only manifest in the final transformed state. We needed to validate the actual output that clients would consume, not just the inputs, as close to the clients as possible.

Production Traffic is Essential: We initially considered shadow traffic, but quickly realized it was insufficient. Shadow traffic can only replay requests to our catalog metadata service; it can’t simulate the entire playback lifecycle across multiple services and domains. To detect real customer impact, we needed real production traffic.

Limit Blast Radius: Despite using production traffic for validation, we couldn’t allow customers to experience widespread issues during the validation process. Any regression needed to be detected and contained immediately.

Our Solution: The Data Canary Orchestrator Pattern

After evaluating several architectural approaches, we developed a solution built around three key innovations:

1. Dedicated Orchestrator Pattern

We created a dedicated cluster for the purposes of canarying new catalog metadata that separates concerns, avoids self-testing, and provides a pattern for extensibility. Here’s how it works:

Orchestrator Instance: A dedicated orchestrator instance of our catalog metadata service coordinates the data canary flow. When a new catalog version is published to the canary environment, the orchestrator validates that both baseline and canary clusters are healthy and version-synchronized, then triggers a chaos experiment.

Permanent Baseline & Canary Clusters: Two dedicated service clusters run continuously in our canary region. The baseline cluster always serves the latest production catalog version, while the canary cluster receives new versions for validation.

Generic Integration Point: Upon chaos experiment completion, the orchestrator reports results back to the transformer service via a REST endpoint. This generic interface means new data sources can implement their own orchestrator patterns without requiring transformer code changes.

This pattern can now be adopted by other teams at Netflix for validating different data sources, which is exactly the kind of extensibility we designed for.
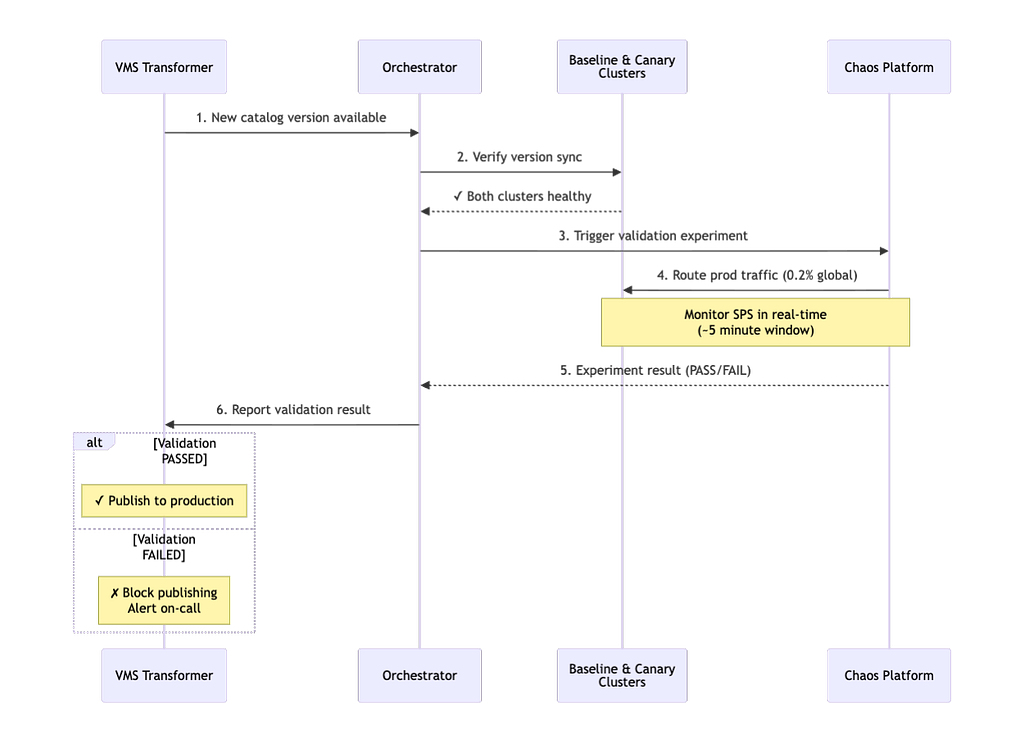
Data Canary workflow

2. Utilizing and Extending our Chaos Platform

Meeting the 10-minute constraint required not only leaning on our chaos platform, but also extending it to meet our needs:

Custom Threshold Tuning: We worked with our Resilience team to customize experiment thresholds for our use case. Standard chaos experiment thresholds were too conservative for our time constraints.

Multi-Tenant Testing: Our catalog service supports multiple client types with different traffic patterns and downstream dependencies. We ran separate experiments for major client types and discovered that running traffic through the tenant that handles playback requests consistently identified failures fastest.

Sticky Canaries: To isolate experiment traffic, sticky canaries use session affinity to guarantee that once a user’s traffic is routed to the baseline or canary clusters, it stays there for the duration of the experiment window. This prevents cross-contamination from concurrent chaos experiments, ensuring a clean apples-to-apples comparison between data versions.

Behavioral Metrics Over Technical Metrics: We focused on Starts Per Second (SPS), or actual customer playback attempts, as our primary signal. SPS proved more reliable than latency or error rates for detecting catalog corruption because it directly measures customer impact, and data errors may not always manifest as application errors to our catalog metadata service.

Immediate Abort on Regression: Instead of collecting data for post-hoc analysis, we stream metrics in real-time and abort experiments the moment we detect regression. This trades some statistical confidence for speed, but our tight thresholds and clear signal make this not only acceptable, but necessary.

3. Production-Hardened Edge Case Handling

Building a system that runs in production every 10 minutes taught us that the devil is in the details:

In-Flight Experiments During Redeployment: When the orchestrator restarts, it must detect and continue polling any ongoing experiments, as we can’t abandon a validation cycle mid-flight.

Leader Election: During orchestrator deployments, multiple instances might be running simultaneously. We implemented safeguards to ensure only one experiment is triggered per version announcement.

Version Synchronization: In a multi-tenant service where different clients consume data at different cadences, we track version state to ensure baseline and canary clusters are properly aligned before triggering experiments.

Validating the Validator: Controlled Failure Injection

To prove the system worked, we needed to break things on purpose. We ran a series of controlled experiments where we deliberately corrupted catalog data — denylisting high-profile titles and simulating real data corruption scenarios — to validate that the canary could detect issues and block publication.

These experiments were coordinated as proactive incidents during business hours, with product operations teams on standby. We routed approximately 0.2% of global traffic through the validation flow, minimizing blast radius while still generating meaningful signal.

Key Results:

  • Detection Speed: Issues identified in 2.5–4 minutes depending on client type
  • Clear Signal: 10x error differential between canary and baseline
  • Automatic Blocking: Publishing workflow blocked as designed when regressions detected

The experiments validated our end-to-end workflow and revealed important operational insights: different client traffic patterns detect failures at different speeds, and threshold tuning requires careful refinement based on the magnitude of impact we want this system to detect. Most importantly, they proved that even with a 10-minute validation window, far shorter than traditional 30–60 minute canary analysis, we had sufficient signal to catch high-impact catalog corruption.

Bringing Code Validation Principles to Data

This effort wasn’t just about building a validation system, it was about recognizing that data deployments deserve the same rigor as code deployments. Just because something isn’t a binary doesn’t mean it can’t break production. The patterns we landed on aren’t specific to catalog metadata, and can be applied to systems with high-velocity data pipelines more broadly.

If you’re working with data that changes frequently and impacts customers directly, ask yourself:

  • What’s your MTTD for data corruption?
  • Can you validate with production traffic safely?
  • How would you detect emergent issues in transformed data?
  • What behavioral metric most closely indicates customer impact in your domain?

Today, the failure mode that caused the aforementioned incident would be caught and mitigated in under 10 minutes. We all know outages aren’t a question of if, but when. The next time you find yourself faced with bad data, how fast will you be able to respond?

Acknowledgments

This work was a collaborative effort across multiple teams at Netflix. Special thanks to Jongyoon Lee, David Su, and Zubeen Lalani of the Catalog Foundations & Distribution team for their contributions to the design, and to Ales Plsek of the Resilience team for their support in customizing our chaos platform for our unique use case.


The Data Canary: How Netflix Validates Catalog Metadata was originally published in Netflix TechBlog on Medium, where people are continuing the conversation by highlighting and responding to this story.
Improving Hugo stability and addressing oncall challenges through automation

Post Syndicated from Grab Tech original https://engineering.grab.com/improving-hugo-stability

Introduction

Hugo plays a pivotal role in enabling data ingestion for Grab’s data lake, managing over 4,000 pipelines onboarded by users. The stability of Hugo pipelines is contingent upon the health of both the data sources and various Hugo components. Given the complexity of this system, pipeline failures occasionally occur, necessitating user intervention when retry mechanisms prove insufficient. These incidents present challenges such as:

  • Limited user visibility into pipeline issues.
  • Uncertainty about resolution steps due to extensive documentation.
  • An overwhelmed Hugo on-call team dealing with ad-hoc requests and growing infrastructure dependencies.
  • Raised Data Production Issues (DPIs) lacking clear Root Cause Analysis (RCA), hindering effective management.

Such challenges ultimately increase data downtime due to prolonged issue triage and resolution times.

To address these problems, we conducted a thorough analysis of failure modes and the efforts required to resolve them. Based on our findings, we propose a comprehensive automation solution.

This blog outlines the architecture and implementation of our proposed solution, consisting of modules like Signal, Diagnosis, RCA Table, Auto-resolution, Data Health API, and Data Health WorkBench, each with a specific function to enhance Hugo’s monitoring, diagnosis, and resolution capabilities.

The blog further details the impact of these automated features, such as enhanced data visibility, reduced on-call workload, and concludes with our next steps, which focus on advancing auto-resolution strategies, enriching the Data Health Workbench, and broadening diagnostics to include more infrastructure components, like Flink, for comprehensive coverage.

Architecture details

We designed the solution based on these principles:

  1. Identify different failure modes based on past issues and analysis from first principles.
  2. Analyse temporal relationships of pipeline execution steps to diagnose issues to failure modes.
  3. Focus on auto-resolution, and add additional features to cover gaps which can’t be immediately addressed by auto-resolution or diagnosis.

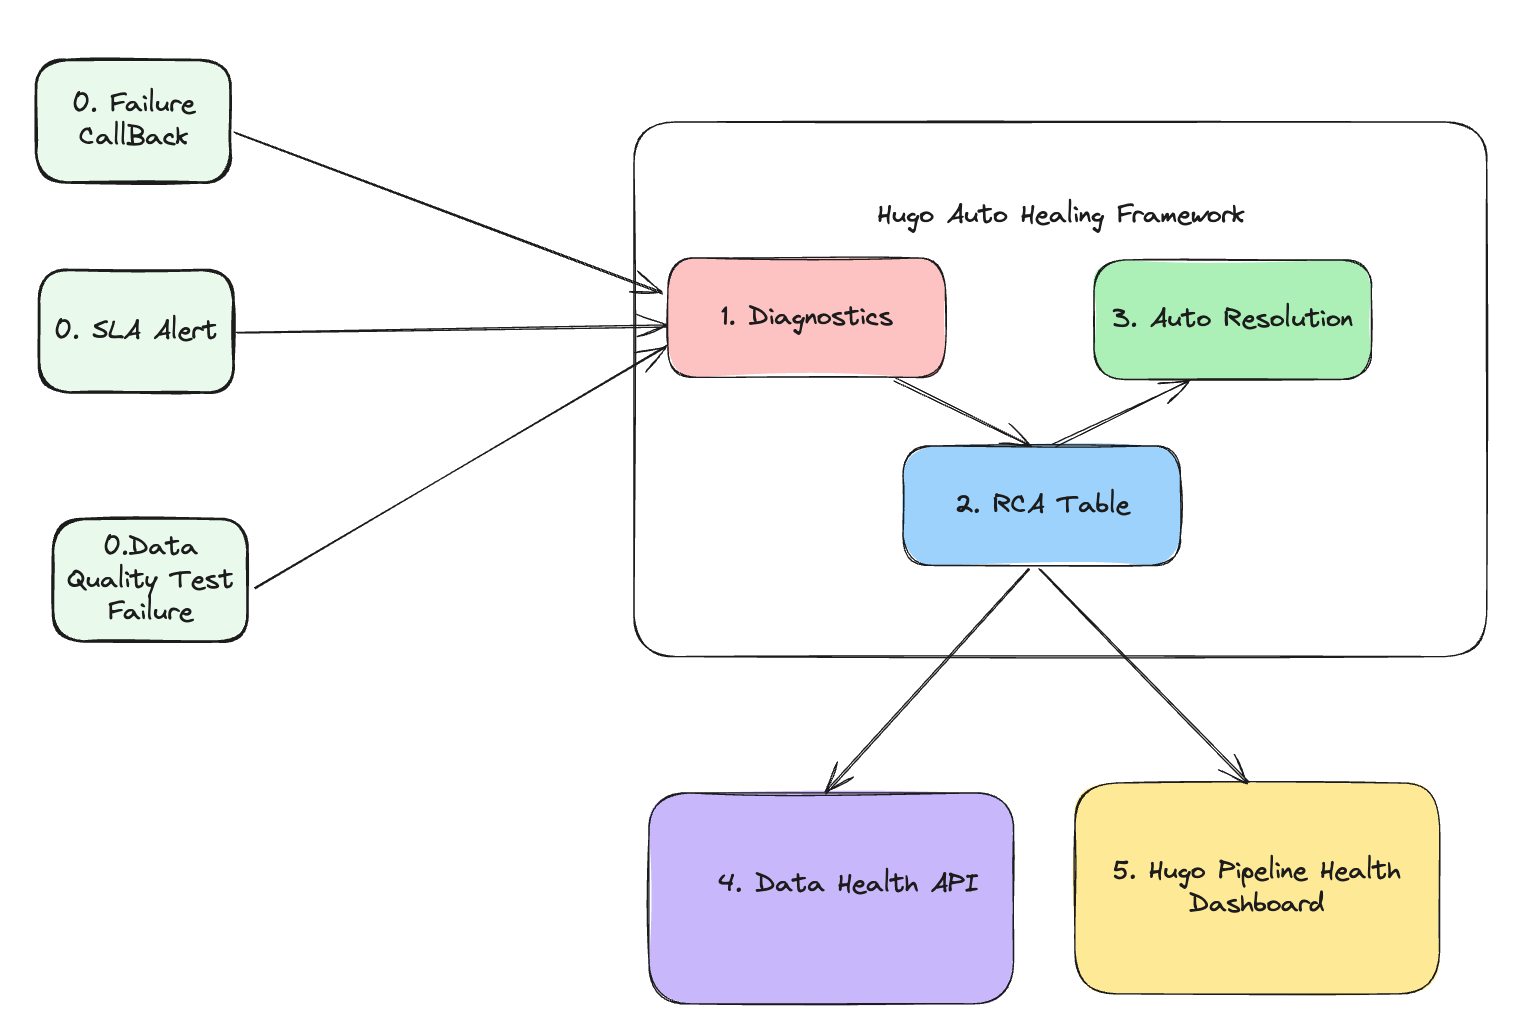
The following diagram shows the solution we proposed.

Figure 1. Architecture

The architecture consists of five core modules, each with a specific function:

  1. Signal module: This module is responsible for collecting signals. It gathers three different types of signals that collectively define the health status of the data lake table. The signals include:
    • Failure callback signal: This indicates whether the pipeline runs involving this data lake table are successful or not.
    • SLA alert signal: This indicates whether the pipeline execution involving this data lake table meets the Service Level Agreement (SLA). For an hourly batch job, the expectation is to complete within one hour.
    • Data quality test failure signal: This represents various types of completeness checks to ensure that data lake tables are consistent with the source tables based on their pipeline strategies.
  2. Diagnosis module: This is the core module responsible for diagnosing the root cause of 3 types of failures collected in the Signal module. It determines:
    • The root cause of the failure.
    • The assignee responsible for fixing the error.
    • The auto-resolution method to fix the issue.
    • Manual resolution steps if the auto-resolution fails.
  3. RCA table: This module stores the following information:
    • Signals
    • Assignee information
    • Diagnosis results
    • Auto-resolution methods
    • Manual resolution steps
  4. Auto-resolution module: This module executes the auto-resolution methods to resolve issues automatically.
  5. Data health API: This module provides API access to other platforms. External platforms or pipelines that rely on Hugo onboarded tables can subscribe to the health status and investigate the root cause when a table is deemed unhealthy.
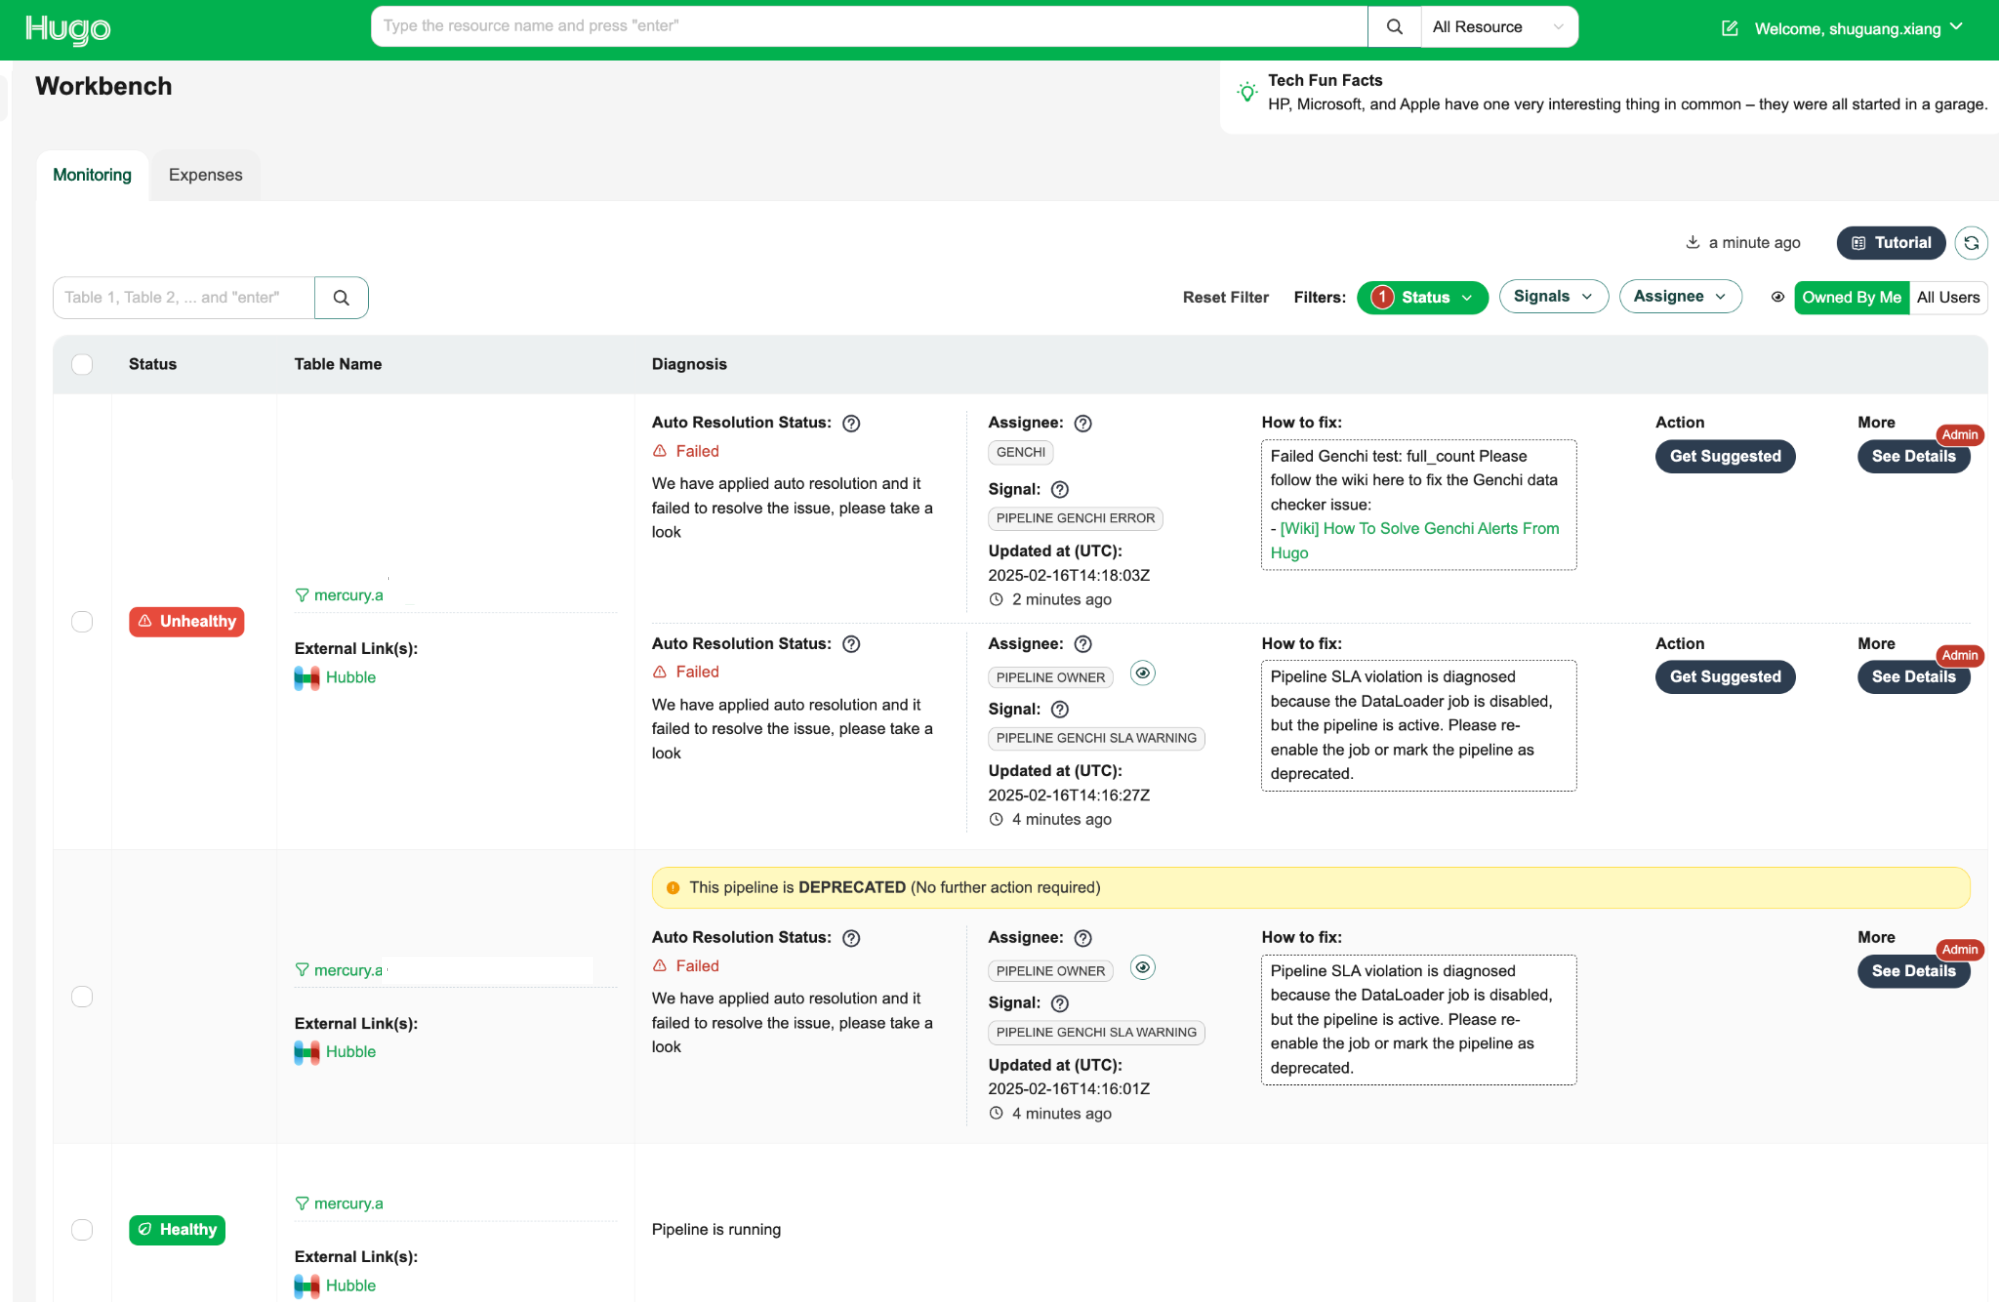
  6. Hugo pipeline health dashboard: A centralised dashboard for Hugo users to visualise the health status of tables, auto resolution status, and manual fix button.

By leveraging these modules, the architecture ensures robust monitoring, diagnosis, and resolution of issues, leading to improved data health and operational efficiency.

Implementation

Signal module

There are two methods for generating these three signals. The failure signal is generated through an airflow callback, while the SLA miss and data completeness test signals are produced by Genchi. Genchi is a data quality observability platform at Grab that performs data quality checks and acts as a crucial enabler for the enforcement of data contracts.

Diagnosis module

As soon as an alert is created, the diagnosis begins. To avoid lengthy diagnosis times, Hugo has developed an innovative approach that eliminates the requirement for parsing extensive logs, such as Spark executor logs or Airflow logs. Instead, it gathers signals transmitted by the computation engine or Grab’s internal platforms.

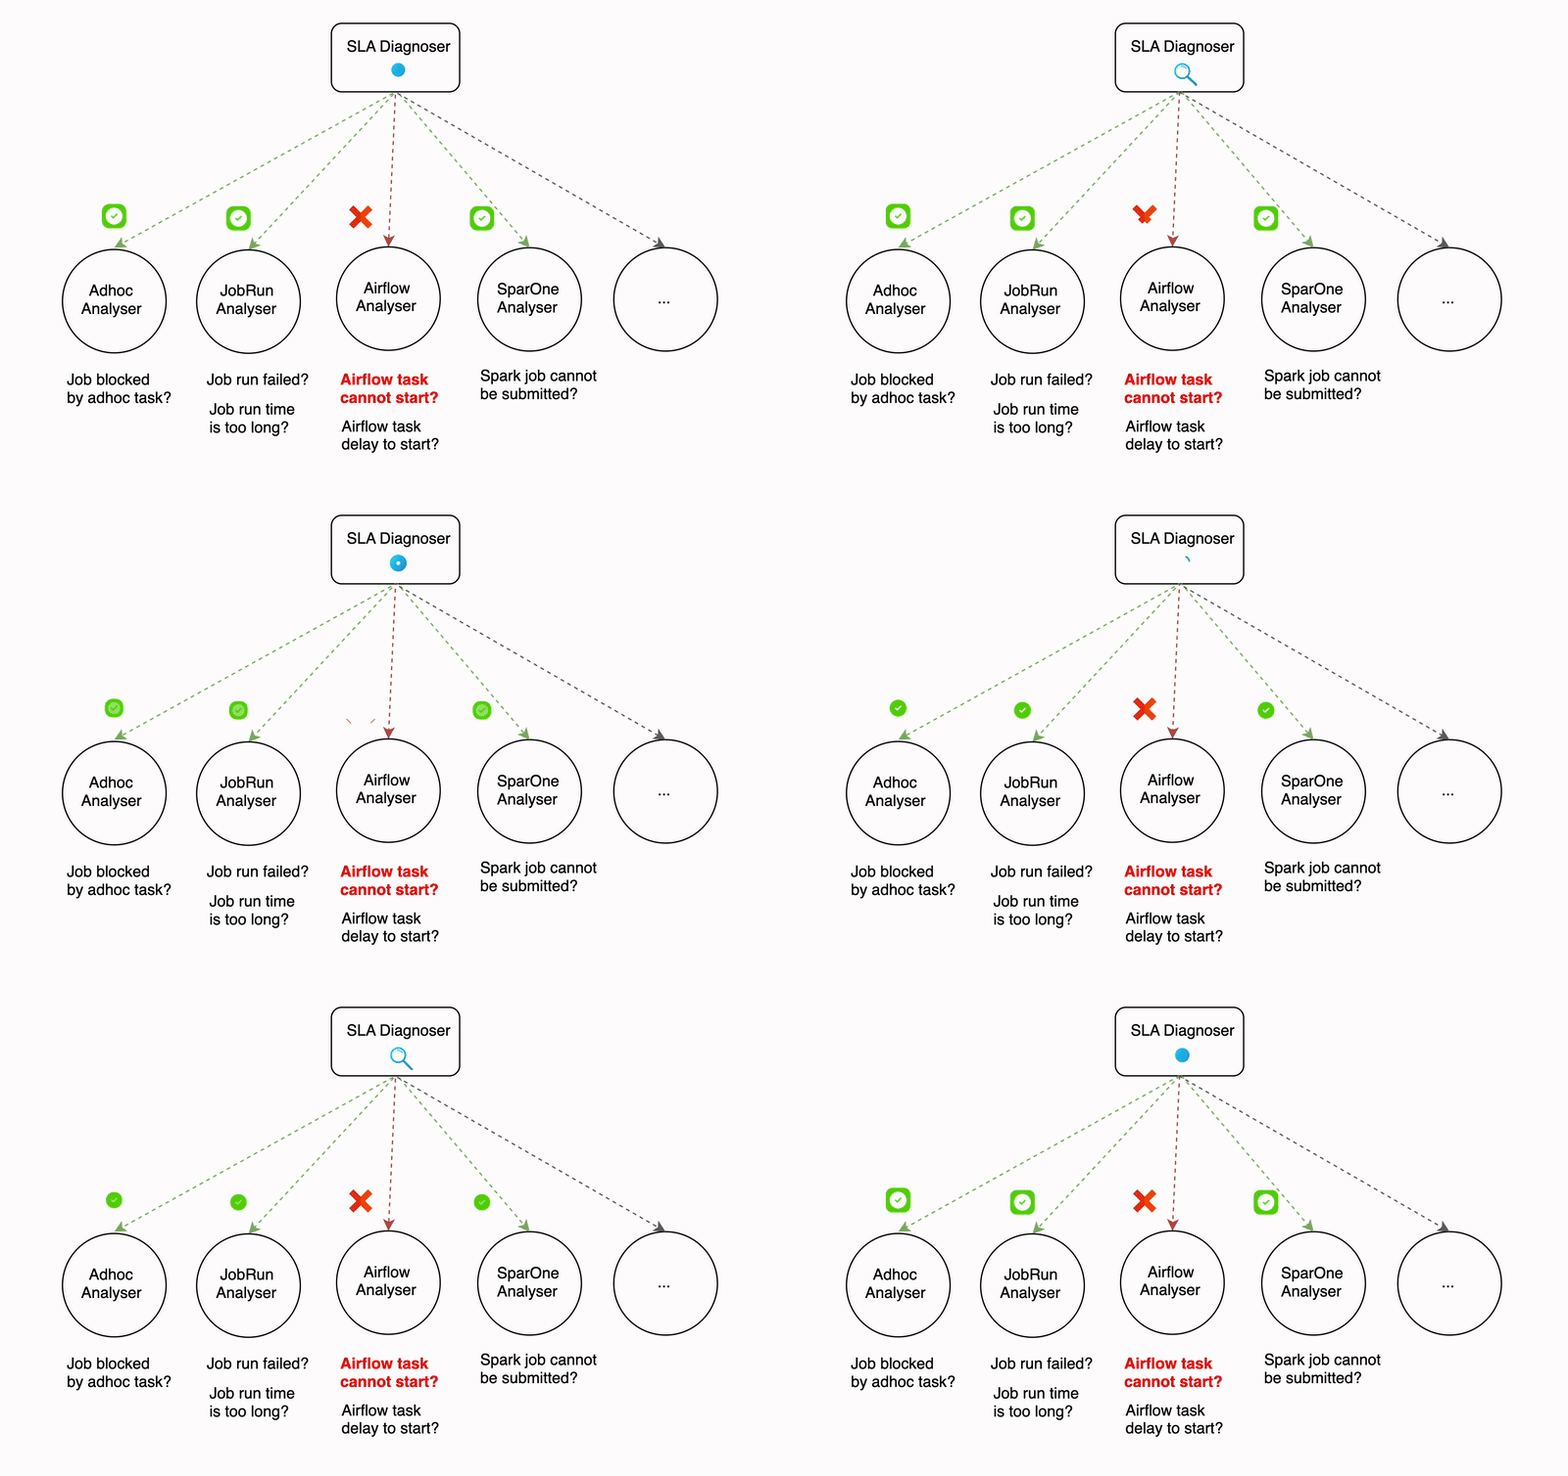
The diagnosis process can be time-consuming, even with efforts to reduce the time it takes. For example, the SLA diagnoser uses multiple analysers that run sequentially, and some of these analysers (like the Airflow analyser) make API calls that can take a significant amount of time. The more analysers that are involved in the diagnosis process, the longer it can take.

Figure 2. Diagnosis process

Parallelism in diagnosis serves as a solution to lower the overall latency when there is a surge in error traffic. The degree of parallelism differs based on the type of signal. For example, the failure signal diagnosis can be executed in thousands of processes at once, while for SLA miss and data quality test failures signals, the parallelism is determined by the number of partitions in the Kafka topic since these signals are received from Kafka.

Auto-resolution module

Auto-resolution is a flexible framework that enables the implementation of custom handlers for various types of failures. One of the common handlers employs a retry mechanism with backoff for transient errors. For instance, if Hugo receives a failure callback indicating that the root cause is a database replica lag, it would wait for an hour before re-triggering the job. This auto-resolution process runs asynchronously with the diagnosis process.

Data health API

The data health information includes a unique identifier, current status, error details, and the time of the last health check, providing a comprehensive snapshot of the dataset’s health.

Hugo converts the detailed information available in its internal data health API to the data health API specification format to be consumed by Kinabalu, our internal system designed to automate and streamline incident management processes by integrating with multiple systems such as Slack, Jira, Splunk on-call, and Datadog.

Hugo pipeline health dashboard

The Data Health Workbench is a centralised dashboard for Hugo users to visualise the health status of tables, auto-resolution status, and manual fix buttons. It provides a comprehensive view of data health and facilitates efficient issue resolution.

The key features are as follows:

  1. Health status visualisation: Displays the current health status of tables, making it easy to identify unhealthy tables.
  2. Assignee information: Indicates the assignee responsible for fixing the issue, ensuring clear accountability.
  3. How-to-fix guide: Provides step-by-step instructions on how to resolve the issue, empowering users to take immediate action.
  4. Action: Offers an action button to initiate the resolution process with a single click, streamlining issue resolution.
  5. Admin feature with detailed diagnosis information: Provides admins supplementary information, including the reasoning behind the root cause identification and assignee determination, which allows for a deeper understanding of the root cause of issues.

By leveraging the Data Health Workbench, Hugo users can efficiently monitor and manage data health, ensuring data integrity and operational efficiency.

Figure 3. Data Health Workbench

Impact

The implementation of Hugo’s auto-healing and diagnosis features has resulted in significant improvements in stability and operational efficiency for our data pipelines. Here are some key outcomes:

  • Enhanced data visibility: We’ve improved the visibility into the health of datasets, allowing for quick identification of issues and more informed decision-making.
  • Timely resolution of data issues: With automated diagnostic and resolution processes, we ensure that data issues are addressed promptly, minimising data downtime and enhancing overall data availability.
  • Reduced on-call workload: By automating many of the common failure resolutions, the workload on Hugo on-call teams has been significantly reduced. This allows teams to focus on more complex and impactful tasks.
  • Scalable solution for managing complexity: The auto-resolution framework is well-equipped to handle the increasing complexity of data infrastructure, offering scalable solutions for transient errors through custom handlers and retry mechanisms.
  • Improved data contract management: By providing detailed pipeline health information via the Data Health API, we enable precise and accurate DPIs, complete with root cause analysis and assignee information, enhancing the management and resolution of data contract breaches.
  • Valuable reference for other platforms: The insights and methodologies developed through this initiative provide a valuable reference for other platform teams at Grab looking to implement similar automation and diagnostic capabilities.
  • Support for Grab’s success: These enhancements support Grabbers by ensuring easy access to the datasets they need and contribute to the overall success of Grab through reliable data availability.

Next steps

Our next steps involve advancing auto-resolution strategies by focusing on complex solutions like pipeline runtime optimisation to boost efficiency and minimise processing delays. We will enrich the Data Health Workbench with detailed information, enabling users to visualise and understand pipeline health more effectively and make informed corrective actions. Additionally, we plan to broaden our diagnosis capabilities by integrating more infrastructure components, such as Flink health information, to ensure a comprehensive and holistic monitoring approach for all engines within Hugo.

Join us

Grab is a leading superapp in Southeast Asia, operating across the deliveries, mobility and digital financial services sectors. Serving over 800 cities in eight Southeast Asian countries, Grab enables millions of people everyday to order food or groceries, send packages, hail a ride or taxi, pay for online purchases or access services such as lending and insurance, all through a single app. Grab was founded in 2012 with the mission to drive Southeast Asia forward by creating economic empowerment for everyone. Grab strives to serve a triple bottom line – we aim to simultaneously deliver financial performance for our shareholders and have a positive social impact, which includes economic empowerment for millions of people in the region, while mitigating our environmental footprint.

Powered by technology and driven by heart, our mission is to drive Southeast Asia forward by creating economic empowerment for everyone. If this mission speaks to you, join our team today!

Ensuring data reliability and observability in risk systems

Post Syndicated from Grab Tech original https://engineering.grab.com/data-observability

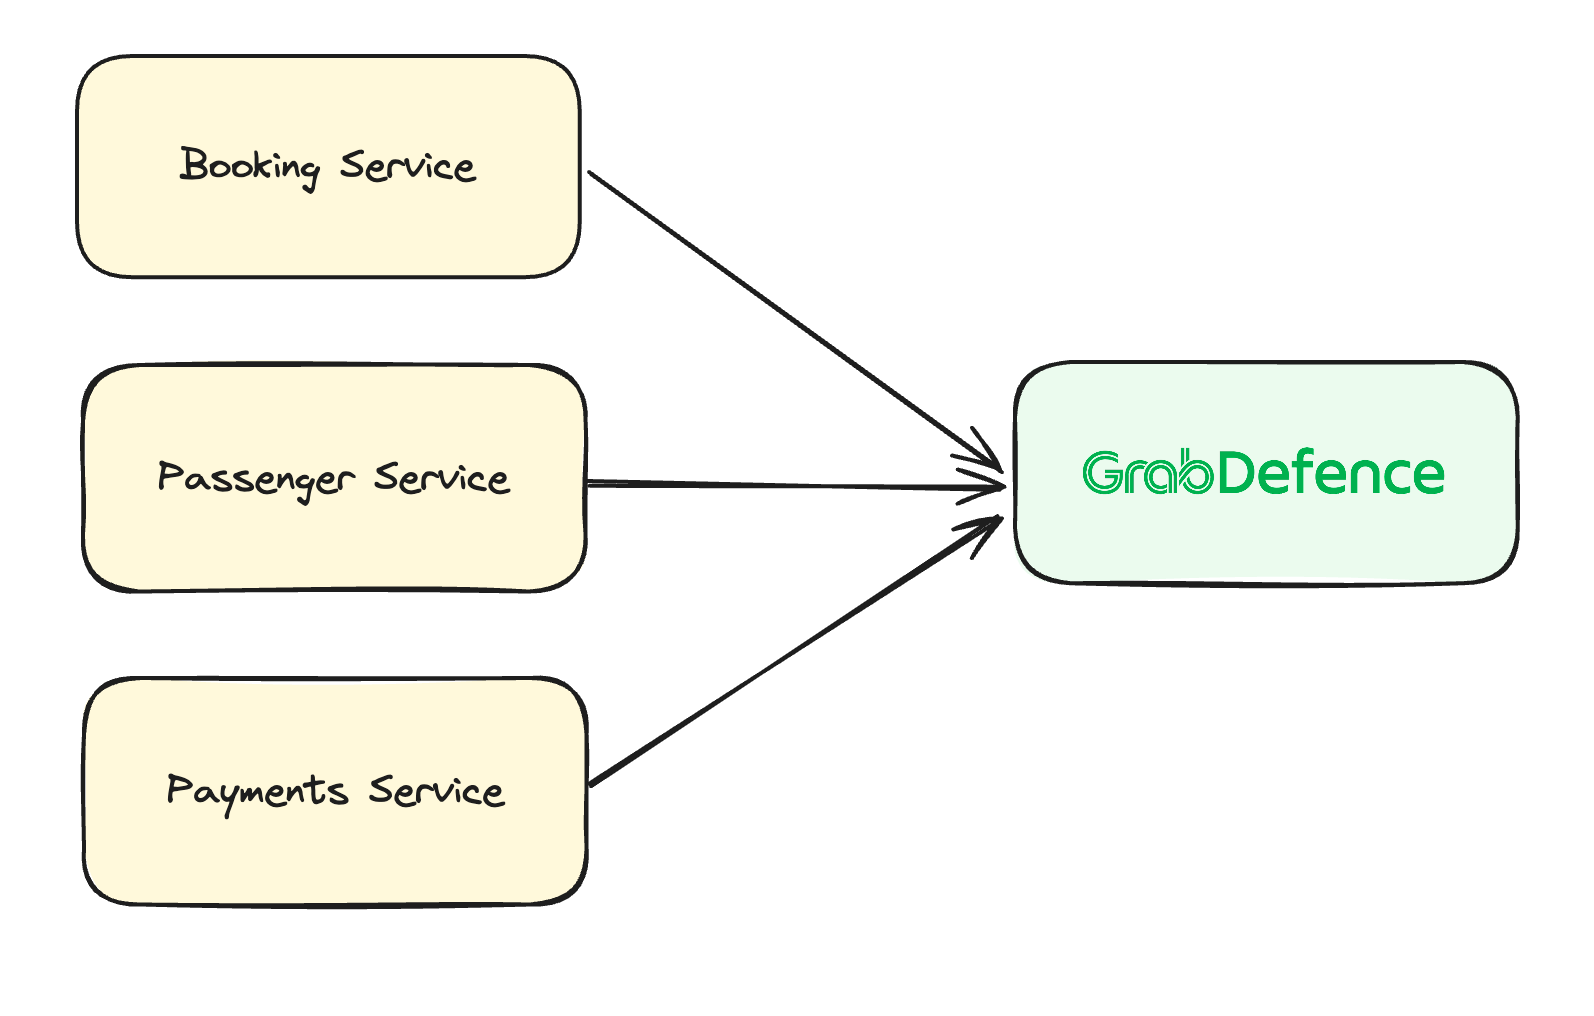
Grab has an in-house Risk Management platform called GrabDefence which relies on ingesting large amounts of data gathered from upstream services to power our heuristic risk rules and data science models in real time.

Fig 1. GrabDefence aggregates data from different upstream services

As Grab’s business grows, so does the amount of data. It becomes imperative that the data which fuels our risk systems is of reliable quality as any data discrepancy or missing data could impact fraud detection and prevention capabilities.

We need to quickly detect any data anomalies, which is where data observability comes in.

Data observability as a solution

Data observability is a type of data operation (DataOps; similar to DevOps) where teams build visibility over the health and quality of their data pipelines. This enables teams to be notified of data quality issues, and allows teams to investigate and resolve these issues faster.

We needed a solution that addresses the following issues:

  1. Alerts for any data quality issues as soon as possible – so this means the observability tool had to work in real time.
  2. With hundreds of data points to observe, we needed a neat and scalable solution which allows users to quickly pinpoint which data points were having issues.
  3. A consistent way to compare, analyse, and compute data that might have different formats.

Hence, we decided to use Flink to standardise data transformations, compute, and observe data trends quickly (in real time) and scalably.

Flink SQL is a powerful, flexible tool for performing real-time analytics on streaming data. It allows users to query continuous data streams using standard SQL syntax, enabling complex event processing and data transformation within the Apache Flink ecosystem, which is particularly useful for scenarios requiring low-latency insights and decisions.

In Grab, data comes from multiple sources and while most of the data is in JSON format, the actual JSON structure differs between services. Because of JSON’s nested and dynamic data structure, it is difficult to consistently analyse the data – posing a significant challenge for real-time analysis.

To help address this issue, Apache Flink SQL has the capability to manage such intricacies with ease. It offers specialised functions tailored for parsing and querying JSON data, ensuring efficient processing.

Another standout feature of Flink SQL is the use of custom table functions, such as JSONEXPLOAD, which serves to deconstruct and flatten nested JSON structures into tabular rows. This transformation is crucial as it enables subsequent aggregation operations. By implementing a 5-minute tumbling window, Flink SQL can easily aggregate these now-flattened data streams. This technique is pivotal for monitoring, observing, and analysing data patterns and metrics in near real-time.

Now that data is aggregated by Flink for easy analysis, we still needed a way to incorporate comprehensive monitoring so that teams could be notified of any data anomalies or discrepancies in real time.

How we interfaced the output with Datadog 

Datadog is the observability tool of choice in Grab, with many teams using Datadog for their service reliability observations and alerts. By aggregating data from Apache Flink and integrating it with Datadog, we can harness the synergy of real-time analytics and comprehensive monitoring. Flink excels in processing and aggregating data streams, which, when pushed to Datadog, can be further analysed and visualised. Datadog also provides seamless integration with collaboration tools like Slack, which enables teams to receive instant notifications and alerts.

With Datadog’s out-of-the-box features such as anomaly detection, teams can identify and be alerted to unusual patterns or outliers in their data streams. Taking a proactive approach to monitoring is crucial in maintaining system health and performance as teams can be alerted, then collaborate quickly to diagnose and address anomalies.

This integrated pipeline—from Flink’s real-time data aggregation to Datadog’s monitoring and Slack’s communication capabilities—creates a robust framework for real-time data operations. It ensures that any potential issues are quickly traced and brought to the team’s attention, facilitating a rapid response. Such an ecosystem empowers organisations to maintain high levels of system reliability and performance, ultimately enhancing the overall user experience.

Organising monitors and alerts using out-of-the-box solutions from Datadog

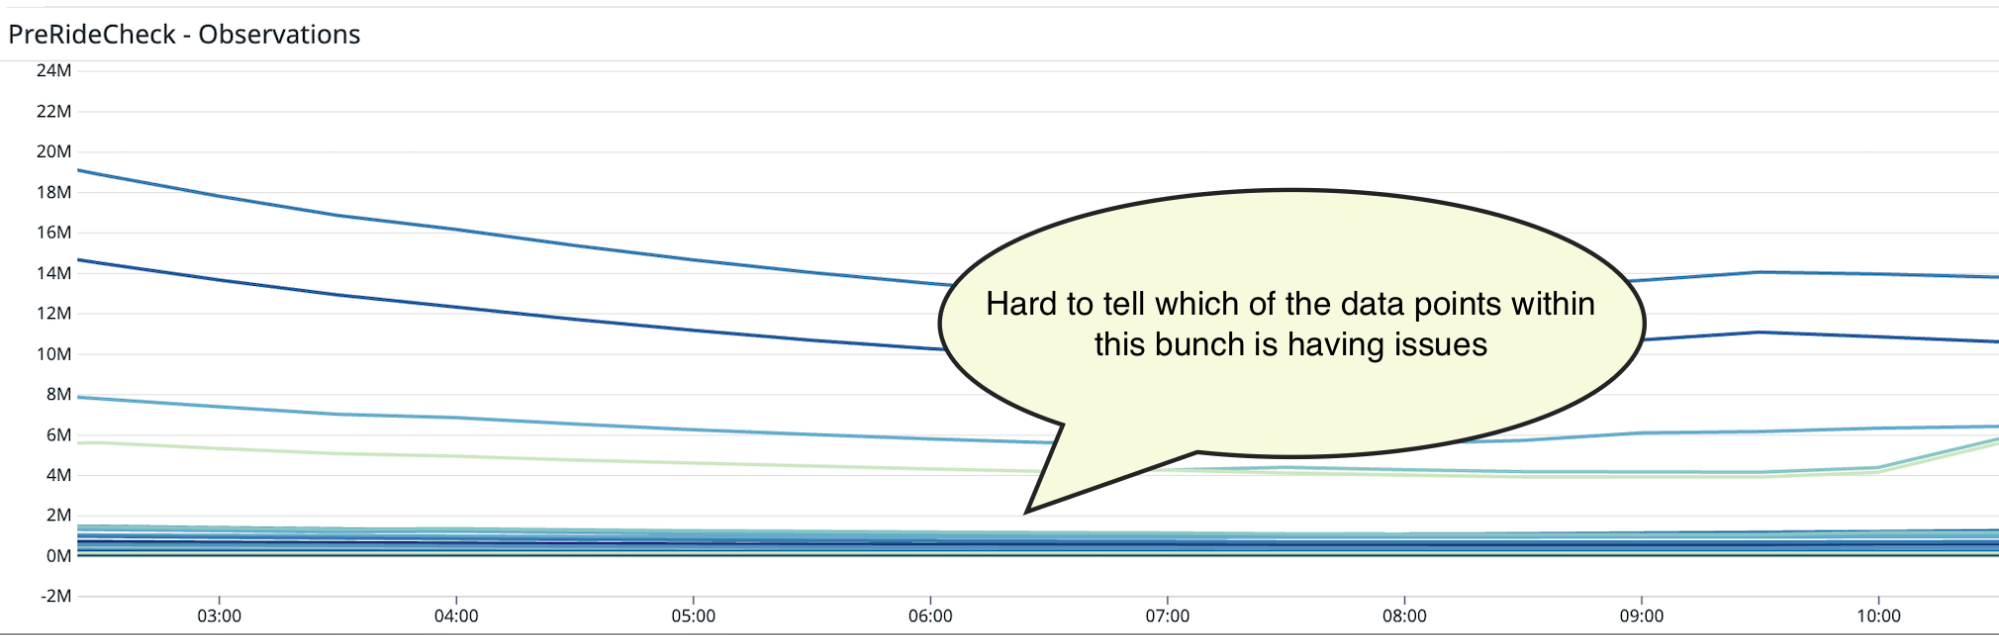
Once we integrated Flink data into Datadog, we realised that it could become unwieldy to try to identify the data point with issues from hundreds of other counters.

Fig 2. Hundreds of data points on a graph make it hard to decipher which ones have issues

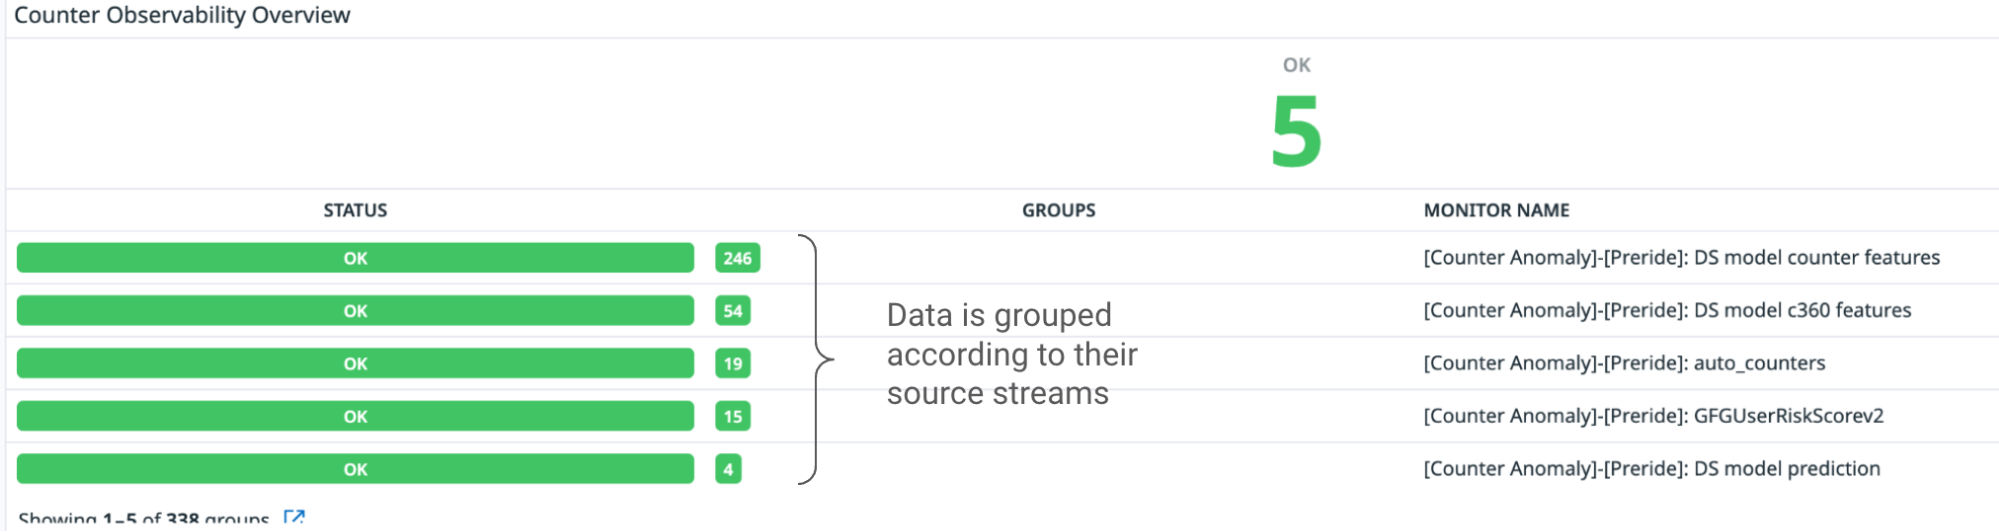
We decided to organise the counters according to the service stream it was coming from, and create individual monitors for each service stream. We used Datadog’s Monitor Summary tool to help visualise the total number of service streams we are reading from and the number of underlying data points within each stream.  

Fig 3. Data is grouped according to their source stream

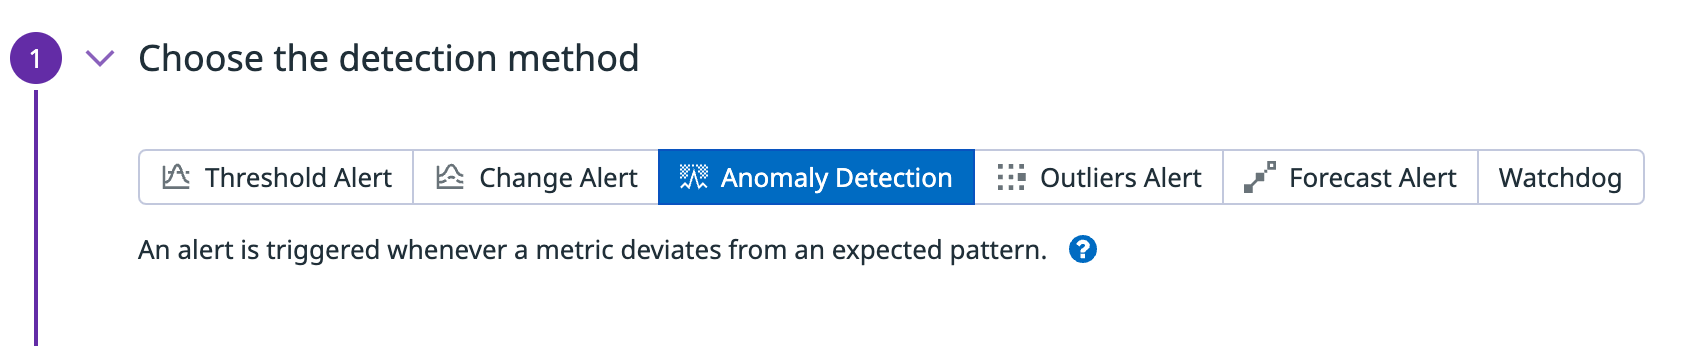
Within each individual stream, we used Datadog’s Anomaly Detection feature to create an alert whenever a data point from the stream exceeds a predefined threshold. This can be configured by the service teams on Datadog.

Fig 4. Datadog’s built-in Anomaly Detection function triggers alerts whenever a data point exceeds a threshold

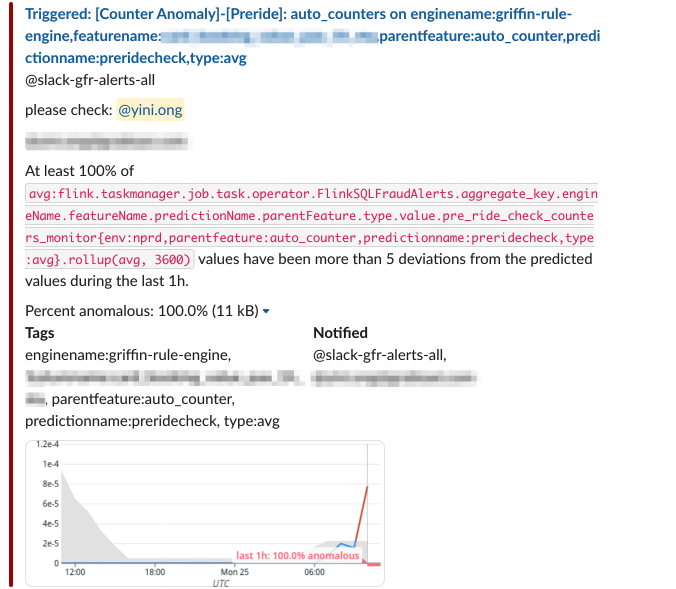
These alerts are then sent to a Slack channel where the Data team is informed when a data point of interest starts throwing anomalous values.

Fig 5. Datadog integration with Slack to help alert users

Impact

Since the deployment of this data observability tool, we have seen significant improvement in the detection of anomalous values. If there are any anomalies or issues, we now get alerts within the same day (or hour) instead of days to weeks later.

Organising the alerts according to source streams have also helped simplify the monitoring load and allows users to quickly narrow down and identify which pipeline has failed.

What’s next?

At the moment, this data observability tool is only implemented on selected checkpoints in GrabDefence. We plan to expand the observability tool’s coverage to include more checkpoints, and continue to refine the workflows to detect and resolve these data issues.

Join us

Grab is the leading superapp platform in Southeast Asia, providing everyday services that matter to consumers. More than just a ride-hailing and food delivery app, Grab offers a wide range of on-demand services in the region, including mobility, food, package and grocery delivery services, mobile payments, and financial services across 428 cities in eight countries.

Powered by technology and driven by heart, our mission is to drive Southeast Asia forward by creating economic empowerment for everyone. If this mission speaks to you, join our team today!