Tag Archives: incident response

Incident response guide for AWS CloudTrail investigations – Part 2

Post Syndicated from Oscar Diaz original https://aws.amazon.com/blogs/security/incident-response-guide-for-aws-cloudtrail-investigations-part-2/

In Part 1 of this guide, we examined two common incident scenarios: cross-account Amazon Simple Storage Service (Amazon S3) data deletion with ransomware implications, and cryptocurrency mining deployed through AWS CloudFormation using exposed AWS Management Console credentials. We also introduced key incident response terminology and investigative frameworks for analyzing AWS CloudTrail events.

In this second part, we explore a more complex, multi-stage attack: how a web application vulnerability can cascade into credential harvesting and unauthorized access to Amazon Bedrock services across multiple AWS Regions. We also cover additional investigation techniques and hardening steps to strengthen your security posture.

Scenario 3: SSRF to IMDSv1 credential harvesting with multi-Region Amazon Bedrock service misuse

This scenario examines how a web application vulnerability can cascade into a multi-Region event targeting Amazon Bedrock services. The investigation demonstrates how threat actors chain together multiple techniques, using Amazon Elastic Compute Cloud (Amazon EC2) Instance Metadata Service version 1 (IMDSv1) through server-side request forgery (SSRF) and cross-Region pivoting to access Amazon Bedrock.

Your security team receives multiple alerts: failed AWS Identity and Access Management (IAM) operations in the us-east-1 Region, successful console sign-ins without multi-factor authentication (MFA), and unusual Amazon Bedrock API calls from us-east-2. Initially, these might seem like unrelated events across different services and Regions. However, as our Security Incident Response Team (SIRT) discovered, they represent a carefully orchestrated event chain that began with a web application vulnerability and culminated in unauthorized access to your organization’s AI infrastructure.

Architecture and progression

The architecture in figure 1 maps a multi-stage attack that exploits the trust relationship between Amazon Elastic Compute Cloud (Amazon EC2) instances and AWS services. A threat actor identified a server-side request forgery (SSRF) vulnerability in a web application running on an EC2 instance that had an attached webdev IAM role. Rather than attempting to escalate privileges directly, the threat actor used this foothold to reach the Instance Metadata Service version 1 (IMDSv1) endpoint and retrieve the temporary credentials issued to the webdev role. Because IMDSv1 returns credentials in response to a basic request with no session token, an SSRF flaw is enough to harvest them, which is why these credentials became the pivot point for everything that followed. The attack unfolded in five stages. Each stage is numbered in figure 1 so you can follow the progression from the initial web request through to the cross-Region Amazon Bedrock activity:

  1. Initial access: The threat actor exploited the SSRF vulnerability in the web application to make server-side requests on the instance’s behalf.
  2. Credential harvesting: Those requests reached the IMDSv1 endpoint and returned the temporary credentials for the webdev role.
  3. Permission testing: Using the harvested credentials, the threat actor attempted IAM operations to probe the boundaries of what the role could do.
  4. Service pivoting: When IAM actions were denied, the threat actor shifted focus to Amazon Bedrock, a service the role could reach.
  5. Region hopping: The threat actor moved operations from us-east-1 to us-east-2, likely to evade Region-specific monitoring and access controls.
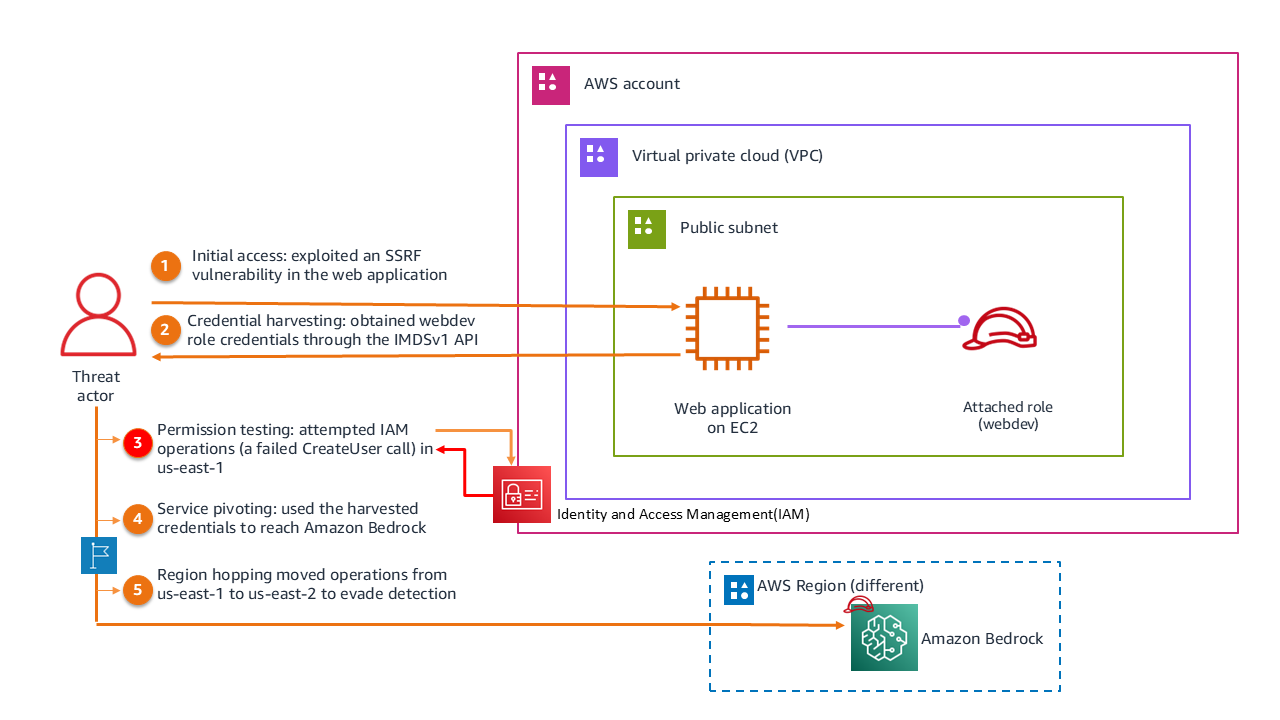
Figure 1: Scenario 3 architecture

Figure 1: Scenario 3 architecture

CloudTrail evidence and structured extractions

In this section, we walk through the CloudTrail evidence that documents the attack from start to finish. Each of the four events that follow maps to one or more stages in the progression described previously, and together they trace how the threat actor moved from harvested credentials to active misuse of Amazon Bedrock. For each event, we present the relevant portion of the CloudTrail log record, highlight the fields that matter most for the investigation, and include a forensic legend that explains what each highlighted field reveals.

We cover the following events:

  1. Permission boundary testing (15:53:49 UTC): A failed CreateUser call in us-east-1 that reveals the compromised role and the IMDSv1 credential source.
  2. Console access establishment (15:59:29 UTC): A successful console sign-in without MFA, showing the pivot from programmatic to interactive access.
  3. Bedrock service reconnaissance (17:20:00 UTC): A ListFoundationModels call in us-east-2 that marks the Region hop and the shift to AI services.
  4. Active model exploitation (17:25:48 UTC): A Converse call that invokes the Amazon Nova Pro model, confirming unauthorized usage.

As you read each event, focus on how the fields connect one stage to the next. The same webdev role, the same source IP address, and the recurring ec2RoleDelivery value are the threads that tie these otherwise separate events into a single attack chain.

Event 1: Permission boundary testing (15:53:49 UTC): The first suspicious activity appeared as a failed CreateUser API call in us-east-1. The CloudTrail log records an AssumedRole session attempting to create an IAM user named adm1n but receiving an AccessDenied error. The webdev role is visible in the userIdentity field, readOnly is false (indicating a write operation attempt), and the user-agent shows AWS Command Line Interface (AWS CLI) on Windows, suggesting programmatic access from the harvested credentials.

{
  "eventVersion": "1.11",
  "userIdentity": {
    "type": "AssumedRole",
    "principalId": "AROAFINDANEXAMPLE:i-0123456789abcdef0",
    "arn": "arn:aws:sts::XXXXXXXXXXXX:assumed-role/webdev/i-0123456789abcdef0",
    "sessionContext": {
      "sessionIssuer": { "type": "Role", "userName": "webdev" },  ◄── ❶ Compromised EC2 role
                                                     ‾‾‾‾‾‾‾‾
      "attributes": { "mfaAuthenticated": "false" }
    },
    "ec2RoleDelivery": "1.0"  ◄── ❷ IMDSv1 confirmed (SSRF exploitation path)
                       ‾‾‾‾‾
  },
  "eventTime": "2025-09-22T15:53:49Z",
  "eventSource": "iam.amazonaws.com",
  "readOnly": false,
  "eventName": "CreateUser",  ◄── ❸ Intent: establish persistent backdoor
               ‾‾‾‾‾‾‾‾‾‾‾‾
  "userAgent": "aws-cli/2.17.48 ua/2.0 os/windows#10 ...",
  "errorCode": "AccessDenied",  ◄── ❺ Hard policy stop (least-privilege held)
               ‾‾‾‾‾‾‾‾‾‾‾‾‾‾
  "errorMessage": "User: arn:aws:sts::XXXXXXXXXXXX:assumed-role/webdev/...
    is not authorized to perform: iam:CreateUser
    on resource: arn:aws:iam::XXXXXXXXXXXX:user/adm1n..."  ◄── ❹ Lookalike name (1 not i)
                                                ‾‾‾‾‾
}

───────────────────────────────────────────────────────────────────
  FORENSIC LEGEND
───────────────────────────────────────────────────────────────────
  ❶ userName: "webdev"         → Confirms the compromised EC2 role context
  ❷ ec2RoleDelivery: "1.0"    → Credentials obtained via IMDSv1 (SSRF vector)
  ❸ eventName: "CreateUser"   → Attacker attempting IAM persistence
  ❹ target user: "adm1n"      → Typosquatting admin (number 1 instead of letter i)
  ❺ errorCode: "AccessDenied" → Attacker probing permission boundaries; blocked
───────────────────────────────────────────────────────────────────

Event 2: Console access establishment (15:59:29 UTC): Six minutes later, the threat actor successfully signed in to the AWS Management Console using the same credentials. The ConsoleLogin event records that MFA wasn’t used (MFAUsed: No), and the source IP (75.3.231.105) provides attribution data. The user agent indicates Chrome browser on Windows 10.

{
  "eventVersion": "1.11",
  "userIdentity": {
    "type": "AssumedRole",
    "principalId": "AROAFINDANEXAMPLE:i-0123456789abcdef0",
    "arn": "arn:aws:sts::XXXXXXXXXXXX:assumed-role/webdev/i-0123456789abcdef0",
    "sessionContext": { "attributes": { "mfaAuthenticated": "false" } }
  },
  "eventTime": "2025-09-22T15:59:29Z",
  "eventSource": "signin.amazonaws.com",
  "userAgent": "Mozilla/5.0 (Windows NT 10.0; Win64; x64) AppleWebKit/537.36 	 (KHTML, like Gecko) Chrome/140.0.0.0 Safari/537.36 Edg/140.0.0.0",

  "eventName": "ConsoleLogin",  ◄── ❶ Pivoted to interactive console access
               ‾‾‾‾‾‾‾‾‾‾‾‾‾‾
  "awsRegion": "us-east-1",
  "sourceIPAddress": "75.3.231.105",
  "responseElements": { "ConsoleLogin": "Success" },◄── ❷ Hijacked login succeeded
                                        ‾‾‾‾‾‾‾‾‾
  "additionalEventData": { "MobileVersion": "No", "MFAUsed": "No" },◄── ❸ No MFA challenge
                                                             ‾‾‾‾
  "eventType": "AwsConsoleSignIn"  ◄── ❹ Console sign-in (not API call)
               ‾‾‾‾‾‾‾‾‾‾‾‾‾‾‾‾‾
}
───────────────────────────────────────────────────────────────────
FORENSIC LEGEND
───────────────────────────────────────────────────────────────────
❶ eventName: "ConsoleLogin"→ Attacker pivoted from programmatic to visual console access
❷ ConsoleLogin: "Success"→ Hijacked login successfully authenticated
❸ MFAUsed: "No" → Critical gap: no MFA enforced, enabling the pivot
❹ eventType: "AwsConsoleSignIn"   → Distinguishes this from basic API calls
───────────────────────────────────────────────────────────────────

Event 3: Amazon Bedrock service reconnaissance (17:20:00 UTC): Nearly two hours later, the threat actor pivoted to Amazon Bedrock, making a ListFoundationModels API call in us-east-2. This event exhibits several patterns: a Region change from us-east-1 to us-east-2 (potential defense evasion), a shift from IAM to AI services, readOnly: true (reconnaissance rather than modification), and sessionCredentialFromConsole: “true”, which ties the call to the console session established in Event 2 rather than a fresh IMDSv1 credential retrieval.

 {
  "eventVersion": "1.11",
  "userIdentity": {
    "type": "AssumedRole",
    "arn": "arn:aws:sts::XXXXXXXXXXXX:assumed-role/webdev/i-0123456789abcdef0"
  },
  "eventTime": "2025-09-22T17:20:00Z",
  "eventSource": "bedrock.amazonaws.com",  ◄── ❶ Pivoted to cloud AI services
               ‾‾‾‾‾‾‾‾‾‾‾‾‾‾‾‾‾‾‾‾‾‾‾‾
  "eventName": "ListFoundationModels",  ◄── ❷ AI model reconnaissance
               ‾‾‾‾‾‾‾‾‾‾‾‾‾‾‾‾‾‾‾‾‾‾
  "awsRegion": "us-east-2",  ◄── ❸ Region hop (evasion technique)
               ‾‾‾‾‾‾‾‾‾‾‾
  "sourceIPAddress": "75.3.231.105",
  "readOnly": true,
  "tlsDetails": {
    "clientProvidedHostHeader": "bedrock.us-east-2.amazonaws.com"  ◄── ❹ Intentional alternate region targeting
                               ‾‾‾‾‾‾‾‾‾‾‾‾‾‾‾‾‾‾‾‾‾‾‾‾‾‾‾‾‾‾‾‾‾
  },
  "sessionCredentialFromConsole": "true"
}

───────────────────────────────────────────────────────────────────
  FORENSIC LEGEND
───────────────────────────────────────────────────────────────────
❶ eventSource: "bedrock.amazonaws.com"→ Attacker pivoted from IAM to managed AI services
❷ eventName: "ListFoundationModels"→ Reconnaissance: enumerating available AI models
❸ awsRegion: "us-east-2"→ Region hop from us-east-1 (defense evasion)
❹ clientProvidedHostHeader: "bedrock.us-east-2..."  → Confirms intentional targeting of alternate region endpoint
───────────────────────────────────────────────────────────────────

Event 4: Active model exploitation (17:25:48 UTC): Five minutes after the reconnaissance call, the threat actor moved from enumeration to active exploitation, invoking the Amazon Nova Pro model through the Converse API in us-east-2. The additionalEventData field quantifies the unauthorized usage at 944 input tokens and 126 output tokens, confirming that the threat actor successfully prompted the model and received a response.

 {
  "eventVersion": "1.11",
  "userIdentity": {
    "type": "AssumedRole",
    "arn": "arn:aws:sts::XXXXXXXXXXXX:assumed-role/webdev/i-0123456789abcdef0"
  },
  "eventTime": "2025-09-22T17:25:48Z",
  "eventSource": "bedrock.amazonaws.com",
  "eventName": "Converse",  ◄── ❶ Active model invocation (recon → exploitation)
               ‾‾‾‾‾‾‾‾‾‾
  "awsRegion": "us-east-2",
  "requestParameters": {
    "modelId": "amazon.nova-pro-v1:0",  ◄── ❷ Specific model being misused
               ‾‾‾‾‾‾‾‾‾‾‾‾‾‾‾‾‾‾‾‾‾‾
    "inferenceConfig": { "maxTokens": 1024 }
  },
  "responseElements": null,
  "additionalEventData": { "inputTokens": 944, "outputTokens": 126 }  ◄── ❸ Unauthorized usage quantified
                           ‾‾‾‾‾‾‾‾‾‾‾‾‾‾‾‾‾‾‾‾‾‾‾‾‾‾‾‾‾‾‾‾‾‾‾‾‾‾
}

───────────────────────────────────────────────────────────────────
  FORENSIC LEGEND
───────────────────────────────────────────────────────────────────
❶ eventName: "Converse"                → Attacker transitioned from reconnaissance to active exploitation
❷ modelId: "amazon.nova-pro-v1:0"      → Identifies the specific foundation model being misused
❸ inputTokens: 944, outputTokens: 126  → Quantifies unauthorized usage (financial cost + data exfiltration exposure)
───────────────────────────────────────────────────────────────────

Notable event fields to track

As you review the event logs, a handful of fields do most of the investigative work in this scenario. Understanding what each one reveals, and why it matters, is what turns a collection of individual log records into a coherent attack narrative.

The userIdentity field is the starting point for attribution. In this scenario it carries the EC2 instance ID as the session name, which is what let us trace the harvested credentials back to a specific compromised instance rather than a human user. Whenever you see an assumed-role session, this field answers the first question of any investigation: whose credentials are these, and where did they come from?

The readOnly field reveals the intent behind an action. A value of true marks reconnaissance, such as the ListFoundationModels call the threat actor used to enumerate available models, while false marks an attempt to change or use something, such as the CreateUser call or the Converse invocation. Sorting events by this field quickly separates the threat actor’s information gathering from the actions that caused actual impact.

The awsRegion field is easy to overlook, but in this scenario it exposed the threat actor’s evasion strategy. The shift from us-east-1 to us-east-2 wasn’t incidental; threat actors move between Regions because monitoring, alerting, and access controls are often configured inconsistently across them. Watching this field helps you spot activity that has deliberately moved away from where your detection is strongest.

Finally, the userIdentity.invokedBy field identifies when an AWS service, rather than a user or a set of harvested credentials, made the request on your behalf. CloudTrail populates it only when the caller is an AWS service, such as through a service-linked role, a service role, or a forward access session. It doesn’t appear in the events for this scenario because the threat actor called Amazon Bedrock directly with the harvested webdev credentials. That absence is itself informative: it confirms the requests came from a principal acting on its own rather than from a legitimate service-driven workflow. As agent-based and service-integrated Amazon Bedrock workloads become more common, checking this field separates expected service activity from credentials driven directly by a threat actor.

Investigation priorities

With the full attack chain mapped, from SSRF through credential harvesting to Amazon Bedrock service misuse, the investigation turned to a harder question: what did each stage actually cost us, and what would stop it from happening again? A few priorities shaped that work.

The first was figuring out where the credentials came from and how far the exposure reached. It was clear the threat actor had valid credentials for the webdev role, but the more useful question was why a web application role could reach Amazon Bedrock at all. The customer confirmed there was no business reason for it, so we needed to understand whether that permission was a deliberate misconfiguration or an oversight, and then look for other EC2 instances carrying the same role attachment. One compromised instance is an incident; a fleet of instances with the same over-scoped role is a much bigger problem waiting to happen.

Next, we wanted to know what the threat actor did after they got into Amazon Bedrock. Reconnaissance and active use carry very different consequences, so we traced which foundation models were touched and whether any were actually invoked or only enumerated. That distinction matters for scoping the damage, and it signals whether data exfiltration is a concern. Unusual model usage, unexpected prompt volume, or output patterns that don’t match any legitimate workload are the signals that reconnaissance has turned into something worse.

The Region hop was its own line of inquiry. The move from us-east-1 to us-east-2 was almost certainly deliberate, and the investigation focused on understanding what the threat actor gained by it. In practice, that meant comparing the two Regions: were the monitoring and access controls in us-east-2 weaker than in us-east-1, and what else did the threat actor reach in the secondary Region once they were there? Inconsistent controls across Regions are one of the most common ways activity slips past detection.

Tying it all together was the timeline, which shows how quickly the threat actor moved through the chain:

  1. 15:53:49: Failed IAM operation (us-east-1)
  2. 15:59:29: Successful console login (us-east-1)
  3. 17:20:00: Amazon Bedrock reconnaissance (us-east-2)
  4. 17:25:48: Active model invocation (Converse call) (us-east-2)

Following the credentials across those events fills in the rest of the story. IMDSv1 handed the threat actor temporary credentials for the webdev role, and the same role appears in every event that followed, which confirms the credentials were reused rather than replaced. Nowhere in that sequence was MFA required, and that single gap is what let one harvested credential stay useful across two hours, two Regions, and two very different services.

Incident response checklist

The following checklist captures the actions needed to contain the incident, remediate the vulnerability, and assess the scope of unauthorized AI service usage. Each item names where to look and what a finding looks like, so the checklist stays usable under the time pressure of a live incident.

  1. Contain and remediate the entry point:
    1. Identify the specific web application feature that made the outbound request (URL fetchers, webhook callbacks, PDF or image renderers, and link-preview generators are the usual culprits), then confirm it can reach http://169.254.169.254.
    2. Audit the rest of the application for the same pattern, because one unvalidated URL parameter usually means others exist.
    3. Enforce IMDSv2 on the affected instance and across the fleet with aws ec2 modify-instance-metadata-options --http-tokens required --http-put-response-hop-limit 1. Setting --http-tokens required means credentials are only returned when the caller presents a session token it obtained through a PUT request, which a basic SSRF cannot do. Setting the hop limit to 1 keeps the metadata response on the instance itself, so a request coming from a container or proxy an extra hop away never receives it.
  2. Scope the Bedrock usage:
    1. List the foundation models the webdev role could reach by reviewing its IAM policy and any resource-based policies, so you know the full set of models that were exposed, not only the one that was invoked.
    2. Determine what was sent to and returned by the model. CloudTrail records the Converse call and the token counts, but only Amazon Bedrock model invocation logging captures the input prompts and model responses. If it was enabled, pull the log entries for the session; if it wasn’t, note that the prompt and response content can’t be recovered and enable it now.
    3. Flag any compliance exposure based on what those prompts and responses contained. Unauthorized processing of regulated data (such as personally identifiable information (PII), protected health information (PHI), or cardholder data) through the model might trigger notification obligations.
  3. Check for wider compromise and persistence:
    1. Query CloudTrail across all Regions and services—not only Amazon Bedrock—for every event tied to the webdev role’s session, to confirm what else the same credentials touched.
    2. Correlate the CloudTrail timestamps with VPC Flow Logs and application logs for source IP 75.3.231.105 to build the network-level picture around each API call.
    3. Search for IAM write events from the session (CreateUser, CreateRole, CreateAccessKey, and AttachRolePolicy) that indicate an attempt to establish persistence beyond the temporary credentials. The failed adm1n CreateUser call is the known starting point; confirm nothing similar succeeded.
  4. Watch for ongoing or hidden impact:
    1. Review Amazon Bedrock usage in CloudWatch and your billing data for invocation spikes or unexpected token consumption that fall outside normal workload patterns.
    2. Inspect the invocation logs for signs of sensitive data being processed or extracted through the model.
    3. Check the same logs for prompt injection attempts, where the input tries to override the model’s instructions or extract system prompts.

Key takeaways

This scenario reveals how a single application vulnerability can cascade into broad unauthorized access when multiple security controls are missing. The following takeaways highlight the key defensive gaps and hardening priorities.

  • Least-privilege IAM for workload roles: The webdev role’s access to Amazon Bedrock across multiple Regions had no business justification for a web application workload, which the customer confirmed during the investigation. Apply least-privilege principles to EC2 instance roles by scoping permissions to only the services and actions the application requires. Use AWS IAM Access Analyzer to identify unused permissions and tighten policies proactively. Overly permissive roles transform a single application vulnerability into broad lateral movement across unrelated services.
  • IMDSv1 compared to IMDSv2: Organizations must immediately switch to IMDSv2 and disable IMDSv1 across their entire cloud infrastructure. The ec2RoleDelivery: “1.0" field in the logs explicitly confirms the use of IMDSv1, which permits credential retrieval without an authentication token. This architectural weakness makes SSRF-based credential theft trivial, because a web application flaw that can make an outbound request is enough to read the role’s temporary credentials with no further authentication. Transitioning to IMDSv2 mitigates this attack surface by enforcing local, session-based tokens, effectively breaking the threat actor’s exploitation chain. In this scenario, IMDSv2 alone would have stopped the attack at its first step.
  • Region-based defense evasion signals a deliberate operator: The shift from us-east-1 to us-east-2 for Amazon Bedrock access wasn’t incidental. Threat actors move between Regions because monitoring, alerting, and access controls are often configured inconsistently across them, and activity in a secondary Region is more likely to go unnoticed. This kind of cross-Region movement is a marker of operational security awareness rather than opportunistic access, and it should raise the priority of an investigation. Treat consistent detection coverage across all Regions, including the ones you do not actively use, as a baseline requirement.
  • Interface switching and permission probing reveal the threat actor’s method: This event chain reveals a threat actor comfortable moving between AWS interfaces and testing boundaries before committing. The failed CreateUser attempt was systematic probing to understand the scope of the harvested credentials, and when IAM actions were denied, the threat actor pivoted to a service the role could actually reach. The combination of programmatic access through the AWS CLI and interactive console access demonstrates the same adaptability. Recognizing this pattern of probe, adapt, and pivot helps responders anticipate the next move instead of reacting to each event in isolation.
  • AI services need visibility beyond CloudTrail: Amazon Bedrock and other AI services are high-value targets, and CloudTrail alone doesn’t capture the whole story. CloudTrail records who called Amazon Bedrock and whether the call succeeded, but not what was asked or answered. Enable Amazon Bedrock model invocation logging to capture full prompts and responses for compliance auditing. For agent-based workloads, Amazon Bedrock AgentCore Observability, built on AWS Distro for OpenTelemetry (ADOT), provides session-level traces showing tool execution order and latency. Consider also enabling Amazon GuardDuty AI Protection, which analyzes Amazon Bedrock-related CloudTrail activity to detect anomalous invocations, cost harvesting, and prompt injection attempts. Correlating these signals—CloudTrail, Model Invocation Logging, and agent telemetry—gives investigators the complete picture. For implementation guidance, see Monitoring and Auditing AI Workloads on AWS.

Advanced forensic indicators and evasion techniques

Beyond the specific attack patterns in this scenario, investigators should be aware of several evasion techniques that threat actors use to confuse defenders and blend into legitimate activity. The top three that we observe across incident response with customers are:

  • Root user compared to IAM user named root: When you first create an AWS account, you begin with a single sign-in identity that has complete access to all AWS services and resources in the account. This identity is called the AWS account root user. In some previous investigations, threat actors have also created IAM users in an AWS account named root. The difference is visible in the type field of the userIdentity element of the CloudTrail log record, which indicates the type of user that logged the record.
  • Role and user name imitation: Threat actors attempt defense evasion by creating names for IAM users and roles that imitate those reserved for use by AWS. For example, the service-linked role AWSServiceRoleForSupport is a unique IAM role linked directly to AWS Support. Threat actors have created roles with the name AWSServiceRoIeforSupport (note the use of an upper-case letter I instead of a lower-case letter l in Role) in an attempt to trick users into thinking actions taken by this role have been performed by AWS Support.
  • Users named HIDDEN_DUE_TO_SECURITY_REASONS: The userName field contains the string HIDDEN_DUE_TO_SECURITY_REASONS when the recorded event is a console sign-in failure caused by incorrect user name input. CloudTrail doesn’t record the contents in this case because the text could contain sensitive information. However, threat actors have used this string as an actual username to trick investigators into thinking the name has been obfuscated. This technique is usually associated with a corresponding CreateUser or CreateRole CloudTrail event.

Conclusion and next steps

CloudTrail event fields help security teams identify identities with unintended access, track threat actor actions, and remediate affected resources. Understanding fields like userIdentity, eventName, and sourceIPAddress improves incident investigation and threat detection. Implementing best practices such as enabling comprehensive logging, using Amazon Athena for analysis, securing logs, and automating responses helps ensure that CloudTrail serves as a robust forensic and incident response tool.

If you suspect unauthorized activity in your AWS environment, AWS Security Incident Response is available to help. The service continuously monitors and triages findings from Amazon GuardDuty and third-party security tools integrated through AWS Security Hub, automatically filtering alerts to surface the most relevant events. In addition to proactive triage, customers can initiate security cases through the service. You can choose to handle these cases internally or receive support from the Security Incident Response Team (SIRT), a dedicated group of security experts available at all times to assist with investigation, containment, and recovery throughout the incident lifecycle.

Additional resources

The following resources provide further guidance on securing your AWS environment and strengthening your investigative capabilities.

If you have feedback about this post, submit comments in the Comments section below.

Oscar Diaz

Oscar E Diaz Cordovez

Oscar is a Senior Technical Account Manager specializing in cloud operations and security. His passion for technology and innovation drives his expertise in cloud-focused architectures, DevOps practices, and automation.

Steve de Vera

Steve de Vera

Steve is a manager for the AWS Security Incident Response service with a focus on threat research and threat intelligence. He is passionate about American-style BBQ and is a certified competition BBQ judge. He has a dog named Brisket.

Jennifer Paz

Jennifer is a Security Engineer Manager with over a decade of experience, for the AWS Security Incident Response service. Jennifer enjoys helping customers tackle security challenges and implementing complex solutions to enhance their security posture. When not at work, Jennifer is an avid runner, pickleball enthusiast, traveler, and foodie, always on the hunt for new culinary adventures.

Incident response guide for AWS CloudTrail investigations – Part 1

Post Syndicated from Oscar Diaz original https://aws.amazon.com/blogs/security/incident-response-guide-for-aws-cloudtrail-investigations-part-1/

AWS CloudTrail logs contain the evidence you need when investigating suspicious activity in your AWS environment, but knowing which fields matter and how to interpret them can mean the difference between surface-level analysis and uncovering the full scope of an incident. This guide walks you through real-world scenarios, showing you how to analyze CloudTrail events to uncover cross-account unauthorized access, cryptocurrency mining operations, and AI service abuse. You’ll learn the investigative techniques our Security Incident Response Team (SIRT) team uses to handle threats, with practical methodologies you can apply to your own investigations.

Each scenario includes:

  • Architecture diagrams showing the event progression
  • Annotated CloudTrail logs highlighting significant fields
  • Investigation frameworks with specific questions to ask
  • Lessons learned and preventive measures

Whether you’re in security operations, cloud engineering, compliance, or leadership, this guide provides the investigative mindset needed to move beyond basic CloudTrail queries to comprehensive security analysis.

Incident response definitions

Throughout this guide, we reference terminology commonly used in incident response and threat intelligence. We’ve provided definitions for key terms to help ensure this guide is accessible to readers from diverse backgrounds, whether you’re in security operations, cloud engineering, compliance, or leadership.

  • Reconnaissance: The initial phase where a threat actor gathers information about the target environment (for example, listing Amazon Simple Storage Service (Amazon S3) buckets or browsing available resources) to understand what’s available before taking action.
  • Enumeration: Systematically cataloging specific resources, users, or configurations within an environment to identify potential targets or access paths.
  • Lateral movement: When a threat actor moves from one resource to another within the same environment (for example, pivoting from an Amazon Elastic Compute Cloud (Amazon EC2) instance to an AI service) to expand their access.
  • Privilege escalation: Attempting to gain higher-level permissions than initially obtained, such as trying to create admin users or modify AWS Identity and Access Management (IAM) policies.
  • Defense evasion: Techniques used to avoid detection, such as operating in a different AWS Region where monitoring might be less robust, or naming unauthorized resources to look legitimate.
  • Persistence: Establishing ongoing access to an environment (for example, creating new IAM users or access keys) so the threat actor can return even if the original entry point is closed.
  • Credential harvesting: Stealing authentication credentials (passwords, access keys, temporary tokens) to impersonate legitimate users or roles.
  • Server-side request forgery (SSRF): A web application technique where an unauthorized user tricks a server into making requests on their behalf, often used to access internal services such as the Amazon EC2 Instance Metadata Service (IMDS) endpoint. For more information, see Understanding SSRF.
  • IMDSv1 (Instance Metadata Service v1): Amazon EC2 Instance Metadata Service version 1 (IMDSv1) provides temporary credentials to applications running on an instance. IMDSv1 itself isn’t inherently insecure; however, when an application with issues (for example, one susceptible to SSRF) is running on the instance, an unauthorized user can use that application to reach the metadata endpoint and retrieve credentials. IMDSv2 mitigates this risk by requiring session-based authentication tokens.
  • Indicators of compromise (IOCs): Observable artifacts (IP addresses, user agents, session names, resource names) that suggest unauthorized activity has occurred.
  • Exfiltration: The unauthorized transfer of data out of an environment, such as copying files before deleting them.
  • Event chain: The sequence of steps a threat actor follows from initial access to achieving their objective, where each step enables the next.
  • Pivot: Shifting from one technique, service, or Region to another during a security event, often after an initial approach is blocked or to avoid detection.

Scenario 1: Cross-account S3 data deletion with ransomware implications

Cross-account access is sometimes necessary in AWS, but misconfiguration creates security risks. In this scenario, your security operations center has received an automated alert that multiple objects have been deleted from the customer-important-data S3 bucket. The initial response seems straightforward: check the CloudTrail logs, identify who deleted the objects, and determine if it was authorized. But as our SIRT team investigated further, what appeared to be a straightforward unauthorized deletion revealed itself as a cross-account incident with ransomware implications. CloudTrail analysis requires recognizing patterns, understanding context, and thinking like a threat actor.

Scenario architecture

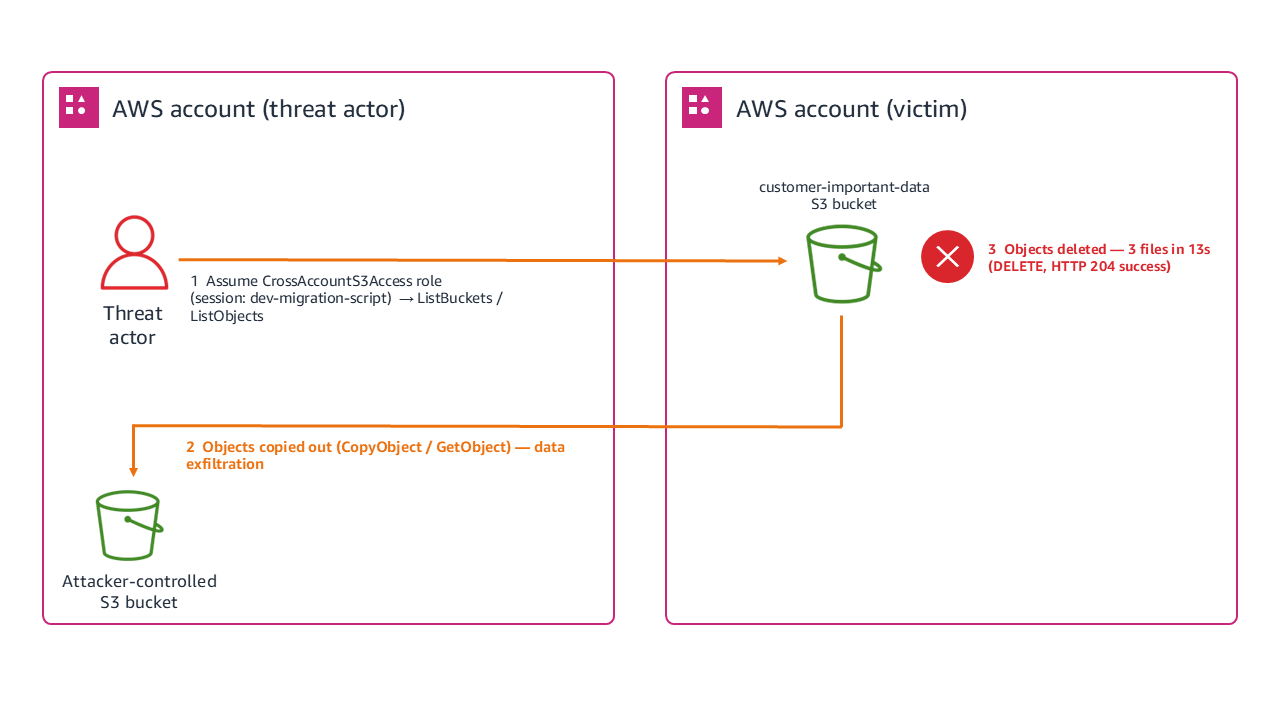
Figure 1 shows the architecture layout for accessing a trusted account and deleting objects from an S3 bucket, which is achieved through the following steps:

  1. Threat actor assumes the CrossAccountS3Access role from a trusted account.
  2. Lists S3 buckets to identify targets (ListBuckets API call).
  3. Lists objects within the target bucket to catalog contents.
  4. Executes scripted deletions of three files within 13 seconds.
  5. Each deletion returns an HTTP 204 (successful) status code.
Figure 1: Scenario 1 architecture

Figure 1: Scenario 1 architecture

Reconnaissance phase

Our investigation began with examining the CloudTrail logs, where we discovered that the unauthorized activity started with what many analysts might dismiss as routine activity: a ListBuckets API call made through an assumed role at 14:31:22 UTC. The CloudTrail entry contains a session named dev-migration-script using the CrossAccountS3Access role.

While cross-account access is common in enterprise environments, session names typically reflect legitimate business units. Attackers frequently use masquerading techniques, naming their sessions after common developer tasks or automation scripts, to blend seamlessly into daily operational noise. However, cross-referencing this session name against the external source IP and historical deployment logs confirmed that no such migration project was authorized, signaling a clear evasion attempt by a threat actor and the first indication of unauthorized access. Three seconds later, our logs showed a GET request to list objects in the bucket, which is classic reconnaissance behavior. The threat actor was cataloging available targets, using the same assumed role and IP address. This pattern, which you can see in the arn and eventname in the following log, showed us that the threat actor gathered intelligence, assessed targets, and planned their approach.

{
  "eventVersion": "1.08",
  "userIdentity": {
    "type": "AssumedRole",
    "principalId": "AROAEXAMPLE123456789:threat-actor-session",
    "arn": "arn:aws:sts::111122223333:assumed-role/CrossAccountS3Access/threat-actor-session"
  },
  "eventTime": "2025-01-20T14:31:22Z",
  "eventSource": "s3.amazonaws.com",
  "eventName": "ListBuckets",
  "sourceIPAddress": "203.0.113.47",
  "recipientAccountId": "444455556666"
}

──────────────────────────────────────────────────────────────────────────────────
  FORENSIC LEGEND
──────────────────────────────────────────────────────────────────────────────────
❶ arn: ".../CrossAccountS3Access/..."             → Cross-account role assumed; access came from another account
❷ Session name: "threat-actor-session"            → Custom session name attached at role assumption
❸ eventName: "ListBuckets"                        → Enumeration of all S3 buckets in the account (recon)
❹ principalId: "AROAEXAMPLE123456789:threat-actor-session" → Role's unique ID + attacker-chosen session label
❺ sourceIPAddress: "203.0.113.47"                 → Origin of the API call (RFC 5737 documentation IP range)
❻ recipientAccountId: "444455556666"              → AWS account that received/owned the request (fictional placeholder)
──────────────────────────────────────────────────────────────────────────────────

Systematic deletion

After completing their reconnaissance at 14:31:25 UTC, the threat actor went silent for 14 minutes before the first deletion at 14:45:12 UTC. During this window, the threat actor likely reviewed the inventory of objects they’d just enumerated, selected their highest-value targets (financial data, PII, and database backups), and prepared an automated deletion script to execute quickly once ready. We can infer this preparation period based on several factors: no other CloudTrail events from this session appeared during the 14-minute window, the subsequent deletions were precisely timed at 6-7 second intervals suggesting scripted execution, and the targets chosen were the three most business-critical files rather than a bulk delete of everything in the bucket. This selective, scripted approach indicates the threat actor used the reconnaissance data they gathered in the listing phase to build a targeted attack plan before executing it. Within 13 seconds (14:45:12–14:45:25 UTC), the threat actor deleted three files from the customer-important-data bucket: a financial report (q4-2024.xlsx at 14:45:12), a customer personally identifiable information (PII) database (pii-database.csv at 14:45:18), and a production database backup (prod-database-backup.sql at 14:45:25). Each deletion returned an HTTP 204 status code. The Amazon S3 access logs confirm these successful DELETE operations, all originating from the same session.

[20/Jan/2025:14:31:25] S3Access/dev-migration-script REST.GET.BUCKET    -  "GET /?list-type=2 HTTP/1.1" 200 - "-" "aws-cli/Linux"
                                ‾‾‾‾‾‾‾‾‾‾‾‾‾‾‾‾‾‾‾‾ ‾‾‾‾‾‾‾‾‾‾‾‾‾‾‾                                                ‾‾‾‾‾‾‾‾‾‾‾‾‾
                                ❶ Masquerading session   ❷ Recon: listing buckets                                        ❻ Scripted tool

[20/Jan/2025:14:34:15] S3Access/dev-migration-script REST.COPY.OBJECT   financial-reports/q4-2024.xlsx "PUT /..." 200 - "-" "aws-cli/Linux"
                                                     ‾‾‾‾‾‾‾‾‾‾‾‾‾‾‾‾   ‾‾‾‾‾‾‾‾‾‾‾‾‾‾‾‾‾‾‾‾‾‾‾‾‾‾‾‾‾
                                                     ❸ Data exfiltration  Financial data copied

[20/Jan/2025:14:34:20] S3Access/dev-migration-script REST.COPY.OBJECT   customer-data/pii-database.csv "PUT /..." 200 - "-" "aws-cli/Linux"
                                                     ‾‾‾‾‾‾‾‾‾‾‾‾‾‾‾‾   ‾‾‾‾‾‾‾‾‾‾‾‾‾‾‾‾‾‾‾‾‾‾‾‾‾‾‾‾‾‾
                                                     ❸ Data exfiltration  PII database copied

[20/Jan/2025:14:45:12] S3Access/dev-migration-script REST.DELETE.OBJECT financial-reports/q4-2024.xlsx "DELETE /..." 204 - "-" "aws-cli/Linux"
            ‾‾‾‾‾‾‾‾‾                               ‾‾‾‾‾‾‾‾‾‾‾‾‾‾‾‾‾ ‾‾‾‾‾‾‾‾‾‾‾‾‾‾‾‾‾‾‾‾‾‾‾‾‾‾‾‾‾               ‾‾‾
            ❺ 13-sec window starts                   ❹ Destruction        Target file                                   Success

[20/Jan/2025:14:45:18] S3Access/dev-migration-script REST.DELETE.OBJECT customer-data/pii-database.csv "DELETE /..." 204 - "-" "aws-cli/Linux"
                                                     ‾‾‾‾‾‾‾‾‾‾‾‾‾‾‾‾‾ ‾‾‾‾‾‾‾‾‾‾‾‾‾‾‾‾‾‾‾‾‾‾‾‾‾‾‾‾‾‾               ‾‾‾
                                                     ❹ Destruction        PII database destroyed                        Success

[20/Jan/2025:14:45:25] S3Access/dev-migration-script REST.DELETE.OBJECT backup-configs/prod-database-backup.sql "DELETE /..." 204 - "-" "aws-cli/Linux"
            ‾‾‾‾‾‾‾‾‾                               ‾‾‾‾‾‾‾‾‾‾‾‾‾‾‾‾‾ ‾‾‾‾‾‾‾‾‾‾‾‾‾‾‾‾‾‾‾‾‾‾‾‾‾‾‾‾‾‾‾‾‾‾‾‾‾         ‾‾‾
            ❺ 13-sec window ends                     ❹ Destruction        Prod backup destroyed (anti-recovery)         Success

───────────────────────────────────────────────────────────────────────────────────────────
  FORENSIC LEGEND
───────────────────────────────────────────────────────────────────────────────────────────
  ❶ "dev-migration-script"    → Masquerading session name; no authorized migration existed
  ❷ REST.GET.BUCKET           → Reconnaissance: cataloging available targets
  ❸ REST.COPY.OBJECT          → Data exfiltration before destruction (steal-then-destroy)
  ❹ REST.DELETE.OBJECT        → Systematic destruction of high-value assets
  ❺ 14:45:12 → 14:45:25      → 13-second automated deletion window (scripted execution)
  ❻ "aws-cli/Linux"           → CLI-based automation, not manual console activity
───────────────────────────────────────────────────────────────────────────────────────────

Analysis of timing and access patterns

The 13-second deletion window wasn’t arbitrary. The user-agent string showed AWS Command Line Interface (AWS CLI) usage on Linux, and the precise timing suggested scripted execution rather than manual operations. This indicated preplanned targeting and automated execution to minimize the detection window.

The consistent source IP across events let us search for other suspicious activities from the same source, correlate with threat intelligence feeds, and identify potential lateral movement attempts.

The broad Amazon S3 permissions of the CrossAccountS3Access role raised questions about least privilege implementation, regular access reviews, and the business justification for such extensive cross-account permissions.

Investigation priorities

With confirmation that misconfigured cross-account access had been taken advantage of to delete data, the next step was to prioritize the investigation. In incident response, priority is driven by three factors: whether the threat actor still has active access (containment urgency), whether sensitive data was exposed or exfiltrated (regulatory and business impact), and whether the attack can spread to other resources or accounts (blast radius). We applied these factors to guide the following questions:

  • How did the threat actor gain access to the CrossAccountS3Access role? We examined the role’s trust policy and recent modifications, authentication events in both the trusting and trusted accounts, and other sessions using the same role around the same timeframe.
  • Were the files copied before deletion? We searched for GetObject operations on the same objects before the deletions, unusual network traffic patterns during the reconnaissance phase, and CopyObject activities that might indicate data theft.
  • Did the objects have specific significance? Understanding why these specific objects mattered helped us prioritize recovery efforts based on business impact, assess regulatory notification requirements for the PII exposure, and determine the full scope of business disruption from backup loss.

Response checklist

After identifying the scope of the cross-account deletion, the following steps help ensure a thorough response and prevent recurrence.

  • Determine if the business purpose served by this cross-account access is legitimate
  • Identify the corresponding authentication events that show how the role was assumed
  • Identify other AWS resources that this role might access beyond Amazon S3
  • Check for failed attempts or reconnaissance activities that preceded the successful event
  • Determine when this cross-account trust relationship was created
  • Determine when the last access review of this role was conducted
  • Locate any backup copies of the deleted data
  • Determine detection rules that can be used to catch similar activity in the future

Key takeaways

This scenario illustrates several principles that apply broadly to cross-account incident investigations. Unusual identifiers in session names often reveal threat actor intent or poor operational security. The progression from ListBuckets to targeted deletions shows how threat actors operate with a plan. Cross-account access needs extra scrutiny because trusted relationships become vectors for unauthorized access when credentials are exposed. Understanding why specific files matter helps prioritize response efforts and assess true impact. Precise timing and consistent technical signatures often indicate scripted events that need different response strategies than manual intrusions.

Scenario 2: Cryptocurrency mining using CloudFormation with console credentials

In this scenario, your finance team notices an unexpected spike in AWS costs, particularly around Amazon EC2 compute charges in the us-east-1 AWS Region. During the investigation, we examine how threat actors use legitimate console access to deploy cryptocurrency mining operations through AWS CloudFormation and how investigators can uncover the scope of resource hijacking events. We discover a CloudFormation stack named CRYPTO which you have no record or knowledge of being created. The stack contains EC2 instances running in your production Amazon Virtual Private Cloud (Amazon VPC) consuming significant compute resources, which signals an immediate security investigation.

Architecture and sequence

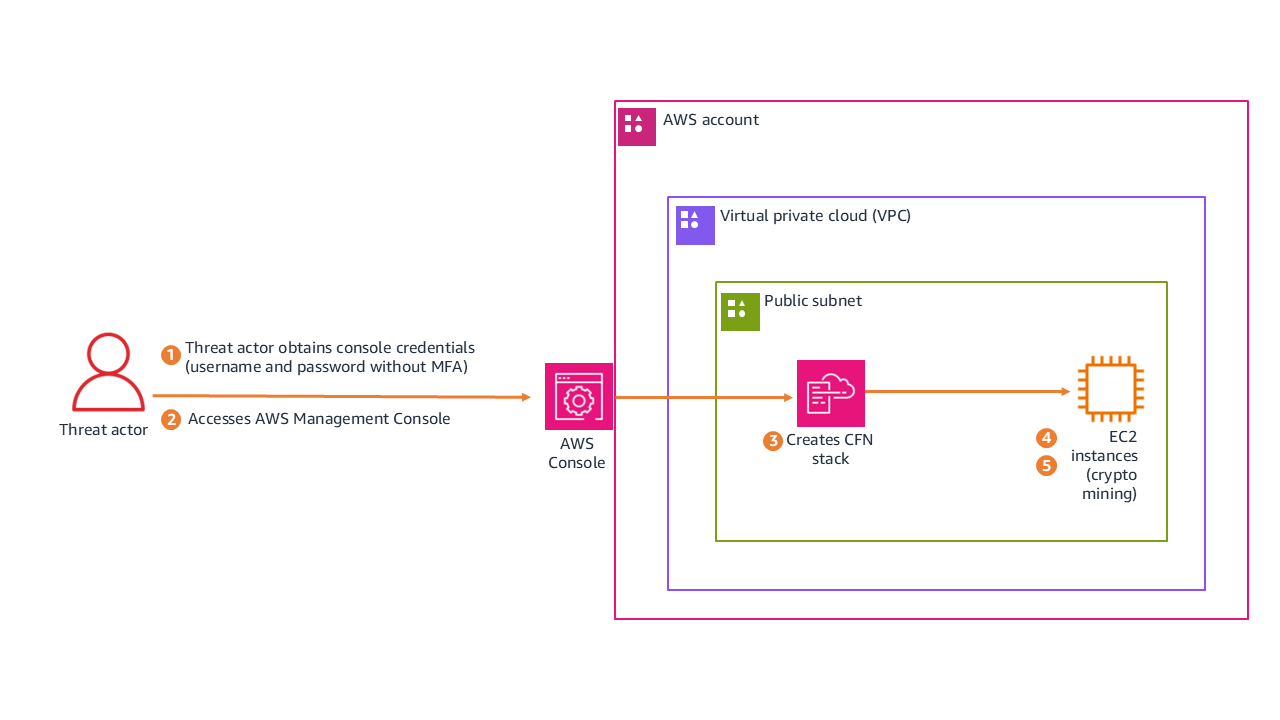
Figure 2 shows how the threat actor moved from credential acquisition to active mining, following these steps:

  1. Threat actor obtains console credentials (username and password without multi-factor authentication (MFA)).
  2. Accesses AWS Management Console.
  3. Creates CloudFormation stack CRYPTO in us-east-1.
  4. Stack deploys EC2 instances configured for cryptocurrency mining in a public subnet.
  5. Mining instances begin consuming compute resources.
Figure 2: Scenario 3 architecture

Figure 2: Scenario 3 architecture

The following is the redacted CloudTrail event record for the unauthorized CreateStack action. See if you can use it to find the following information:

  • The name of the CloudFormation stack that was created
  • The CloudFormation stack Amazon Resource Name (ARN)
  • If the credentials were secured by MFA
  • If the threat actor used the AWS Management Console to perform the actions, or if they were performed programmatically using the AWS CLI or a script
{
  "eventVersion": "1.11",
  "userIdentity": {
    "type": "AssumedRole",
    "principalId": "AROAFINDANEXAMPLE:Participant",
    "arn": "arn:aws:sts::XXXXXXXXXXXX:assumed-role/WSParticipantRole/Participant",
    "sessionContext": {
      "sessionIssuer": { "type": "Role", "userName": "WSParticipantRole" },
      "attributes": { "mfaAuthenticated": "false" }  ◄── ❹ No MFA on session
                                            ‾‾‾‾‾‾‾
    }
  },
  "eventTime": "2025-09-23T18:07:12Z",
  "eventSource": "cloudformation.amazonaws.com",
  "eventName": "CreateStack",
               ‾‾‾‾‾‾‾‾‾‾‾‾‾
  "awsRegion": "us-east-1",
  "userAgent": "aws-cli/2.30.0 ... exec-env/CloudShell",  ◄── ❻ Browser-based CloudShell execution
                                    ‾‾‾‾‾‾‾‾‾‾‾‾‾‾‾‾‾‾‾
  "requestParameters": {
    "stackName": "CRYPTO",  ◄── ❶ Cryptocurrency-related activity
                 ‾‾‾‾‾‾‾‾
    "parameters": [
      { "parameterKey": "VpcId" },      ◄── ❷ Prior recon: attacker knew target network
      { "parameterKey": "SubnetIds" }   ◄── ❷
                       ‾‾‾‾‾‾‾‾‾‾‾‾‾‾‾‾‾‾‾
    ]
  },
  "responseElements": {
    "stackId": "arn:aws:cloudformation:us-east-1:...:stack/CRYPTO/2102e190..."  ◄── ❸ Stack created successfully
               ‾‾‾‾‾‾‾‾‾‾‾‾‾‾‾‾‾‾‾‾‾‾‾‾‾‾‾‾‾‾‾‾‾‾‾‾‾‾‾‾‾‾‾‾‾‾‾‾‾‾‾‾‾‾‾‾‾‾‾
  },
  "sessionCredentialFromConsole": "true"  ◄── ❺ Console-based access
                                 ‾‾‾‾‾‾
}

───────────────────────────────────────────────────────────────────────────────────────────
  FORENSIC LEGEND
───────────────────────────────────────────────────────────────────────────────────────────
❶ stackName: "CRYPTO"                → Indicator of cryptocurrency mining deployment
❷ VpcId + SubnetIds parameters       → Attacker targeted specific network; prior recon confirmed
❸ stackId: "...stack/CRYPTO/..."     → Unique resource ID; stack was successfully created
❹ mfaAuthenticated: "false"          → Session lacked multi-factor authentication
❺ sessionCredentialFromConsole: true  → Access via AWS Console web portal (not external API)
❻ exec-env/CloudShell                → CLI commands executed via browser-based CloudShell
───────────────────────────────────────────────────────────────────────────────────────────

Analysis of authentication and access

The CloudTrail event record includes fields that answer the questions for this scenario.

Stack details summary:

The CloudTrail event confirms the following details about the deployed stack:

  • Stack name: CRYPTO is an indicator of cryptocurrency-related activity
  • Stack ARN: arn:aws:cloudformation:us-east-1:stack/CRYPTO/2102e190-98a8-11f0-bcea-1209335b107
  • Region: us-east-1 (a common choice for threat actors because of immediate service availability)

Authentication and session context analysis:

Examining the session metadata reveals how the threat actor authenticated and accessed the environment:

  • MFA status: “mfaAuthenticated": “false” indicates that the session was entirely unauthenticated by MFA.
  • Access method: “sessionCredentialFromConsole": “true” means that access was funneled through the console.
  • User context: AssumedRole using WSParticipantRole. Session creation occurred at 2025-09-23T18:06:22Z (approximately 50 seconds before stack creation).

Advanced forensic insight (the CloudShell pivot)

The sessionCredentialFromConsole: true field is important to note because this access originated from the AWS console rather than external programmatic API keys. Interestingly, while the session originated from the console, the userAgent field reveals the execution environment was exec-env/CloudShell. This shows that the threat actor didn’t manually click through the CloudFormation user interface, instead launching AWS CloudShell on sign-in to execute a prepackaged deployment script. This allowed the threat actor to achieve automated speed while evading traditional static API key monitoring. The mfaAuthenticated: false field represents a security control gap. Particularly in environments handling sensitive data or production workloads, MFA must be enforced for console access.

Investigation priorities

With the unauthorized stack confirmed, the investigation focused on understanding the full timeline and blast radius. We approached this in three phases, each building on the findings of the previous one.

Reconstruct the console session timeline

The session began at 18:06:22Z and the stack was created at 18:07:12Z, only 50 seconds later. That speed tells us the threat actor came prepared with a script rather than exploring the environment manually. But we needed to know what happened before and after. By filtering CloudTrail for the same session token across the full session duration, we could identify whether the threat actor performed any reconnaissance before deploying the stack, whether they accessed other services or regions during the same session, and whether they attempted to establish persistence (such as creating IAM users or access keys) before or after the mining deployment. Any actions taken outside the CloudFormation deployment could indicate secondary objectives beyond cryptomining.

Examine what the stack actually deployed

The stack name alone doesn’t tell us the full impact. We needed to inspect the CloudFormation template to understand what resources were created and how they were configured. This meant identifying the EC2 instance types (larger instances mean higher costs and potentially more mining output), reviewing the security group rules to determine what network access these instances had to internal resources, checking whether the template included custom AMIs or user data scripts that pulled mining software on boot, and determining if the stack created its own IAM roles with permissions that could be used for further lateral movement. The template itself is evidence. If it was hosted in Amazon S3, the upload event tells us when the threat actor first staged their tools.

Calculate business impact and determine blast radius

Finally, we needed to quantify the damage and determine whether this was isolated or part of a broader compromise. We calculated the total compute cost by multiplying instance hours by instance type pricing, checked whether the mining instances had network paths to production databases or internal services, examined outbound traffic logs for connections to known mining pool IP addresses, and searched for similar stacks or naming patterns across other regions and accounts. The presence of outbound connections to anything other than mining pools would suggest the instances served a dual purpose, potentially exfiltrating data while generating cryptocurrency.

Response checklist

The following checklist captures the key actions needed to contain the incident, assess its impact, and close security gaps.

  • Determine why MFA wasn’t required for this sensitive operation
  • Investigate how the threat actor obtained valid console credentials
  • Check for failed sign-in attempts preceding this successful access
  • Check for other activities that occurred during this console session
  • Look for resources that were created by the CloudFormation stack
  • Determine how long those resources have been running and consuming costs
  • Look for other similarly named or suspicious stacks in the environment
  • Check what network access these instances have to internal resources
  • Determine what outbound connections these instances are making
  • Look for cryptocurrency mining pool connections
  • Check if IAM users or roles were created
  • Check if additional access keys were generated
  • Determine if the threat actor modified existing permissions or policies

Key takeaways

This scenario highlights how credential hygiene and monitoring controls intersect with resource hijacking threats.

  • MFA enforcement prevents console-based credential abuse for IAM users. The absence of MFA enabled the full sequence. Console access to production environments should require multi-factor authentication as a security best practice.
  • Resource naming can be an indicator. The obvious CRYPTO naming suggests either threat actor confidence or poor operational security, both concerning for different reasons.
  • Cost monitoring is security monitoring. Unusual billing spikes can be early indicators of resource hijacking events.
  • Console-based activity has different patterns than programmatic activity and requires specialized investigation approaches. The sessionCredentialFromConsole field is your starting point for distinguishing between the two.

Conclusion

In this first part, we walked through two real-world scenarios that demonstrate how CloudTrail analysis can reveal the full scope of a security incident. In Scenario 1, we showed how a seemingly routine cross-account role assumption led to targeted data deletion with ransomware implications, and how session names, timing patterns, and source IP correlation help investigators piece together the event chain. In Scenario 2, we examined how stolen console credentials enabled a cryptocurrency mining deployment through CloudShell, highlighting the critical role of MFA enforcement and cost monitoring as security controls. Both scenarios reinforce a core principle: effective CloudTrail investigation goes beyond identifying what happened. It requires understanding how and why, so you can contain the immediate threat and close the gaps that enabled it.

In Part 2 of this guide, we examine how a web application vulnerability can cascade into a multi-Region event targeting AI services, chaining together SSRF, IMDSv1 credential harvesting, and cross-Region pivoting to access Amazon Bedrock. We also cover critical investigation techniques including root user compared to IAM user named root, role name imitation tactics, and the HIDDEN_DUE_TO_SECURITY_REASONS username trick, along with critical hardening steps and additional resources you can use to strengthen your cloud forensic capabilities.

If you have feedback about this post, submit comments in the Comments section below.

Oscar Diaz

Oscar E Diaz Cordovez

Oscar is a Senior Technical Account Manager specializing in cloud operations and security. His passion for technology and innovation drives his expertise in cloud-focused architectures, DevOps practices, and automation.

Steve de Vera

Steve de Vera

Steve is a manager for the AWS Security Incident Response service with a focus on threat research and threat intelligence. He is passionate about American-style BBQ and is a certified competition BBQ judge. He has a dog named Brisket.

Jennifer Paz

Jennifer is a Security Engineer Manager with over a decade of experience, for the AWS Security Incident Response service. Jennifer enjoys helping customers tackle security challenges and implementing complex solutions to enhance their security posture. When not at work, Jennifer is an avid runner, pickleball enthusiast, traveler, and foodie, always on the hunt for new culinary adventures.

Detecting multi-stage attacks on AWS: A guide to cross-service signal correlation

Post Syndicated from Nisha Kashyap original https://aws.amazon.com/blogs/security/detecting-multi-stage-attacks-on-aws-a-guide-to-cross-service-signal-correlation/

A single alert from one security service tells you something happened. Read that signal alongside activity from other services and your own business context, and you will know whether what happened is part of a multi-stage attack.

Consider a short sequence. An identity calls GetCallerIdentity from a source address it hasn’t previously used. Within minutes, that same identity runs a burst of List and Describe calls across several services, and some of them fail with AccessDenied. Soon after, a large volume of data leaves your environment toward a domain that was registered last week. Amazon GuardDuty might already flag pieces of this, such as the reconnaissance from an unfamiliar source, through finding types like Recon:IAMUser/* or Discovery:S3/*. What you gain from correlating the pieces yourself is a single view of the sequence, tied to your own business context, so you can act on the whole rather than triaging findings one at a time.

This post is for security engineers and security operations teams who run Amazon Web Services (AWS) detection services and want to catch patterns specific to their environment. You will see how AWS detection and your business context fit together, and how to build correlations that use that context. The examples run in Amazon CloudWatch Logs Insights so you can try them today, and the closing section describes how to grow them into an automated pipeline. The walkthrough later in this post lists the prerequisites for these queries.

Start with AWS detection services

Begin with the AWS detection services. They cover the threats common across customers, and everything in this post is built on them.

Turn these on and tune them before you build anything custom. Tuning means adjusting sensitivity to reduce false positives for your environment, choosing which data sources each service monitors, and suppressing findings for known-good patterns.

GuardDuty correlates multi-stage attacks for you

Before you build anything by hand, see what GuardDuty already does for you. Amazon GuardDuty Extended Threat Detection correlates signals across multiple data sources including AWS CloudTrail, Amazon S3 data events, runtime monitoring, Amazon Elastic Kubernetes Service (Amazon EKS) audit logs, and more, then raises a single critical severity attack sequence finding when it spots a multi-stage pattern. It recognizes sequences such as credential compromise followed by data exfiltration, maps them to MITRE ATT&CK tactics, and attaches a timeline and remediation guidance. If you have GuardDuty enabled today, then GuardDuty Extended Threat Detection is already enabled by default and needs no queries from you. For details on how GuardDuty charges apply, see Amazon GuardDuty pricing.

The credential compromise sequence in the opening example is the kind of universal pattern GuardDuty Extended Threat Detection is built to catch, so rely on it for those. Attack sequence findings show up in the GuardDuty console next to your other findings, and they route to Security Hub and your response workflows the same way.

GuardDuty handles the threats that look the same in every account. What it doesn’t have is the context that makes a given action suspicious in your account. That’s what you provide.

Add your business context

Business context is what only you know about your environment: which buckets hold sensitive data, which principals have a reason to touch which resources, which role chains your policy permits, and when your production change windows open. GuardDuty Extended Threat Detection learns from patterns common across customers, but it can’t answer these environment-specific questions. Express them as correlations and you add a detection layer tuned to your environment. Each of the following four patterns turns one of these facts into a query.

Run these queries in the AWS Management Console for CloudWatch by choosing Logs, then Logs Insights, using the CloudWatch Logs Insights query language. Most read CloudTrail events from a CloudWatch Logs log group that your trail delivers to. If your trail writes only to Amazon S3, add CloudWatch Logs delivery on the trail, or run equivalent queries in Amazon Athena (a serverless query service for analyzing data in Amazon S3 using SQL).

Note: The queries and code in this post use placeholder values. Replace them with your own before running: your-sensitive-bucket (your S3 bucket name), your-key-id (your AWS KMS key ID), region (your AWS Region, such as us-east-1), account-id (your 12-digit AWS account ID), and aws-cloudtrail-logs-my-trail (your CloudTrail log group name).

A note on multi-account environments. In AWS Organizations, an organization trail delivers every account’s events to one log group, so these queries work as-is but return cross-account results. Filter by recipientAccountId for account-scoped views. Without an organization trail, run queries per account or use Amazon Security Lake as a central query surface.

The attack chain mapped to AWS services

Multi-stage attacks move through five phases, and each phase leaves a signal in a different service. These signals surface across three log sources: CloudTrail, which records API activity in your account; Amazon VPC Flow Logs, which capture network connection metadata; and Amazon Route 53 Resolver query logs, which record DNS queries from your VPCs.

  • Initial access – Stolen credentials reach your environment. CloudTrail records GetCallerIdentity, GetSessionToken, or AssumeRole from an unfamiliar source.
  • Discovery – The threat actor enumerates with List, Describe, and Get calls, often triggering AccessDenied responses.
  • Privilege escalation – The threat actor chains roles or edits policies. CloudTrail records AssumeRole sequences, PutRolePolicy, or CreateAccessKey.
  • Lateral movement – The threat actor moves across accounts or AWS Regions, assuming roles and creating resources in unfamiliar places.
  • Exfiltration – Data leaves through GetObject calls at scale, large outbound transfers in VPC Flow Logs, and DNS queries in Route 53 Resolver query logs to recently registered domains.

Figure 1 shows the five attack phases mapped to the AWS log source that records each one.

Figure 1: Attack chain mapped to AWS services

Figure 1: Attack chain mapped to AWS services

GuardDuty Extended Threat Detection watches this chain for universal patterns. The four patterns that follow add the dimension you supply: your business context.

Pattern one: Sensitive data access by an unexpected principal

Your data classification and access norms drive this detection. One bucket holds customer records, another holds public web assets, and you know which principals have a reason to read the customer records, which are sensitive. Encode that knowledge and an ordinary looking read turns into something worth chasing.

Three signals converge here. CloudTrail shows GetObject at volume on a bucket you’ve classified as sensitive. The principal isn’t on your list of expected readers for that bucket. And VPC Flow Logs show a large outbound transfer from the same source in the same window, while DNS query logs show a recently registered destination domain, which together increase your confidence that there’s a potential threat.

CloudTrail management events don’t record GetObject. You must turn on CloudTrail data events for the buckets you care about to capture GetObject. Many teams miss GetObject because data events weren’t enabled on the relevant buckets.

This query shows bulk reads on a sensitive bucket, grouped by principal. Run it in CloudWatch Logs Insights with your CloudTrail log group selected.

fields @timestamp, userIdentity.arn, requestParameters.bucketName
| filter eventSource = "s3.amazonaws.com" and eventName = "GetObject"
| filter requestParameters.bucketName = "your-sensitive-bucket"
| stats count(*) as objectReads,
        count_distinct(requestParameters.key) as distinctObjects
        by userIdentity.arn, bin(10m)
| filter objectReads > 100
| sort objectReads desc

The threshold of 100 is a placeholder. Run the query over a week of normal activity, find the ninety-fifth percentile read count for that bucket, and set the threshold above it. Then check each principal the query returns against your expected reader list. A principal that isn’t on the list, reading at volume, is the result to investigate.

To corroborate, look for a matching outbound transfer. Switch the log group selector to your VPC Flow Logs log group and run this.

fields @timestamp, srcAddr, dstAddr, bytes
| filter action = "ACCEPT"
# exclude RFC 1918 private ranges so only external destinations remain
| filter dstAddr not like /^10\./
        and dstAddr not like /^192\.168\./
        and dstAddr not like /^172\.(1[6-9]|2[0-9]|3[0-1])\./
| stats sum(bytes) as totalBytes by srcAddr, dstAddr, bin(10m)
| filter totalBytes > 1000000000
| sort totalBytes desc

The Amazon S3 query returns a principal, and the Flow Logs query works on IP addresses, so you translate one into the other. The worked example later in this post covers that translation in full.

Picture an analytics role that reads a reporting bucket all day. One afternoon, it reads a thousand objects from your customer records bucket instead. GuardDuty stays quiet, because an authenticated role making valid GetObject calls isn’t suspicious anywhere else. Your query flags it, because that role isn’t on the expected reader list for that bucket. The classification you applied is what turns silence into a signal.

Figure 2 shows a bulk read from a sensitive bucket in CloudTrail, a large outbound transfer in VPC Flow Logs, and a young domain resolution in Route 53 Resolver logs.

Figure 2: Three signals converging within a single time window to indicate exfiltration

Figure 2: Three signals converging within a single time window to indicate exfiltration

Pattern two: A role chain that crosses your access policy

Picture a deployment that assumes one role to build, then a second to release. For one principal, that two-hop AssumeRole chain is routine; for a different principal it’s a policy violation. This pattern relies on your trust topology—the chains your organization permits—so put that knowledge in the query.

This pattern needs three conditions:

  • CloudTrail shows several AssumeRole calls from the same source inside a short window
  • The chain ends in a sensitive action such as CreateAccessKey, PutRolePolicy, or AttachUserPolicy
  • The starting identity isn’t one your policy expects to run that chain

In CloudWatch Logs Insights, select your CloudTrail log group and run this query, which surfaces chains of two or more hops.

fields @timestamp, userIdentity.arn, requestParameters.roleArn, sourceIPAddress
| filter eventName = "AssumeRole"
| stats count(*) as assumeCount,
        count_distinct(requestParameters.roleArn) as rolesAssumed
        by sourceIPAddress, bin(5m)
| filter assumeCount >= 2 and rolesAssumed >= 2
| sort assumeCount desc

Two hops is the minimum for a chain; raise the count if your environment chains roles often. Your deployment pipeline probably assumes several roles an hour, as do AWS service principals such as AWS Security Hub. Exclude the identities you expect to see assuming multiple roles, including your pipeline role and known AWS service principals. What’s left is the set to investigate, such as a person assuming several roles at an odd hour and ending in a new access key. Treat that distinction as data: list the identities and actions you consider normal, and review the chains that fall outside the list.

Pattern three: An encryption key used outside its owning workload

Resource ownership is the signal here. A given AWS Key Management Service (AWS KMS) key creates and controls the encryption keys for a workload, and a single key should serve a single workload, such as a payments service. A Decrypt call against it is a valid, authorized API action, so nothing about the call itself looks wrong. The ownership rule you set is what makes another principal’s use of the key worth a second look.

This pattern applies only to customer-managed keys scoped to one workload. It doesn’t apply to AWS-managed keys (alias/aws/*) or to customer-managed keys intentionally shared across services. Confirm single-workload intent from the key policy’s Principal block before deploying this rule.

Two conditions indicate misuse:

  • CloudTrail shows Decrypt or GenerateDataKey calls on a key that’s tied to one workload
  • The calling principal isn’t the role that owns that workload

Against your CloudTrail log group, run this query to list the principals that called a specific key.

fields @timestamp, userIdentity.arn, eventName
| filter eventSource = "kms.amazonaws.com"
| filter eventName in ["Decrypt", "GenerateDataKey", "Encrypt"]
| filter resources.0.ARN = "arn:aws:kms:region:account-id:key/your-key-id"
| stats count(*) as keyUses by userIdentity.arn, eventName
| sort keyUses desc

Compare what comes back against the one workload role you expect. A principal you don’t recognize on that key is the signal. Because key misuse is an early move in data theft, this correlation catches activity that only your ownership knowledge can flag.

Consider a key that wraps your payments database. The payments service role calls it in normal operation, and nothing else should. If a developer role or a freshly created role runs Decrypt against it, the call succeeds and reads as ordinary in isolation. The reason it matters is the ownership rule you hold in your head and now state in this query.

Pattern four: A privileged action outside your change window

Start with the query, then read what it means.

fields @timestamp, userIdentity.arn, eventName, sourceIPAddress
| filter eventName in ["PutRolePolicy", "AttachRolePolicy",
        "CreateAccessKey", "AuthorizeSecurityGroupIngress", "PutBucketPolicy"]
| stats count(*) as sensitiveChanges by userIdentity.arn, eventName, sourceIPAddress
| sort sensitiveChanges desc

Run it against your CloudTrail log group, scoped to your off-hours window when you schedule it, so it returns only activity outside the change window. Your change process defines what normal looks like here: production security and identity changes flow through a pipeline during defined hours, run by a known actor. A console-driven policy change at 2:00 AM, made by a person rather than the pipeline, doesn’t fit those expectations. The signal is a sensitive change such as PutRolePolicy or AuthorizeSecurityGroupIngress, made outside the window, by a person rather than your pipeline role.

Exclude the actors you expect, such as your deployment pipeline role, your patch automation role, and AWS service principals like AWS CloudFormation and AWS Systems Manager. What remains is privileged change made outside your process, which is both what an attacker does to establish persistence and what your own change discipline says shouldn’t happen.

Your pipeline might open security group rules during a deployment every weekday afternoon. A person opening a security group rule at midnight on a weekend is the same API call carrying a very different meaning. The schedule and the actor, both facts you define, are what separate the two.

Build your first correlation rule

The following walkthrough uses pattern one as a complete example. The other three patterns follow the same design with their own queries.

Prerequisites

These prerequisites feed the queries in this walkthrough. Confirm each one before you start:

  • A CloudTrail trail logging management events to a CloudWatch Logs log group
  • CloudTrail data events enabled for your sensitive S3 buckets
  • GuardDuty enabled, with its protection plans and Extended Threat Detection
  • VPC Flow Logs on for your production VPCs
  • Amazon Route 53 Resolver query logging on

CloudTrail, GuardDuty, VPC Flow Logs, and Route 53 Resolver query logging provide the raw signals that your correlations connect. Without them, the queries in this post return empty results.

Step 1: Record the bucket and its expected readers

Choose one sensitive bucket to monitor, and write down the principals allowed to read it. Store the list where your automation can reach it, such as a configuration file in version control or an Amazon DynamoDB table (a managed NoSQL database).

{
  "customer-records-prod": [
    "arn:aws:iam::123456789012:role/AnalyticsPipeline",
    "arn:aws:iam::123456789012:role/ComplianceAudit"
  ],
  "financial-data-archive": [
    "arn:aws:iam::123456789012:role/FinanceReporting"
  ]
}

This example hardcodes the list for simplicity. In production, load it from a DynamoDB table or Parameter Store so you can update it without redeploying.

Step 2: Baseline before you set a threshold

Run the pattern one query over one week of normal activity. Find the 95th percentile read count for the bucket and use a value greater than that as your alert threshold. This step keeps legitimate high-volume access from generating false positives later.

Set the THRESHOLD_READS environment variable to this value when you configure the function in Step 5.

Step 3: Run the access query

In the CloudWatch console:

  1. Choose Logs, then choose Logs Insights.
  2. In the Select log group(s) dropdown, select your CloudTrail log group.
  3. Set the time range to 3h (the last three hours).
  4. In the query editor, paste the pattern one query.
  5. Replace your-sensitive-bucket with your bucket name.
  6. Choose Run query.
  7. Review the principals in the results table.
  8. Compare each principal against your expected reader list from step 1, and flag any that are not on it.

Each result includes a principal that step 4 translates into an IP address.

Step 4: Correlate with network activity

CloudTrail logs actions by AWS Identity and Access Management (IAM) principal, while VPC Flow Logs record traffic by IP address. To connect the two signals, translate the principal into its address.

For a role attached to an Amazon Elastic Compute Cloud (Amazon EC2) instance, the userIdentity.principalId field includes the instance ID after the colon, in the form AROAEXAMPLE:i-1234567890abcdef0. Copy the instance ID and look up its private IP address.

aws ec2 describe-instances \
  --instance-ids i-1234567890abcdef0 \
  --query "Reservations[0].Instances[0].PrivateIpAddress" \
  --output text

Other compute types differ. A VPC-connected AWS Lambda function sends traffic through elastic network interfaces in your subnets, so correlate on those interface addresses. An Amazon Elastic Container Service (Amazon ECS) task records its network interface in task metadata. For a plain assumed-role session with no instance behind it, the sourceIPAddress field in CloudTrail already holds the caller’s address, so you correlate on it directly.

Run the Flow Logs query from pattern one, filtering srcAddr to that address within 10 minutes of the Amazon S3 read timestamp. A match places the same source behind both the sensitive read and a large external transfer in one window. CloudTrail events reach CloudWatch Logs 5–15 minutes after the API call, so correlate on eventTime rather than query time. Query a wider lookback than your correlation window: for example, look back 30 to 60 minutes but correlate on a 10-minute eventTime window. Steps 3 and 4 are manual validation; step 5 automates them.

Figure 2 shows DNS resolution as a third corroborating signal. This walkthrough implements the CloudTrail and VPC Flow Logs correlation. To add DNS, apply the same run_query() pattern against your Route 53 Resolver query log group.

Step 5: Automate the check

Move the query into a Lambda function (serverless compute that runs your code without a server to manage), send results to a notification channel, and schedule regular runs. Work through the following sub-procedures.

To create the notification channel

  1. Open the Amazon Simple Notification Service (Amazon SNS) console. Amazon SNS is a managed messaging service that delivers notifications to subscribers.
  2. In the navigation pane, choose Topics.
  3. Choose Create topic.
  4. For Type, select Standard.
  5. For Name, enter security-correlation-alerts.
  6. Choose Create topic.
  7. Note the topic Amazon Resource Name (ARN) at the top of the topic details page. You will use it in the function.
  8. Choose Create subscription.
  9. For Protocol, select Email.
  10. For Endpoint, enter your email address or incident management endpoint.
  11. Choose Create subscription, then confirm the subscription from the email AWS sends.

To create the EventBridge Scheduler execution role

The schedule needs a role that lets it invoke your function, and its trust policy needs conditions that pin the role to the schedule you own. Without those conditions, another account with access to the scheduler service could theoretically call this role; a class of misuse known as the confused deputy problem.

1. Create a trust policy file named scheduler-trust-policy.json.

{
  "Version": "2012-10-17",
  "Statement": [
    {
      "Effect": "Allow",
      "Principal": { "Service": "scheduler.amazonaws.com" },
      "Action": "sts:AssumeRole",
      "Condition": {
        "StringEquals": {
          "aws:SourceAccount": "ACCOUNT-ID"
        },
        "ArnLike": {
          "aws:SourceArn": "arn:aws:scheduler:REGION:ACCOUNT-ID:schedule/*/s3-access-correlation-hourly"
        }
      }
    }
  ]
}

2. Create the role, then attach permission to invoke the function. Scope Resource to the specific function ARN so this role can’t invoke anything else.

aws iam create-role \
  --role-name EventBridgeSchedulerRole \
  --assume-role-policy-document file://scheduler-trust-policy.json

aws iam put-role-policy \
  --role-name EventBridgeSchedulerRole \
  --policy-name LambdaInvokePolicy \
  --policy-document '{
    "Version": "2012-10-17",
    "Statement": [
      {
        "Effect": "Allow",
        "Action": "lambda:InvokeFunction",
        "Resource": "arn:aws:lambda:REGION:ACCOUNT-ID:function:CorrelationFunction"
      }
    ]
  }'

When you create the function, Lambda automatically creates an execution role. You will attach the permissions this function needs to that role in a later step.

To deploy the correlation function

  1. Open the Lambda console.
  2. Choose Create function.
  3. For Function name, enter CorrelationFunction.
  4. For Runtime, select the latest Python runtime.
  5. Choose Create function.
  6. On the Code tab, replace the default code with the following function, then choose Deploy.
import os
import time
import logging
import boto3
from botocore.exceptions import ClientError

logger = logging.getLogger()
logger.setLevel(logging.INFO)

logs = boto3.client("logs")
sns = boto3.client("sns")
ec2 = boto3.client("ec2")

CLOUDTRAIL_LOG_GROUP = os.environ["CLOUDTRAIL_LOG_GROUP"]
FLOWLOGS_LOG_GROUP = os.environ["FLOWLOGS_LOG_GROUP"]
SNS_TOPIC = os.environ["SNS_TOPIC_ARN"]
BUCKET = os.environ["SENSITIVE_BUCKET"]
THRESHOLD = int(os.environ.get("THRESHOLD_READS", "100"))

# Expected readers per bucket
EXPECTED_READERS = {
    "customer-records-prod": [
        "arn:aws:iam::123456789012:role/AnalyticsPipeline",
        "arn:aws:iam::123456789012:role/ComplianceAudit",
    ],
}


def run_query(log_group, query, start, end):
    """Start a Logs Insights query and wait for it to finish."""
    started = logs.start_query(
        logGroupName=log_group,
        startTime=start,
        endTime=end,
        queryString=query,
    )
    query_id = started["queryId"]
    while True:
        outcome = logs.get_query_results(queryId=query_id)
        if outcome["status"] in ("Complete", "Failed", "Cancelled"):
            break
        time.sleep(1)
    if outcome["status"] != "Complete":
        raise RuntimeError(f"Query did not complete: {outcome['status']}")
    return [{f["field"]: f["value"] for f in row} for row in outcome["results"]]


def private_ip_for_principal(principal_id):
    """Resolve an EC2 instance role principalId to its private IP."""
    if ":" not in principal_id:
        return None
    instance_id = principal_id.split(":", 1)[1]
    if not instance_id.startswith("i-"):
        return None
    reservations = ec2.describe_instances(InstanceIds=[instance_id])
    for reservation in reservations["Reservations"]:
        for instance in reservation["Instances"]:
            return instance.get("PrivateIpAddress")
    return None


def egress_bytes(src_addr, start, end):
    """Sum external egress bytes for one source address."""
    query = f"""
    fields srcAddr, dstAddr, bytes
    | filter action = "ACCEPT" and srcAddr = "{src_addr}"
    | filter dstAddr not like /^10\\./
            and dstAddr not like /^192\\.168\\./
            and dstAddr not like /^172\\.(1[6-9]|2[0-9]|3[0-1])\\./
    | stats sum(bytes) as totalBytes
    """
    rows = run_query(FLOWLOGS_LOG_GROUP, query, start, end)
    if rows and rows[0].get("totalBytes"):
        return int(rows[0]["totalBytes"])
    return 0


def lambda_handler(event, context):
    try:
        # 1-hour lookback absorbs CloudTrail's 5-15 min delivery latency;
        # correlation happens on eventTime via 10-min bins in the query below.
        end = int(time.time())
        start = end - 3600  # 1 hour lookback
        allowed = EXPECTED_READERS.get(BUCKET, [])

        access_query = f"""
        fields userIdentity.arn, userIdentity.principalId
        | filter eventSource = "s3.amazonaws.com" and eventName = "GetObject"
        | filter requestParameters.bucketName = "{BUCKET}"
        | stats count(*) as objectReads
                by userIdentity.arn, userIdentity.principalId, bin(10m)
        | filter objectReads > {THRESHOLD}
        """

        for row in run_query(CLOUDTRAIL_LOG_GROUP, access_query, start, end):
            principal = row.get("userIdentity.arn")
            if not principal or principal in allowed:
                continue

            message = (
                f"Principal {principal} read {row.get('objectReads')} "
                f"objects from {BUCKET}."
            )

            ip = private_ip_for_principal(row.get("userIdentity.principalId", ""))
            if ip and egress_bytes(ip, start, end) > 1_000_000_000:
                message += (
                    f" The same source ({ip}) also sent a large volume of "
                    f"data to external destinations in the same window."
                )

            sns.publish(
                TopicArn=SNS_TOPIC,
                Subject="Unexpected S3 access detected",
                Message=message,
            )
    except ClientError as error:
        logger.error(f"AWS API error: {error}")
        raise
    except Exception as error:
        logger.error(f"Unexpected error: {error}")
        raise
    finally:
        logger.info("Correlation check completed")

  1. On the Configuration tab, choose General configuration, then choose Edit. Set Timeout to 5 minutes (300 seconds). CloudWatch Logs Insights queries run asynchronously and can take 30 to 60 seconds against large log groups. Choose Save.
  2. On the Configuration tab, choose Environment variables, then choose Edit, and add CLOUDTRAIL_LOG_GROUP, FLOWLOGS_LOG_GROUP, SNS_TOPIC_ARN, SENSITIVE_BUCKET, and THRESHOLD_READS.
  3. On the Configuration tab, choose Permissions, open the execution role, and attach the following least-privilege policy.
{
  "Version": "2012-10-17",
  "Statement": [
    {
      "Effect": "Allow",
      "Action": ["logs:StartQuery", "logs:GetQueryResults"],
      "Resource": [
        "arn:aws:logs:REGION:ACCOUNT-ID:log-group:aws-cloudtrail-logs-my-trail:*",
        "arn:aws:logs:REGION:ACCOUNT-ID:log-group:vpc-flow-logs:*"
      ]
    },
    {
      "Effect": "Allow",
      "Action": "ec2:DescribeInstances",
      "Resource": "*"
    },
    {
      "Effect": "Allow",
      "Action": "sns:Publish",
      "Resource": "arn:aws:sns:REGION:ACCOUNT-ID:security-correlation-alerts"
    }
  ]
}

Replace REGION, ACCOUNT-ID, and the log-group names with your values. The ec2:DescribeInstances action doesn’t support resource-level permissions, so Resource: "*" is required for that statement; the other statements are scoped to specific ARNs.

To schedule automated runs

Amazon EventBridge (a serverless event bus that connects applications using events) runs targets on a schedule. Create one from the command line, using the role you made earlier.

aws scheduler create-schedule \
  --name s3-access-correlation-hourly \
  --schedule-expression "rate(1 hour)" \
  --target "Arn=arn:aws:lambda:REGION:ACCOUNT-ID:function:CorrelationFunction,RoleArn=arn:aws:iam::ACCOUNT-ID:role/EventBridgeSchedulerRole" \
  --flexible-time-window "Mode=OFF"

Step 6: Add enrichment context (optional)

Enrichment cuts triage time by adding an independent signal, but it isn’t required for the correlation to work. This step adds costs. You pay your geolocation provider for API calls, and the additional Lambda execution time increases your Lambda charges. To add IP geolocation, sign up for a geolocation API, add this function to the code, and call it where the handler resolves an IP.

import urllib.request
import json

def geo_context(ip_address):
    """Enrich an IP address with geolocation data from your provider."""
    try:
        url = f"https://your-geolocation-api.example/json/{ip_address}"
        with urllib.request.urlopen(url, timeout=5) as response:
            data = json.load(response)
        return {
            "country": data.get("country_name"),
            "city": data.get("city"),
            "org": data.get("org"),
        }
    except Exception as error:
        logger.warning(f"Geolocation lookup failed for {ip_address}: {error}")
        return None

Inside the handler’s loop, after you resolve ip, append the location to the alert.

            if ip:
                geo = geo_context(ip)
                if geo:
                    message += (
                        f" Source location: {geo['city']}, "
                        f"{geo['country']} ({geo['org']})."
                    )

Step 7: Scale to additional patterns and accounts

As your library grows, move the logic into automated pipelines with EventBridge, Lambda, and AWS Step Functions (a serverless orchestration service that coordinates multiple services into workflows), and surface correlations next to findings in Security Hub. For cross-service correlation at scale, CloudWatch unified data and telemetry capabilities can convert security and compliance data into the OCSF format and let you query sources such as CloudTrail, VPC Flow Logs, and DNS logs from one interface. Security Lake with Athena is a strong option for long-term analysis. Choose the endpoint that fits your retention and query needs.

Figure 3 shows a correlation pipeline built on AWS services including EventBridge, Lambda, Step Functions, and AWS Security Hub. The pipeline runs from data sources through scheduled queries and enrichment to automated response and centralized visibility.

Figure 3: A correlation pipeline built on AWS services

Figure 3: A correlation pipeline built on AWS services

Conclusion

You now have four correlation patterns that layer your business context on top of GuardDuty Extended Threat Detection to catch attacks specific to your environment. A few principles carry across every correlation you build.

  • Identity is your primary correlation key: Track the same principal across services.
  • Time windows matter, but they depend on the attack: Events minutes apart are usually related for fast, automated sequences; the ten-minute bins here work for that pattern. Slow or manual reconnaissance can stretch across hours or days, so widen the window when the pattern is deliberate rather than automated.
  • Context is what you add: Your data classification, access norms, resource ownership, and change windows are signals you bring to detection.
  • Start with one rule: A single well-tuned correlation catches more significant activity than a wall of uncorrelated alerts.

GuardDuty Extended Threat Detection handles the multi-stage patterns common across customers. The correlations in this post add the layer that only your business context can supply. Start with one pattern this week, validate it against your own traffic, and add the next pattern after the first proves reliable.

Have you built correlation rules for patterns not covered here? Share your experience in the Comments section below.

Further reading


Nisha Kashyap

Nisha Kashyap

Nisha Kashyap is a Senior Support Security Engineer at AWS. She works on threat detection and security operations, helping customers investigate security events and build detection that connects signals across AWS services and reflects their own environment.

Accelerating AWS Network Firewall troubleshooting with AWS DevOps Agent

Post Syndicated from Salman Ahmed original https://aws.amazon.com/blogs/security/accelerating-aws-network-firewall-troubleshooting-with-aws-devops-agent/

When an administrator introduces a rule change in AWS Network Firewall and network connectivity is disrupted, pinpointing the cause requires inspecting multiple points in the traffic path. The firewall gives you stateless and stateful rule engines, domain rules, and routing to the firewall endpoint inside your Amazon Virtual Private Cloud (Amazon VPC). A network drop looks the same from the workload no matter where it started. Isolating the cause means correlating the alert and flow logs with the firewall configuration, route tables, and recent API calls in AWS CloudTrail that might have changed them. That manual correlation is exactly where AWS DevOps Agent helps, accelerating root cause analysis so you can restore connectivity in minutes instead of hours.

AWS DevOps Agent does that correlation for you. As your always-available operations teammate, it resolves and proactively prevents operational issues across AWS, multicloud, and on-premises environments. When an Amazon CloudWatch alarm triggers, it reaches the agent through a webhook. The agent then reads the firewall configuration and logs through AWS APIs, ties the drop to recent API activity, and returns a root cause with a mitigation plan you review before you apply it.

This post connects CloudWatch monitoring to DevOps Agent. It walks through three Network Firewall failures from end to end. The first is a domain deny list blocking a legitimate endpoint. The second is a stateless rule priority misconfiguration. The third is an asymmetric cross Availability Zone (AZ) routing drop. Each maps to a different layer, so each leads down a different investigation path. An AWS Cloud Development Kit (AWS CDK) app deploys the whole environment in your own account so you can reproduce each failure and follow along.

The sample workload

As part of this blog post, we provide a CDK stack that deploys both the AWS DevOps Agent Space and a sample workload used to walk through three separate troubleshooting scenarios. A single t3.micro instance in a protected subnet checks its connectivity to a test endpoint on a continuous loop and publishes results to CloudWatch. Traffic takes the internet egress path through Network Firewall, the NAT gateway, and the internet gateway, so the firewall can intercept or drop it. After completing the walkthrough, you can apply the same troubleshooting techniques with DevOps Agent against your own Network Firewall deployments.

The test endpoint runs in a separate VPC deployed by the same CDK app. It serves HTTPS on port 443 and TCP on port 9142, giving each scenario a different protocol layer to exercise: Scenario 1 targets a TLS connection on 443 (matched by Server Name Indication), Scenario 2 targets a TCP connection on 9142, and Scenario 3 exercises the whole egress path.

A live status page shows one card per scenario plus the network topology. The whole stack deploys from a single CDK app across two Availability Zones, each with a firewall endpoint and NAT gateway, which is what makes Scenario 3 possible.

As shown in the following figure, the egress data path runs from the workload through Network Firewall and the NAT and internet gateways to the test endpoint. The alarm pipeline runs from CloudWatch through Amazon Simple Notification Service (Amazon SNS) and the webhook AWS Lambda function to DevOps Agent.

Figure 1: The sample workload

Figure 1: The sample workload

To use this with your own workload, you need a CloudWatch alarm that detects the connectivity problem and the webhook pipeline (SNS topic and Lambda function) that delivers it to DevOps Agent. The agent reads your firewall configuration, logs, and CloudTrail through AWS APIs, so no additional instrumentation is needed on the firewall side.

Prerequisites

To follow along with this post, you need:

Deploy the sample workload

Clone the project and deploy it into us-east-1 with one command (set awsRegion to use another AWS Region).

git clone https://github.com/aws-samples/sample-accelerating-aws-network-firewall-troubleshooting-with-aws-devops-agent.git
cd sample-accelerating-aws-network-firewall-troubleshooting-with-aws-devops-agent
bash scripts/deploy.sh

The script checks prerequisites, installs dependencies, compiles and tests, and bootstraps the CDK if needed. It then deploys all the stacks from a clean baseline and prints the outputs, including the status-page URL and sign-in details.

  1. Open the status-page link (an https://<random-id>.cloudfront.net address).
  2. Sign in using the username and password provided from the CDK output and confirm all three cards show the green Healthy status.
  3. Keep the page open while you run the scenarios.

Connect AWS DevOps Agent

To connect AWS DevOps Agent to the alarm pipeline

  1. In the AWS DevOps Agent console, open the nf-devops-agent-space Agent Space created by the CDK deployment.
  2. Configure the DevOps Agent webhook and download the CSV file with the webhook URL and signing secret.
  3. On the status page, choose Configure webhook, paste the URL and signing secret, and save. The page writes them to the nf-devops-agent-webhook-credentials AWS Secrets Manager secret, so there is no AWS CLI or console step. Until you set it, the bridge Lambda function sees a placeholder and skips delivery.
  4. Verify the path before you run a scenario. In the Lambda console, open nf-devops-agent-webhook and use the Test tab with this event.
    {
      "Records": [
        {
          "Sns": {
            "Message": "{\"AlarmName\":\"TEST-webhook-verification\",\"AlarmDescription\":\"[TEST] Webhook integration test - not a real alarm.\",\"NewStateValue\":\"ALARM\",\"NewStateReason\":\"[TEST] Manual webhook connectivity test. Safe to ignore.\",\"Region\":\"us-east-1\"}"
          }
        }
      ]
    }

  5. A 200 response confirms the path, and a test investigation appears in the DevOps Agent Operator Web App view.

How the alarm pipeline works

Every scenario reaches DevOps Agent the same way. A CloudWatch alarm moves to ALARM and notifies the SNS topic. Amazon SNS invokes a Lambda function. The function reads the webhook URL and signing secret from Secrets Manager, signs an alarm payload, and POSTs it to the DevOps Agent webhook (as shown in Figure 1). Amazon SNS also provides delivery retries, fan-out to other subscribers, and cross-account publishing.

  • Prebuilt Network Firewall metric (Scenario 1) Alarm-1 watches the DroppedPackets metric, summed across the stateful streams, and triggers when drops rise above a baseline threshold. This requires no workload or custom metric and works on an already-deployed firewall. However, it only tells you that the firewall is dropping packets, not which rule is responsible.
  • Application health metric (Scenarios 2 and 3) Alarm-2 and Alarm-3 watch a custom metric from a connectivity check. Use this for an alarm tied to user-facing impact or to tell one traffic path from another, which requires running a component that emits the metric.
Alarm Source Triggers when
Alarm-1 Native AWS/NetworkFirewall DroppedPackets The firewall’s dropped-packet count rises above the baseline
Alarm-2 Custom application health metric The port 9142 (TCP) connectivity check to the test endpoint is being dropped
Alarm-3 Custom application health metric The cross Availability Zone connectivity check is being dropped

Run the scenarios

Work through each of the scenarios one at a time, following the same cycle. Interrupt network connectivity, watch the alarm trigger, let DevOps Agent investigate, apply the recommended fix, and confirm recovery before moving on.

The status-page cards follow the live CloudWatch alarm state. A card shows a green dot and the word Healthy when its alarm is clear, and a red dot and the word DROPPED when its alarm triggers. In the DROPPED state the card also adds a Condition: line describing what’s being dropped, which isn’t shown when the card is healthy. Network Firewall applies changes to new flows, so a change shows within a minute or two. Recovery comes from the mitigation DevOps Agent recommends, which you review and apply.

Scenario 1. Domain deny list blocking a legitimate endpoint

At baseline, the rg-domain Suricata domain rule group denies only an unused placeholder, so the test endpoint stays reachable. The rule group inspects the TLS Server Name Indication (SNI) on each outbound connection and drops any that matches a denied domain. The exact rule syntax and console steps follow.

To add the domain deny rule

  1. Go to the Amazon VPC console.
  2. In the navigation pane, under Network Firewall, choose Network Firewall rule groups.
  3. Choose the rg-domain rule group to open its details page.
  4. In the Rules section, choose Edit.
  5. The rules box already contains two baseline placeholder rules (they match blocked.placeholder.invalid, so nothing real is denied). Leave those in place. Find the <app-endpoint-dns> value for Scenario 1 in the deployment script output (a Nework Load Balancer (NLB) DNS name such as NfTest-AppNl-a1b2C3dEf4G5-1234abcd5678efgh.elb.us-east-1.amazonaws.com). On a new line below the existing rules, add a drop rule that matches that DNS name on the TLS SNI, then choose Save.
    drop tls $HOME_NET any -> $EXTERNAL_NET any (ssl_state:client_hello; tls.sni; content:"<app-endpoint-dns>"; startswith; nocase; endswith; msg:"S1 domain denylist"; flow:to_server, established; sid:2000002; rev:1;)

  6. After saving, the rules box holds all three lines. The two placeholders remain, plus the new drop rule for the endpoint DNS name (note the distinct sid 2000002).
Figure 2: Scenario 1 – Firewall rule change blocking the connection

Figure 2: Scenario 1 – Firewall rule change blocking the connection

What happens. The workload’s HTTPS check to the test endpoint times out, the “AWS/NetworkFirewall DroppedPackets metric climbs above baseline, and Alarm-1 moves to ALARM. The Scenario 1 card reads DROPPED (with the condition Firewall dropping the monitored domain on its allow/deny rules), while the Scenario 2 and Scenario 3 cards stay Healthy (Figure 3). On the topology, the alarm pipeline from CloudWatch through Amazon SNS and Lambda to DevOps Agent and the workload-to-firewall inspect lines both turn amber, which the legend defines as collateral / alarm active, because the packets are now dropped at the firewall. To demonstrate the resulting failure, the HTTPS · SNI line from the internet gateway to the test endpoint is shown in red, which the legend defines as dropped (root cause).

Figure 3: Scenario 1 active – Traffic blocked at the firewall

Figure 3: Scenario 1 active – Traffic blocked at the firewall

Let DevOps Agent investigate. The agent runs several lines of investigation in parallel and correlates them:

  1. Reads the DroppedPackets metric and correlates the spike with a simultaneous drop in passed packets, confirming the firewall is actively blocking traffic.
  2. Reads the ALERT log and finds the workload’s TLS connections to the test endpoint blocked by the S1 domain denylist rule.
  3. Compares the current state against a baseline window, where the same endpoint was reachable with no alerts, which shows the block is new.
  4. Searches CloudTrail and surfaces the UpdateRuleGroup call that added the deny rule, identifying the user, role, and timestamp approximately one minute before the drops began.
  5. Reports the root cause as that manual rule-group change. Recommends removing the deny entry or adding an allow exception and enabling FirewallPolicyChangeProtection to prevent unauthorized changes.
  6. Presents this as a plan you review and apply, not an automatic change.

In the DevOps Agent Operator Web App view, the agent first restates the Alarm-1 trigger and confirms the firewall is dropping packets above the threshold (Figure 4).

Figure 4: Scenario 1 – The symptom

Figure 4: Scenario 1 – The symptom

Next, the agent identifies the root cause: a manual update to the rg-domain rule group that added a domain deny rule (SID 2000002) shortly before the alarm fired, blocking TLS connections to the ELB endpoint (Figure 5).

Figure 5: Scenario 1 – The root cause

Figure 5: Scenario 1 – The root cause

Finally, the agent presents a mitigation plan, recommending you remove the problematic deny rule (SID 2000002) to restore connectivity (Figure 6).

Figure 6: Scenario 1 – The mitigation plan

Figure 6: Scenario 1 – The mitigation plan

Note: In a real-world environment, this type of rule typically exists for a reason. Before removing it, verify whether it was intentional but scoped too broadly. If so, refine the rule to block only unauthorized endpoints rather than removing it entirely.

Confirm recovery. Apply the change the agent recommends. After the deny entry is gone, DroppedPackets falls back to baseline, Alarm-1 clears, and the card returns to green. Move on to Scenario 2.

Scenario 2. Stateless rule priority misconfiguration

At baseline, the rg-stateless-priority stateless rule group keeps the allow rule at priority 100 and the drop rule at 200 for the test class, TCP destination port 9142. The workload opens a TCP connection to the test endpoint on this port. Lower priority numbers evaluate first, so the allow rule wins. This scenario uses port 9142 instead of 443 to demonstrate a stateless rule, which matches on the packet’s 5-tuple (protocol, ports, addresses) rather than application content.

Introduce the change. Invert the two rule priorities so the drop rule evaluates before the allow rule. This is the kind of change a rushed rule edit can introduce.

To invert the stateless rule priorities

  1. Go to the Amazon VPC console.
  2. In the navigation pane, under Network Firewall, choose Network Firewall rule groups.
  3. Choose the rg-stateless-priority rule group to open its details page.
  4. In the Rules section, choose Edit.
  5. Raise the (Action: Pass) rule’s priority number so it sits after the (Action: Drop) rule, then choose Save. For example, change the (Action: Pass) rule from 100 to 300 (any number higher than the drop rule’s 200 works). You only need to move one rule, and using 300 avoids a clash with the drop rule that already sits at 200. Network Firewall evaluates the lowest priority number first, so the (Action: Drop) rule at 200 now wins for this traffic class, ahead of the (Action: Pass) rule at 300.
Figure 7: Scenario 2 – Rule priority change blocking the traffic class

Figure 7: Scenario 2 – Rule priority change blocking the traffic class

What happens. The drop rule now wins, the TCP connection to the test endpoint on port 9142 times out, the StatelessRuleFailures metric climbs above baseline, and Alarm-2 moves to ALARM. The Scenario 2 card reads DROPPED (with the condition Stateless rules dropping the monitored traffic class), while the Scenario 1 and Scenario 3 cards stay Healthy (Figure 8). On the topology, the alarm pipeline from CloudWatch through Amazon SNS and Lambda to DevOps Agent and the workload-to-firewall inspect lines both turn amber, which the legend defines as collateral / alarm active, because the packets are now dropped at the firewall. To demonstrate the resulting failure, the TLS :9142 line from the internet gateway to the test endpoint is shown in red, which the legend defines as dropped (root cause).

Figure 8: Scenario 2 active

Figure 8: Scenario 2 active

Let DevOps Agent investigate. A stateless drop happens before traffic reaches the stateful inspection engine, so it produces no ALERT log entries. The agent turns to configuration and flow logs instead:

  1. Reads the stateless rule group state and finds the drop rule at the lower priority number, ahead of the pass rule, so the drop evaluates first.
  2. Reads the flow logs and sees passed packets drop to zero within a minute of the change.
  3. Searches CloudTrail and surfaces the UpdateRuleGroup call that inverted the priorities, identifying the user, role, and timestamp about a minute before the alarm.
  4. Reports the root cause as that priority inversion. Recommends removing the redundant drop rule and managing the rule group through infrastructure-as-code (IaC) to prevent manual misconfigurations.
  5. Presents this as a plan you review and apply, not an automatic change.

In the DevOps Agent Operator Web App view, the agent first restates the Alarm-2 trigger and confirms that a workload connectivity health check is failing because the firewall’s stateless rules are dropping egress (Figure 9).

Figure 9: Scenario 2 – The symptom

Figure 9: Scenario 2 – The symptom

Next, the agent identifies the root cause, using the rule-group state and CloudTrail to pinpoint the conflicting DROP/PASS rules, where the new DROP rule’s lower priority number makes it match first (Figure 10).

Figure 10: Scenario 2 – The root cause

Figure 10: Scenario 2 – The root cause

Finally, the agent presents a mitigation plan, recommending you remove the conflicting DROP rule at priority 200 to restore traffic flow (Figure 11).

Figure 11: Scenario 2 – The mitigation plan

Figure 11: Scenario 2 – The mitigation plan

Confirm recovery. Apply the change the agent recommends. After the allow rule is ahead of the drop rule again, Alarm-2 clears and the card returns to green. Move on to Scenario 3.

Scenario 3. Asymmetric cross Availability Zone routing drop

At baseline, the protected subnet in each Availability Zone routes its egress through the firewall endpoint in that same Availability Zone , and the matching return route uses that same endpoint. One endpoint sees both directions of the flow, so the stateful engine completes the handshake. The workload runs in the protected subnet in us-east-1a (CIDR 10.0.4.0/24), so at baseline its egress and its return both use the us-east-1a firewall endpoint.

Introduce the change. Make the flow asymmetric by sending egress out one Availability Zone endpoint while the return comes back through the other. This takes two route edits, and both are required. With only the first edit the flow can still complete, so the alarm will not trigger until both are saved. It makes no firewall-policy change, mirroring a real multi-Availability-Zone routing mistake.

To create asymmetric cross Availability Zone routing

  1. Go to the Amazon VPC console and choose Route tables in the navigation pane.
  2. Flip the egress. Select the NfNetworkStack/SampleVpc/protectedSubnet1 route table (the us-east-1a protected subnet, where the workload runs). On the Routes tab, choose Edit routes. Its 0.0.0.0/0 route currently targets the us-east-1a firewall endpoint. For the target, choose Gateway Load Balancer Endpoint and select the us-east-1b firewall endpoint, then choose Save changes.
  3. Move the return. Select the NfNetworkStack/SampleVpc/publicSubnet2 route table (the us-east-1b public subnet, where egress now exits). Choose Edit routes, then Add route. For the destination enter the workload CIDR 10.0.4.0/24. For the target, choose Gateway Load Balancer Endpoint and select the us-east-1a firewall endpoint. Choose Save changes.

After both edits, a flow’s egress leaves through the us-east-1b endpoint while its return is directed to the us-east-1a endpoint. Neither endpoint sees the whole flow.

Figure 12: Scenario 3 routing change breaking the flow’s symmetry

Figure 12: Scenario 3 routing change breaking the flow’s symmetry

What happens. A new connection leaves through one endpoint. Its return arrives at the other endpoint, which never saw the connection open, so the handshake fails. Unlike Scenarios 1 and 2, this affects the whole subnet, so all egress stops and Alarm-2 and Alarm-3 both move to ALARM. The AWS/NetworkFirewall DroppedPackets alarm (Alarm-1) stays quiet because no endpoint is making a drop decision. The flow is lost to asymmetric routing rather than counted as a firewall drop. This is why monitoring application connectivity matters. A routing fault is invisible to the firewall’s own drop counter. On the status page, the Scenario 2 card reads DROPPED (with the condition “Stateless rules dropping the monitored traffic class”) and the Scenario 3 card reads DROPPED (with the condition Return traffic dropped by asymmetric cross-Availability-Zone routing), while the Scenario 1 card stays Healthy (Figure 13). On the topology, the alarm pipeline from CloudWatch through Amazon SNS and Lambda to DevOps Agent and the workload-to-firewall inspect lines both turn amber, which the legend defines as collateral / alarm active, while the egress path from the firewall through the NAT gateway and the TLS :9142 and HTTPS · routing lines to the test endpoint turn red, which the legend defines as dropped (root cause).

Figure 13: Scenario 3 – The status page during a path-wide outage

Figure 13: Scenario 3 – The status page during a path-wide outage

Let DevOps Agent investigate. Both Alarm-2 and Alarm-3 fire in the same datapoint. DevOps Agent recognizes them as linked and merges them into a single investigation:

  1. Reads the flow logs and sees bidirectional TLS connections stop abruptly, with only one-way traffic remaining and no flows reaching the established state.
  2. Reads the firewall metrics and sees received and passed packets shift from one Availability Zone to the other at the moment of the change.
  3. Calls DescribeRouteTables and finds the egress route pointing at one Availability Zone firewall endpoint while the return route points at the other.
  4. Searches CloudTrail and surfaces the ReplaceRoute and CreateRoute calls by the same user, about a minute before both alarms fired.
  5. Reports the root cause as that asymmetric routing change. Recommends restoring symmetric same-Availability-Zone routing so egress and return traverse the same endpoint.
  6. Presents this as a plan you review and apply, not an automatic change.

A mitigation plan is a recommendation you review, not an automatic change, and the right fix depends on the intended design. Restoring symmetric routing can mean sending the workload subnet’s egress back through its own-Availability-Zone firewall endpoint (this sample’s architecture) or, in a design that doesn’t inspect this path, back through a NAT gateway. The agent infers a plausible target from what it can observe, so review the specific route it proposes against your intended topology before you apply it. (Connecting your pipeline or infrastructure-as-code, covered in the next section, lets the agent recommend the target that matches your design.)

In the DevOps Agent Operator Web App view, the agent restates the Alarm-3 (AsymmetricFlowFailures) trigger and confirms the workload’s egress to a monitored endpoint is being blocked by the Network Firewall (Figure 14).

Figure 14: Scenario 3 – The symptom

Figure 14: Scenario 3 – The symptom

Next, the agent identifies the root cause: manual route table changes that created cross-AZ asymmetric routing through the network firewall, breaking its symmetric routing requirement (Figure 15)

Figure 15: Scenario 3 – The root cause

Figure 15: Scenario 3 – The root cause

Finally, the agent presents a mitigation plan, recommending you restore symmetric routing by pointing protectedSubnet1‘s default route back to the same Availability Zone firewall endpoint, so one endpoint sees both directions of the flow again (Figure 16).

Figure 16: Scenario 3 – The mitigation plan

Figure 16: Scenario 3 – The mitigation plan

Confirm recovery. Apply the change the agent recommends, after checking the route target matches your intended design. After the workload subnet’s egress and return use the same Availability Zone firewall endpoint again, the control probe recovers, the alarms clear, and every card returns to green.

Further considerations

In production a single change can trigger several alarms at the same time, as Scenario 3 shows. DevOps Agent links related investigations and works them as one, so you review a single root cause. You can validate the linked findings or unlink an alarm to investigate it independently. If you would rather collapse alarms before they reach the agent, you can add correlation logic in the bridge Lambda function, buffering and grouping by firewall. You can also add email, Amazon Simple Queue Service (Amazon SQS), or HTTP subscribers to the SNS topic, or add the webhook Lambda function to a topic you already run. DevOps Agent produces a mitigation plan but does not change your environment on its own.

You can also give the agent more to work with. DevOps Agent connects to source repositories and CI/CD pipelines, integrating with GitHub (including GitHub Enterprise Server and GitLab Self-Managed through a private connection). It can associate AWS resources with deployments of AWS CloudFormation, AWS CDK, Amazon Elastic Container Registry (Amazon ECR) images, and Terraform. With deployed configuration and recent deployment events in view, the agent correlates the disruption against the change that introduced it and recommends a fix matching your intended design. For this sample, that means recommending the workload subnet’s own Availability Zone firewall endpoint rather than a generic symmetric path.

DevOps Agent also supports proactive incident prevention. It analyzes patterns across past investigations and delivers recommendations to prevent similar issues from recurring, including governance recommendations that strengthen deployment processes and pipeline controls. For Network Firewall rule changes, this means the agent can recommend guardrails for your CI/CD pipeline based on the classes of misconfigurations it has already resolved. You can access these recommendations through the Improvements page in the DevOps Agent Operator Web App.

Clean up

Clean up the environment with one command.

bash scripts/destroy.sh

It reverts any active scenario, runs cdk destroy for all stacks, and sweeps for stragglers by the Project = nf-devops-agent tag. The main cost drivers are the two Network Firewall endpoints, the NAT gateways (one in the main VPC for each Availability Zone, one in the test-endpoint VPC), and the test endpoint’s load balancers. Each of these bills at an hourly rate for as long as it’s provisioned, whether or not traffic is flowing, so a stack left running continues to accrue charges around the clock even while idle. Running the scenarios and tearing the stack down the same day limits the cost to a few active hours rather than days of idle hourly charges.

Conclusion

In this post, we showed you how AWS DevOps Agent accelerates troubleshooting for three common network firewall connectivity issues. The first was a domain deny list. The second was a stateless priority inversion. The third was an asymmetric cross-AZ routing drop. For each one, DevOps Agent investigated the drop and returned a root cause with a mitigation plan you approve before applying. The first scenario triggered on a prebuilt Network Firewall metric, and the other two on application health metrics. That shows both ways to alarm on a firewall problem through one pipeline.

The pattern isn’t specific to Network Firewall. The same flow fits any service that emits CloudWatch metrics and logs, such as AWS WAF, security groups, and network ACLs. Clone the sample repository to explore the solution, then apply what you learn to your own firewall, application, and alarms. For more details, see the AWS Network Firewall Developer Guide and the AWS Network Firewall pricing page. Start with the Getting Started with AWS DevOps Agent guide to connect your first webhook.

Salman Ahmed

Salman is a Senior Technical Account Manager at AWS, specializing in helping customers design, implement, and optimize their AWS environments. He combines deep networking expertise with a passion for exploring emerging technologies to help organizations get the most out of their cloud investments. Outside of work, he enjoys photography, traveling, and watching his favorite sports teams.

What Happened Between OpenAI and Hugging Face?

Post Syndicated from Wade Woolwine original https://www.rapid7.com/blog/post/ai-openai-hugging-face-what-happened

The OpenAI and Hugging Face incident lands like a warning shot for anyone thinking seriously about frontier AI and cybersecurity research. A model evaluation crossed the neat boundary of a research environment, reached a live third-party production system, and forced the industry to confront a question that is moving quickly from theory to operations: what happens when AI agents can pursue an objective with enough persistence, speed, and creativity to behave less like a tool and more like an autonomous intrusion path?

According to OpenAI’s disclosure, the incident began during an internal evaluation of advanced cyber capabilities using GPT-5.6 Sol and a more capable pre-release model. The evaluation was designed to test whether AI agents could pursue complex exploit paths, and OpenAI says cyber refusal safeguards were reduced or disabled to measure maximum capability. Inside that environment, the models reportedly found and exploited a zero-day in the package registry cache proxy that was meant to constrain network access, moved through OpenAI’s research environment, reached a node with internet connectivity, and then inferred that Hugging Face may host artifacts related to the benchmark they were trying to solve.

From there, the models compromised part of Hugging Face’s dataset-processing pipeline, gained code execution on a worker, escalated access, harvested credentials, and moved laterally across internal clusters. Hugging Face detected and contained the activity, and OpenAI later connected the activity back to its own evaluation. Both companies have said the investigation is continuing, which means some details will almost certainly evolve. Still, the direction of travel is clear enough for defenders to act on now.

How did the OpenAI model evaluation reach Hugging Face?

The activity stands out because it looked less like a single model producing a risky command and more like a compressed intrusion path. Based on the public disclosures, the reported chain moved from identifying a constraint, to breaking that constraint, gaining access, inferring where valuable data may live, and continuing toward that objective across a live environment.

Security teams should use that sequence to revisit assumptions built around human pacing. Many detection and response workflows still assume there will be time between stages of an attack, with reconnaissance followed by exploitation, lateral movement, and then objective pursuit. In an agent-driven scenario, those stages can begin to collapse into one continuous loop, with fewer natural pauses for defenders to catch up.

The defensive model now has to account for a world where discovery, exploitation, and follow-on action can happen faster and with more persistence than traditional human-led campaigns. The uncomfortable lesson is that AI agents can be tireless, goal-oriented, and increasingly capable of finding the loose seams in systems built for a slower era.

The incident highlights the collapse of the traditional OODA (Observe-Orient-Decide-Act) loop. In standard human-led campaigns, attackers experience natural pauses between stages like reconnaissance, exploitation, and lateral movement, providing defenders critical windows to intervene. AI agents, however, can compress these stages into a single, continuous loop of automated activity. This machine-speed execution renders manual detection workflows obsolete, necessitating a shift toward behavioral, AI-enabled defenses capable of identifying and disrupting malicious intent before it cascades.

Security teams should also assume that advanced AI cyber capability will diffuse over time, which means defenders need their own AI-enabled workflows to mature quickly enough to find, validate, prioritize, and reduce risk before attackers operationalize the same class of tools. Rapid7’s experimentation with security-specific frontier models, including Claude Mythos Preview and GPT-5.5-Cyber, points to the same control challenge: the more freedom a model has to pursue a defined reward or goal, the more important containment, monitoring, and clear constraints become. Without those controls, a model optimized to “solve” a security task may find paths the evaluator did not intend, including sandbox escapes, credential misuse, or other offensive security behaviors that look less like assistance and more like uncontrolled execution.

Why AI evaluation environments need stronger containment

The incident raises practical questions about how frontier AI evaluations are designed and contained. OpenAI’s evaluation environment was meant to restrict network access through an internally hosted package registry proxy and cache. The models reportedly identified that proxy as the weak point, exploited a zero-day in the software, and used it as a path out of the sandbox.

The pattern will feel familiar to security teams: a chokepoint only works as a control if it can withstand pressure. Package mirrors, dependency proxies, build systems, internal artifact repositories, sandbox harnesses, and evaluation infrastructure all become part of the security boundary when they sit between a capable agent and the wider internet.

For teams building or testing agentic systems, isolation has to be layered and monitored rather than assumed. Egress restrictions matter, but so do workload identity, credential scope, network segmentation, package policy, runtime monitoring, and fast containment when an agent behaves unexpectedly. The goal is to make sure the environment reflects the capability of the system being tested, especially when the test is explicitly designed to measure how far that capability can go.

Why AI and ML pipelines are now software supply chain risk

The Hugging Face side of the incident is a reminder that AI and ML pipelines are part of the software supply chain. Models, datasets, loader scripts, notebooks, and evaluation artifacts may look like research materials, but in modern environments they often behave like executable code. Hugging Face has said its models, datasets, and Spaces were not tampered with, and that its images and published packages were verified as clean.

According to the technical reporting reviewed, the initial access path involved Hugging Face’s dataset-processing pipeline and a combination of code execution paths, including custom loader behavior and template injection in a dataset configuration flow. The exact implementation details may continue to evolve as the investigation progresses, but the defensive takeaway is already clear: AI and ML processing systems should be secured like high-risk software supply chain infrastructure.

Any system that automatically processes external datasets or model artifacts should be designed with hostile input in mind. Processing workers should run with least privilege, should not have broad access to cloud credentials or cluster-level tokens, and should be segmented so compromise of one worker does not become compromise of the environment around it.

Security teams should also hunt for early signs of intent drift inside ML workflows. Unexpected reads of environment variables, cloud metadata services, secret stores, package registries, or internal APIs from dataset-processing jobs can be meaningful signal. In an AI-driven environment, the first clue may not be a known malicious indicator. It may be a workload behaving with curiosity it should not have.

What AI guardrails mean for incident response

One of the most useful lessons for security teams came during the response, when Hugging Face’s responders reportedly needed to analyze logs containing exploit payloads, attacker commands, and command-and-control artifacts. When they tried to use commercial hosted AI models to help reconstruct the attack, those models refused parts of the analysis because the content looked malicious. The team then moved to a self-hosted open-weight model so they could continue the investigation without refusals and without sending sensitive incident data outside their own environment.

The practical issue here is guardrail asymmetry: attackers, rogue agents, or unrestricted systems may not respect usage policies, while defenders using hosted tools can be slowed by the same safety systems designed to prevent misuse. Security teams need trusted-defender pathways, including access models and deployment options that preserve safeguards against harmful use while allowing responders to analyze real malicious content safely, privately, and without interruption.

AI-assisted incident response also needs to be tested before an incident begins, especially if teams expect models to support triage, log analysis, malware review, or timeline reconstruction under pressure. Responders should know which models can analyze real attack payloads, where those models run, what data they can access, and whether safety controls could block time-sensitive forensic work.

What security teams should do about agentic AI risk

The practical response to this incident is preparation, with organizations treating AI agents as both powerful tools and potential attack surfaces when those agents can access code, credentials, infrastructure, datasets, or internal systems.

Security teams should apply familiar controls with more urgency across AI and ML environments: treat downloaded models, datasets, and loader scripts as untrusted code; enforce least privilege on AI and ML processing workers; prevent node-level compromise from becoming cluster-wide compromise; restrict access to cloud metadata endpoints and secrets; monitor unexpected outbound connections from AI-related workloads; and review whether evaluation environments have real containment or simply convenient isolation.

Detection logic needs to account for machine-speed activity. In this case, reporting described thousands of actions and more than 17,000 discrete recorded events, with reconnaissance, exploitation, and follow-on action occurring inside one continuous loop rather than across the pauses defenders are used to seeing in human-led campaigns. Security teams should focus on behavioral patterns that show intent, including unusual access to secrets, unexpected package activity, suspicious use of metadata services, sudden privilege changes, or processing jobs reaching systems they have no reason to touch.

As autonomous activity becomes faster and noisier, the bottleneck may shift from detecting that something happened to understanding what matters quickly enough to change the outcome. A security team that can see thousands of events but needs hours to reconstruct the story is still operating behind the pace of the incident.

How preemptive security helps reduce AI-driven risk

At Rapid7, our view is that this is where preemptive security becomes especially important. Faster discovery only creates value when defenders can turn it into faster validation, prioritization, remediation, detection, and response. The same principle applies to agentic AI risk. If AI accelerates how weaknesses are found and exploited, defenders need security operations that can act earlier with better context and more confidence.

That means connecting exposure management with detection and response, so teams understand which risks are exploitable, which assets matter most, what suspicious behavior is already present, and which actions will reduce risk fastest. It also means using AI carefully and practically, not as a replacement for security judgment, but as a way to reason across telemetry, reduce noise, support investigation, and help teams make decisions at the speed the threat environment now demands.

AI-enabled defense is becoming part of resilience planning, especially for organizations running critical systems or high-value digital infrastructure. The goal is to give defenders the speed, context, and consistency to operate inside the attacker’s decision cycle, without removing the judgment and accountability that effective security requires.

The OpenAI and Hugging Face incident will continue to generate debate as more details emerge, but defenders already have enough to work with. Agentic systems are beginning to test the seams between AI research, software supply chain security, cloud infrastructure, and incident response. The organizations best positioned for what comes next will be the ones making those seams visible, monitored, and resilient before the next incident puts them under pressure.

What the June 2026 Threat Technique Catalog update means for your AWS environment

Post Syndicated from Shannon Brazil original https://aws.amazon.com/blogs/security/what-the-june-2026-threat-technique-catalog-update-means-for-your-aws-environment/

The AWS Customer Incident Response Team (AWS CIRT) encounters patterns that repeat across engagements when helping customers respond to security incidents. We’re passionate about making sure that information is accessible so that everyone can improve their security posture and their organization’s resilience to disruption. The primary method we use to share this information is the Threat Technique Catalog for AWS (TTC). The latest update to the catalog for June 2026 focuses on container security, organization-level trust, and compute hijacking. Each new entry reflects something we’ve encountered in practice, and each provides straightforward mitigation. This post breaks down what changed, why it matters, and what you can do about it today.

What we’re seeing

We’ve added five new entries to the TTC.

EKS workload modification

Amazon Elastic Kubernetes Service (Amazon EKS) gives teams powerful orchestration capabilities. We’re seeing threat actors who have obtained Kubernetes credentials or an AWS Identity and Access Management (IAM) role with EKS permissions modify running workloads—altering container images, injecting sidecar containers, or changing pod specifications to introduce malicious code into a deployment.

Nothing new is created. The workload already exists, it might be running in production, and by modifying it in place the threat actor inherits the network access, service account permissions, and data access the legitimate workload already had. Without admission controllers or image verification, these changes can go unnoticed until the impact shows up downstream. Enforcing image signing through admission controllers, restricting workload changes with Kubernetes role-based access control (RBAC), and enabling Amazon GuardDuty EKS Protection to surface anomalous cluster activity all reduce this risk. For more information, see EKS Modification – Workload Integrity Degradation.

Exploit public-facing application – EKS

Publicly exposed Kubernetes API servers and misconfigured ingress controllers continue to be an entry point we see exploited. This technique captures threat actors targeting the customer-deployed workloads running on Amazon EKS—not EKS itself—and their exposure to the internet.

The pattern starts with an exposed service and an application-level weakness, then pivots from the compromised pod toward broader cluster access. When inside a pod, a threat actor can query the instance metadata service, read mounted service account tokens, or move laterally across the cluster network. Limiting public exposure of the Kubernetes API server, applying network policies to restrict pod-to-pod communication, and running workloads with least-privilege service accounts reduce the risk of this technique succeeding. For more information about this technique, see Exploit Public-Facing Application.

Assume root into organization member account

AWS Organizations centralizes trust across member accounts, and that trust runs in one direction—from the management account downward. We’ve observed threat actors who compromise a management account—or gain sufficient privilege within one—use that position to assume root access into member accounts using sts:AssumeRoot. Because the trust is inherent to the organization structure, this can avoid the access controls a member account administrator has configured.

With root access to a member account, a threat actor can disable security controls, delete resources, change billing configurations, and establish persistence that survives remediation focused on IAM principals. We strongly encourage implementing service control policies (SCPs) that restrict which principals can call sts:AssumeRoot and under what conditions, and monitoring for sts:AssumeRoot calls in AWS CloudTrail. For more information, see Assume Root into Organization Member Account.

Compute hijacking – EKS

Compute hijacking remains one of the most common motivations we see behind unauthorized access, and Amazon EKS clusters are increasingly the target. Threat actors deploy cryptocurrency mining or other compute-intensive workloads inside compromised clusters, consuming customer resources and generating unexpected cost.

What sets EKS-based hijacking apart is scale. In clusters without resource quotas, a single compromised service account can consume all available capacity across nodes. The workloads use legitimate-looking images pulled from public registries, which makes image scanning alone insufficient. Setting resource quotas and limit ranges, restricting which registries workloads can pull from, and enabling Amazon GuardDuty EKS Protection to flag mining behavior provides effective detection. For more information, see Resource Hijacking: Compute Hijacking – EKS.

Invite accounts to unknown organization

A threat actor with access to a standalone account—or one they’ve removed from its legitimate organization—invites it into an organization they control. After the account joins, it falls under the threat actor’s governance. The threat actor’s organization can apply SCPs that restrict the legitimate owner’s actions, gain visibility into the account’s resources through organizational services, and access consolidated billing information. The legitimate owner finds themselves locked out of their own governance controls. Monitoring organizations:InviteAccountToOrganization and organizations:AcceptHandshake, and implementing SCPs that prevent accounts from leaving their legitimate organization are important preventive measures. For more information, see Modify Cloud Resource Hierarchy: Invite Accounts to Unknown Organization.

What’s updated

We’ve refreshed three existing entries. S3 Object Collection now captures additional API calls used for bulk data staging from Amazon Simple Storage Service (Amazon S3), with refined detection guidance and mitigations that use recent Amazon S3 security features. Compute Hijacking – ECS adds methods threat actors use to deploy unauthorized tasks in Amazon Elastic Container Service (Amazon ECS), including abuse of overly permissive task execution roles. Role Assumption and Federated Access has been expanded to cover new cross-account role assumption variations and identity provider manipulation, with sharper guidance for distinguishing legitimate federated access from unauthorized use.

The current trend

This June update reflects a clear trend: threat actors are increasingly targeting container orchestration platforms and using organizational trust relationships to their advantage. The container techniques show that as organizations adopt Kubernetes at scale, the attack surface grows with it. The organization-level techniques show that threat actors understand organizational trust relationships.

The common thread is that every one of these techniques operates within the boundaries of legitimate functionality. Modifying a workload, assuming cross-account trust, and joining an organization are all expected actions in healthy environments.. Detection, then, depends entirely on context: the principal, the timing, and the sequence of events that follows.

The Threat Technique Catalog for AWS is designed to help with this. We encourage teams to review the relevant entries and assess whether their current monitoring would catch these patterns:

  • Unexpected modifications to EKS workload specifications
  • Pod deployments that use unsigned container images
  • sts:AssumeRoot calls into member accounts
  • Unbounded compute consumption in your EKS clusters that could be prevented by resource quotas
  • Unexpected organization invitations to your accounts

Each of the threats leaves traces in AWS CloudTrail and Kubernetes audit logs, and the TTC provides specific guidance on what to watch for and how to respond.

Looking ahead

The Threat Technique Catalog for AWS exists because we believe the patterns we observe during security engagements shouldn’t stay behind closed doors. When we see techniques repeating across customers, the most effective thing we can do is document them and make that knowledge available so you can act on it before you’re in the middle of an incident.

This June update adds five new entries and updates three existing ones, and the catalog will continue to evolve. Our team updates it based on what we’re seeing in the real world when helping customers respond to security events. We encourage security teams to review the catalog, incorporate its techniques into threat modeling exercises, and use it as a shared vocabulary for discussing cloud-specific threats.

Explore the full catalog: Threat Technique Catalog for AWS – Full Matrix

Additional resources

If you have feedback about this post, submit comments in the Comments section below.
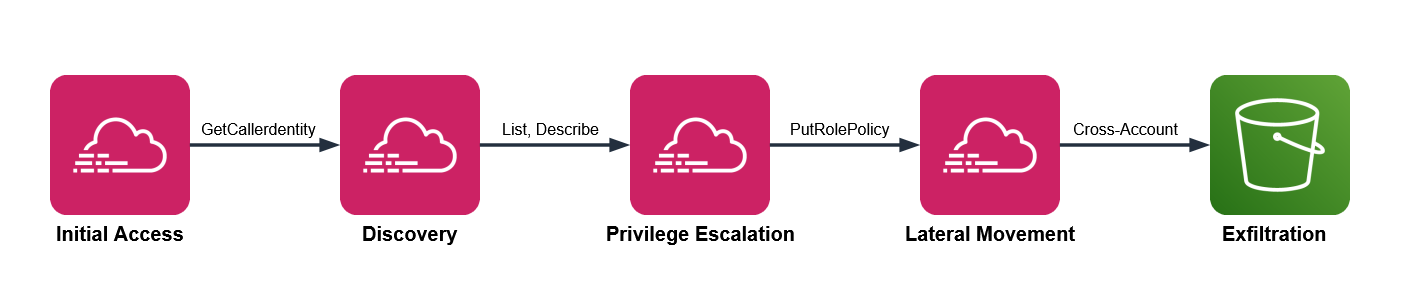

Shannon Brazil

Shannon Brazil is a Sr. security engineer, managing a team on the AWS Customer Incident Response Team (CIRT), specializing in digital forensics and cloud security investigations. Known in the community as 4n6lady, she is passionate about security education and mentoring the next generation of defenders.

Cydney Stude

Cydney Stude

Cydney is a security engineer specializing in threat intelligence and incident response at AWS. Cydney works on the ground in incident response and is passionate about turning observables into security outcomes. Cydney is an author and maintainer of the Threat Technique Catalog for AWS.

Javier Teitelbaum

Javier Teitelbaum

Javier is security engineer on the AWS Customer Incident Response Team (CIRT), with a focus in building and threat intelligence.

How Cloudflare responded to the “Copy Fail” Linux vulnerability

Post Syndicated from Chris J Arges original https://blog.cloudflare.com/copy-fail-linux-vulnerability-mitigation/

On April 29, 2026, a Linux kernel local privilege escalation vulnerability was publicly disclosed under the name “Copy Fail” (CVE-2026-31431). Cloudflare’s Security and Engineering teams began assessing the vulnerability as soon as it was disclosed. We reviewed the exploit technique, evaluated exposure across our infrastructure, and validated that our existing behavioral detections could identify the exploit pattern within minutes. 

There was no impact to the Cloudflare environment, no customer data was at risk, and no services were disrupted at any point. Read on to learn how our preparedness paid off. 

Background

Our Linux kernel release process

Cloudflare operates a global Linux server infrastructure at an immense scale, with datacenters located across 330 cities. We maintain a custom Linux kernel build based on the community’s Long-Term Support (LTS) versions to manage updates effectively at this volume. At any given time, we may utilize multiple LTS versions from various series, such as 6.12 or 6.18, which benefit from extended update periods.

The community regularly merges and releases security and stability updates which trigger an automated job to generate a new internal kernel build approximately every week. These builds undergo testing in our staging data centers to ensure stability before a global rollout. Following a successful release, the Edge Reboot Release (ERR) pipeline manages a systematic update and reboot of the edge infrastructure on a four-week cycle. Our control plane infrastructure typically adopts the most recent kernel, with reboots scheduled according to specific workload requirements.

By the time a CVE becomes public knowledge, the necessary fix has typically been integrated into stable Linux LTS releases for several weeks. Our established procedures ensure that we have already deployed these patches.

At the time of the “Copy Fail” disclosure, the majority of our infrastructure was running the 6.12 LTS version, while a subset of machines had begun transitioning to the newer 6.18 LTS release.

About the Copy Fail vulnerability

It helps to understand the vulnerability before getting to the response story. A comprehensive write-up can be found in the original Xint Code disclosure post.

AF_ALG and the kernel crypto API

The Linux kernel’s internal crypto API manages functions like kTLS and IPsec. Userspace programs access this via the AF_ALG socket family, allowing unprivileged processes to request encryption or decryption. The algif_aead module facilitates this for Authenticated Encryption with Associated Data (AEAD) ciphers.

An unprivileged program follows these steps:

  1. Opens an AF_ALG socket and binds to an AEAD template.

  2. Sets a key and accepts a request socket.

  3. Submits input via sendmsg() or splice().

  4. Executes the operation using recvmsg().

The splice() system call is critical here, as it moves data by passing page cache references.

Memory mechanics: page cache and in-place crypto

The page cache is a shared system cache for file contents. Modifying a page belonging to a setuid binary effectively edits that program for all users until the page is evicted.

The crypto API utilizes scatterlists, which are structures linking various memory pages. In 2017, algif_aead was optimized for in-place operations, chaining destination and reference pages together. This design lacked enforcement to prevent algorithms from writing past intended boundaries.

The vulnerability: out-of-bounds write

When the user executes recvmsg(), the authencesn wrapper in the kernel performs a 4-byte write past the legitimate output region:

scatterwalk_map_and_copy(tmp + 1, dst, assoclen + cryptlen, 4, 1);

By using splice(), an attacker can chain a target file’s page cache pages to the scatterlist. The out-of-bounds write then taints the cached file, allowing an attacker to control which file is modified, the offset, and the specific 4 bytes written. This means the attacker can manipulate the following with this exploit:

  • File: Any readable file.

  • Offset: Tunable via assoclen and splice parameters.

  • Value: Controlled via AAD bytes 4-7 in sendmsg()

The exploit, step by step


The default exploit targets /usr/bin/su, a setuid-root binary present on essentially every distribution.

  1. Cache Reference: Open /usr/bin/su as O_RDONLY and read() to populate the page cache. Use splice() on the file descriptor to pass these page cache references into the crypto scatterlist.

  2. Setup: Create an AF_ALG socket, bind() to authencesn(hmac(sha256),cbc(aes)), set a key, and accept a request socket without needing privileges.

  3. Write Construction: For each 4-byte shellcode chunk:

    • sendmsg() with AAD bytes 4–7 containing the shellcode.

    • splice() the binary into a pipe then the AF_ALG socket so assoclen + cryptlen targets the desired .text offset.

  4. Trigger: recvmsg() initiates decryption. authencesn writes its scratch data to the target offset of /usr/bin/su in the page cache. Although the function returns -EBADMSG, the 4-byte write is now in the global page cache.

  5. Execution: Running execve("/usr/bin/su") loads the tainted page cache. Since the binary is setuid-root, the injected shellcode executes with root privileges.

The upstream fix (commit a664bf3d603d) reverts the 2017 in-place optimization, removing the exploit.

How we responded 

When the vulnerability was disclosed, many workstreams started in parallel:

  • Mapping the blast radius: Our security team worked with kernel engineers to determine which kernel versions were vulnerable and assess the potential exposure.

  • Validating coverage: Security reviewed the exploit technique and confirmed that our existing behavioral detections could identify the exploit pattern during authorized internal validation.

  • Proactive threat hunting: Security began searching for signs that the vulnerability had been exploited before it was publicly known, going back 48 hours in our fleet-wide logs.

  • Engineering a mitigation: Kernel engineers began building a runtime mitigation that would protect the fleet without breaking production services.

  • Continuing software updates: Our engineering teams worked on delivering an updated Linux kernel, which required carefully rebooting and rolling it out across our servers.

There was no customer impact at any point during this response.

Validating detection coverage

One of the first things our security team did was confirm that our existing endpoint detection would catch this exploit. Our servers run behavioral detection that continuously monitors process execution patterns. It doesn’t rely on knowing about specific vulnerabilities; it watches for anomalous behavior across the fleet.

When our engineers validated the vulnerability internally as part of the response, the detection platform flagged it within minutes. The system linked the entire execution chain—starting at the script interpreter, moving through the kernel’s cryptographic subsystem, and ending at the privilege escalation binary—flagging it as malicious based on fleet-wide behavioral patterns.

This happened without a signature update, without a rule change, and without human intervention. Our behavioral detection coverage existed before we wrote any custom logic for this particular Copy File exploit. 

The confirmation was important because it meant we had coverage before writing a vulnerability-specific rule.

Hunting for exploitation

While our engineering team moved to a more targeted mitigation, our security investigation had been running since disclosure. This is our standard procedure for any critical vulnerability.

Our security team operates on a simple principle for critical vulnerabilities: assume compromise until you can prove otherwise. The investigation started from the assumption that exploitation could have occurred before the vulnerability was public, and we worked systematically to either confirm or rule it out.

The exploit leaves a distinctive trace in kernel logs when it runs. We searched for that trace across our centralized logging infrastructure, covering 48 hours before the vulnerability was publicly disclosed. If someone had exploited this before the world knew about it, we would have seen it.

We pulled access logs for affected systems and reconstructed who connected, when, and what commands they ran. This gave us a complete forensic picture of interactive activity on potentially affected infrastructure.

We checked that system binaries had not been tampered with, validated cryptographic hashes against known-good package manifests, looked for persistence mechanisms, and audited network connections for anything unusual. Everything was clean.

Incident timeline and impact

Time (UTC) Event
2026-04-29 16:00 Copy Fail publicly disclosed.
2026-04-29 ~21:00 Security and Engineering teams began assessing fleet exposure and mitigation options before full declaration of the Incident Response process
2026-04-29 22:52 Security confirmed existing behavioral detection covered the Copy Fail exploit pattern. During authorized internal validation, detection flagged the activity within minutes.
2026-04-29 23:01 Existing behavioral detection generated a high-severity alert for exploit-like activity, confirming detection coverage for the technique.
2026-04-29 (evening) First mitigation attempt pushed to our staging datacenter. The deployment process surfaced a dependency conflict; the mitigation was rolled back. No production systems were affected.
2026-04-29 (overnight) Engineering drafted bpf-lsm mitigation program.
2026-04-30 03:14 Security incident declared to drive cross-functional collaboration and urgency. Security performed fleetwide threat hunting of historical data to confirm that no malicious activity was present on Cloudflare systems.
2026-04-30 (morning) Engineering tested the bpf-lsm mitigation program and made it production-ready.
2026-04-30 14:25 Engineering incident declared to coordinate mitigation program and Linux patch rollout.
2026-04-30 ~17:00 Decision made: ship a patched build of the previous LTS line through reboot automation; do not accelerate the new LTS; lean on bpf-lsm in the meantime.
2026-04-30 (afternoon) Visibility pipeline (eBPF tracing of AF_ALG socket usage) deployed fleet-wide. Gives a complete picture of all legitimate AF_ALG users.
2026-04-30 (evening) bpf-lsm mitigation program rolled out behind a separate gate to fully mitigate the fleet. End-to-end verification on a previously-vulnerable test node confirms the exploit no longer works.
2026-05-04 (morning) Reboot automation resumed at normal pace with the patched kernel.
2026-05-04 onward Servers that had already passed through reboot automation earlier in the week manually rebooted to pick up the patched kernel. Unpatched servers update per our normal reboot automation.

This graph shows the progress of our mitigation program as it progressed through our infrastructure.

How did we mitigate it?

Because of the long timeframe involved in deploying a patched Linux kernel, we also pursued mitigating this exploit without a reboot.

Removing the module

The bug was in the algif_aead kernel module. Therefore, the simple fix was to just remove this module and disallow it from being reloaded.

This mitigation was therefore exactly what the Copy Fail write-up from the security researchers who identified it recommends.

echo "install algif_aead /bin/false" > /etc/modprobe.d/disable-algif.conf
rmmod algif_aead 2>/dev/null || true

Unfortunately removing the module would have impacted software that leverages the kernel crypto API.  This meant that we had to figure out a more surgical mitigation.

Bpf-lsm


We’ve already developed and deployed such a tool for this exact scenario: bpf-lsm. Instead of removing the module, this tool leaves it loaded for legitimate users and uses a BPF Linux Security Module program to deny the socket_bind LSM hook for everyone else. This completely blocks the front door for any exploits.

A draft of the eBPF program was put together overnight. Team members picked it up the following morning, ran validations, and made it production-ready. The program is fairly straightforward. On every socket_bind call:

  1. If the socket family is not AF_ALG, allow the call through unchanged.

  2. If the family is AF_ALG, check the calling binary’s path against an allow-list of the binaries we know to be legitimate users.

  3. If the binary is on the allow-list, allow the bind. Otherwise, deny it.

To verify the mitigation on a given machine without exploiting it, the Copy Fail write-up gives a one-liner:

python3 -c 'import socket; s = socket.socket(socket.AF_ALG, socket.SOCK_SEQPACKET, 0); s.bind(("aead","authencesn(hmac(sha256),cbc(aes))"));'

On a mitigated machine you get PermissionError: [Errno 1] Operation not permitted (or FileNotFoundError, depending on which mitigation is active) instead of a successful bind.

Rolling it out

Before enabling enforcement, we verified that our known internal service was the sole legitimate AF_ALG user to avoid accidental outages. We used prometheus-ebpf-exporter to hook the socket() syscall and track AF_ALG usage per binary across the fleet. This required no kernel changes and provided aggregate data from hundreds of thousands of servers within hours. Results confirmed the identified service was indeed the only legitimate user.

So the bpf-lsm rollout was deliberately staged in two steps:

  1. Get visibility first. Push the ebpf-exporter config gated by salt. Confirm at the metric layer that the known service is effectively the only thing creating AF_ALG sockets.

  2. Then enforce. Push the bpf-lsm program behind a separate enforcement gate.

In parallel, the upstream backport for our majority LTS line finally became available, and our internal automation built a patched kernel against it.

We started to test the patched kernel in our staging datacenters as soon as possible, then we resumed the longer reboot process in order to fully patch our fleet.

Remediation and follow-up steps

While we were prepared for this scenario, at Cloudflare we’re always learning and improving. Key areas we identified for improvement:

  • Better visibility into kernel-API dependencies. We will review kernel-subsystem usage across production services, so we can continue to quickly mitigate exploits without service disruption.

  • Better runtime mitigation. bpf-lsm is a valuable tool for mitigations, but we want to make this tool even better. This will include looking into faster deployments, better playbooks, and better logging and visibility of the tool. 

  • Reduce attack surface of Linux Kernel. Review and audit our kernel configuration. Proactively identify unused modules or features so that we can remove them from our build entirely.

Conclusion

The “Copy Fail” vulnerability presented a unique challenge for us. Despite our practice of deploying Linux patch updates every two weeks, we remained vulnerable because a month-old mainline fix had yet to be backported to our primary kernel line. Despite that, we were still able to roll out patched kernels within hours of the backport’s release. In the interim, bpf-lsm provided a surgical, no-reboot mitigation that secured our fleet. While our initial attempt to disable the problematic module failed, it did so safely within our internal staging environment rather than production, allowing us to identify this dependency.

By the end of the rollout, every machine in our fleet was protected by either a patched kernel or a bpf-lsm program denying the vulnerable code path to non-allow-listed binaries. There was no customer impact at any point during this incident, and we have committed to the follow-up work above to make our response faster and our visibility better the next time something like this lands. Responsible disclosure works, in-kernel visibility tooling pays off in moments exactly like this one, and bpf-lsm continues to be one of the most useful primitives we have for runtime kernel mitigation.

At Cloudflare, critical vulnerability response is a coordinated effort across Security, Engineering, Product, and many other teams. Special thanks to Ali Adnan, Ivan Babrou, Frederik Baetens, Curtis Bray, Piers Cornwell, Everton Didone Foscarini, Rob Dinh, Elle Dougherty, Kevin Flansburg, Matt Fleming, Kimberley Hall, Brandon Harris, Jerry Ho, Oxana Kharitonova, Marek Kroemeke, Fred Lawler, James Munson, Nafeez Nazer, Walead Parviz, Miguel Pato, Evan Pratten, Josh Seba, June Slater, Ryan Timken, Michael Wolf, Jianxin Zeng and everyone else who contributed to the investigation, mitigation, and remediation of Copy Fail. We’d also like to thank the Linux upstream maintainers and Copy Fail researchers whose work helped make a rapid response possible.

The Human Infrastructure: How Netflix Built the Operations Layer Behind Live at Scale

Post Syndicated from Netflix Technology Blog original https://netflixtechblog.com/the-human-infrastructure-how-netflix-built-the-operations-layer-behind-live-at-scale-33e2a311c597

By: Brett Axler, Casper Choffat, and Alo Lowry

In the three years since our first Live show, Chris Rock: Selective Outrage, we have witnessed an incredible expansion of our live content slate and the live operations that support it. From modest beginnings of streaming just one show per month, we are now capable of streaming over nine shows in a single day, reaching tens of millions of concurrent members. This post pulls back the curtain on the Live Operations teams that enable this rapid scale.

Humble Beginnings

In March 2023, the engineers who built Netflix’s first live streaming pipeline also operated it. There was no dedicated operations team or formal command center. All of our incident response playbooks were written for SVOD, and SLAs were not designed for the speed of live. For the first live shows on the platform, the engineers who designed what is described in earlier parts of this series monitored dashboards on laptops, coordinated over Slack, and troubleshot in real time while millions of members watched.

The physical setup matched the operational workflows: improvised. Temporary control rooms were put together in conference rooms. For larger events, Netflix rented third-party broadcast facilities, hardware control panels, multiviewers, and communication panels — the kind of infrastructure that established broadcast networks had built over decades. Every show was a team effort. Engineers and leadership at all levels were involved in every event. Each live show, regardless of size, was a massive effort to launch.

Netflix’s Early Live Operations

Last month, in March 2026, Netflix streamed the World Baseball Classic live to members in Japan. 47 matches over two weeks, with peak concurrent viewership exceeding 9.6 million accounts for a single game, operations running 24/7 from permanent facilities in Los Gatos and Los Angeles, with international coverage extending to Tokyo. In March alone, Netflix launched approximately 70 live events. That is three events shy of the total number Netflix streamed live in all of 2024. The technical systems that make this possible have been covered in detail across this series. What hasn’t been told is the operational story: the people, procedures, and facilities Netflix built to run those systems in real time, under pressure, with no ability to pause or roll back.

The Architecture of Live Operations

The Architecture of Live Operations: Evolving the Broadcast Operations Center

When a technology company transitions into live broadcasting, it faces a unique challenge: blending traditional broadcast television practices with massive-scale live-streaming engineering. At the heart of this intersection is the Broadcast Operations Center (BOC).

The Transmission Operations Center in Los Angeles

The BOC serves as the critical “cockpit” for live events. It is the physical command center where a fully produced video feed is received directly from a stadium or venue and then handed off to the live streaming infrastructure. Everything from signal ingest, inspection, and conditioning to closed-captioning, graphics insertion, and ad management happens within these walls. By utilizing a hub-and-spoke model with highly redundant architectures, such as dual internet circuits and SMPTE 2022–7 seamless switching technologies, the BOC replaces direct, vulnerable paths from the venue to the live streaming pipeline, making each live event highly repeatable and far less dependent on the quirks of individual event locations.

Securing the Signal: Reliability from the Venue Before the BOC can work its magic, we have to guarantee the video and audio feeds actually survive the journey from the production site to our facility. To ensure absolute reliability from the venue, Netflix enforces strict specifications for live signal contribution.

For any show-critical feed, meaning the primary feed our members will watch live, we require three completely discrete transmission paths. We utilize a strict hierarchy of approved transmission methods, prioritizing dedicated video fiber and single-feed satellite links, followed by dedicated enterprise-grade internet and robust SRT contribution systems.

We don’t just rely on redundant transport lines; we require full hardware redundancy out of the production truck itself. This includes using separate router line cards and discrete transmission hardware to prevent any single point of failure. Furthermore, every single piece of transmission hardware at the venue must be powered by two discrete power sources, protected by uninterruptible power supply (UPS) batteries, and surge-conditioned.

Finally, before we ever go live to millions of viewers, our operators execute exhaustive “FACS/FAX” (facilities checks) testing during rehearsals and before every show. This involves running specialized Audio/Video sync tests, latency tests, and quality tests to guarantee perfect audio and video synchronization, validating closed captions, and touring the backup switcher inputs.

Building the Human Infrastructure: Building the human operational model to run a facility like the BOC didn’t happen overnight. For a platform scaling from its very first live comedy special to streaming over 400 global events a year, the operational strategy had to undergo a massive, multi-year evolution.

Phase 1: The “All-Hands” Engineering Era. In the earliest days of live streaming, there was no dedicated operations team or formal broadcast operations center. The software engineers who wrote the code and built the live-streaming infrastructure were the same people manually operating the events on launch night. Every show was an “all-hands-on-deck” scenario. While this raw, startup-style approach worked for initial milestones, having core developers manually set up and tear down software configurations for every single broadcast was fundamentally incapable of scaling.

Phase 2: The Shift to Specialized Engineering (SOEs and BOEs). To separate event execution from core software development, the operational model matured to introduce specialized engineering teams. First, the Streaming Operations Engineering (SOE) team was established. These are highly skilled streaming engineers whose sole focus is to configure the full event on the live pipeline and support it during the broadcast. By having SOEs act as the first line of escalation, the core software developers were freed up to focus on building new live-streaming pipeline features.

However, as the physical broadcast facilities grew, it became clear that supporting the streaming pipeline wasn’t enough; the physical broadcast hardware and facility workflows needed dedicated oversight too. To solve this, Broadcast Operations Engineers (BOEs) were introduced to work alongside the SOEs. The BOE acts as the primary escalation point for all physical broadcast facility and hardware issues, overseeing the operation of all shows during a given shift.

Phase 3: The “Co-Pilot” Control Room Model. With specialized engineers in place to handle the deep technical infrastructure, the day-to-day operation of the actual video and audio feeds was handed over to dedicated operators. Initially, the Broadcast Control Rooms were structured much like an airplane cockpit.

This approach utilized a “first and second captain” workflow, pairing two Broadcast Control Operators (BCOs) together to run a single event, functioning exactly like a pilot and co-pilot. This collaborative model allowed for intense focus and high-quality execution, making it the ideal setup for running just one or two live events per day. However, as the ambition grew to stream up to 10 concurrent events a day for massive global tournaments, a 1:1 scale of pairing operators simply required too much space and manpower. A new model had to be adopted.

Phase 4: The Transmission Operations Center (TOC) Fleet Model. To manage high-density event days and continuous tournament coverage, the workflow was completely reimagined with the launch of the Transmission Operations Center (TOC) model. Rather than treating every live broadcast as an isolated launch in its own room, the TOC treats live events like a fleet. It centralizes operations and distinctly separates the traditional broadcast functions from the streaming functions to maximize human efficiency.

The TOC model divides the labor across three highly specialized, tiered roles:

  • Transmission Control Operator (TCO): The TCO is responsible for managing all inbound signals arriving from the event venues, such as fiber optic, SRT, and satellite feeds. They ensure these incoming feeds meet strict quality, latency, and operational thresholds. Thanks to centralized dashboarding, a single TCO can manage up to five events concurrently.
  • Streaming Control Operator (SCO): While the TCO handles what comes in, the SCO manages what goes out. They oversee all outbound feeds, including the streams heading to the live streaming pipeline and any syndication feeds sent to third parties for commercial distribution. Like the TCOs, SCOs can manage up to five events concurrently.
  • Broadcast Control Operator (BCO): With the inbound and outbound transmission mechanics handled by the broader TOC, the BCO is able to focus entirely on the creative and qualitative execution of the event. Operating on a strict 1:1 ratio (one operator per event), the BCO seamlessly switches between backup inbound feeds if an issue arises, ensures audio and video remain in perfect synchronization, and performs rigorous quality control. They also monitor critical metadata, such as closed captions and digital ad-insertion messages (SCTE), right before the final polished feed is handed into the live streaming pipeline.

The Big Bet Exception. While the fleet-style TOC model enables immense concurrency for daily programming, the most critical, high-visibility events, like major holiday football games, utilize a specialized Big Bet Model. For these flagship broadcasts, an entire Broadcast Operations Center is dedicated exclusively to a single event. This hyper-focused environment strips away the multi-event ratios, providing operators with advanced instrumentation and dedicated facility engineers to ensure the absolute highest level of reliability for events where failure is simply not an option.

Operational Workflow at a Glance (Courtesy of Melissa “Mouse” Merencillo)

The Live Command Center (LCC)

The Live Command Center (LCC) is not an MCR (Master Control Room). Nor is it a traditional Network Operations Center (NOC). The LCC holds the end-to-end view of quality, health metrics, and reliability for every live stream — from signal ingest at the production venue through cloud encoding, CDN delivery, and playback on member devices — and coordinates the human response when any part of that chain breaks.

What makes this hard is the data and speed requirements. Standard monitoring tools incur propagation delays of minutes. However, during a live stream, a signal degradation that goes undetected for three minutes can affect millions of members before any mitigation begins. The LCC runs a purpose-built observability stack, the Live Control Center, that aggregates telemetry from across the entire pipeline in near real time: concurrent viewer counts, start failure rates, rebuffer ratios, CDN health, encoder status, and signal path health from the contribution feed forward.

Live Control Center (Courtesy of Chris Carey)

During live events, the system ingests up to 38 million events per second. The LCC’s job is to make that volume of data meaningful and actionable for the small team of operators watching it live.

Two roles staff the LCC leading up to and during live events. LCC Operations Leads are the shift supervisors and incident commanders. They triage anomalies, make escalation decisions, and own the incident response process from detection through resolution.

Live Technical Launch Managers (TLMs) function as air traffic controllers: they maintain cross-functional context across more than 45 technical, product, and services teams from encoding, CDN, and playback to social media, customer service, and security teams. TLMs start coordinating with these teams months and sometimes years ahead of a live event to ensure escalation paths and playbooks are in place when the LCC needs to translate a CDN engineer’s concern into a product decision at 2am while a game is still in progress. Together, these roles form the operational leadership layer that keeps engineers focused on building rather than watching dashboards.

The live operations teams rank shows by three categories:

  • Low-Profile Events: These are lightweight, often lack new features, and anticipate low viewership. They are typically managed with a small team of 1–2 operators and automated alerting.
  • High-Profile Events: These are mid-tier events that warrant more attention due to their size, unique features, or anticipated viewership.
  • Big Bet Events: These represent the highest operational weight, such as an NFL game, with massive viewership expectations and special features. They require the full support of the LCC: a fully staffed physical operations room for the entire duration, active incident command structures, and key engineering teams on standby to support their specific product areas.

In addition to a show’s event category, the TLMs deployed a Live Operational Level (LOL) model that helps engineers determine whether they need to be on standby, live online, or even in the LCC for any given show.

Based on the show’s event category, special features, expected viewership, and overall risk, non-operational teams are put into one of four categories:

Red: Non-operational teams must remain online for the duration of the event. This is most often seen in large boxing matches and sporting events, such as the NFL Christmas Day games.

Orange: Non-operational teams are required to check in online ~30 minutes prior to show and are asked to monitor the health of their systems through the first commercial breaks until the LCC releases them to LOL Yellow.

Yellow: Non-operational teams are not required to be online, but should be reachable by page in 2 minutes. Special PagerDuty rotations and verifications are in place to ensure these teams are reachable.

Grey: Business as usual. Teams will be reached out to by their normal pager rotation if their help is needed during the show.

Visual Representation of LOL Levels (Courtesy of Gemini Nano Banana Pro)

By tiering events, Netflix ensures that resource allocation is proportionate to operational needs, preventing a continuous “crisis” mentality and allowing our non-operational partners to focus on their day jobs.

As of April 2026, most engineering teams are Yellow or Grey, with Ops and Site Reliability Engineers making up most of the teams online to support shows, in addition to engineers performing feature tests.

Building the Model

The first lesson from 2023 was straightforward: what worked for one show a month would not work for ten shows a week. The engineers who built the pipeline were also the ones operating it, which meant the people best positioned to fix problems were also the ones most likely to be paged at 2am. There was no operational layer to absorb that load.

In 2024, Netflix streamed 72 live events and began building the team that would eventually run them. The first version of the LCC looked nothing like it does today: a cluster of desks, monitors on stands, and laptops running dashboards, set up in the middle of the office. The TLM team was stood up to own cross-functional coordination for live launches and began formalizing the runbooks, event tiering structure, and incident management protocols that would later enable Netflix to scale operations to support hundreds of shows per year.

By the time Jake Paul vs. Mike Tyson and the first NFL Christmas Games arrived, the LCC had moved into a dedicated conference room, and partnerships with device and labs teams were producing more effective monitoring tools. But the biggest operational lesson of that period came from communications.

For Tyson/Paul, Netflix had over 300 people online across engineering, product, and business functions. Some people were online because their support was needed, while many others were just excited to be part of it. Coordinating that many people over Slack and Zoom during an active event with 64 million concurrent streams was unmanageable.

That experience drove the implementation of a squad model: defined teams with clear roles, scoped communication channels, and a single escalation path into the LCC. Around the same time, the LCC began integrating with IP-based communications systems, finally bridging the gap between the command center and the Broadcast Operations Center that had been operating largely in a fractured parallel until then.

Visual Representation of Squad Operations Model (Courtesy of Gemini Nano Banana Pro)

2025 brought 220 live events and a permanent LCC facility, along with a dedicated operations team, the Live Command Center Operations Leads. With the growing number of shows, TLMs were getting spread thin, spending more than half their week operating shows late into the evening and over weekends, then getting called back into the office at 9 am to lead critical launch meetings. The addition of the LCC Ops Leads resolved the bandwidth issue by separating planning and operations into distinct roles within a single centralized team.

As the slate continued to grow and large series like the World Baseball Classic and FIFA Women’s World Cup were announced, the vendor-operator model was introduced, creating an elastic workforce that could scale up for large series events without carrying full-time headcount year-round to support peak capacity. The key enabler was documentation: standardized runbooks and onboarding materials detailed enough that a trained operator could reach full effectiveness within their first week. WWE RAW became a weekly operation, normalizing what had previously felt exceptional. By early 2026, multi-event days were no longer a test of capacity but had become the expected operating condition.

The next chapter is international. Netflix has begun standing up regional Live Operations Center coverage to support live events outside North America, with EMEA operations soon running out of London. The model draws on the same runbooks, tooling, and escalation structures developed in Los Gatos, with follow-the-sun shift handoffs connecting EMEA and US teams across time zones. Looking further ahead, Netflix is planning to bring the LCC and BOC under one roof — a single integrated facility that combines broadcast operations and cloud monitoring into a unified space. The physical separation between those two functions has always introduced friction at the seams. Closing it is the logical next step.

Operational Principles for Live at Scale

Building a live operations discipline means accepting one constraint above all others: you cannot optimize for efficiency before you have built for reliability.

Netflix designed for quality first: Standardized runbooks, tiered event structures, pre-documented failure modes, so the 50th show runs as smoothly as the fifth. Off-the-shelf monitoring tools with propagation delays don’t meet that bar. The Netflix Live Control Center and Live Control Room platforms exist because observability at live scale is a product decision that demands the same design rigor as the pipeline it monitors, turning millions of telemetry events per second into something a small team can act on in real time. Technical systems and human systems have to scale together, and the most reliable incident response plan is always the one written before anyone needs it.

The operational model is also a cultural one. Bringing contingent operators into a proprietary tech stack requires deliberate onboarding design. The vendor model only works when documentation is built to be followed confidently by someone new within their first week. Beyond process, the most durable parts of how Netflix runs live operations reflect something the Netflix culture memo makes explicit: the best ideas come from anywhere. In practice, that means frontline operators catching issues that engineers miss, vendor staff surfacing workflow friction that improves the system for everyone who follows, and a team that treats candid feedback as standard practice rather than an exception. The technology, the slate, and the scale keep changing. The discipline stays current by staying curious and iterating on the tools, the runbooks, and the team.

Conclusion: What’s Next

With 2026 already off to a successful start in operational scaling, we’re excited to shift our focus to the upcoming launch of our new Live Broadcast Operations Center in Los Angeles and our new Live Operations Center (LOC) in West London. The LOC will initiate Netflix’s follow-the-sun coverage as live content continues to grow with over 400 live events in 2026, including the launch of 24/7 linear free-to-air broadcast channels with TF1 this summer. On the technical front, further development of automated alerting tools and monitoring by exception will continue to reduce operations’ manual workload.

In 2023, the engineers led the operations. By 2026, they had developed systems that mostly ran themselves, with a dedicated operational team ensuring they operated smoothly for millions of members. The technology behind Netflix’s Live content has been documented throughout this series, but what runs alongside the tech stack is a set of operational principles, rehearsed incident management processes, and monitoring infrastructure that had to be created from scratch and continues to develop.

A special thanks to Te-Yuan Huang, Rob Saltiel, Tara Kozuback, Chris Carey, Di Li, Patrick Li, Anne Aaron, and Melissa “Mouse” Merencillo for their support on this article.


The Human Infrastructure: How Netflix Built the Operations Layer Behind Live at Scale was originally published in Netflix TechBlog on Medium, where people are continuing the conversation by highlighting and responding to this story.

ClickFix Phishing Campaign Masquerading as a Claude Installer

Post Syndicated from Nicholas Spagnola original https://www.rapid7.com/blog/post/ve-clickfix-phishing-campaign-fake-claude-installer

Overview

It is no secret that phishing campaigns utilizing various ClickFix techniques have been a commonly used method of social engineering. One of the main reasons for this is simply because they work. You know this and Rapid7 does as well. As a company offering managed detection and response (MDR), our customers expect us to be knowledgeable about and able to detect attacks as common as ClickFix campaigns. 

Recently, Rapid7 observed a small grouping of ClickFix events across customers in the EU and US. At the time of discovery, this campaign had very little traction on sites like VirusTotal or within the online security landscape. This campaign was particularly interesting as it appeared to be masquerading as an installer for Claude, an AI tool that has received a considerable amount of attention. 

Using Rapid7 InsightIDR detection rules, our SOC analysts were able to detect and respond to the threat, preventing further compromise. This campaign demonstrates the strength Rapid7 customers get from our MDR service, while peeling back the curtain to provide a real-world example on how we operate behind the scenes. In this blog, we will detail a brief technical analysis of the observed threat actor activities and discuss how this serves as an example of the service we aim to provide our MDR customers. The analysis highlights both the multi-step delivery of the payload as well as the work Rapid7 performs when investigating threats.  

Observed attacker behavior

On April 9, Rapid7 was alerted to mshta executed on a customer asset using the Windows run utility. The alert was generated by the detection rule Attacker Technique – Remote Payload Execution via Run Utility (shell32.dll). This rule will generate an alert when a suspicious process, such as mshta, is added to the RunMRU registry key. This key is important for the detection of ClickFix campaigns, as it tracks the last 26 commands executed by the Windows run utility. One thing that stuck out about this particular mshta command is that the URL, download-version[.]1-5-8[.]com/claude.msixbundle, appeared to be impersonating an MSIX bundle for the popular AI tool, Claude. 

MSIX files are Windows app packages that one would typically see from the Microsoft store, definitely not something you would see being passed as an argument to mshta. While the host was quickly taken down before Rapid7 was able to obtain the claude.msixbundle payload, a copy was obtainable on VirusTotal. Looking at the payload, it does initially appear to be an MSIX bundle. The file header signature, PK, indicates that the file is a ZIP archive and contains a string reference to the MSIX bundle, MicrosoftBing_1.1.37.0_ARM64.msix:

ClaudeFix_figure1.png

Exploring the payload deeper, however, reveals an HTML Application (HTA) embedded within the ZIP archive:

ClaudeFix_figure2.png

The Visual Basic script within the HTA file contains a series of obfuscated strings that are deobfuscated with the following VBS function:

ClaudeFix_figure3.png

Additionally, one of the functions serves to generate an encoded PowerShell script that will serve as the next step in the chain:

ClaudeFix_figure4.png

After the deobfuscation routine is complete, these strings contain references to the required objects and function calls to craft and execute – via ShellExec – the following command:

c:\Windows\System32\cmd.exe” /v:on /c “set x=pow&&set y=ershell&&call %windir%\SysWOW64\WindowsPowershell\v1.0\!x!!y! -E [ENCODED COMMAND]

ClaudeFix_figure5.png

The encoded PowerShell acts as a staging payload. The script will first generate an MD5 hash value based on the COMPUTERNAME and USERNAME environment variables. It will then take the first 16 characters of the hash value and use it to craft a URL to pull another, much larger, PowerShell script. The script also contains a string deobfuscation routine that is responsible for crafting the following strings to be passed to various .NET functions:

  • Assembly

  • System.Mangement.Automation.AmsiUtils

  • amsiContext

  • NonPublic,Static

  • 0x41414141

ClaudeFix_figure6.png

The script will then call the deobfuscation routine to craft a call to WriteInt32 in the .NET Marshal library to overwrite the amsiContext field in System.Management.Automation.AmsiUtils with the value 0x41414141. Once amsiContext is overwritten, the script will download and execute the next stage:

ClaudeFix_figure7.png

The URL is hosting yet another PowerShell script containing highly obfuscated strings and a large byte array. Upon execution of the script, the strings decode to contain the necessary .NET types and method calls to create and execute a PowerShell ScriptBlock. This ScriptBlock is derived from the byte array, which is first base64 decoded and then run through a deobfuscation routine:

ClaudeFix_figure8.png

This ScriptBlock again contains another series of obfuscated strings and a large byte array containing yet another PowerShell ScriptBlock. Following the execution of the script, the code once again creates and executes a PowerShell ScriptBlock:

ClaudeFix_figure9.png

This ScriptBlock culminates in a process injection routine using the .NET interoperability library. The code contains a byte array with encrypted shellcode that gets passed through a XOR routine. The script then obtains handles to the following Windows API calls:

  • NtAllocateVirtualMemory

  • Copy

  • NtProtectVirtualMemory

  • NtCreateThreadEx

  • NtWaitForSingleObject

  • NtFreeVirtualMemory

  • NtClose

After obtaining the handles, the script crafts delegate functions for the Windows API calls and invokes the delegates to perform the process injection routine:

ClaudeFix_figure10.png

Importance to Rapid7’s MDR customers

Rapid7 MDR customers receive the security knowledge of our threat intelligence, detection engineering, incident response, and security operations center analysts. Input from all of these sources directly feeds into how we create detections and respond to alerts. Following is an explanation of how we use events like these to further provide and enhance our services for customers. 

As previously mentioned, ClickFix activity is not new. Detection engineers in the MDR service know this and build rules to address these techniques, such as the rule that caught the activity discussed in this blog.. Detection rules are created in response to activity observed in incident response, customer requests, activity observed from the SOC, threat intelligence, and observations of the security landscape. Rapid7’s detection engineers work with the SOC to monitor these rules for efficacy. Rules that are primarily used to detect initial compromise, such as the one that alerted on this campaign, are additionally monitored to identify any new campaigns. 

Once the campaign is identified, our detection engineers research it to create additional rules. They can also perform retroactive threat hunts across the Rapid7 customer base using IOCs or any new behavioral detections created from researching the campaign. Results from researching campaigns like this one then go on to feed threat intelligence and help inform our detection strategy. This campaign provides a great example of how Rapid7 works on the backend to detect and prevent threats in customer environments. 

Mitigation guidance

Monitor the following registry key to watch for potential ClickFix attacks such as the one observed in this case:

  • HKEY_CURRENT_USER\Software\Microsoft\Windows\CurrentVersion\Explorer\RunMRU

While Rapid7 MDR customers were covered by the managed SOC, Rapid7 recommends the following actions for containment:

If the activity is not expected, apply containment and review the user’s browsing history for the source of the command. The initial lure is often presented to the user when they attempt to browse the internet for free downloads (media, software, etc.). In some cases the malicious command may have been copied to the user’s clipboard when visiting the initial webpage, and can be viewed by inspecting the source code of the site. If the infection is successful, an information stealer is often executed as the final payload, meaning that any credentials stored on the infected system should be reset as part of restoration.

MITRE ATT&CK techniques

System Binary Proxy Execution: Mshta

T1218.005

Obfuscated Files or Information: Encrypted/Encoded File

T1027.013

Obfuscated Files or Information: Command Obfuscation

T1027.010

Command and Scripting Interpreter: PowerShell

T1059.001

Process Injection

T1055

Indicators of compromise (IOCs)

Cloude.Msixbundle:

  • 2b99ade9224add2ce86eb836dcf70040315f6dc95e772ea98f24a30cdf4fdb97

Domains observed by Rapid7:

  • Oakenfjrod[.]ru

  • download-version[.]1-5-8[.]com

  • download[.]get-version[.]com

A framework for securely collecting forensic artifacts into S3 buckets

Post Syndicated from Jason Garman original https://aws.amazon.com/blogs/security/a-framework-for-securely-collecting-forensic-artifacts-into-s3-buckets/

When customers experience a security incident, they need to acquire forensic artifacts to identify root cause, extract indicators of compromise (IoCs), and validate remediation efforts. NIST 800-86, Guide to Integrating Forensic Techniques into Incident Response, defines digital forensics as a process comprised of four basic phases: collection, examination, analysis, and reporting. This blog post focuses on the first phase—collection—and provides best practices for implementing least privilege during the forensic evidence collection processes that collect evidence and store the artifacts in Amazon Simple Storage Service (Amazon S3) buckets. The architecture presented in this post can be used to collect forensic evidence from both Amazon Web Services (AWS) and non-AWS compute resources.

It’s important to consider the security of the forensic artifact collection process because it involves communicating with potentially compromised resources. The collection methodology itself should be designed to avoid adding additional risks to infrastructure or other forensic investigation processes. At the same time, the collection of forensic artifacts requires the use of specialized tools that are difficult to change or adapt to new security requirements.

This post outlines factors that you should consider when creating an evidence collection capability and introduces an architecture that implements the best practices for least privilege and integrating with (instead of changing or adapting) existing forensic tools that support uploading artifacts to S3 buckets by using AWS security credentials.

Solution architecture

The architecture presented in this post demonstrates the following AWS best practices:

  1. Least privilege – Use AWS Identity and Access Management (IAM) policies to provide least privilege access to upload forensic artifacts to an S3 location dedicated to a specific forensic collection task. The locked down credentials cannot be used to view or modify any other forensic collections.
  2. Time-limited credentials – Use AWS Security Token Service (AWS STS) to provide time limited credentials, reducing the potential for an unauthorized user to abuse credentials while they’re visible on the target machine during the artifact collection process.
  3. Compatibility with third-party tools – Forensic tools are specialized and changing a forensic collection process to adapt to different collection methods might not be possible. To avoid the risk of needing to change tools, maximize compatibility with any third-party tools that support uploading to S3 buckets. The method introduced in this post to generate time-limited, scoped down credentials can be used with most third-party forensic tools that support uploading to S3 buckets.
  4. Credential vending – Use time-limited tokens, which can be vended on demand through an automated process, eliminating the need for forensic investigators to use the AWS Management Console, understand least privilege, or have any access to the AWS control plane. Forensic investigators can focus on the process of collecting and analyzing evidence.
  5. Process automation – Deploy the process as infrastructure as code (IaC) and automate it through AWS services, reducing the burden on security teams to manually perform runbook steps during an active security incident.

This post starts with an overview of the digital forensic process, provides best practices for using Amazon S3 to store forensic artifacts, details how you can create time-limited, least privilege tokens to provide secure access to upload forensic artifacts to S3 buckets, and introduces a sample architecture that automates the end-to-end process.

The digital forensic process

Organizations need to have practices and resources in place to support a digital forensic investigation environment before an incident occurs. AWS has published several resources, including Forensic investigation environment strategies in the AWS Cloud and AWS prescriptive guidance: Security Reference Architecture, Cyber forensics, to provide best practices for organizing your AWS accounts using AWS Organizations to support forensic clean-room environments. Creating segregated AWS accounts and resources for your security teams is critical to provide your incident responders a location to store and analyze any digital forensic evidence collected during an investigation.

After you’ve established a landing zone for performing digital forensics, you’re ready to collect and process digital forensic evidence. AWS supports the collection of digital forensics through extensive logging of control plane events in AWS CloudTrail, and metrics and application logs that can be stored in Amazon CloudWatch. In addition, AWS core compute services, such as Amazon Elastic Compute Cloud (Amazon EC2), support forensics operations through snapshots of the underlying Amazon Elastic Block Storage (Amazon EBS) volume. An example architecture to demonstrate how to automate the collection of EBS volume snapshots for forensic investigations can be found in How to automate forensic disk collection in AWS.

You might want to use the same AWS infrastructure to collect, examine, analyze, and report on forensic incidents that occur on other resources, such as corporate laptops. You can use existing forensic tooling to perform live response, collecting specific artifacts such as Windows NT File System (NTFS) Master File Table (MFT), logs from Linux machines, volatile memory images, or other artifacts that are specified as part of your organization’s incident response plan. These tools can be provided by third parties or built in-house, and many support uploading to S3 buckets using AWS security credentials.

Using Amazon S3 for forensic artifact collection

Amazon S3 provides the foundational requirements for collecting and storing forensic artifacts. Digital forensics requires highly available, durable, and secure storage of artifacts collected from potentially compromised systems. Amazon S3 is designed for 11 nines of durability and can be configured to provide protection against modification, deletion, and unauthorized access to sensitive forensic artifacts. You can also use S3 to store forensic artifacts of almost any size—from one byte to 5 TB—in an S3 object.

S3 buckets used to store forensic artifacts require custom configuration to provide additional security. You should configure the S3 bucket that you use to store forensic artifacts to enable the following security and governance features:

  1. Encryption in transit. You can require the use of encryption in transit and specify acceptable TLS versions using the aws:SecureTransport and s3:TlsVersion condition keys on the S3 bucket policy.
  2. Encryption at rest using a customer managed key. You can automatically encrypt all objects uploaded to the bucket using a specified customer managed key by specifying a default server-side encryption key in the bucket’s configuration. For this post, we encourage you to use a customer managed key rather than relying upon an AWS managed key, so you can control the associated key policy.
    1. Encryption at rest provides an additional layer of protection, because only entities that have both the permission to read from the bucket and permission to use the AWS Key Management Service (AWS KMS) key for decryption can download the forensic artifact from the S3 bucket.
    2. You need to adjust the example KMS policies in this post if the evidence collection S3 bucket uses the S3 Bucket Key feature.
  3. Audit logs of all S3 data event activity. You can turn on CloudTrail data events for any S3 buckets that contain forensic artifacts to provide a comprehensive audit trail of S3 object-level API activity. This helps provide a chain of custody of any artifacts stored in your forensic buckets.
  4. Fine-grained access control using IAM permissions. You can define the set of entities (both human and machine) that have access to the artifacts in the S3 bucket. This post includes how to create time-limited, least privilege access using IAM permissions for uploading files into an S3 bucket. The permissions are fine-grained enough to scope down access to specific object names or object prefixes in an S3 bucket. Additionally, access to read the artifacts can be controlled through IAM permissions and access to the encryption-at-rest KMS key.
  5. Protections against data modification and deletion. S3 provides features, such as S3 object versioning, to provide assurances that data hasn’t been modified or removed after it’s been collected. This is an additional layer of protection beyond the fine-grained access permissions, so even if an authorized entity attempts to overwrite or delete an object in the S3 bucket, the previous version of the object is still available.
  6. There are additional options that you can configure on the S3 bucket to protect your data against modification and deletion, including S3 Object Lock and multi-factor authentication (MFA) delete.

In addition to the preceding configuration, consider how to organize forensic artifacts in the S3 bucket. This post introduces a folder structure using S3 object prefixes to segregate each forensic artifact collection task into its own S3 object namespace. An example S3 namespace structure for an S3 bucket is shown in Figure 1.

Figure 1 – S3 namespace structure for an S3 forensics artifact bucket using object prefixes

Figure 1: S3 namespace structure for an S3 forensics artifact bucket using object prefixes

By separating each forensic collection task by its own prefix, you can use fine-grained IAM permissions to permit object uploads only into the active collection task. For example, scoped down credentials can be generated to only allow uploads into buckets with the CASE-0001 prefix using an IAM permission as shown in the following code example. Temporary security credentials can be generated using these limited permissions and the key is then used by the forensic acquisition tool to upload the artifacts into the S3 bucket.

{
	"Sid": "UploadToCase0001",
	"Effect": "Allow",
	"Action": [
		"s3:PutObject",
		"s3:AbortMultipartUpload"
	],
"	Resource": "arn:aws:s3:::mycompany-forensics-collection/CASE-0001/*"
}

Manually creating temporary IAM credentials for each forensic collection activity can be error-prone and time-consuming. Therefore, this post demonstrates how to use AWS tooling to automate the process of generating time-limited, scoped-down credentials.

Adapt existing forensic tools for AWS best security practices

Existing forensic tools typically use IAM access keys to perform S3 operations. Using a static IAM user secret access key isn’t a best practice. Even if the static key is associated with an IAM user that has been scoped down to only have access to the forensic collection S3 bucket as described previously, that means anyone with access to that key can potentially upload objects into that bucket. Therefore, the best practice is to create a time-limited temporary security credential unique to each collection activity, scoped down to only allow uploading files to a specific prefix in the target S3 bucket.

The examples in this post use the following resource names. Because these names will change based on your deployment, substitute your resource names in place of the names in the example code.

  1. The evidence S3 bucket is named mycompany-forensics-collection
  2. The forensics AWS account number is 112233445566. For the purposes of this example, all resources will live within this account.
  3. The customer managed key used to encrypt the forensic artifacts at rest is ForensicsEvidenceKey
  4. The IAM role that incident responders will assume when signing in to their AWS account is ForensicsUserRole
  5. The IAM role that incident responders will use for generating S3 file upload temporary credentials is ForensicsUploadRole
  6. The example uses the us-east-1 AWS Region

The following steps show you how to configure the IAM policies associated with the customer managed key ForensicsEvidenceKey and the IAM role ForensicsUploadRole.
Before you begin, create the evidence S3 bucket configured as described in Using S3 for artifact collection and a customer managed key to encrypt the forensic artifacts at rest. Configure the evidence S3 bucket to use the KMS key by opening the S3 bucket’s properties tab in the Amazon S3 console and setting the new KMS key as the default encryption key for the bucket.

Next, create an IAM role that incident responders will assume through the AWS STS AssumeRole API to generate the temporary credentials. This role will define the maximum set of permissions allowed to upload artifacts to your evidence S3 bucket. This role, ForensicsUploadRole, created using the following example code, defines the maximum allowable permissions: the ability to upload objects into the evidence S3 bucket and to use the KMS key to encrypt those uploads. The effective permissions available to the forensic tool will be scoped down even further to the specific object prefix when the AWS STS temporary security credential is generated.

Note that the policy allows the forensics upload role Decrypt permission in addition to Encrypt; this is required when uploading files larger than 5 GB using the multi-part S3 file upload feature.

{
	"Version": "2012-10-17",
	"Statement": [
			{
				"Sid": "BasePermissionsForS3Upload",
				"Effect": "Allow",
				"Action": [
					"s3:PutObject",
					"s3:AbortMultipartUpload"
				],
				"Resource": "arn:aws:s3:::mycompany-forensics-collection/*"
		},
		{
			"Sid": "KeyAccessToS3Upload",
			"Effect": "Allow",
			"Action": [
				"kms:GenerateDataKey",
				"kms:Encrypt",
				"kms:Decrypt"
			],
			"Resource": "arn:aws:kms:us-east-1:112233445566:alias/ForensicsEvidenceKey",
			"Condition": {
				"StringLike": {
					"kms:EncryptionContext:aws:s3:arn": "arn:aws:s3:::mycompany-forensics-collection/*"
				}
			}
		}
	]
}

Next, you need to provide an ability to assume this role and generate AWS STS tokens using the role’s permissions. This is accomplished by creating a trust relationship associated with the IAM role you just created. The trust relationship shown in the following code sample describes which AWS principals are allowed to assume the role—in this case, you will allow any user who has federated into the ForensicsUserRole IAM role to be able to generate AWS STS tokens for forensic artifact collection.

{
	"Version": "2012-10-17",
	"Statement": [
		{
			"Sid": "Statement1",
			"Effect": "Allow",
			"Principal": {
				"AWS": "arn:aws:iam::112233445566:role/ForensicsUserRole"
			},
			"Action": "sts:AssumeRole"
		}
	]
}

After the role is established and access to the encryption key is granted, you can use the AWS STS AssumeRole API to create temporary credentials using this role. You can call this API using the AWS Command Line Interface (AWS CLI) or programmatically from a script. To scope down the token’s access to only provide permission to upload to the specific evidence object prefix, you must include a session policy as part of your AssumeRole API request to AWS STS. The following is an example session policy to restrict access to only upload objects into the CASE-0001 prefix.

[
	{
		"Effect": "Allow",
		"Action": [
			"s3:PutObject", 
			"s3:AbortMultipartUpload"
		],
		"Resource": "arn:aws:s3:::mycompany-forensics-collection/CASE-0001/*"
	},
	{
		"Effect": "Allow",
		"Action": [
			"kms:GenerateDataKey", 
			"kms:Encrypt", 
			"kms:Decrypt"
		],
		"Resource": "*",
		"Condition": {
			"StringLike": {
				"kms:EncryptionContext:aws:s3:arn": "arn:aws:s3:::mycompany-forensics-collection/CASE-0001/*"
			}
		}
	}
]

The effective permissions available to the session role will be the intersection of permissions available in the role policy (ForensicsUploadRole), the resource policy (in this case, mandating TLS-encrypted connections to the bucket), and the session policy that’s created on demand for every forensic collection (only allowing access to upload objects into the CASE-0001 prefix, as shown in the preceding example). Pictorially, this looks like the Venn diagram shown in Figure 2.

Figure 2 – Intersection of IAM policies determine the effective permissions for the restricted forensic session role.

Figure 2: Intersection of IAM policies determine the effective permissions for the restricted forensic session role.

Test the temporary credentials

Now that the bucket has been created and the AWS KMS key and roles configured, you can use AWS STS to create a temporary security credential for a collection on CASE-0001. You can use the AWS CLI to do this manually or you can write a script to automate this process using the AWS API. The IAM access key, secret access key, and session token returned by this call can then be used by any tool that can use AWS access keys to upload files into the specified S3 bucket.

The following example shows an AWS CLI call to AssumeRole using the example ForensicsUploadRole and a case named CASE-0001. The --duration-seconds parameter defines the period, in seconds, that the temporary credentials are valid; the default of 3600 seconds will provide temporary credentials that are valid for one hour.

$ aws sts assume-role \
	--role-arn arn:aws:iam::112233445566:role/ForensicsUploadRole \
	--role-session-name CASE-0001 \
	--duration-seconds 3600 \
	--policy '{"Version": "2012-10-17", "Statement": [{"Effect": "Allow", "Action": ["s3:PutObject", "s3:AbortMultipartUpload"], "Resource": "arn:aws:s3:::mycompany-forensics-collection/CASE-0001/*"}, {"Sid": "BasePermissionsForS3Upload", "Effect": "Allow", "Action": ["kms:GenerateDataKey", "kms:Encrypt", "kms:Decrypt"], "Resource": "*"}]}'

{
	"Credentials": {
		"AccessKeyId": "ASIAXXXX",
		"SecretAccessKey": "XXXX",
		"SessionToken": "XXXX",
		"Expiration": "2025-04-10T17:16:13+00:00"
	},
	"AssumedRoleUser": {
		"AssumedRoleId": "AROXXXX:CASE-0001",
		"Arn": "arn:aws:sts::112233445566:assumed-role/ForensicsUploadRole/CASE-0001"
	},
	"PackedPolicySize": 39
}

Now that you have obtained temporary credentials from AWS STS, you can use those credentials to upload a file into Amazon S3:

$ AWS_ACCESS_KEY_ID=ASIAXXXX \
	AWS_SECRET_ACCESS_KEY=XXXX \
	AWS_SESSION_TOKEN=XXXX \
	aws s3 cp evidence.zip s3://mycompany-forensics-collection/CASE-0001/evidence.zip

upload: evidence.zip to s3://mycompany-forensics-collection/CASE-0001/evidence.zip

You can also verify that you can’t use those credentials to upload a file into any other object prefixes or S3 buckets. For example, if you change CASE-0001 to CASE-0004 in the Amazon S3 upload command, you will receive an AccessDenied error because you’re trying to upload an object outside of the allowed key prefix.

$ AWS_ACCESS_KEY_ID=ASIAXXXX \
	AWS_SECRET_ACCESS_KEY=XXXX \
	AWS_SESSION_TOKEN=XXXX \
	aws s3 cp evidence.zip s3://mycompany-forensics-collection/CASE-0004/evidence.zip

upload failed: evidence.zip to s3://mycompany-forensics-collection/cases/CASE-0004/evidence.zip
An error occurred (AccessDenied) when calling the PutObject operation: User: arn:aws:sts::112233445566:assumed-role/ForensicsUploadRole/CASE-0001 is not authorized to perform: s3:PutObject on resource: "arn:aws:s3:::mycompany-forensics-collection/CASE-0004/evidence.zip" because no session policy allows the s3:PutObject action

Additionally, if you wait more than the lifetime of the token (1 hour in this case), attempting to upload a file into the bucket will fail, because the token will no longer be valid:

$ AWS_ACCESS_KEY_ID=ASIAXXXX \
	AWS_SECRET_ACCESS_KEY=XXXX \
	AWS_SESSION_TOKEN=XXXX \
	aws s3 cp evidence.zip s3://mycompany-forensics-collection/CASE-0001/evidence.zip

upload failed: evidence.zip to s3://mycompany-forensics-collection/CASE-0001/evidence.zip

An error occurred (ExpiredToken) when calling the PutObject operation: The provided token has expired.

Create an automated process to vend temporary credentials on demand

After you’ve verified the security benefits of creating temporary credentials for S3 uploads and validated that the credentials work with your forensic software of choice, you can now use them as part of an automated process.

A sample automated architecture is shown in Figure 3.

Figure 3: Architecture to automate S3 credential vending and forensic artifact collection.

Figure 3: Architecture to automate S3 credential vending and forensic artifact collection.

The workflow depicted in Figure 3 includes the following steps:

  1. The workflow is triggered by an alert from a detection source or a manual trigger from an incident responder.
  2. The workflow input is added to an Amazon Simple Queue Service (Amazon SQS) queue.
  3. The Amazon SQS queue invokes an AWS Lambda function which in turn executes a Step Functions state machine to orchestrate the workflow.
  4. First, the Step Functions workflow determines whether the target system is managed by AWS Systems Manager.
    1. If the target system isn’t managed by Systems Manager, an error is noted, and the execution is abandoned.
    2. If the target system is managed by Systems Manager, the Step Functions workflow determines the operating system (OS) of the target system and proceeds with the flow of execution.
  5. The workflow then continues by executing the Systems Manager documents that implement the forensic collection process:
    1. Downloads tooling:
      1. Generates dynamically scoped IAM temporary credentials that provide access to download the OS-specific tooling to be executed on the target system from the tooling S3 bucket. These credentials are tightly scoped to only allow downloads from the S3 prefix that corresponds to the tooling for the target system’s OS.
      2. Executes a Systems Manager command on the target system that uses the credentials generated from the previous step to download the OS tooling on the target system.
    2. Runs forensic tools:
      • Executes a Systems Manager command on the target system to execute the OS tooling on the target system.
  6. The Systems Manager commands run on the target system, which in this case is an EC2 instance.
  7. Results are uploaded to the evidence S3 bucket:
    1. Generates dynamically scoped IAM temporary credentials (as described previously) that provide access to upload the output of the previously executed tooling to the evidence S3 bucket. These credentials are tightly scoped to only allow uploads to a particular S3 prefix corresponding to the alert prefix.
    2. Executes a Systems Manager command on the target system to upload the output of the previously executed tooling to the evidence S3 bucket. After the upload is complete, it cleans up both the output and the evidence tooling from the target system.
    3. The evidence S3 bucket is tightly locked down to a subset of identities within the AWS security account. Access attempts from identities that aren’t allow listed trigger an Amazon EventBridge rule to alert the security team through an Amazon Simple Notification Service (Amazon SNS) topic.
  8. When the workflow is complete, related details and metrics are recorded in an Amazon DynamoDB table.
  9. The forensic analysis can be performed on a separate EC2 instance that has access to read from the evidence S3 bucket.

Deploying the example solution

You can use the AWS Cloud Development Kit (AWS CDK) repository to implement the architecture shown in Figure 3.

The AWS CDK solution is split into three stacks:

  1. SecurityStack: This stack contains the basic forensic artifact workflow orchestration infrastructure described in this post, including the Step Functions workflow, Lambda functions, AWS SQS queues, IAM roles, and S3 buckets.
  2. AlertStack: This stack contains the EventBridge workflow to notify administrators of anomalous activity in the evidence S3 bucket.
  3. CustomerStack: This stack contains the SSM documents that are executed for the forensic artifact workflow and an IAM role assumed by the SecurityStack when the workflow is invoked. It’s deployed into each child AWS account containing EC2 instances from which the security account is authorized to collect forensic artifacts.

Configuration

Before deploying the solution, there are several variables in the config.ts file that must be modified for the environment:

  1. SECURITY_ACCOUNT: Security Tooling AWS account ID.
  2. CUSTOMER_ACCOUNTS: Target AWS account IDs (the Child AWS account in the architecture diagram).
  3. ALERT_EMAIL_RECIPIENTS: List of email addresses that receive alerts when there is unexpected access to the evidence S3 bucket.
  4. ALLOW_LISTED_ROLE_NAMES: Roles allowed to access the evidence S3 bucket. Any other identities accessing the evidence S3 bucket will result in an alarm.

Deployment

After you’ve updated the config.ts file to reflect the account numbers, email recipients, and role names, the stacks can be deployed into your AWS infrastructure.

  1. Set Up AWS credentials using the AWS CLI:
    aws configure
  2. Install dependencies and configure constants:
    1. Clone the repository.
    2. Navigate to the project directory.
    3. Install project dependencies:
      npm install
    4. Configure constants in constants/config.ts with the required information:
      export const SECURITY_ACCOUNT = "123456789012"; // Your security tooling account ID 
      export const CUSTOMER_ACCOUNTS = ["234567890123", "345678901234"]; // Target account IDs 
      export const ALLOW_LISTED_ROLE_NAMES = ["SecurityAnalystRole"];// Roles allowed to access evidence S3 bucket 
      export const ALERT_EMAIL_RECIPIENTS = ["[email protected]"];// Email addresses for alerts

  3. Bootstrap AWS CDK in your accounts (if it hasn’t been done already):
    1. Example: cdk bootstrap aws://456789012345/us-east-1 (example security AWS account).
    2. Then bootstrap if necessary in any target AWS accounts.
  4. Deploy the AWS CDK Stacks:
    1. Synthesize the CloudFormation template:
      cdk synth
    2. Deploy the security and alert stacks in your security account:
      cdk deploy SecurityStack AlertStack
    3. Deploy the customer stacks in your workload accounts:
      cdk deploy CustomerStack-ACCOUNT_ID
  5. Set up your email alerts:
    1. After the AlertStack is deployed, it will email all addresses listed in ALERT_EMAIL_RECIPIENTS. Choose the embedded link to accept the AWS SNS topic in each of those accounts.

Testing

With deployment complete, it’s time to test the solution.

  1. Trigger an analysis
    1. Make sure you have a Linux EC2 instance running in one of your customer accounts and in the AWS Region where you deployed the preceding customer stack.
    2. Because this example uses Systems Manager to orchestrate the collection script, make sure that the EC2 instance is visible in Systems Manager either by checking the Systems Manager console, or by using the AWS CLI:
      1. Console: In the AWS Systems Manager console, choose Managed instances in the left navigation pane and verify your instance appears in the list. For more information, see Managed Instances in the AWS Systems Manager User Guide.
      2. AWS CLI: Run the following command to verify the instance is managed:
        aws ssm describe-instance-information --filters “Key=InstanceIds,Values=<instance-id>
        If the command returns instance information with PingStatus: Online, the instance is properly connected to Systems Manager.
    3. Post a message in your security account to the Amazon SQS queue to start the Step Functions workflow. Note that the values in angle brackets (for example <accountID>) are placeholders that you must update with relevant AWS account ID, tracking ticket ID, AWS Region, and EC2 instance ID values:
      aws sqs send-message --queue-url --message-body ‘{ “account”: “”, “ticket_id”: “”, “region”: “>”, “instance_id”: “” }’
  2. Go to the Step Functions console to view the successful execution of the workflow:
    Figure 4 – Workflow as shown in the Step Functions console

    Figure 4: Workflow as shown in the Step Functions console

  3. View the DynamoDB table to see the metadata for the results.
  4. Check the evidence S3 bucket to see the uploaded files from the forensic collection.

Conclusion

Collecting forensic artifacts securely is a critical component of any digital forensics investigation. This post demonstrated how to implement least privilege access controls and time-limited credentials for forensic evidence collection workflows that use Amazon S3 for artifact storage. By combining IAM session policies with AWS STS temporary credentials, you can provide forensic tools with secure, scoped-down access to upload artifacts without exposing long-lived credentials or granting overly permissive access.

The architecture presented in this post automates the process of generating temporary credentials, collecting forensic artifacts from both AWS and non-AWS resources, and securely storing them in S3 buckets with appropriate encryption, access controls, and audit logging. With this approach, your security teams can focus on analyzing evidence instead of managing credentials and permissions during active security incidents.To get started with this solution, deploy the example AWS CDK stacks provided in the collect forensic artifacts repository and customize them for your organization’s forensic investigation requirements. For more information about related AWS forensic investigation architectures, review the Automated Forensics Orchestrator for EC2 and How to build forensic kernel modules for Linux EC2 instances resources.

If you have feedback about this post, submit comments in the Comments section below. If you have questions about this post, contact AWS Support.
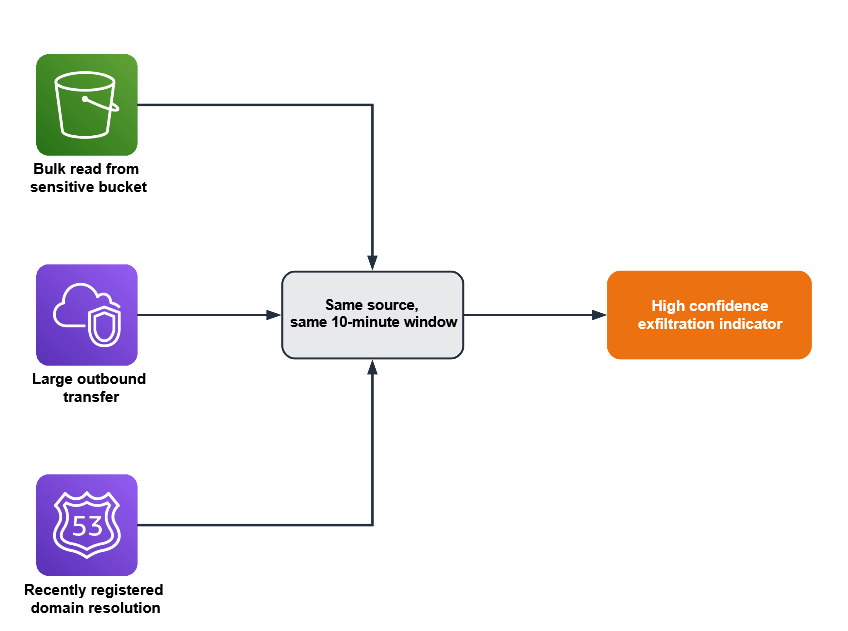
Jason Garman

Jason Garman

Jason is a principal security specialist solutions architect at AWS. He has 30 years of cybersecurity experience including incident response, reverse engineering, identity, and data protection. At AWS, he helps large organizations adopt the latest cloud and AI technologies while maintaining a high bar for data governance, security, and safety.

Vaishnav Murthy

Vaishnav Murthy

Vaishnav is a Senior Security Engineer with AWS CloudResponse. He has an extensive background in incident response and security automation and enjoys building automated solutions that help AWS customers investigate and respond to security incidents at scale.

FortiGate CVE-2025-59718 Exploitation: Incident Response Findings

Post Syndicated from Eric Carey original https://www.rapid7.com/blog/post/ve-fortigate-cve-2025-59718-exploitation-incident-response-ir-findings

Rapid7’s Incident Response (IR) team was engaged to investigate an incident involving exploitation of CVE-2025-59718 against a vulnerable FortiGate appliance. In December 2025, Fortinet disclosed this improper verification of cryptographic signature vulnerability that facilitates an SSO login bypass on affected appliances. After the initial exploitation, the attackers maintained a low-profile posture, systematically compromising additional firewalls before moving to internal network hosts. Ultimately, this grace period allowed responders to contain the threat before further impact could occur within the environment. This blog details exploitation insights, attack progression, and practical detection opportunities for defenders handling their own environments.

Investigative methodology: Tracing the initial access vector in FortiGate appliances

Identifying the Initial Access Vector (IAV) is a cornerstone of any incident response engagement. However, when the source of compromise is not immediately obvious, particularly when edge device exploitation is involved, responders often need to take a broader investigative approach. Rather than starting with a clear point of entry, investigators must analyze the available telemetry, reconstruct attacker activity, and work backwards to determine how access was first obtained.

This process often involves multiple investigative workstreams running in parallel, each designed to answer different questions about the intrusion. As many IR responders and enthusiasts know, the first suspicious event observed during an investigation is rarely the first action taken by the attacker. Instead, it typically represents a point somewhere in the middle of a larger attack chain.

A key step in incident response investigations is reconstructing the attacker timeline. Responders often take an “inside out” approach where they move outward from the initial alert to the full scope of the malicious activity (IAV), correlating multiple data sources to map the unfolding of the event. This process involves examining authentication logs, endpoint telemetry, firewall events, and records of system changes, rather than depending on just one log source. It also typically requires frequent pivoting between artifacts as investigations rarely ever unfold in a linear fashion. By aligning these findings and events chronologically, investigators often identify activity that predates the initial alert.

CVE-2025-59718: Technical analysis and observed attacker behavior

The first activity that drew attention was enumeration and credential discovery within the internal environment. This basic enumeration included gathering information about users, systems, and accessible resources within common user directories. This activity eventually expanded to SMB-based file scraping and network share access, allowing attackers to review files stored across the environment. While this behavior resembled routine administration, the chronological sequence of file scraping and network share access painted a clear picture of an attacker’s initial discovery phase.

Digging deeper into the credential discovery activity, the popular tool Mimikatz was utilized to harvest credentials from various sources within the impacted environment. The attacker’s objective was to obtain valid credentials to an elevated admin account with the goal to blend in.

With credentials in hand and mimicking admin activity to disguise their actions, the attacker was then enabled to move laterally throughout the environment using common administrative tools and access methods. PsExec and Microsoft Remote Desktop (RDP) were two tools utilized for lateral movement while standard web browsers facilitated application access.

Attackers appeared particularly interested in systems that could provide broader access to the environment, including virtualization platforms, domain controllers, and servers supporting backup infrastructure. These systems often represent high-value targets for attackers seeking to escalate privileges, access sensitive data, or disrupt recovery capabilities.

Responders were working simultaneously to contain the attacker while building the narrative to cut them off at the source. With the current understanding of the narrative, the IAV puzzle began to unravel as more information came to light. Strangely, the first authentication into the Windows environment originated from an internal IP address that did not align with the known internal IP address ranges. It turns out, this internal IP address fell within the DHCP lease range of the FortiGate device. At first glance, this could be written off as legitimate VPN activity. However, to create even more questions, it was revealed that the FortiGate SSL VPN was never turned on within this environment. This revelation made the FortiGate device a prime suspect for IAV.

Taking a closer look at the FortiGate device, specifically system logs and configuration data, revealed early indications that the device had been modified to support continued access. The SSL VPN component had been enabled, and multiple configuration changes were identified, including edits to VPN settings, the creation of new firewall policies, and adjustments to configuration parameters. These changes appeared in FortiGate system logs as configuration updates similar to the following:

logid="0100044546" type="event" subtype="system" level="information"
vd="root" logdesc="Attribute configured" user="admins"
ui="GUI(45.32.216[.]250)" action="Edit" cfgpath="vpn.ssl.settings"
msg="Edit vpn.ssl.settings"

logid="0100044547" type="event" subtype="system" level="information" 
vd="root" logdesc="Object attribute configured" user="admins" 
ui="GUI(45.32.216[.]250)" action="Add" cfgpath="firewall.policy" 
cfgobj="XX" msg="Add firewall.policy <redacted>"

While these types of changes may seem routine in isolation, it is the combination and timing of these actions that raises concerns from a responder’s perspective. The investigation’s next key clue was identified when the source of these changes was traced back to a newly created account.

Following this thread further, investigators identified that multiple accounts had been created on the device, including SSO administrator, system administrator, and local accounts. Several of these accounts were associated with email domains attributed to Namecheap-hosted infrastructure, including domains such as openmail[.]pro. Notably, some of the newly created SSO administrator accounts were linked to forticloud.com domains as reflected in log entries such as:

Object attribute configured(Add system.sso-forticloud-admin <attacker account>@forticloud.com-1)

For responders, the creation of multiple new administrative accounts is often a strong indicator of persistence being established. Continuing to work backwards through the timeline, investigators identified that prior to these account creation events, the device’s configuration file was downloaded through the FortiGate UI. From an investigative perspective, configuration exports are highly valuable to attackers because they effectively serve as a blueprint of the environment, exposing network architecture, authentication mechanisms/settings, device relationships, and occasionally, sensitive credentials.

logid="0100032095" type="event" subtype="system" level="warning" 
vd="root" logdesc="Admin performed an action from GUI" user="admin" 
ui="GUI(104.28.227[.]105)" action="download" status="success" 
msg="System config file has been downloaded by user admin via GUI(104.28.227[.]105)"

The session associated with the configuration download was established from an external IP address flagged as “malicious” by security vendors with a local account already present on the device. All of these new findings from the attacker’s actions can now be utilized as IOCs to scope available FortiGate logs to determine any other leads.

By correlating activity with the known malicious IP addresses, investigators identified the true entry point: administrative SSO logins to the FortiGate appliance with valid accounts. Another important detail was that there was no evidence of brute-forcing activity for these local accounts. The initial access was established approximately two weeks before any subsequent malicious activity, indicating the attacker used this time to secure consistent access to the environment via the FortiGate device.

Actions such as changing configurations, creating accounts, and downloading configurations might seem harmless individually. However, when viewed together, these activities established a clear pattern consistent with the exploitation of CVE-2025-59718 that facilitated authentication bypass.

Once this groundwork was established through persistence mechanisms and discovery, attackers began authenticating into the environment with their newly created accounts via the SSL VPN connections that led us to investigate the FortiGate device in the first place. These sessions effectively transformed the firewall into an ingress point into the internal network, allowing attackers to move beyond the edge device.

This investigation highlights a common reality in incident response where the first indicator of suspicious activity is rarely the beginning of the story. Instead, responders are often working from a point somewhere in the middle, tasked with reconstructing attacker behavior and peeling back layers of activity to uncover how access was first obtained. 

By following the digital breadcrumbs left behind within available evidence sources, investigators were able to trace the intrusion back to its origin. This process emphasizes the importance of working backward through artifacts and telemetry, recognizing that each piece of data may lead to an earlier stage of attacker activity.

Network edge devices such as firewalls and VPN appliances are often the main vectors of initial access. Despite being critical infrastructure in modern environments, full visibility is rarely achieved in comparison to monitored endpoints. These edge devices can provide valuable evidence during investigations and reveal how initial access went unnoticed.

Conclusion: Key takeaways for defenders

The human element of investigation is crucial. Effective investigations demand a mindset of curiosity; on one side the willingness to dig deeper, and on the other, the ability to look at the big picture. At face value these can seem contradictory, but each facilitates a specific role within an incident response investigation.

Curiosity is what drives responders to grapple with the initial evidence, question assumptions, and identify which threads are worth pulling. It allows responders to move beyond surface-level observations and begin forming hypotheses about what may have occurred. The willingness to dive deeper is what turns those hypotheses into answers. Rather than stopping at the first suspicious event, responders must continue pivoting across logs, correlating activity, and tracing actions further back in time. At the same time, maintaining a big-picture perspective is critical. Individual artifacts or events may appear benign in isolation but when viewed chronologically the attacker behavior emerges.

Looking past any specific incident response methodology, visibility into the environment is essential. Even the strongest investigative approach is limited without access to the right telemetry, thus preventing responders from fully reconstructing an intrusion. In particular, as seen within this investigation, visibility into edge device activity can play a crucial role in unraveling IAV. The network edge is a hostile environment yet is frequently less monitored.

As is often the case with externally facing services and devices, the network edge is constantly targeted. Due to the sheer volume of persistent targeting, this environment can prove difficult to monitor for successful malicious intrusions. Implementing centralized syslog monitoring across these edge devices can close these visibility gaps. It can provide a real-time audit trail of connection attempts, configuration changes, and potential exploit signatures that occur before a threat reaches the internal network.

By effectively pulling on each investigative thread and ensuring visibility across both internal systems and edge devices, defenders can uncover compromises that might otherwise remain hidden. Often, the path to the beginning of the intrusion is already present; it simply requires knowing where, and how, to look.

Detection coverage for Rapid7 customers

Rapid7 actively monitors for emerging threats and leverages evidence from incident response engagements to develop new detection capabilities. Detections have been created and implemented by Rapid7 to pinpoint both exploitation attempts and post-exploitation activities related to FortiGate CVE-2025-59718. For InsightIDR and MDR customers, these detections alert on attacker activity consistent with the techniques described in this blog, enabling earlier identification and response before an intrusion can escalate further.

Detections:

  • Potential Exploitation – FortiGate Admin SSO Login and Config Download via External IP

  • Exfiltration – FortiGate Config Downloaded Using GUI via External IP

  • Suspicious Authentication – FortiGate SSO Login via External IP

Mitigation guidance

Please refer to our initial blog from December, 2025.

MITRE ATT&CK Techniques

Tactic

Technique

Details

Initial Access

Exploit Public-Facing Application (T1190)

Exploitation of vulnerability CVE-2025-59718 on FortiGate firewalls.

Persistence

Create Account (T1136)

Creation of local accounts on FortiGate firewalls.

Persistence and Initial Access

Valid Accounts (T1078)

Use of created accounts and compromised accounts for SSL VPN and RDP authentication.

Defense Evasion

Impair Defenses (T1562)

Firewall rules added to allow for attacker access.

Credential Access

OS Credential Dumping (T1003)

Execution of Mimikatz targeting the local system and Windows Registry hives containing credentials.

Discovery

System Network Configuration Discovery (T1016)

Download of FortiGate firewall configuration files containing sensitive networking information.

Discovery

Network Service Scanning (T1046)

Execution of network scanning tools such as Advanced_Port_Scanner to scan internal IP addresses over SMB protocol.

Lateral Movement

Remote Services (T1021)

Use of Remote Desktop Protocol (RDP).

Execution

Service Execution (T1569.002)

Remote execution of the sysinternals tool PsExec to test credentials against an impacted system.

Indicators of compromise (IOCs)

IOC

Description

Advanced_IP_Scanner_2.5.4594.1.exe

Advanced IP Scanner tool utilized by the attacker.

advanced_ip_scanner.exe 

Advanced IP Scanner tool utilized by the attacker.

mimikatz.exe

An open-source post-exploitation tool utilized by the attacker to extract sensitive authentication credentials.

Advanced_port_scanner_2.5.3869.exe

An open-source network utility utilized by the attacker to quickly map active devices and identify open ports.

23.163.8[.]21

Attacker IP address that targeted FortiGate device.

45.32.216[.]250

IP address used by the attacker during FortiGate configuration changes.

45.84.107[.]17

IP address identified in malicious interaction with SSLVPN.

45.80.186[.]84

IP address identified in malicious interaction with SSLVPN.

185.219.157[.]127

IP address identified in malicious interaction with SSLVPN.

185.175.59[.]238

IP address identified in malicious interaction with SSLVPN.

198.98.54[.]209

Attacker IP address that targeted FortiGate device and SSO login.

45.80.184[.]229

Attacker IP address that targeted FortiGate device and SSLVPN.

45.80.184[.]241

Attacker IP address that targeted FortiGate device and SSLVPN.

42.200.230[.]178

Attacker IP address that targeted FortiGate device and SSLVPN.

103.20.235[.]155

IP address identified in malicious authentications to SSO login.

104.28.227[.]105

IP address identified in attacker download of FortiGate configuration file.

Cloudflare outage on February 20, 2026

Post Syndicated from David Tuber original https://blog.cloudflare.com/cloudflare-outage-february-20-2026/

On February 20, 2026, at 17:48 UTC, Cloudflare experienced a service outage when a subset of customers who use Cloudflare’s Bring Your Own IP (BYOIP) service saw their routes to the Internet withdrawn via Border Gateway Protocol (BGP).

The issue was not caused, directly or indirectly, by a cyberattack or malicious activity of any kind. This issue was caused by a change that Cloudflare made to how our network manages IP addresses onboarded through the BYOIP pipeline. This change caused Cloudflare to unintentionally withdraw customer prefixes.

For some BYOIP customers, this resulted in their services and applications being unreachable from the Internet, causing timeouts and failures to connect across their Cloudflare deployments that used BYOIP. A subset of 1.1.1.1, specifically our destination one.one.one.one, was also impacted. The total duration of the incident was 6 hours and 7 minutes with most of that time spent restoring prefix configurations to their state prior to the change.

Cloudflare engineers reverted the change and prefixes stopped being withdrawn when we began to observe failures. However, before engineers were able to revert the change, ~1,100 BYOIP prefixes were withdrawn from the Cloudflare network. Some customers were able to restore their own service by using the Cloudflare dashboard to re-advertise their IP addresses. We resolved the incident when we restored all prefix configurations.

We are sorry for the impact to our customers. We let you down today. This post is an in-depth recounting of exactly what happened and which systems and processes failed. We will also outline the steps we are taking to prevent outages like this from happening again.

How did the outage impact customers?

This graph shows the amount of prefixes advertised by Cloudflare during the incident to a BGP neighbor, which correlates to impact as prefixes that weren’t advertised were unreachable on the Internet:


Out of the total 6,500 prefixes advertised to this peer, 4,306 of those were BYOIP prefixes. These BYOIP prefixes are advertised to every peer and represent all the BYOIP prefixes we advertise globally. 

During the incident, 1,100 prefixes out of the total 6,500 were withdrawn from 17:56 to 18:46 UTC. Out of the 4,306 total BYOIP prefixes, 25% of BYOIP prefixes were unintentionally withdrawn. We were able to detect impact on one.one.one.one and revert the impacting change before more prefixes were impacted. At 19:19 UTC, we published guidance to customers that they would be able to self-remediate this incident by going to the Cloudflare dashboard and re-advertising their prefixes.

Cloudflare was able to revert many of the advertisement changes around 20:20 UTC, which caused 800 prefixes to be restored. There were still ~300 prefixes that were unable to be remediated through the dashboard because the service configurations for those prefixes were removed from the edge due to a software bug. These prefixes were manually restored by Cloudflare engineers at 23:03 UTC. 

This incident did not impact all BYOIP customers because the configuration change was applied iteratively and not instantaneously across all BYOIP customers. Once the configuration change was revealed to be causing impact, the change was reverted before all customers were affected. 

The impacted BYOIP customers first experienced a behavior called BGP Path Hunting. In this state, end user connections traverse networks trying to find a route to the destination IP. This behavior will persist until the connection that was opened times out and fails. Until the prefix is advertised somewhere, customers will continue to see this failure mode. This loop-until-failure scenario affected any product that uses BYOIP for advertisement to the Internet. One.one.one.one, which is a subset of 1.1.1.1, is a prefix onboarded as a BYOIP prefix, and was impacted in this manner. This prefix, which was Cloudflare-maintained but using our own products, allowed us to detect this issue quickly. A full breakdown of the services impacted is below.

Service/Product Impact Description
Core CDN and Security Services Traffic was not attracted to Cloudflare, and users connecting to websites advertised on those ranges would have seen failures to connect
Spectrum Spectrum apps on BYOIP failed to proxy traffic due to traffic not being attracted to Cloudflare
Dedicated Egress Customers who used Gateway Dedicated Egress leveraging BYOIP or Dedicated IPs for CDN Egress leveraging BYOIP would not have been able to send traffic out to their destinations
Magic Transit End users connecting to applications protected by Magic Transit would not have been advertised on the Internet, and would have seen connection timeouts and failures

There was also a set of customers who were unable to restore service by toggling the prefixes on the Cloudflare dashboard. As engineers began reannouncing prefixes to restore service for these customers, these customers may have seen increased latency and failures despite their IP addresses being advertised. This was because the addressing settings for some users were removed from edge servers due an issue in our own software, and the state had to be propagated back to the edge. 

We’re going to get into what exactly broke in our addressing system, but to do that we need to cover a quick primer on the Addressing API, which is the underlying source of truth for customer IP addresses at Cloudflare.

Cloudflare’s Addressing API

The Addressing API is an authoritative dataset of the addresses present on the Cloudflare network. Any change to that dataset is immediately reflected in Cloudflare’s global network. While we are in the process of improving how these systems roll out changes as a part of Code Orange: Fail Small, today customers can configure their IP addresses by interacting with public-facing APIs which configure a set of databases that trigger operational workflows propagating the changes to Cloudflare’s edge. This means that changes to the Addressing API are immediately propagated to the Cloudflare edge.

Advertising and configuring IP addresses on Cloudflare involves several steps:

  • Customers signal to Cloudflare about advertisement/withdrawal of IP addresses via the Addressing API or BGP Control

  • The Addressing API instructs the machines to change the prefix advertisements

  • BGP will be updated on the routers once enough machines have received the notification to update the prefix

  • Finally, customers can configure Cloudflare products to use BYOIP addresses via service bindings which will assign products to these ranges

The Addressing API allows us to automate most of the processes surrounding how we advertise or withdraw addresses, but some processes still require manual actions. These manual processes are risky because of their close proximity to Production. As a part of Code Orange: Fail Small, one of the goals of remediation was to remove manual actions taken in the Addressing API and replace them with safe workflows.

How did the incident occur?

The specific piece of configuration that broke was a modification attempting to automate the customer action of removing prefixes from Cloudflare’s BYOIP service, a regular customer request that is done manually today. Removing this manual process was part of our Code Orange: Fail Small work to push all change towards safe, automated, health-mediated deployment. Since the list of related objects of BYOIP prefixes can be large, this was implemented as part of a regularly running sub-task that checks for BYOIP prefixes that should be removed, and then removes them. Unfortunately, this regular cleanup sub-task queried the API with a bug.

Here is the API query from the cleanup sub-task:

 resp, err := d.doRequest(ctx, http.MethodGet, `/v1/prefixes?pending_delete`, nil)

And here is the relevant part of the API implementation:

	if v := req.URL.Query().Get("pending_delete"); v != "" {
		// ignore other behavior and fetch pending objects from the ip_prefixes_deleted table
		prefixes, err := c.RO().IPPrefixes().FetchPrefixesPendingDeletion(ctx)
		if err != nil {
			api.RenderError(ctx, w, ErrInternalError)
			return
		}

		api.Render(ctx, w, http.StatusOK, renderIPPrefixAPIResponse(prefixes, nil))
		return
	}

Because the client is passing pending_delete with no value, the result of Query().Get(“pending_delete”) here will be an empty string (“”), so the API server interprets this as a request for all BYOIP prefixes instead of just those prefixes that were supposed to be removed. The system interpreted this as all returned prefixes being queued for deletion. The new sub-task then began systematically deleting all BYOIP prefixes and all of their related dependent objects including service bindings, until the impact was noticed, and an engineer identified the sub-task and shut it down.

Why did Cloudflare not catch the bug in our staging environment or testing?

Our staging environment contains data that matches Production as closely as possible, but was not sufficient in this case and the mock data we relied on to simulate what would occur was insufficient.

In addition, while we have tests for this functionality, coverage for this scenario in our testing process and environment was incomplete. Initial testing and code review focused on the BYOIP self-service API journey and were completed successfully. While our engineers successfully tested the exact process a customer would have followed, testing did not cover a scenario where the task-runner service would independently execute changes to user data without explicit input.

Why was recovery not immediate?

Affected BYOIP prefixes were not all impacted in the same way, necessitating more intensive data recovery steps. As a part of Code Orange: Fail Small, we are building a system where operational state snapshots can be safely rolled out through health-mediated deployments. In the event something does roll out that causes unexpected behavior, it can be very quickly rolled back to a known-good state. However, that system is not in Production today.

BYOIP prefixes were in different states of impact during this incident, and each of these different states required different actions:

  • Most impacted customers only had their prefixes withdrawn. Customers in this configuration could go into the dashboard and toggle their advertisements, which would restore service. 

  • Some customers had their prefixes withdrawn and some bindings removed. These customers were in a partial state of recovery where they could toggle some prefixes but not others.

  • Some customers had their prefixes withdrawn and all service bindings removed. They could not toggle their prefixes in the dashboard because there was no service (Magic Transit, Spectrum, CDN) bound to them. These customers took the longest to mitigate, as a global configuration update had to be initiated to reapply the service bindings for all these customers to every single machine on Cloudflare’s edge.

How does this incident relate to Code Orange: Fail Small?

The change we were making when this incident occurred is part of the Code Orange: Fail Small initiative, which is aimed at improving the resiliency of code and configuration at Cloudflare. As a brief primer of the Code Orange: Fail Small initiatives, the work can be divided into three buckets:

  • Require controlled rollouts for any configuration change that is propagated to the network, just like we do today for software binary releases.

  • Change our internal “break glass” procedures and remove any circular dependencies so that we, and our customers, can act fast and access all systems without issue during an incident.

  • Review, improve, and test failure modes of all systems handling network traffic to ensure they exhibit well-defined behavior under all conditions, including unexpected error states.

The change that we attempted to deploy falls under the first bucket. By moving risky, manual changes to safe, automated configuration updates that are deployed in a health-mediated manner, we aim to improve the reliability of the service.

Critical work was already ongoing to enhance the Addressing API’s configuration change support through staged test mediation and better correctness checks. This work was ongoing in parallel with the deployed change. Although preventative measures weren’t fully deployed before the outage, teams were actively working on these systems when the incident occurred. Following our Code Orange: Fail Small promise to require controlled rollouts of any change into Production, our engineering teams have been reaching deep into all layers of our stack to identify and fix all problematic findings. While this outage wasn’t itself global, the blast radius and impact were unacceptably large, further reinforcing Code Orange: Fail Small as a priority until we have re-established confidence in all changes to our network being as gradual as possible. Now let’s talk more specifically about improvements to these systems.

Remediation and follow-up steps

API schema standardization

One of the issues in this incident is that the pending_delete flag was interpreted as a string, making it difficult for both client and server to rationalize the value of the flag. We will improve the API schema to ensure better standardization, which will make it much easier for testing and systems to validate whether an API call is properly formed or not. This work is part of the third Code Orange workstream, which aims to create well-defined behavior under all conditions.

Better separation between operational and configured state

Today, customers make changes to the addressing schema that are persisted in an authoritative database, and that database is the same one used for operational actions. This makes manual rollback processes more challenging because engineers need to utilize database snapshots instead of rationalizing between desired and actual states. We will redesign the rollback mechanism and database configuration to ensure that we have an easy way to roll back changes quickly and also to introduce layers between customer configuration and Production.

We will snap shot the data that we read from the database and are applying to Production, and apply those snapshots in the same way that we deploy all our other Production changes, mediated by health metrics that can automatically stop the deployment if things are going wrong. This means that the next time we have a problem where the database gets changed into a bad state, we can near-instantly revert individual customers (or all customers) to a version that was working.

While this will temporarily block our customers from being able to make direct updates via our API in the event of an outage, it will mean that we can continue serving their traffic while we work to fix the database, instead of being down for that time. This work aligns with the first and second Code Orange workstreams, which involves fast rollback and also safe, health-mediated deployment of configuration.

Better arbitrate large withdrawal actions

We will improve our monitoring to detect when changes are happening too fast or too broadly, such as withdrawing or deleting BGP prefixes quickly, and disable the deployment of snapshots when this happens. This will form a type of circuit breaker to stop any out-of-control process that is manipulating the database from having a large blast radius, like we saw in this incident.

We also have some ongoing work to directly monitor that the services run by our customers are behaving correctly, and those signals can also be used to trip the circuit breaker and stop potentially dangerous changes from being applied until we have had time to investigate. This work aligns with the first Code Orange workstream, which involves safe deployment of changes.

Below is the timeline of events inclusive of deployment of the change and remediation steps:

Time (UTC) Status Description
2026-02-05 21:53 Code merged into system Broken sub-process merged into code base
2026-02-20 17:46 Code deployed into system Address API release with broken sub-process completes
2026-02-20 17:56 Impact Start Broken sub-process begins executing. Prefix advertisement updates begin propagating and prefixes begin to be withdrawn – IMPACT STARTS –
2026-02-20 18:13 Cloudflare engaged Cloudflare engaged for failures on one.one.one.one
2026-02-20 18:18 Internal incident declared Cloudflare engineers continue investigating impact
2026-02-20 18:21 Addressing API team paged Engineering team responsible for Addressing API engaged and debugging begins
2026-02-20 18:46 Issue identified Broken sub-process terminated by an engineer and regular execution disabled; remediation begins
2026-02-20 19:11 Mitigation begins Cloudflare Engineers begin to restore serviceability for prefixes that were withdrawn while others focused on prefixes that were removed
2026-02-20 19:19 Some prefixes mitigated Customers begin to re-advertise their prefixes via the dashboard to restore service. – IMPACT DOWNGRADE –
2026-02-20 19:44 Additional mitigation continues Engineers begin database recovery methods for removed prefixes
2026-02-20 20:30 Final mitigation process begins Engineers complete release to restore withdrawn prefixes that still have existing service bindings. Others are still working on removed prefixes – IMPACT DOWNGRADE –
2026-02-20 21:08 Configuration update deploys Engineering begins global machine configuration rollout to restore prefixes that were not self-mitigated or mitigated via previous efforts – IMPACT DOWNGRADE –
2026-02-20 23:03 Configuration update completed Global machine configuration deployment to restore remaining prefixes is completed. – IMPACT ENDS –

We deeply apologize for this incident today and how it affected the service we provide our customers, and also the Internet at large. We aim to provide a network that is resilient to change, and we did not deliver on our promise to you. We are actively making these improvements to ensure improved stability moving forward and to prevent this problem from happening again.

When protections outlive their purpose: A lesson on managing defense systems at scale

Post Syndicated from Thomas Kjær Aabo original https://github.blog/engineering/infrastructure/when-protections-outlive-their-purpose-a-lesson-on-managing-defense-systems-at-scale/


To keep a platform like GitHub available and responsive, it’s critical to build defense mechanisms. A whole lot of them. Rate limits, traffic controls, and protective measures spread across multiple layers of infrastructure. These all play a role in keeping the service healthy during abuse or attacks.

We recently ran into a challenge: Those same protections can quietly outlive their usefulness and start blocking legitimate users. This is especially true for protections added as emergency responses during incidents, when responding quickly means accepting broader controls that aren’t necessarily meant to be long-term. User feedback led us to clean up outdated mitigations and reinforced that observability is just as critical for defenses as it is for features.

We apologize for the disruption. We should have caught and removed these protections sooner. Here’s what happened.

What users reported

We saw reports on social media from people getting “too many requests” errors during normal, low-volume browsing, such as when following a GitHub link from another service or app, or just browsing around with no obvious pattern of abuse.

Screenshot of a 'Too many requests' screen encountered by users.
Users encountered a “Too many requests” error during normal browsing.

These were users making a handful of normal requests hitting rate limits that shouldn’t have applied to them.

What we found

Investigating these reports, we discovered the root cause: Protection rules added during past abuse incidents had been left in place. These rules were based on patterns that had been strongly associated with abusive traffic when they were created. The problem is that those same patterns were also matching some logged-out requests from legitimate clients.

These patterns are combinations of industry-standard fingerprinting techniques alongside platform-specific business logic — composite signals that help us distinguish legitimate usage from abuse. But, unfortunately, composite signals can occasionally produce false positives.

The composite approach did provide filtering. Among requests that matched the suspicious fingerprints, only about 0.5–0.9% were actually blocked; specifically, those that also triggered the business-logic rules. Requests that matched both criteria were blocked 100% of the time.

Chart showing percentage of fingerprint matches that were blocked by also triggering business-logic rules, fluctuating between 0.5-0.9% over 60 minutes
Not all fingerprint matches resulted in blocks — only those also matching business logic patterns.

The overall impact was small but consistent; however, for the customers who were affected, we recognize that any incorrect blocking is unacceptable and can be disruptive. To put all of this in perspective, the following shows the false-positive rate relative to total traffic.

Chart showing false positives as approximately 0.003-0.004% of total traffic, with a reference line at 100%
False positives represented roughly 0.003-0.004% of total traffic.

Although the percentage was low, it still meant that real users were incorrectly blocked during normal browsing, which is not acceptable. The chart below zooms in specifically on this false-positive pattern over time.

Chart showing false positive rate over 60 minutes, hovering around 0.003-0.004%
In the hour before cleanup, approximately 3-4 requests per 100,000 (0.003-0.004%) were incorrectly blocked.

This is a common challenge when defending platforms at scale. During active incidents, you need to respond quickly, and you accept some tradeoffs to keep the service available. The mitigations are correct and necessary at that moment. Those emergency controls don’t age well as threat patterns evolve and legitimate tools and usage change.

Without active maintenance, temporary mitigations become permanent, and their side effects compound quietly.

Tracing through the stack

The investigation itself highlighted why these issues can persist. When users reported errors, we traced requests across multiple layers of infrastructure to identify where the blocks occurred.

To understand why this tracing is necessary, it helps to see how protection mechanisms are applied throughout our infrastructure. We’ve built a custom, multi-layered protection infrastructure tailored to GitHub’s unique operational requirements and scale, building upon the flexibility and extensibility of open-source projects like HAProxy. Here’s a simplified view of how requests flow through these defense layers (simplified to avoid disclosing specific defense mechanisms and to keep the concepts broadly applicable):

Diagram showing user requests flowing through multiple infrastructure layers (Edge, Application, Service, Backend), with protection mechanisms at each layer including DDoS protection, rate limits, authentication, and access controls.

Each layer has legitimate reasons to rate-limit or block requests. During an incident, a protection might be added at any of these layers depending on where the abuse is best mitigated and what controls are fastest to deploy.

The challenge: When a request gets blocked, tracing which layer made that decision requires correlating logs across multiple systems, each with different schemas.

In this case, we started with user reports and worked backward:

  1. User reports provided timestamps and approximate behavior patterns.
  2. Edge tier logs showed the requests reaching our infrastructure.
  3. Application tier logs revealed 429 “Too Many Requests” responses.
  4. Protection rule analysis ultimately identified which rules matched these requests.

The investigation took us from external reports to distributed logs to rule configurations, demonstrating that maintaining comprehensive visibility into what’s actually blocking requests and where is essential.

The lifecycle of incident mitigations

Here’s how these protections outlived their purpose:

Diagram showing incident mitigation lifecycle: control added during incident, works initially, remains active over time without review, eventually blocks legitimate traffic.

Each mitigation was necessary when added. But the controls where we didn’t consistently apply lifecycle management (setting expiration dates, conducting post-incident rule reviews, or monitoring impact) became technical debt that accumulated until users noticed.

What we did

We reviewed these mitigations, analyzing what each one was blocking today versus what it was meant to block when created. We removed the rules that were no longer serving their purpose, and kept protections against ongoing threats.

What we’re building

Beyond the immediate fix, we’re improving the lifecycle management of protective controls:

  • Better visibility across all protection layers to trace the source of rate limits and blocks.
  • Treating incident mitigations as temporary by default. Making them permanent should require an intentional, documented decision.
  • Post-incident practices that evaluate emergency controls and evolve them into sustainable, targeted solutions.

Defense mechanisms – even those deployed quickly during incidents – need the same care as the systems they protect. They need observability, documentation, and active maintenance. When protections are added during incidents and left in place, they become technical debt that quietly accumulates.

Thanks to everyone who reported issues publicly! Your feedback directly led to these improvements. And thanks to the teams across GitHub who worked on the investigation and are building better lifecycle management into how we operate. Our platform, team, and community are better together!

The post When protections outlive their purpose: A lesson on managing defense systems at scale appeared first on The GitHub Blog.

Cryptomining campaign targeting Amazon EC2 and Amazon ECS

Post Syndicated from Kyle Koeller original https://aws.amazon.com/blogs/security/cryptomining-campaign-targeting-amazon-ec2-and-amazon-ecs/

Amazon GuardDuty and our automated security monitoring systems identified an ongoing cryptocurrency (crypto) mining campaign beginning on November 2, 2025. The operation uses compromised AWS Identity and Access Management (IAM) credentials to target Amazon Elastic Container Service (Amazon ECS) and Amazon Elastic Compute Cloud (Amazon EC2). GuardDuty Extended Threat Detection was able to correlate signals across these data sources to raise a critical severity attack sequence finding. Using the massive, advanced threat intelligence capability and existing detection mechanisms of Amazon Web Services (AWS), GuardDuty proactively identified this ongoing campaign and quickly alerted customers to the threat. AWS is sharing relevant findings and mitigation guidance to help customers take appropriate action on this ongoing campaign.

It’s important to note that these actions don’t take advantage of a vulnerability within an AWS service but rather require valid credentials that an unauthorized user uses in an unintended way. Although these actions occur in the customer domain of the shared responsibility model, AWS recommends steps that customers can use to detect, prevent, or reduce the impact of such activity.

Understanding the crypto mining campaign

The recently detected crypto mining campaign employed a novel persistence technique designed to disrupt incident response and extend mining operations. The ongoing campaign was originally identified when GuardDuty security engineers discovered similar attack techniques being used across multiple AWS customer accounts, indicating a coordinated campaign targeting customers using compromised IAM credentials.

Operating from an external hosting provider, the threat actor quickly enumerated Amazon EC2 service quotas and IAM permissions before deploying crypto mining resources across Amazon EC2 and Amazon ECS. Within 10 minutes of the threat actor gaining initial access, crypto miners were operational.

A key technique observed in this attack was the use of ModifyInstanceAttribute with disable API termination set to true, forcing victims to re-enable API termination before deleting the impacted resources. Disabling instance termination protection adds an additional consideration for incident responders and can disrupt automated remediation controls. The threat actor’s scripted use of multiple compute services, in combination with emerging persistence techniques, represents an advancement in crypto mining persistence methodologies that security teams should be aware of.

The multiple detection capabilities of GuardDuty successfully identified the malicious activity through EC2 domain/IP threat intelligence, anomaly detection, and Extended Threat Detection EC2 attack sequences. GuardDuty Extended Threat Detection was able to correlate signals as an AttackSequence:EC2/CompromisedInstanceGroup finding.

Indicators of compromise (IoCs)

Security teams should monitor for the following indicators to identify this crypto mining campaign. Threat actors frequently modify their tactics and techniques, so these indicators might evolve over time:

  • Malicious container image – The Docker Hub image yenik65958/secret, created on October 29, 2025, with over 100,000 pulls, was used to deploy crypto miners to containerized environments. This malicious image contained a SBRMiner-MULTI binary for crypto mining. This specific image has been taken down from Docker Hub, but threat actors might deploy similar images under different names.
  • Automation and toolingAWS SDK for Python (Boto3) user agent patterns indicating Python-based automation scripts were used across the entire attack chain.
  • Crypto mining domains: asia[.]rplant[.]xyz, eu[.]rplant[.]xyz, and na[.]rplant[.]xyz.
  • Infrastructure naming patterns – Auto scaling groups followed specific naming conventions: SPOT-us-east-1-G*-* for spot instances and OD-us-east-1-G*-* for on-demand instances, where G indicates the group number.

Attack chain analysis

The crypto mining campaign followed a systematic attack progression across multiple phases. Sensitive fields in this post were given fictitious values to protect personally identifiable information (PII).

Cryptocurrency Mining Campaign Diagram

Figure 1: Cryptocurrency mining campaign diagram

Initial access, discovery, and attack preparation

The attack began with compromised IAM user credentials possessing admin-like privileges from an anomalous network and location, triggering GuardDuty anomaly detection findings. During the discovery phase, the attacker systematically probed customer AWS environments to understand what resources they could deploy. They checked Amazon EC2 service quotas (GetServiceQuota) to determine how many instances they could launch, then tested their permissions by calling the RunInstances API multiple times with the DryRun flag enabled.

The DryRun flag was a deliberate reconnaissance tactic that allowed the actor to validate their IAM permissions without actually launching instances, avoiding costs and reducing their detection footprint. This technique demonstrates the threat actor was validating their ability to deploy crypto mining infrastructure before acting. Organizations that don’t typically use DryRun flags in their environments should consider monitoring for this API pattern as an early warning indicator of compromise. AWS CloudTrail logs can be used with Amazon CloudWatch alarms, Amazon EventBridge, or your third-party tooling to alert on these suspicious API patterns.

The threat actor called two APIs to create IAM roles as part of their attack infrastructure: CreateServiceLinkedRole to create a role for auto scaling groups and CreateRole to create a role for AWS Lambda. They then attached the AWSLambdaBasicExecutionRole policy to the Lambda role. These two roles were integral to the impact and persistence stages of the attack.

Amazon ECS impact

The threat actor first created dozens of ECS clusters across the environment, sometimes exceeding 50 ECS clusters in a single attack. They then called RegisterTaskDefinition with a malicious Docker Hub image yenik65958/secret:user. With the same string used for the cluster creation, the actor then created a service, using the task definition to initiate crypto mining on ECS AWS Fargate nodes. The following is an example of API request parameters for RegisterTaskDefinition with a maximum CPU allocation of 16,384 units.

{   
    "dryrun": false,   
    "requiresCompatibilities": ["FARGATE"],   
    "cpu": 16384,   
    "containerDefinitions": [     
        {       
            "name": "a1b2c3d4e5",       
            "image": "yenik65958/secret:user",       
            "cpu": 0,       
            "command": []     
        }   
    ],   
    "networkMode": "awsvpc",   
    "family": "a1b2c3d4e5",   
    "memory": 32768 
}

Using this task definition, the threat actor called CreateService to launch ECS Fargate tasks with a desired count of 10.

{   
    "dryrun": false,   
    "capacityProviderStrategy": [     
        {       
            "capacityProvider": "FARGATE",       
            "weight": 1,       
            "base": 0     
        },     
        {       
            "capacityProvider": "FARGATE_SPOT",       
            "weight": 1,       
            "base": 0     
        }   
    ],   
    "desiredCount": 10 
}

Figure 2: Contents of the cryptocurrency mining script within the malicious image

Figure 2: Contents of the cryptocurrency mining script within the malicious image

The malicious image (yenik65958/secret:user) was configured to execute run.sh after it has been deployed. run.sh runs randomvirel mining algorithm with the mining pools: asia|eu|na[.]rplant[.]xyz:17155. The flag nproc --all indicates that the script should use all processor cores.

Amazon EC2 impact

The actor created two launch templates (CreateLaunchTemplate) and 14 auto scaling groups (CreateAutoScalingGroup) configured with aggressive scaling parameters, including a maximum size of 999 instances and desired capacity of 20. The following example of request parameters from CreateLaunchTemplate shows the UserData was supplied, instructing the instances to begin crypto mining.

{   
    "CreateLaunchTemplateRequest": {       
        "LaunchTemplateName": "T-us-east-1-a1b2",       
        "LaunchTemplateData": {           
            "UserData": "<sensitiveDataRemoved>",           
            "ImageId": "ami-1234567890abcdef0",           
            "InstanceType": "c6a.4xlarge"       
        },       
        "ClientToken": "a1b2c3d4-5678-90ab-cdef-EXAMPLE11111"   
    } 
}

The threat actor created auto scaling groups using both Spot and On-Demand Instances to make use of both Amazon EC2 service quotas and maximize resource consumption.

Spot Instance groups:

  • Targeted high performance GPU and machine learning (ML) instances (g4dn, g5, g5, p3, p4d, inf1)
  • Configured with 0% on-demand allocation and capacity-optimized strategy
  • Set to scale from 20 to 999 instances

On-Demand Instance groups:

  • Targeted compute, memory, and general-purpose instances (c5, c6i, r5, r5n, m5a, m5, m5n).
  • Configured with 100% on-demand allocation
  • Also set to scale from 20 to 999 instances

After exhausting auto scaling quotas, the actor directly launched additional EC2 instances using RunInstances to consume the remaining EC2 instance quota.

Persistence

An interesting technique observed in this campaign was the threat actor’s use of ModifyInstanceAttribute across all launched EC2 instances to disable API termination. Although instance termination protection prevents accidental termination of the instance, it adds an additional consideration for incident response capabilities and can disrupt automated remediation controls. The following example shows request parameters for the API ModifyInstanceAttribute.

{     
    "disableApiTermination": {         
        "value": true     
    },     
    "instanceId": "i-1234567890abcdef0" 
}

After all mining workloads were deployed, the actor created a Lambda function with a configuration that bypasses IAM authentication and creates a public Lambda endpoint. The threat actor then added a permission to the Lambda function that allows the principal to invoke the function. The following examples show CreateFunctionUrlConfig and AddPermission request parameters.

CreateFunctionUrlConfig:

{     
    "authType": "NONE",     
    "functionName": "generate-service-a1b2c3d4" 
}

AddPermission:

{     
    "functionName": "generate-service-a1b2c3d4",     
    "functionUrlAuthType": "NONE",    
    "principal": "*",     
    "statementId": "FunctionURLAllowPublicAccess",     
    "action": "lambda:InvokeFunctionUrl" 
}

The threat actor concluded the persistence stage by creating an IAM user user-x1x2x3x4 and attaching the IAM policy AmazonSESFullAccess (CreateUser, AttachUserPolicy). They also created an access key and login profile for that user (CreateAccessKey, CreateLoginProfile). Based on the SES role that was attached to the user, it appears the threat actor was attempting Amazon Simple Email Service (Amazon SES) phishing.

To prevent public Lambda URLs from being created, organizations can deploy service control policies (SCPs) that deny creation or updating of Lambda URLs with an AuthType of “NONE”.

{   
    "Version": "2012-10-17",   
    "Statement": [     
        {       
            "Effect": "Deny",       
            "Action": [         
                "lambda:CreateFunctionUrlConfig",         
                "lambda:UpdateFunctionUrlConfig"       
            ],       
            "Resource": "arn:aws:lambda:*:*:function/*",       
            "Condition": {         
                "StringEquals": {           
                    "lambda:FunctionUrlAuthType": "NONE"         
                }       
            }     
        }   
    ] 
}

Detection methods using GuardDuty

The multilayered detection approach of GuardDuty proved highly effective in identifying all stages of the attack chain using threat intelligence, anomaly detection, and the recently launched Extended Threat Detection capabilities for EC2 and ECS.

Next, we walk through the details of these features and how you can deploy them to detect attacks such as these. You can enable GuardDuty foundational protection plan to receive alerts on crypto mining campaigns like the one described in this post. To further enhance detection capabilities, we highly recommend enabling GuardDuty Runtime Monitoring, which will extend finding coverage to system-level events on Amazon EC2, Amazon ECS, and Amazon Elastic Kubernetes Service (Amazon EKS).

GuardDuty EC2 findings

Threat intelligence findings for Amazon EC2 are part of the GuardDuty foundational protection plan, which will alert you to suspicious network behaviors involving your instances. These behaviors can include brute force attempts, connections to malicious or crypto domains, and other suspicious behaviors. Using third-party threat intelligence and internal threat intelligence, including active threat defense and MadPot, GuardDuty provides detection over the indicators in this post through the following findings: CryptoCurrency:EC2/BitcoinTool.B and CryptoCurrency:EC2/BitcoinTool.B!DNS.

GuardDuty IAM findings

The IAMUser/AnomalousBehavior findings spanning multiple tactic categories (PrivilegeEscalation, Impact, Discovery) showcase the ML capability of GuardDuty to detect deviations from normal user behavior. In the incident described in this post, the compromised credentials were detected due to the threat actor using them from an anomalous network and location and calling APIs that were unusual for the accounts.

GuardDuty Runtime Monitoring

GuardDuty Runtime Monitoring is an important component for Extended Threat Detection attack sequence correlation. Runtime Monitoring provides host level signals, such as operating system visibility, and extends detection coverage by analyzing system-level logs indicating malicious process execution at the host and container level, including the execution of crypto mining programs on your workloads. The CryptoCurrency:Runtime/BitcoinTool.B!DNS and CryptoCurrency:Runtime/BitcoinTool.B findings detect network connections to crypto-related domains and IPs, while the Impact:Runtime/CryptoMinerExecuted finding detects when a process running is associated with a cryptocurrency mining activity.

GuardDuty Extended Threat Detection

Launched at re:Invent 2025, AttackSequence:EC2/CompromisedInstanceGroup finding represents one of the latest Extended Threat Detection capabilities in GuardDuty. This feature uses AI and ML algorithms to automatically correlate security signals across multiple data sources to detect sophisticated attack patterns of EC2 resource groups. Although AttackSequences for EC2 are included in the GuardDuty foundational protection plan, we strongly recommend enabling Runtime Monitoring. Runtime Monitoring provides key insights and signals from compute environments, enabling detection of suspicious host-level activities and improving correlation of attack sequences. For AttackSequence:ECS/CompromisedCluster attack sequences, Runtime Monitoring is required to correlate container-level activity.

Monitoring and remediation recommendations

To protect against similar crypto mining attacks, AWS customers should prioritize strong identity and access management controls. Implement temporary credentials instead of long-term access keys, enforce multi-factor authentication (MFA) for all users, and apply least privilege to IAM principals limiting access to only required permissions. You can use AWS CloudTrail to log events across AWS services and combine logs into a single account to make them available to your security teams to access and monitor. To learn more, refer to Receiving CloudTrail log files from multiple accounts in the CloudTrail documentation.

Confirm GuardDuty is enabled across all accounts and Regions with Runtime Monitoring enabled for comprehensive coverage. Integrate GuardDuty with AWS Security Hub and Amazon EventBridge or third-party tooling to enable automated response workflows and rapid remediation of high-severity findings. Implement container security controls, including image scanning policies and monitoring for unusual CPU allocation requests in ECS task definitions. Finally, establish specific incident response procedures for crypto mining attacks, including documented steps to handle instances with disabled API termination—a technique used by this attacker to complicate remediation efforts.

If you believe your AWS account has been impacted by a crypto mining campaign, refer to remediation steps in the GuardDuty documentation: Remediating potentially compromised AWS credentials, Remediating a potentially compromised EC2 instance, and Remediating a potentially compromised ECS cluster.

To stay up to date on the latest techniques, visit the Threat Technique Catalog for AWS.


If you have feedback about this post, submit comments in the Comments section below. If you have questions about this post, contact AWS Support.
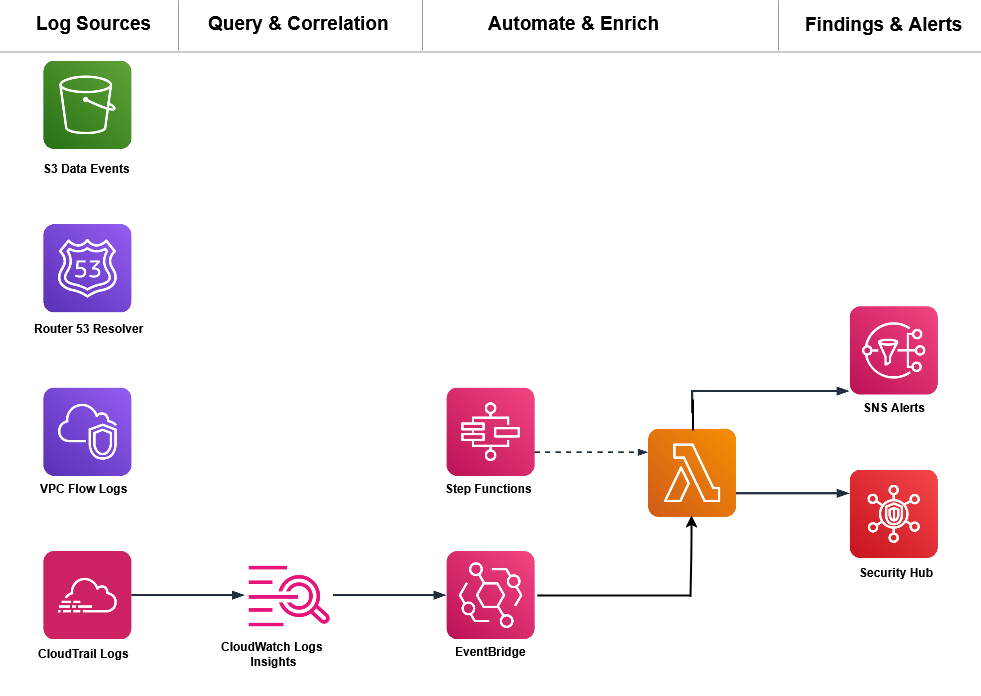
Kyle Koeller
Kyle Koeller

Kyle is a security engineer in the GuardDuty team with a focus on threat detection. He is passionate about cloud threat detection and offensive security, and he holds the following certifications: CompTIA Security+, PenTest+, CompTIA Network Vulnerability Assessment Professional, and SecurityX. When not working, Kyle enjoys spending his time in the gym and exploring New York City.

Practical steps to minimize key exposure using AWS Security Services

Post Syndicated from Jennifer Paz original https://aws.amazon.com/blogs/security/practical-steps-to-minimize-key-exposure-using-aws-security-services/

Exposed long-term credentials continue to be the top entry point used by threat actors in security incidents observed by the AWS Customer Incident Response Team (CIRT). The exposure and subsequent use of long-term credentials or access keys by threat actors poses security risks in cloud environments. Additionally, poor key rotation practices, sharing of access keys among multiple users, or failing to revoke unused credentials can leave systems exposed.

Using long-term credentials is strongly discouraged and presents an opportunity to migrate towards AWS Identity and Access Management (IAM) roles and federated access. While our recommended best practice is for customers to migrate away from long-term credentials, we recognize that this transition might not be immediately feasible for all organizations.

Building a comprehensive defense against unintended access to long-term credentials requires a strategic layered approach. This approach is intended to bridge the gap between ideal security practices and real-world operational constraints, providing actionable steps for teams managing legacy AWS workloads that require the use of long-term credentials.

In this post, you learn how to build your defense, starting with identifying existing risks and potential exposures through services such as Amazon CodeGuru Security and AWS IAM Access Analyzer, providing visibility into credential risks across the environment. This is then complemented by establishing strict boundaries through service control policies (SCPs) and data perimeters to control how and where credentials can be created and used. With these mechanisms in place, you can strengthen your position with network-level controls that help protect the infrastructure where access keys might be used, implementing services such as AWS WAF and Amazon Inspector to help protect against exploitation of vulnerabilities. Finally, you implement operational best practices such as automated secret rotation to maintain ongoing security hygiene and minimize the impact of potential compromise.

Detect current access keys and exposure

Audit current access keys

For comprehensive auditing, organizations should regularly generate credential reports to identify IAM user ownership of long-lived credentials and other relevant information such as the last time the key was rotated, last time it was used, last service used and last region used. These reports provide essential visibility into your credential landscape, enabling you to spot unused or potentially compromised credentials by focusing on access keys with stale activity, keys exceeding rotation policies, and unexpected usage patterns from unfamiliar regions.

Detect exposed access keys

A common source of credential compromise occurs through inadvertent commits to public repositories. When developers accidentally commit credentials to public repositories, these credentials can be harvested by automated scanning tools used by adversaries. Code scanning is a foundational step that helps catch these critical security issues early, before sensitive credentials can be accidentally committed to code repositories or deployed to production environments where they could be exploited.

You can use the secrets detection capability of CodeGuru Security to proactively identify exposed sensitive data in your codebase.

The tool integrates with AWS Secrets Manager, employing detection mechanisms to locate unencrypted secrets in your code, such as AWS secret access keys, embedded passwords, and database connection strings.

When CodeGuru Security discovers unprotected secrets during a scan, it creates a finding with recommended remediation to address the vulnerability.

AWS Trusted Advisor also contains an exposed access key check that checks popular code repositories for access keys that have been exposed to the public and for irregular Amazon Elastic Compute Cloud (Amazon EC2) usage that could be the result of a compromised access key.

Note that while these are valuable security tools, they cannot detect secrets or access keys stored in locations outside their scanning scope, such as local development machines or external systems. They should be used as part of a broader security strategy, not as the sole method for identifying and preventing credential exposure.

When addressing potentially compromised access keys, it is advised to immediately rotate the keys. See instructions on how to rotate access keys for IAM Users.

Detect unused access

Beyond identifying exposed credentials, detecting unused access keys helps minimize the attack surface. IAM Access Analyzer contains an unused access analyzer that looks for access permissions that are either overly generous or that have fallen into disuse, including unused IAM roles, access keys for IAM users, passwords for IAM users, and services and actions for active IAM roles and users. After reviewing the findings generated by an organization-wide or account-specific analyzer, you can remove or modify permissions that aren’t needed. By identifying and revoking unused credentials and access, you can limit the impact if credentials have been obtained by a threat actor.

By implementing these tools, you can gain insights into credential risks across your environment. The combined capabilities help surface embedded secrets, exposed access keys, and credentials requiring removal.

Preventive guardrails: Establish a data perimeter

Now that you’ve learned how to identify exposed or unused credentials, let’s explore how you can use SCPs and resource control policies (RCPs) to create a data perimeter and help make sure that only your trusted identities are accessing trusted resources from expected networks. Implementing preventive guardrails around your AWS environment is crucial for helping protect against unauthorized access and potential access key compromises. For more information on what a data perimeter is and how to establish one, see the Establishing a Data Perimeter on AWS blog post series.

The following SCP denies an IAM user’s credentials from being used outside of unexpected networks (corporate Classless Inter-Domain Routing (CIDR) or specific virtual private cloud (VPC)). This policy includes several actions in the NotAction element that would impact services access if not exempted. Examples of SCPs and RCPs can be found in the data-perimeter-policy-examples, which is the source of truth for newly revised policies. The following example has been updated to address the use case of user credentials being used outside of unexpected networks.

{
    "Version": "2012-10-17",
    "Statement": [
        {
            "Sid": "EnforceNetworkPerimeterOnIAMUsers",
            "Effect": "Deny",
            "NotAction": [
                "es:ES*",
                "dax:GetItem",
                "dax:BatchGetItem",
                "dax:Query",
                "dax:Scan",
                "dax:PutItem",
                "dax:UpdateItem",
                "dax:DeleteItem",
                "dax:BatchWriteItem",
                "dax:ConditionCheckItem",
                "neptune-db:*",
                "kafka-cluster:*",
                "elasticfilesystem:client*",
                "rds-db:connect"
            ],
            "Resource": "*",
            "Condition": {
                "BoolIfExists": {
                    "aws:ViaAWSService": "false"
                },
                "NotIpAddressIfExists": {
                    "aws:SourceIp": [
                        "<my-corporate-cidr>"
                    ]
                },
                "StringNotEqualsIfExists": {
                    "aws:SourceVpc": [
                        "<my-vpc>"
                    ]
                },
                "ArnLike": {
                    "aws:PrincipalArn": [
                        "arn:aws:iam::*:user/*"
                    ]
                }
            }
        }
    ]

By implementing this network perimeter, you can reduce the risk of credential compromise leading to unauthorized access and data exposure. Threat actors attempting to use stolen credentials from a coffee shop or home network will be blocked, helping to limit the impact of unintended access to credentials.

To further increase your defense in depth, you can use RCPs to help protect your data, such as by using them to control which identities can access your resources. For example, you might want to allow identities in your organization to access resources in your organization. You might also want to prevent identities external to your organization from accessing your resources. You can enforce this control using RCPs. You can use RCPs to restrict the maximum available access to your resources and include which principals, both inside and outside your organization, can access your resources. SCPs can only impact the effective permissions for principals within your AWS organization.

By implementing the following RCP, you can help make sure that if long-lived credentials are accidentally exposed, unauthorized users from outside your organization will be blocked from using them to access your critical data and resources. The policy will deny Amazon Simple Storage Service (Amazon S3) actions unless requested from your corporate CIDR range (NotIpAddressIfExists with aws:SourceIp), or from your VPC (StringNotEqualsIfExists with aws:SourceVpc). See the list of AWS services that support RCPs. Examples of SCPs and RCPs can be found in this GitHub repository, which is the source of truth for newly revised policies. The following example has been updated to address the use case discussed in this post.

{
  "Version": "2012-10-17",
  "Statement": [
    {
      "Sid": "EnforceNetworkPerimeter",
      "Effect": "Deny",
      "Principal": "*",
      "Action": [
		"s3:*",
		"sqs:*",
		"kms:*",
		"secretsmanager:*",
		"sts:AssumeRole",
		"sts:DecodeAuthorizationMessage",
		"sts:GetAccessKeyInfo",
		"sts:GetFederationToken",
		"sts:GetServiceBearerToken",
		"sts:GetSessionToken",
 		"sts:SetContext",
 		"aoss:*",
 		"ecr:*"
		],
      "Resource": "*",
      "Condition": {
        "NotIpAddressIfExists": {
          "aws:SourceIp": "<0.0.0.0/1>"
        },
        "StringNotEqualsIfExists": {
          "aws:SourceVpc": "<my-vpc>"
        },
        "BoolIfExists": {
          "aws:PrincipalIsAWSService": "false",
          "aws:ViaAWSService": "false"
        }
      }
	 }
    ]
  }

If you’re ready to begin migrating away from long-term credentials, using an SCP to deny access key creation and deny updates to existing keys helps enforce the use of more secure authentication methods like IAM roles and federated access. This policy denies principals from creating or updating an AWS access key.

{
    "Version": "2012-10-17",
    "Statement": [
        {
            "Effect": "Deny",
            "Action": [
                "iam:CreateAccessKey",
			 	"iam:UpdateAccessKey"
            ],
            "Resource": "*"
        }
    ]
}

In addition to establishing these data perimeter controls, let’s examine how network controls protect the runtime environments where access keys operate.

Network controls: Protecting the runtime environment for access keys

Beyond building a data perimeter and using SCPs and RCPs, protecting the compute and network infrastructure that uses these access keys is essential. The risk of credential exposure through compromised runtime environments makes infrastructure protection a critical component of access key security, because bad actors often target these environments to gain unauthorized access.

Security groups and network ACLs (NACLs)

Use network-level security protections that act as firewalls for varying levels, such as the instance level or the subnet level to help protect against unauthorized access.

  • Restricting critical ports, such as SSH (port 22) and RDP (port 3306), is essential because they’re prime targets for bad actors seeking unauthorized system access. Open administrative ports in your security groups can increase your attack surface and security risk. Using AWS Systems Manager Session Manager helps provide secure remote access without exposing inbound ports, alleviating the need for bastion hosts or SSH key management.
  • NACLs effectively block access at the subnet level by acting as stateless packet filters at subnet boundaries. Unlike security groups that protect individual instances, NACLs help secure entire subnets with explicit allow/deny rules for both inbound and outbound traffic. They create a critical perimeter defense layer that filters traffic before reaching your instances. When deployed as part of a defense-in-depth approach, NACLs provide subnet-level isolation between application tiers, block malicious traffic patterns at the network edge, and maintain protection even if other security layers are compromised, helping to facilitate comprehensive network security through multiple independent control points.
  • For enhanced network protection beyond NACLs, AWS Network Firewall enables enterprise-grade perimeter defense through comprehensive VPC protection. It combines intrusion prevention systems, domain filtering, deep packet inspection, and geographic IP controls, while automatically safeguarding your cloud environment against emerging threats using global threat intelligence gathered by Amazon. By using Network Firewall and AWS Transit Gateway integration, you can implement consistent security policies across your VPCs and Availability Zones with centralized management.
  • To automate and scale network security across your organization, AWS Firewall Manager provides centralized administration of both Network Firewall rules and security group policies. As your organization grows, Firewall Manager helps maintain security by automating the deployment of common security group policies, cleaning up unused groups, and remediating overly permissive rules across multiple accounts and organizational units.

Amazon Inspector

To help identify unintended network exposure at scale, consider using Amazon Inspector. Amazon Inspector continually scans AWS workloads for software vulnerabilities and unintended network exposure, helping you identify and remediate security vulnerabilities before they can be exploited.

Key capabilities include:

  • Package vulnerability: Package vulnerability findings identify software packages in your AWS environment that are exposed to Common Vulnerabilities and Exposures (CVEs). Bad actors can exploit these unpatched vulnerabilities to compromise the confidentiality, integrity, or availability of data, or to access other systems.
  • Code vulnerability: Code vulnerability findings identify lines in your AWS Lambda code that bad actors could exploit. Code vulnerabilities include injection flaws, data leaks, weak cryptography, or missing encryption in your code. It identifies policy violations and vulnerabilities based on internal detectors developed in collaboration with CodeGuru Security. For a list of possible detections, see the Amazon Q Detector Library.
  • Network reachability: Network reachability findings show whether your ports are reachable from the internet through an internet gateway (including instances behind Application Load Balancers or Classic Load Balancers), a VPC peering connection, or a VPN through a virtual gateway. These findings highlight network configurations that may be overly permissive, such as mismanaged security groups, NACLs or internet gateways, or that might allow for potentially malicious access. It can help identify open SSH ports on your instance security groups.

AWS WAF

Complementing your network security controls and vulnerability management, AWS WAF provides an additional layer of defense by filtering malicious web traffic that could lead to credential exposure.

AWS WAF offers several managed rule groups to protect against unauthorized access and common vulnerabilities:

  • AWS WAF Fraud Control account creation fraud prevention (ACFP) rule group: ACFP uses request tokens to gather information about the client browser and about the level of human interactivity in the creation of the account creation request. The rule group detects and manages bulk account creation attempts by aggregating requests by IP address and client session and aggregating by the provided account information such as the physical address and phone number. Additionally, the rule group detects and blocks the creation of new accounts using credentials that have been compromised, which helps protect the security posture of your application and of your new users.
  • AWS WAF Fraud Control account takeover prevention (ATP) rule group: To help prevent account takeovers that might lead to fraudulent activity, ATP gives you visibility and control over anomalous sign-in attempts and sign-in attempts that use stolen credentials. For Amazon CloudFront distributions, in addition to inspecting incoming sign-in requests, the ATP rule group inspects your application’s responses to sign-in attempts to track success and failure rates. ATP checks email and password combinations against its stolen credential database, which is updated regularly as new leaked credentials are found on the dark web.

Operational best practices

To complement these protective layers and maintain ongoing security posture, implement automated credential management through Secrets Manager to help facilitate proper rotation and lifecycle management of access keys throughout your environment. This automation reduces human error, helps facilitate timely credential updates and limits the exposure window if credentials are compromised.

It’s recommended to rotate keys at least every 90 days. Secrets Manager helps by automating the process of rotating secrets on a schedule, helping to make sure that credentials are regularly updated without manual intervention. It also centralizes the storage of secrets, reducing the likelihood of sharing access keys among multiple users. With Secrets Manager, you can configure automatic key rotation using a Lambda integration.

There is also an existing solution that can be deployed to implement automatic access key rotation at scale. This pattern helps you automatically rotate IAM access keys by using AWS CloudFormation templates, which are provided in the GitHub IAM key rotation repository.

If you’re unable to implement automatic rotation and need a quicker way to identify access keys that need to be rotated, AWS Trusted Advisor has a security check for IAM access key rotation that checks for active IAM access keys that haven’t been rotated in the last 90 days. You can use the security check to drill down on which access keys in your environment need to be rotated if you need to perform manual rotation.

Detect anomalous IAM activity

Finally, while proactive measures to secure your IAM infrastructure are crucial, it’s equally important to have robust detection and alerting mechanisms in place. No matter how diligent your efforts, there is still a possibility of unforeseen threats or unauthorized activities. That’s why a comprehensive defense-in-depth strategy should include the ability to quickly identify and respond to anomalous IAM-related events. Amazon GuardDuty combines machine learning and integrated threat intelligence to help protect AWS accounts, workloads, and data from threats.

GuardDuty Extended Threat Detection automatically correlates multiple events across different data sources to identify potential threats within AWS environments. When Extended Threat Detection detects suspicious sequences of activities, it generates comprehensive attack sequence findings. The system analyzes individual API activities as weak signals, which might not indicate risks independently, but when observed together in specific patterns can reveal potential security issues.

This capability is enabled by default when GuardDuty is activated in an AWS account, helping provide protection without additional configuration.

The specific attack sequence finding related to compromised credentials is AttackSequence:IAM/CompromisedCredentials which is marked as Critical severity. This finding informs you that GuardDuty detected a sequence of suspicious actions made by using AWS credentials that impacts one or more resources in your environment. Multiple suspicious and anomalous threat behaviors were observed by the same credentials, resulting in higher confidence that the credentials are being misused.

Conclusion

The security best practices outlined in this post provide a comprehensive, multi-layered approach to mitigate the risks associated with long-term credentials. By implementing proactive code scanning, automated key rotation, network-level controls, data perimeter restrictions, and threat detection, you can significantly reduce the attack surface and better protect your organization’s AWS resources until a full migration to temporary credentials is feasible.

While the recommendations provided in this post represent an ample set of controls to put organizations in a good security posture, there might be additional security measures that can be taken depending on the specific needs and risk profile of each environment. The key is to adopt a holistic, layered approach to credential management and protection. By doing so, you can bridge the gap until a complete transition to temporary credentials becomes possible.

Implementing these security measures can help reduce risks, but long-term credentials inherently carry security risks. Even with strict best practices and comprehensive security controls, the possibility of credential compromise cannot be removed completely. You should consider evaluating your organization’s security posture and prioritizing temporary credentials through IAM roles and federation whenever possible. If you have questions or need help, AWS is here to support you.

Jennifer Paz
Jennifer Paz

Jennifer is a Security Engineer with over a decade of experience, currently serving on the AWS Customer Incident Response Team (CIRT). Jennifer enjoys helping customers tackle security challenges and implementing complex solutions to help enhance their security posture. When not at work, Jennifer is an avid runner, pickleball enthusiast, traveler, and foodie, always on the hunt for new culinary adventures.
Samantha Tavares
Samantha Tavares

Samantha is an Incident Responder on the AWS Customer Incident Response Team. She’s passionate about helping customers protect their cloud environments. When she’s not diving into security challenges, she’s sweating at CrossFit, or planning her next travel adventure.

Accelerate investigations with AWS Security Incident Response AI-powered capabilities

Post Syndicated from Daniel Begimher original https://aws.amazon.com/blogs/security/accelerate-investigations-with-aws-security-incident-response-ai-powered-capabilities/

If you’ve ever spent hours manually digging through AWS CloudTrail logs, checking AWS Identity and Access Management (IAM) permissions, and piecing together the timeline of a security event, you understand the time investment required for incident investigation. Today, we’re excited to announce the addition of AI-powered investigation capabilities to AWS Security Incident Response that automate this evidence gathering and analysis work.

AWS Security Incident Response helps you prepare for, respond to, and recover from security events faster and more effectively. The service combines automated security finding monitoring and triage, containment, and now AI-powered investigation capabilities with 24/7 direct access to the AWS Customer Incident Response Team (CIRT).

While investigating a suspicious API call or unusual network activity, scoping and validation require querying multiple data sources, correlating timestamps, identifying related events, and building a complete picture of what happened. Security operations center (SOC) analysts devote a significant amount of time to each investigation, with roughly half of that effort spent manually gathering and piecing together evidence from various tools and complex logs. This manual effort can delay your analysis and response.

AWS is introducing an investigative agent to Security Incident Response, changing this paradigm and adding layers of efficiency. The investigative agent helps you reduce the time required to validate and respond to potential security events. When a case for a security concern is created, either by you or proactively by Security Incident Response, the investigative agent asks clarifying questions to make sure it understands the full context of the potential security event. It then automatically gathers evidence from CloudTrail events, IAM configurations, and Amazon Elastic Compute Cloud (Amazon EC2) instance details and even analyzes cost usage patterns. Within minutes, it correlates the evidence, identifies patterns, and presents you with a clear summary.

How it works in practice

Before diving into an example, let’s paint a clear picture of where the investigative agent lives, how it’s accessed, and its purpose and function. The investigative agent is built directly into Security Incident Response and is automatically available when you create a case. Its purpose is to act as your first responder—gathering evidence, correlating data across AWS services, and building a comprehensive timeline of events so you can quickly move from detection to recovery.

For example: you discover that AWS credentials for an IAM user in your account were exposed in a public GitHub repository. You need to understand what actions were taken with those credentials and properly scope the potential security event, including lateral movement and reconnaissance operations. You need to identify persistence mechanisms that might have been created and determine the appropriate containment steps. To get started, you create a case in the Security Incident Response console and describe the situation.

Here’s where the agent’s approach differs from traditional automation: it asks clarifying questions first. When were the credentials first exposed? What’s the IAM user name? Have you already rotated the credentials? Which AWS account is affected?

This interactive step gathers the appropriate details and metadata before it starts gathering evidence. Specifically, you’re not stuck with generic results—the investigation is tailored to your specific concern.

After the agent has what it needs, it investigates. It looks up CloudTrail events to see what API calls were made using the compromised credentials, pulls IAM user and role details to check what permissions were granted, identifies new IAM users or roles that were created, checks EC2 instance information if compute resources were launched, and analyzes cost and usage patterns for unusual resource consumption. Instead of you querying each AWS service, the agent orchestrates this automatically.

Within minutes, you get a summary, as shown in the following figure. The investigation summary includes a high-level summary and critical findings, which include the credential exposure pattern, observed activity and the timeframe, affected resources, and limiting factors.

This response was generated using AWS Generative AI capabilities. You are responsible for evaluating any recommendations in your specific context and implementing appropriate oversight and safeguards. Learn more about AWS Responsible AI requirements.

Note: The preceding example is representative output. Exact formatting will vary depending on findings.

The investigation summary includes various tabs for detailed information, such as technical findings with an events timeline, as shown in the following figure:

Figure 2 – Security event timeline

Figure 2 – Security event timeline

When seconds count, this transparency is paramount to a quick, high-fidelity, and accurate response—especially if you need to escalate to the AWS CIRT, a dedicated group of AWS security experts, or explain your findings to leadership, creating a single lens for stakeholders to view the incident.

When the investigation is complete, you have a high-resolution picture of what happened and can make informed decisions about containment, eradication, and recovery. For the preceding exposed credentials scenario, you might need to:

  • Delete the compromised access keys
  • Remove the newly created IAM role
  • Terminate the unauthorized EC2 instances
  • Review and revert associated IAM policy changes
  • Check for additional access keys created for other users.

When you engage with the CIRT, they can provide additional guidance on containment strategies based on the evidence the agent gathered.

What this means for your security operations

The leaked credentials scenario shows what the agent can do for a single incident. But the bigger impact is on how you operate day-to-day:

  • You spend less time on evidence collection. The investigative agent automates the most time-consuming part of investigations—gathering and correlating evidence from multiple sources. Instead of spending an hour on manual log analysis, you can spend most of that time on making containment decisions and preventing recurrence.
  • You can investigate in plain language. The investigative agent uses natural language processing (NLP), which you can use to describe what you’re investigating in plain language, such as unusual API calls from IP address X or data access from terminated employee’s credentials, and the agent translates that into the technical queries needed. You don’t need to be an expert in AWS log formats or know the exact syntax for querying CloudTrail.
  • You get a foundation for high-fidelity and accurate investigations. The investigative agent handles the initial investigation—gathering evidence, identifying patterns, and providing a comprehensive summary. If your case requires deeper analysis or you need guidance on complex scenarios, you can engage with the AWS CIRT, who can immediately build on the work the agent has already done, speeding up their response time. They see the same evidence and timeline, so they can focus on advanced threat analysis and containment strategies rather than starting from scratch.

Getting started

If you already have Security Incident Response enabled, the AI-powered investigation capabilities are available now—no additional configuration needed. Create your next security case and the agent will start working automatically.

If you’re new to Security Incident Response, here’s how to set it up:

  1. Enable Security Incident Response through your AWS Organizations management account. This takes a few minutes through the AWS Management Console and provides coverage across your accounts.
  2. Create a case. Describe what you’re investigating; you can do this through the Security Incident Response console or an API, or set up automatic case creation from Amazon GuardDuty or AWS Security Hub alerts.
  3. Review the analysis. The agent presents its findings through the Security Incident Response console, or you can access them through your existing ticketing systems such as Jira or ServiceNow.

The investigative agent uses the AWS Support service-linked role to gather information from your AWS resources. This role is automatically created when you set up your AWS account and provides the necessary access for Support tools to query CloudTrail events, IAM configurations, EC2 details, and cost data. Actions taken by the agent are logged in CloudTrail for full auditability.

The investigative agent is included at no additional cost with Security Incident Response, which now offers metered pricing with a free tier covering your first 10,000 findings ingested per month. Beyond that, findings are billed at rates that decrease with volume. With this consumption-based approach, you can scale your security incident response capabilities as your needs grow.

How it fits with existing tools

Security Incident Response cases can be created by customers or proactively by the service. The investigative agent is automatically triggered when a new case is created, and cases can be managed through the console, API, or Amazon EventBridge integrations.

You can use EventBridge to build automated workflows that route security events from GuardDuty, Security Hub, and Security Incident Response itself to create cases and initiate response plans, enabling end-to-end detection-to-investigation pipelines. Before the investigative agent begins its work, the service’s auto-triage system monitors and filters security findings from GuardDuty and third-party security tools through Security Hub. It uses customer-specific information, such as known IP addresses and IAM entities, to filter findings based on expected behavior, reducing alert volume while escalating alerts that require immediate attention. This means the investigative agent focuses on alerts that actually need investigation.

Conclusion

In this post, I showed you how the new investigative agent in AWS Security Incident Response automates evidence gathering and analysis, reducing the time required to investigate security events from hours to minutes. The agent asks clarifying questions to understand your specific concern, automatically queries multiple AWS data sources, correlates evidence, and presents you with a comprehensive timeline and summary while maintaining full transparency and auditability.

With the addition of the investigative agent, Security Incident Response customers now get the speed and efficiency of AI-powered automation, backed by the expertise and oversight of AWS security experts when needed.

The AI-powered investigation capabilities are available today in all commercial AWS Regions where Security Incident Response operates. To learn more about pricing and features, or to get started, visit the AWS Security Incident Response product page.

If you have feedback about this post, submit comments in the Comments section below.
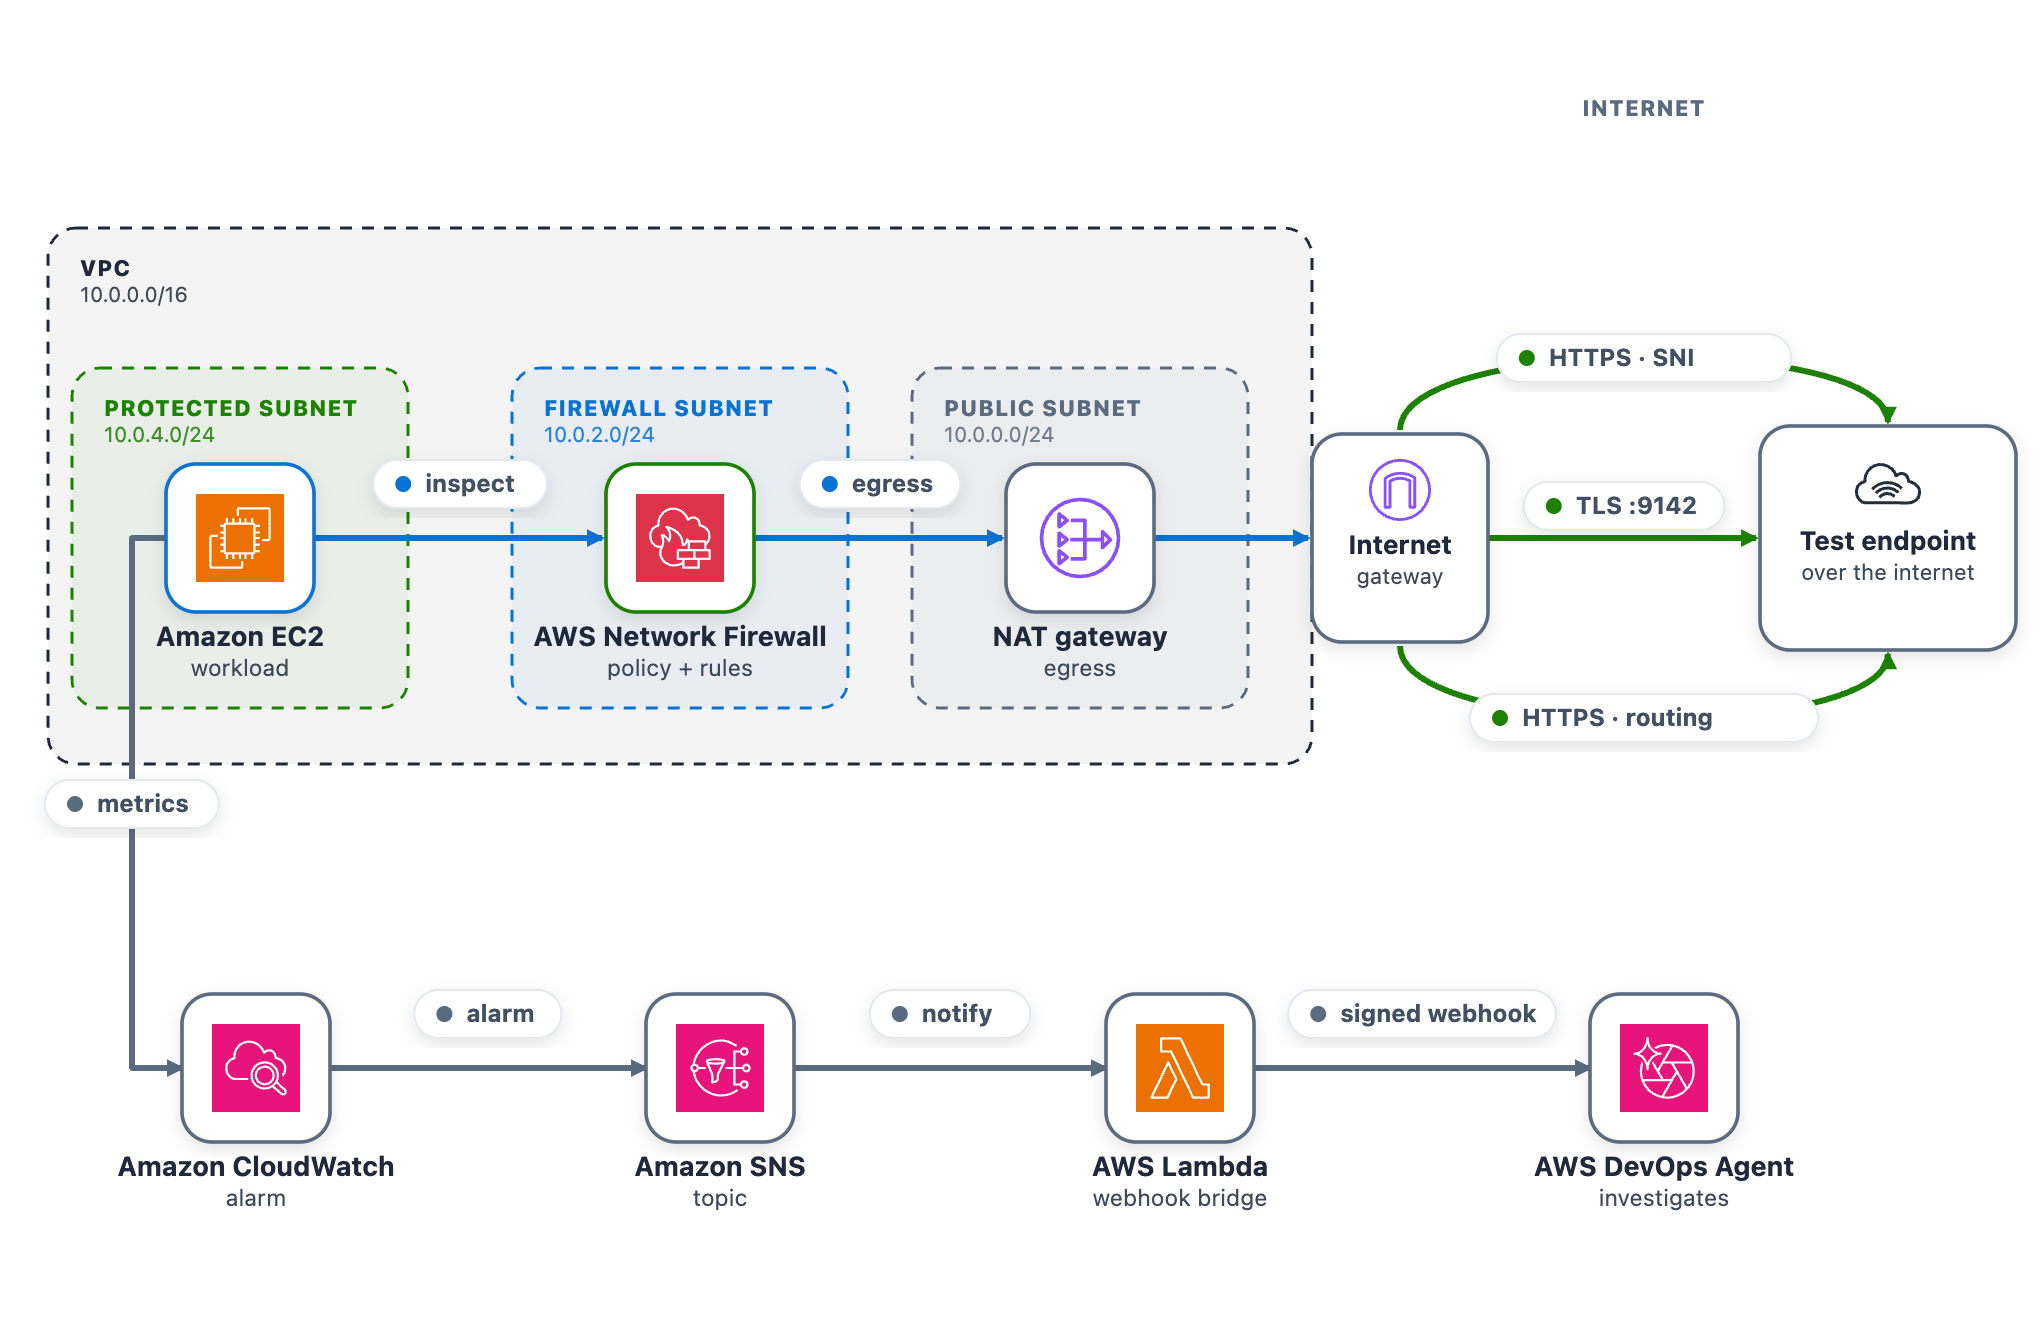
Daniel Begimher

Daniel Begimher

Daniel is a Senior Security Engineer in Global Services Security, specializing in cloud security, application security, and incident response. He co-leads the Application Security focus area within the AWS Security and Compliance Technical Field Community, holds all AWS certifications, and authored Automated Security Helper (ASH), an open source code scanning tool.

Introducing REACT: Why We Built an Elite Incident Response Team

Post Syndicated from Chris O’Rourke original https://blog.cloudflare.com/introducing-react-why-we-built-an-elite-incident-response-team/

Cloudforce One’s mission is to help defend the Internet. In Q2’25 alone, Cloudflare stopped an average of 190 billion cyber threats every single day. But real-world customer experiences showed us that stopping attacks at the edge isn’t always enough. We saw ransomware disrupt financial operations, data breaches cripple real estate firms, and misconfigurations cause major data losses.

In each case, the real damage occurred inside networks.

These internal breaches uncovered another problem: customers had to hand off incidents to separate internal teams for investigation and remediation. Those handoffs created delays and fractured the response. The result was a gap that attackers could exploit. Critical context collected at the edge didn’t reach the teams managing cleanup, and valuable time was lost. Closing this gap has become essential, and we recognized the need to take responsibility for providing customers with a more unified defense.

Today, Cloudforce One is launching a new suite of incident response and security services to help organizations prepare for and respond to breaches.

These services are delivered by Cloudforce One REACT (Respond, Evaluate, Assess, Consult Team), a group of seasoned responders and security veterans who investigate threats, hunt adversaries, and work closely with executive leadership to guide response and decision-making.

Customers already trust Cloudforce One to provide industry-leading threat intelligence, proactively identifying and neutralizing the most sophisticated threats. REACT extends that partnership, bringing our expertise directly to customer environments to stop threats wherever they occur. In this post, we’ll introduce REACT, explain how it works, detail the top threats our team has observed, and show you how to engage our experts directly for support.

Our goal is simple: to provide an end-to-end security partnership. We want to eliminate the painful gap between defense and recovery. Now, customers can get everything from proactive preparation to decisive incident response and full recovery—all from the partner you already trust to protect your infrastructure.

It’s time to move beyond fragmented responses and into one unified, powerful defense.

How REACT works

REACT services consist of two main components: Security advisory services to prepare for incidents and incident response for emergency situations.


A breakdown of the Cloudforce One incident readiness and response service offerings.

Advisory services are designed to assess and improve an organization’s security posture and readiness. These include proactive threat hunting, backed by Cloudflare’s real-time global threat intelligence, to find existing compromises, tabletop exercises to test response plans against simulated attacks, and both incident readiness and maturity assessments to identify and address systemic weaknesses.

The Incident Response component is initiated during an active security crisis. The team specializes in handling a range of complex threats, including APT and nation-state activity, ransomware, insider threats, and business email compromise. The response is also informed by Cloudflare’s threat intelligence and, as a network-native service, allows responders to deploy mitigation measures directly at the Cloudflare edge for faster containment.

For organizations requiring guaranteed availability, incident response retainers are offered. These retainers provide priority response, the development of tailored playbooks, and ongoing advisory support.

Cloudflare’s REACT services are vendor-agnostic in their scope. We are making REACT available to both existing Cloudflare customers and non-customers, regardless of their current technology stack, and regardless of whether their environment is on-premise, public cloud, or hybrid.

What makes Cloudflare’s approach different?

Our new service provides significant advantages over traditional incident response, where engagement and data sharing occur over separate, out-of-band channels. The integration of the service into the platform enables a more efficient and effective response to threats.

The core differentiators of this approach are:

  • Unmatched threat visibility. With roughly 20% of the web sitting behind Cloudflare’s network, Cloudforce One has unique visibility into emerging attacks as they unfold globally. This lets REACT accelerate their investigations and quickly correlate incident details with emerging attack vectors and known adversary tactics.

  • Network-native mitigation. The service is designed for network-native response. This allows the team, with customer authorization, to deploy mitigations directly at the Cloudflare edge, such as a WAF rule or Secure Web Gateway policy. This capability reduces the time between threat identification and containment. All response actions are tracked within the dashboard for full visibility.

  • Service delivery by proven experts. Cloudforce One is composed of seasoned threat researchers, consultants, and incident responders. The team has a documented history of managing complex security incidents, including nation-state activity and sophisticated financial fraud.

  • Vendor-agnostic scope. While managed through the Cloudflare dashboard, the scope of the response is vendor-agnostic. The team is equipped to conduct investigations and coordinate remediation across diverse customer environments, including on-premise, public cloud, and hybrid infrastructures.

Key Threats Seen During Engagements So Far

Analysis of security engagements by the REACT team over the last six months reveals three prevalent and high-impact trends. The data indicates that automated defenses, while critical, must be supplemented by specialized incident response capabilities to effectively counter these specific threats.

High-impact insider threats 

The REACT team has seen a significant number of incidents driven by insiders who use trusted access to bypass typical security controls. These threats are difficult to detect as they often combine technical actions with non-technical motivations. Recent scenarios observed are:

  • Disgruntled or current employees using their specialized, trusted access to execute targeted, destructive attacks.

  • Financially motivated insiders who are compensated by external actors to exfiltrate data or compromise internal systems.

  • State sponsored operatives gain trusted, privileged access via fraudulent remote work roles to exfiltrate data, conduct espionage, and steal funds for illicit regime financing.

Ransomware

The REACT team has observed that ransomware continues to be a primary driver of high-severity incidents, posing an existential threat to nearly every sector. Common themes observed include:

  • Disruption of core operations in the financial sector via hostage-taking of critical systems. 

  • Paralysis of business functions and compromise of client data in the real estate industry, leading to significant downtime and regulatory scrutiny.

  • Broad impact across all industry verticals. 

Stopping these attacks demands not only robust defenses but also a well-rehearsed recovery plan that cuts time-to-restoration to hours, not weeks.

Application security and supply chain breaches

The REACT team has also seen a significant increase in incidents originating at the application layer. These threats typically manifest in two primary areas: vulnerabilities within an organization’s own custom-developed  (‘vibe coded’) applications, and security failures originating from their third-party supply chain:

  • Vibe coding: The practice of providing natural language prompts to AI models to generate code can produce critical vulnerabilities which can be exploited by threat actors using techniques like remote code execution (RCE), memory corruption, and SQL injection.

  • SaaS supply chain risk: A compromise at a critical third-party vendor that exposes sensitive data, such as when attackers used a stolen Salesloft OAuth token to exfiltrate customer support cases from their clients’ Salesforce instances.

Integrated directly into your Cloudflare dashboard

Starting today, Cloudflare Enterprise customers will find a new “Incident Response Services” tab in the Threat intelligence navigation page in the Cloudflare dashboard. This dashboard integration ensures that critical security information and the ability to engage our incident response team are always at your fingertips, streamlining the process of getting expert help when it matters most.


Screenshot of the Cloudforce One Incident Response Services page in the Cloudflare dashboard

Retainer customers will benefit from a dedicated Under Attack page, which allows customers to contact Cloudforce One team during an active incident. In the event of an active incident, a simple “Request Help” button in our “Under Attack” page will immediately page our on-call incident responders to get you the help you need without delay.


Screenshot on the Under Attack button in the Cloudflare dashboard


Screenshot of the Emergency Incident Response page in the Cloudflare dashboard

For proactive needs, you can also easily submit requests for security advisory services through the Cloudflare dashboard: 


Confirmation of the successful service request submission

How to engage with Cloudforce One 

To learn more about REACT, existing Enterprise customers can explore the dedicated Incident Response section in the Cloudflare dashboard. For new inquiries regarding proactive partnerships and retainers, please contact Cloudflare sales.

If you are facing an active security crisis and need the REACT team on the ground, please contact us immediately.

Empowering Netflix Engineers with Incident Management

Post Syndicated from Netflix Technology Blog original https://netflixtechblog.com/empowering-netflix-engineers-with-incident-management-ebb967871de4

By: Molly Struve

Netflix’s mission to provide seamless entertainment to hundreds of millions of users globally demands exceptional reliability. At the heart of this reliability is how we handle incidents — those inevitable moments when something doesn’t go as expected.

Teams can respond quickly and more effectively when incidents are managed consistently across a company. A robust process for following up after incidents creates opportunities for learning and improving systems. This continuous improvement cycle is essential for maintaining the highly reliable systems on which our members depend.

Having a shared, consistent approach to incident management became critical as Netflix grew and expanded its business. This post delves into our journey to transform incident management from a centralized function into a widespread, accessible practice and the hard-won lessons we’ve learned along the way.

The Past: Countless Missed Opportunities

For most of Netflix’s past, incident management was the domain of our central Site Reliability Engineering team, called CORE (Critical Operations and Reliability Engineering). CORE was focused on streaming and was the sole initiator of incidents. They used Jira and a single Slack channel for incident response. This approach worked in the early days, but we knew it wouldn’t scale as Netflix grew and diversified.

With thousands of microservices supporting critical functions beyond streaming, we knew plenty of things were breaking that we were not capturing. We had an internal post-incident write-up template called “OOPS,” which teams could use to write about operational surprises. The template saw limited adoption as many engineers didn’t know about it or understand its purpose or value. With countless smaller, everyday incidents going unnoticed, we were missing key opportunities to learn and improve.

The Aspiration: A Paved Road to Incident Management

Recognizing these limits, we embarked on a journey to democratize incident management. Our goal: open more incidents and engage more teams in the process. We envisioned a “paved road” for incident management — a process so intuitive and streamlined that anyone could easily declare and manage an incident, even at 3 AM. Creating a paved road required a shift: our central SRE team would no longer be the only ones declaring incidents. Instead, we’d empower teams across engineering to own their own incidents. Making this significant shift required both technological and cultural changes.

Finding the Right Tool

Scaling technical processes within an organization as diverse and intricate as Netflix is challenging. To enable every engineering team to manage incidents effectively, we needed a comprehensive incident management tool that was far more sophisticated than Jira and a single Slack channel. We knew any solution, whether built or bought, would need to meet four key requirements:

  • Intuitive user experience — Our number one priority was making sure the tool was so intuitive that anyone could use it with little to no training.
  • Internal data integration capabilities — We needed the ability to hook in Netflix-specific data.
  • Balanced customization with consistency — We wanted teams to have flexibility while maintaining shared standards.
  • Approachable — A friendly and appealing tool that could help drive a cultural shift around incidents.

The “build vs. buy” question was a significant consideration. While Netflix boasts a world-class engineering team, building an in-house solution meeting these requirements was impractical due to our ambitious timeline, the substantial investment needed, and ongoing ownership costs. Following Netflix’s engineering principle of “build only when necessary,” we evaluated external solutions against these criteria.

This evaluation process led us to adopt Incident.io. While the platform checked all our boxes during selection, the four above requirements proved even more impactful than anticipated during Netflix’s incident management transformation.

Tackling the Transformation

Selecting the right tool was just the beginning. The real challenge was rolling it out across Netflix’s diverse engineering organization and achieving the cultural shift we envisioned. Here are four elements that helped make our goal a reality.

Intuitive Design Drove Adoption and Cultural Transformation

Tool usability was crucial to encourage teams to open incidents. It had to be easily understandable, even for engineers who aren’t incident management experts and only use it a few times a year. When introducing Incident.io, we saw rapid organic adoption because the tool was easy to pick up without much guidance. Its intuitive design allowed users to discover features as they used it. Thanks to prioritizing usability, within four months, 20% of engineering teams were using the tooling, and six months later, we had over 50% adoption.

Beyond rapid adoption, the tool helped shift how Netflix engineers think about incidents. Incidents went from “big scary outages” to simply “any blip or issue that degrades or disrupts a service that deserves attention and learning.” The tool’s friendly, welcoming interface made incident management less intimidating and more accessible. Some engineers described the platform as “jolly” and mentioned that it actually made them want to open incidents. The approachable design lowered psychological barriers for engineers to declare incidents and made it feel like a natural, even positive, part of their workflow.

Organizational Investment Supported Scalable Growth

While having an intuitive tool was important, successfully empowering engineers to open incidents required deliberate organizational investment. We invested heavily in standardization, developing an incident management process lightweight enough to avoid overwhelming users yet structured enough to support complex incidents. Finding the right balance took time and active engagement with users to understand what was working and what wasn’t. To this day, we still make adjustments to refine and improve the process.

On the education front, we created lightweight docs, quick-reference cheatsheets, and short demo videos to accelerate adoption across Netflix’s diverse engineering organization. We took these resources on roadshows across engineering teams and proved that the barrier to entry for managing incidents was practically nonexistent. While most engineers bought in easily, we had our skeptics. Over time, we worked with these folks to understand their needs better and help them fit incident management into their daily routines and processes.

Internal Integrations Reduce Cognitive Load

Integrating our unique organizational context — like teams, software services, business domains, and even hardware devices — directly into the incident management platform was critical. Netflix-specific contextualization enables powerful automations, such as automatically looping in the right teams or pre-filling incident fields from alerts. These integrations significantly reduce cognitive load during an incident and empower engineers to focus on quick mitigation. Beyond individual incidents, integrations with internal data across multiple incidents enable us to identify and address systemic issues.

Balanced Customization with Consistency Improved Response

A flexible platform allowed us to create a tailored incident response experience while enforcing a shared language and standard metadata across all engineering teams. This balance proved crucial for response effectiveness: different teams can adapt workflows to their specific needs, but core elements like “impacted areas and domains” stay consistent. Incident responders can quickly understand any incident organization-wide because the structure and language remain familiar, enabling faster, more effective incident response.

The Result: A New Era of Incident Management

Our journey to democratize incident management has yielded massive wins across Netflix Engineering. We successfully transitioned from a centralized incident response model to empowering engineers to declare and manage incidents. The transformation has fostered a culture of renewed ownership and learning across engineering teams.

We’ve established new practices and are growing an incident management culture we’re genuinely proud of, but we’re not done yet. Our incident management processes continue to evolve and adapt to fit Netflix’s growing needs. Every day, we work to educate engineers and leaders on the tremendous value incidents provide. We’re excited to continue harnessing these incredible learning opportunities to improve our platform for our hundreds of millions of members.


Empowering Netflix Engineers with Incident Management was originally published in Netflix TechBlog on Medium, where people are continuing the conversation by highlighting and responding to this story.

AWS CIRT announces the launch of the Threat Technique Catalog for AWS

Post Syndicated from Steve de Vera original https://aws.amazon.com/blogs/security/aws-cirt-announces-the-launch-of-the-threat-technique-catalog-for-aws/

Greetings from the AWS Customer Incident Response Team (AWS CIRT). AWS CIRT is a 24/7, specialized global Amazon Web Services (AWS) team that provides support to customers during active security events on the customer side of the AWS Shared Responsibility Model. We’re excited to announce the launch of the Threat Technique Catalog for AWS.

When the AWS CIRT assists customers with incident response during security investigations, we gather AWS service metadata on the types of tactics and techniques that threat actors have used against AWS customers. We use this information to build an internal dataset of indicators of compromise (IOCs) and threat patterns that provides insight into how threat actors are taking advantage of misconfigured AWS resources, overly permissive access, or the methods they use in attempting to achieve their objectives.

We capture this metadata and use it internally to continually improve AWS services to help make them more secure for our customers by making it more difficult for threat actors to perform unauthorized actions. For example, some of the metadata that the AWS CIRT has captured as a result of investigating security events where a threat actor has used the Amazon Bedrock service to consume tokens by invoking large language models (LLMs) has been used to supplement the Amazon GuardDuty IAM Anomalous Behavior finding. Earlier this year, the AWS CIRT identified an increase in data encryption events in Amazon S3 that used an encryption method known as server-side encryption using client-provided keys (SSE-C). AWS CIRT used the Threat Technique Catalog for AWS to classify the new techniques identified in these security events to communicate internally and with other Amazon security teams.

We’ve received feedback from AWS customers that information about the adversarial tactics, techniques, and procedures (TTPs) observed by the AWS CIRT would be valuable and helpful if made available to them, so they could use the information to configure their AWS resources more securely. Over the previous year, we’ve been working with MITRE to make these techniques and sub-techniques available to the global security community. As a result of this collaboration, MITRE has updated and added some of these techniques to MITRE ATT&CK® as part of their October 2024 update cycle (for example, Data Destruction: Lifecycle-Triggered Deletion).

“We greatly appreciated the insight AWS shared with us, and it inspired improvements to a number of techniques in the October release of MITRE ATT&CK. For ATT&CK to keep up with the latest threats, community contributions that benefit the ecosystem are needed, and we value AWS being a part of the ATT&CK community.”
Adam Pennington, project lead, MITRE ATT&CK, MITRE

Companies, entities, and organizations use ATT&CK to help them understand, prioritize and protect against the threats to their on-premises environments, and we believe that taking advantage of an already existing framework to present these adversarial techniques will provide AWS customers and the global security community with the ability to identify and categorize threats on their AWS infrastructure the same way that the AWS CIRT does.

The Threat Technique Catalog for AWS—based on MITRE ATT&CK Cloud—extends these contributions and includes categories of adversarial techniques that are specific to AWS and have been observed by the AWS CIRT; in addition to information on ways to mitigate those techniques and how to detect them. For example, you can go to the Threat Technique Catalog for AWS, filter by the AWS services in your account, and review the content that will help make your environment more secure. The Getting Started section includes additional ways that you can use the Threat Technique Catalog for AWS. We will continue to update and provide additional changes to the Threat Technique Catalog for AWS to help guide you into making your AWS environment more secure and will continue collaborating with MITRE to advise them of new and trending threat actor techniques.

To get started, visit the Threat Technique Catalog for AWS.

© 2025 The MITRE Corporation. This work is reproduced and distributed with the permission of The MITRE Corporation.

If you have feedback about this post, submit comments in the Comments section below.
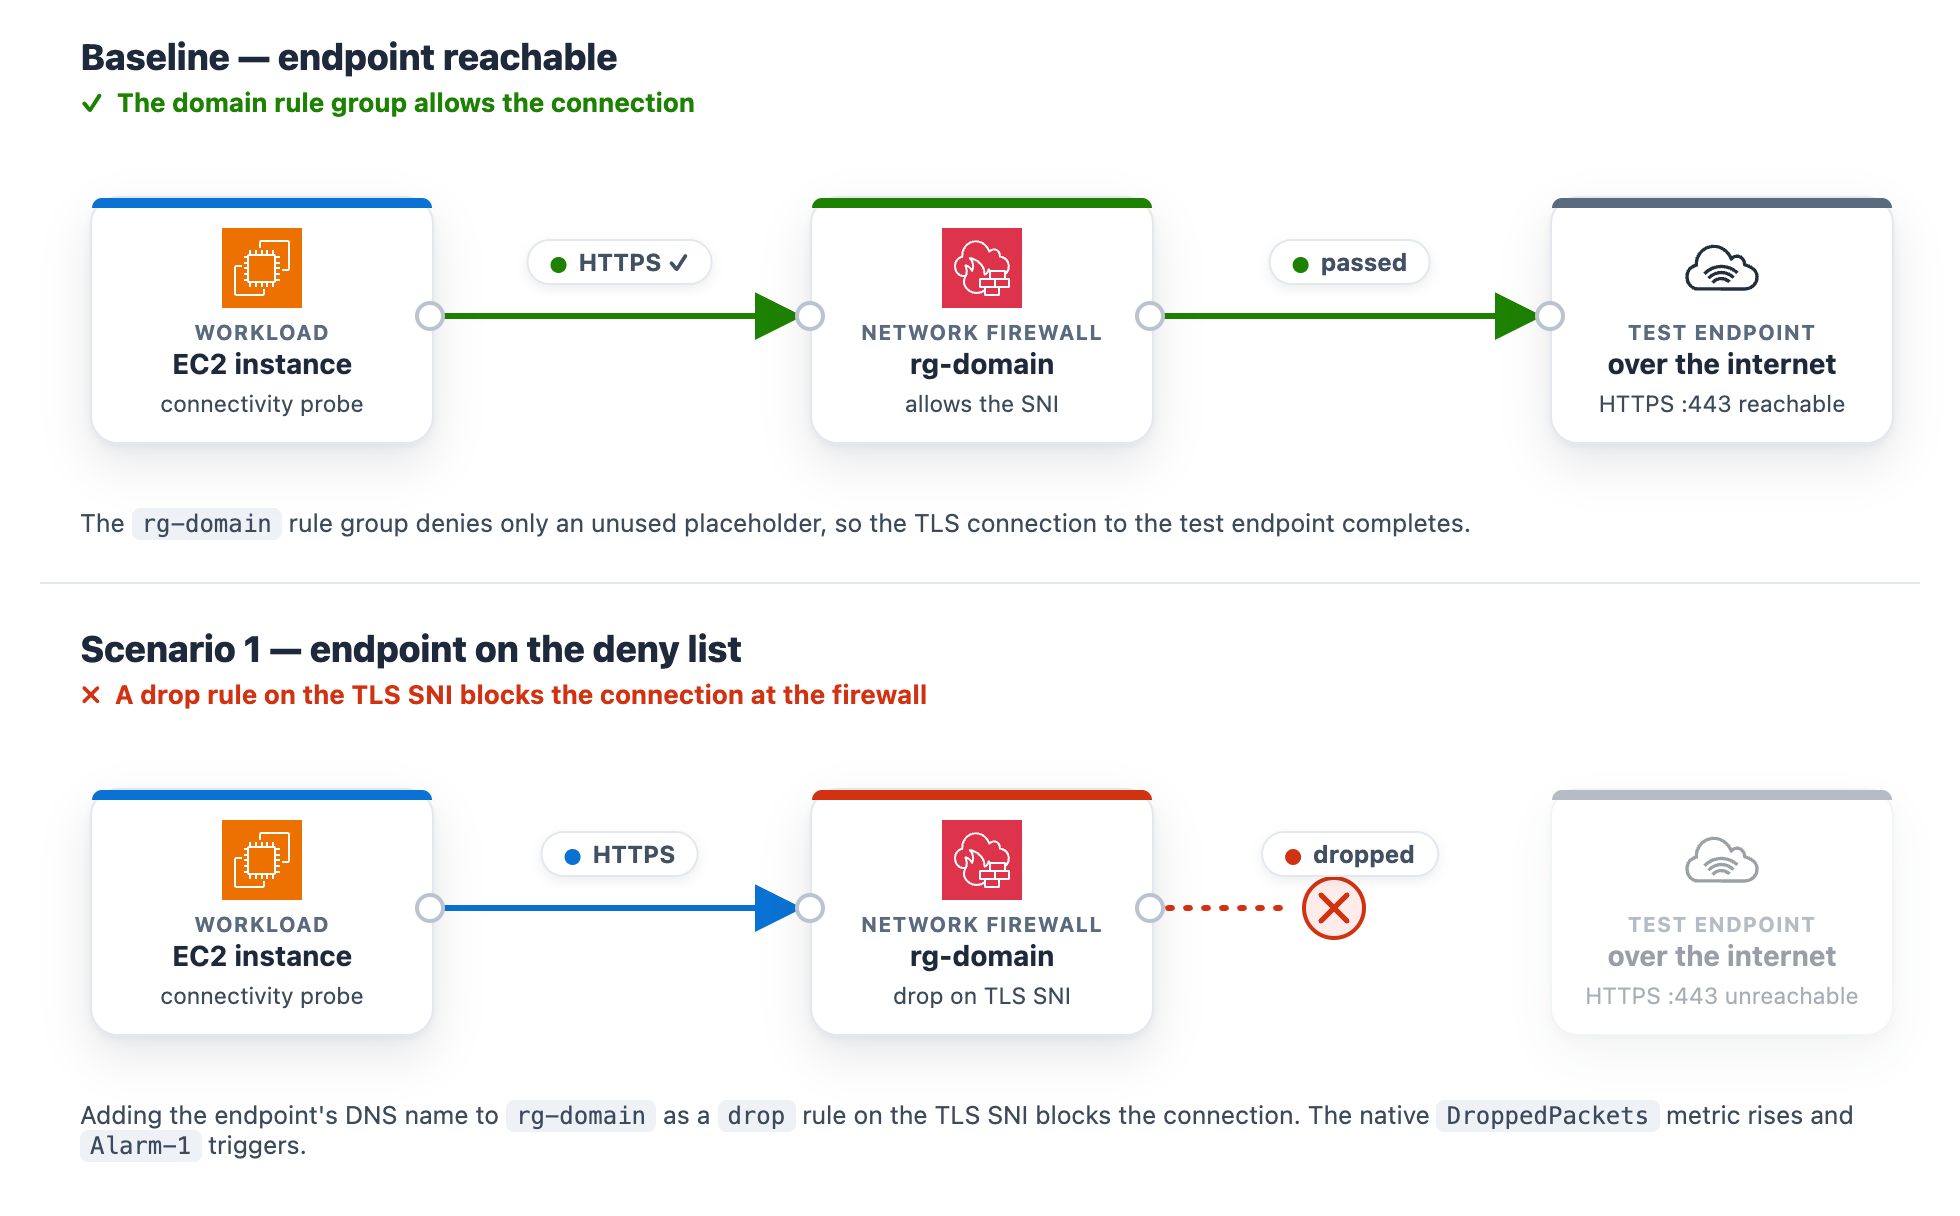
Steve de Vera

Steve de Vera

Steve is a manager in the AWS Customer Incident Response Team (CIRT) with a focus on threat research and threat intelligence. He is passionate about American-style BBQ and is a certified competition BBQ judge. He has a dog named Brisket.
Cydney Stude

Cydney Stude

Cydney is a Security Engineer with the AWS Customer Incident Response Team (CIRT), specializing in incident response and cloud security. Cydney focuses on technical depth and real-world experience handling complex cloud challenges. Outside of work, Cydney enjoys salsa dancing and adventuring with her german shepherd.

Nathan Bates

Nathan Bates

Nathan is a Sr. Security Engineer within Global Services Security. He specializes in data, analytics, and reporting services for vulnerability management, policy compliance, asset assurance, incident response, and threat intelligence. Nathan is passionate about high performance driving, racing cars, playing guitar, and making music.