Post Syndicated from Vittorio Cioe original https://blog.zabbix.com/mysql-performance-tuning-101-for-zabbix/13899/
In this post and the video, you will learn about a proper approach to getting the most out of Zabbix and optimizing the underlying MySQL Database configuration to improve performance while working with a database-intensive application such as Zabbix.
Contents
I. Zabbix and MySQL (1:12)
II. Optimizing MySQL for Zabbix (2:09)
III. Conclusion (15:43)
Zabbix and MySQL
Zabbix and MySQL love each other. Half of the Zabbix installations are running on MySQL. However, Zabbix is quite a write-intensive application, so we need to optimize the database configuration and usage to work smoothly with Zabbix that reads the database and writes to the database a lot.
Optimizing MySQL for Zabbix
Balancing the load on several disks
So, how can we optimize MySQL configuration to work with Zabbix? First of all, it is very important to balance the load on several hard drives by using:
-
- datadir to specify the default location, that is to dedicate the hard drives to the data directory;
- datadir innodb_data_file_path to define size, and attributes of InnoDB system tablespace data files;
- innodb_undo_directory to specify the path to the InnoDB undo tablespaces;
- innodb_log_group_home_dir to specify the path to the InnoDB redo log files;
- log-bin to enable binary logging and set path/file name prefix (dual functionality); and
- tmpdir (Random, SSD, tmpfs).
The key here is to split the load as much as possible across different hard drives in order to avoid different operations fighting for resources.
Viewing your MySQL configuration
Now, we can jump straight to MySQL configuration. It is important to start from your current configuration and check who and when has changed this configuration.
SELECT t1.*, VARIABLE_VALUE FROM performance_schema.variables_info t1 JOIN
performance_schema.global_variables t2 ON t2.VARIABLE_NAME=t1.VARIABLE_NAME WHERE
t1.VARIABLE_SOURCE not like "COMPILED"
This query can help you to understand who has changed the configuration. However, when the configuration is changing is also important to keep track of these changes.
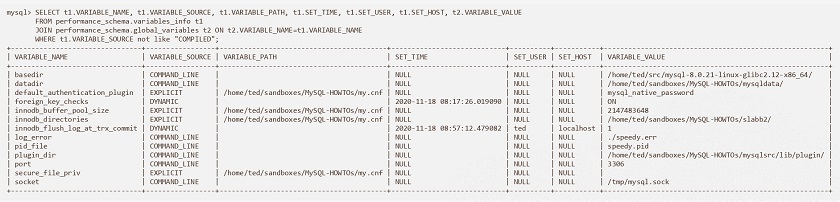
Viewing MySQL configuration
MySQL key variables to optimize in your configuration
InnoDB buffer pool
The king of all of the variables to be optimized is InnoDB buffer pool, which is the main parameter determining the memory for storing the DB pages — MySQL buffer pool — an area in main memory MySQL where InnoDB caches table and index data as it is accessed.
- InnoDB default value is to log, for production 50-75% of available memory on the dedicated database server.
- Since MySQL 5.7, innodb_buffer_pool_size can be changed dynamically.
Judging from experience, 50 percent of available memory will be enough for the majority of databases with a lot of connections or activities, as many other indicators are used, which occupy memory. So, 50 percent is a good though conservative parameter.
To check InnoDB Buffer Pool usage (in %) and if you need to allocate more memory for the InnoDB Buffer Pool, you can use the query, which allows you to see the current usage as a percentage (though there are many queries to monitor the InnoDB Buffer Pool).
SELECT CONCAT(FORMAT(DataPages*100.0/TotalPages,2),
' %') BufferPoolDataPercentage
FROM (SELECT variable_value DataPages FROM information_schema.global_status
WHERE variable_name = 'Innodb_buffer_pool_pages_data') A,
(SELECT variable_value TotalPages FROM information_schema.global_status
WHERE variable_name = 'Innodb_buffer_pool_pages_total') B;
Binary logs
Binary logs contain events that describe changes, provide data changes sent to replicas, and are used for data recovery operations.
If you work with replication, you might know that binary logs require special attention apart from having them on a separate disk. You should size the binary logs properly, set the proper expiration time (1 month by default), and the maximum size, for instance, of 1 GB so that you will be able to write 1 GB of data per day.
We can have about 30 log files in the binary logs. However, you should check the activities of your system to consider increasing this number, as well as the expiration of the binary logs, if you need to keep more data for operations, such as finding time recovery, for instance.
How to control binary logs:
-
- log_bin, max_binlog_size, binlog_expire_logs_seconds, etc.
- PURGE BINARY LOGS TO|BEFORE to delete all the binary log files listed in the log index file prior to the specified log file name or date.
- In addition, consider using GTID for replication to keep track of transactions.
InnoDB redo logs
This is yet another beast, which we want to keep control of — the redo and undo logs, which get written prior to flushing the data to the disk.
-
- innodb_log_file_size
– The size of redo logs will impact the writing speed over the time to recover.
– The default value is too low, so consider using at least 512 MB for production.
– Total redo log capacity is determined by innodb_log_files_in_group (default value 2). For write-intensive systems, consider increasing innodb_log_files_in_group and keeping them on in a separate disk.
NOTE. Here, the related parameters are innodb_log_file_size and innodb_log_files_in_group.
Trading performance over consistency (ACID)
Associated with the redo and undo log discussion is the trading performance over consistency discussion about when InnoDB should flush/sync committed truncations.
innodb_flush_log_at_trx_commit defines how ofter InnoDB flushes the logs to the disk. This variable can have different values:
-
- 0 — transactions are written to redo logs once per second;
- 1 — (default value) fully ACID-compliant with redo logs written and flushed to disk at transaction commit;
- 2 — transactions are written to redo logs at commit, and redo logs are flushed once per second.
If the system is write-intensive, you might consider setting this value to 2 to keep redo logs at every commit with the data written to disk once per second. This is a very good compromise between data integrity and performance successfully used in a number of write-intensive setups. This is a relief for the disk subsystem allowing you to gain that extra performance.
NOTE. I recommend using default (1) settings unless you are bulk-loading data, set session variable to 2 during load, experiencing an unforeseen peak in workload (hitting your disk system) and need to survive until you can
solve the problem, or you use the latest MySQL 8.0. You can also disable redo-logging completely.
table_open_cache and max_connections
Opening the cache discussions, we will start from the max_connections parameter, which sets the maximum number of connections that we want to accept on the MySQL server, and the table_open_cache parameter, which sets the value of the cache of open tables we want to keep. Both parameters affect the maximum number of files the server keeps open:
-
- table_open_cache value — 2,000 (default), which means that by default you can keep 2,000 tables open per connection.
- max_connections value — 151 (default).
If you increase both values too much, you may easily run out of memory. So, the total number of open tables in MySQL is:
N of opened tables = N of connections x N (max number of tables per join)
NOTE. This number is related to the joins operated by your database per connection.
So, having an insight into what Zabbix does and which queries it executes can help you fine-tune this parameter. In addition, you can go by the rule of thumb checking if the table_open_cache sheets are full. To do that, you can check the global status like ‘opened_tables‘ to understand what is going on.
In addition, if you are going to increase the table up and cache on the maximum number of connections, you can check open_files_limit in MySQL and ulimit — the maximum number of open files in the operating system, as new connections are kept as open files in Linux. So, this is a parameter to fine-tune as well.
Open buffers per client connection
There are other buffers that depend on the number of connections (max_connections), such as:
-
- read_buffer_size,
- read_rnd_buffer_size,
- join_buffer_size,
- sort_buffer_size,
- binlog_cache_size (if binary logging is enabled),
- net_buffer_length.
Depending on how often you get connections to the Zabbix database, you might want to increase these parameters. It is recommended to monitor your database to see how these buffers are being filled up.
You also need to reserve some extra memory for these buffers if you have many connections. That is why it is recommended to reserve 50 percent of available memory for InnoDB buffer pool, so that you can use these spare 25 percent for extra buffers.
However, there might be another solution.
Enabling Automatic Configuration for a Dedicated MySQL Server
In MySQL 8.0, innodb_dedicated_server automatically configures the following variables:
-
- innodb_buffer_pool_size,
- innodb_log_file_size,
- innodb_log_files_in_group, and
- innodb_flush_method.
I would enable this variable as it configures the innodb_flush_ method which has a dependency with the file system.
NOTE. Enabling innodb_dedicated_server is not recommended if the MySQL instance shares system resources with other applications, as this variable enabled implicitly means that we are running only MySQL on the machine.
Conclusion
Now, you are ready to fine-tune your configuration step by step, starting from innodb_buffer_pool, max_connections, and table_open_cache, and see if your performance improves. Eventually, you can do further analysis and go further to really fine-tune your system up to your needs.
In general, 3-5 core parameters would be enough for operating with Zabbix in the vast majority of cases. If you tune those parameters keeping in mind dealing with a write-intensive application, you can achieve good results, especially if you separate the resources at a hardware level or at a VM level.
Performance tuning dos and don’ts
- For a high-level performance tuning 101, think carefully and consider the whole stack together with the application.
- In addition, think methodically:
-
- define what you are trying to solve, starting from the core of variables, which you want to fine-tune;
- argue why the proposed change will work;
- create an action plan; and
- verify the change worked.
- To make things work:
— don’t micromanage;
— do not optimize too much;
— do not optimize everything; and, most importantly,
— do not take best practices as gospel truth, but try to adjust any practices to your particular environment.