Recently we announced the availability of Amazon Elastic Compute Cloud (Amazon EC2) R8a instances, the latest addition to the AMD memory-optimized instance family. These instances are powered by the 5th Generation AMD EPYC (codename Turin) processors with a maximum frequency of 4.5 GHz. In this post I take these instances for a spin and benchmark MySQL later on, but first I discuss the top things you should know about these instances.
Notable characteristics of R8a instances
Each vCPU on an R8a instance corresponds to a physical CPU core (something we started on 7th generation AMD instances). This means that there is no simultaneous multi-threading (SMT). Each vCPU mapped to a dedicated physical core, which means that you get more predictable and consistent performance because there’s no resource sharing or potential interference between threads, which is particularly crucial for performance-sensitive workloads where consistent latency is essential. When evaluating and adopting R8a instances, make sure that you’re re-evaluating your thresholds for CPU usage. You can likely squeeze more out of each instance’s CPU without impacting any of your workload’s SLA metrics.
R8a instances feature sizes of up to 192 vCPU with 1,536 GiB RAM. The following table shows the detailed specs:
Instance size
vCPU
Memory (GiB)
Instance storage
Network bandwidth (Gbps)
EBS bandwidth (Gbps)
r8a.medium
1
8
EBS Only
Up to 12.5
Up to 10
r8a.large
2
16
EBS Only
Up to 12.5
Up to 10
r8a.xlarge
4
32
EBS Only
Up to 12.5
Up to 10
r8a.2xlarge
8
64
EBS Only
Up to 15
Up to 10
r8a.4xlarge
16
128
EBS Only
Up to 15
Up to 10
r8a.8xlarge
32
256
EBS Only
15
10
r8a.12xlarge
48
384
EBS Only
22.5
15
r8a.16xlarge
64
512
EBS Only
30
20
r8a.24xlarge
96
768
EBS Only
40
30
r8a.48xlarge
192
1536
EBS Only
75
60
r8a.metal-24xl
96
768
EBS Only
40
30
r8a.metal-48xl
192
1536
EBS Only
75
60
Testing MySQL performance using HammerDB
R8a instances are a great choice for MySQL databases, so I thought that would be a great place to showcase some of these instances capabilities. To test MySQL, I used a series of scripts written by my colleagues to track MySQL performance across software versions and different EC2 instances. These scripts are stored in the repro-collection repository, which is an open source, extensible framework for performance testing that addresses real-world workloads rather than micro-benchmarks. It is built to provide a performance measurement reference usable across multiple organizations, and it’s currently centered on MySQL and actively used in discussions with Linux Kernel developers and maintainers. Furthermore, it helps track any performance impacts created by code changes to MySQL. The scripts contained in this repository set up a MySQL database to be tested, and a load generator running the HammerDB benchmark.
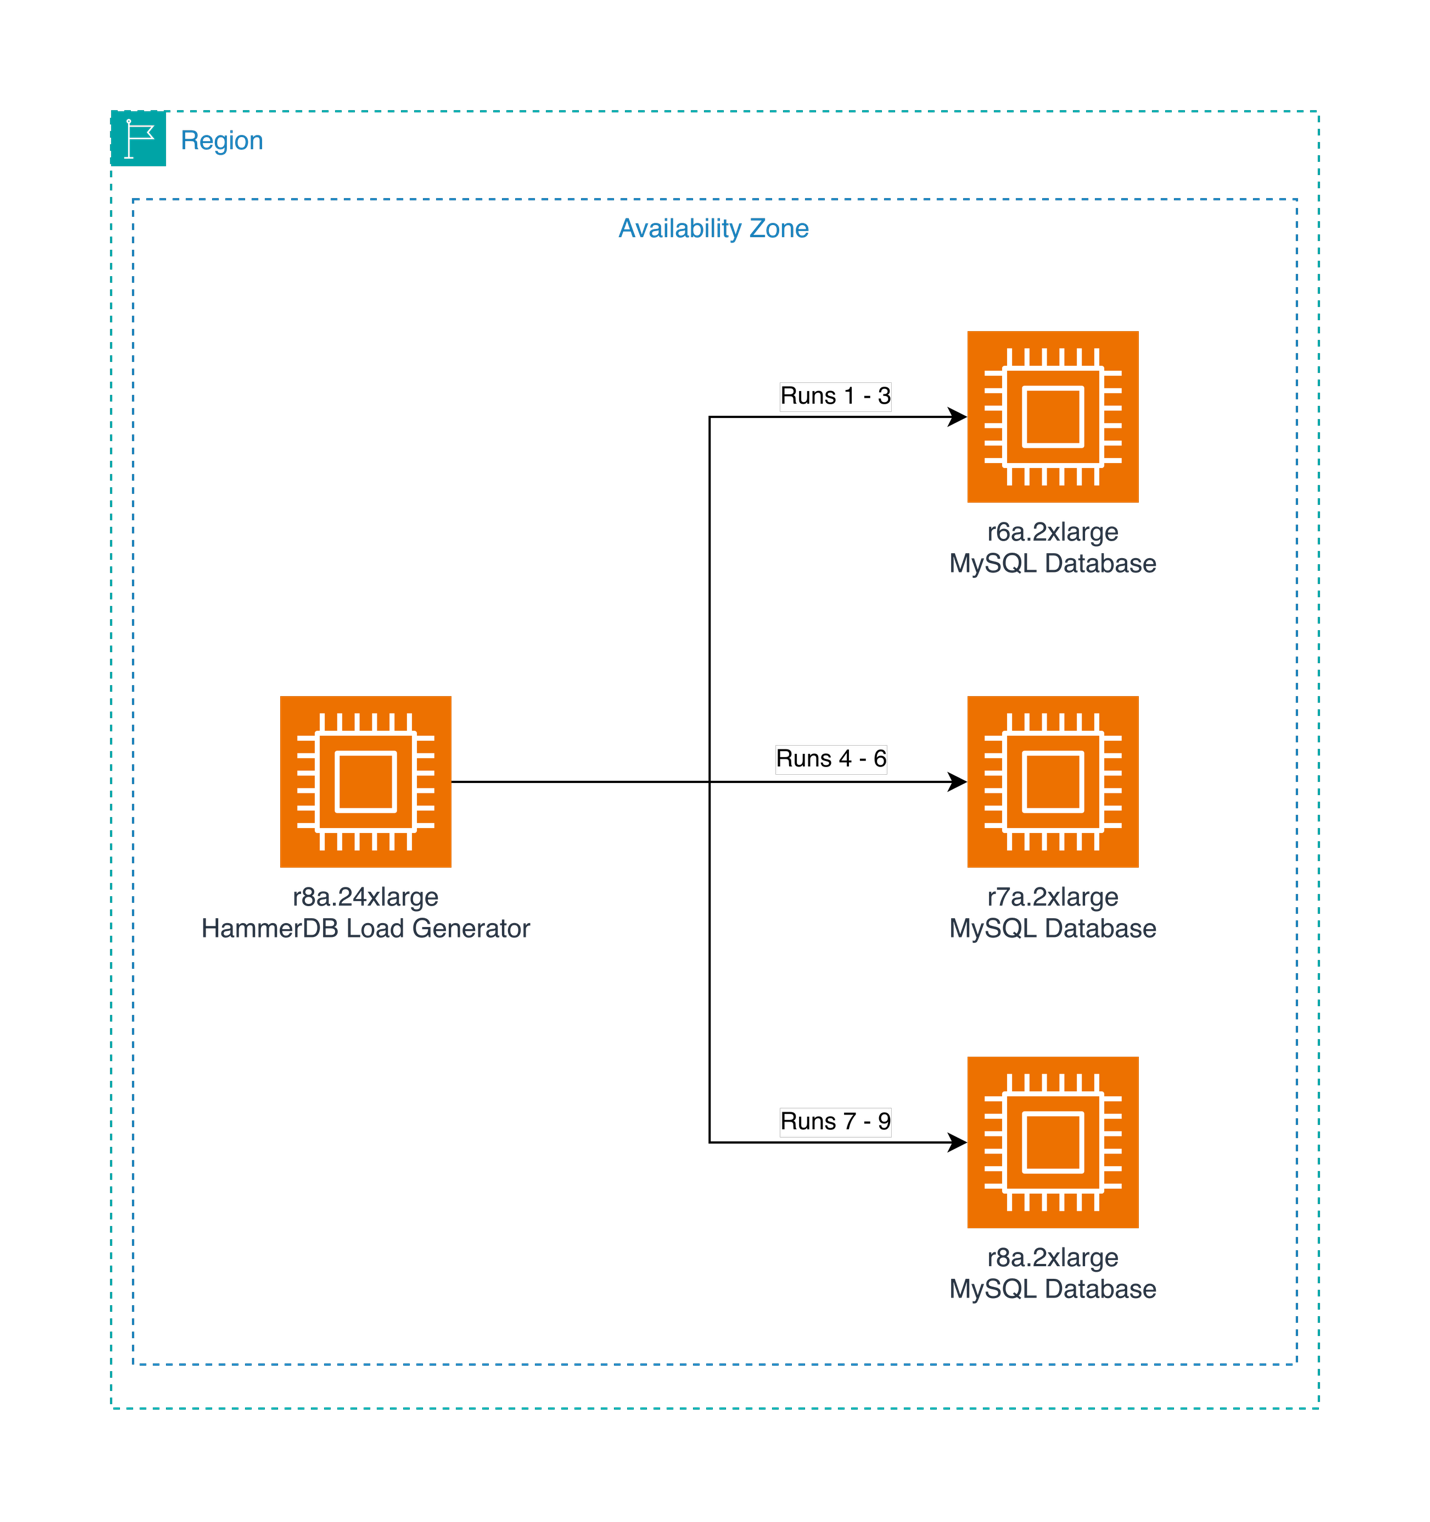
For this benchmark I used an r6a.24xlarge instance for the load generator, and an r6a.xlarge, r7a.xlarge, and r8a.xlarge instances for the MySQL database server all deployed in the same AWS Availability Zone (AZ). I chose a single AZ setup to minimize any latency variability from crossing multiple AZs. This is not meant to be a production-like setup, and I highly recommend using multiple AZs for production workloads. Each MySQL instance was tested separately using the same HammerDB load generator. Each test was run three times, and the results were averaged across the three runs. A diagram of the architecture is shown in the following figure:
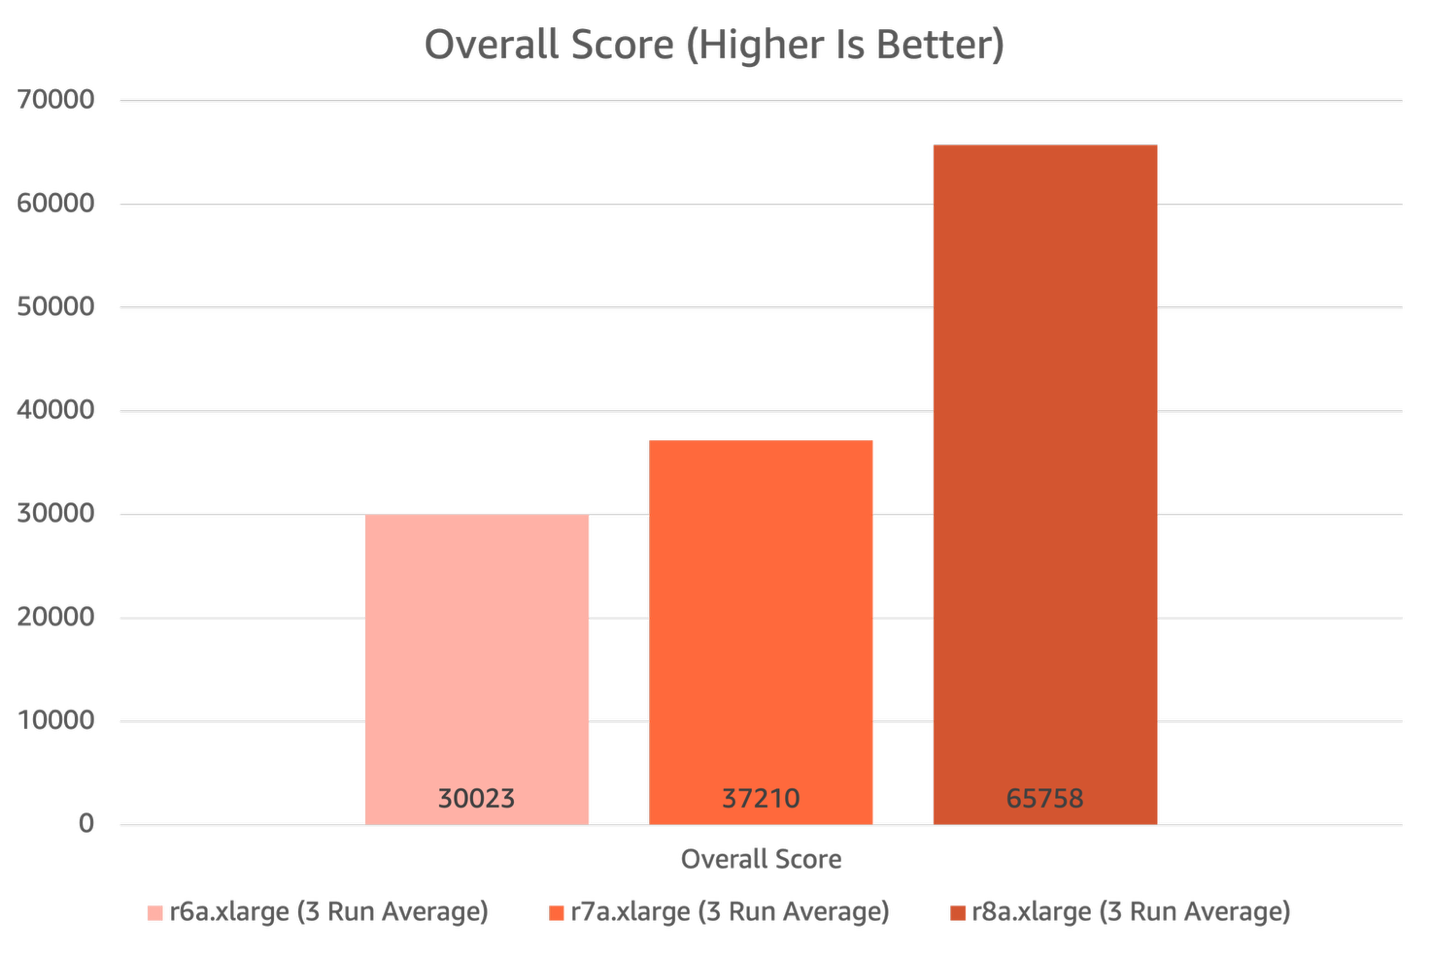
HammerDB overall results
R8a instances show great results in the HammerDB benchmark for MySQL databases. For HammerDB’s overall score category, R8a instances outscored R7a instances by 55% and outscored R6a instances by 74%.
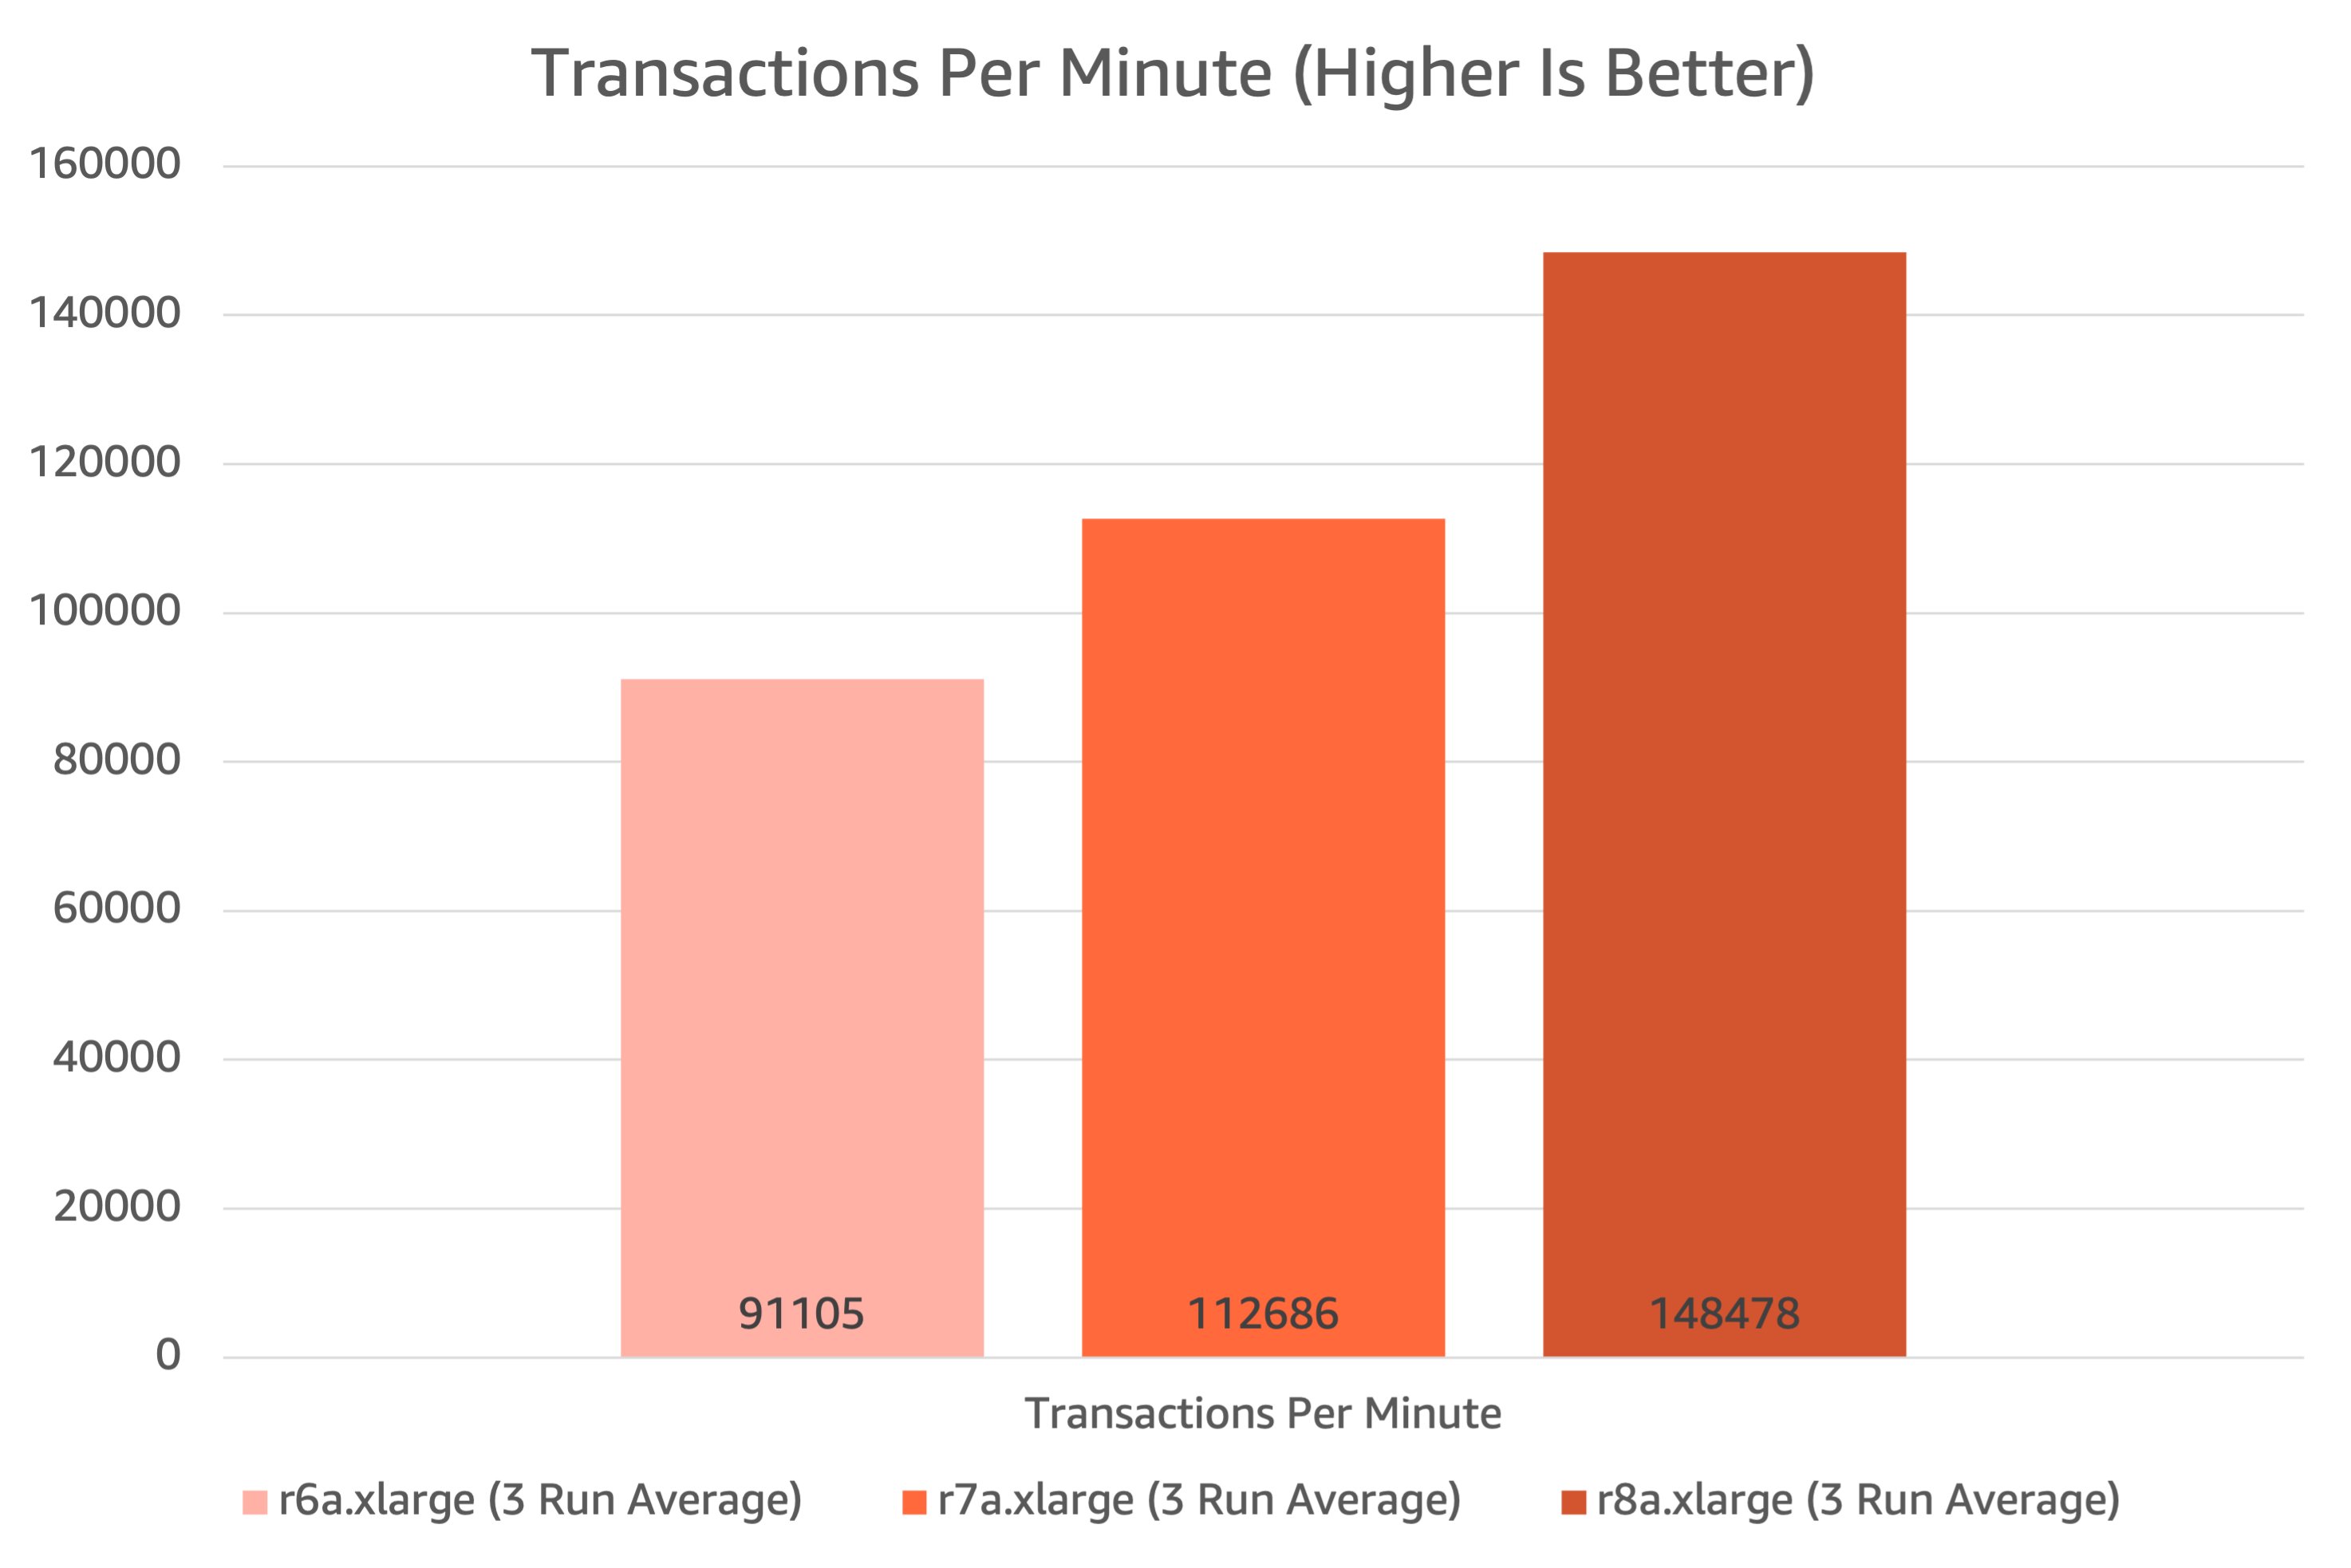
HammerDB transactions per minute test
R8a instances also showed a notable improvement in this category. When compared to previous generation R7a instances, R8a out performed R7a by 32%. When compared to R6a instances, R8a outperformed by 63%.
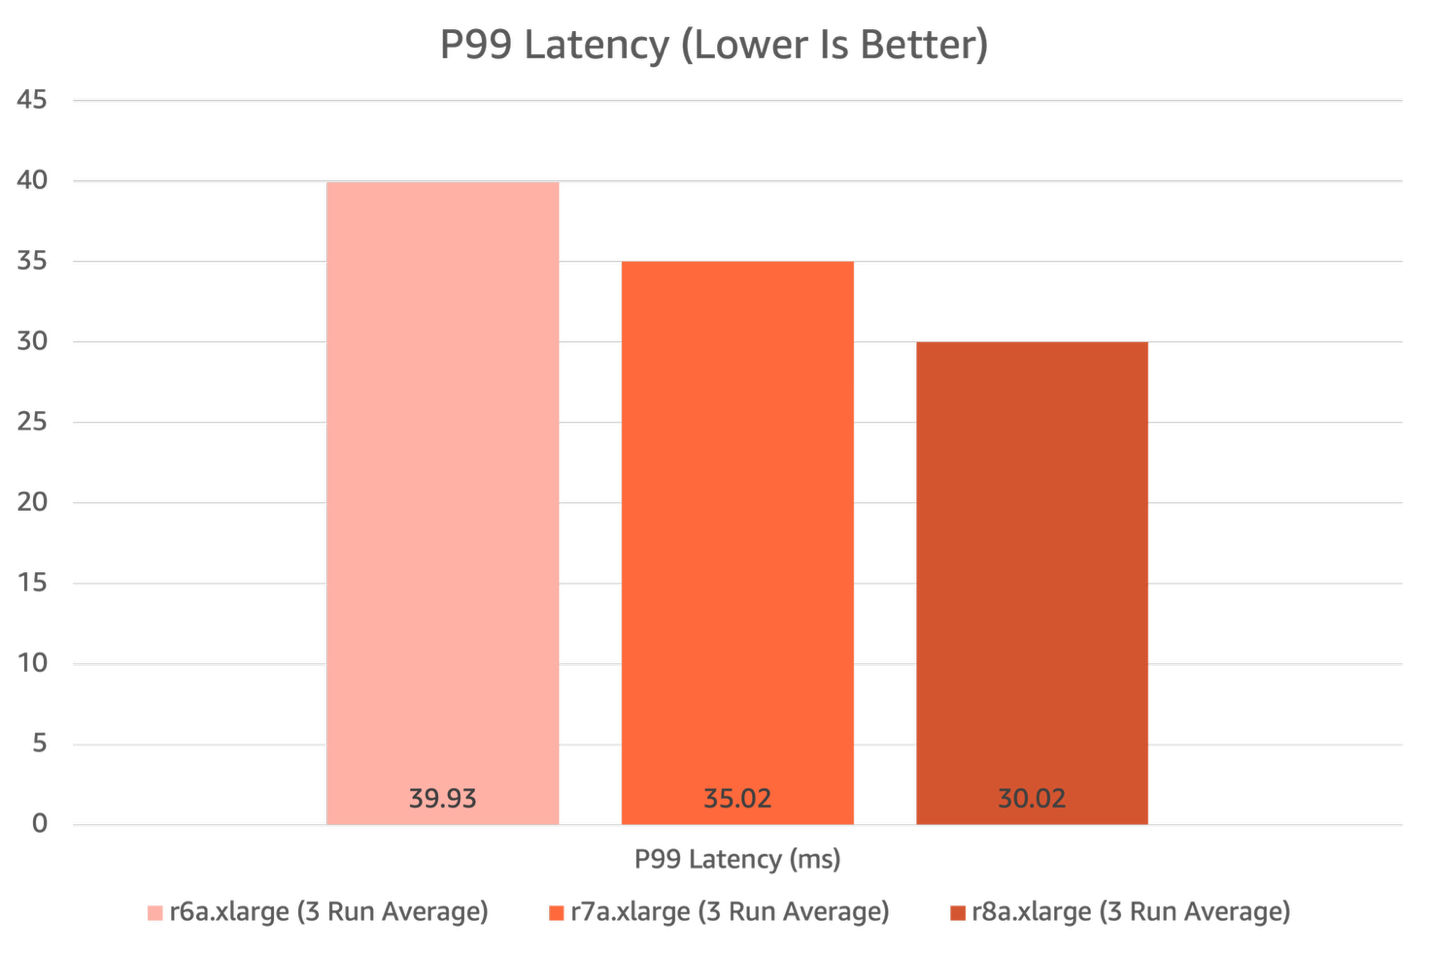
HammerDB P99 latency results
R8a instances showed improvement in P99 latency results, showing the efficiency gains driven by the new 5th Generation AMD EPYC CPUs and higher memory bandwidth. R8a shows an 14% latency reduction when compared to R7a, and a 25% latency reduction when compared to R6a.
Conclusion
Built on the AWS Nitro System using sixth generation Nitro Cards, R8a instances are ideal for high performance, memory-intensive workloads, such as SQL and NoSQL databases, as demonstrated by the bench-marking shown in this post, as well as distributed web scale in-memory caches, in-memory databases, real-time big data analytics, and Electronic Design Automation (EDA) applications. R8a instances offer 12 sizes, including 2 bare metal sizes. Amazon EC2 R8a instances are SAP-certified, and providing 38% more SAPS when compared to R7a instances. If you’re still running 6th generation R6a instances, then I highly encourage you to migrate to the 8th generation instances to use their clear price performance benefits. Staying on modern infrastructure is a great way to drive down costs and provide more features for your customers, and there are clear gains to be had based on the testing shown in this post.
Start optimizing your high performance memory intensive workloads today by migrating to R8a instances. Visit the Amazon EC2 R8a instances page to learn more and get started on your upgrades to use the increased price performance of R8a instances today!
Today, we’re announcing support for MySQL in Cloudflare Workers and Hyperdrive. You can now build applications on Workers that connect to your MySQL databases directly, no matter where they’re hosted, with native MySQL drivers, and with optimal performance.
Connecting to MySQL databases from Workers has been an area we’ve been focusing on for quite some time. We want you to build your apps on Workers with your existing data, even if that data exists in a SQL database in us-east-1. But connecting to traditional SQL databases from Workers has been challenging: it requires making stateful connections to regional databases with drivers that haven’t been designed for the Workers runtime.
After multiple attempts at solving this problem for Postgres, Hyperdrive emerged as our solution that provides the best of both worlds: it supports existing database drivers and libraries while also providing best-in-class performance. And it’s such a critical part of connecting to databases from Workers that we’re making it free (check out the Hyperdrive free tier announcement).
With new Node.js compatibility improvements and Hyperdrive support for the MySQL wire protocol, we’re happy to say MySQL support for Cloudflare Workers has been achieved. If you want to jump into the code and have a MySQL database on hand, this “Deploy to Cloudflare” button will get you setup with a deployed project and will create a repository so you can dig into the code.
Read on to learn more about how we got MySQL to work on Workers, and why Hyperdrive is critical to making connectivity to MySQL databases fast.
Getting MySQL to work on Workers
Until recently, connecting to MySQL databases from Workers was not straightforward. While it’s been possible to make TCP connections from Workers for some time, MySQL drivers had many dependencies on Node.js that weren’t available on the Workers runtime, and that prevented their use.
This led to workarounds being developed. PlanetScale provided a serverless driver for JavaScript, which communicates with PlanetScale servers using HTTP instead of TCP to relay database messages. In a separate effort, a fork of the mysql package was created to polyfill the missing Node.js dependencies and modify the mysql package to work on Workers.
These solutions weren’t perfect. They required using new libraries that either did not provide the level of support expected for production applications, or provided solutions that were limited to certain MySQL hosting providers. They also did not integrate with existing codebases and tooling that depended on the popular MySQL drivers (mysql and mysql2). In our effort to enable all JavaScript developers to build on Workers, we knew that we had to support these drivers.
Improving our Node.js compatibility story was critical to get these MySQL drivers working on our platform. We first identified net and stream as APIs that were needed by both drivers. This, complemented by Workers’ nodejs_compat to resolve unused Node.js dependencies with unenv, enabled the mysql package to work on Workers:
Further work was required to get mysql2 working: dependencies on Node.js timers and the JavaScript eval API remained. While we were able to land support for timers in the Workers runtime, eval was not an API that we could securely enable in the Workers runtime at this time.
mysql2 uses eval to optimize the parsing of MySQL results containing large rows with more than 100 columns (see benchmarks). This blocked the driver from working on Workers, since the Workers runtime does not support this module. Luckily, prior effort existed to get mysql2 working on Workers using static parsers for handling text and binary MySQL data types without using eval(), which provides similar performance for a majority of scenarios.
In mysql2 version 3.13.0, a new option to disable the use of eval() was released to make it possible to use the driver in Cloudflare Workers:
import { createConnection  } from 'mysql2/promise';

export default {
 async fetch(request, env, ctx): Promise<Response> {
    const connection = await createConnection({
     host: env.DB_HOST,
     user: env.DB_USER,
     password: env.DB_PASSWORD,
     database: env.DB_NAME,
     port: env.DB_PORT

     // The following line is needed for mysql2 to work on Workers (as explained above)
     // mysql2 uses eval() to optimize result parsing for rows with > 100 columns
     // eval() is not available in Workers due to runtime limitations
     // Configure mysql2 to use static parsing with disableEval
     disableEval: true
   });

   const [results, fields] = await connection.query(
     'SHOW tables;'
   );

   return new Response(JSON.stringify({ results, fields }), {
     headers: {
       'Content-Type': 'application/json',
       'Access-Control-Allow-Origin': '*',
     },
   });
 },
} satisfies ExportedHandler<Env>;
So, with these efforts, it is now possible to connect to MySQL from Workers. But, getting the MySQL drivers working on Workers was only half of the battle. To make MySQL on Workers performant for production uses, we needed to make it possible to connect to MySQL databases with Hyperdrive.
Supporting MySQL in Hyperdrive
If you’re a MySQL developer, Hyperdrive may be new to you. Hyperdrive solves a core problem: connecting from Workers to regional SQL databases is slow. Database drivers require many roundtrips to establish a connection to a database. Without the ability to reuse these connections between Worker invocations, a lot of unnecessary latency is added to your application.
Hyperdrive solves this problem by pooling connections to your database globally and eliminating unnecessary roundtrips for connection setup. As a plus, Hyperdrive also provides integrated caching to offload popular queries from your database. We wrote an entire deep dive on how Hyperdrive does this, which you should definitely check out.
Getting Hyperdrive to support MySQL was critical for us to be able to say “Connect from Workers to MySQL databases”. That’s easier said than done. To support a new database type, Hyperdrive needs to be able to parse the wire protocol of the database in question, in this case, the MySQL protocol. Once this is accomplished, Hyperdrive can extract queries from protocol messages, cache results across Cloudflare locations, relay messages to a datacenter close to your database, and pool connections reliably close to your origin database.
Adapting Hyperdrive to parse a new language, MySQL protocol, is a challenge in its own right. But it also presented some notable differences with Postgres. While the intricacies are beyond the scope of this post, the differences in MySQL’s authentication plugins across providers and how MySQL’s connection handshake uses capability flags required some adaptation of Hyperdrive. In the end, we leveraged the experience we gained in building Hyperdrive for Postgres to iterate on our support for MySQL. And we’re happy to announce MySQL support is available for Hyperdrive, with all of the performanceimprovements we’ve made to Hyperdrive available from the get-go!
Now, you can create new Hyperdrive configurations for MySQL databases hosted anywhere (we’ve tested MySQL and MariaDB databases from AWS (including AWS Aurora), GCP, Azure, PlanetScale, and self-hosted databases). You can create Hyperdrive configurations for your MySQL databases from the dashboard or the Wrangler CLI:
In your Wrangler configuration file, you’ll need to set your Hyperdrive binding to the ID of the newly created Hyperdrive configuration as well as set Node.js compatibility flags:
From your Cloudflare Worker, the Hyperdrive binding provides you with custom connection credentials that connect to your Hyperdrive configuration. From there onward, all of your queries and database messages will be routed to your origin database by Hyperdrive, leveraging Cloudflare’s network to speed up routing.
import { createConnection  } from 'mysql2/promise';

export interface Env {
 HYPERDRIVE: Hyperdrive;
}

export default {
 async fetch(request, env, ctx): Promise<Response> {

   // Hyperdrive provides new connection credentials to use with your existing drivers
   const connection = await createConnection({
     host: env.HYPERDRIVE.host,
     user: env.HYPERDRIVE.user,
     password: env.HYPERDRIVE.password,
     database: env.HYPERDRIVE.database,
     port: env.HYPERDRIVE.port,

     // Configure mysql2 to use static parsing (as explained above in Part 1)
     disableEval: true
   });

   const [results, fields] = await connection.query(
     'SHOW tables;'
   );

   return new Response(JSON.stringify({ results, fields }), {
     headers: {
       'Content-Type': 'application/json',
       'Access-Control-Allow-Origin': '*',
     },
   });
 },
} satisfies ExportedHandler<Env>;
As you can see from this code snippet, you only need to swap the credentials in your JavaScript code for those provided by Hyperdrive to migrate your existing code to Workers. No need to change the ORMs or drivers you’re using!
Get started building with MySQL and Hyperdrive
MySQL support for Workers and Hyperdrive has been long overdue and we’re excited to see what you build. We published a template for you to get started building your MySQL applications on Workers with Hyperdrive:
As for what’s next, we’re going to continue iterating on our support for MySQL during the beta to support more of the MySQL protocol and MySQL-compatible databases. We’re also going to continue to expand the feature set of Hyperdrive to make it more flexible for your full-stack workloads and more performant for building full-stack global apps on Workers.
Finally, whether you’re using MySQL, PostgreSQL, or any of the other compatible databases, we think you should be using Hyperdrive to get the best performance. And because we want to enable you to build on Workers regardless of your preferred database, we’re making Hyperdrive available to the Workers free plan.
We want to hear your feedback on MySQL, Hyperdrive, and building global applications with Workers. Join the #hyperdrive channel in our Developer Discord to ask questions, share what you’re building, and talk to our Product & Engineering teams directly.
In September 2024, we introduced beta support for hosting, storing, and serving static assets for free on Cloudflare Workers — something that was previously only possible on Cloudflare Pages. Being able to host these assets — your client-side JavaScript, HTML, CSS, fonts, and images — was a critical missing piece for developers looking to build a full-stack application within a single Worker.
Today we’re announcing ten big improvements to building apps on Cloudflare. All together, these new additions allow you to build and host projects ranging from simple static sites to full-stack applications, all on Cloudflare Workers:
You can build complete full-stack apps on Workers without a framework: you can “just use Vite” and React together, and build a backend API in the same Worker. See our Vite + React template for an example.
The Cloudflare Vite plugin is now v1.0 and generally available. The Vite plugin allows you to run Vite’s development server in the Workers runtime (workerd), meaning you get all the benefits of Vite, including Hot Module Replacement, while still being able to use features that are exclusive to Workers (like Durable Objects).
You can now use static _headers and _redirects configuration files for your applications on Workers, something that was previously only available on Pages. These files allow you to add simple headers and configure redirects without executing any Worker code.
In addition to PostgreSQL, you can now connect to MySQL databases in addition from Cloudflare Workers, via Hyperdrive. Bring your existing Planetscale, AWS, GCP, Azure, or other MySQL database, and Hyperdrive will take care of pooling connections to your database and eliminating unnecessary roundtrips by caching queries.
More Node.js APIs are available in the Workers Runtime — including APIs from the crypto, tls, net, and dns modules. We’ve also increased the maximum CPU time for a Workers request from 30 seconds to 5 minutes.
The Images binding in Workers is generally available, allowing you to build more flexible, programmatic workflows.
These improvements allow you to build both simple static sites and more complex server-side rendered applications. Like Pages, you only get charged when your Worker code runs, meaning you can host and serve static sites for free. When you want to do any rendering on the server or need to build an API, simply add a Worker to handle your backend. And when you need to read or write data in your app, you can connect to an existing database with Hyperdrive, or use any of our storage solutions: Workers KV, R2, Durable Objects, or D1.
If you’d like to dive straight into code, you can deploy a single-page application built with Vite and React, with the option to connect to a hosted database with Hyperdrive, by clicking this “Deploy to Cloudflare” button:
Start with Workers
Previously, you needed to choose between building on Cloudflare Pages or Workers (or use Pages for one part of your app, and Workers for another) just to get started. This meant figuring out what your app needed from the start, and hoping that if your project evolved, you wouldn’t be stuck with the wrong platform and architecture. Workers was designed to be a flexible platform, allowing developers to evolve projects as needed — and so, we’ve worked to bring pieces of Pages into Workers over the years.
Now that Workers supports both serving static assets and server-side rendering, you should start with Workers. Cloudflare Pages will continue to be supported, but, going forward, all of our investment, optimizations, and feature work will be dedicated to improving Workers. We aim to make Workers the best platform for building full-stack apps, building upon your feedback of what went well with Pages and what we could improve.
Before, building an app on Pages meant you got a really easy, opinionated on-ramp, but you’d eventually hit a wall if your application got more complex. If you wanted to use Durable Objects to manage state, you would need to set up an entirely separate Worker to do so, ending up with a complicated deployment and more overhead. You also were limited to real-time logs, and could only roll out changes all in one go.
When you build on Workers, you can immediately bind to any other Developer Platform service (including Durable Objects, Email Workers, and more), and manage both your front end and back end in a single project — all with a single deployment. You also get the whole suite of Workers observability tooling built into the platform, such as Workers Logs. And if you want to rollout changes to only a certain percentage of traffic, you can do so with Gradual Deployments.
These latest improvements are part of our goal to bring the best parts of Pages into Workers. For example, we now support static _headers and _redirects config files, so that you can easily take an existing project from Pages (or another platform) and move it over to Workers, without needing to change your project. We also directly integrate with GitHub and GitLab with Workers Builds, providing automatic builds and deployments. And starting today, Preview URLs are posted back to your repository as a comment, with feature branch aliases and environments coming soon.
To learn how to migrate an existing project from Pages to Workers, read our migration guide.
Next, let’s talk about how you can build applications with different rendering modes on Workers.
Building static sites, SPAs, and SSR on Workers
As a quick primer, here are all the architectures and rendering modes we’ll be discussing that are supported on Workers:
Static sites: When you visit a static site, the server immediately returns pre-built static assets — HTML, CSS, JavaScript, images, and fonts. There’s no dynamic rendering happening on the server at request-time. Static assets are typically generated at build-time and served directly from a CDN, making static sites fast and easily cacheable. This approach works well for sites with content that rarely changes.
Single-Page Applications (SPAs): When you load an SPA, the server initially sends a minimal HTML shell and a JavaScript bundle (served as static assets). Your browser downloads this JavaScript, which then takes over to render the entire user interface client-side. After the initial load, all navigation occurs without full-page refreshes, typically via client-side routing. This creates a fast, app-like experience.
Server-Side Rendered (SSR) applications: When you first visit a site that uses SSR, the server generates a fully-rendered HTML page on-demand for that request. Your browser immediately displays this complete HTML, resulting in a fast first page load. Once loaded, JavaScript “hydrates” the page, adding interactivity. Subsequent navigations can either trigger new server-rendered pages or, in many modern frameworks, transition into client-side rendering similar to an SPA.
Next, we’ll dive into how you can build these kinds of applications on Workers, starting with setting up your development environment.
Setup: build and dev
Before uploading your application, you need to bundle all of your client-side code into a directory of static assets. Wrangler bundles and builds your code when you run wrangler dev, but we also now support Vite with our new Vite plugin. This is a great option for those already using Vite’s build tooling and development server — you can continue developing (and testing with Vitest) using Vite’s development server, all using the Workers runtime.
To get started using the Cloudflare Vite plugin, you can scaffold a React application using Vite and our plugin, by running:
The Vite plugin informs Wrangler that this /dist directory contains the project’s built static assets — which, in this case, includes client-side code, some CSS files, and images.
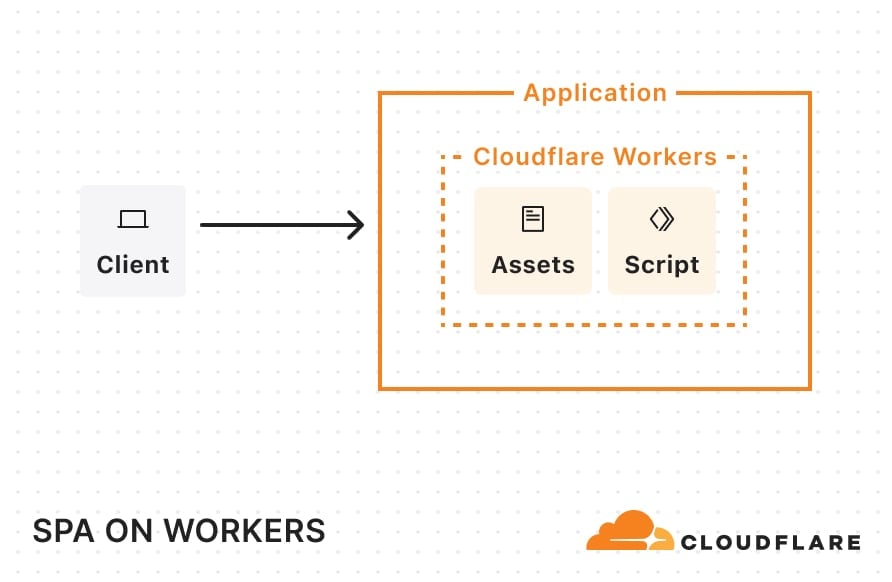
Once deployed, this single-page application (SPA) architecture will look something like this:
When a request comes in, Cloudflare looks at the pathname and automatically serves any static assets that match that pathname. For example, if your static assets directory includes a blog.html file, requests for example.com/blog get that file.
Static sites
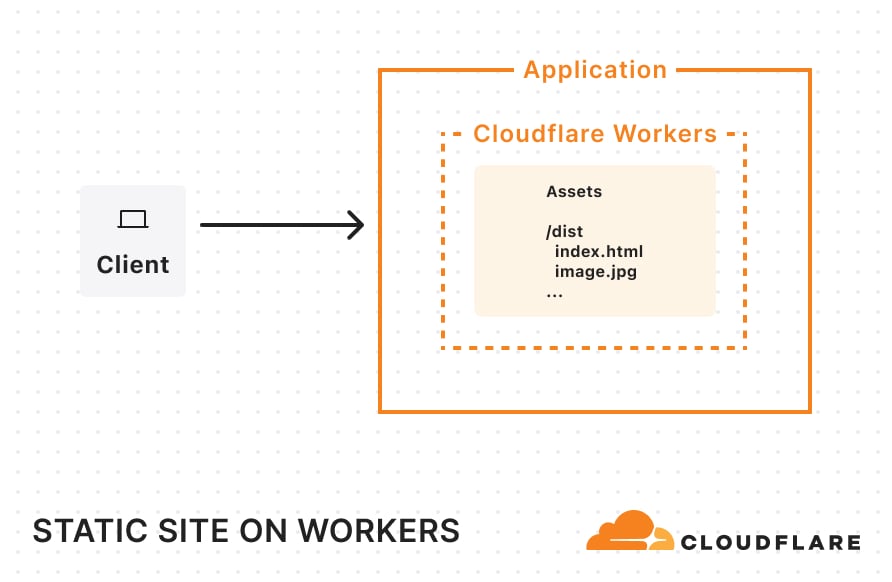
If you have a static site created by a static site generator (SSG) like Astro, all you need to do is create a wrangler.jsonc file (or wrangler.toml) and tell Cloudflare where to find your built assets:
Once you’ve added this configuration, you can simply build your project and run wrangler deploy. Your entire site will then be uploaded and ready for traffic on Workers. Once deployed and requests start flowing in, your static site will be cached across Cloudflare’s network.
You can try starting a fresh Astro project on Workers today by running:
By enabling this, the platform assumes that any navigation request (requests which include a Sec-Fetch-Mode: navigate header) are intended for static assets and will serve up index.html whenever a matching static asset match cannot be found. For non-navigation requests (such as requests for data) that don’t match a static asset, Cloudflare will invoke the Worker script. With this setup, you can render the frontend with React, use a Worker to handle back-end operations, and use Vite to help stitch the two together. This is a great option for porting over older SPAs built with create-react-app, which was recently sunset.
Another thing to note in this Wrangler configuration file: we’ve defined a Hyperdrive binding and enabled Smart Placement. Hyperdrive lets us use an existing database and handles connection pooling. This solves a long-standing challenge of connecting Workers (which run in a highly distributed, serverless environment) directly to traditional databases. By design, Workers operate in lightweight V8 isolates with no persistent TCP sockets and a strict CPU/memory limit. This isolation is great for security and speed, but it makes it difficult to hold open database connections. Hyperdrive addresses these constraints by acting as a “bridge” between Cloudflare’s network and your database, taking care of the heavy lifting of maintaining stable connections or pools so that Workers can reuse them. By turning on Smart Placement, we also ensure that if requests to our Worker originate far from the database (causing latency), Cloudflare can choose to relocate both the Worker—which handles the database connection—and the Hyperdrive “bridge” to a location closer to the database, reducing round-trip times.
SPA example: Worker code
Let’s look at the “Deploy to Cloudflare” example at the top of this blog. In api/index.js, we’ve defined an API (using Hono) which connects to a hosted database through Hyperdrive.
import { Hono } from "hono";
import postgres from "postgres";
import booksRouter from "./routes/books";
import bookRelatedRouter from "./routes/book-related";

const app = new Hono();

// Setup SQL client middleware
app.use("*", async (c, next) => {
 // Create SQL client
 const sql = postgres(c.env.HYPERDRIVE.connectionString, {
   max: 5,
   fetch_types: false,
 });

 c.env.SQL = sql;

 // Process the request
 await next();

 // Close the SQL connection after the response is sent
 c.executionCtx.waitUntil(sql.end());
});

app.route("/api/books", booksRouter);
app.route("/api/books/:id/related", bookRelatedRouter);


export default {
 fetch: app.fetch,
};
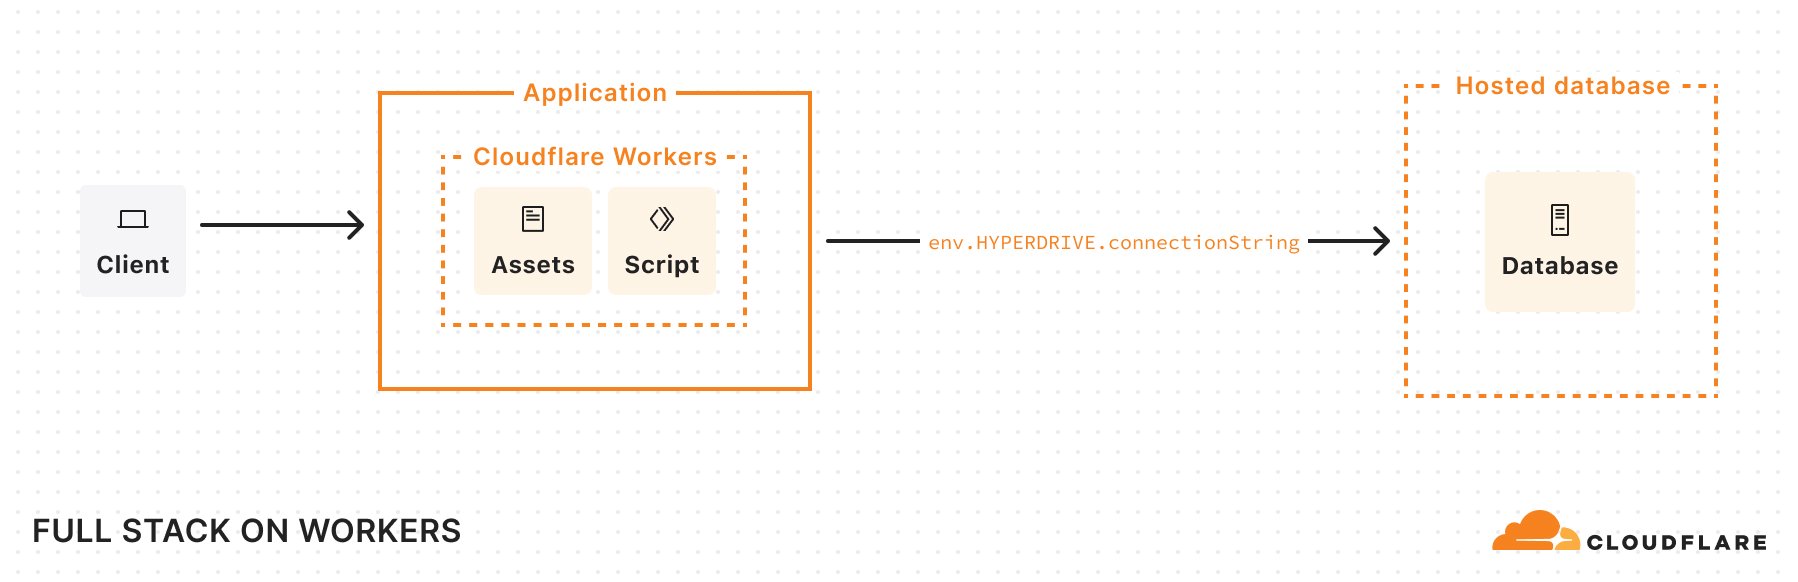
When deployed, our app’s architecture looks something like this:
If Smart Placement moves the placement of my Worker to run closer to my database, it could look like this:
Server-Side Rendering (SSR)
If you want to handle rendering on the server, we support a number of popular full-stack frameworks.
Here’s a version of our previous example, now using React Router v7’s server-side rendering:
Deploy to Workers, with as few changes as possible
Node.js compatibility
We’ve also continued to make progress supporting Node.js APIs, recently adding support for the crypto, tls, net, and dns modules. This allows existing applications and libraries that rely on these Node.js modules to run on Workers. Let’s take a look at an example:
Previously, if you tried to use the mongodb package, you encountered the following error:
Error: [unenv] dns.resolveTxt is not implemented yet!
This occurred when mongodb used the node:dns module to do a DNS lookup of a hostname. Even if you avoided that issue, you would have encountered another error when mongodb tried to use node:tls to securely connect to a database.
Now, you can use mongodb as expected because node:dns and node:tls are supported. The same can be said for libraries relying on node:crypto and node:net.
Additionally, Workers now expose environment variables and secrets on the process.env object when the nodejs_compat compatibility flag is on and the compatibility date is set to 2025-04-01 or beyond. Some libraries (and developers) assume that this object will be populated with variables, and rely on it for top-level configuration. Without the tweak, libraries may have previously broken unexpectedly and developers had to write additional logic to handle variables on Cloudflare Workers.
Now, you can just access your variables as you would in Node.js.
We have also raised the maximum CPU time per Worker request from 30 seconds to 5 minutes. This allows for compute-intensive operations to run for longer without timing out. Say you want to use the newly supported node:crypto module to hash a very large file, you can now do this on Workers without having to rely on external compute for CPU-intensive operations.
Workers Builds
We’ve also made improvements to Workers Builds, which allows you to connect a Git repository to your Worker, so that you can have automatic builds and deployments on every pushed change. Workers Builds was introduced during Builder Day 2024, and initially only allowed you to connect a repository to an existing Worker. Now, you can bring a repository and immediately deploy it as a new Worker, reducing the amount of setup and button clicking needed to bring a project over. We’ve improved the performance of Workers Builds by reducing the latency of build starts by 6 seconds — they now start within 10 seconds on average. We also boosted API responsiveness, achieving a 7x latency improvement thanks to Smart Placement.
Note: On April 2, 2025, Workers Builds transitioned to a new pricing model, as announced during Builder Day 2024. Free plan users are now capped at 3,000 minutes of build time, and Workers Paid subscription users will have a new usage-based model with 6,000 free minutes included and $0.005 per build minute pricing after. To better support concurrent builds, Paid plans will also now get six (6) concurrent builds, making it easier to work across multiple projects and monorepos. For more information on pricing, see the documentation.
Last week, we wrote a blog post that covers how the Images binding enables more flexible, programmatic workflows for image optimization.
Previously, you could access image optimization features by calling fetch() in your Worker. This method requires the original image to be retrievable by URL. However, you may have cases where images aren’t accessible from a URL, like when you want to compress user-uploaded images before they are uploaded to your storage. With the Images binding, you can directly optimize an image by operating on its body as a stream of bytes.
We’re excited to see what you’ll build, and are focused on new features and improvements to make it easier to create any application on Workers. Much of this work was made even better by community feedback, and we encourage everyone to join our Discord to participate in the discussion.
Over 15 years ago, GitHub started as a Ruby on Rails application with a single MySQL database. Since then, GitHub has evolved its MySQL architecture to meet the scaling and resiliency needs of the platform—including building for high availability, implementing testing automation, and partitioning the data. Today, MySQL remains a core part of GitHub’s infrastructure and our relational database of choice.
This is the story of how we upgraded our fleet of 1200+ MySQL hosts to 8.0. Upgrading the fleet with no impact to our Service Level Objectives (SLO) was no small feat–planning, testing and the upgrade itself took over a year and collaboration across multiple teams within GitHub.
Motivation for upgrading
Why upgrade to MySQL 8.0? With MySQL 5.7 nearing end of life, we upgraded our fleet to the next major version, MySQL 8.0. We also wanted to be on a version of MySQL that gets the latest security patches, bug fixes, and performance enhancements. There are also new features in 8.0 that we want to test and benefit from, including Instant DDLs, invisible indexes, and compressed bin logs, among others.
GitHub’s MySQL infrastructure
Before we dive into how we did the upgrade, let’s take a 10,000-foot view of our MySQL infrastructure:
Our fleet consists of 1200+ hosts. It’s a combination of Azure Virtual Machines and bare metal hosts in our data center.
We store 300+ TB of data and serve 5.5 million queries per second across 50+ database clusters.
Our data is partitioned. We leverage both horizontal and vertical sharding to scale our MySQL clusters. We have MySQL clusters that store data for specific product-domain areas. We also have horizontally sharded Vitess clusters for large-domain areas that outgrew the single-primary MySQL cluster.
We have a large ecosystem of tools consisting of Percona Toolkit, gh-ost, orchestrator, freno, and in-house automation used to operate the fleet.
All this sums up to a diverse and complex deployment that needs to be upgraded while maintaining our SLOs.
Preparing the journey
As the primary data store for GitHub, we hold ourselves to a high standard for availability. Due to the size of our fleet and the criticality of MySQL infrastructure, we had a few requirements for the upgrade process:
We must be able to upgrade each MySQL database while adhering to our Service Level Objectives (SLOs) and Service Level Agreements (SLAs).
We are unable to account for all failure modes in our testing and validation stages. So, in order to remain within SLO, we needed to be able to roll back to the prior version of MySQL 5.7 without a disruption of service.
We have a very diverse workload across our MySQL fleet. To reduce risk, we needed to upgrade each database cluster atomically and schedule around other major changes. This meant the upgrade process would be a long one. Therefore, we knew from the start we needed to be able to sustain operating a mixed-version environment.
Preparation for the upgrade started in July 2022 and we had several milestones to reach even before upgrading a single production database.
Prepare infrastructure for upgrade
We needed to determine appropriate default values for MySQL 8.0 and perform some baseline performance benchmarking. Since we needed to operate two versions of MySQL, our tooling and automation needed to be able to handle mixed versions and be aware of new, different, or deprecated syntax between 5.7 and 8.0.
Ensure application compatibility
We added MySQL 8.0 to Continuous Integration (CI) for all applications using MySQL. We ran MySQL 5.7 and 8.0 side-by-side in CI to ensure that there wouldn’t be regressions during the prolonged upgrade process. We detected a variety of bugs and incompatibilities in CI, helping us remove any unsupported configurations or features and escape any new reserved keywords.
To help application developers transition towards MySQL 8.0, we also enabled an option to select a MySQL 8.0 prebuilt container in GitHub Codespaces for debugging and provided MySQL 8.0 development clusters for additional pre-prod testing.
Communication and transparency
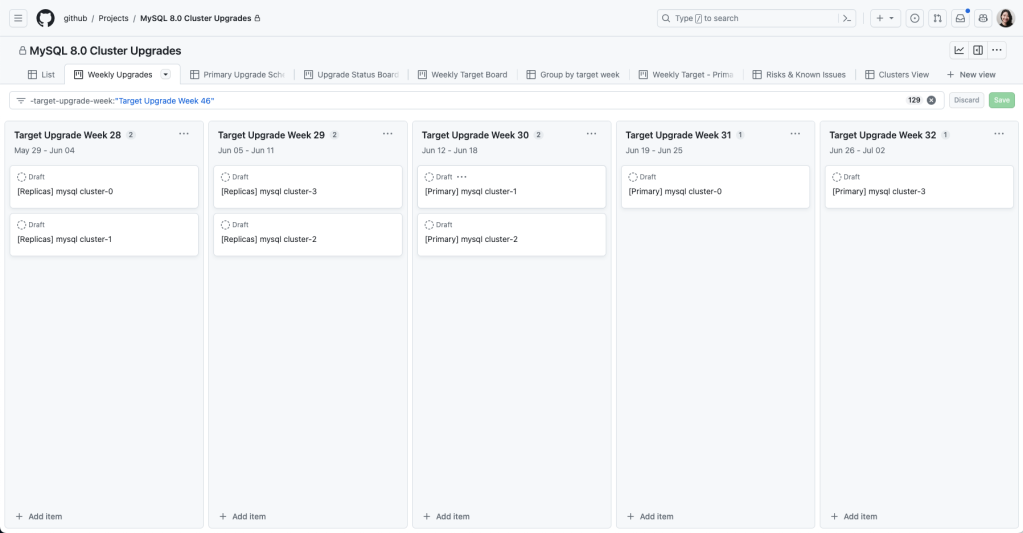
We used GitHub Projects to create a rolling calendar to communicate and track our upgrade schedule internally. We created issue templates that tracked the checklist for both application teams and the database team to coordinate an upgrade.
Project Board for tracking the MySQL 8.0 upgrade schedule
Upgrade plan
To meet our availability standards, we had a gradual upgrade strategy that allowed for checkpoints and rollbacks throughout the process.
Step 1: Rolling replica upgrades
We started with upgrading a single replica and monitoring while it was still offline to ensure basic functionality was stable. Then, we enabled production traffic and continued to monitor for query latency, system metrics, and application metrics. We gradually brought 8.0 replicas online until we upgraded an entire data center and then iterated through other data centers. We left enough 5.7 replicas online in order to rollback, but we disabled production traffic to start serving all read traffic through 8.0 servers.
The replica upgrade strategy involved gradual rollouts in each data center (DC).
Step 2: Update replication topology
Once all the read-only traffic was being served via 8.0 replicas, we adjusted the replication topology as follows:
An 8.0 primary candidate was configured to replicate directly under the current 5.7 primary.
Two replication chains were created downstream of that 8.0 replica:
A set of only 5.7 replicas (not serving traffic, but ready in case of rollback).
A set of only 8.0 replicas (serving traffic).
The topology was only in this state for a short period of time (hours at most) until we moved to the next step.
To facilitate the upgrade, the topology was updated to have two replication chains.
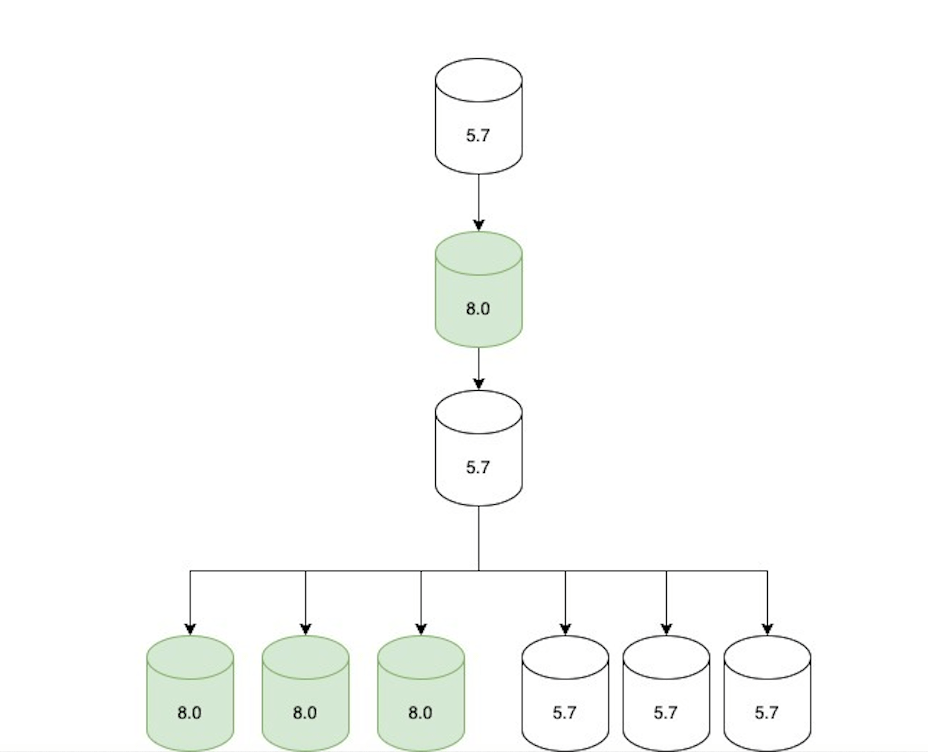
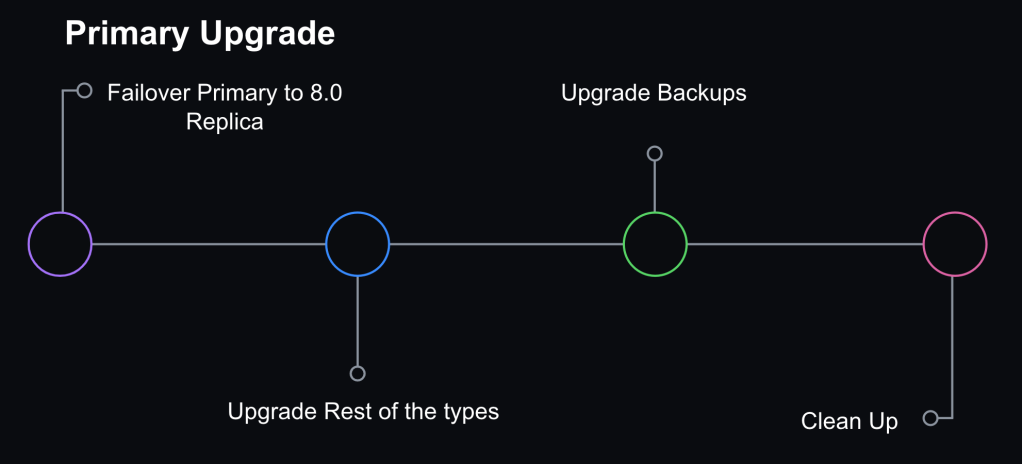
Step 3: Promote MySQL 8.0 host to primary
We opted not to do direct upgrades on the primary database host. Instead, we would promote a MySQL 8.0 replica to primary through a graceful failover performed with Orchestrator. At that point, the replication topology consisted of an 8.0 primary with two replication chains attached to it: an offline set of 5.7 replicas in case of rollback and a serving set of 8.0 replicas.
Orchestrator was also configured to blacklist 5.7 hosts as potential failover candidates to prevent an accidental rollback in case of an unplanned failover.
Primary failover and additional steps to finalize MySQL 8.0 upgrade for a database
Step 4: Internal facing instance types upgraded
We also have ancillary servers for backups or non-production workloads. Those were subsequently upgraded for consistency.
Step 5: Cleanup
Once we confirmed that the cluster didn’t need to rollback and was successfully upgraded to 8.0, we removed the 5.7 servers. Validation consisted of at least one complete 24 hour traffic cycle to ensure there were no issues during peak traffic.
Ability to Rollback
A core part of keeping our upgrade strategy safe was maintaining the ability to rollback to the prior version of MySQL 5.7. For read-replicas, we ensured enough 5.7 replicas remained online to serve production traffic load, and rollback was initiated by disabling the 8.0 replicas if they weren’t performing well. For the primary, in order to roll back without data loss or service disruption, we needed to be able to maintain backwards data replication between 8.0 and 5.7.
MySQL supports replication from one release to the next higher release but does not explicitly support the reverse (MySQL Replication compatibility). When we tested promoting an 8.0 host to primary on our staging cluster, we saw replication break on all 5.7 replicas. There were a couple of problems we needed to overcome:
In MySQL 8.0, utf8mb4 is the default character set and uses a more modern utf8mb4_0900_ai_ci collation as the default. The prior version of MySQL 5.7 supported the utf8mb4_unicode_520_ci collation but not the latest version of Unicode utf8mb4_0900_ai_ci.
MySQL 8.0 introduces roles for managing privileges but this feature did not exist in MySQL 5.7. When an 8.0 instance was promoted to be a primary in a cluster, we encountered problems. Our configuration management was expanding certain permission sets to include role statements and executing them, which broke downstream replication in 5.7 replicas. We solved this problem by temporarily adjusting defined permissions for affected users during the upgrade window.
To address the character collation incompatibility, we had to set the default character encoding to utf8 and collation to utf8_unicode_ci.
For the GitHub.com monolith, our Rails configuration ensured that character collation was consistent and made it easier to standardize client configurations to the database. As a result, we had high confidence that we could maintain backward replication for our most critical applications.
Challenges
Throughout our testing, preparation and upgrades, we encountered some technical challenges.
What about Vitess?
We use Vitess for horizontally sharding relational data. For the most part, upgrading our Vitess clusters was not too different from upgrading the MySQL clusters. We were already running Vitess in CI, so we were able to validate query compatibility. In our upgrade strategy for sharded clusters, we upgraded one shard at a time. VTgate, the Vitess proxy layer, advertises the version of MySQL and some client behavior depends on this version information. For example, one application used a Java client that disabled the query cache for 5.7 servers—since the query cache was removed in 8.0, it generated blocking errors for them. So, once a single MySQL host was upgraded for a given keyspace, we had to make sure we also updated the VTgate setting to advertise 8.0.
Replication delay
We use read-replicas to scale our read availability. GitHub.com requires low replication delay in order to serve up-to-date data.
Earlier on in our testing, we encountered a replication bug in MySQL that was patched on 8.0.28:
Replication: If a replica server with the system variable replica_preserve_commit_order = 1 set was used under intensive load for a long period, the instance could run out of commit order sequence tickets. Incorrect behavior after the maximum value was exceeded caused the applier to hang and the applier worker threads to wait indefinitely on the commit order queue. The commit order sequence ticket generator now wraps around correctly. Thanks to Zhai Weixiang for the contribution. (Bug #32891221, Bug #103636)
We happen to meet all the criteria for hitting this bug.
We use replica_preserve_commit_order because we use GTID based replication.
We have intensive load for long periods of time on many of our clusters and certainly for all of our most critical ones. Most of our clusters are very write-heavy.
Since this bug was already patched upstream, we just needed to ensure we are deploying a version of MySQL higher than 8.0.28.
We also observed that the heavy writes that drove replication delay were exacerbated in MySQL 8.0. This made it even more important that we avoid heavy bursts in writes. At GitHub, we use freno to throttle write workloads based on replication lag.
Queries would pass CI but fail on production
We knew we would inevitably see problems for the first time in production environments—hence our gradual rollout strategy with upgrading replicas. We encountered queries that passed CI but would fail on production when encountering real-world workloads. Most notably, we encountered a problem where queries with large WHERE IN clauses would crash MySQL. We had large WHERE IN queries containing over tens of thousands of values. In those cases, we needed to rewrite the queries prior to continuing the upgrade process. Query sampling helped to track and detect these problems. At GitHub, we use Solarwinds DPM (VividCortex), a SaaS database performance monitor, for query observability.
Learnings and takeaways
Between testing, performance tuning, and resolving identified issues, the overall upgrade process took over a year and involved engineers from multiple teams at GitHub. We upgraded our entire fleet to MySQL 8.0 – including staging clusters, production clusters in support of GitHub.com, and instances in support of internal tools. This upgrade highlighted the importance of our observability platform, testing plan, and rollback capabilities. The testing and gradual rollout strategy allowed us to identify problems early and reduce the likelihood for encountering new failure modes for the primary upgrade.
While there was a gradual rollout strategy, we still needed the ability to rollback at every step and we needed the observability to identify signals to indicate when a rollback was needed. The most challenging aspect of enabling rollbacks was holding onto the backward replication from the new 8.0 primary to 5.7 replicas. We learned that consistency in the Trilogy client library gave us more predictability in connection behavior and allowed us to have confidence that connections from the main Rails monolith would not break backward replication.
However, for some of our MySQL clusters with connections from multiple different clients in different frameworks/languages, we saw backwards replication break in a matter of hours which shortened the window of opportunity for rollback. Luckily, those cases were few and we didn’t have an instance where the replication broke before we needed to rollback. But for us this was a lesson that there are benefits to having known and well-understood client-side connection configurations. It emphasized the value of developing guidelines and frameworks to ensure consistency in such configurations.
Prior efforts to partition our data paid off—it allowed us to have more targeted upgrades for the different data domains. This was important as one failing query would block the upgrade for an entire cluster and having different workloads partitioned allowed us to upgrade piecemeal and reduce the blast radius of unknown risks encountered during the process. The tradeoff here is that this also means that our MySQL fleet has grown.
The last time GitHub upgraded MySQL versions, we had five database clusters and now we have 50+ clusters. In order to successfully upgrade, we had to invest in observability, tooling, and processes for managing the fleet.
Conclusion
A MySQL upgrade is just one type of routine maintenance that we have to perform – it’s critical for us to have an upgrade path for any software we run on our fleet. As part of the upgrade project, we developed new processes and operational capabilities to successfully complete the MySQL version upgrade. Yet, we still had too many steps in the upgrade process that required manual intervention and we want to reduce the effort and time it takes to complete future MySQL upgrades.
We anticipate that our fleet will continue to grow as GitHub.com grows and we have goals to partition our data further which will increase our number of MySQL clusters over time. Building in automation for operational tasks and self-healing capabilities can help us scale MySQL operations in the future. We believe that investing in reliable fleet management and automation will allow us to scale github and keep up with required maintenance, providing a more predictable and resilient system.
The lessons from this project provided the foundations for our MySQL automation and will pave the way for future upgrades to be done more efficiently, but still with the same level of care and safety.
The Relational Database Management System (RDBMS) is a popular choice among organizations running critical applications that supports online transaction processing (OLTP) use-cases. But managing the RDBMS database comes with its own challenges. AWS has made it easier for organizations to operate these databases in the cloud, thereby addressing the undifferentiated heavy lifting with managed databases (Amazon Aurora, Amazon RDS). Although using managed services has freed up engineering from provisioning hardware, database setup, patching, and backups, they still face the challenges that come with running a highly performant database. As applications scale in size and sophistication, it becomes increasingly challenging for customers to detect and resolve relational database performance bottlenecks and other operational issues quickly.
Amazon RDS Performance Insights is a database performance tuning and monitoring feature, that lets you quickly assess your database load and determine when and where to take action. Performance Insights lets non-experts in database administration diagnose performance problems with an easy-to-understand dashboard that visualizes database load. Furthermore, Performance Insights expands on the existing Amazon RDS monitoring features to illustrate database performance and help analyze any issues that affect it. The Performance Insights dashboard also lets you visualize the database load and filter the load by waits, SQL statements, hosts, or users.
On Dec 1st, 2021, we announced Amazon DevOps Guru for RDS, a new capability for Amazon DevOps Guru. It’s a fully-managed machine learning (ML)-powered service that detects operational and performance related issues for Amazon Aurora engines. It uses the data that it collects from Performance Insights, and then automatically detects and alerts customers of application issues, including database problems. When DevOps Guru detects an issue in an RDS database, it publishes an insight in the DevOps Guru dashboard. The insight contains an anomaly for the resource AWS/RDS. If DevOps Guru for RDS is turned on for your instances, then the anomaly contains a detailed analysis of the problem. DevOps Guru for RDS also recommends that you perform an investigation, or it provides a specific corrective action. For example, the recommendation might be to investigate a specific high-load SQL statement or to scale database resources.
In this post, we’ll deep-dive into some of the common issues that you may encounter while running your workloads against Amazon Aurora MySQL-Compatible Edition databases, with simulated performance issues. We’ll also look at how DevOps Guru for RDS can help identify and resolve these issues. Simulating a performance issue is resource intensive, and it will cost you money to run these tests. If you choose the default options that are provided, and clean up your resources using the following clean-up instructions, then it will cost you approximately $15 to run the first test only. If you wish to run all of the tests, then you can choose “all” in the Tests parameter choice. This will cost you approximately $28 to run all three tests.
Prerequisites
To follow along with this walkthrough, you must have the following prerequisites:
An AWS account with a role that has sufficient access to provision the required infrastructure. The account should also not have exceeded its quota for the resources being deployed (VPCs, Amazon Aurora, etc.).
Credentials that enable you to interact with your AWS account.
If you already have Amazon DevOps Guru turned on, then make sure that it’s tagged properly to detect issues for the resource being deployed.
Solution overview
You will clone the project from GitHub and deploy an AWS CloudFormation template, which will set up the infrastructure required to run the tests. If you choose to use the defaults, then you can run only the first test. If you would like to run all of the tests, then choose the “all” option under Tests parameter.
We simulate some common scenarios that your database might encounter when running enterprise applications. The first test simulates locking issues. The second test simulates the behavior when the AUTOCOMMIT property of the database driver is set to: True. This could result in statement latency. The third test simulates performance issues when an index is missing on a large table.
Solution walk through
Clone the repo and deploy resources
Utilize the following command to clone the GitHub repository that contains the CloudFormation template and the scripts necessary to simulate the database load. Note that by default, we’ve provided the command to run only the first test.
If you wish to run all four of the tests, then flip the ParameterValue of the Tests ParameterKey to “all”.
If Amazon DevOps Guru is already enabled in your account, then change the ParameterValue of the EnableDevOpsGuru ParameterKey to “n”.
It may take up to 30 minutes for CloudFormation to provision the necessary resources. Visit the CloudFormation console (make sure to choose the region where you have deployed your resources), and make sure that DevOpsGuru-Stack is in the CREATE_COMPLETE state before proceeding to the next step.
Navigate to AWS Cloud9, then choose Your environments. Next, choose DevOpsGuruMySQLInstance followed by Open IDE. This opens a cloud-based IDE environment where you will be running your tests. Note that in this setup, AWS Cloud9 inherits the credentials that you used to deploy the CloudFormation template.
Open a new terminal window which you will be using to clone the repository where the scripts are located.
Clone the repo into your Cloud9 environment, then navigate to the directory where the scripts are located, and run initial setup.
git clone https://github.com/aws-samples/amazon-devops-guru-rds.git
cd amazon-devops-guru-rds/scripts
sh setup.sh
# NOTE: If you are running all test cases, use sh setup.sh all command instead.
source ~/.bashrc
Initialize databases for all of the test cases, and add random data into them. The script to insert random data takes approximately five hours to complete. Your AWS Cloud9 instance is set up to run for up to 24 hours before shutting down. You can exit the browser and return between 5–24 hours to validate that the script ran successfully, then continue to the next step.
source ./connect.sh test 1
USE devopsgurusource;
CREATE TABLE IF NOT EXISTS test1 (id int, filler char(255), timer timestamp);
exit;
python3 ct.py
If you chose to run all test cases, and you ran the sh setup.sh all command in Step 4, open two new terminal windows and run the following commands to insert random data for test cases 2 and 3.
# Test case 2 – Open a new terminal window to run the commands
cd amazon-devops-guru-rds/scripts
source ./connect.sh test 2
USE devopsgurusource;
CREATE TABLE IF NOT EXISTS test1 (id int, filler char(255), timer timestamp);
exit;
python3 ct.py
# Test case 3 - Open a new terminal window to run the commands
cd amazon-devops-guru-rds/scripts
source ./connect.sh test 3
USE devopsgurusource;
CREATE TABLE IF NOT EXISTS test1 (id int, filler char(255), timer timestamp);
exit;
python3 ct.py
Return between 5-24 hours to run the next set of commands.
Add an index to the first database.
source ./connect.sh test 1
CREATE UNIQUE INDEX test1_pk ON test1(id);
INSERT INTO test1 VALUES (-1, 'locker', current_timestamp);
exit;
If you chose to run all test cases, and you ran the sh setup.sh all command in Step 4, add an index to the second database. NOTE: Do no add an index to the third database.
source ./connect.sh test 2
CREATE UNIQUE INDEX test1_pk ON test1(id);
INSERT INTO test1 VALUES (-1, 'locker', current_timestamp);
exit;
DevOps Guru for RDS uses Performance Insights, and it establishes a baseline for the database metrics. Baselining involves analyzing the database performance metrics over a period of time to establish a “normal” behavior. DevOps Guru for RDS then uses ML to detect anomalies against the established baseline. If your workload pattern changes, then DevOps Guru for RDS establishes a new baseline that it uses to detect anomalies against the new “normal”. For new database instances, DevOps Guru for RDS takes up to two days to establish an initial baseline, as it requires an analysis of the database usage patterns and establishing what is considered a normal behavior.
Allow two days before you start running the following tests.
Scenario 1: Locking Issues
In this scenario, multiple sessions compete for the same (“locked”) record, and they must wait for each other. In real life, this often happens when:
A database session gets disconnected due to a (i.e., temporary network) malfunction, while still holding a critical lock.
Other sessions become stuck while waiting for the lock to be released.
The problem is often exacerbated by the application connection manager that keeps spawning additional sessions (because the existing sessions don’t complete the work on time), thus creating a distinct “inclined slope” pattern that you’ll see in this scenario.
Here’s how you can reproduce it:
Connect to the database.
cd amazon-devops-guru-rds/scripts
source ./connect.sh test 1
In your MySQL, enter the following SQL, and don’t exit the shell.
START TRANSACTION;
UPDATE test1 SET timer=current_timestamp WHERE id=-1;
-- Do NOT exit!
Open a new terminal, and run the command to simulate competing transactions. Give it approximately five minutes before you run the commands in this step.
cd amazon-devops-guru-rds/scripts
source ./connect.sh test 1
exit;
python3 locking_scenario.py 1 1200 2
After the program completes its execution, navigate to the Amazon DevOps Guru console, choose Insights, and then choose RDS DB Load Anomalous. You’ll notice a summary of the insight under Description.
Choose the View Recommendations link on the top right, and observe the databases for which it’s showing the recommendations.
Next, choose View detailed analysis for database performance anomaly for the following resources.
Under To view a detailed analysis, choose a resource name, choose the database associated with the first test.
Observe the recommendations under Analysis and recommendations. It provides you with analysis, recommendations, and links to troubleshooting documentation.
In this example, DevOps Guru for RDS has detected a high and unusual spike of database load, and then marked it as “performance anomaly”.
Note that the relative size of the anomaly is significant: 490 times higher than the “typical” database load, which is why it’s deemed: “HIGH severity”.
In the analysis section, note that a single “wait event”, wait/synch/mutex/innodb/aurora_lock_thread_slot_futex, is dominating the entire spike. Moreover, a single SQL is “responsible” (or more precisely: “suffering”) from this wait event at the time of the problem. Select the wait event name and see a simple explanation of what’s happening in the database. For example, it’s “record locking”, where multiple sessions are competing for the same database records. Additionally, you can select the SQL hash and see the exact text of the SQL that’s responsible for the issue.
If you’re interested in why DevOps Guru for RDS detected this problem, and why these particular wait events and an SQL were selected, the Why is this a problem? and Why do we recommend this? links will provide the answer.
Finally, the most relevant part of this analysis is a View troubleshooting doc link. It references a document that contains a detailed explanation of the likely causes for this problem, as well as the actions that you can take to troubleshoot and address it.
Scenario 2: Autocommit: ON
In this scenario, we must run multiple batch updates, and we’re using a fairly popular driver setting: AUTOCOMMIT: ON.
This setting can sometimes lead to performance issues as it causes each UPDATE statement in a batch to be “encased” in its own “transaction”. This leads to data changes being frequently synchronized to disk, thus dramatically increasing batch latency.
Here’s how you can reproduce the scenario:
On your Cloud9 terminal, run the following commands:
cd amazon-devops-guru-rds/scripts
source ./connect.sh test 2
exit;
python3 batch_autocommit.py 50 1200 1000 10000000
Once the program completes its execution, or after an hour, navigate to the Amazon DevOps Guru console, choose Insights, and then choose RDS DB Load Anomalous. Then choose Recommendations and choose View detailed analysis for database performance anomaly for the following resources. Under To view a detailed analysis, choose a resource name, choose the database associated with the second test.
Observe the recommendations under Analysis and recommendations. It provides you with analysis, recommendations, and links to troubleshooting documentation.
Note that DevOps Guru for RDS detected a significant (and unusual) spike of database load and marked it as a HIGH severity anomaly.
The spike looks similar to the previous example (albeit, “smaller”), but it describes a different database problem (“COMMIT slowdowns”). This is because of a different database wait event that dominates the spike: wait/io/aurora_redo_log_flush.
As in the previous example, you can select the wait event name to see a simple description of what’s going on, and you can select the SQL hash to see the actual statement that is slow. Furthermore, just as before, the View troubleshooting doc link references the document that describes what you can do to troubleshoot the problem further and address it.
Scenario 3: Missing index
Have you ever wondered what would happen if you drop a frequently accessed index on a large table?
In this relatively simple scenario, we’re testing exactly that – an index gets dropped causing queries to switch from fast index lookups to slow full table scans, thus dramatically increasing latency and resource use.
Here’s how you can reproduce this problem and see it for yourself:
On your Cloud9 terminal, run the following commands:
cd amazon-devops-guru-rds/scripts
source ./connect.sh test 3
exit;
python3 no_index.py 50 1200 1000 10000000
Once the program completes its execution, or after an hour, navigate to the Amazon DevOps Guru console, choose Insights, and then choose RDS DB Load Anomalous. Then choose Recommendations and choose View detailed analysis for database performance anomaly for the following resources. Under To view a detailed analysis, choose a resource name, choose the database associated with the third test.
Observe the recommendations under Analysis and recommendations. It provides you with analysis, recommendations, and links to troubleshooting documentation.
As with the previous examples, DevOps Guru for RDS detected a high and unusual spike of database load (in this case, ~ 50 times larger than the “typical” database load). It also identified that a single wait event, wait/io/table/sql/handler, and a single SQL, are responsible for this issue.
The analysis highlights the SQL that you must pay attention to, and it links a detailed troubleshooting document that lists the likely causes and recommended actions for the problems that you see. While it doesn’t tell you that the “missing index” is the real root cause of the issue (this is planned in future versions), it does offer many relevant details that can help you come to that conclusion yourself.
Cleanup
On your terminal where you originally ran the AWS Command Line Interface (AWS CLI) command to create the CloudFormation resources, run the following command:
In this post, you learned how to leverage DevOps Guru for RDS to alert you of any operational issues with recommendations. You simulated some of the commonly encountered, real-world production issues, such as locking contentions, AUTOCOMMIT, and missing indexes. Moreover, you saw how DevOps Guru for RDS helped you detect and resolve these issues. Try this out, and let us know how DevOps Guru for RDS was able to address your use-case.
At Cloudflare, we’re building the best compute platform in the world. We want to make it easy, seamless, and obvious to build your applications with us. But simply making the best compute platform is not enough — at the heart of your applications are the data they interact with.
Cloudflare has multiple data storage solutions available today: Workers KV, R2, and Durable Objects. All three follow Cloudflare’s design goals for Workers: global by default, infinitely scalable, and delightful for developers to use. We’ve partnered with third-party storage solutions like Fauna, MongoDB and Prisma, who have built data platforms that align beautifully with our design goals and written tutorials for databases that already support HTTP connections.
The one area that’s been sorely missed: relational databases. Cloudflare itself runs on relational databases, and we’re not alone. In April, we asked which Node libraries you wanted us to support, and four of the top five requests were related to databases. For this Full Stack Week, we asked ourselves: how could we support relational databases in a way that aligned with our design goals?
Today, we’re taking a first step towards that world by announcing support for relational databases, including Postgres and MySQL from Workers.
Connecting to a database is no simple task — if it were as easy as passing a connection string to a database driver, we would have already done it. We’ve had to overcome several hurdles to reach this point, and have several more still to conquer.
Our goal with this announcement is to work with you, our developers, to solve the unique pain points that come from accessing databases inside Workers. If you’d like to work with us, fill out this form or join us on Discord — this is just the beginning. If you’d just like to grab the code and play around, use this example to get started connecting to your own database, or check out our demo.
Why are Database Connectors so hard to build?
Serverless database connections are challenging to support for several reasons.
Databases are needy — they often require TCP connections, since they assume long-lived connections between an application server and the database. The Workers runtime doesn’t currently support TCP connections, so we’ve only been able to support HTTP-based databases or proxies.
Like a relationship, establishing a connection isn’t quite enough. Developers use client libraries for databases to make submitting queries and managing the responses easy. Since the Workers runtime is not entirely Node.js compatible, we need to either roll our own database library or find one that does not use unsupported built-in libraries.
Finally, databases are sensitive. It often takes external libraries to manage shared connections between an application server and a database, since these connections tend to be expensive to establish.
Moving past these challenges
Our approach today gives us the foundation to address each of these challenges in creative ways going forward.
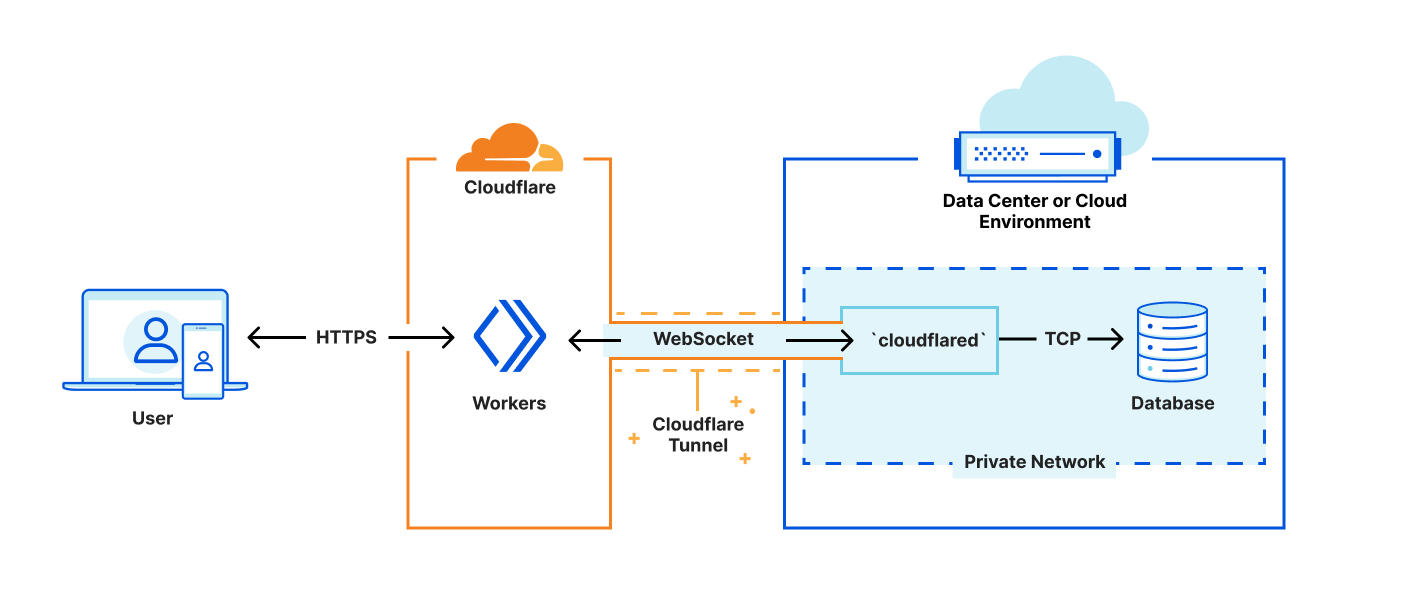
First, we’re leveraging cloudflared to create a secure tunnel between Cloudflare and a private network within your existing infrastructure. Cloudflared already supports proxying HTTP to TCP over WebSockets — Our challenge is providing interfaces that look like the socket interfaces existing libraries expect, while rewiring the implementations to redirect reads and writes to our websocket. This method is fast, safe, and secure; but limiting in that we lack control of where to direct the final connections. This is a problem we will solve soon, but until then our approach is essential to gathering latency and performance data to see where else we need to improve.
Next, we’ve created a shim-layer that adapts the socket API from a popular runtime to connect directly to databases using a WebSocket. This allows us to bundle code as-is, without forking or otherwise making significant changes to the database library. As part of this announcement, we’ve published a tutorial on how to connect to and query a Postgres database from your Workers, using existing Cloudflare technology and a driver from the growing community at Deno. We’re excited to work with the upstream maintainers, on expanding support.
Finally, we’re most excited for how this approach will let us begin to manage connection pooling and connection establishment overhead. While our current tech demo requires setting up the Cloudflare Tunnel on your own infrastructure, we’re looking for customers who’d like to pilot a model where Cloudflare hosts the tunnel for you.
Where we’re going
We’re just getting started. Our goal with today’s announcement is to find customers who are looking to build new applications or migrate existing applications to Workers while working with data that’s stored in a relational database.
Just as Cloudflare started by providing security, performance, and reliability for customer’s websites, we’re excited about a future where Cloudflare manages database connections, handles replication of data across cloud providers and provides low-latency access to data globally.
First, we’re looking to add support for TCP into the runtime natively. With native support for TCP we’ll not only have better support for databases, but expand the Workers runtime to work with data infrastructure more broadly.
Our position in the network layer of the stack makes providing performance, security benefits and extremely reduced egress costs to global databases all possible realities. To do so, we’ll repurpose the HTTP to TCP proxy service that we’ve currently built and run it for developers as a connection pooling service, managing connections to their databases on their behalf.
Finally, our network makes caching data and making it accessible globally at low latency possible. Once we have connections back to your data, making it globally accessible in Cloudflare’s network will unlock fundamentally new architectures for distributed data.
Take our connectors for a spin
Want to check things out? There are three main steps to getting up-and-running:
Deploying cloudflared within your infrastructure.
Deploying a database that connects to cloudflared.
Deploying a Worker with the database driver that submits queries.
With two weeks to go until Zabbix Summit 2021, we continue to introduce you to our guest speakers. Vittorio Cioe is already known to our community – he has participated in various Zabbix events, such as Zabbix summits and meetups. This year’s Zabbix Summit is not an exception. We asked Vittorio to tell us a few words about himself and introduce the presentation he will deliver on November 25th.
Hi Vittorio, we are happy to see you among the speakers this year! Would you mind please uncovering what your paper is about?
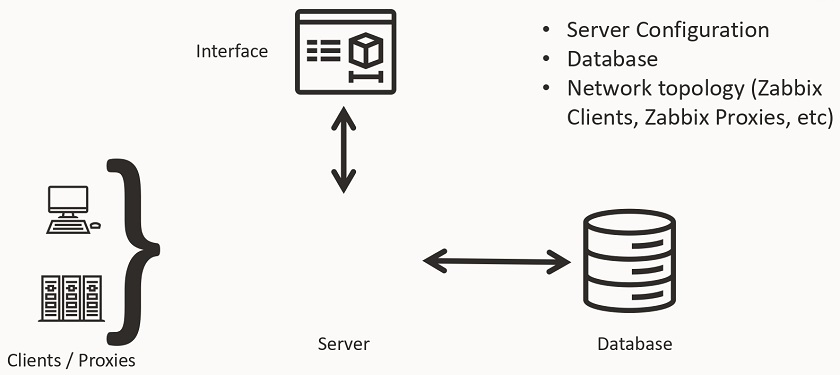
Hi, happy to be at Zabbix Summit also this year! This year I will cover a topic that is growing interest in the market as far as I can see: infrastructure as code, to create reusable deployment scripts. I will take as an example a Zabbix deployment on Oracle Cloud, using MySQL as a Service. I have decided to go this way because Oracle Cloud is very strong on the infrastructure as code side, and Zabbix it is very straightforward to automate.
You’re already familiar with many of our users and event attendees, but our community is growing, and new members are definitely interested in learning more about the speakers. Tell us please about yourself and your professional activities.
I originally come from Italy but relocated to Poland several years ago. Professionally I am a technology enthusiast, and in the past, I have been working the Security and Digital Transformation space. Finally, 4 years ago I landed at MySQL, which previously I have been a user of. This has been quite an incredible journey which put me in contact with some really amazing technology companies, and among those, Zabbix.
What role does Zabbix play in your professional activities?
Zabbix is one of the Oracle MySQL partners with which we have been able to establish cooperation and I really enjoy working with.
What do you think makes Zabbix stand out from other monitoring solutions?
I believe that the real strength of Zabbix is that the product is Open Source, and it brings the power of an enterprise-level monitoring solution to the broader public which normally could not afford it, giving a lot of companies the possibility of growing.
Have you already seen the summit program and the topics that will be covered? Which presentations would you be interested in hearing yourself?
There are some really great speeches this year! I would really like to listen to the speech of Alexei Vladishev (Zabbix 6.0 LTS – The next great leap in monitoring) and Sergey Sorokin (Take Advantage of Zabbix Services Online).
From this post and the video, you’ll learn about the possibilities of database monitoring using out-of-the-box Zabbix functionality without having to install additional tools, additional applications, or additional software that might not be allowed by your company.
ODBC stands for open database connectivity. There are a couple of ODBC drivers available for different database management systems (DBMS):
Oracle,
PostgreSQL,
MySQL,
Microsoft SQL Server,
Sybase ASE,
SAP HANA,
DB2.
All of these databases have different ODBCs specifically tailored for them. They offer slightly different functionality. So, even if you have set up the database monitoring for one database it might not necessarily work just as good for the other, as the functionality used to monitor one database might not exist for the other. In addition, as different technologies have different capabilities, most ODBC drivers do not implement all functionality defined in the ODBC standard.
What to monitor?
When we are planning to use ODBC for monitoring, what kind of data we can expect to receive? The answer ultimately depends on your own preferences, needs, or your proficiency in a specific database. You can monitor any possible database performance metrics and incidents using Zabbix templates.
Generally, monitoring of the following areas is of interest:
database performance
engine availability
configuration changes that you need to be aware of
To make the process easier, we provide ready-to-use templates, which can be applied to a host where your database is deployed. You can browse a full list of available metrics in these templates’ descriptions. So, you don’t have to perform configuration completely from scratch, which is good news.
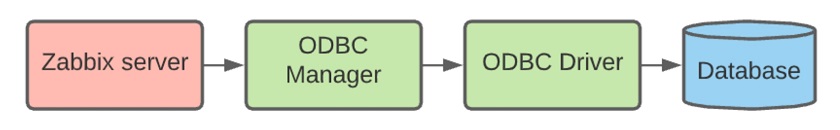
How does it work?
Without diving too deep into the transport layer and all of the technical details, the ODBC driver accesses the database over the network using the database API. So, there is no direct connection between Zabbix and the database. Zabbix only creates a query passed to the ODBC manager for processing, which then moves the request over to the ODBC driver that connects to the database management system and then executes the query. Here, Zabbix does not limit the query execution timeout, and the timeout parameter is used as the ODBC login timeout.
Chain of processes
ODBC configuration is based on two files:
odbc.ini — holds a list of installed ODBC database drivers, which are used for specific communication.
odbcinst.ini — holds the definitions of data sources so that we know to which database we are going to connect.
Where to start?
What do we need to do in order to start using this ODBC monitoring approach?
First, we will need to install the ODBC driver relevant to the database we are going to monitor. A simple yum command will suffice if we’re working with CentOS.
# yum -y install unixODBC unixODBC-devel
Then we need to specify the package (driver) we want to install and modify the ODBC driver files.
[root@localhost ~]# cat /etc/odbcinst.ini
[MySQL]
Description=ODBC for MySQL
Driver=/usr/lib/libmyodbc5.so
Setup=/usr/lib/libodbcmyS.so
Driver64=/usr/lib64/libmyodbc8a.so
Setup64=/usr/lib64/libmyodbc8a.so
FileUsage=1
Then we need to populate them with the necessary information. So, in this case, DSN (data source name) is used to call a specific connection. We need to get this part correctly, otherwise, the connection will not work out, for instance, in case of a typo.
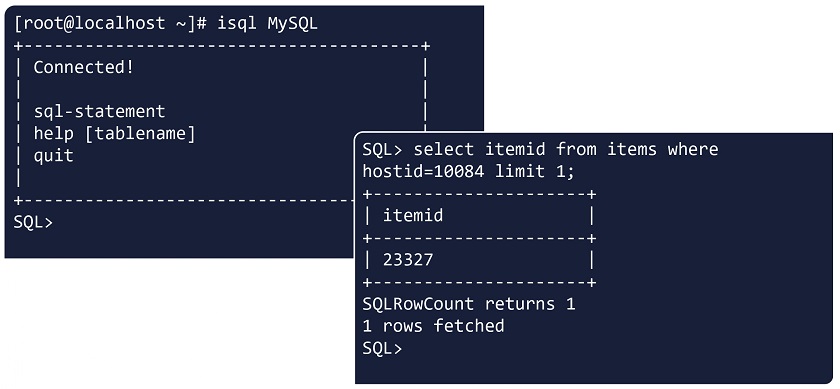
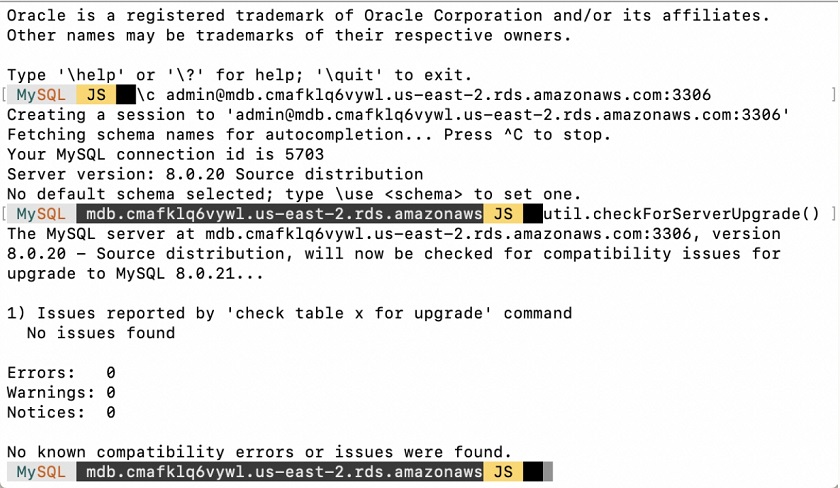
After we have installed the ODBC driver and configured the configuration files, we don’t really need to go ahead into Zabbix to create a new item and see if it works. We can test the ODBC configuration using isql to connect or at least attempt to connect to a particular database using the specified configuration.
Using isql to test ODBC configuration
If we receive an output that you have been connected then the communication is correct. You can also execute a sort of query, for instance, select some information from the database. If you get the result, then you do have the necessary permissions to access that data, and the connection, that is the ODBC driver, is working fine. Then you can proceed to the frontend.
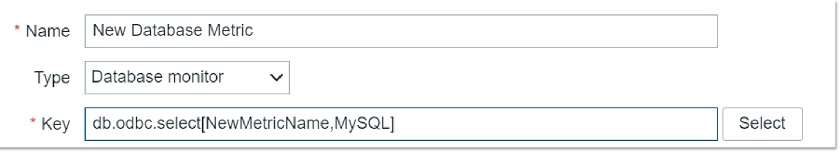
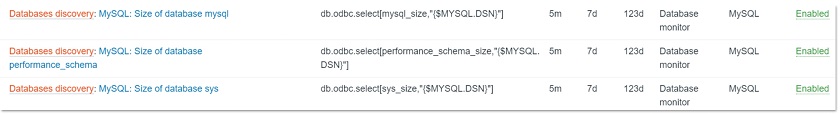
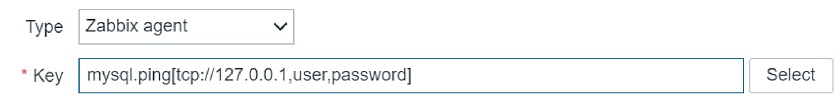
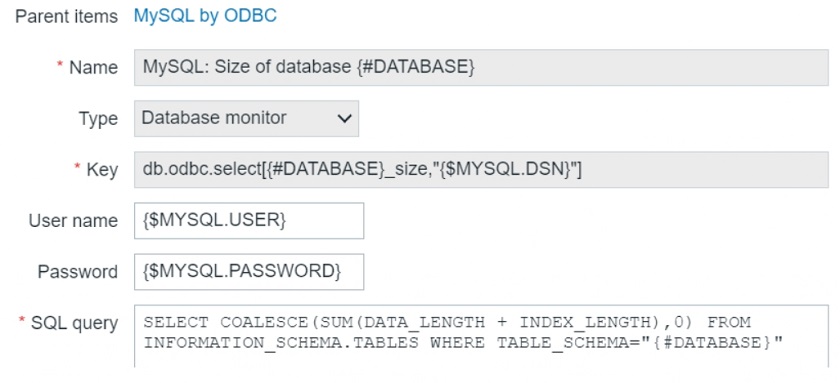
In the frontend, we will need to create an item of the ‘Database monitor’ type on a particular host or a template and specify one of the two keys available for ODBC monitoring: db.odbc.select or db.odbc.get.
Creating ‘Database monitor’ item
The difference between these item keys is pretty simple — select will return only one value and get will return values in bulk. So, get is more efficient and allows for reducing the load on the database if we are working with a lot of data. Within the key parameters, we need to specify the same DSN that we have defined in our odbc.ini file.
We need to make sure that the first parameter is unique so that this particular item key is unique and does not duplicate anything else, and the second parameter is the DSN.
After we have specified everything, we specify the query, which is a part of the item configuration.
We test the item using the test form in the Zabbix frontend. If the test form returns a value or does not return an error message, then everything is fine and we can proceed with this item or create more items.
Testing the item
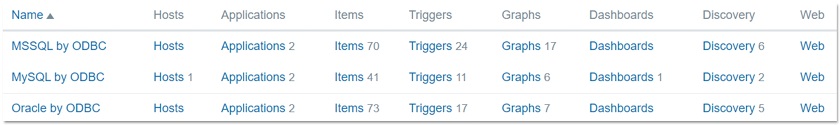
ODBC templates
There are a couple of built-in templates. If the metrics obtained through these templates are sufficient, we obviously don’t need to create these items from scratch or configure them. We can simply assign the templates we need to the host, on which we are monitoring the database. All we need to do is to tweak a little, if necessary, modify the macro related to the DSN, and then start monitoring.
Assigning a template
NOTE. The easiest way to get the templates is to upgrade to the latest Zabbix with our official templates already built in. If you don’t have the needed templates for any reason, you can download them from Zabbix official repository or Zabbix integrations. If you still need a specific template, you can definitely check out the community-created templates.
Finally, we can execute discovery rules:
and check the Latest data:
Synthetic MySQL monitoring
Synthetic MySQL monitoring approach is using capabilities of the Zabbix Agent. Though that is not something that Zabbix Agent is doing out of the box, still we don’t need to install anything or perform some super difficult manipulations to make it work as it is a part of Zabbix functionality.
As you might already know, the Zabbix Agent functionality can be extended using custom UserParameters and then used for database monitoring.
So, we can create new UserParameters, which invoke native MySQL administration client commands providing output, which can then be used to calculate performance metrics.
UserParameter=mysql.ping[*], mysqladmin -h"$1" -P"$2" ping
UserParameter=mysql.get_status_variables[*], mysql -h"$1" -P"$2" -sNX -e "show
global status"
UserParameter=mysql.version[*], mysqladmin -s -h"$1" -P"$2" version
UserParameter=mysql.db.discovery[*], mysql -h"$1" -P"$2" -sN -e "show
databases"
It is a good practice to test the commands themselves to make sure that they work and to test the UserParameter keys, for instance using the zabbix_get utility.
Then you might want to use our official MySQL monitoring template by creating an additional file .my.cnf under /var/lib/zabbix (default location) as follows:
[client]
user='zbx_monitor'
password='<password>'
Then we need to provide credentials for the user to confirm that the user has the necessary permissions to access the database.
If everything is working, assign MySQL by Zabbix agent template.
In this case, we are not actually logging in to the database. We execute commands from the terminal by using Zabbix Agent and extending the functionality beyond the built-in functions.
DB monitoring with Zabbix Agent 2
Why Zabbix Agent 2?
What are the benefits of Zabbix Agent 2 in relation to database monitoring?
Zabbix Agent 2 is the improved version of our original Zabbix Agent, which is now written in Go.
Zabbix Agent 2 is more efficient and supports some new functions that Zabbix Agent 1 does not, for instance, custom intervals with active checks as Zabbix Agent 2 is using the Scheduler plugin and is capable of keeping track of time when certain checks need to be executed;
Older configuration is also supported. So, if we switch from Zabbix Agent 1 to Zabbix Agent 2, we do not need to rewrite the whole configuration file in order for Zabbix Agent 2 to work.
Zabbix Agent 2 is installed simply with one-line command just like Zabbix Agent 1, we need just to specify a different package.
# yum -y install zabbix-agent2
Zabbix Agent 2 is based on plugins, so you do not need to install it with ODBC drivers, as plugins do the work, or anything extra as Zabbix Agent 2 has out-of-the-box database-specific plugins to monitor your database, including MySQL, Oracle, and PostgreSQL.
Plugins are also written in Go.
We have created Zabbix Agent 2-specific templates, which we can assign to the host. So, if you decide to use Zabbix Agent 2, you need to perform even fewer manipulations in order to get your database monitored by Zabbix.
Built-in Zabbix Agent 2 templates
Configuration
The configuration is very simple. We need to decide whether we specify the necessary parameters within the item keys or, if we prefer named sessions, we edit the configuration file of Zabbix Agent 2 to define those and use the session name as the first parameter of the key.
So, we specify the key according to the documentation page. In the first case, we can specify essentially the location of our database and provide the credentials.
In the second case, we simply need to provide the DSN in order to connect to the database using Zabbix Agent 2 built-in plugins.
Finally, you can definitely use low-level discovery for database monitoring. LLD is a very efficient and powerful tool within Zabbix. You can definitely use either built-in discovery keys, which utilize Zabbix Agent, or other sources such as custom scripts to pass the payload to your low-level discovery rule.
LLD:
Automatically creates items, triggers, and graphs from different entities on a host.
Parses data received in Zabbix-specific JSON format.
Different sources for LLD can be used, such as:
Built-in discovery keys,
Dependent on a built-in item key,
Dependent on a custom script/custom UserParameter.
Here we have a script providing our JSON-formatted payload, which is sent by the Data sender Zabbix utility to the Master trapper item within our Zabbix instance, while our LLD rule depends on this particular Master trapper item.
So, we just populate this trapper item with the JSON payload, LLD rule creates new entities based on the prototypes, and then the items created by those prototypes are collecting the data from that master trapper item each time a new payload comes in.
How to configure custom LLD?
In general, to create LLD from scratch:
First, you will need to decide on the actual payload delivery method (Zabbix Agent, script, Zabbix sender, or UserParameter).
Make sure that your payload is in JSON that is structurally sound so that Zabbix can accept and parse it.
Create LLD rule with type according to delivery method.
Test the rule (if available for passive checks) to see JSON you receive.
Create filters or overrides, if necessary.
Create prototypes, based on which your entities will be created.
If we don’t want to create LLD rules from scratch, we can definitely modify the built-in templates without wasting time creating custom LLD rules:
Modify/create new entities;
Clone the templates;
Refer to templated discovery rule configuration.
Modifying LLD rules of official templates
Questions & Answers
Question. Can we monitor the database using active checks or passive checks?
Answer. As I have mentioned, everything depends on your preferences and, ultimately, on the way you want to pass this output to Zabbix Server. If we’re talking about active checks, you can utilize Zabbix sender, for instance. So, it will be a trapper item on the Zabbix Server side waiting for data. In case of passive checks, we can use Zabbix Agent. So, we can use both types of checks for database monitoring.
Question. Can we establish a secure connection between the ODBC gateway and the database, which is somewhere on a distant machine?
Answer. Yes, this can be done though it does require a little bit of finesse. It is an extensive topic, and the security of the connection is highly dependent on the driver, which should support a secure connection. Some older databases might not have this functionality.
Question. Are ODBC checks influencing the performance of the master server?
Answer. It depends on what kind of data you are collecting. If you have a lot of items utilizing db.odbc.get item key, which retrieves just one value from the database, this might impact your database performance. You might not notice this impact if your hardware is powerful enough. However, it is advisable to use the odbc.select key in order to collect this information in bulk. Otherwise, you might be locking up some entries within your database that could potentially lead to problems.
Question. So, we provide two solutions with one of them using ODBC agentless checks ODBC. In addition, we have the agent tool. Will you briefly describe the advantages of ODBC and Agent checks?
Answer. If we’re talking about the ODBC database monitoring method, the most obvious difference is that you don’t need to install an agent. From the data collection perspective, there is not much difference. Everything depends on your specific needs.
In this post and the video, you will learn about a proper approach to getting the most out of Zabbix and optimizing the underlying MySQL Database configuration to improve performance while working with a database-intensive application such as Zabbix.
Zabbix and MySQL love each other. Half of the Zabbix installations are running on MySQL. However, Zabbix is quite a write-intensive application, so we need to optimize the database configuration and usage to work smoothly with Zabbix that reads the database and writes to the database a lot.
Optimizing MySQL for Zabbix
Balancing the load on several disks
So, how can we optimize MySQL configuration to work with Zabbix? First of all, it is very important to balance the load on several hard drives by using:
datadir to specify the default location, that is to dedicate the hard drives to the data directory;
datadir innodb_data_file_path to define size, and attributes of InnoDB system tablespace data files;
innodb_undo_directory to specify the path to the InnoDB undo tablespaces;
innodb_log_group_home_dir to specify the path to the InnoDB redo log files;
log-bin to enable binary logging and set path/file name prefix (dual functionality); and
tmpdir (Random, SSD, tmpfs).
The key here is to split the load as much as possible across different hard drives in order to avoid different operations fighting for resources.
Viewing your MySQL configuration
Now, we can jump straight to MySQL configuration. It is important to start from your current configuration and check who and when has changed this configuration.
SELECT t1.*, VARIABLE_VALUE FROM performance_schema.variables_info t1 JOIN
performance_schema.global_variables t2 ON t2.VARIABLE_NAME=t1.VARIABLE_NAME WHERE
t1.VARIABLE_SOURCE not like "COMPILED"
This query can help you to understand who has changed the configuration. However, when the configuration is changing is also important to keep track of these changes.
Viewing MySQL configuration
MySQL key variables to optimize in your configuration
InnoDB buffer pool
The king of all of the variables to be optimized is InnoDBbuffer pool, which is the main parameter determining the memory for storing the DB pages — MySQL buffer pool — an area in main memory MySQL where InnoDB caches table and index data as it is accessed.
InnoDB default value is to log, for production 50-75% of available memory on the dedicated database server.
Since MySQL 5.7, innodb_buffer_pool_size can be changed dynamically.
Judging from experience, 50 percent of available memory will be enough for the majority of databases with a lot of connections or activities, as many other indicators are used, which occupy memory. So, 50 percent is a good though conservative parameter.
To check InnoDB Buffer Pool usage (in %) and if you need to allocate more memory for the InnoDB Buffer Pool, you can use the query, which allows you to see the current usage as a percentage (though there are many queries to monitor the InnoDB Buffer Pool).
SELECT CONCAT(FORMAT(DataPages*100.0/TotalPages,2),
' %') BufferPoolDataPercentage
FROM (SELECT variable_value DataPages FROM information_schema.global_status
WHERE variable_name = 'Innodb_buffer_pool_pages_data') A,
(SELECT variable_value TotalPages FROM information_schema.global_status
WHERE variable_name = 'Innodb_buffer_pool_pages_total') B;
Binary logs
Binary logs contain events that describe changes, provide data changes sent to replicas, and are used for data recovery operations.
If you work with replication, you might know that binary logs require special attention apart from having them on a separate disk. You should size the binary logs properly, set the proper expiration time (1 month by default), and the maximum size, for instance, of 1 GB so that you will be able to write 1 GB of data per day.
We can have about 30 log files in the binary logs. However, you should check the activities of your system to consider increasing this number, as well as the expiration of the binary logs, if you need to keep more data for operations, such as finding time recovery, for instance.
How to control binary logs:
log_bin, max_binlog_size, binlog_expire_logs_seconds, etc.
PURGE BINARY LOGS TO|BEFORE to delete all the binary log files listed in the log index file prior to the specified log file name or date.
In addition, consider using GTID for replication to keep track of transactions.
InnoDB redo logs
This is yet another beast, which we want to keep control of — the redo and undo logs, which get written prior to flushing the data to the disk.
innodb_log_file_size
– The size of redo logs will impact the writing speed over the time to recover.
– The default value is too low, so consider using at least 512 MB for production.
– Total redo log capacity is determined by innodb_log_files_in_group (default value 2). For write-intensive systems, consider increasing innodb_log_files_in_group and keeping them on in a separate disk.
NOTE. Here, the related parameters are innodb_log_file_size and innodb_log_files_in_group.
Trading performance over consistency (ACID)
Associated with the redo and undo log discussion is the trading performance over consistency discussion about when InnoDB should flush/sync committed truncations.
innodb_flush_log_at_trx_commit defines how ofter InnoDB flushes the logs to the disk. This variable can have different values:
0 — transactions are written to redo logs once per second;
1 — (default value) fully ACID-compliant with redo logs written and flushed to disk at transaction commit;
2 — transactions are written to redo logs at commit, and redo logs are flushed once per second.
If the system is write-intensive, you might consider setting this value to 2 to keep redo logs at every commit with the data written to disk once per second. This is a very good compromise between data integrity and performance successfully used in a number of write-intensive setups. This is a relief for the disk subsystem allowing you to gain that extra performance.
NOTE. I recommend using default (1) settings unless you are bulk-loading data, set session variable to 2 during load, experiencing an unforeseen peak in workload (hitting your disk system) and need to survive until you can solve the problem, or you use the latest MySQL 8.0. You can also disable redo-logging completely.
table_open_cache and max_connections
Opening the cache discussions, we will start from the max_connections parameter, which sets the maximum number of connections that we want to accept on the MySQL server, and the table_open_cache parameter, which sets the value of the cache of open tables we want to keep. Both parameters affect the maximum number of files the server keeps open:
table_open_cache value — 2,000 (default), which means that by default you can keep 2,000 tables open per connection.
max_connectionsvalue — 151 (default).
If you increase both values too much, you may easily run out of memory. So, the total number of open tables in MySQL is:
N of opened tables = N of connections x N (max number of tables per join)
NOTE. This number is related to the joins operated by your database per connection.
So, having an insight into what Zabbix does and which queries it executes can help you fine-tune this parameter. In addition, you can go by the rule of thumb checking if the table_open_cache sheets are full. To do that, you can check the global status like ‘opened_tables‘ to understand what is going on.
In addition, if you are going to increase the table up and cache on the maximum number of connections, you can check open_files_limit in MySQL and ulimit — the maximum number of open files in the operating system, as new connections are kept as open files in Linux. So, this is a parameter to fine-tune as well.
Open buffers per client connection
There are other buffers that depend on the number of connections (max_connections), such as:
read_buffer_size,
read_rnd_buffer_size,
join_buffer_size,
sort_buffer_size,
binlog_cache_size (if binary logging is enabled),
net_buffer_length.
Depending on how often you get connections to the Zabbix database, you might want to increase these parameters. It is recommended to monitor your database to see how these buffers are being filled up.
You also need to reserve some extra memory for these buffers if you have many connections. That is why it is recommended to reserve 50 percent of available memory for InnoDB buffer pool, so that you can use these spare 25 percent for extra buffers.
However, there might be another solution.
Enabling Automatic Configuration for a Dedicated MySQL Server
In MySQL 8.0, innodb_dedicated_server automatically configures the following variables:
innodb_buffer_pool_size,
innodb_log_file_size,
innodb_log_files_in_group, and
innodb_flush_method.
I would enable this variable as it configures the innodb_flush_ method which has a dependency with the file system.
NOTE. Enabling innodb_dedicated_server is not recommended if the MySQL instance shares system resources with other applications, as this variable enabled implicitly means that we are running only MySQL on the machine.
Conclusion
Now, you are ready to fine-tune your configuration step by step, starting from innodb_buffer_pool, max_connections, and table_open_cache, and see if your performance improves. Eventually, you can do further analysis and go further to really fine-tune your system up to your needs.
In general, 3-5 core parameters would be enough for operating with Zabbix in the vast majority of cases. If you tune those parameters keeping in mind dealing with a write-intensive application, you can achieve good results, especially if you separate the resources at a hardware level or at a VM level.
Performance tuning dos and don’ts
For a high-level performance tuning 101, think carefully and consider the whole stack together with the application.
In addition, think methodically:
define what you are trying to solve, starting from the core of variables, which you want to fine-tune;
argue why the proposed change will work;
create an action plan; and
verify the change worked.
To make things work:
— don’t micromanage;
— do not optimize too much;
— do not optimize everything; and, most importantly,
— do not take best practices as gospel truth, but try to adjust any practices to your particular environment.
If you are tired of administering the infrastructure on your own and would prefer to gain time to focus on real monitoring activities rather than costly platform upgrades, you can easily lift and shift your MySQL-based Zabbix installation stack to Oracle Cloud.
The data is increasingly moving to the cloud — the consumer data followed by the enterprise data, as enterprises are always a bit slower in adopting technologies.
Data moving to the cloud
Oracle Cloud Infrastructure, OCI, is the 4th cloud provider in the Cloud Infrastructure Ranking of the Gartner Magic Quadrant based on ‘Completeness of Vision’ and ‘Ability to Execute’.
OCI is available in 26 regions and has 26 data centers across the world with 12 more planned.
26 Regions Live, 12+ Planned
24+ Industry and Regional Certifications
Moving Zabbix to Oracle Cloud
With Zabbix in the Oracle Cloud you can:
get the latest updates on the technology stack, minimizing downtime and service windows.
convert the time you spend managing your monitoring platform into the time you spend monitoring your platforms.
leverage the most secure and cost-effective cloud platform in the market, including security information and security updates made available by OCI.
Planning migration
To plan effective migration of the on-premise Zabbix instance with clients, proxies, management server, interface, and database, we need to migrate the last three instance components. Basically, we need:
the server configuration;
on-premise network topology to understand what can communicate with the outside or what would eventually go over VPN, that is, the network topology of client and proxies; and
the database.
Migration requirements
We also need to set up the following in the OCI tenancy:
MySQL Database System,
Compute instance for the Zabbix Server,
storage for database and backup,
networking/load balancing.
The target architecture involves setting up the VPN from your data center to the Oracle cloud tenancy and deploying the load balancer, the Zabbix server in redundancy over availability domains, and the MySQL database in a separate subnet.
Required Components:
• Cloud Networking,
• Zabbix Cloud Image,
• MySQL Database Service,
• VPN Connection for client/proxies.
Oracle Cloud target architecture for Zabbix
You can also have a lighter setup, for instance, with proxies communicating over TLS connections over the Internet or communicating directly with the Zabbix Server in the Oracle Cloud, and the Zabbix server interfacing with the database. Here, you will need fewer elements: server, database, and VCN.
Oracle Cloud target architecture for Zabbix — a simpler solution
Migrating Zabbix to Oracle Cloud
Zabbix migration to the Oracle Cloud is straightforward.
1. Before you begin:
set up tenancy and compartments,
set up cloud networking — public and private VCN.
2. Zabbix deployment on the VM:
select one-click deployment or DIY — use the official Zabbix OCI Marketplace Image or deploy an OCI Compute Instance and install manually,
choose the desired Compute ‘shape’ during deployment.
3. Configuration:
start the instance,
edit the config file,
point to the database with the IP address, username, and password (to do that, you’ll need to open several ports in the cloud network via the GUI).
The OCI infrastructure allows for multiple choices. The Zabbix Server is lightweight software requiring resources. In the majority of cases, a powerful VM will be enough. Otherwise, you’ll have the Oracle Cloud available.
Compute services for any enterprise use case
In the Oracle Cloud you’ll have the bare metal option — the physical machines dedicated to a single customer, Kubernetes container engine, and a lot of fast storage possibilities, which end up being quite cheap.
Migrating the database to MySQL Database Service
MySQL Database Service is the managed offer for MySQL in Oracle Cloud, fully developed, managed, and supported by the MySQL team. It is secure and provides the latest features as it leverages the Oracle Cloud, which has been rated by various sources as one of the most secure cloud platforms.
In addition, the platform is built on the MySQL Enterprise Edition binaries, so it is fully compatible with the platform you might be using. Finally, it costs way less on a yearly basis than a full-blown on-premise MySQL Enterprise subscription.
MySQL Database Service — 100% developed, managed, and supported by the MySQL team
Considerations before migration
Before you begin:
check your MySQL 8.0 compatibility,
check your database size (to assess the time needed to migrate), and
plan a service window.
High-level migration plan
Set up cloud networking.
Set up your (on-premise) networking secure connection (to communicate with the cloud).
Create MySQL Database Service DB System with storage.
Move the data using MySQL Shell Dump & Load utility.
Creating MySQL DB system with just a few clicks
Create a customized configuration.
Start the wizard to create DB system.
Select Virtual Cloud Network (VCN).
Select subnet to place your MySQL endpoint.
Select MySQL configuration (or create customized instances for your workload).
The shape for the DB System (CPU and RAM) will be set automatically.
Select the size of the storage for data and backup.
Create a backup policy or accept the default.
Creating MySQL instances
You can use MySQL Shell Upgrade Checker Utility to check the compatibility with MySQL8.0.
util.checkForServerUpgrade()
Loading the data
To move the data, you can use the MySQL Shell Dump & Load utility, which is capable of multi-threading and is callable with the JavaScript methods from MySQL Shell.
So, you can dump on what can be a bastion machine, and load your instance to the cloud. It will take several minutes to load the database of several gigabytes, so it is necessary to plan the service maintenance window accordingly.
In addition, the utility is easy to use. You just need to connect to an instance and dump.
MySQL Shell Dump & Load
The operation is pretty straightforward and the migration time will depend on the size of the database.
Free trial
You can have a test drive of the MySQL Database Service with $300 in cloud credits, which you can spend in the Oracle Cloud on MySQL Database Service or other cloud services.
Questions & Answers
Question. Do you help with migrating the databases from older versions to MySQL 8.0?
Answer. Yes, this is the thing we normally do for our customers — providing guidance, though data migration is normally straightforward.
Question. Does the database size matter? How efficient MySQL Shell Dump is? What if my database is terabytes in size?
Answer. MySQL Shell Dump & Load utility is much more efficient than what MySQL Dump used to be. The database size still matters. In that case, it will require more time, still way less than it used to take
The collective thoughts of the interwebz
Manage Consent
To provide the best experiences, we use technologies like cookies to store and/or access device information. Consenting to these technologies will allow us to process data such as browsing behavior or unique IDs on this site. Not consenting or withdrawing consent, may adversely affect certain features and functions.
Functional
Always active
The technical storage or access is strictly necessary for the legitimate purpose of enabling the use of a specific service explicitly requested by the subscriber or user, or for the sole purpose of carrying out the transmission of a communication over an electronic communications network.
Preferences
The technical storage or access is necessary for the legitimate purpose of storing preferences that are not requested by the subscriber or user.
Statistics
The technical storage or access that is used exclusively for statistical purposes.The technical storage or access that is used exclusively for anonymous statistical purposes. Without a subpoena, voluntary compliance on the part of your Internet Service Provider, or additional records from a third party, information stored or retrieved for this purpose alone cannot usually be used to identify you.
Marketing
The technical storage or access is required to create user profiles to send advertising, or to track the user on a website or across several websites for similar marketing purposes.