Post Syndicated from Sheila Busser original https://aws.amazon.com/blogs/compute/optimizing-amazon-ec2-spot-instances-with-spot-placement-scores/
This blog post is written by Steve Cole, Principal Specialist SA, and Robert McCone, Sr. Specialist SA.
Getting the compute resources you need, even vCPUS numbering in the millions, and completing a workload using Amazon EC2 Spot Instances is just a configuration away. In this post you will learn how to use Spot placement scores to reduce interruptions, acquire greater capacity, and identify optimal configurations, times, and locations to run workloads on Spot Instances. Amazon EC2 Spot Instances let you take advantage of unused EC2 capacity in the AWS cloud and are available at up to a 90% discount compared to On-Demand prices. Spot placement scores is a feature that many customers use to identify optimal instance types or to choose the best Availability Zone (AZ) for ephemeral work like data analytics or high-performance computing. As a real-time tool, Spot placement scores are often integrated into deployment automation. However, because of its logging and graphic capabilities, you may find it be a valuable resource even before you launch a workload into the cloud. Now available through AWS Labs, a Github repository hosting tools for customers, the Spot placement score tracker tackles the undifferentiated heavy lifting and can do this for any customer.
About Spot placement score
Spot placement scores are a feature available through AWS APIs – also implemented in the Amazon EC2 Spot requests console – that uses internal capacity and interruption data to scrutinize the size and shape of a Spot Instance request and responds with a “likelihood of success” rating of 1 to imply lower likelihood of success and 10 to imply higher likelihood of success. The score represents confidence in being able to acquire the desired capacity (size) using the instance configuration (shape) for the next few hours. The shape of the request can be a list of specific instances or can be requirements-based with attribute-based instance type selection. The size of the request can be instance count, number of vCPUs, or GB of RAM. It’s based on known capacity, allocation strategies, and the trending of capacities over time.
Before the release of Spot placement score, customers could track the trends of their existing workloads and configurations. This might have helped them to anticipate capacity constraints over time, but the ability to do something more meaningful when assessing configurations was something customers requested often. With the launch of Spot placement score, that capability was delivered and enabled customers to receive guidance on how a configuration change might affect the effectiveness of Spot Instances in a workload.
Customers immediately recognized the power of this new feature and started writing tooling around their workloads to incorporate the new functionality provided by Spot placement scores. For examples, customers leveraged Spot placement scores to find the highest scoring AZ in a region for work that requires low latency within a cluster. Customers running data analytics with services like Amazon EMR could more confidently launch clusters on Spot Instances. This reduces costs and the time necessary to process data because of fewer interruptions. Financial customers, health care and life sciences, and high tech were some of the early adopters of this strategy.
Benefits of Spot placement scores
One specific customer used tools like the Spot instance advisor and Spot pricing history tools to make decisions about what instances to run every night. If the customer’s analytics workload received too many interruptions, then it would inevitably be relaunched using On-Demand Instances, increasing costs and time-to-complete. The addition of Spot placement scores to the customer’s tooling allowed for more informed decisions about which configurations worked best and, more specifically, which AZ(s) to use. Ultimately, this led not only to higher confidence in using Spot instances, but also to significant cost savings over time.
Other customers tracked Spot placement scores over time with regular queries stored in time series databases to identify not only the best configuration or location, but also the best time-of-day or day-of-week to run their workloads. Different configurations of instance types were queried through automation and the results were logged into a time series database that could then be presented as graphs. These graphs were scrutinized, configurations were tuned, and ultimately these customers could take greater advantage of the cost optimization that Spot instances offer through fewer interruptions by running their workloads where and when scores were higher.
AWS was interested in how this solved problems for customers, and after some more research with customers and design ideation, led to the creation of an OSS tool that AWS has recently released: Spot placement score tracker. Spot placement score tracker helps customers evaluate different configurations against multiple times and locations. It’s an AWS-native solution that leverages the Spot placement score API along with AWS Lambda and Amazon CloudWatch to create a dashboard that enables any AWS customer to benefit from this model without having to write it themselves.
How to use the Spot placement score tracker
The project provides Infrastructure as Code (IaC) automation using the AWS Cloud Development Kit (AWS CDK) to deploy the infrastructure and permissions required to run Lambda. This gets executed every five minutes to collect the placement scores of as many diversified configurations as defined.

After installing the CloudWatch dashboard, and given some time to collect and record data, you will be provided valuable insights in an intuitive graph such as those in the following example.
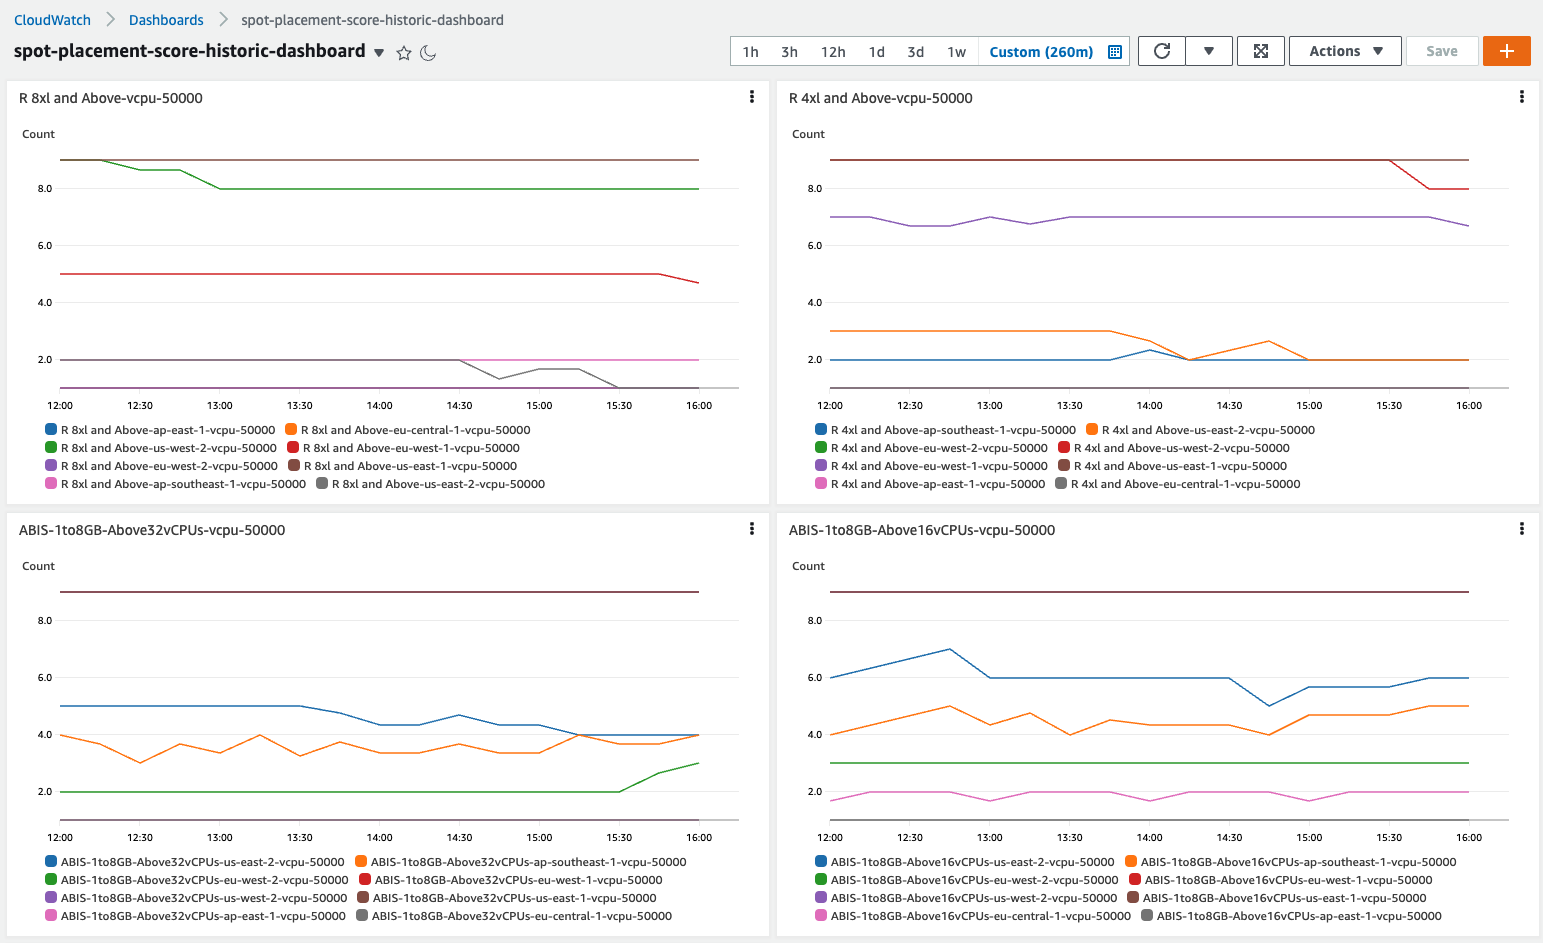
Insights available through the Spot placement score tracker
The first thing you may notice by observing data over time is that instance diversification is the primary driver of high placement scores. This has always been a best practice for the use of Spot Instances, and it extends to On-Demand Instances as well. In short, if you can only run on one instance type, then the likelihood of experiencing interruptions is far greater than if you can run on six or twelve. Sometimes the simple inclusion of -a, -d, and -n instance types (e.g. m5.large, m5a.large, m5d.large, m5d.large), previous generations (e.g., m5.large, m4.large), different sizes in a container environment (e.g., m5.large, m5.xlarge, m5.2xlarge), and even the inclusion of AWS Graviton will have a material impact on placement scores, which equates to fewer interruptions. This ultimately leads to more efficient use of resources through less restarted processes, resulting in increased efficiency and reduced costs.
The second insight that you can realize through the use of placement scores over time is identifying the optimal AZ in which an ephemeral process can be placed. Perhaps the best use case for this type of insight is data analytics clusters that are launched to complete many calculations overnight. This is common in financial institutions for various reasons including risk analysis and compliance, but could apply to medical research examining results of experiments during the day as well as other situations where a 24/7 presence isn’t required by the workload. These customers are typically using a single AZ to allow for faster communication between nodes and to reduce data transfer costs. Therefore, the ability for Spot placement scores to provide different scores for different AZs is highly advantageous.
Third, with access to placement scores over time, it becomes possible to identify exactly how large a workload’s footprint can be. By submitting identical configurations to Spot placement scores but with different sizes, you can surface the ideal workload size. Not too small, where perhaps the job takes too long to complete, but also not so large that the interruptions are too frequent and cause restarts too often. This can benefit not only ephemeral workloads, but also persistent clusters or fleets by understanding what the lowest score would be over time and giving you solid information regarding what they can expect from Spot Instances and where. This might inform you to be ready to launch On-Demand Instances to compensate when Spot Instance availability is lower. This can also help to forecast pricing and inform decisions about the consideration of AWS Savings Plans or On-Demand Capacity Reservations.
Finally, analyzing Spot placement scores over time can provide regional scoring. Through this lens it’s possible for you to identify entire regions that they may have overlooked without the knowledge that Spot Instances outside the your primary region(s) might offer lower interruptions during daylight hours due to them being off-peak. When it’s possible to place a workload in another region, unconstrained by local data access requirements, it’s quite possible to harness the compute of a significant footprint in locations that are otherwise un(der)-utilized. Workloads that require less data transfer and more compute can benefit tremendously from access to Spot Instances in other regions. For example, things like build servers might run extraordinarily well in Europe during North American business hours and the reduction in compute cost might offset the data transfer to complete the job.
Conclusion
Spot placement scores can be used to make decisions about how, when, and where Spot Instances can be most efficiently utilized to deliver business needs, and at greatly reduced prices. We’re very excited to release this tool to enable you to tap into information which was previously unavailable and make data-driven decisions for your business. The information in this post, combined with the output of placement scores over time, is a significant evolution.
Install the Spot placement score tracker today, configure it to match an existing Spot workload, and see how you might perform at different times or different locations. Explore more robust options and discover greater capacity and lower interruptions. Or investigate how On-Demand workloads could migrate to Spot Instances.