Post Syndicated from Leonardo Gomez original https://aws.amazon.com/blogs/big-data/amazon-datazone-introduces-openlineage-compatible-data-lineage-visualization-in-preview/
We are excited to announce the preview of API-driven, OpenLineage-compatible data lineage in Amazon DataZone to help you capture, store, and visualize lineage of data movement and transformations of data assets on Amazon DataZone.
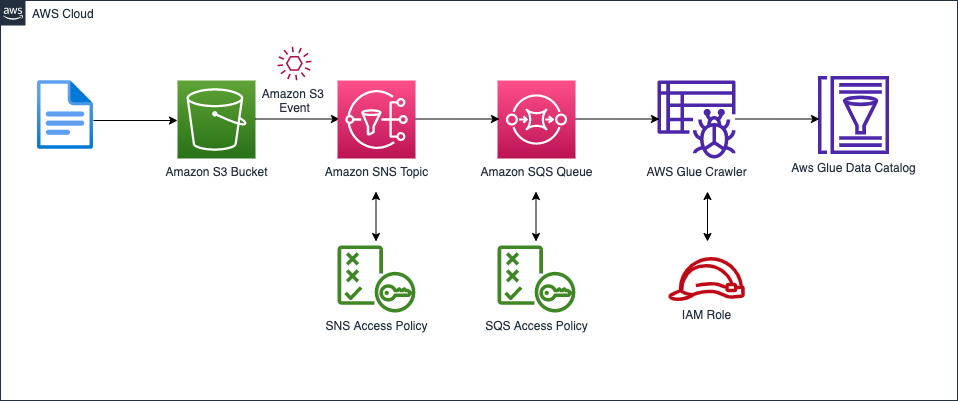
With the Amazon DataZone OpenLineage-compatible API, domain administrators and data producers can capture and store lineage events beyond what is available in Amazon DataZone, including transformations in Amazon Simple Storage Service (Amazon S3), AWS Glue, and other AWS services. This provides a comprehensive view for data consumers browsing in Amazon DataZone, who can gain confidence of an asset’s origin, and data producers, who can assess the impact of changes to an asset by understanding its usage.
In this post, we discuss the latest features of data lineage in Amazon DataZone, its compatibility with OpenLineage, and how to get started capturing lineage from other services such as AWS Glue, Amazon Redshift, and Amazon Managed Workflows for Apache Airflow (Amazon MWAA) into Amazon DataZone through the API.
Why it matters to have data lineage
Data lineage gives you an overarching view into data assets, allowing you to see the origin of objects and their chain of connections. Data lineage enables tracking the movement of data over time, providing a clear understanding of where the data originated, how it has changed, and its ultimate destination within the data pipeline. With transparency around data origination, data consumers gain trust that the data is correct for their use case. Data lineage information is captured at levels such as tables, columns, and jobs, allowing you to conduct impact analysis and respond to data issues because, for example, you can see how one field impacts downstream sources. This equips you to make well-informed decisions before committing changes and avoid unwanted changes downstream.
Data lineage in Amazon DataZone is an API-driven, OpenLineage-compatible feature that helps you capture and visualize lineage events from OpenLineage-enabled systems or through an API, to trace data origins, track transformations, and view cross-organizational data consumption. The lineage visualized includes activities inside the Amazon DataZone business data catalog. Lineage captures the assets cataloged as well as the subscribers to those assets and to activities that happen outside the business data catalog captured programmatically using the API.
Additionally, Amazon DataZone versions lineage with each event, enabling you to visualize lineage at any point in time or compare transformations across an asset’s or job’s history. This historical lineage provides a deeper understanding of how data has evolved, which is essential for troubleshooting, auditing, and enforcing the integrity of data assets.
The following screenshot shows an example lineage graph visualized with the Amazon DataZone data catalog.

Introduction to OpenLineage compatible data lineage
The need to capture data lineage consistently across various analytical services and combine them into a unified object model is key in uncovering insights from the lineage artifact. OpenLineage is an open source project that offers a framework to collect and analyze lineage. It also offers reference implementation of an object model to persist metadata along with integration to major data and analytics tools.
The following are key concepts in OpenLineage:
- Lineage events – OpenLineage captures lineage information through a series of events. An event is anything that represents a specific operation performed on the data that occurs in a data pipeline, such as data ingestion, transformation, or data consumption.
- Lineage entities – Entities in OpenLineage represent the various data objects involved in the lineage process, such as datasets and tables.
- Lineage runs – A lineage run represents a specific run of a data pipeline or a job, encompassing multiple lineage events and entities.
- Lineage form types – Form types, or facets, provide additional metadata or context about lineage entities or events, enabling richer and more descriptive lineage information. OpenLineage offers facets for runs, jobs, and datasets, with the option to build custom facets.
The Amazon DataZone data lineage API is OpenLineage compatible and extends OpenLineage’s functionality by providing a materialization endpoint to persist the lineage outputs in an extensible object model. OpenLineage offers integrations for certain sources, and integration of these sources with Amazon DataZone is straightforward because the Amazon DataZone data lineage API understands the format and translates to the lineage data model.
The following diagram illustrates an example of the Amazon DataZone lineage data model.

In Amazon DataZone, every lineage node represents an underlying resource—there is a 1:1 mapping of the lineage node with a logical or physical resource such as table, view, or asset. The nodes represent a specific job with a specific run, or a node for a table or asset, and one node for a subscription target.
Each version of a node captures what happened to the underlying resource at that specific timestamp. In Amazon DataZone, lineage not only shares the story of data movement outside it, but it also represents the lineage of activities inside Amazon DataZone, such as asset creation, curation, publishing, and subscription.
To hydrate the lineage model in Amazon DataZone, two types of lineage are captured:
- Lineage activities inside Amazon DataZone – This includes assets added to the catalog and published, and then details about the subscriptions are captured automatically. When you’re in the producer project context (for example, if the project you’re selected is the owning project of the asset you are browsing and you’re a member of that project), you will see two states of the dataset node:
- The inventory asset type node defines the asset in the catalog that is in an unpublished stage. Other users can’t subscribe to the inventory asset. To learn more, refer to Creating inventory and published data in Amazon DataZone.
- The published asset type represents the actual asset that is discoverable by data users across the organization. This is the asset type that can be subscribed by other project members. If you are a consumer and not part of the producing project of that asset, you will only see the published asset node.
- Lineage activities outside of Amazon DataZone can be captured programmatically using the PostLineageEvent With these events captured either upstream or downstream of cataloged assets, data producers and consumers get a comprehensive view of data movement to check the origin of data or its consumption. We discuss how to use the API to capture lineage events later in this post.
There are two different types of lineage nodes available in Amazon DataZone:
- Dataset node – In Amazon DataZone, lineage visualizes nodes that represent tables and views. Depending on the context of the project, the producers will be able to view both the inventory and published asset, whereas consumers can only view the published asset. When you first open the lineage tab on the asset details page, the cataloged dataset node will be the starting point for lineage graph traversal upstream or downstream. Dataset nodes include lineage nodes automated from Amazon DataZone and custom lineage nodes:
- Automated dataset nodes – These nodes include information about AWS Glue or Amazon Redshift assets published in the Amazon DataZone catalog. They’re automatically generated and include a corresponding AWS Glue or Amazon Redshift icon within the node.
- Custom dataset nodes – These nodes include information about assets that are not published in the Amazon DataZone catalog. They’re created manually by domain administrators (producers) and are represented by a default custom asset icon within the node. These are essentially custom lineage nodes created using the OpenLineage event format.
- Job (run) node – This node captures the details of the job, which represents the latest run of a particular job and its run details. This node also captures multiple runs of the job and can be viewed on the History tab of the node details. Node details are made visible when you choose the icon.
Visualizing lineage in Amazon DataZone
Amazon DataZone offers a comprehensive experience for data producers and consumers. The asset details page provides a graphical representation of lineage, making it straightforward to visualize data relationships upstream or downstream. The asset details page provides the following capabilities to navigate the graph:
- Column-level lineage – You can expand column-level lineage when available in dataset nodes. This automatically shows relationships with upstream or downstream dataset nodes if source column information is available.
- Column search – If the dataset has more than 10 columns, the node presents pagination to navigate to columns not initially presented. To quickly view a particular column, you can search on the dataset node that lists just the searched column.
- View dataset nodes only – If you want filter out the job nodes, you can choose the Open view control icon in the graph viewer and toggle the Display dataset nodes only This will remove all the job nodes from the graph and let you navigate just the dataset nodes.
- Details pane – Each lineage node captures and displays the following details:
- Every dataset node has three tabs: Lineage info, Schema, and History. The History tab lists the different versions of lineage event captured for that node.
- The job node has a details pane to display job details with the tabs Job info and History. The details pane also captures queries or expressions run as part of the job.
- Version tabs – All lineage nodes in Amazon DataZone data lineage will have versioning, captured as history, based on lineage events captured. You can view lineage at a selected timestamp that opens a new tab on the lineage page to help compare or contrast between the different timestamps.
The following screenshot shows an example of data lineage visualization.

You can experience the visualization with sample data by choosing Preview on the Lineage tab and choosing the Try sample lineage link. This opens a new browser tab with sample data to test and learn about the feature with or without a guided tour, as shown in the following screenshot.

Solution overview
Now that we understand the capabilities of the new data lineage feature in Amazon DataZone, let’s explore how you can get started in capturing lineage from AWS Glue tables and ETL (extract, transform, and load) jobs, Amazon Redshift, and Amazon MWAA.
The getting started scripts are also available in Amazon DataZone’s new GitHub repository.
Prerequisites
For this walkthrough, you should have the following prerequisites:
- An AWS account
- An AWS Identity and Access Management (IAM) user with access to the following services:
- AWS Cloud9
- AWS CloudFormation
- AWS CloudShell
- Amazon DataZone
- AWS Glue
- Amazon S3
- An Amazon DataZone domain
- An Amazon DataZone project, with a data lake environment created
If the AWS account you use to follow this post uses AWS Lake Formation to manage permissions on the AWS Glue Data Catalog, make sure that you log in as a user with access to create databases and tables. For more information, refer to Implicit Lake Formation permissions.
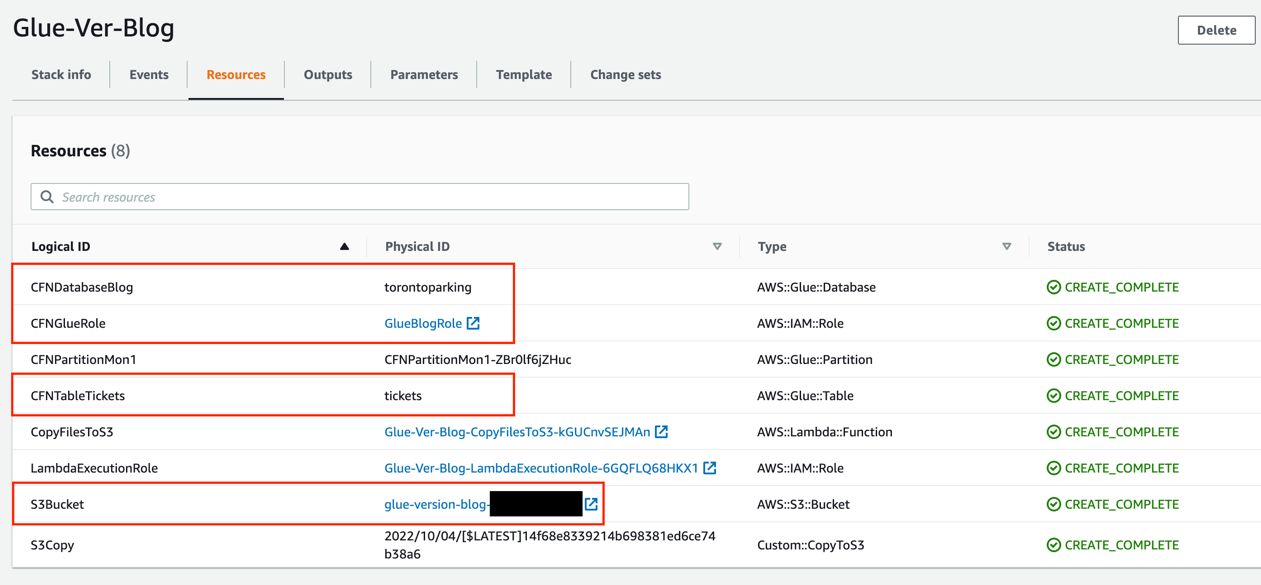
Launch the CloudFormation stack
To create your resources for this use case using AWS CloudFormation, complete the following steps:
- Launch the CloudFormation stack in
us-east-1:

- For Stack name, enter a name for your stack.
- Choose Next.
- Select I acknowledge that AWS CloudFormation might create IAM resources with custom names.
- Choose Create stack.
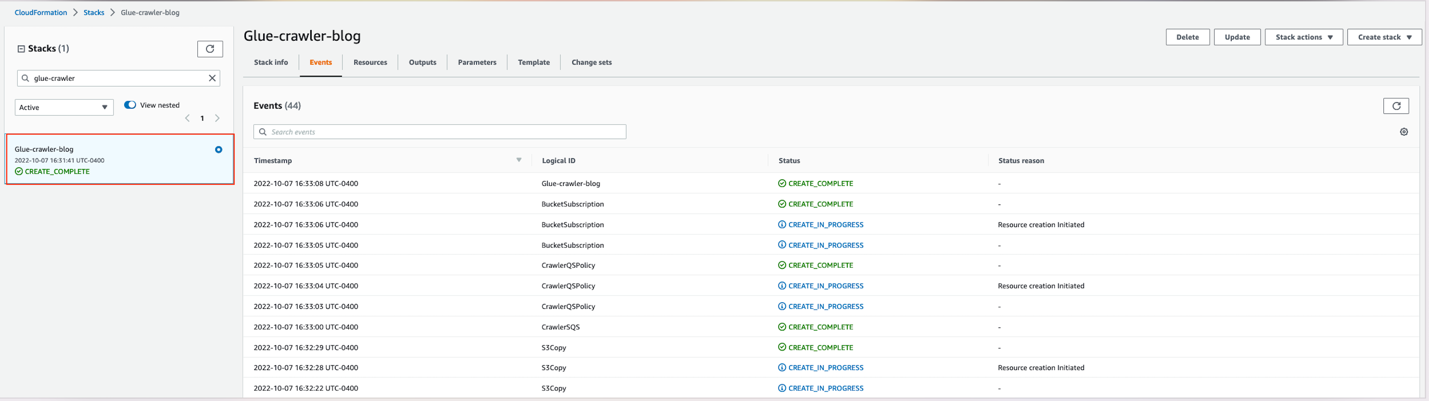
Wait for the stack formation to finish provisioning the resources. When you see the CREATE_COMPLETE status, you can proceed to the next steps.
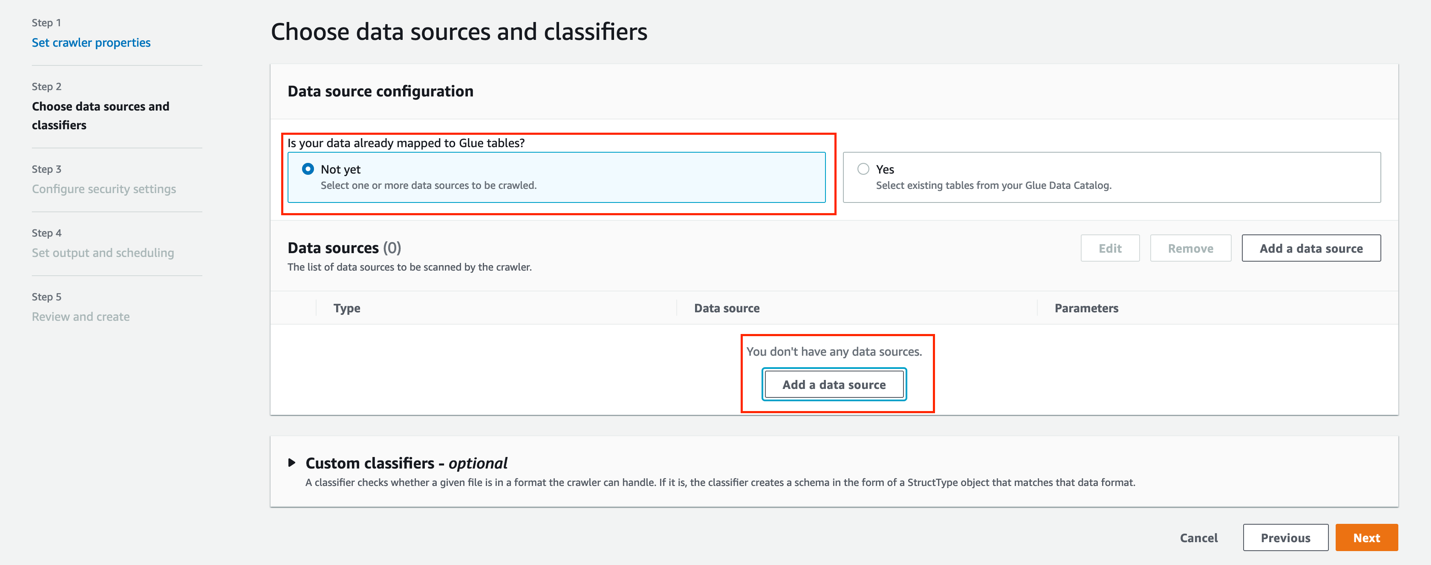
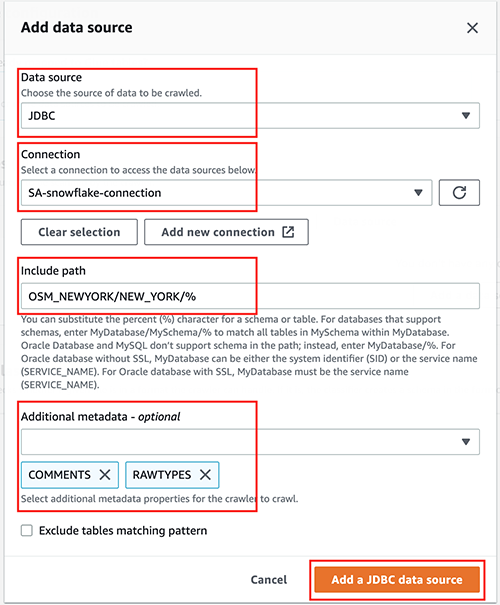
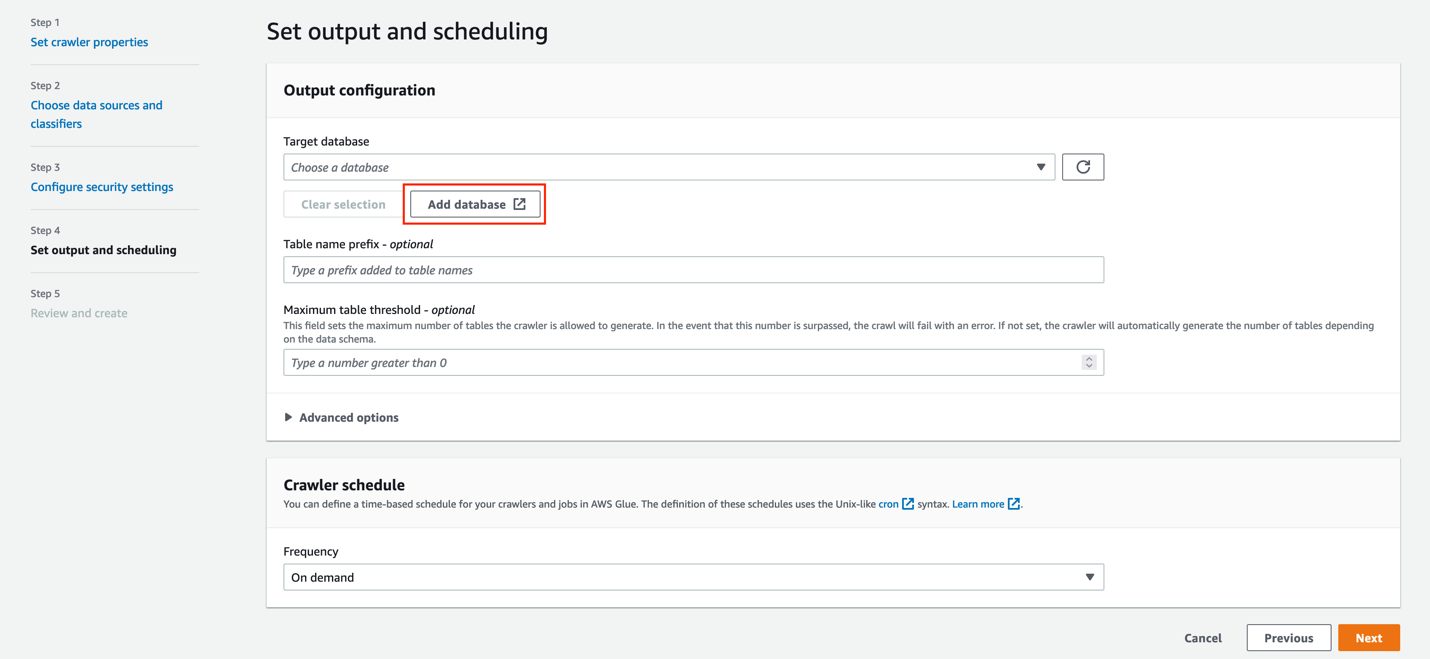
Capture lineage from AWS Glue tables
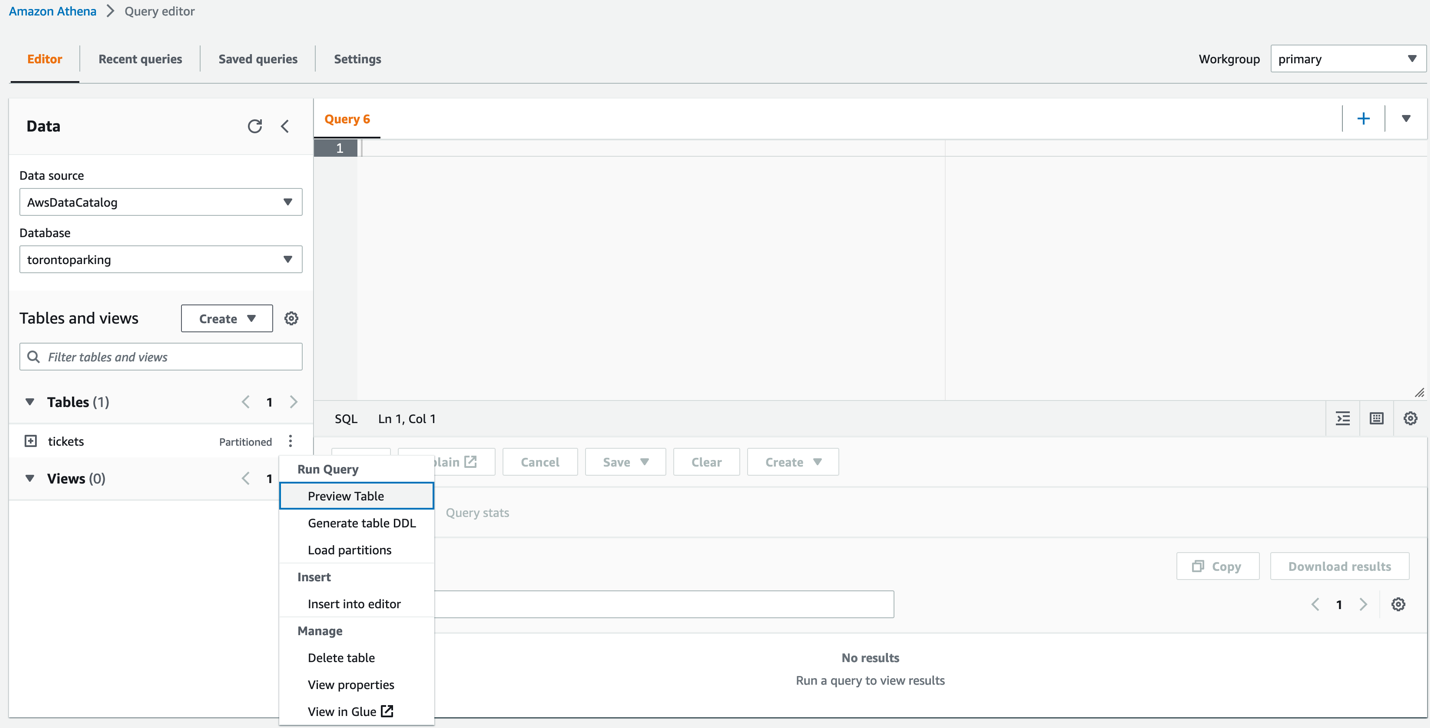
For this example, we use CloudShell, which is a browser-based shell, to run the commands necessary to harvest lineage metadata from AWS Glue tables. Complete the following steps:
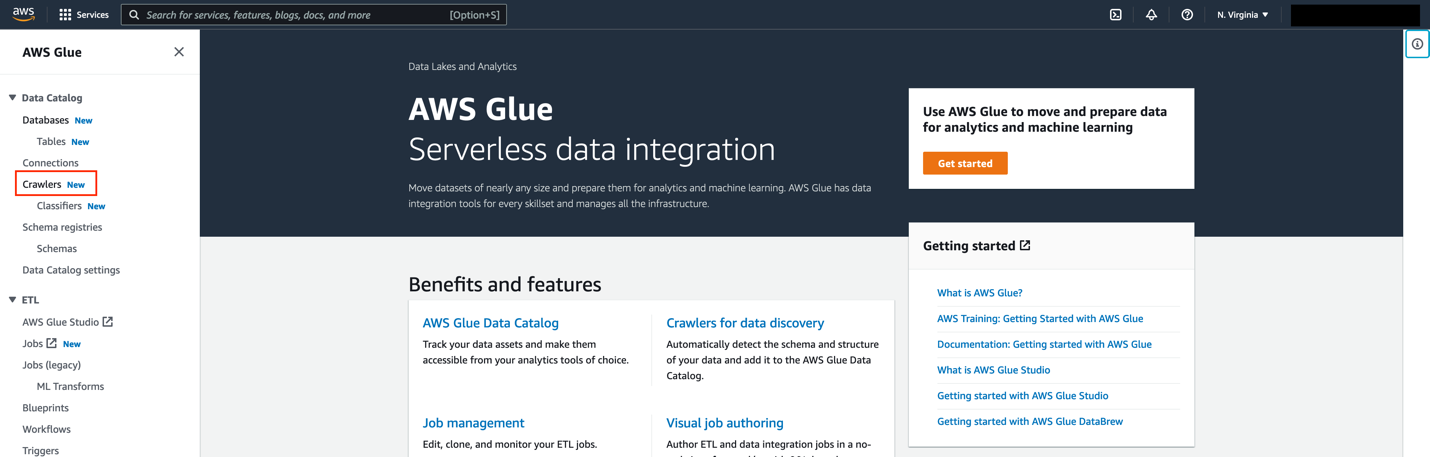
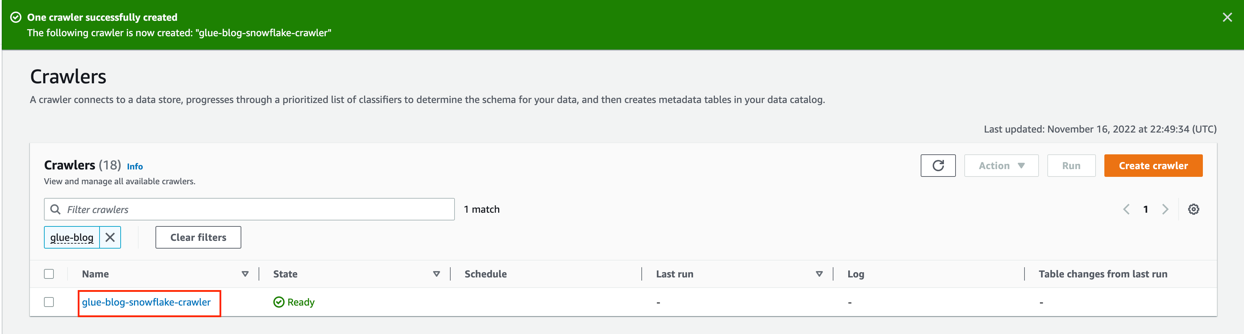
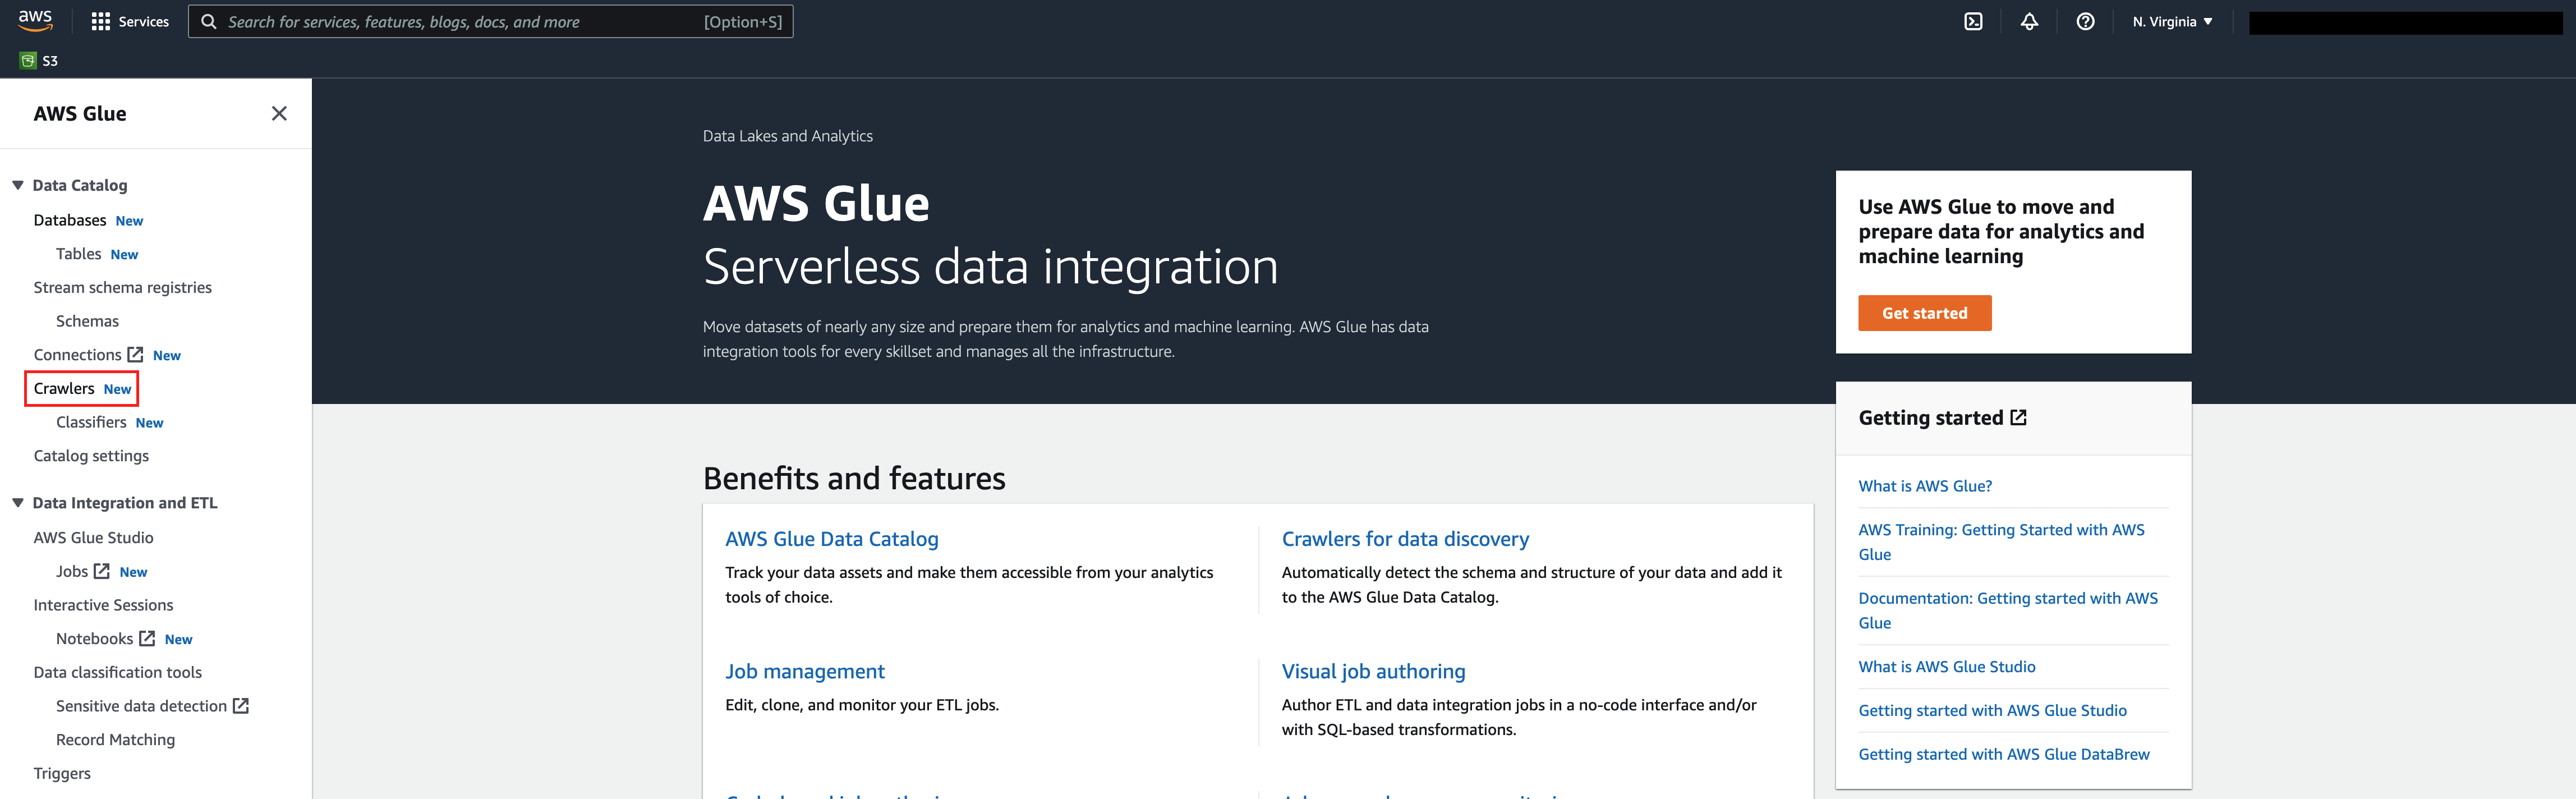
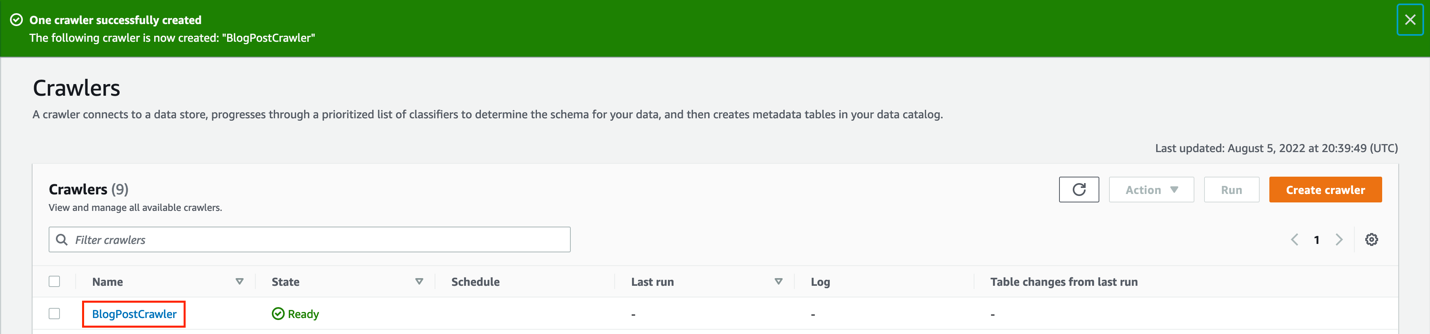
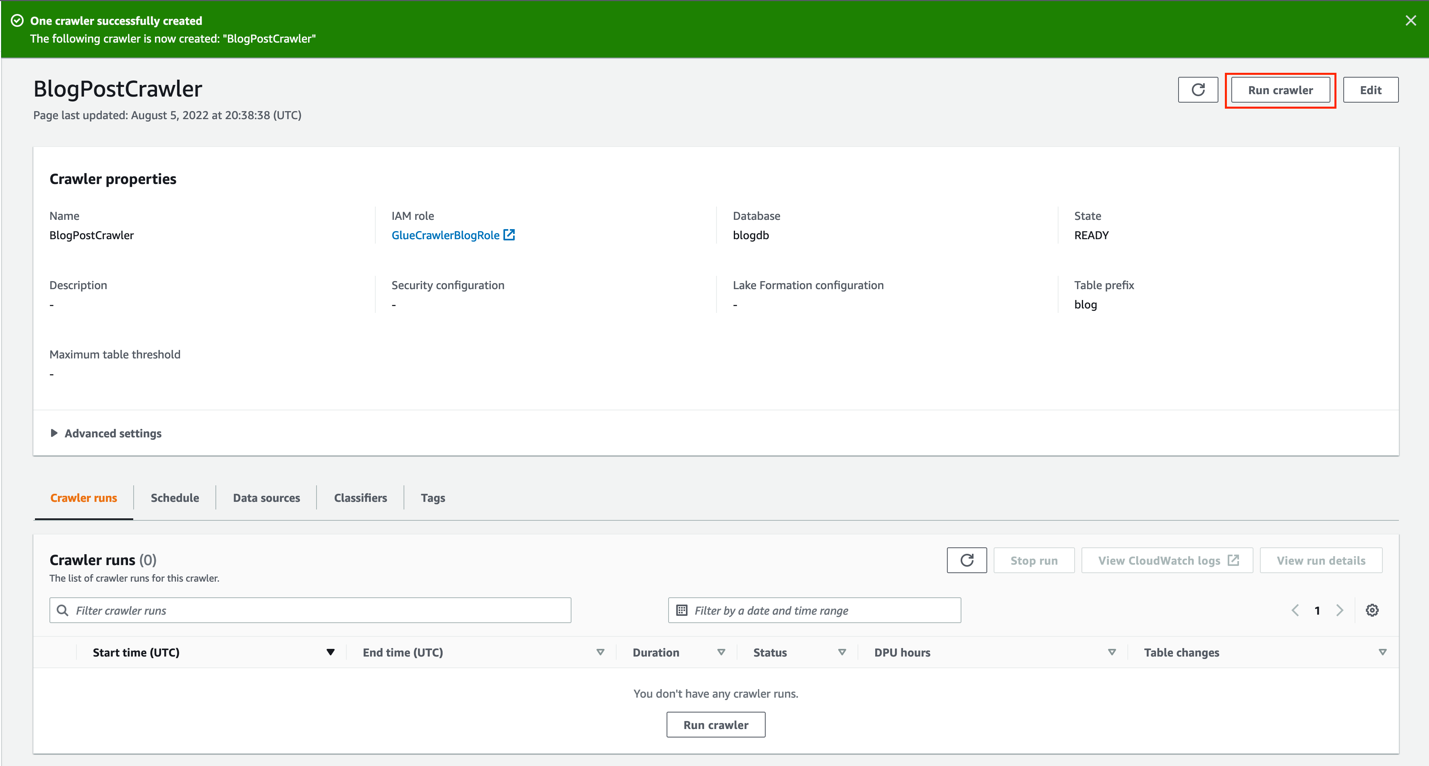
- On the AWS Glue console, choose Crawlers in the navigation pane.
- Select the AWSomeRetailCrawler crawler created by the CloudFormation template.
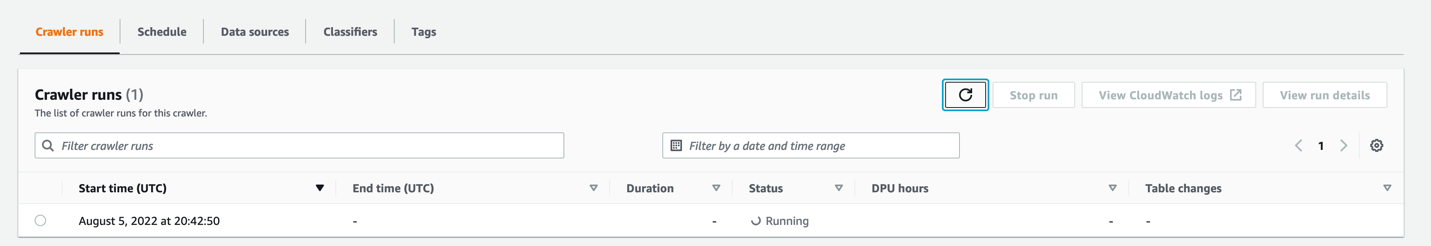
- Choose Run.
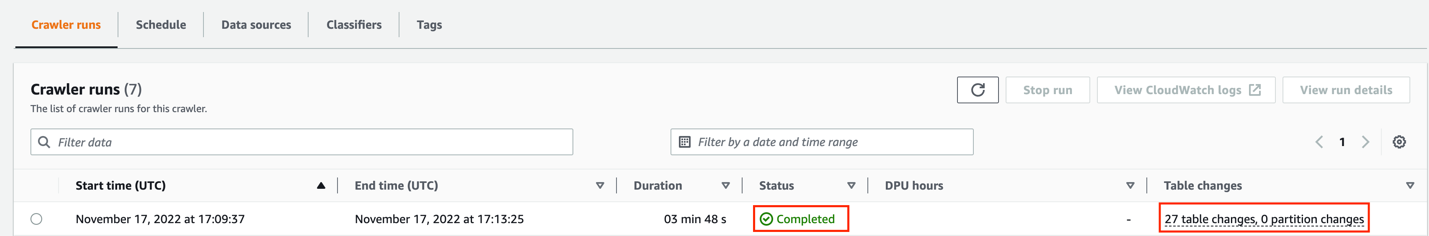
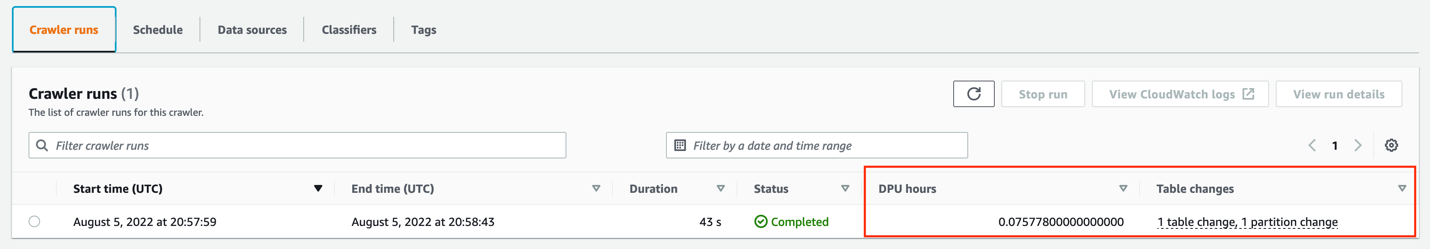
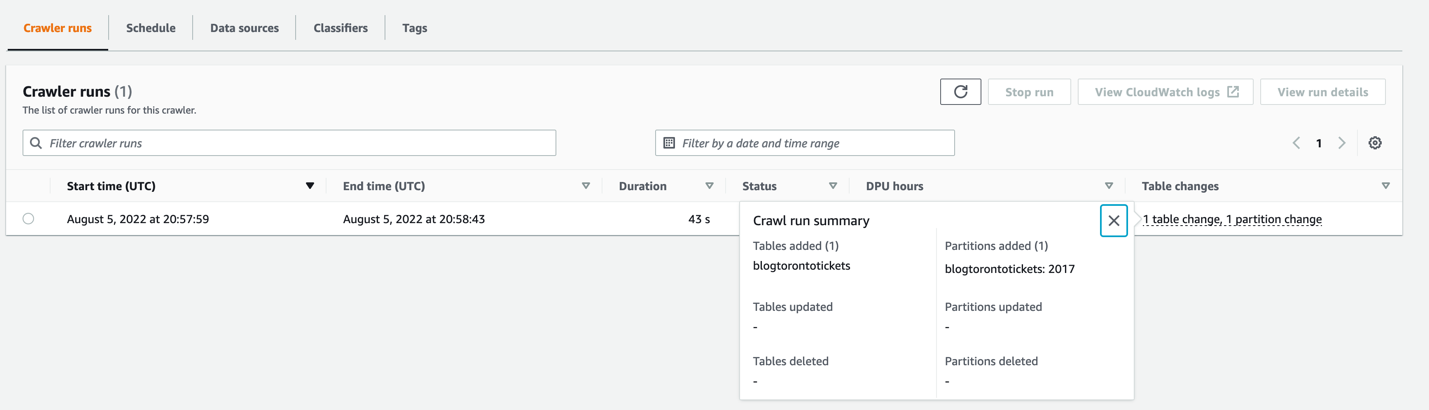
When the crawler is complete, you’ll see a Succeeded status.

Now let’s harvest the lineage metadata using CloudShell.
- Download the
extract_glue_crawler_lineage.pyfile. - On the Amazon DataZone console, open CloudShell.


- On the Actions menu, choose Update file.
- Upload the
extract_glue_crawler_lineage.pyfile.


- Run the following commands:


You should get the following results.

- After all the libraries and dependencies are configured, run the following command to harvest the lineage metadata from the inventory table:
- The script asks for verification of the settings provided; enter
Yes.


You should receive a notification indicating that the script ran successfully.

After you capture the lineage information from the Inventory table, complete the following steps to run the data source.
- On the Amazon DataZone data portal, open the
Sales - On the Data tab, choose Data sources in the navigation pane.


- Select your data source job and choose Run.
For this example, we had a data source job called SalesDLDataSourceV2 already created pointing to the awesome_retail_db database. To learn more about how to create data source jobs, refer to Create and run an Amazon DataZone data source for the AWS Glue Data Catalog.
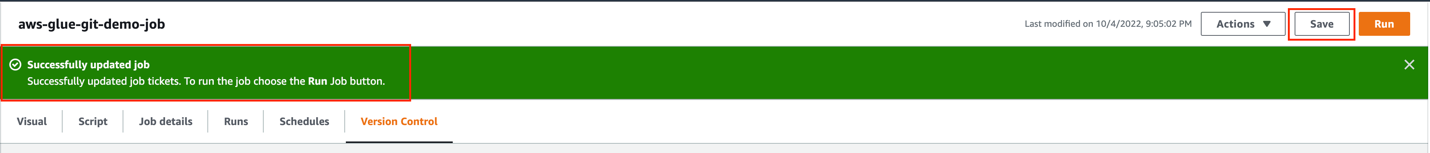
After the job runs successfully, you should see a confirmation message.

Now let’s view the lineage diagram generated by Amazon DataZone.
- On the Data inventory tab, choose the
Inventorytable.

- On the
Inventoryasset page, choose the new Lineage tab.


On the Lineage tab, you can see that Amazon DataZone created three nodes:
- Job / Job run – This is based on the AWS Glue crawler used to harvest the asset technical metadata
- Dataset – This is based on the S3 object that contains the data related to this asset
- Table – This is the AWS Glue table created by the crawler
If you choose the Dataset node, Amazon DataZone offers information about the S3 object used to create the asset.

Capture data lineage for AWS Glue ETL jobs
In the previous section, we covered how to generate a data lineage diagram on top of a data asset. Now let’s see how we can create one for an AWS Glue job.
The CloudFormation template that we launched earlier created an AWS Glue job called Inventory_Insights. This job gets data from the Inventory table and creates a new table called Inventory_Insights with the aggregated data of the total products available in all the stores.
The CloudFormation template also copied the openlineage-spark_2.12-1.9.1.jar file to the S3 bucket created for this post. This file is necessary to generate lineage metadata from the AWS Glue job. We use version 1.9.1, which is compatible with AWS Glue 3.0, the version used to create the AWS Glue job for this post. If you’re using a different version of AWS Glue, you need to download the corresponding OpenLineage Spark plugin file that matches your AWS Glue version.
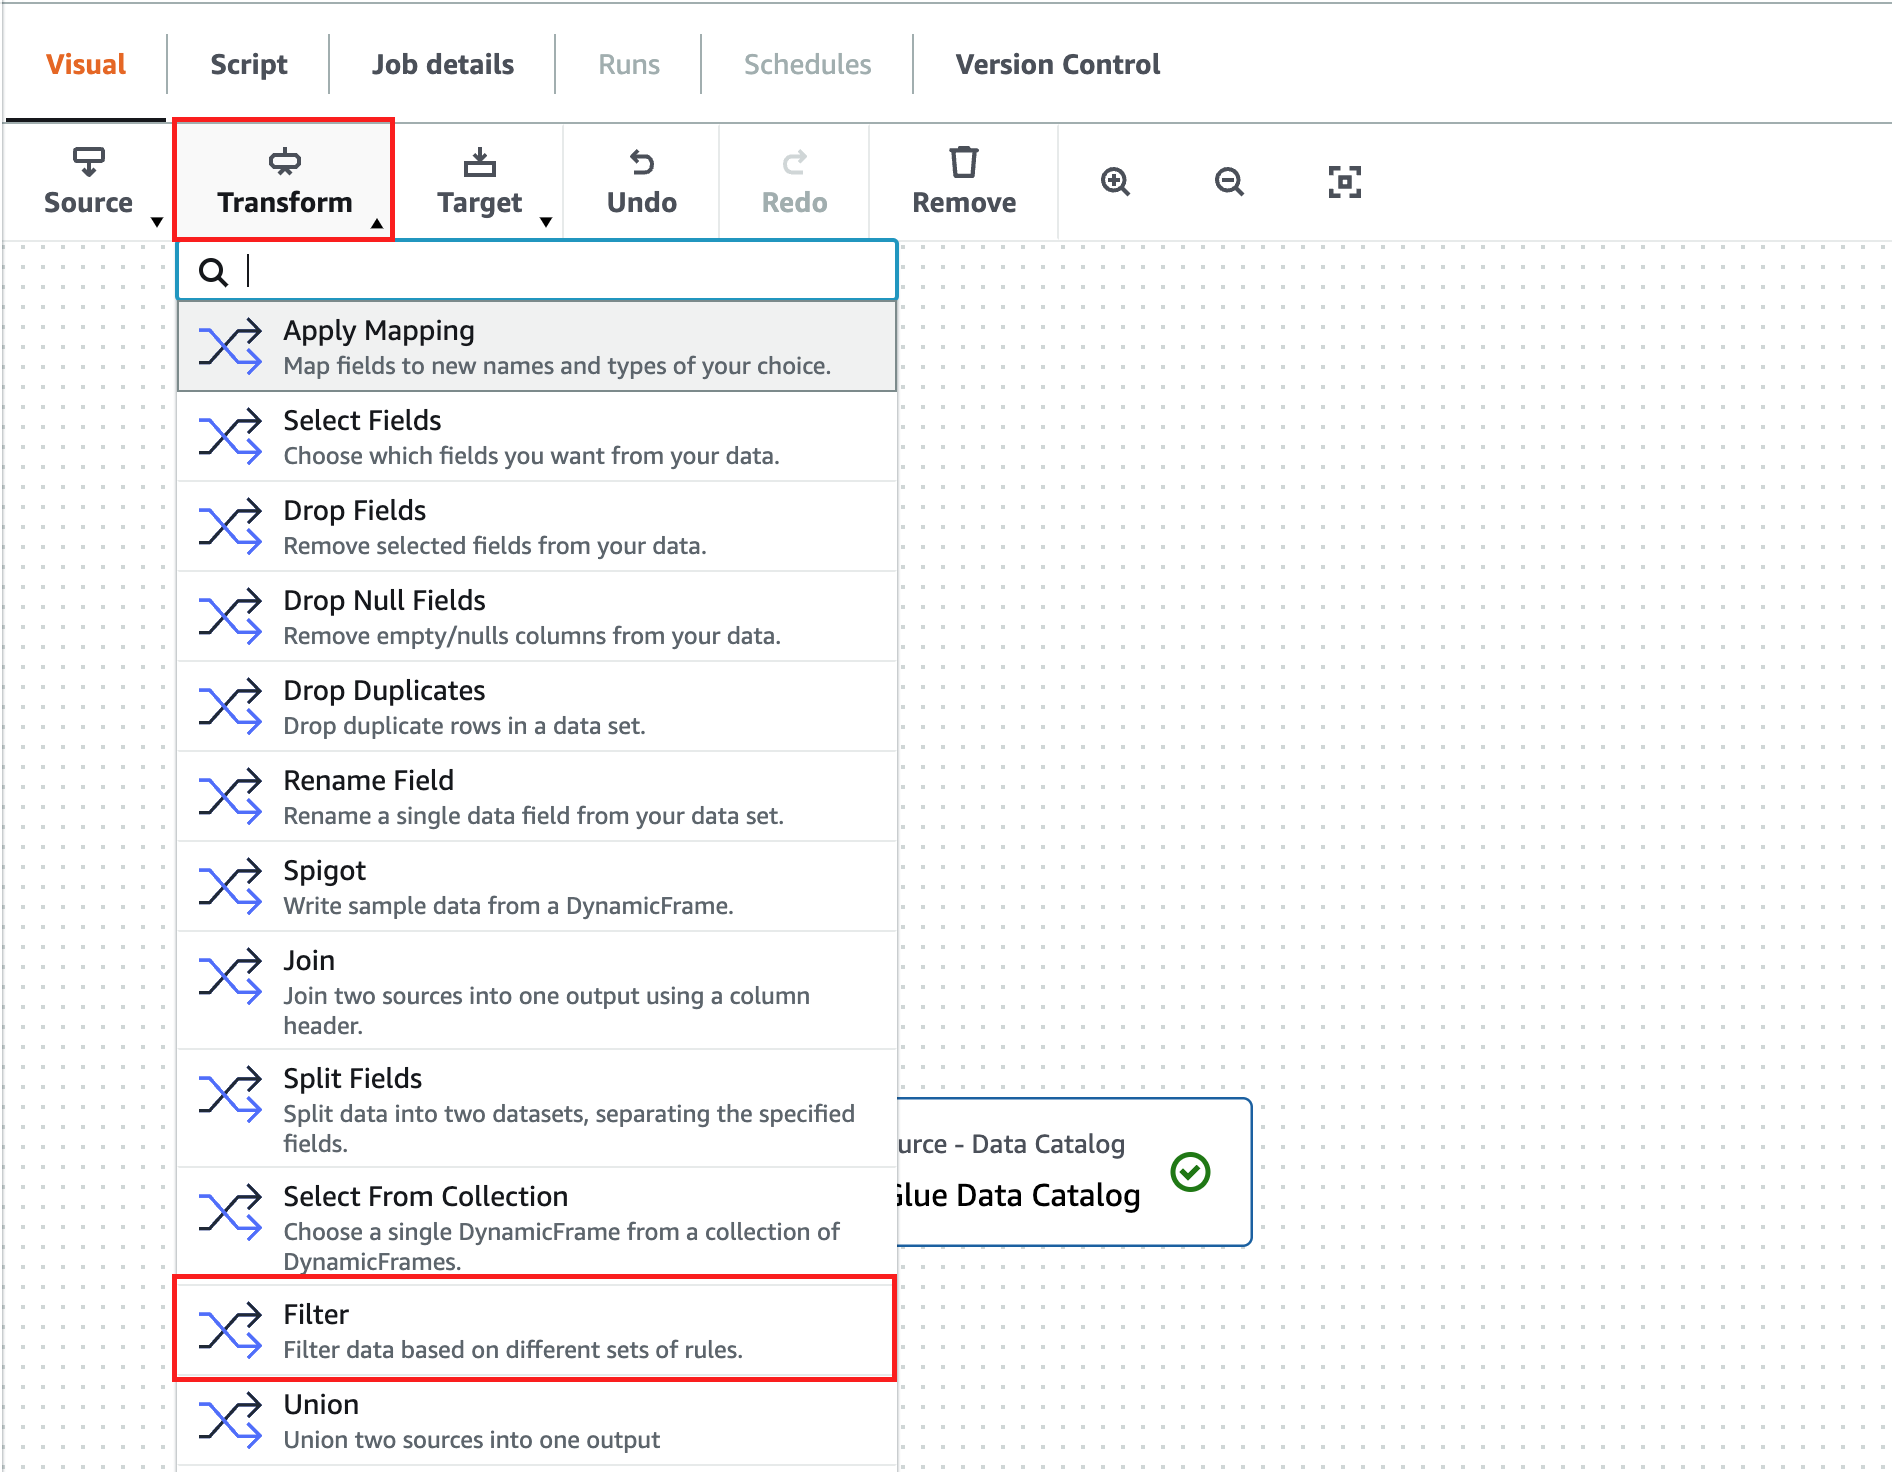
The OpenLineage Spark plugin is not able to extract data lineage from AWS Glue Spark jobs that use AWS Glue DynamicFrames. Use Spark SQL DataFrames instead.
- Download the extract_glue_spark_lineage.py file.
- On the Amazon DataZone console, open CloudShell.
- On the Actions menu, choose Update file.
- Upload the extract_glue_spark_lineage.py file.
- On the CloudShell console, run the following command (if your CloudShell session expired, you can open a new session):
- Confirm the information showed by the script by entering
yes.
You will see the following message; this means that the script is ready to get the AWS Glue job lineage metadata after you run it.
Now let’s run the AWS Glue job created by the Cloud formation template.
- On the AWS Glue console, choose ETL jobs in the navigation pane.
- Select the Inventory_Insights job and choose Run job.
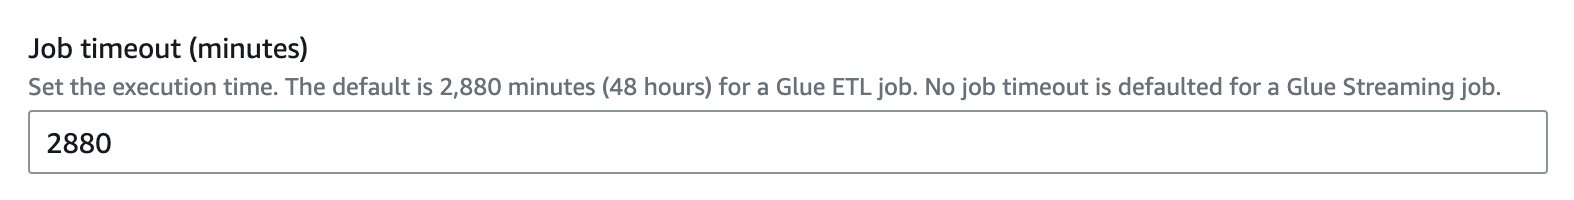
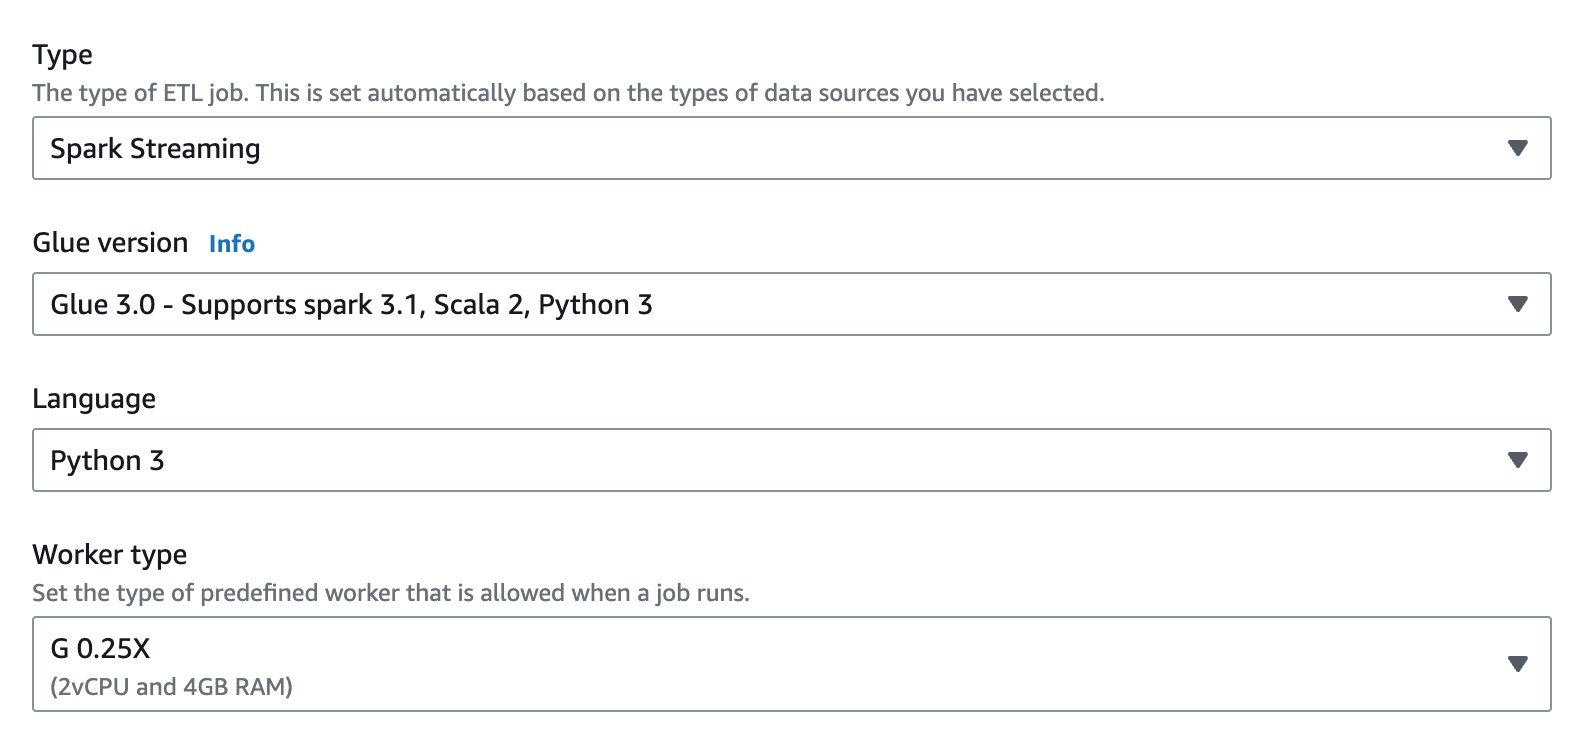
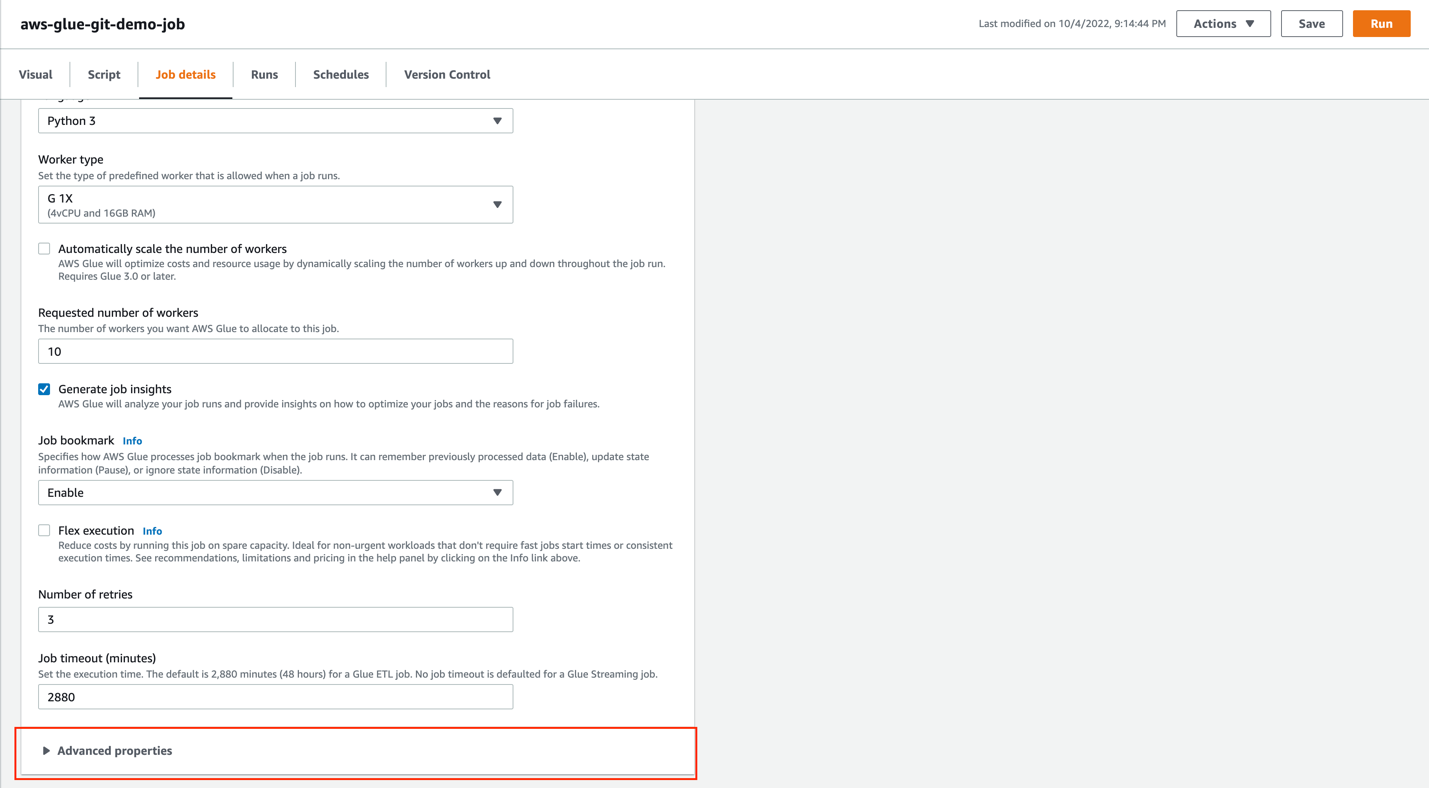
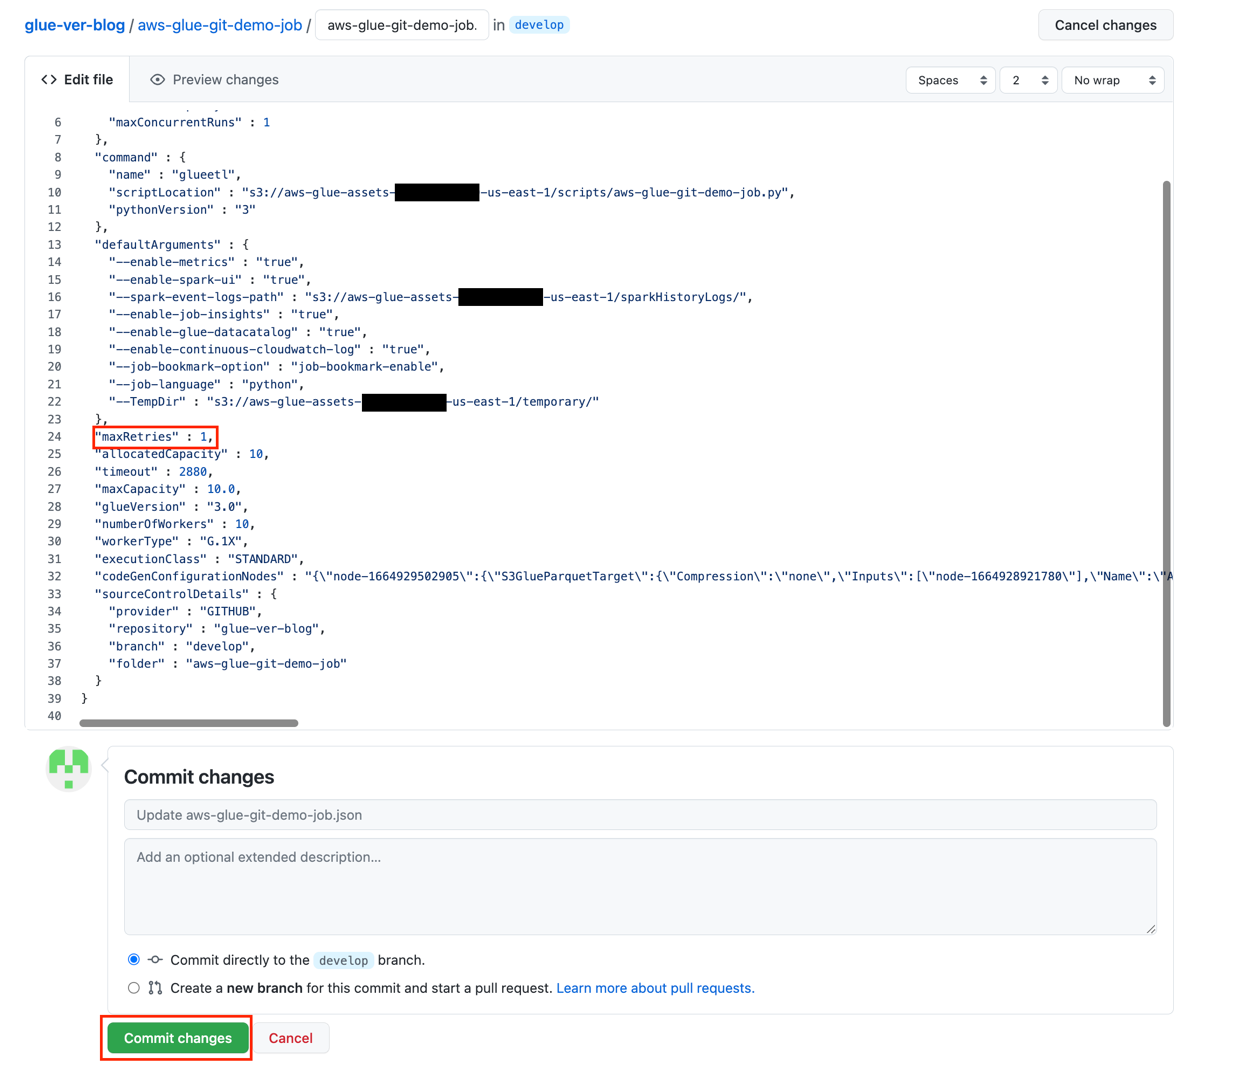
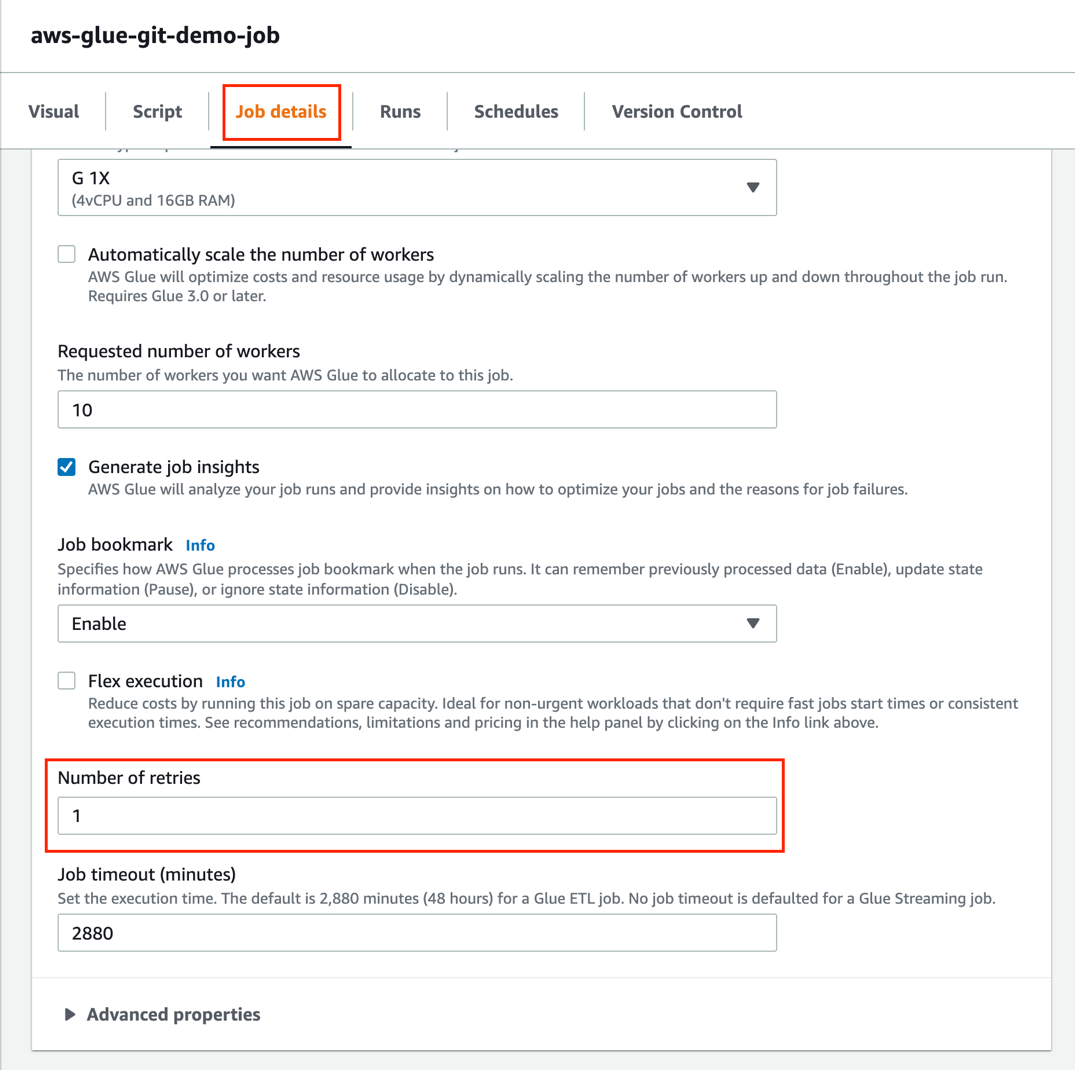
On the Job details tab, you will notice that the job has the following configuration:
- Key
--confwith valueextraListeners=io.openlineage.spark.agent.OpenLineageSparkListener --conf spark.openlineage.transport.type=console --conf spark.openlineage.facets.custom_environment_variables=[AWS_DEFAULT_REGION;GLUE_VERSION;GLUE_COMMAND_CRITERIA;GLUE_PYTHON_VERSION;] - Key
--user-jars-firstwith valuetrue - Dependent JARs path set as the S3 path
s3://{your bucket}/lib/openlineage-spark_2.12-1.9.1.jar - The AWS Glue version set as 3.0
During the run of the job, you will see the following output on the CloudShell console.

This means that the script has successfully harvested the lineage metadata from the AWS Glue job.
Now let’s create an AWS Glue table based on the data created by the AWS Glue job. For this example, we use an AWS Glue crawler.
- On the AWS Glue console, choose Crawlers in the navigation pane.
- Select the
AWSomeRetailCrawlercrawler created by the CloudFormation template and choose Run.
When the crawler is complete, you will see the following message.

Now let’s open the Amazon DataZone portal to see how the diagram is represented in Amazon DataZone.
- On the Amazon DataZone portal, choose the
Salesproject. - On the Data tab, choose Inventory data in the navigation pane.
- Choose the
inventory insightsasset
On the Lineage tab, you can see the diagram created by Amazon DataZone. It shows three nodes:
-
- The AWS Glue crawler used to create the AWS Glue table
- The AWS Glue table created by the crawler
- The Amazon DataZone cataloged asset
- To see the lineage information about the AWS Glue job that you ran to create the
inventory_insightstable, choose the arrows icon on the left side of the diagram.


Now you can see the full lineage diagram for the Inventory_insights table.

- Choose the blue arrow icon in the inventory node to the left of the diagram.


You can see the evolution of the columns and the transformations that they had.
When you choose any of the nodes that are part of the diagram, you can see more details. For example, the inventory_insights node shows the following information.

Capture lineage from Amazon Redshift
Let’s explore how to generate a lineage diagram from Amazon Redshift. In this example, we use AWS Cloud9 because it allows us to configure the connection to the virtual private cloud (VPC) where our Redshift cluster resides. For more information about AWS Cloud9, refer to the AWS Cloud9 User Guide.
The CloudFormation template included as part of this post doesn’t cover the creation of a Redshift cluster or the creation of the tables used in this section. To learn more about how to create a Redshift cluster, see Step 1: Create a sample Amazon Redshift cluster. We use the following query to create the tables needed for this section of the post:
Remember to add the IP address of your AWS Cloud9 environment to the security group with access to the Redshift cluster.
- Download the
requirements.txtandextract_redshift_lineage.pyfiles. - On the File menu, choose Upload Local Files.
- Upload the
requirements.txtandextract_redshift_lineage.pyfiles. - Run the following commands:
You should be able to see the following messages.

- To set the AWS credentials, run the following command:
- Run the
extract_redshift_lineage.pyscript to harvest the metadata necessary to generate the lineage diagram: - Next, you will be prompted to enter the user name and password for the connection to your Amazon DataZone database.
- When you receive a confirmation message, enter
yes.


If the configuration was done correctly, you will see the following confirmation message.

Now let’s see how the diagram was created in Amazon DataZone.
- On the Amazon DataZone data portal, open the
Salesproject. - On the Data tab, choose Data sources.
- Run the data source job.
For this post, we already created a data source job called Sales_DW_Enviroment-default-datasource to add the Redshift data source to our Amazon DataZone project. To learn how to create a data source job, refer to Create and run an Amazon DataZone data source for Amazon Redshift
After you run the job, you’ll see the following confirmation message.

- On the Data tab, choose Inventory data in the navigation pane.
- Choose the
total_salesasset.


- Choose the Lineage tab.


Amazon DataZone create a three-node lineage diagram for the total sales table; you can choose any node to view its details.
- Choose the arrows icon next to the Job/ Job run node to view a more complete lineage diagram.


- Choose the Job / Job run
The Job Info section shows the query that was used to create the total sales table.

Capture lineage from Amazon MWAA
Apache Airflow is an open-source platform for developing, scheduling, and monitoring batch-oriented workflows. Amazon MWAA is a managed service for Airflow that lets you use your current Airflow platform to orchestrate your workflows. OpenLineage supports integration with Airflow 2.6.3 using the openlineage-airflow package, and the same can be enabled on Amazon MWAA as a plugin. Once enabled, the plugin converts Airflow metadata to OpenLineage events, which are consumable by DataZone.PostLineageEvent.
The following diagram shows the setup required in Amazon MWAA to capture data lineage using OpenLineage and publish it to Amazon DataZone.

The workflow uses an Amazon MWAA DAG to invoke a data pipeline. The process is as follows:
- The
openlineage-airflowplugin is configured on Amazon MWAA as a lineage backend. Metadata about the DAG run is passed to the plugin, which converts it into OpenLineage format. - The lineage information collected is written to Amazon CloudWatch log group according to the Amazon MWAA environment.
- A helper function captures the lineage information from the log file and publishes it to Amazon DataZone using the
PostLineageEventAPI.
The example used in the post uses Amazon MWAA version 2.6.3 and OpenLineage plugin version 1.4.1. For other Airflow versions supported by OpenLineage, refer to Supported Airflow versions.
Configure the OpenLineage plugin on Amazon MWAA to capture lineage
When harvesting lineage using OpenLineage, a Transport configuration needs to be set up, which tells OpenLineage where to emit the events to, for example the console or an HTTP endpoint. You can use ConsoleTransport, which logs the OpenLineage events in the Amazon MWAA task CloudWatch log group, which can then be published to Amazon DataZone using a helper function.
Specify the following in the requirements.txt file added to the S3 bucket configured for Amazon MWAA:
openlineage-airflow==1.4.1
In the Airflow logging configuration section under the MWAA configuration for the Airflow environment, enable Airflow task logs with log level INFO. The following screenshot shows a sample configuration.

A successful configuration will add a plugin to Airflow, which can be verified from the Airflow UI by choosing Plugins on the Admin menu.


In this post, we use a sample DAG to hydrate data to Redshift tables. The following screenshot shows the DAG in graph view.

Run the DAG and upon successful completion of a run, open the Amazon MWAA task CloudWatch log group for your Airflow environment (airflow-env_name-task) and filter based on the expression console.py to select events emitted by OpenLineage. The following screenshot shows the results.

Publish lineage to Amazon DataZone
Now that you have the lineage events emitted to CloudWatch, the next step is to publish them to Amazon DataZone to associate them to a data asset and visualize them on the business data catalog.
- Download the files
requirements.txtandairflow_cw_parse_log.pyand gather environment details like AWS region, Amazon MWAA environment name and Amazon DataZone Domain ID. - The Amazon MWAA environment name can be obtained from the Amazon MWAA console.

- The Amazon DataZone domain ID can be obtained from Amazon DataZone service console or from the Amazon DataZone portal.

- Navigate to CloudShell and choose Upload files on the Actions menu to upload the files
requirements.txtandextract_airflow_lineage.py.


- After the files are uploaded, run the following script to filter lineage events from the Airflow task logs and publish them to Amazon DataZone:


The function extract_airflow_lineage.py filters the lineage events from the Amazon MWAA task log group and publishes the lineage to the specified domain within Amazon DataZone.
Visualize lineage on Amazon DataZone
After the lineage is published to DataZone, open your DataZone project, navigate to the Data tab and chose a data asset that was accessed by the Amazon MWAA DAG. In this case, it is a subscribed asset.

Navigate to the Lineage tab to visualize the lineage published to Amazon DataZone.

Choose a node to look at additional lineage metadata. In the following screenshot, we can observe the producer of the lineage has been marked as airflow.

Conclusion
In this post, we shared the preview feature of data lineage in Amazon DataZone, how it works, and how you can capture lineage events, from AWS Glue, Amazon Redshift, and Amazon MWAA, to be visualized as part of the asset browsing experience.
To learn more about Amazon DataZone and how to get started, refer to the Getting started guide. Check out the YouTube playlist for some of the latest demos of Amazon DataZone and short descriptions of the capabilities available.
About the Authors
 Leonardo Gomez is a Principal Analytics Specialist at AWS, with over a decade of experience in data management. Specializing in data governance, he assists customers worldwide in maximizing their data’s potential while promoting data democratization. Connect with him on LinkedIn.
 Priya Tiruthani is a Senior Technical Product Manager with Amazon DataZone at AWS. She focuses on improving data discovery and curation required for data analytics. She is passionate about building innovative products to simplify customers’ end-to-end data journey, especially around data governance and analytics. Outside of work, she enjoys being outdoors to hike, capture nature’s beauty, and recently play pickleball.
 Ron Kyker is a Principal Engineer with Amazon DataZone at AWS, where he helps drive innovation, solve complex problems, and set the bar for engineering excellence for his team. Outside of work, he enjoys board gaming with friends and family, movies, and wine tasting.
 Srinivasan Kuppusamy is a Senior Cloud Architect – Data at AWS ProServe, where he helps customers solve their business problems using the power of AWS Cloud technology. His areas of interests are data and analytics, data governance, and AI/ML.


 Leonardo Gomez is a Principal Analytics Specialist Solutions Architect at AWS. He has over a decade of experience in data management, helping customers around the globe address their business and technical needs. Connect with him on
  Michael Chess – is a Product Manager on the AWS Lake Formation team based out of Palo Alto, CA. He specializes in permissions and data catalog features in the data lake.
 Derek Liu – is a Senior Solutions Architect based out of Vancouver, BC. He enjoys helping customers solve big data challenges through AWS analytic services.


 Noritaka Sekiyama is a Principal Big Data Architect on the AWS Glue team. He is responsible for building software artifacts to help customers. In his spare time, he enjoys cycling with his new road bike.


 Leonardo Gómez is a Senior Analytics Specialist Solution Architect at AWS. Based in Toronto, Canada, He works with customers across Canada to design and build big data solutions.