Post Syndicated from Marvin Gersho original https://aws.amazon.com/blogs/big-data/build-streaming-data-pipelines-with-amazon-msk-serverless-and-iam-authentication/
Currently, MSK Serverless only directly supports IAM for authentication using Java. This example shows how to use this mechanism. Additionally, it provides a pattern creating a proxy that can easily be integrated into solutions built in languages other than Java.
The rising trend in today’s tech landscape is the use of streaming data and event-oriented structures. They are being applied in numerous ways, including monitoring website traffic, tracking industrial Internet of Things (IoT) devices, analyzing video game player behavior, and managing data for cutting-edge analytics systems.
Apache Kafka, a top-tier open-source tool, is making waves in this domain. It’s widely adopted by numerous users for building fast and efficient data pipelines, analyzing streaming data, merging data from different sources, and supporting essential applications.
Amazon’s serverless Apache Kafka offering, Amazon Managed Streaming for Apache Kafka (Amazon MSK) Serverless, is attracting a lot of interest. It’s appreciated for its user-friendly approach, ability to scale automatically, and cost-saving benefits over other Kafka solutions. However, a hurdle encountered by many users is the requirement of MSK Serverless to use AWS Identity and Access Management (IAM) access control. At the time of writing, the Amazon MSK library for IAM is exclusive to Kafka libraries in Java, creating a challenge for users of other programming languages. In this post, we aim to address this issue and present how you can use Amazon API Gateway and AWS Lambda to navigate around this obstacle.
SASL/SCRAM authentication vs. IAM authentication
Compared to the traditional authentication methods like Salted Challenge Response Authentication Mechanism (SCRAM), the IAM extension into Apache Kafka through MSK Serverless provides a lot of benefits. Before we delve into those, it’s important to understand what SASL/SCRAM authentication is. Essentially, it’s a traditional method used to confirm a user’s identity before giving them access to a system. This process requires users or clients to provide a user name and password, which the system then cross-checks against stored credentials (for example, via AWS Secrets Manager) to decide whether or not access should be granted.
Compared to this approach, IAM simplifies permission management across AWS environments, enables the creation and strict enforcement of detailed permissions and policies, and uses temporary credentials rather than the typical user name and password authentication. Another benefit of using IAM is that you can use IAM for both authentication and authorization. If you use SASL/SCRAM, you have to additionally manage ACLs via a separate mechanism. In IAM, you can use the IAM policy attached to the IAM principal to define the fine-grained access control for that IAM principal. All of these improvements make the IAM integration a more efficient and secure solution for most use cases.
However, for applications not built in Java, utilizing MSK Serverless becomes tricky. The standard SASL/SCRAM authentication isn’t available, and non-Java Kafka libraries don’t have a way to use IAM access control. This calls for an alternative approach to connect to MSK Serverless clusters.
But there’s an alternative pattern. Without having to rewrite your existing application in Java, you can employ API Gateway and Lambda as a proxy in front of a cluster. They can handle API requests and relay them to Kafka topics instantly. API Gateway takes in producer requests and channels them to a Lambda function, written in Java using the Amazon MSK IAM library. It then communicates with the MSK Serverless Kafka topic using IAM access control. After the cluster receives the message, it can be further processed within the MSK Serverless setup.
You can also utilize Lambda on the consumer side of MSK Serverless topics, bypassing the Java requirement on the consumer side. You can do this by setting Amazon MSK as an event source for a Lambda function. When the Lambda function is triggered, the data sent to the function includes an array of records from the Kafka topic—no need for direct contact with Amazon MSK.
Solution overview
This example walks you through how to build a serverless real-time stream producer application using API Gateway and Lambda.
For testing, this post includes a sample AWS Cloud Development Kit (AWS CDK) application. This creates a demo environment, including an MSK Serverless cluster, three Lambda functions, and an API Gateway that consumes the messages from the Kafka topic.
The following diagram shows the architecture of the resulting application including its data flows.
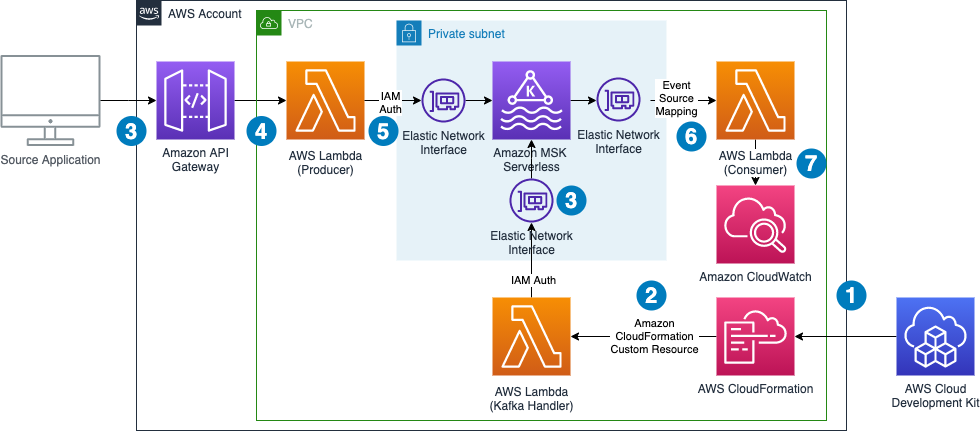
The data flow contains the following steps:
- The infrastructure is defined in an AWS CDK application. By running this application, a set of AWS CloudFormation templates is created.
- AWS CloudFormation creates all infrastructure components, including a Lambda function that runs during the deployment process to create a topic in the MSK Serverless cluster and to retrieve the authentication endpoint needed for the producer Lambda function. On destruction of the CloudFormation stack, the same Lambda function gets triggered again to delete the topic from the cluster.
- An external application calls an API Gateway endpoint.
- API Gateway forwards the request to a Lambda function.
- The Lambda function acts as a Kafka producer and pushes the message to a Kafka topic using IAM authentication.
- The Lambda event source mapping mechanism triggers the Lambda consumer function and forwards the message to it.
- The Lambda consumer function logs the data to Amazon CloudWatch.
Note that we don’t need to worry about Availability Zones. MSK Serverless automatically replicates the data across multiple Availability Zones to ensure high availability of the data.
The demo additionally shows how to use Lambda Powertools for Java to streamline logging and tracing and the IAM authenticator for the simple authentication process outlined in the introduction.
The following sections take you through the steps to deploy, test, and observe the example application.
Prerequisites
The example has the following prerequisites:
- An AWS account. If you haven’t signed up, complete the following steps:
- Create an account. For instructions, see Sign Up For AWS.
- Create an IAM user. For instructions, see Create IAM User.
- The following software installed on your development machine, or use an AWS Cloud9 environment, which comes with all requirements preinstalled:
- Java Development Kit 17 or higher (for example, Amazon Corretto 17, OpenJDK 17)
- Python version 3.11 or higher
- Apache Maven version 3.8.4 or higher
- Docker version 24.0.2 or higher
- Node.js v18.0.0
- AWS CLI 2.12.1 or higher
- AWS CDK 2.89.0 or higher
- Appropriate AWS credentials for interacting with resources in your AWS account.
Deploy the solution
Complete the following steps to deploy the solution:
- Clone the project GitHub repository and change the directory to subfolder
serverless-kafka-iac:
- Configure environment variables:
- Prepare the virtual Python environment:
- Bootstrap your account for AWS CDK usage:
- Run cdk synth to build the code and test the requirements (ensure docker daemon is running on your machine):
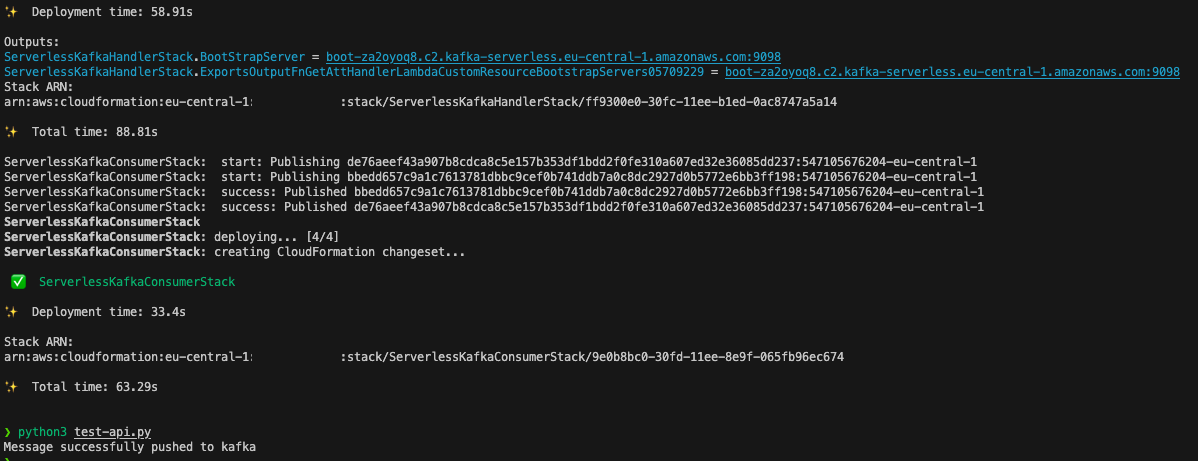
- Run cdk deploy to deploy the code to your AWS account:
Test the solution
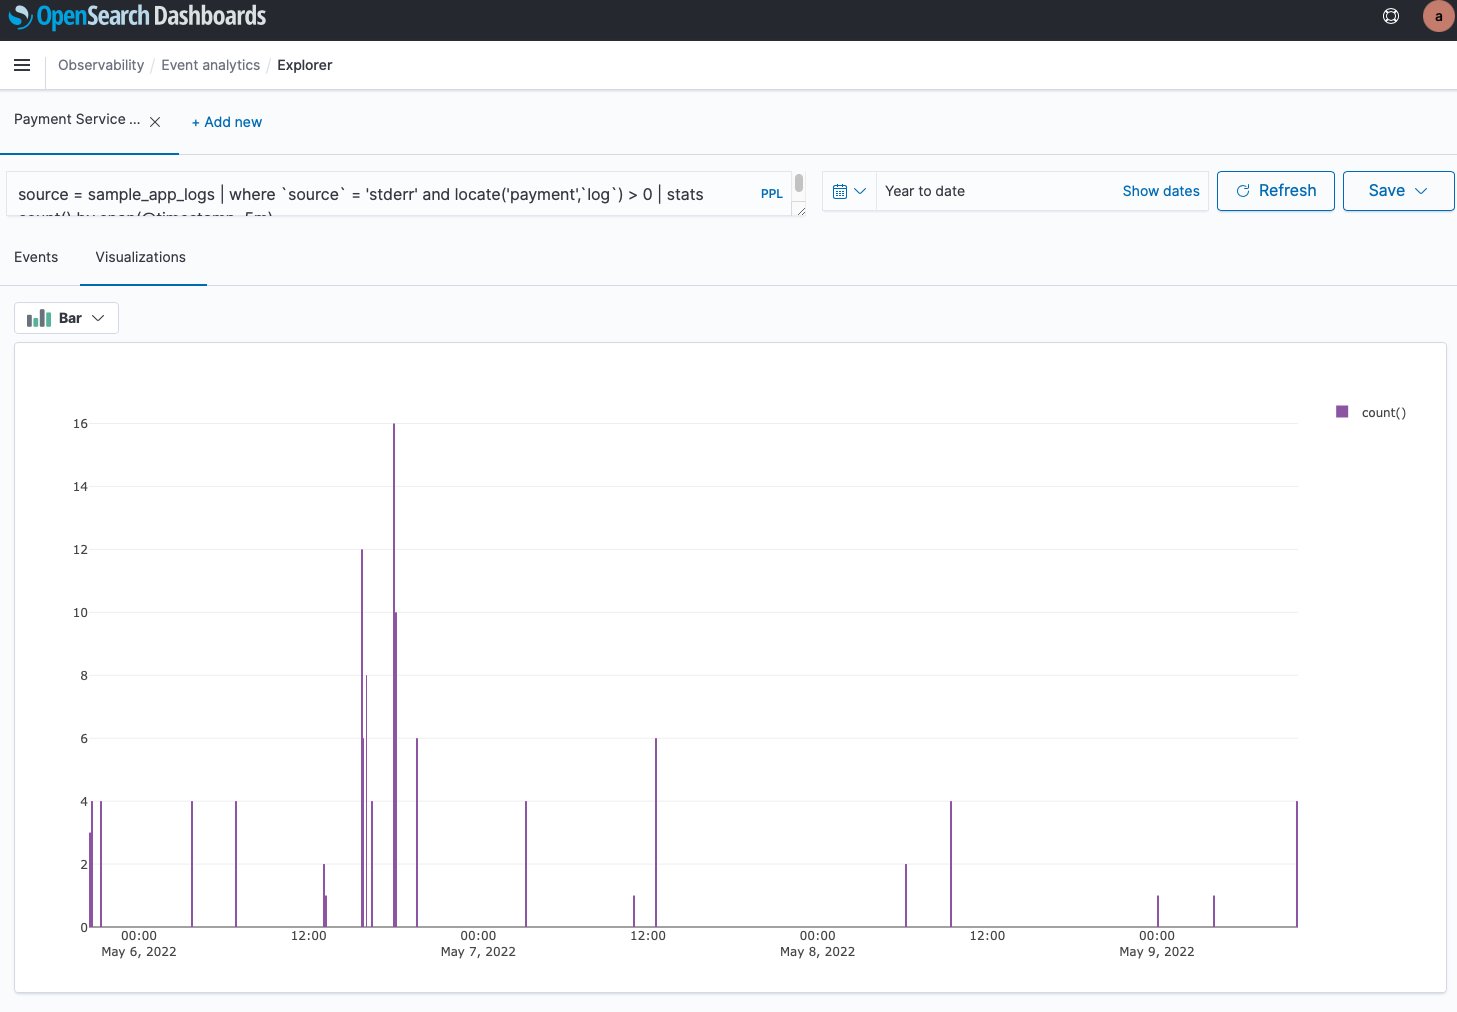
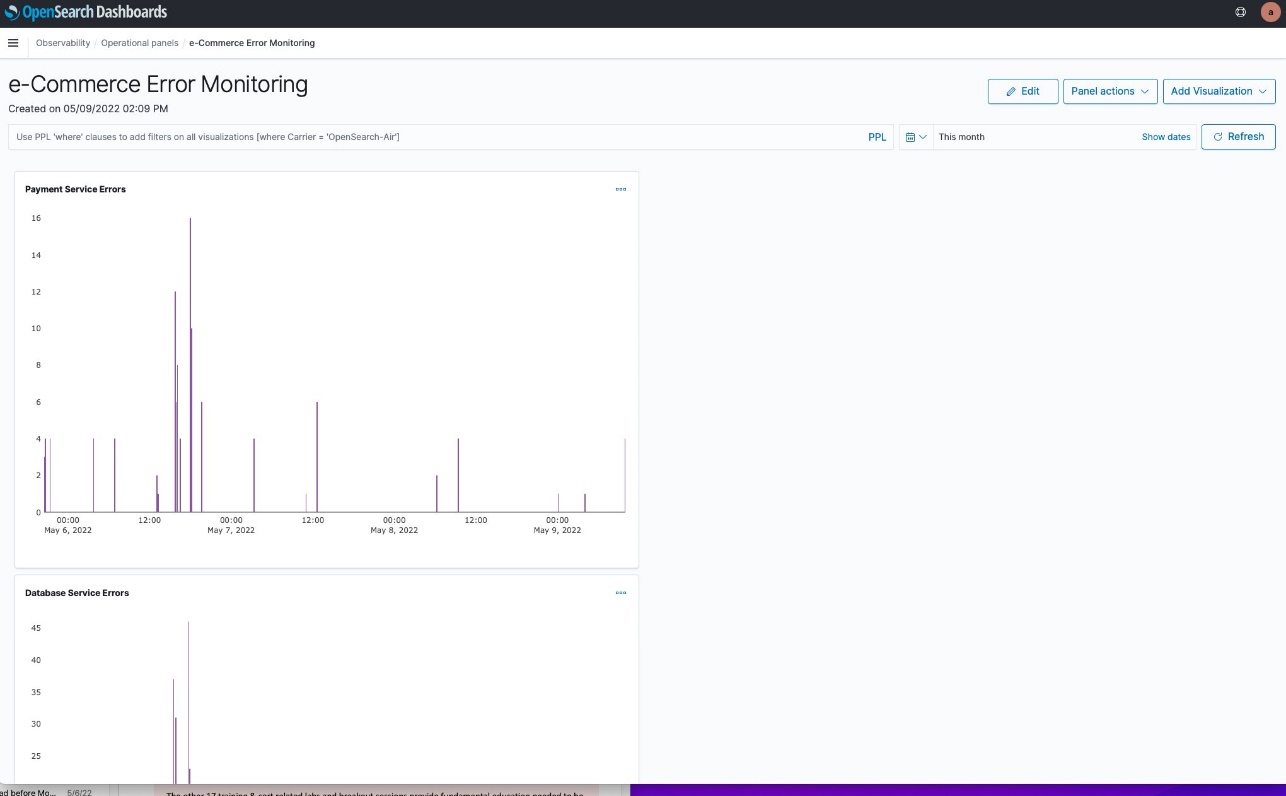
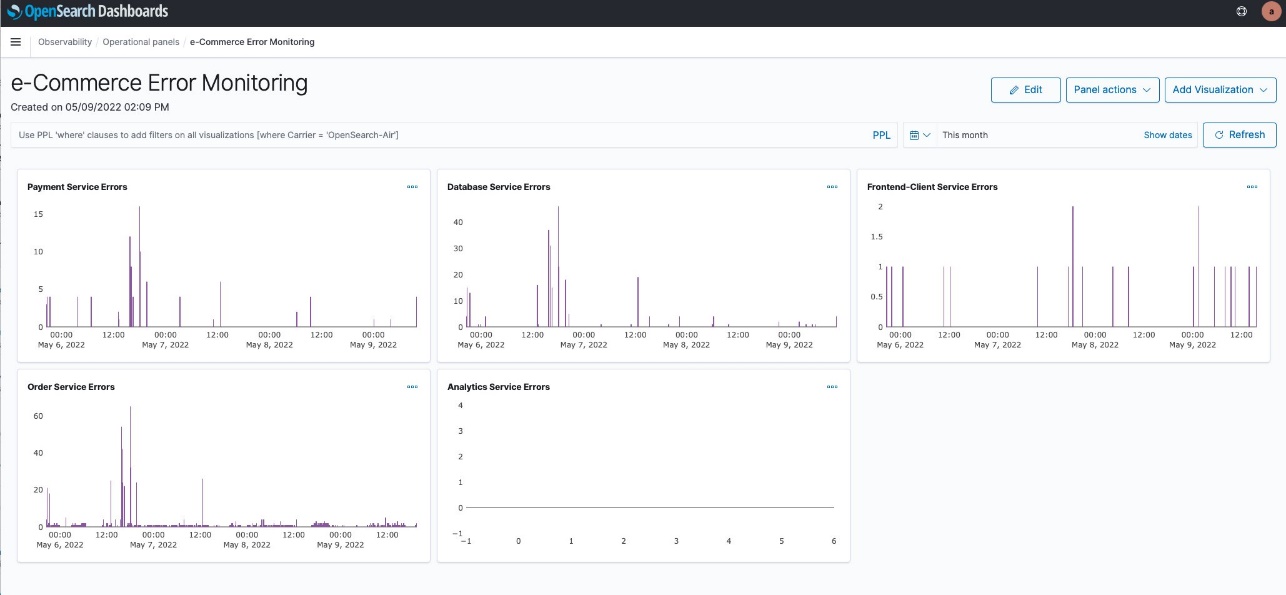
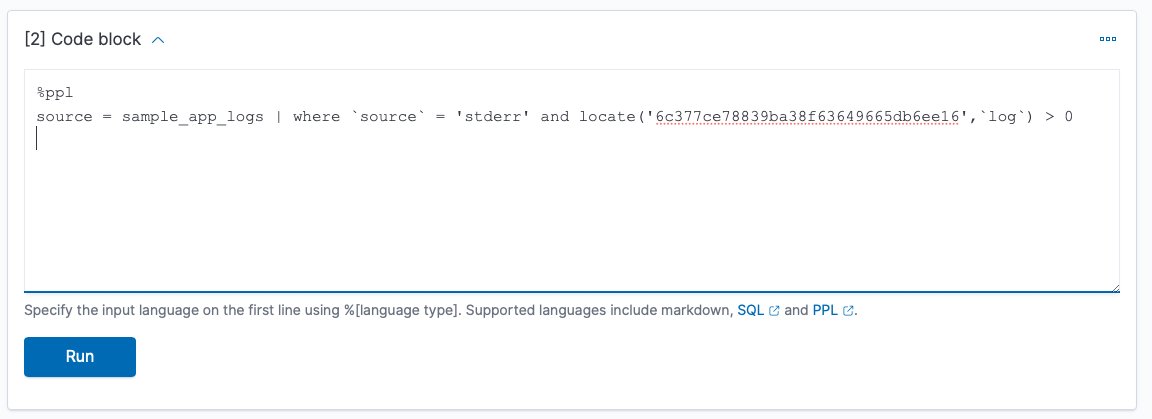
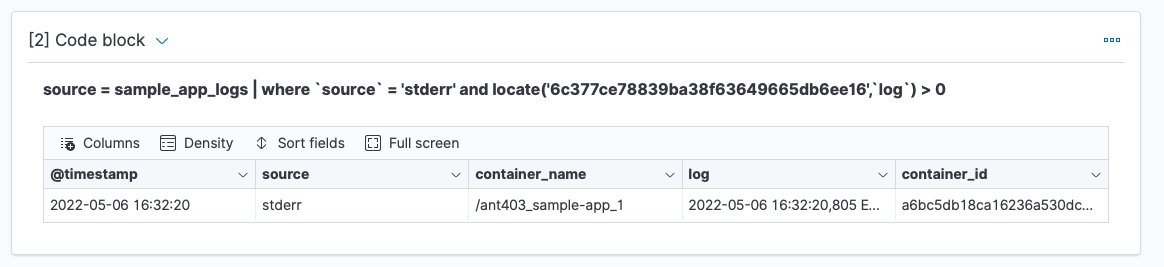
To test the solution, we generate messages for the Kafka topics by sending calls through the API Gateway from our development machine or AWS Cloud9 environment. We then go to the CloudWatch console to observe incoming messages in the log files of the Lambda consumer function.
- Open a terminal on your development machine to test the API with the Python script provided under
/serverless_kafka_iac/test_api.py:
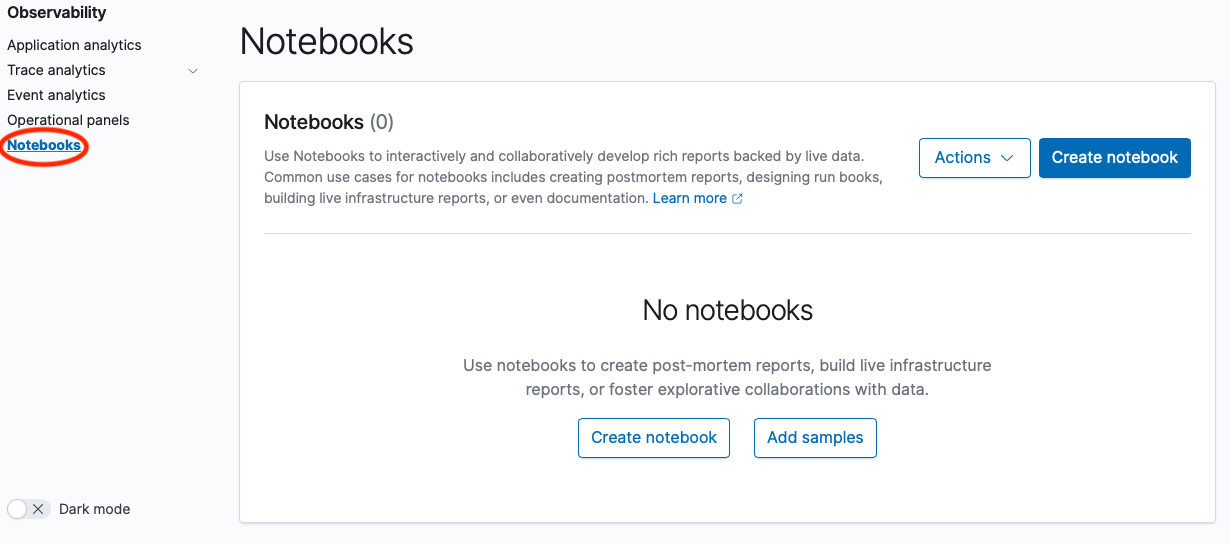
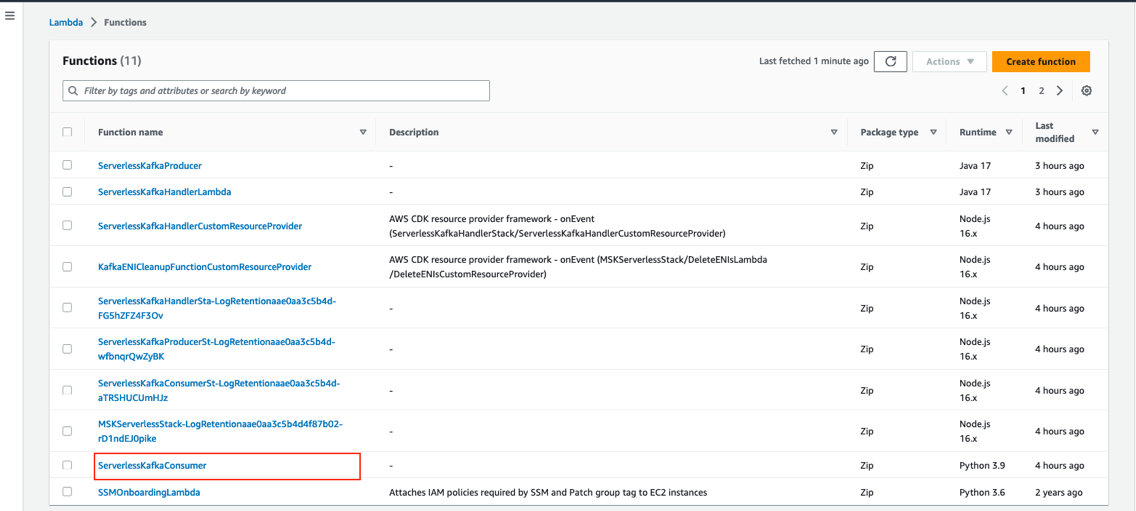
- On the Lambda console, open the Lambda function named
ServerlessKafkaConsumer.
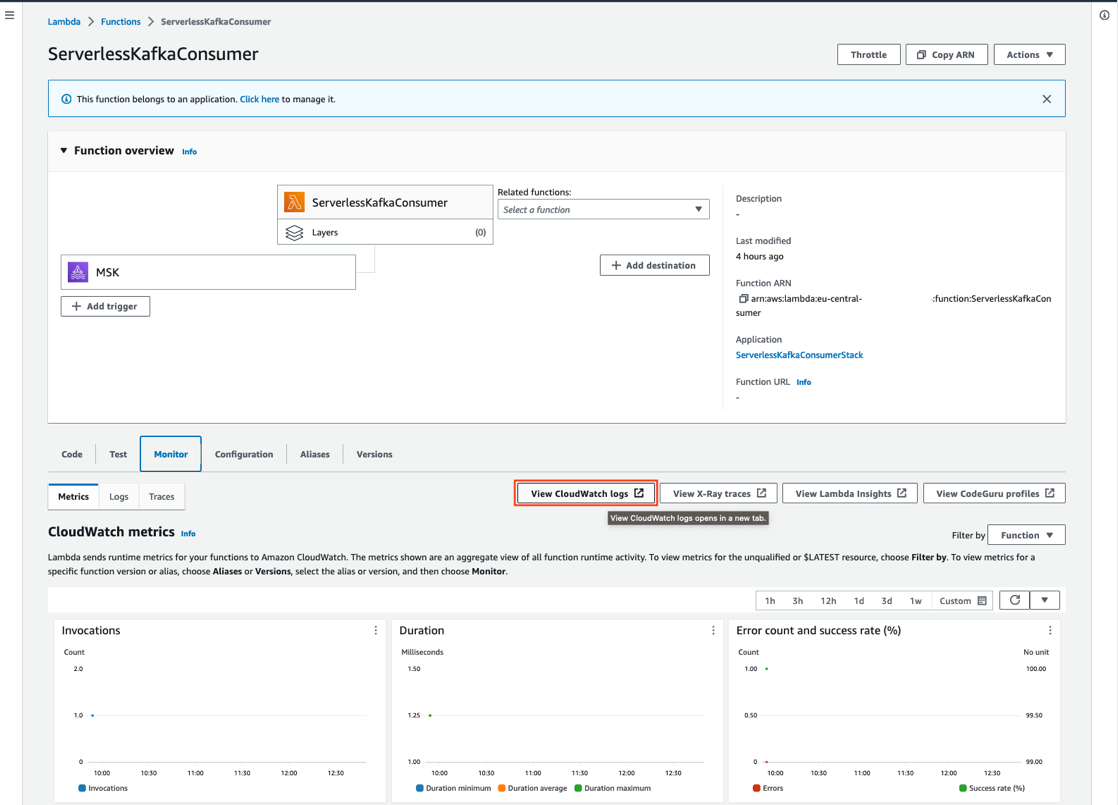
- On the Monitor tab, choose View CloudWatch logs to access the logs of the Lambda function.
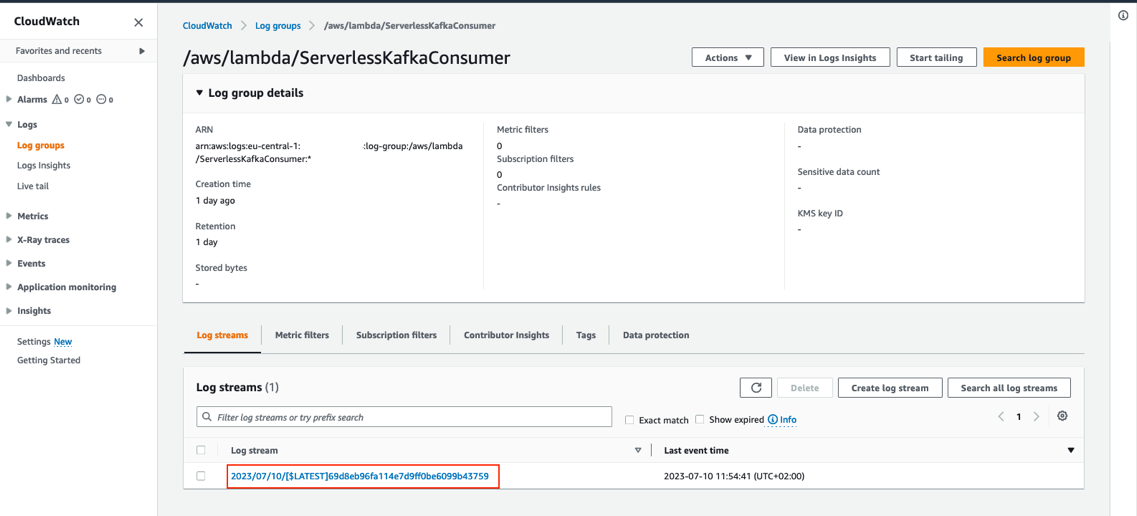
- Choose the latest log stream to access the log files of the last run.
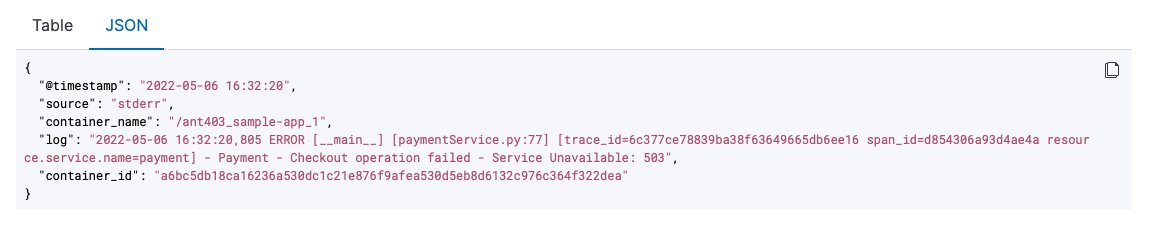
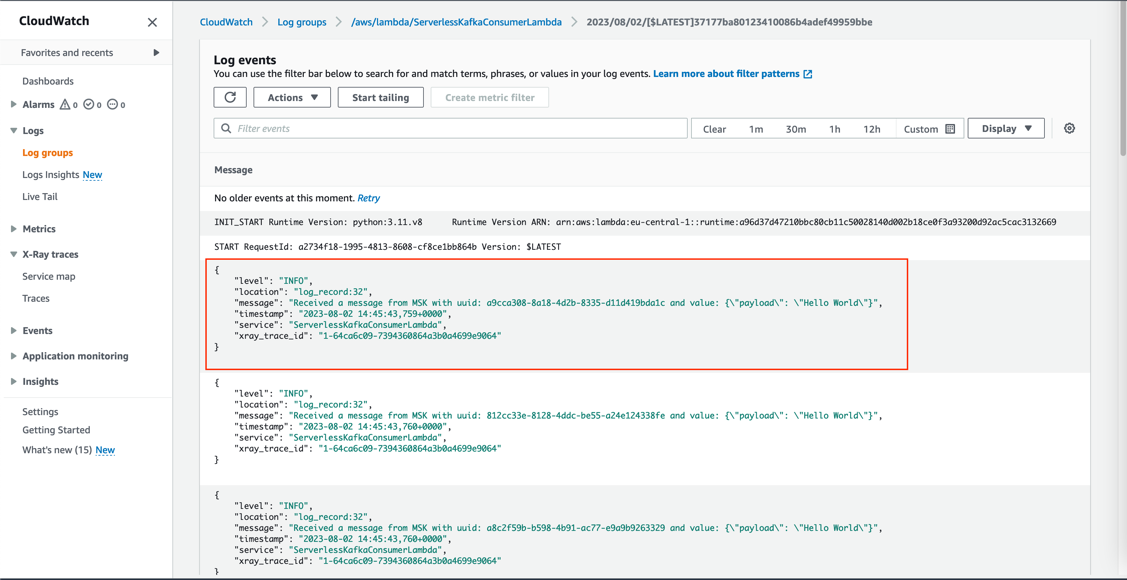
You can review the log entry of the received Kafka messages in the log of the Lambda function.
Trace a request
All components integrate with AWS X-Ray. With AWS X-Ray, you can trace the entire application, which is useful to identify bottlenecks when load testing. You can also trace method runs at the Java method level.
Lambda Powertools for Java allows you to shortcut this process by adding the @Trace annotation to a method to see traces on the method level in X-Ray.
To trace a request end to end, complete the following steps:
- On the CloudWatch console, choose Service map in the navigation pane.
- Select a component to investigate (for example, the Lambda function where you deployed the Kafka producer).
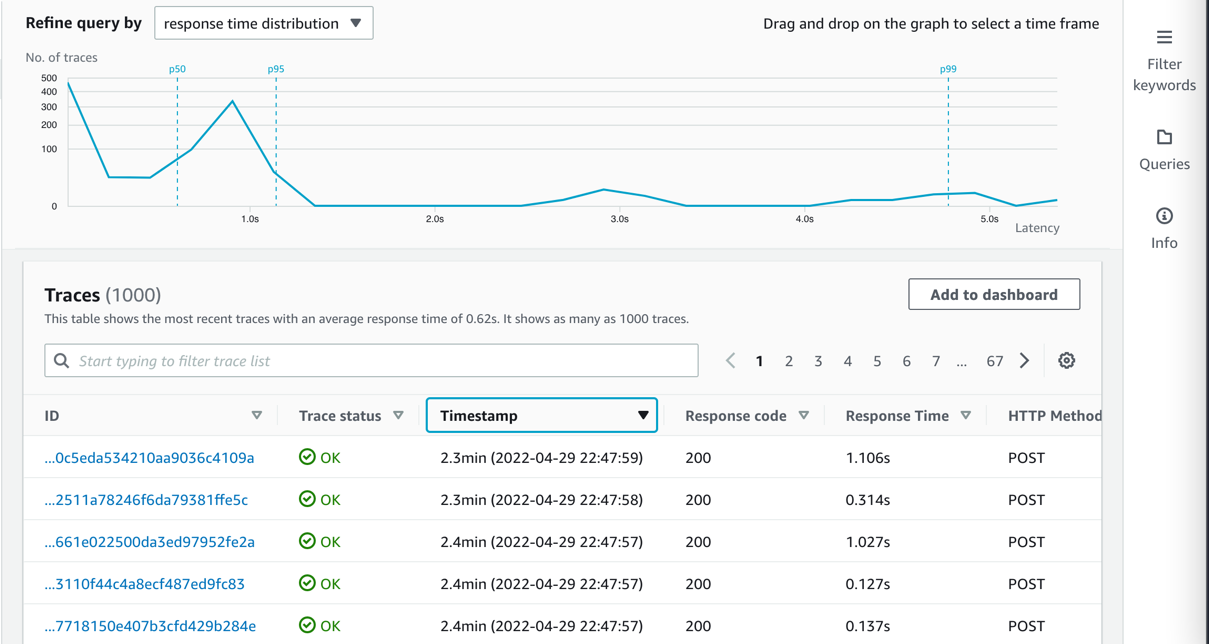
- Choose View traces.
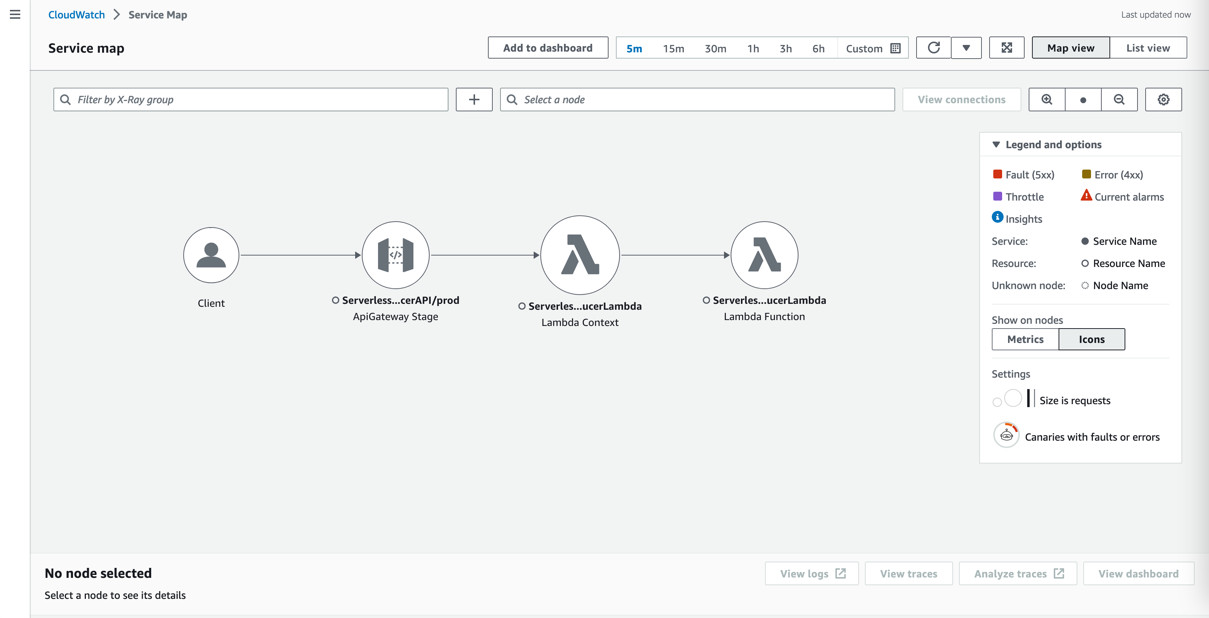
- Choose a single Lambda method invocation and investigate further at the Java method level.
Implement a Kafka producer in Lambda
Kafka natively supports Java. To stay open, cloud native, and without third-party dependencies, the producer is written in that language. Currently, the IAM authenticator is only available to Java. In this example, the Lambda handler receives a message from an API Gateway source and pushes this message to an MSK topic called messages.
Typically, Kafka producers are long-living and pushing a message to a Kafka topic is an asynchronous process. Because Lambda is ephemeral, you must enforce a full flush of a submitted message until the Lambda function ends by calling producer.flush():
Connect to Amazon MSK using IAM authentication
This post uses IAM authentication to connect to the respective Kafka cluster. For information about how to configure the producer for connectivity, refer to IAM access control.
Because you configure the cluster via IAM, grant Connect and WriteData permissions to the producer so that it can push messages to Kafka:
This shows the Kafka excerpt of the IAM policy, which must be applied to the Kafka producer. When using IAM authentication, be aware of the current limits of IAM Kafka authentication, which affect the number of concurrent connections and IAM requests for a producer. Refer to Amazon MSK quota and follow the recommendation for authentication backoff in the producer client:
Additional considerations
Each MSK Serverless cluster can handle 100 requests per second. To reduce IAM authentication requests from the Kafka producer, place it outside of the handler. For frequent calls, there is a chance that Lambda reuses the previously created class instance and only reruns the handler.
For bursting workloads with a high number of concurrent API Gateway requests, this can lead to dropped messages. Although this might be tolerable for some workloads, for others this might not be the case.
In these cases, you can extend the architecture with a buffering technology like Amazon Simple Queue Service (Amazon SQS) or Amazon Kinesis Data Streams between API Gateway and Lambda.
To reduce latency, reduce cold start times for Java by changing the tiered compilation level to 1, as described in Optimizing AWS Lambda function performance for Java. Provisioned concurrency ensures that polling Lambda functions don’t need to warm up before requests arrive.
Conclusion
In this post, we showed how to create a serverless integration Lambda function between API Gateway and MSK Serverless as a way to do IAM authentication when your producer is not written in Java. You also learned about the native integration of Lambda and Amazon MSK on the consumer side. Additionally, we showed how to deploy such an integration with the AWS CDK.
The general pattern is suitable for many use cases where you want to use IAM authentication but your producers or consumers are not written in Java, but you still want to take advantage of the benefits of MSK Serverless, like its ability to scale up and down with unpredictable or spikey workloads or its little to no operational overhead of running Apache Kafka.
You can also use MSK Serverless to reduce operational complexity by automating provisioning and the management of capacity needs, including the need to constantly monitor brokers and storage.
For more serverless learning resources, visit Serverless Land.
For more information on MSK Serverless, check out the following:
- MSK Serverless Developer Guide
- Building a Serverless Apache Kafka Data Pipeline workshop
- Split your monolith Apache clusters using Amazon MSK Serverless
- Connect to Amazon MSK Serverless from your on-premises network
About the Authors
 Philipp Klose is a Global Solutions Architect at AWS based in Munich. He works with enterprise FSI customers and helps them solve business problems by architecting serverless platforms. In this free time, Philipp spends time with his family and enjoys every geek hobby possible.
 Daniel Wessendorf is a Global Solutions Architect at AWS based in Munich. He works with enterprise FSI customers and is primarily specialized in machine learning and data architectures. In his free time, he enjoys swimming, hiking, skiing, and spending quality time with his family.
 Marvin Gersho is a Senior Solutions Architect at AWS based in New York City. He works with a wide range of startup customers. He previously worked for many years in engineering leadership and hands-on application development, and now focuses on helping customers architect secure and scalable workloads on AWS with a minimum of operational overhead. In his free time, Marvin enjoys cycling and strategy board games.
 Nathan Lichtenstein is a Senior Solutions Architect at AWS based in New York City. Primarily working with startups, he ensures his customers build smart on AWS, delivering creative solutions to their complex technical challenges. Nathan has worked in cloud and network architecture in the media, financial services, and retail spaces. Outside of work, he can often be found at a Broadway theater.