Organizations are increasingly expanding their Kubernetes footprint by deploying microservices to incrementally innovate and deliver business value faster. This growth places increased reliance on the network, giving platform teams exponentially complex challenges in monitoring network performance and traffic patterns in EKS. As a result, organizations struggle to maintain operational efficiency as their container environments scale, often delaying application delivery and increasing operational costs.
Today, I’m excited to announce Container Network Observability in Amazon Elastic Kubernetes Service (Amazon EKS), a comprehensive set of network observability features in Amazon EKS that you can use to better measure your network performance in your system and dynamically visualize the landscape and behavior of network traffic in EKS.
Here’s a quick look at Container Network Observability in Amazon EKS:
Container Network Observability in EKS addresses observability challenges by providing enhanced visibility of workload traffic. It offers performance insights into network flows within the cluster and those with cluster-external destinations. This makes your EKS cluster network environment more observable while providing built-in capabilities for more precise troubleshooting and investigative efforts.
Getting started with Container Network Observability in EKS
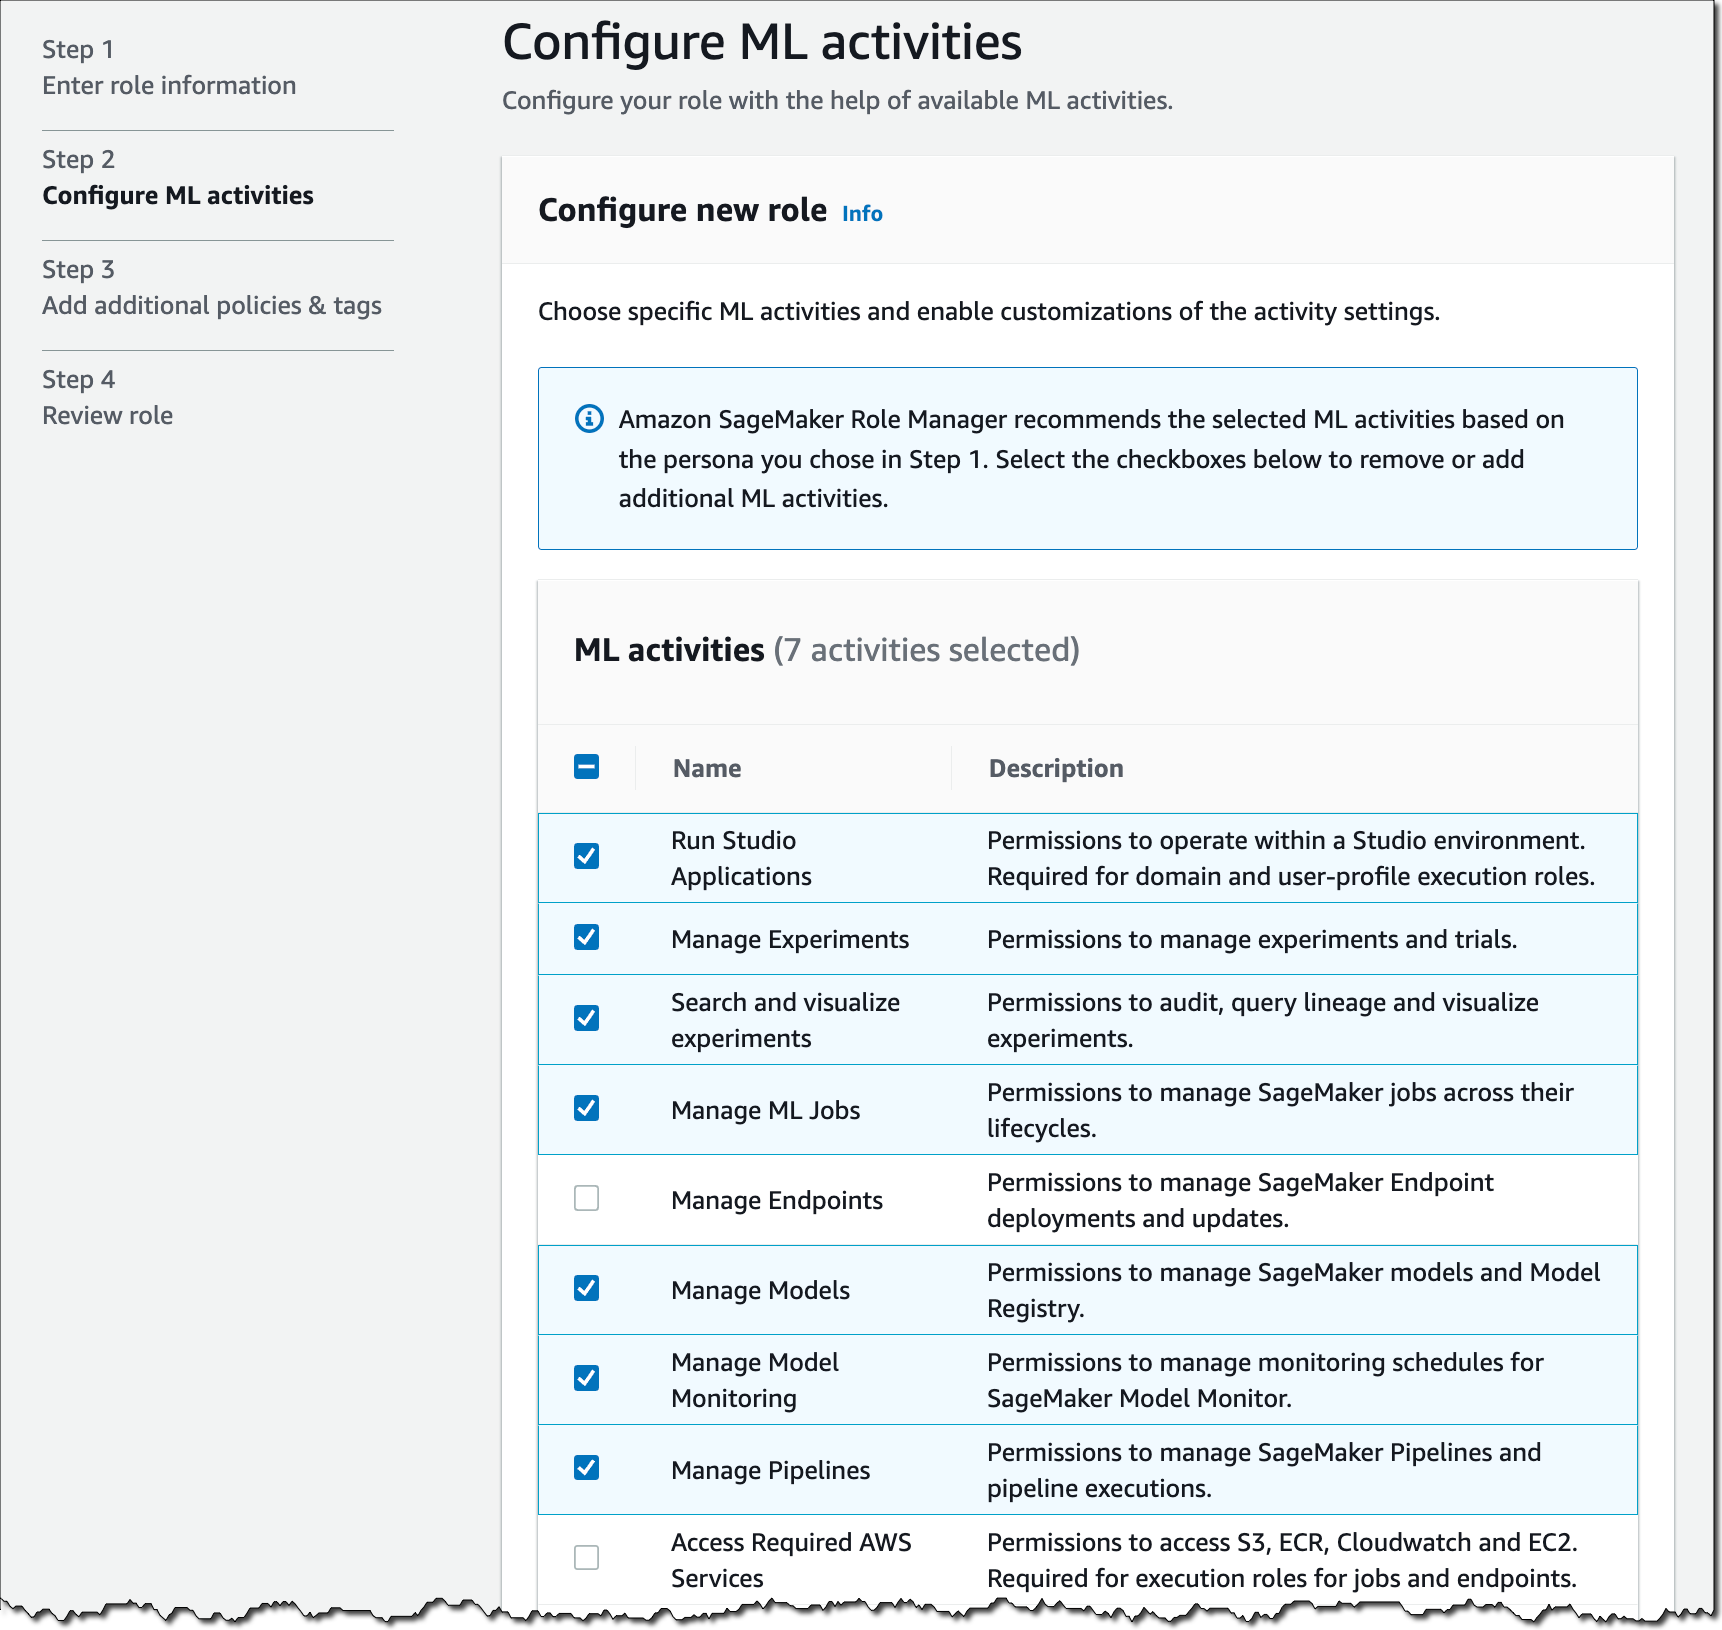
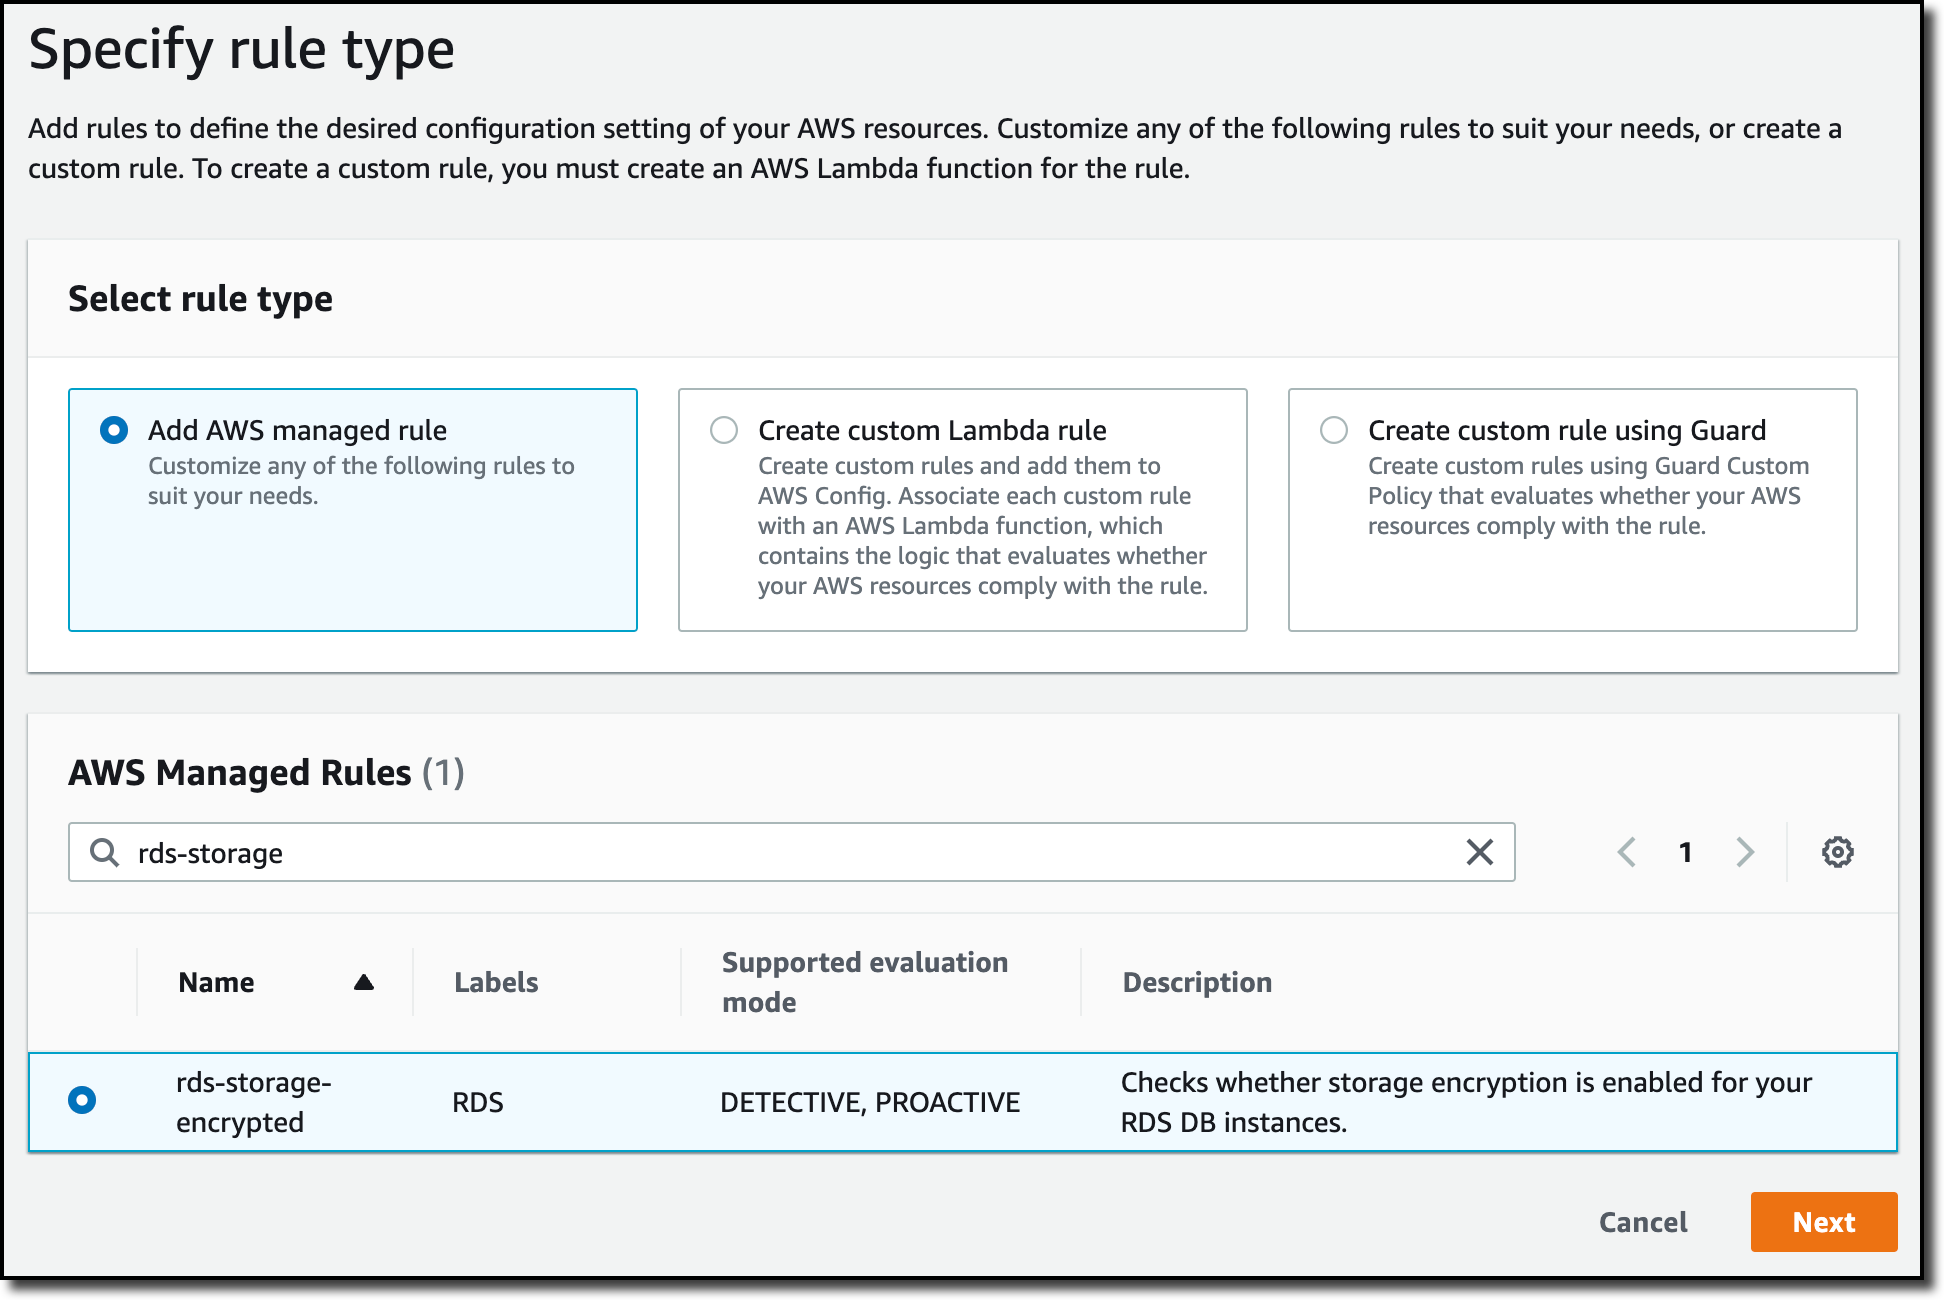
I can enable this new feature for a new or existing EKS cluster. For a new EKS cluster, during the Configure observability setup, I navigate to the Configure network observability section. Here, I select Edit container network observability. I can see there are three included features: Service map, Flow table, and Performance metric endpoint, which are enabled by Amazon CloudWatch Network Flow Monitor.
On the next page, I need to install the AWS Network Flow Monitor Agent.
After it’s enabled, I can navigate to my EKS cluster and select Monitor cluster.
This will bring me to my cluster observability dashboard. Then, I select the Network tab.
Comprehensive observability features Container Network Observability in EKS provides several key features, including performance metrics, service map, and flow table with three views: AWS service view, cluster view, and external view.
With Performance metrics, you can now scrape network-related system metrics for pods and worker nodes directly from the Network Flow Monitor agent and send them to your preferred monitoring destination. Available metrics include ingress/egress flow counts, packet counts, bytes transferred, and various allowance exceeded counters for bandwidth, packets per second, and connection tracking limits. The following screenshot shows an example of how you can use Amazon Managed Grafana to visualize the performance metrics scraped using Prometheus.
With the Service map feature, you can dynamically visualize intercommunication between workloads in your cluster, making it straightforward to understand your application topology with a quick look. The service map helps you quickly identify performance issues by highlighting key metrics such as retransmissions, retransmission timeouts, and data transferred for network flows between communicating pods.
Let me show you how this works with a sample e-commerce application. The service map provides both high-level and detailed views of your microservices architecture. In this e-commerce example, we can see three core microservices working together: the GraphQL service acts as an API gateway, orchestrating requests between the frontend and backend services.
When a customer browses products or places an order, the GraphQL service coordinates communication with both the products service (for catalog data, pricing, and inventory) and the orders service (for order processing and management). This architecture allows each service to scale independently while maintaining clear separation of concerns.
For deeper troubleshooting, you can expand the view to see individual pod instances and their communication patterns. The detailed view reveals the complexity of microservices communication. Here, you can see multiple pod instances for each service and the network of connections between them.
This granular visibility is crucial for identifying issues like uneven load distribution, pod-to-pod communication bottlenecks, or when specific pod instances are experiencing higher latency. For example, if one GraphQL pod is making disproportionately more calls to a particular products pod, you can quickly spot this pattern and investigate potential causes.
Use the Flow table to monitor the top talkers across Kubernetes workloads in your cluster from three different perspectives, each providing unique insights into your network traffic patterns.
Flow table – Monitor the top talkers across Kubernetes workloads in your cluster from three different perspectives, each providing unique insights into your network traffic patterns:
AWS service view shows which workloads generate the most traffic to Amazon Web Services (AWS) services such as Amazon DynamoDB and Amazon Simple Storage Service (Amazon S3), so you can optimize data access patterns and identify potential cost optimization opportunities.
The Cluster view reveals the heaviest communicators within your cluster (east-west traffic), which means you can spot chatty microservices that might benefit from optimization or colocation strategies
External viewidentifies workloads with the highest traffic to destinations outside AWS (internet or on premises), which is useful for security monitoring and bandwidth management.
The flow table provides detailed metrics and filtering capabilities to analyze network traffic patterns. In this example, we can see the flow table displaying cluster view traffic between our e-commerce services. The table shows that the orders pod is communicating with multiple products pods, transferring amounts of data. This pattern suggests the orders service is making frequent product lookups during order processing.
The filtering capabilities are useful for troubleshooting, for example, to focus on traffic from a specific orders pod. This granular filtering helps you quickly isolate communication patterns when investigating performance issues. For instance, if customers are experiencing slow checkout times, you can filter to see if the orders service is making too many calls to the products service, or if there are network bottlenecks between specific pod instances.
Additional things to know Here are key points to note about Container Network Observability in EKS:
Pricing – For network monitoring, you pay standard Amazon CloudWatch Network Flow Monitor pricing.
Availability – Container Network Observability in EKS is available in all commercial AWS regions where Amazon CloudWatch Network Flow Monitor is available.
Export metrics to your preferred monitoring solution – Metrics are available in OpenMetrics format, compatible with Prometheus and Grafana. For configuration details, refer to Network Flow Monitor documentation.
This post demonstrates how to leverage AWS CloudFormation Lambda Hooks to enforce compliance rules at provisioning time, enabling you to evaluate and validate Lambda function configurations against custom policies before deployment. Often these policies impact the way a software should be built, restricting language versions and runtimes. A great example is applying those policies on AWS Lambda, a serverless compute service for running code without having to provision or manage servers. While AWS Lambda already manages the deprecation of runtimes, preventing you from deploying unsupported runtimes, organizations may need to provide and enforce their specific compliance rules not directly linked to the deprecation of a specific language version.
Introducing Lambda Hooks
AWS CloudFormation Lambda Hooks are a powerful feature that allows developers to evaluate CloudFormation and AWS Cloud Control API operations against custom code implemented as Lambda functions. This capability enables proactive inspection of resource configurations before provisioning, enhancing security, compliance, and operational efficiency.
Lambda Hooks provide a mechanism to intercept and evaluate various CloudFormation operations, including resource operations, stack operations, and change set operations (they can also be used with Cloud Control API, but in this post we’re focusing on CloudFormation). By activating a Lambda Hook, CloudFormation creates an entry in your account’s registry as a private Hook, allowing you to configure it for specific AWS accounts and regions. When configuring Lambda Hooks, you can specify one or more Lambda functions to be invoked during the evaluation process. These functions can be in the same AWS account and Region as the Hook, or in another Account you own, provided proper permissions are set up. The evaluation process occurs at specific points in the CloudFormation Stack lifecycle. For instance, during stack creation, update, or deletion, the configured Lambda functions are invoked to assess the proposed changes against your defined compliance rules. Based on the evaluation results, the hook can either block the operation or issue a warning, allowing the operation to proceed.
Lambda Hooks evaluate resources before they are provisioned through CloudFormation, providing a pre-emptive layer of governance. This means that non-compliant resources are caught and prevented from being deployed, rather than requiring retroactive fixes. By leveraging Lambda Hooks, organizations can automate and standardize their compliance checks across all AWS accounts and regions. This centralized approach to policy enforcement ensures consistency and reduces the overhead of managing compliance manually.
Solution Overview
The following sections demonstrate a practical use case for AWS CloudFormation Lambda Hooks, focusing on enforcing compliance rules on AWS Lambda runtimes.
Meet AnyCompany, a forward-thinking enterprise with a robust set of compliance rules governing their software development practices. Among these rules is a strict policy on the use of specific AWS Lambda runtimes.
As they continue to embrace serverless architecture, AnyCompany faces a challenge: how to prevent the deployment of Lambda functions that use non-compliant runtimes. Given their commitment to AWS CloudFormation for deploying Lambda functions, AnyCompany is keen to leverage the power of AWS CloudFormation Lambda Hooks.
We’ll explore the setup process, demonstrate the hook in action, and discuss the broader implications for maintaining compliance in a dynamic cloud environment.
Architecture
The following architecture highlights the implementation of the Lambda Hook. In this implementation, we are using AWS CloudFormation Lambda Hooks to intercept the deployment of Lambda Functions and perform the compliance checks on these resources. The Lambda Hook will interact with an AWS Lambda Function, which will perform the compliance checks. Finally, we’re using AWS Systems Manager Parameter Store to store the Configuration Parameter which contains the list of permitted Lambda Runtimes.
Figure 1: Architecture of the Solution
A Developer (or a CI/CD pipeline) deploys a CloudFormation stack containing Lambda functions.
CloudFormation invokes the respective Lambda Hook, which is configured to intercept operations on AWS Lambda Resources. We are setting this hook to “FAIL” deployment in case checks are not successful.
hook-lambda: directory containing all the code related to the CloudFormation Lambda Hook (Validation Lambda Function, and the CloudFormation template for the Solution)
sample: directory containing the code of the sample used to test the CloudFormation Lambda Hook
deploy.sh: utility script to deploy the Solution via AWS CLI
cleanup.sh: utility script to clean up the AWS CloudFormation Hook infrastructure via the AWS CLI
template.yml: AWS CloudFormation Template containing all the AWS Resources involved in the Solution
Prerequisites
You must have the following prerequisites for this solution:
An AWS account or sign up to create and activate one.
The following software installed on your development machine:
Install the AWS Command Line Interface (AWS CLI) and configure it to point to your AWS account.
Install Node.js and use a package manager such as npm.
Appropriate AWS credentials for interacting with resources in your AWS account.
Walkthrough
Creating the AWS Lambda Validation Function – Lambda Code
The CloudFormation Lambda Hook interacts with a specific Lambda (referred to as Validation Lambda throughout the rest of this post), which gets invoked during CloudFormation CREATE and UPDATE STACK operations involving Lambda Functions. The goal is to check if these Lambda functions have runtimes that comply with AnyCompany’s rules.
Below is the detailed description of the steps that the Validation Lambda function handler follows (the code is written in Typescript).
First, the Validation Lambda retrieves an environment variable containing the SSM Parameter Store parameter name which contains the compliant runtimes list. Additionally, safety checks ensure that only Lambda Resources are considered and that their Runtime property is defined.
Note that both safety checks could be skipped, since the Hook should already be configured to interact only with Lambda Resources and the Lambda’s Runtime property is always required. However, they remain in place to demonstrate how to retrieve this information from the Lambda Hook event in your handler.
const parameterName = process.env.PERMITTED_RUNTIMES_PARAM;
if (!parameterName) {
	throw new Error('Permitted Runtimes Parameter is not set');
}

const resourceProperties = event.requestData.targetModel.resourceProperties;
// Check if this is a Lambda function resource
if (event.requestData.targetType !== 'AWS::Lambda::Function') {
console.log("Resource is not a Lambda function, skipping");
	return {
		hookStatus: 'SUCCESS',
		message: 'Not a Lambda function resource, skipping validation',
		clientRequestToken: event.clientRequestToken
	}
}

// Check runtime version compliance
const runtime = resourceProperties.Runtime;
if (!runtime) {
	console.log("Runtime not defined, failing");
	return {
		hookStatus: 'FAILURE',
		errorCode: 'NonCompliant',
		message: 'Runtime is required for Lambda functions',
		clientRequestToken: event.clientRequestToken
	}
}
Then the Validation Lambda retrieves the value of the Configuration Parameter from SSM Parameter Store through a utility class called ParameterStoreService. For this post, consider that the value inside that Configuration Parameter is a list of strings, where each string contains one of the possible Lambda runtime values that you can find here (e.g. nodejs22.x,nodejs20.x,python3.11,python3.10,java17,java11,dotnet6). After retrieving the value, the Validation Lambda checks if the runtime of the Lambda Resource complies with the configured admitted runtimes. If the runtime is not compliant, you’ll receive a properly formatted response with FAILURE as hookStatus, otherwise the response will contain a SUCCESS hookStatus.
// Retrieve configuration from Parameter Store
const compliantRuntimes = await parameterStoreService.getParameterFromStore(parameterName);

// Check if Lambda runtime is permitted or not
if (!compliantRuntimes.includes(runtime)) {
console.log("Runtime " + runtime + " not compliant ");
	return {
		hookStatus: 'FAILURE',
		errorCode: 'NonCompliant',
		message: `Runtime ${runtime} is not compliant. Please use one of: ${compliantRuntimes.join(', ')}`,
		clientRequestToken: event.clientRequestToken
	}
}

return {
	hookStatus: 'SUCCESS',
	message: 'Runtime version compliance check passed',
	clientRequestToken: event.clientRequestToken
}
For more information about the possible response values of CloudFormation Lambda Hooks Lambda, have a look at this link.
Creating the validation Lambda – Lambda CloudFormation definition
The Validation Lambda function will be deployed via CloudFormation, in the same Stack with the CloudFormation Lambda Hook definition and the AWS Systems Manager Parameter Store Parameter. Here’s the fragment of the CloudFormation Template containing its definition:
Please note that the above template contains a reference to an IAM Role because the Hook requires proper permissions to call the target (Lambda Function). Here’s the IAM Role definition:
Configuring the compliant runtimes – Using Systems Manager Parameter Store
AWS Systems Manager Parameter Store is a secure, hierarchical storage service for configuration data management and secrets management, allowing users to store and retrieve data such as configurations, database strings etc. as parameter values.
In this specific example, we’ll leverage Parameter Store to store our permitted Lambda runtimes configuration. This configuration value is a StringList parameter, containing a comma-separated list of permitted runtimes. Here’s the fragment of the CloudFormation template that defines the Parameter:
Please note the usage of CloudFormation parameters for the ‘Name’ and ‘Value’ properties, allowing for dynamic input when deploying the CloudFormation template.
Deploying the Solution
To deploy the solution you can leverage the script deploy.sh in the root folder of the repository. This script will perform the following actions:
Compile and build the Validation Lambda Function
Create an Amazon S3 Bucket to store the CloudFormation Template
Upload the CloudFormation template and Lambda code to the S3 Bucket
Deploy the CloudFormation template
Testing the Lambda Hook
To test the CloudFormation Lambda Hook, deploy a simple testing CloudFormation template containing a Hello World Lambda function. First, test the Lambda configured with a permitted Lambda runtime, then modify the template to configure the Lambda with a non-compliant runtime.
Here’s the initial definition of the testing CloudFormation Template:
Please note that the Runtime value is nodejs22.x, which is currently in the list of permitted runtimes. The expectation is that the deployment of this function will succeed.
As expected, the deployment was successful. You can also see that the CloudFormation Lambda Hook has been invoked by taking a look at the CloudWatch Logs:
Figure 3: Validation Lambda Function Logs with successful validation
Now modify the original sample Template in order to set a Lambda Runtime which is not inside the list of permitted runtimes:
Deploy this template via AWS CLI with the same command used before and check the CloudFormation Console:
Figure 4: CloudFormation Console showing failed Stack deployment due to Hook intervention
As expected, the deployment was not successful. The CloudFormation Lambda Hook has been invoked, and since the Lambda Runtime was not present in the permitted runtimes list, the deployment failed.
You can also see that the hook failed In the CloudWatch Logs:
Figure 5: Validation Lambda Function Logs with validation error
Cleaning up
To clean up the resources related to the sample, you can run the script cleanup_sample.sh inside the sample folder. This script will delete the sample’s CloudFormation Template through the AWS CLI.
To cleanup the resources related to the solution described above and based on AWS CloudFormation Lambda Hook, you can leverage the script cleanup.sh in the root folder of the repository. This script will perform the following actions:
Delete the CloudFormation Stack
Empty the S3 Bucket used for the deployment of the Stack
Delete the S3 Bucket
Conclusion
In this post, you explored the implementation of CloudFormation Hooks to enforce runtime compliance in Lambda functions across your AWS infrastructure. By leveraging the Lambda hook’s capabilities, you learned how to create a preventative control that validates Lambda runtime configurations before deployment.
By activating the Lambda hook and implementing a custom Lambda function validator, you established an automated mechanism to ensure that only compliant runtimes are used within your organization’s Lambda functions during CloudFormation stack creation and updates. The solution’s integration with common development tools like AWS CLI, AWS SAM, CI/CD pipelines, and AWS CDK makes it straightforward to implement these controls within existing workflows, eliminating the need for manual runtime checks or post-deployment remediation.
The validation approach demonstrated in this post extends beyond Lambda runtimes and can be adapted to different AWS Resources supported by CloudFormation, allowing you to enforce policies on different infrastructure components offered by AWS.
Architecture decision records (ADRs) help you document and communicate important process and architecture decisions in your engineering projects. Based on our experience implementing over 200 ADRs across multiple projects, we’ve developed best practices that can help you streamline your decision-making processes and improve team collaboration.
In this post, you’ll learn:
How to implement ADRs in your organization
Best practices based on more than 200 ADRs across multiple projects
Practical tips for streamlining architectural decision-making
Real-world examples from projects with 10 to more than 100 team members
Common challenges in architecture decision-making
Before implementing ADRs, your teams might face these common challenges:
Team alignment – Development teams spend a huge part of their time (20 –30%, based on our project experience of the past 3 years) coordinating with other teams, which can slow down feature deployment and increase costs through repeated architecture refactoring
Design flexibility – Finding the right balance between upfront design and evolving architecture when working with agile and DevOps approaches
Nonfunctional requirements – Making trade-offs between security, maintainability, and scalability requirements
Changing requirements – Adapting architectural decisions to evolving business goals while maintaining system integrity
Knowledge transfer – Onboard new team members efficiently and make sure they follow the team’s current way of working
How to streamline the decision-making process
We base the recommendations in this post on our experience with several projects, working with teams with fewer than 10 team members as well as complex projects with 100 team members across 10 work streams. We embarked on ambitious projects with a green-field start as well as projects covering ongoing development of new features in production. Especially in teams with 100 people contributing to the code base, we faced the challenge of making sure that collaboration was seamless and decision-making consistent.
To address this challenge, we implemented an ADR mechanism, which served as our guiding light throughout the project’s lifecycle. After more than 3 years of following this approach, we’ve amassed a wealth of experience and best practices that we’re excited to share with the software development community. By capturing the context, alternatives considered, and the rationale behind each decision, ADRs foster transparency, knowledge-sharing, and accountability within teams. Our goal is to guide you through the process of writing effective ADRs with the following best practice recommendations:
Keep ADR meetings short and focused – Effective ADR meetings should be concise and time-bound. Aim to keep them 30–45 minutes maximum. This focused approach keeps discussions on track and participants engaged throughout the process.
Embrace the readout meeting style – Adopt the readout meeting style, where participants spend 10–15 minutes reading the ADR document. Encourage attendees to provide written comments on sections, paragraphs, or sentences that require clarification or where they have differing opinions. This approach promotes active engagement and fosters a bias for action and frugality.
Maintain a cross-functional yet lean participant list – Invite representatives from each team that might be affected by the architectural decision but strive to keep the total number of participants below 10. This cross-functional representation provides diverse perspectives while maintaining a lean and efficient decision-making process, aligning with the principles of frugality and bias for action.
Focus on a single decision – Keep ADRs concise by focusing on a single decision. Don’t hesitate to split up decisions if necessary. Concentrating on one decision at a time simplifies the decision-making process so that participants can thoroughly evaluate the impact during readout sessions. This approach aligns with the principles of ownership and customer obsession.
Separate design from decision – Use a separate design document mechanism to explore alternative options thoroughly. Reference these design documents within the ADR, adhering to the principles of invention and simplification.
Address comments and resolve feedback – Actively follow up on comments received during the ADR review process. Resolve all comments, either by incorporating changes or by discussing and reaching a consensus with the comment author. This practice demonstrates a commitment to delivering results and fostering a sense of ownership.
Push for a timely decision – Avoid prolonged discussions and multiple readout meetings. Based on our experience, one to three ADR readouts should be sufficient. If more sessions are required, reevaluate the dependencies and consider reducing the number of invitees or reducing the scope of the ADR. Most of the decisions are two-way door decisions, meaning that they can be changed with little impact in the future. It’s always better to make a decision and try it fast instead of endlessly discussing it. This approach aligns with the AWS principles of working backwards, customer obsession, delivering results, and being right a lot.
Embrace team collaboration – Approving an ADR is a team effort. The author must own the document and gather feedback from all affected teams before finalizing the decision. This practice encourages having backbone, disagreeing and committing, and fostering a collaborative environment.
Maintain and follow the process – Keep ADRs up to date and follow the established process. If an ADR supersedes a previous one, document the change and link the new ADR in the superseded document. Insist on the highest standards by adhering to the defined processes—consider ADRs as a team law.
Centralize ADR storage – Store ADRs in a central location accessible to all project members, regardless of their team affiliation. This practice promotes transparency and makes sure that architectural decisions are readily available to everyone involved.
Implementation tips and success measures
When implementing these practices, we recommend that you start small with a pilot team, create clear templates, and establish review cycles. Defining success measures such as the time to decision, team satisfaction, architecture rework reduction, or cross-team collaboration improvement help to evaluate your decision-making process
Conclusion
By implementing these best practices for ADRs, you’ll streamline your decision-making processes, foster collaboration, and make sure that architectural decisions are well-documented, communicated, and aligned with your organization’s principles and goals. Embrace these practices and witness the positive impact they have on the success of your software projects.
Landing Zone Accelerator on AWS (LZA) enables customers to deploy a flexible, configuration-driven solution to establish a landing zone while also leveraging AWS Control Tower. At AWS Professional Services, we’ve helped customers deploy and configure LZA hundreds of times. A common request we encounter is integrating LZA configuration into customers’ existing GitOps workflows. GitOps has emerged as a leading model for Infrastructure as Code (IaC), helping organizations automate and manage their cloud infrastructure. The model uses Git repositories as the single source of truth for infrastructure configuration, enabling teams to maintain consistent, version-controlled environments.
In this blog, we will focus on common LZA implementation steps based on our experience, helping customers jump-start their LZA environment and implement GitOps for their AWS infrastructure management. First, we will demonstrate how to leverage LZA while complying with your organization’s policies such as private package repositories. Next, we will guide you through a new installation of LZA that takes advantage of an auto-generated starter set of configuration files. Finally, we will direct you to another blog post that will enable you to leverage GitOps for ongoing management of your LZA configuration.
Architecture overview
The LZA solution leverages two distinct repositories; one for the LZA source code, and another for your organization’s specific configuration files. LZA creates two separate AWS CodePipelines , which are used to install the LZA solution and apply your organization’s specific configuration. Figure 1 illustrates the association between repositories and pipelines. By default, when installing LZA, the solution uses GitHub as the source and pulls the installation files published by AWS from the official LZA GitHub repository.
Figure 1. Landing Zone Accelerator solution components
Deploy LZA as a new install
Step 1: Preparing your enterprise private GitHub to host LZA source code. Customers may choose to deploy LZA from the official AWS GitHub repository for LZA, but we often we find customers have policies in place that require these types of packages to be deployed from a private repository managed by the organization. For customers using GitHub privately in their enterprise, this can be as easy as cloning the LZA source code repository into your own private GitHub repository, enabling you to take advantage of policies and controls within your organization. Before moving to the next step, take a moment and clone the repository into your own private repository. A GitHub personal access token stored in AWS Secrets Manager is required to enable the stack to access your private repository. Before deploying LZA, follow these instructions to enable stack access to your repository.
Step 2: In the organization management account, install LZA as a CloudFormation Stack.
To get started, we will be going through a new installation of the LZA solution. The following steps provide specific parameter options to the CloudFormation template to support a new installation of LZA.
Specify the following parameters for Source Code Repository Configuration, see Figure 2.
For Stack name, specify a name you like.
For Source Location, choose github.
For Repository Owner, specify your GitHub account owner ID.
For Repository Name, specify your cloned LZA source code repository
For Branch Name, specify the branch name of your LZA source code repository.
We intentionally want to use S3 for the configuration repository because as the LZA solution is installed, it will auto-generate a set of starter configuration YAML files and deploy them for us in S3. This makes it very easy to get started with an initial set of customized YAML files for your environment. We choose “No” in the Use Existing Config Repository field, to have LZA to perform a new LZA installation.
Choose Next, and complete the remainder of the stack settings.
Finally, choose Create stack to launch the CloudFormation stack.
The installer stack typically takes minutes to complete (See Figure 4).
Figure 4. LZA installer stack completion
Step 3: Validate two LZA pipelines are created and successfully completed in AWS CodePipeline console.
After the CloudFormation stack completes, open the AWS CodePipeline console. You’ll see a new pipeline named “AWSAccelerator-Installer” running (See Figure 5). This is the LZA Installer pipeline, and it’s connected to the GitHub source repository you specified in Step 2 above with parameters from 2 to 5. This Installer pipeline automatically generates a set of LZA configuration files stored as a compressed ZIP archive in Amazon S3. It will be designated as configuration repository of the LZA solution.
When the AWSAccelerator-Installer pipeline completes, the solution automatically creates and runs a second pipeline named “AWSAccelerator-Pipeline” as shown in Figure 6. This pipeline connects to both the GitHub source repository, and the newly created configuration repository in Amazon S3. The AWSAccelerator-Pipeline is the pipeline that manages your landing zone deployment and customization.
Figure 6. AWSAccelerator-Pipeline created from the AWSAccelerator-Installer pipeline
After the AWSAccelerator-Pipeline completes, your LZA solution is ready for customization.
Step 4: Migrate the LZA configuration repository from S3 to GitHub
With the AWSAccelerator-Pipeline completed, your initial landing zone is now deployed, leveraging the configuration stored in your S3 bucket. For some customers, they may need to ensure that changes to the landing zone configuration are controlled through their existing GitOps processes and tooling. See Figure 7 as an example where the S3 configuration files have been copied to a customer owned GitHub repository. This transition step can be performed in future LZA upgrade window when there is a new release of LZA source code, or right after the initial LZA installation completes in Step 3. For more information on migrating from S3 to GitHub, follow this guide to configure your AWSAccelerator-Pipelines with AWS CodeConnection.
Figure 7. CodeConnection based LZA Configuration Repository
Conclusion
In this post, we explored key steps to streamline your LZA implementation journey. By demonstrating how to work with your private package repositories, providing guidance on leveraging auto-generated configuration files, and introducing GitOps-based management, we’ve outlined a practical path to establish and maintain a robust AWS infrastructure foundation. These approaches can significantly reduce the time and complexity typically associated with LZA deployments while ensuring compliance with organizational policies. We encourage you to try these implementation steps and explore the referenced resources to enhance your AWS cloud operations. For more information about Landing Zone Accelerator, visit the AWS Landing Zone Accelerator on GitHub.
Well, it’s been another historic year! We’ve watched in awe as the use of real-world generative AI has changed the tech landscape, and while we at the Architecture Blog happily participated, we also made every effort to stay true to our channel’s original scope, and your readership this last year has proven that decision was the right one.
AI/ML carries itself in the top posts this year, but we’re also happy to see that foundational topics like resiliency and cost optimization are still of great interest to our audience.
(By the way, if you were hoping for more AI/ML content, head on over to our sister channel, the AWS Machine Learning Blog!).
Without further ado, here are our top posts from 2024!
In keeping with Let’s Architect! series, we have our first of three favorites for the year. This set of resources helps you apply Well-Architected standards in practice.
As I said, Let’s Architect! has a winning series, and they’ve got a finger on the pulse of the tech world. This post about machine learning showcases some of the most exciting things happening at AWS.
Figure 3. Let’s Architect
If you’re more interested in generative AI, you can also take a look at another post from 2024: Let’s Architect! GenAI
Preparedness is another common theme in this year’s favorites. Michael, John, and Saurabh are well-versed in multi-Region architecture, and they’re here to share some strategies to contain failure impact.
Figure 4. When the application experiences an impairment using S3 resources in the primary Region, it fails over to use an S3 bucket in the secondary Region.
Let’s talk cost optimization. This post about a three-tier architecture that relies on the AWS Free Tier is a must-read for anyone looking for tips to help them avoid unnecessary costs (and that’s everyone).
Figure 5. Example of a three-tier architecture on AWS
As usual, Haleh & team are pros at making sure the Well-Architected Framework is current and relevant. Take a look at the enhanced and expanded guidance in all six pillars.
One more winning post from Luca, Federica, Vittorio, and Zamira! This collection of developer resources includes new ideas in AWS Lambda, Amazon Q Developer, and Amazon DynamoDB.
Frugality AND Well-Architected? What a winning combo! This post, inspired by the 2023 re:Invent keynote, outlines the seven laws of Frugal Architecture.
And finally, our number one post of the year! Amit and Luiz showcase a customer solution with real-world applications that builds on the guidelines of other posts in this list! Well done!
Figure 10. The Pilot Light scenario for a 3-tier application that has application servers and a database deployed in two Regions
Thank you!
As always, thanks to our contributors for their dedication and desire to share, and to you, our readers! We would be nothing with you. Literally.
For other top post lists, see our Top 10 and Top 5 posts from previous years.
Amazon Cognito is a developer-centric and security-focused customer identity and access management (CIAM) service that simplifies the process of adding user sign-up, sign-in, and access control to your mobile and web applications. Cognito is a highly available service that supports a range of use cases, from managing user authentication and authorization to enabling secure access to your APIs and workloads. It’s a managed service that can act as an identity provider (IdP) for your applications, can scale to millions of users, provides advanced security features, and can support identity federation with third-party IdPs.
A feature of Amazon Cognito is support for OAuth 2.0 client credentials grants, used for machine-to-machine (M2M) authorization. As your M2M use cases scale, it becomes important to have proper monitoring, optimization of token issuance, and awareness of security best practices and considerations. It’s a best practice for app clients to locally cache and reuse access tokens while still valid and not expired. You can customize how long issued tokens are valid, so it’s important to make sure that the timeframe is aligned with your security requirements. If caching and reusing access tokens isn’t possible at the client level or cannot be enforced, then combining your M2M use cases with a REST API proxy integration using Amazon API Gateway enables you to cache token responses. By using API Gateway caching, you can optimize the request and response of access tokens for M2M authorization. This reduces redundant calls to Cognito for access tokens, thus improving the overall performance, availability, and security of your M2M use cases.
In this post, we explore strategies to help monitor, optimize, and secure Amazon Cognito M2M authorization. You’ll first learn some effective monitoring techniques to keep track of your usage, then delve into optimization strategies using API Gateway and token caching. Lastly, we will cover security best practices and considerations to bolster the security of your M2M use cases. Let’s dive in and discover how to make the most out of your Amazon Cognito M2M implementation.
Machine-to-machine authorization
Amazon Cognito uses an OAuth 2.0 client credentials grant to handle M2M authorization. A Cognito user pool can issue a client ID and client secret to allow your service to request a JSON web token (JWT)-compliant access token to access protected resources. Figure 1 illustrates how an app client requests an access token using the client credentials grant flow with Amazon Cognito.
Figure 1: Client credentials grant flow
The client credential grant flow (Figure 1) includes the following steps:
The app client makes an HTTP POST request to the Amazon Cognito user pool /token endpoint (see The token issuer endpoint for more information), which provides an authorization header consisting of the client ID and client secret, and request parameters consisting of grant type, client ID, and scopes.
After validating the request, Cognito will return a JWT-compliant access token.
The client can make subsequent requests to a downstream resource server using the Cognito issued access token.
The resource server gets a JSON Web Key Set (JWKS) from the Cognito user pool. The JWKS contains the user pool’s public keys, which should be used to verify the token signature.
The resource server uses the public key to verify the signature of the access token is valid (proving the token has not been tampered with). The resource server also needs to verify that the token is not expired and required claims and values are present, including scopes. The resource server should use the aws-jwt-verify library to verify that the access token is valid.
After the access token is verified and the app client is authorized, the requested resource is returned to the app client.
Now, let’s dive deep into the monitoring, optimization, and security considerations around M2M authorization with Amazon Cognito.
Monitoring usage and costs
In May 2024, Amazon Cognito introduced pricing for M2M authorization to support continued growth and expand M2M features. Customer accounts using M2M with Cognito prior to May 9, 2024, are exempt from M2M pricing until May 9, 2025 (for more information, see Amazon Cognito introduces tiered pricing for machine-to-machine (M2M) usage). To get better visibility into your existing Amazon Cognito usage types, you can use the Security tab of the Cost and Usage Dashboards Operations Solution (CUDOS) dashboard. This dashboard is part of the Cloud Intelligence Dashboard, an opensource framework that provides AWS customers actionable insights and optimization opportunities at an organization scale. As shown in Figure 2, the Security tab in the CUDOS dashboard provides visuals that show the cost and spend of Amazon Cognito per usage type and the projected cost for M2M app clients and token requests after the exemption period with daily granularity. This daily breakdown allows you to track how your cost optimization efforts are trending.
Figure 2: Example Amazon Cognito spend and projected cost with daily granularity
You can also see the monthly spend per account for each usage type, as shown in Figure 3.
Figure 3: Example Amazon Cognito spend and projected cost per AWS account
You can see the usage and spend per resource ID of user pools contributing to the cost, as shown in Figure 4. This resource-level granularity enables you to identify the top spending user pool and prioritize usage and cost management efforts accordingly. An interactive demo of this dashboard is available. For more information, see Cloud Intelligence Dashboards.
Figure 4: Example Amazon Cognito resource usage and cost by resource ID, account, and AWS Region
In addition to using the CUDOS dashboard to help understand Cognito M2M usage and costs, you can also request fine-grained usage details down to the app client level. This can include the number of access tokens successfully requested per app client and the last time the app client was used to issue tokens. To understand fine-grained app client usage, you need to make sure that token requests include the client_id request query parameter. This will result in an AWS CloudTrail log event that includes the client ID within the additionalEventData JSON object that is associated with the client credentials token request, as shown in Figure 5.
Figure 5: Sample CloudTrail event log including client_id
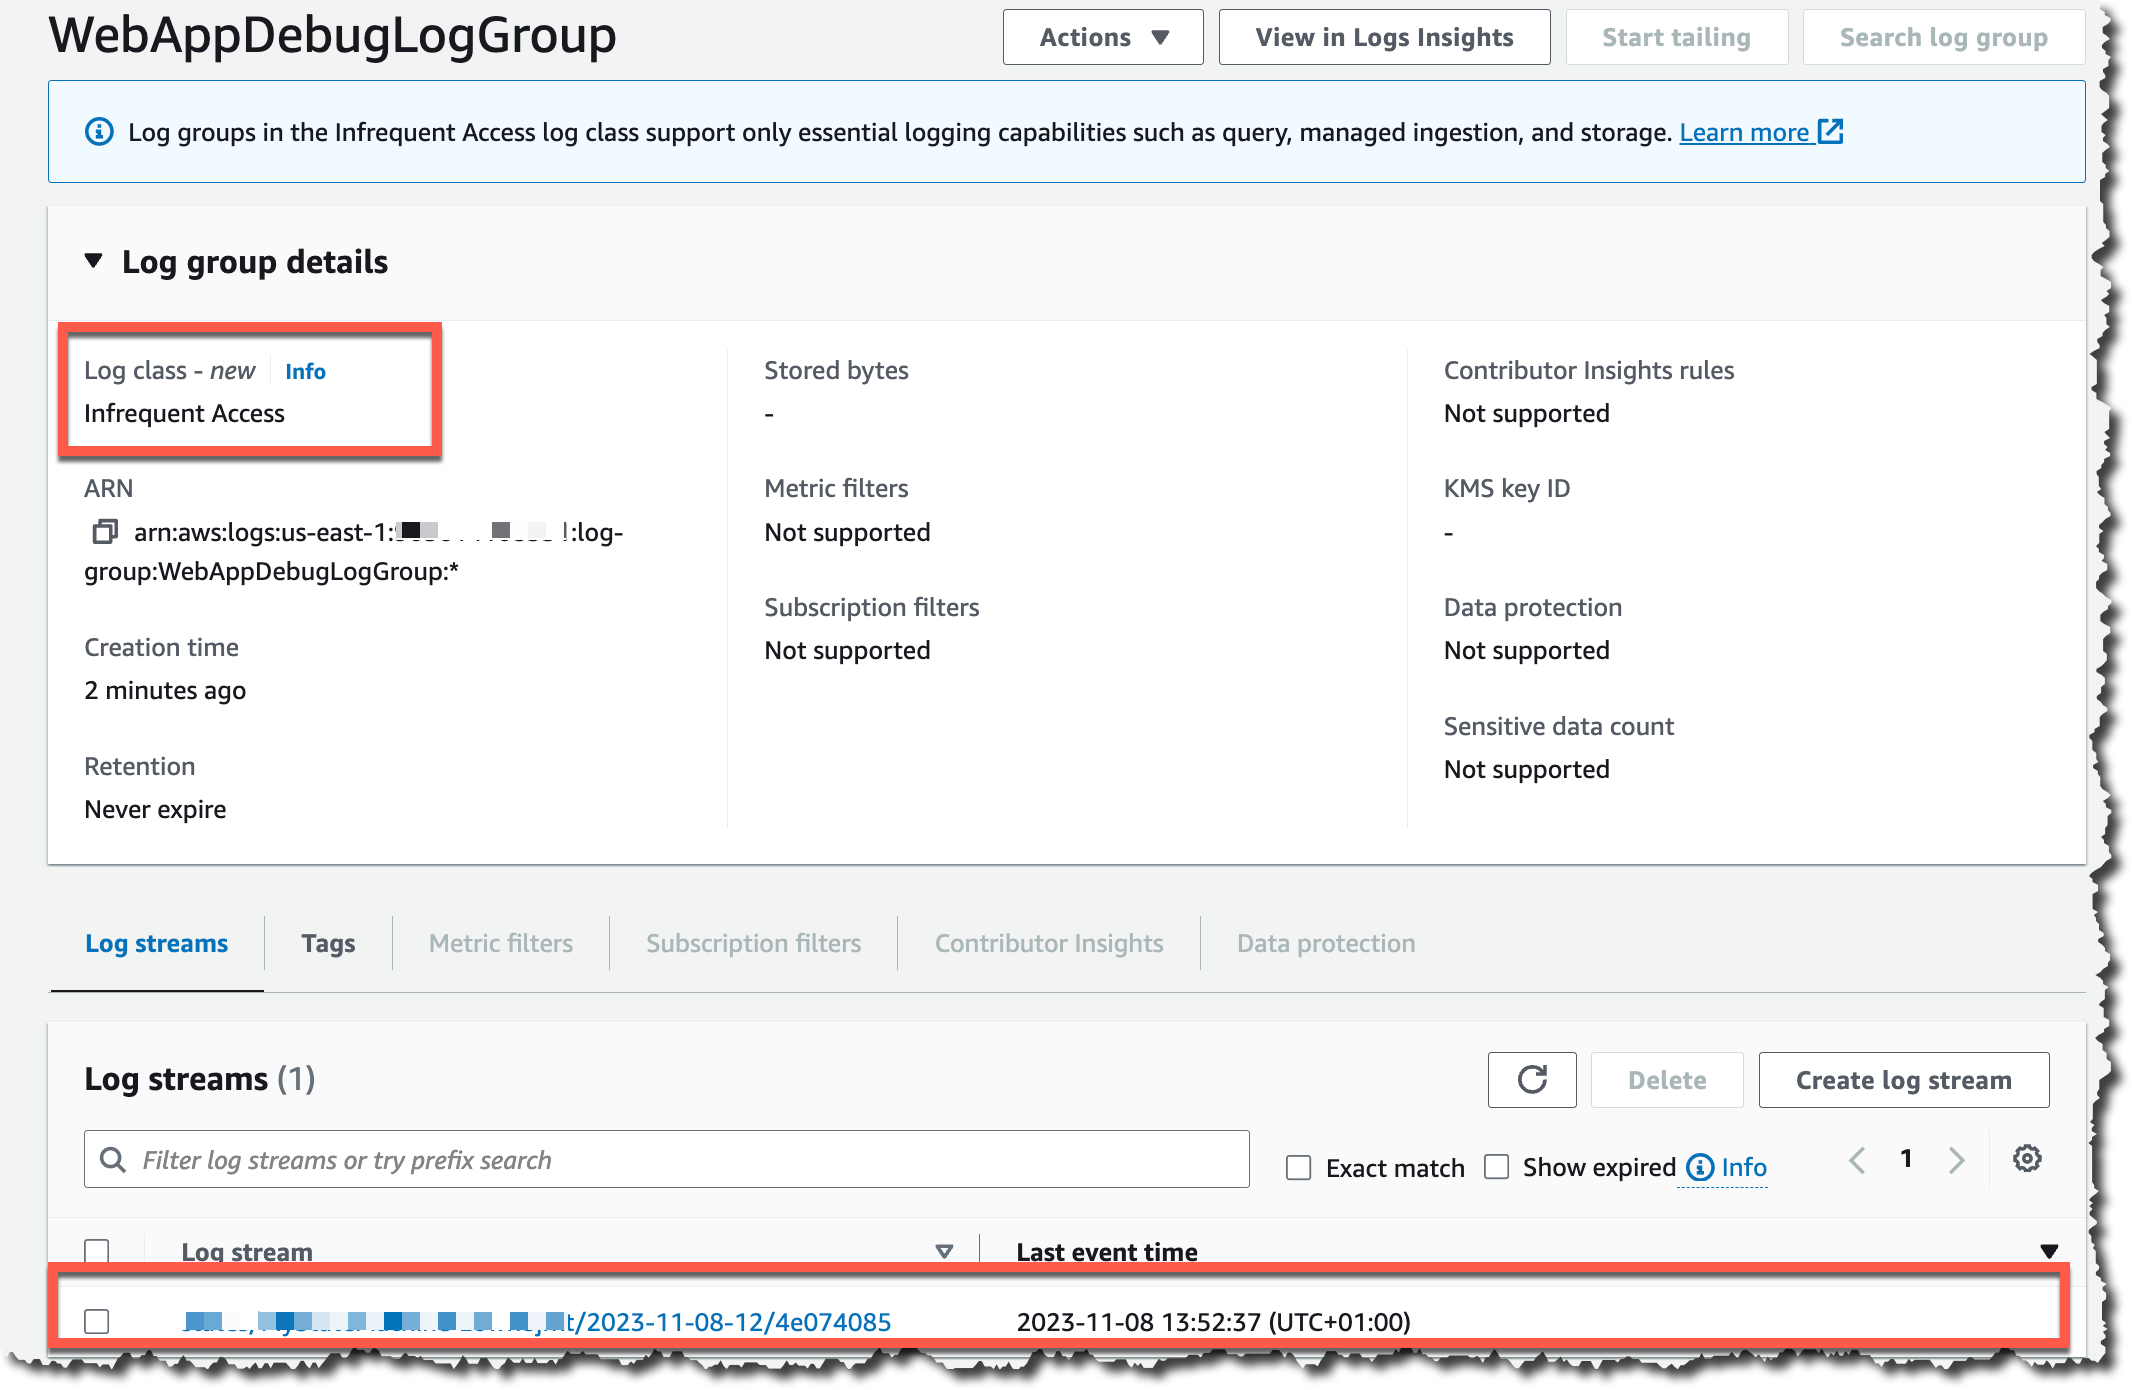
You can also use an Amazon CloudWatch log group to capture and store your CloudTrail logs for longer retention and analysis. Then using CloudWatch Logs Insights, you can use the following sample query to gather app client usage.
fields additionalEventData.userPoolId as user_pool_id, additionalEventData.requestParameters.client_id.0 as client_id, eventName, additionalEventData.responseParameters.status
| filter additionalEventData.requestParameters.grant_type.0="client_credentials" and eventName="Token_POST" and additionalEventData.responseParameters.status="200"
| stats count(*) as count, latest(eventTime) as last_used by user_pool_id, client_id
| sort count desc
Figure 6 is an example result from the preceding CloudWatch Logs Insights query. The result includes the user_pool_id, client_id, count, and last_used columns. The total number of successful token requests grouped per user pool and client ID will be displayed in the count column and the last time the app client successfully issued an access token will be displayed in the last_used column.
Figure 6: Example screenshot result set from CloudWatch Logs Insights query
Optimizing token requests
Now that you know how to better monitor your Amazon Cognito usage and costs, let’s dive deeper into how to optimize your token requests usage. For M2M, it’s recommended that clients use mechanisms to locally cache access tokens to use for authorization. This will reduce the need for the client to request a new access token until the previously issued token is no longer valid. However, the environment where the client runs could be hosted by an external third party or owned by a different team and as the resource owner, you won’t have control over whether the third party implements token caching at the client side. If this is a scenario that you have, you can use a HTTP proxy integration to cache the access token using API Gateway. Because the M2M use case follows the client credentials grant flow of the OAuth 2.0 specification, the /token endpoint of your user pool is what will be configured with the API Gateway proxy integration. This proxy integration is where caching in API Gateway can be used. With caching, you can reduce the number of token requests made to your user pool /token endpoint and improve the latency of the client receiving a cached token in the response. With caching, you can achieve additional benefits, such as cost optimization, improved performance efficiency, higher levels of availability, and custom domain flexibility.
Solution overview
Figure 7: Token caching solution
The solution (shown in the Figure 7) includes the following steps.
The client makes an HTTP POST request to an API Gateway REST API.
The API Gateway method request caches the scope URL query string parameter and the Authorization HTTP request header as caching keys. The integration request is configured as a proxy to the /oauth2/token endpoint of your Amazon Cognito user pool.
Cognito validates the request, making sure that the client ID and client secret are correct from the authorization header, a valid client ID has been provided as a query string parameter, and the client is authorized for the requested scopes.
If the request is valid, Cognito returns an access token to the gateway through the integration response. With caching enabled, the response from the HTTP integration (Cognito token endpoint) is cached for the specified time-to-live (TTL) period.
The method response of the gateway returns the access token to the client.
Subsequent token requests with a remaining cached TTL will be returned, using the authorization header and scope as the caching keys.
To set up token caching, follow the steps in Managing user pool token expiration and caching. After a valid token request is returned through the API Gateway proxy integration and cached, subsequent token requests to the proxy that match the caching keys (authorization header and scope parameter) will return that same access token. This token will be returned to the client until the TTL of the cached token has expired. It’s recommended to set the TTL of the cache to be a few minutes less than the TTL of the access token issued from Amazon Cognito. For example, if your security posture requires access tokens to be valid for 1 hour, then set your caching TTL to be a few minutes less than the 1-hour token validity. It’s also important to understand the ideal caching capacity for your use case. The caching capacity affects the CPU, memory, and network bandwidth of the cache instance within the gateway. As a result, the cache capacity can affect the performance of your cache. See Enable Amazon API Gateway caching for more information. For information about how to determine the ideal cache capacity for your use case, see How do I select the best Amazon API Gateway Cache capacity to avoid hitting a rate limit?. Let’s now explore some security best practices and considerations to raise the security bar of your M2M use cases.
Security best practices
Now that you know how to monitor Amazon Cognito M2M usage and costs and how to optimize access token requests, let’s review some security best practices and considerations. Using OAuth 2.0 client credentials grant for M2M authorization helps protect your APIs. One of the key factors for this is that the access token used by the client to connect to the resource server is a temporary and time-bound token. The client must obtain a new access token after its previous token has expired so you won’t have to issue long-lived credentials that are used directly between the client and the resource server. The client ID and client secret remain confidential on the client and are only used between the client and the Amazon Cognito user pool to request an access token.
Use AWS Secrets Manager
If the workload is running on AWS, use AWS Secrets Manager so you don’t have to worry about hard-coding credentials into workloads and applications. If the workload is running on premises or through another provider, then use a similar secrets’ vault or privileged access management solution to house the workload credentials. The workload should retrieve credentials for authentication only at runtime.
Use AWS WAF
It’s a security best practice to use AWS WAF to protect your Amazon Cognito user pool endpoints. This can help protect your user pools from unwanted HTTP web requests by forwarding selected non-confidential headers, request body, query parameters, and other request components to an AWS WAF web access control list (ACL) associated with your user pool. By using AWS WAF, you can also add managed rule groups to your user pool, such as the AWS managed rule group for Bot Control, to add protection against automated bots that can consume excess resources, cause downtime, or perform malicious activities. Learn more about how to associate an AWS WAF Web ACL with your Cognito user pool.
Always verify tokens
After a client has obtained an access token, it’s important to make sure the client is authorized to access the requested resources. If the resource is using API Gateway and the built-in Amazon Cognito authorizer, then the integrity of the token, the signature, and token expiration are checked and validated for you. However, if you require a more custom authorization decision with API Gateway, you can use an AWS Lambda authorizer along with the aws-jwt-verify library. By doing so, you can verify that the signature of the JWT token is valid, make sure that the token isn’t expired, and that the necessary and expected claims are present (including necessary scopes). For more fine-grained authorization decisions, look into using Amazon Verified Permissions with the resource server or even within a Lambda authorizer. If the resource server is an external system that is, outside of AWS or a custom resource server, you want to make sure that the access token is validated and verified before the requested resources are returned to the client.
Define scopes at the app client level
It’s important to carefully define and constrain the scope of access for each app client to align with the principle of least privilege. By restricting each client ID to only the necessary scopes, organizations can minimize the risk of issuing access tokens with more access and permissions than is required. If your use case aligns with M2M multi-tenancy, consider creating a dedicated app client per tenant and using defined custom scopes for that tenant. Remember that the number of M2M app clients is a pricing dimension and will incur a cost. See Custom scope multi-tenancy best practices for more information.
Security considerations
If you’re using API Gateway to proxy token requests and caching access tokens, the following are some security considerations to raise the security bar of your M2M workload.
Allow token requests only through an API Gateway proxy
After your API Gateway proxy integration is configured and set up for optimization and you have AWS WAF configured for your user pool, you can add an additional layer of security by using an allow list so that only requests from your API Gateway proxy to your Amazon Cognito user pool are accepted. For this, inject a custom HTTP header within the integration request of the POST method execution and create an allow rule within your web ACL that looks for that specific header. You will also create an additional web ACL rule to block all traffic. The single allow rule will have a priority order of 0 and the block-all-traffic rule will have a priority order of 1. Ultimately, this will block all requests that go directly to your Cognito user pool /token endpoint and only allow requests that have been made through the API Gateway proxy. Figure 8 that follows is a deeper explanation of this setup.
Figure 8: Token caching solution with AWS WAF
The process shown in Figure 8 has the following steps:
The client makes a direct HTTP POST call to the /oauth2/token endpoint of the Amazon Cognito user pool. This request would be denied by the AWS WAF web ACL deny all rule.
The client initiates an OAuth2 client credentials grant (HTTP POST) against an API Gateway stage (/token).
The REST API gateway is a proxy integration to the /oauth2/token endpoint of the Cognito user pool.
Within the integration request settings, configure a custom header (for example, x-wafAuthAllowRule). Treat the value of this header as a secret that remains only within the API Gateway integration request and is not exposed outside of the gateway.
Consider using Lambda, Amazon EventBridge, and AWS Secrets Manager to automatically rotate this header value in both the API Gateway integration request and in the AWS WAF web ACL rule.
The request is proxied to the Cognito /oauth2/token endpoint and AWS WAF is configured to protect the Cognito user pool endpoints and therefore web ACL rules are evaluated.
The custom header from the integration request (the preceding step) is evaluated against the web ACL rules to allow this request.
Cognito will verify the authorization header (containing the client ID and client secret) and requested scopes.
After successful credential validation, an access token is returned to the gateway within the integration response.
The access token is cached using the following caching keys:
Authorization header.
Scope query string parameter.
The access token is returned to the client through API Gateway.
Subsequent token requests with a remaining cached TTL are returned to client immediately, using the authorization header and scope as the caching keys.
Additional authorizer with API Gateway
Using the client credentials grant is designed to obtain an access token so that an app client can access downstream resources. If you’re using API Gateway as a proxy integration to your token endpoint, as described previously, you can also use a separate authorizer with an API Gateway proxy. Therefore, to begin the OAuth 2.0 client credentials grant flow, a separate authorization takes place first. For example, if you’re in a highly regulated industry, you might require the use of mTLS authentication to obtain an access token. This might seem like a double-authentication scenario; however, this helps prevent unauthenticated attempts against your API Gateway proxy integration to get an access token from Amazon Cognito.
Encrypting the API cache
While configuring your API Gateway proxy integration and provisioning your API cache, you can enable encryption of the cached response data. Because this caches access tokens for the set TTL of your choosing, you should consider encrypting this data at rest if necessary to help meet your security requirements. You can use the default method caching or set an override stage-level caching and enable encryption at rest.
Conclusion
In this post, we shared how you can monitor, optimize, and enhance the security posture of your machine-to-machine (M2M) authorization use cases with Amazon Cognito. This involved using the Cost and Usage Dashboards Operations Solution (CUDOS) to understand your Cognito M2M token requests and costs. We also discussed using caching from Amazon API Gateway as an HTTP proxy integration to the Cognito user pool /oauth2/token endpoint. By following the guidance in this post, you can better understand your M2M usage and costs and achieve added benefits such as cost optimization, performance efficiency, and higher levels of availability. Lastly, we provided several security best practices and considerations that can be used as additional layers to elevate your security posture.
If you have feedback about this post, submit comments in the Comments section below. If you have questions about this post, start a new thread on Amazon Cognito re:Post or contact AWS Support.
As organizations increasingly use generative AI to streamline processes, enhance efficiency, and gain a competitive edge in today’s fast-paced business environment, they seek mechanisms for measuring and monitoring their use of AI services.
To help you navigate the process of adopting generative AI technologies and proactively measure your generative AI implementation, AWS developed the AWS Audit Manager generative AI best practices framework. This framework provides a structured approach to evaluating and adopting generative AI technologies and addresses important aspects such as strategy alignment, governance, risk assessment, and security and operational best practices. You can use the framework within AWS Audit Manager as you implement generative AI workloads, to measure and monitor existing workloads through Audit Manager capabilities such as automated evidence collection and customized assessment reports.
In this blog post, we’ll cover the AWS Audit Manager generative AI best practices framework and how it can help you during your generative AI journey. We’ll highlight key considerations to prioritize when deploying generative AI workloads, and discuss how the framework can facilitate auditing and compliance with generative AI-specific controls using Audit Manager.
Starting the generative AI Journey
An important consideration in preparing for the introduction of generative AI in your organization is the need to align your risk management strategies with robust mitigation measures. Examples of potential risks include the following:
Data quality, reliability, and bias: Poor source-data quality used to train models might lead to inconsistent, inaccurate, or biased outputs, which can have significant financial and regulatory impact for organizations. For example, a language model trained on biased data might generate text that reinforces harmful stereotypes or propagates misinformation. Similarly, training AI on biased product reviews or ratings might lead to product suggestions that don’t accurately reflect product quality or user preferences.
Model explainability and transparency: The opaque nature of many generative AI models makes it challenging to understand how they arrive at specific outputs or decisions. For example, if a model is used to generate creative content, such as stories or learning materials, it could be difficult to understand why certain outputs are generated, including potential biases or inappropriate content.
Data privacy and security: Generative AI models are trained on vast amounts of data, which might inadvertently include sensitive or personal information. For example, a model trained to generate text could potentially produce sentences that contain personal details from its training data.
AWS empowers organizations to use this technology responsibly while helping them to align with best practices. As part of enabling organizations to create a comprehensive risk management strategy for generative AI systems, AWS has built the AWS Audit Manager generative AI best practices framework which is mapped to Amazon Bedrock and Amazon SageMaker in AWS Audit Manager.
Amazon Bedrock is a managed service that enables you to create, manage, and scale machine learning (ML) and AI services while facilitating adherence to security and defined compliance requirements. Amazon SageMaker is a fully managed ML service that can build, train, and deploy ML models for extended use cases that require deep customization and model fine-tuning.
You can use this framework to facilitate your auditing and compliance requirements by taking advantage of controls for more responsible, ethical, and effective deployment of generative AI models.
The framework is organized into four pillars, as follows:
Data Governance: Data is the foundation of generative AI models, and the quality and diversity of the training data can significantly impact the model’s performance and output. The Data Governance pillar focuses on facilitating data management practices such as data sourcing, data quality, data privacy, and data bias.
Model Development: This pillar focuses on the responsible development and testing of generative AI models and covers aspects such as model architecture selection, model training, and model evaluation.
Model Deployment: This pillar addresses the challenges associated with deploying generative AI models in production environments and covers aspects such as model deployment strategies, infrastructure considerations, and access controls.
Monitoring & Oversight: This pillar focuses on the ongoing monitoring and governance of generative AI models in production environments and addresses aspects such as model performance monitoring and incident response planning.
You can also use Amazon Bedrock Guardrails to provide an additional level of control on top of the protections built into foundation models (FMs) to help deliver relevant and safe user experiences that align with your organization’s policies and principles.
Each organization’s generative AI journey is unique, influenced by factors such as industry-specific regulations, risk appetite, and scale of generative AI deployment. By integrating the framework with Amazon Bedrock or Amazon SageMaker, you can customize the controls to your organization’s unique needs, aligning your generative AI deployments with your specific risk management strategies. This customization is especially valuable for highly regulated sectors, such as the financial sector.
For example, you can map the risk of inaccurate outputs to controls related to data quality and model validation. Similarly, you can map data security risks to controls related to access management and encryption.
Let’s consider an example that uses a subset of these risks to understand how you could perform this mapping. A financial services firm decides to use generative AI models to develop a chatbot capable of understanding complex customer inquiries and providing accurate and tailored responses for their customer portal. Although chatbots can greatly enhance customer experiences and operational efficiency, they also introduce risks that you need to understand and measure, so that you can develop a corresponding mitigation strategy.
An auditor within the internal audit function of the financial organization would like to use the AWS Audit Manager generative AI best practices framework to assess compliance with the following sample of risks associated with the application:
Responsible: Validating that the chatbot adheres to ethical principles, such as fairness and transparency, and avoids perpetuating biases or discrimination against certain customer segments.
Accurate: Verifying the reliability and accuracy of the chatbot’s responses, particularly when handling sensitive financial information or providing advice on complex financial products.
Secure: Protecting the integrity and security of the data being used to train the generative AI model from unauthorized access and validating that sensitive customer data is segregated from data used for training.
Example mapping
We’ve provided an example mapping here that illustrates how you can use the framework within Audit Manager to develop a risk management strategy. Based on your individual control objectives and organizational requirements, you can further customize controls, and evidence collection can be automated or manually defined. The example mapping is as follows:
Responsible: Implement mechanisms for AI model monitoring and explainability to detect and mitigate potential biases or unfair outcomes.
RESPAI3.8: Document Risks and Tolerances: Define, document, and implement specific controls to address identified risks and organizational risk tolerances.
RESPAI3.9: Develop AI RACI: Define organizational roles and responsibilities, lines of communication, and ownership of controls to address identified risks. Ensure that this mapping, measuring, and managing of generative AI risks is clear to individuals and teams throughout the organization.
RESPAI3.13: Continuous Risk Monitoring: Periodically perform retrospectives and review policies and procedures to determine if new risks should be considered, and if current risks are addressed based on AI performance, incidents, and user feedback.
RESPAI3.15: Ethical Guidelines: Develop and adhere to ethical guidelines for the deployment and usage of generative AI models.
Accurate: Implement robust data quality checks, model validation processes, and ongoing monitoring to ensure the accuracy and reliability of the generative AI chatbot’s outputs.
ACCUAI3.4: Regular Audits: Conduct periodic reviews to assess the model’s accuracy over time, especially after system updates or when integrating new data sources.
ACCUAI3.6: Source Verification: Ensure that the data source is reputable, reliable, and the data is of high quality.
ACCUAI3.14: Quality Data Sourcing: The accuracy of generative AI largely depends on the quality of its training data. Ensure that the data is representative, comprehensive, and free from biases or errors.
Secure: Implement robust access controls, data encryption, and security monitoring measures to protect the generative AI chatbot system and training data.
SECAI3.2: Data Encryption In Transit: Implement end-to-end encryption for the input and output data of the AI models to minimum industry standards.
SECAI3.3: Data Encryption At Rest: Implement data encryption at rest for data that’s stored to train the AI models, and for the metadata that’s produced by AI models.
Note: This is an example of a control that can be configured with automated evidence collection using AWS Config as the underlying data source, or further customized with additional data sources according to the scope of the control.
SECAI3.7: Least Privilege: Document, implement, and enforce least privileged principles when granting access to generative AI systems.
SECAI3.8: Periodic Reviews: Document, implement, and enforce periodic reviews of users’ access to generative AI systems.
Note: This is an example of a control that can be configured with manual evidence collection based on the specific policies and procedures defined by each organization.
SECAI3.15: Access Logging: Require and enable mechanisms that allow users to request access to generative AI models. Ensure that access requests are properly logged, reviewed, and approved.
Conclusion
It’s important for institutions, especially those in highly regulated sectors, to proactively address new developments that relate to generative AI. Using the AWS Audit Manager generative AI best practices framework as part of a comprehensive risk management strategy can help you stay ahead of the curve and embrace an agile and responsible approach to generative AI.
The guidance provided by the framework, together with the capabilities of Audit Manager, Amazon Bedrock and SageMaker can help you establish secure and controlled environments for generative AI implementation, automate evidence collection and risk assessments, and monitor and mitigate potential risks. By embracing the potential of generative AI while adhering to best practices, you can position your organization at the forefront of innovation while maintaining the trust and confidence of stakeholders and customers.
If you have feedback about this post, submit comments in the Comments section below. If you have questions about this post, contact AWS Support.
AWS CloudFormation is a service that allows you to define, manage, and provision your AWS cloud infrastructure using code. To enhance this process and ensure your infrastructure meets your organization’s standards, AWS offers CloudFormation Hooks. These Hooks are extension points that allow you to invoke custom logic at specific points during CloudFormation stack operations, enabling you to perform validations, make modifications, or trigger additional processes. Among these, the Lambda hook is a powerful option provided by AWS. This managed hook allows you to use Lambda functions to validate your CloudFormation templates before deployment. By using a Lambda hook, you can invoke custom logic to check infrastructure configurations on create or update or delete CloudFormation resources or stacks or change sets, as well as create or update operations for AWS Cloud Control API (CCAPI) resources. This enables you to enforce defined policies for your infrastructure-as-code (IaC), preventing the deployment of non-compliant resources or emitting warnings for potential issues. In this blog post, you will explore how to use a Lambda hook to validate your CloudFormation templates before deployment, ensuring your infrastructure is compliant and secure from the start.
Introducing Lambda Hook
The Lambda hook is an AWS-provided managed hook with the type AWS::Hooks::LambdaHook. It simplifies the integration of custom logic into CloudFormation stacks. This powerful feature allows you to focus on building and testing your custom logic as a Lambda function, without the complexity of creating a hook from scratch.
By using the Lambda hook, you can activate a pre-built hook and deploy your custom logic into a Lambda function using familiar tools like AWS CLI or AWS Serverless Application Model (SAM) or AWS Cloud Development Kit (CDK). This approach reduces the number of components you need to manage in your workflow, allowing for more streamlined operations. The Lambda hook also offers flexible evaluation capabilities, enabling you to respond to specific template properties or configurations as needed.
One of the key advantages of the Lambda hook is the enhanced control it provides. You can benefit from features such as VPC integration, local logging, and granular resource management, all while leveraging the power of AWS Lambda functions. To get started with the Lambda hook, you’ll need to activate it in your AWS account. This activation process eliminates the need for authoring, testing, packaging, and deploying a custom hook using the AWS CloudFormation Command Line Interface (CFN-CLI), significantly simplifying your workflow.
Example Use Case: S3 Bucket Versioning Validation
This blog post demonstrates using the Lambda hook to validate S3 Bucket versioning before deployment. While focused on S3 buckets, this approach can be applied to other resource types, properties, stack, and change set operations.
By leveraging the Lambda hook, you’ll streamline custom logic integration into your CloudFormation stacks. The process involves:
This example showcases how to enhance your infrastructure-as-code practices, ensuring compliant and secure deployments from the start.
Architecture
This section shows you how the Lambda hook and Lambda function work together to enhance your CloudFormation deployments.
Lambda hook and Lambda function
First, you need to create a Lambda function with the business logic to respond to the hook. Then, you need to create an IAM execution role with the necessary permissions to invoke the Lambda Function. Once you have the Lambda function and the IAM execution role, you can activate the AWS provided Lambda hook. Follow the steps in the documentation to activate a Lambda hook from the AWS console. Alternatively, you can activate it using the AWS Command Line Interface (AWS CLI) by using the activate-type and set-type-configuration commands. Lastly, you can also use AWS::CloudFormation::LambdaHook as a CloudFormation resource to activate and configure Lambda hook from a CloudFormation template. You can share this resource across your other accounts and regions using AWS CloudFormation StackSets by following this blog.
Lambda hook in action
The following diagram and explanation illustrate the step-by-step workflow of how Lambda hook integrates with your CloudFormation operations, providing a visual representation of the process from template creation to resource deployment or modification.
Diagram 1: Lambda hooks in action
The architecture diagram illustrates the step-by-step flow of how the Lambda hook is used during a CloudFormation stack operation.
Author a template: Author a CloudFormation template, including the necessary resources to configure.
Create the stack: The CloudFormation stack creation process has started, but the process of creating the defined resources in the template has not yet begun.
Request is received by CloudFormation service: When a resource creation, update, or deletion is requested, the CloudFormation service receives the request.
Invoke the Hook: The CloudFormation service then invokes the Lambda hook.
The hook invokes your the Lambda Function: The Lambda hook, in turn, triggers the execution of the Lambda function that was defined in the hook activation.
The Lambda function processes the request and responds back to the Hook: The Lambda function processes the request, performing validation, or additional tasks as required. The Lambda function then responds back to the Lambda hook.
The stack workflow progresses further in either continuing the resource creation/update/deletion with/without a warning or fails: Based on the Lambda function’s output, the Lambda hook either allows the stack operation to proceed with the resource operation (for example, creation of the resource), or deny the resource operation causing a rollback of the stack.
This workflow demonstrates how Lambda hook seamlessly integrates into the CloudFormation stack deployment process, allowing you to implement custom validations, enforce policies, and extend the capabilities of your infrastructure-as-code deployments through the power of Lambda functions. By leveraging the Lambda hook and the custom Lambda function, customers can extend the capabilities of their CloudFormation deployments, enabling advanced use cases such as resource validation, or additional task execution.
Sample Deployment
This section shows you how to enable the Lambda hook, which is of type AWS::Hooks::LambdaHook, and add the business logic in the Lambda function to validate the versioning configuration of an S3 bucket. The sample solution shown in this blog post demonstrates the hook triggering for the resource type AWS::S3::Bucket, and if you want to trigger this for every resource type, then you can use the Resource filter within Hook filters configuration that can take wildcard"AWS::*::*" as a value or multiple targets of resource types for example "AWS::S3::Bucket", "AWS::DynamoDB::Table", and you’ll also want to make sure that the Lambda Function has the logic to handle the additional resource type. You can also add additional Hook targets , for example to validate your STACK or CHANGE_SET.
In the example used in this blog post, you will configure the hook and activate on create and update operations operations. For more information about TargetFilters, see Hook configuration schema and for more information about Lambda hook see here. With these modifications, you need to consider two important points: First, you will need to handle the business logic to deal with different resource types in your Lambda function code. Second, additional pricing may apply based on your resource usage, for more details see the Lambda pricing page.
Creating the Lambda Function
You can create a Lambda function in several ways – on the AWS Console, using CloudFormation, using AWS CLI, or by directly invoking the API via SDK. In this section, we will cover creating a Lambda function with a few clicks on the AWS console. See Using Lambda with infrastructure as code (IaC) for deploying Lambda Function using SAM CLI, CDK or CloudFormation.
The Lambda Function code is designed to process the event received from the Lambda hook and validate the versioning configuration of the target S3 bucket resource. Here’s a detailed explanation of the code:
The function first extracts the relevant information from the event, including the invocation point and the target resource type.
It then checks if the current invocation point is in the configured HOOK_INVOCATION_POINTS list and if the target resource type is AWS::S3::Bucket. If not, the function returns a success response, skipping the validation for this particular invocation.
Note: this code that skips the validation is put here as a fallback logic in the event the user has not chosen to use TargetFilters. As this is a wildcard hook, without TargetFilters the hook will always be invoked for any AWS resource type described in the template, and since the hook targets preCreate, preUpdate, and preDelete by default, the hook will be invoked for these invocation points by default. To narrow the scope and reduce costs by avoiding to invoke the hook for all AWS resource type targets and invocation points, use TargetFilters.
Next, the function retrieves the resource properties from the event, specifically looking for the VersioningConfiguration property and its Status.
If the VersioningConfiguration property is not present or its Status is not set to Enabled, the function returns a failure response, indicating that the versioning is not enabled for the S3 bucket.
If the versioning is enabled, the function returns a success response.
The function also includes a fallback mechanism to return a failure response in case of any other exceptions. By evaluating this sample code, you can validate the versioning configuration of the S3 bucket during the CloudFormation stack creation and update processes, with your infrastructure-as-code policies.
Enabling Lambda Hook in your AWS Account/Region
Navigate to the AWS CloudFormation service on the AWS Console, then choose “Create Hook” → “with Lambda” from the main Hooks page:
Diagram 2: Create a Hook with Lambda console page
You will see the page explaining how the Lambda function work as a hook.
Diagram 3: Provide a Lambda function to Hook Console page
Provide the Hooks details: the name, the Lambda function it should take, the type, and the mode. You can also create your execution role directly from the console by choosing “New execution role”.
Diagram 3: Provide a Lambda function to Hook Console page
You can review the Lambda hook and activate it from the next page.
Diagram 4: Review Lambda hook Console page
Test a sample
In this section, you will test the hook and the Lambda Function that you activated for a S3 bucket resource.
Create an S3 Bucket without versioning
AWSTemplateFormatVersion: "2010-09-09"

Description: This CloudFormation template provisions an S3 Bucket without versioning enabled

Resources:
  S3Bucket:
    DeletionPolicy: Delete
    Type: AWS::S3::Bucket
    Properties:
      BucketName: !Sub test-bucket-versioning-1-${AWS::Region}-${AWS::AccountId}
You will see the hook invoking Lambda function and the Lambda Function responding back with a failure message since the Versioning is not enabled.
When you create or update a stack with the template above, the Lambda hook will be invoked, and the Lambda Function will respond with a failure message since bucket versioning is not enabled. The Lambda Function code will extract the resourceProperties from the event, check the VersioningConfiguration property, and find that the Status is not set to Enabled. As a result, if you use the example template above where you describe the S3 bucket without versioning enabled, the Lambda Function will send a failure response back to the hook, causing the CloudFormation stack operation to fail as shown in the following screenshot.
Diagram 5: Lambda Hook failure Stack
Create an S3 Bucket with versioning enabled You can try creating an S3 Bucket with versioning enabled to see how Hooks assessment succeeded.
AWSTemplateFormatVersion: "2010-09-09"

Description: This CloudFormation template provisions an S3 Bucket with Versioning enabled

Resources:
  S3Bucket:
    DeletionPolicy: Delete
    Type: AWS::S3::Bucket
    Properties:
      BucketName: !Sub test-bucket-versioning-2-${AWS::Region}-${AWS::AccountId}
      VersioningConfiguration:
        Status: Enabled
In this case, you will see the hook invoking the Lambda function and getting a success message since the Versioning is enabled
When you create a stack with this CloudFormation template, the Lambda hook will be invoked, and the Lambda Function will respond with a success message since the versioning is enabled. The Lambda Function code will extract the resourceProperties from the event, check the VersioningConfiguration property, and find that the Status is set to Enabled. As a result, the Lambda Function will send a success response back to the hook, allowing the CloudFormation stack operation to proceed as shown in the following screenshot.
Diagram 6: Lambda Hook success Stack
By testing these two scenarios, you can verify that the Lambda hook and the associated Lambda Function are working as expected, enforcing the S3 bucket versioning policy during CloudFormation stack operations.
In this blog post, you explored the capabilities of CloudFormation Hooks and how they can be leveraged to extend the functionality of your infrastructure-as-code deployments. Specifically, you learned about the Lambda hook, a pre-built hook that simplifies the process of integrating custom logic into your CloudFormation stacks.
By activating the Lambda hook, and deploying a custom Lambda Function, you were able to validate the versioning configuration of an S3 bucket during the CloudFormation stack creation and update processes. This approach allows you to enforce infrastructure-as-code policies and ensure compliance at the point of deployment, rather than relying on post-deployment checks or indirect governance mechanisms. The ability to leverage familiar tools and workflows, such as the AWS CLI, AWS SAM, CI/CD pipelines, or the AWS CDK, makes it easier to incorporate custom logic into your CloudFormation deployments. This reduces the overhead and complexity associated with traditional hook orchestration and packaging, empowering you to streamline your infrastructure-as-code practices.
As you continue to build and deploy your cloud infrastructure, consider exploring the various CloudFormation Hooks available, for example, see aws-cloudformation/aws-cloudformation-samples and aws-cloudformation/community-registry-extensions GitHub repositories. The approach demonstrated in this blog post can be applied to other resource types supported by CloudFormation, allowing you to validate and enforce policies for a wide range of infrastructure components, from EC2 instances and VPCs to databases and application services.
About the Author
Kirankumar Chandrashekar is a Sr. Solutions Architect for Strategic Accounts at AWS. He focuses on leading customers in architecting DevOps, modernization using serverless, containers and container orchestration technologies like Docker, ECS, EKS to name a few. Kirankumar is passionate about DevOps, Infrastructure as Code, modernization and solving complex customer issues. He enjoys music, as well as cooking and traveling.
Stella Hie is a Sr. Product Manager Technical for AWS Infrastructure as Code. She focuses on proactive control and governance space, working on delivering the best experience for customers to use AWS solutions safely. Outside of work, she enjoys hiking, playing piano, and watching live shows.
This is a guest post by FINRA (Financial Industry Regulatory Authority). FINRA is dedicated to protecting investors and safeguarding market integrity in a manner that facilitates vibrant capital markets.
FINRA performs big data processing with large volumes of data and workloads with varying instance sizes and types on Amazon EMR. Amazon EMR is a cloud-based big data environment designed to process large amounts of data using open source tools such as Hadoop, Spark, HBase, Flink, Hudi, and Presto.
Monitoring EMR clusters is essential for detecting critical issues with applications, infrastructure, or data in real time. A well-tuned monitoring system helps quickly identify root causes, automate bug fixes, minimize manual actions, and increase productivity. Additionally, observing cluster performance and usage over time helps operations and engineering teams find potential performance bottlenecks and optimization opportunities to scale their clusters, thereby reducing manual actions and improving compliance with service level agreements.
In this post, we talk about our challenges and show how we built an observability framework to provide operational metrics insights for big data processing workloads on Amazon EMR on Amazon Elastic Compute Cloud (Amazon EC2) clusters.
Challenge
In today’s data-driven world, organizations strive to extract valuable insights from large amounts of data. The challenge we faced was finding an efficient way to monitor and observe big data workloads on Amazon EMR due to its complexity. Monitoring and observability for Amazon EMR solutions come with various challenges:
Complexity and scale – EMR clusters often process massive volumes of data across numerous nodes. Monitoring such a complex, distributed system requires handling high data throughput and achieving minimal performance impact. Managing and interpreting the large volume of monitoring data generated by EMR clusters can be overwhelming, making it difficult to identify and troubleshoot issues in a timely manner.
Dynamic environments – EMR clusters are often ephemeral, created and shut down based on workload demands. This dynamism makes it challenging to consistently monitor, collect metrics, and maintain observability over time.
Data variety – Monitoring cluster health and having visibility into clusters to detect bottlenecks, unexpected behavior during processing, data skew, job performance, and so on are crucial. Detailed observability into long-running clusters, nodes, tasks, potential data skews, stuck tasks, performance issues, and job-level metrics (like Spark and JVM) is very critical to understand. Achieving comprehensive observability across these varied data types was difficult.
Resource utilization – EMR clusters consist of various components and services working together, making it challenging to effectively monitor all aspects of the system. Monitoring resource utilization (CPU, memory, disk I/O) across multiple nodes to prevent bottlenecks and inefficiencies is essential but complex, especially in a distributed environment.
Latency and performance metrics –Capturing and analyzing latency and comprehensive performance metrics in real time to identify and resolve issues promptly is critical, but it’s challenging due to the distributed nature of Amazon EMR.
Centralized observability dashboards – Having a single pane of glass for all aspects of EMR cluster metrics, including cluster health, resource utilization, job execution, logs, and security, in order to provide a complete picture of the system’s performance and health, was a challenge.
Alerting and incident management – Setting up effective centralized alerting and notification systems was challenging. Configuring alerts for critical events or performance thresholds requires careful consideration to avoid alert fatigue while making sure important issues are addressed promptly. Responding to incidents from performance slowdowns or disruptions takes time and effort to detect and remediate the issues if proper alerting mechanism is not in place.
Cost management – Lastly, optimizing costs while maintaining effective monitoring is an ongoing challenge. Balancing the need for comprehensive monitoring with cost constraints requires careful planning and optimization strategies to avoid unnecessary expenses while still providing adequate monitoring coverage.
Effective observability for Amazon EMR requires a combination of the right tools, practices, and strategies to address these challenges and provide reliable, efficient, and cost-effective big data processing.
The Ganglia system on Amazon EMR is designed to monitor complete cluster and all nodes’ health, which shows several metrics like Hadoop, Spark, and JVM. When we view the Ganglia web UI in a browser, we see an overview of the EMR cluster’s performance, detailing the load, memory usage, CPU utilization, and network traffic of the cluster through different graphs. However, with Ganglia’s deprecation announced by AWS for higher versions of Amazon EMR, it became important for FINRA to build this solution.
Based on these insights, we completed a successful proof of concept. Next, we built our enterprise central monitoring solution with Managed Prometheus and Managed Grafana to mimic Ganglia-like metrics at FINRA. Managed Prometheus allows for real-time high-volume data collection, which scales the ingestion, storage, and querying of operational metrics as workloads increase or decrease. These metrics are fed to the Managed Grafana workspace for visualizations.
Our solution includes a data ingestion layer for every cluster, with configuration for metrics collection through a custom-built script stored in Amazon Simple Storage Service (Amazon S3). We also installed Managed Prometheus at startup for EC2 instances on Amazon EMR through a bootstrap script. Additionally, application-specific tags are defined in the configuration file to optimize inclusion and collect the specific metrics.
After Managed Prometheus (installed on EMR clusters) collects the metrics, they are sent to a remote Managed Prometheus workspace. Managed Prometheus workspaces are logical and isolated environments dedicated to Managed Prometheus servers that manage specific metrics. They also provide access control for authorizing who or what sends and receives metrics from that workspace. You can create one more workspace by account or application depending on the need, which facilitates better management.
After metrics are collected, we built a mechanism to render them on Managed Grafana dashboards that are then used for consumption through an endpoint. We customized the dashboards for task-level, node-level, and cluster-level metrics so they can be promoted from lower environments to higher environments. We also built several templated dashboards that display node-level metrics like OS-level metrics (CPU, memory, network, disk I/O), HDFS metrics, YARN metrics, Spark metrics, and job-level metrics (Spark and JVM), maximizing the potential for each environment through automated metric aggregation in each account.
We chose a SAML-based authentication option, which allowed us to integrate with existing Active Directory (AD) groups, helping minimize the work needed to manage user access and grant user-based Grafana dashboard access. We arranged three main groups—admins, editors, and viewers—for Grafana user authentication based on user roles.
Through elaborate monitoring automation, these desired metrics are pushed to Amazon CloudWatch. We use CloudWatch for necessary alerting when it exceeds the desired thresholds for each metric.
The following diagram illustrates the solution architecture.
Sample dashboards
The following screenshots showcase example dashboards.
Conclusion
In this post, we shared how FINRA enhanced data-driven decision-making with comprehensive EMR workload observability to optimize performance, maintain reliability, and gain critical insights into big data operations, leading to operational excellence.
FINRA’s solution enabled the operations and engineering teams to use a single pane of glass for monitoring big data workloads and quickly detecting any operational issues. The scalable solution significantly reduced time to resolution and enhanced our overall operational stance. The solution empowered the operations and engineering teams with comprehensive insights into various Amazon EMR metrics like OS levels, Spark, JMX, HDFS, and Yarn, all consolidated in one place. We also extended the solution to use cases such as Amazon Elastic Kubernetes Service (Amazon EKS) clusters, including EMR on EKS clusters and other applications, establishing it as a one-stop system for monitoring metrics across our infrastructure and applications.
About the Authors
Sumalatha Bachu is Senior Director, Technology at FINRA. She manages Big Data Operations which includes managing petabyte-scale data and complex workloads processing in cloud. Additionally, she is an expert in developing Enterprise Application Monitoring and Observability Solutions, Operational Data Analytics, & Machine Learning Model Governance work flows. Outside of work, she enjoys doing yoga, practicing singing, and teaching in her free time.
PremKiran Bejjam is Lead Engineer Consultant at FINRA, specializing in developing resilient and scalable systems. With a keen focus on designing monitoring solutions to enhance infrastructure reliability, he is dedicated to optimizing system performance. Beyond work, he enjoys quality family time and continually seeks out new learning opportunities.
Akhil Chalamalasetty is Director, Market Regulation Technology at FINRA. He is a Big Data subject matter expert specializing in building cutting edge solutions at scale along with optimizing workloads, data, and its processing capabilities. Akhil enjoys sim racing and Formula 1 in his free time.
The design of cloud workloads can be a complex task, where a perfect and universal solution doesn’t exist. We should balance all the different trade-offs and find an optimal solution based on our context. But how does it work in practice? Which guiding principles should we follow? Which are the most important areas we should focus on?
In this blog, we will try to answer some of these questions by sharing a set of resources related to the AWS Well-Architected Framework. The Framework shares a set of methods to help you understand the pros and cons of decisions you make while building cloud systems. By following this resource, you will learn architectural best practices for designing and operating reliable, secure, efficient, cost-effective, and sustainable systems in the cloud. The framework is constantly updated; it evolves as the technology landscape changes. Check out the latest updates from June 2024.
The AWS Well-Architected Framework is constantly updated across all six pillars. The security pillar added a new best practice area: application security (AppSec). In this session, you can learn about the best practices highlighted in this area. Review four key domains: organization and culture, security of the pipeline, security in the pipeline, and dependency management. Each area provides a set of principles that you can implement and provides a complete view of how you design, develop, build, deploy, and operate secure workloads in the cloud.
Figure 1. Security should be part of the end-to-end development process, and implementing best practices both in the application code as well as in the underlying infrastructure components.
How can we integrate different systems as a consequence of an acquisition? Mergers and acquisitions operations bring different people with different backgrounds together, with a need of driving systems convergence. Both organization and technical challenges can arise in this scenario. The Mergers and Acquisitions (M&A) Lens is a collection of customer-proven design principles, best practices, and prescriptive guidance to help you integrate the IT systems of two or more organizations. This lens helps companies follow AWS prescribed best practices during technical integration, drive cost optimization, and expedite merger and acquisition value realization.
Figure 2. If the seller company runs on another cloud platform or on-premises, the acquirer should plan a cloud migration while guaranteeing continuity of service.
One of the best ways to become familiar with new concepts and methodologies consist of doing hands-on work to absorb the techniques properly. For each Let’s Architect! blog, we tend to share at least one workshop associated with the topic. The AWS Well-Architected Framework covers six different pillars, so today we share the AWS Well-Architected Labs to cover each area of the framework. Feel free to jump across the different workshops and start building!
Figure 3. Sustainability is one of the pillars in the framework. Asynchronous and scheduled processing are key techniques for improving the sustainability and costs of cloud architectures.
Distributed systems are difficult to design. It’s even more difficult to test them and prove they are working. Formal methods enable the early discovery of design bugs that can escape the guardrails of design reviews and automated testing only to get uncovered in production. This video shows how AWS uses P, an open source, state machine–based programming language for formal modelling and analysis of distributed systems.
You can learn from AWS engineers and architects how to use P for your own applications to find bugs early in the development process and increase developer velocity. This tool is used in AWS to reason out the correctness of cloud services (for example, Amazon Simple Storage Service and Amazon DynamoDB).
Figure 4. An example of a distributed system for processing transactions.
Thanks for reading! Hopefully, you got interesting insights into the methodologies for designing Well-Architected systems. In the next blog, we will talk about multi-region architectures. We will understand when they are actually needed, and which design principles should be applied.
To revisit any of our previous posts or explore the entire series, visit the Let’s Architect! page.
In this post, we continue with our recommendations for achieving least privilege at scale with AWS Identity and Access Management (IAM). In Part 1 of this two-part series, we described the first five of nine strategies for implementing least privilege in IAM at scale. We also looked at a few mental models that can assist you to scale your approach. In this post, Part 2, we’ll continue to look at the remaining four strategies and related mental models for scaling least privilege across your organization.
6. Empower developers to author application policies
If you’re the only developer working in your cloud environment, then you naturally write your own IAM policies. However, a common trend we’ve seen within organizations that are scaling up their cloud usage is that a centralized security, identity, or cloud team administrator will step in to help developers write customized IAM policies on behalf of the development teams. This may be due to variety of reasons, including unfamiliarity with the policy language or a fear of creating potential security risk by granting excess privileges. Centralized creation of IAM policies might work well for a while, but as the team or business grows, this practice often becomes a bottleneck, as indicated in Figure 1.
Figure 1: Bottleneck in a centralized policy authoring process
This mental model is known as the theory of constraints. With this model in mind, you should be keen to search for constraints, or bottlenecks, faced by your team or organization, identify the root cause, and solve for the constraint. That might sound obvious, but when you’re moving at a fast pace, the constraint might not appear until agility is already impaired. As your organization grows, a process that worked years ago might no longer be effective today.
A software developer generally understands the intent of the applications they build, and to some extent the permissions required. At the same time, the centralized cloud, identity, or security teams tend to feel they are the experts at safely authoring policies, but lack a deep knowledge of the application’s code. The goal here is to enable developers to write the policies in order to mitigate bottlenecks.
The question is, how do you equip developers with the right tools and skills to confidently and safely create the required policies for their applications? A simple way to start is by investing in training. AWS offers a variety of formal training options and ramp-up guides that can help your team gain a deeper understanding of AWS services, including IAM. However, even self-hosting a small hackathon or workshop session in your organization can drive improved outcomes. Consider the following four workshops as simple options for self-hosting a learning series with your teams.
IAM policy learning experience workshop – Learn how to write different types of IAM policies and implement access controls on principals and resources, using conditions to scope down access.
IAM troubleshooting workshop – Learn how to create fine-grained access policies with the help of the IAM API, AWS Management Console, IAM Access Analyzer, and AWS CloudTrail, and review key concepts of the IAM policy evaluation logic.
Refining IAM Permissions Like A Pro – Learn how to use IAM Access Analyzer programmatically, use tools to check IAM policies in CI/CD pipeline and AWS Lambda functions, and get hands-on practice in using the tools from the perspectives of both Security and DevOps teams.
As a next step, you can help your teams along the way by setting up processes that foster collaboration and improve quality. For example, peer reviews are highly recommended, and we’ll cover this later. Additionally, administrators can use AWS native tools such as permissions boundaries and IAM Access Analyzer policy generation to help your developers begin to author their own policies more safely.
Let’s look at permissions boundaries first. An IAM permissions boundary should generally be used to delegate the responsibility of policy creation to your development team. You can set up the developer’s IAM role so that they can create new roles only if the new role has a specific permissions boundary attached to it, and that permissions boundary allows you (as an administrator) to set the maximum permissions that can be granted by the developer. This restriction is implemented by a condition on the developer’s identity-based policy, requiring that specific actions—such as iam:CreateRole or iam:CreatePolicy—are allowed only if a specified permissions boundary is attached.
In this way, when a developer creates an IAM role or policy to grant an application some set of required permissions, they are required to add the specified permissions boundary that will “bound” the maximum permissions available to that application. So even if the policy that the developer creates—such as for their AWS Lambda function—is not sufficiently fine-grained, the permissions boundary helps the organization’s cloud administrators make sure that the Lambda function’s policy is not greater than a maximum set of predefined permissions. So with permissions boundaries, your development team can be allowed to create new roles and policies (with constraints) without administrators creating a manual bottleneck.
Another tool developers can use is IAM Access Analyzer policy generation. IAM Access Analyzer reviews your CloudTrail logs and autogenerates an IAM policy based on your access activity over a specified time range. This greatly simplifies the process of writing granular IAM policies that allow end users access to AWS services.
A classic use case for IAM Access Analyzer policy generation is to generate an IAM policy within the test environment. This provides a good starting point to help identify the needed permissions and refine your policy for the production environment. For example, IAM Access Analyzer can’t identify the production resources used, so it adds resource placeholders for you to modify and add the specific Amazon Resource Names (ARNs) your application team needs. However, not every policy needs to be customized, and the next strategy will focus on reusing some policies.
7. Maintain well-written policies
Strategies seven and eight focus on processes. The first process we’ll focus on is to maintain well-written policies. To begin, not every policy needs to be a work of art. There is some wisdom in reusing well-written policies across your accounts, because that can be an effective way to scale permissions management. There are three steps to approach this task:
Identify your use cases
Create policy templates
Maintain repositories of policy templates
For example, if you were new to AWS and using a new account, we would recommend that you use AWS managed policies as a reference to get started. However, the permissions in these policies might not fit how you intend to use the cloud as time progresses. Eventually, you would want to identify the repetitive or common use cases in your own accounts and create common policies or templates for those situations.
When creating templates, you must understand who or what the template is for. One thing to note here is that the developer’s needs tend to be different from the application’s needs. When a developer is working with resources in your accounts, they often need to create or delete resources—for example, creating and deleting Amazon Simple Storage Service (Amazon S3) buckets for the application to use.
Conversely, a software application generally needs to read or write data—in this example, to read and write objects to the S3 bucket that was created by the developer. Notice that the developer’s permissions needs (to create the bucket) are different than the application’s needs (reading objects in the bucket). Because these are different access patterns, you’ll need to create different policy templates tailored to the different use cases and entities.
Figure 2 highlights this issue further. Out of the set of all possible AWS services and API actions, there are a set of permissions that are relevant for your developers (or more likely, their DevOps build and delivery tools) and there’s a set of permissions that are relevant for the software applications that they are building. Those two sets may have some overlap, but they are not identical.
Figure 2: Visualizing intersecting sets of permissions by use case
When discussing policy reuse, you’re likely already thinking about common policies in your accounts, such as default federation permissions for team members or automation that runs routine security audits across multiple accounts in your organization. Many of these policies could be considered default policies that are common across your accounts and generally do not vary. Likewise, permissions boundary policies (which we discussed earlier) can have commonality across accounts with low amounts of variation. There’s value in reusing both of these sets of policies. However, reusing policies too broadly could cause challenges if variation is needed—to make a change to a “reusable policy,” you would have to modify every instance of that policy, even if it’s only needed by one application.
You might find that you have relatively common resource policies that multiple teams need (such as an S3 bucket policy), but with slight variations. This is where you might find it useful to create a repeatable template that abides by your organization’s security policies, and make it available for your teams to copy. We call it a template here, because the teams might need to change a few elements, such as the Principals that they authorize to access the resource. The policies for the applications (such as the policy a developer creates to attach to an Amazon Elastic Compute Cloud (Amazon EC2) instance role) are generally more bespoke or customized and might not be appropriate in a template.
Figure 3 illustrates that some policies have low amounts of variation while others are more bespoke.
Figure 3: Identifying bespoke versus common policy types
Regardless of whether you choose to reuse a policy or turn it into a template, an important step is to store these reusable policies and templates securely in a repository (in this case, AWS CodeCommit). Many customers use infrastructure-as-code modules to make it simple for development teams to input their customizations and generate IAM policies that fit their security policies in a programmatic way. Some customers document these policies and templates directly in the repository while others use internal wikis accompanied with other relevant information. You’ll need to decide which process works best for your organization. Whatever mechanism you choose, make it accessible and searchable by your teams.
8. Peer review and validate policies
We mentioned in Part 1 that least privilege is a journey and having a feedback loop is a critical part. You can implement feedback through human review, or you can automate the review and validate the findings. This is equally as important for the core default policies as it is for the customized, bespoke policies.
Let’s start with some automated tools you can use. One great tool that we recommend is using AWS IAM Access Analyzer policy validation and custom policy checks. Policy validation helps you while you’re authoring your policy to set secure and functional policies. The feature is available through APIs and the AWS Management Console. IAM Access Analyzer validates your policy against IAM policy grammar and AWS best practices. You can view policy validation check findings that include security warnings, errors, general warnings, and suggestions for your policy.
Let’s review some of the finding categories.
Finding type
Description
Security
Includes warnings if your policy allows access that AWS considers a security risk because the access is overly permissive.
Errors
Includes errors if your policy includes lines that prevent the policy from functioning.
Warning
Includes warnings if your policy doesn’t conform to best practices, but the issues are not security risks.
Suggestions
Includes suggestions if AWS recommends improvements that don’t impact the permissions of the policy.
Custom policy checks are a new IAM Access Analyzer capability that helps security teams accurately and proactively identify critical permissions in their policies. You can use this to check against a reference policy (that is, determine if an updated policy grants new access compared to an existing version of the policy) or check against a list of IAM actions (that is, verify that specific IAM actions are not allowed by your policy). Custom policy checks use automated reasoning, a form of static analysis, to provide a higher level of security assurance in the cloud.
In Figure 4, you’ll see a typical development workflow. This is a simplified version of a CI/CD pipeline with three stages: a commit stage, a validation stage, and a deploy stage. In the diagram, the developer’s code (including IAM policies) is checked across multiple steps.
Figure 4: A pipeline with a policy validation step
In the commit stage, if your developers are authoring policies, you can quickly incorporate peer reviews at the time they commit to the source code, and this creates some accountability within a team to author least privilege policies. Additionally, you can use automation by introducing IAM Access Analyzer policy validation in a validation stage, so that the work can only proceed if there are no security findings detected. To learn more about how to deploy this architecture in your accounts, see this blog post. For a Terraform version of this process, we encourage you to check out this GitHub repository.
9. Remove excess privileges over time
Our final strategy focuses on existing permissions and how to remove excess privileges over time. You can determine which privileges are excessive by analyzing the data on which permissions are granted and determining what’s used and what’s not used. Even if you’re developing new policies, you might later discover that some permissions that you enabled were unused, and you can remove that access later. This means that you don’t have to be 100% perfect when you create a policy today, but can rather improve your policies over time. To help with this, we’ll quickly review three recommendations:
Restrict unused permissions by using service control policies (SCPs)
Remove unused identities
Remove unused services and actions from policies
First, as discussed in Part 1 of this series, SCPs are a broad guardrail type of control that can deny permissions across your AWS Organizations organization, a set of your AWS accounts, or a single account. You can start by identifying services that are not used by your teams, despite being allowed by these SCPs. You might also want to identify services that your organization doesn’t intend to use. In those cases, you might consider restricting that access, so that you retain access only to the services that are actually required in your accounts. If you’re interested in doing this, we’d recommend that you review the Refining permissions in AWS using last accessed information topic in the IAM documentation to get started.
Second, you can focus your attention more narrowly to identify unused IAM roles, unused access keys for IAM users, and unused passwords for IAM users either at an account-specific level or the organization-wide level. To do this, you can use IAM Access Analyzer’s Unused Access Analyzer capability.
Third, the same Unused Access Analyzer capability also enables you to go a step further to identify permissions that are granted but not actually used, with the goal of removing unused permissions. IAM Access Analyzer creates findings for the unused permissions. If the granted access is required and intentional, then you can archive the finding and create an archive rule to automatically archive similar findings. However, if the granted access is not required, you can modify or remove the policy that grants the unintended access. The following screenshot shows an example of the dashboard for IAM Access Analyzer’s unused access findings.
Figure 5: Screenshot of IAM Access Analyzer dashboard
When we talk to customers, we often hear that the principle of least privilege is great in principle, but they would rather focus on having just enough privilege. One mental model that’s relevant here is the 80/20 rule (also known as the Pareto principle), which states that 80% of your outcome comes from 20% of your input (or effort). The flip side is that the remaining 20% of outcome will require 80% of the effort—which means that there are diminishing returns for additional effort. Figure 6 shows how the Pareto principle relates to the concept of least privilege, on a scale from maximum privilege to perfect least privilege.
Figure 6: Applying the Pareto principle (80/20 rule) to the concept of least privilege
The application of the 80/20 rule to permissions management—such as refining existing permissions—is to identify what your acceptable risk threshold is and to recognize that as you perform additional effort to eliminate that risk, you might produce only diminishing returns. However, in pursuit of least privilege, you’ll still want to work toward that remaining 20%, while being pragmatic about the remainder of the effort.
Remember that least privilege is a journey. Two ways to be pragmatic along this journey are to use feedback loops as you refine your permissions, and to prioritize. For example, focus on what is sensitive to your accounts and your team. Restrict access to production identities first before moving to environments with less risk, such as development or testing. Prioritize reviewing permissions for roles or resources that enable external, cross-account access before moving to the roles that are used in less sensitive areas. Then move on to the next priority for your organization.
Conclusion
Thank you for taking the time to read this two-part series. In these two blog posts, we described nine strategies for implementing least privilege in IAM at scale. Across these nine strategies, we introduced some mental models, tools, and capabilities that can assist you to scale your approach. Let’s consider some of the key takeaways that you can use in your journey of setting, verifying, and refining permissions.
Cloud administrators and developers will then verify permissions. For this task, they can use both IAM Access Analyzer’s policy validation and peer review to determine if the permissions that were set have issues or security risks. These tools can be leveraged in a CI/CD pipeline too, before the permissions are set. IAM Access Analyzer’s custom policy checks can be used to detect nonconformant updates to policies.
To both verify existing permissions and refine permissions over time, cloud administrators and developers can use IAM Access Analyzer’s external access analyzers to identify resources that were shared with external entities. They can also use either IAM Access Advisor’s last accessed information or IAM Access Analyzer’s unused access analyzer to find unused access. In short, if you’re looking for a next step to streamline your journey toward least privilege, be sure to check out IAM Access Analyzer.
If you have feedback about this post, submit comments in the Comments section below. If you have questions about this post, contact AWS Support.
Least privilege is an important security topic for Amazon Web Services (AWS) customers. In previous blog posts, we’ve provided tactical advice on how to write least privilege policies, which we would encourage you to review. You might feel comfortable writing a few least privilege policies for yourself, but to scale this up to thousands of developers or hundreds of AWS accounts requires strategy to minimize the total effort needed across an organization.
At re:Inforce 2022, we recommended nine strategies for achieving least privilege at scale. Although the strategies we recommend remain the same, this blog series serves as an update, with a deeper discussion of some of the strategies. In this series, we focus only on AWS Identity and Access Management (IAM), not application or infrastructure identities. We’ll review least privilege in AWS, then dive into each of the nine strategies, and finally review some key takeaways. This blog post, Part 1, covers the first five strategies, while Part 2 of the series covers the remaining four.
Overview of least privilege
The principle of least privilege refers to the concept that you should grant users and systems the narrowest set of privileges needed to complete required tasks. This is the ideal, but it’s not so simple when change is constant—your staff or users change, systems change, and new technologies become available. AWS is continually adding new services or features, and individuals on your team might want to adopt them. If the policies assigned to those users were perfectly least privilege, then you would need to update permissions constantly as the users ask for more or different access. For many, applying the narrowest set of permissions could be too restrictive. The irony is that perfect least privilege can cause maximum effort.
We want to find a more pragmatic approach. To start, you should first recognize that there is some tension between two competing goals—between things you don’t want and things you do want, as indicated in Figure 1. For example, you don’t want expensive resources created, but you do want freedom for your builders to choose their own resources.
Figure 1: Tension between two competing goals
There’s a natural tension between competing goals when you’re thinking about least privilege, and you have a number of controls that you can adjust to securely enable agility. I’ve spoken with hundreds of customers about this topic, and many focus primarily on writing near-perfect permission policies assigned to their builders or machines, attempting to brute force their way to least privilege.
However, that approach isn’t very effective. So where should you start? To answer this, we’re going to break this question down into three components: strategies, tools, and mental models. The first two may be clear to you, but you might be wondering, “What is a mental model”? Mental models help us conceptualize something complex as something relatively simpler, though naturally this leaves some information out of the simpler model.
Teams
Teams generally differ based on the size of the organization. We recognize that each customer is unique, and that customer needs vary across enterprises, government agencies, startups, and so on. If you feel the following example descriptions don’t apply to you today, or that your organization is too small for this many teams to co-exist, then keep in mind that the scenarios might be more applicable in the future as your organization continues to grow. Before we can consider least privilege, let’s consider some common scenarios.
Customers who operate in the cloud tend to have teams that fall into one of two categories: decentralized and centralized. Decentralized teams might be developers or groups of developers, operators, or contractors working in your cloud environment. Centralized teams often consist of administrators. Examples include a cloud environment team, an infrastructure team, the security team, the network team, or the identity team.
Scenarios
To achieve least privilege in an organization effectively, teams must collaborate. Let’s consider three common scenarios:
Creating default roles and policies (for teams and monitoring)
Creating roles and policies for applications
Verifying and refining existing permissions
The first scenario focuses on the baseline set of roles and permissions that are necessary to start using AWS. Centralized teams (such as a cloud environmentteam or identity and access management team) commonly create these initial default roles and policies that you deploy by using your account factory, IAM Identity Center, or through AWS Control Tower. These default permissions typically enable federation for builders or enable some automation, such as tools for monitoring or deployments.
The second scenario is to create roles and policies for applications. After foundational access and permissions are established, the next step is for your builders to use the cloud to build. Decentralized teams (software developers, operators, or contractors) use the roles and policies from the first scenario to then create systems, software, or applications that need their own permissions to perform useful functions. These teams often need to create new roles and policies for their software to interact with databases, Amazon Simple Storage Service (Amazon S3), Amazon Simple Queue Service (Amazon SQS) queues, and other resources.
Lastly, the third scenario is to verify and refine existing permissions, a task that both sets of teams should be responsible for.
Journeys
At AWS, we often say that least privilege is a journey, because change is a constant. Your builders may change, systems may change, you may swap which services you use, and the services you use may add new features that your teams want to adopt, in order to enable faster or more efficient ways of working. Therefore, what you consider least privilege today may be considered insufficient by your users tomorrow.
This journey is made up of a lifecycle of setting, verifying, and refining permissions. Cloud administrators and developers will set permissions, they will then verify permissions, and then they refine those permissions over time, and the cycle repeats as illustrated in Figure 2. This produces feedback loops of continuous improvement, which add up to the journey to least privilege.
Figure 2: Least privilege is a journey
Strategies for implementing least privilege
The following sections will dive into nine strategies for implementing least privilege at scale:
Part 1 (this post):
(Plan) Begin with coarse-grained controls
(Plan) Use accounts as strong boundaries around resources
(Policy) Empower developers to author application policies
(Process) Maintain well-written policies
(Process) Peer-review and validate policies
(Process) Remove excess privileges over time
To provide some logical structure, the strategies can be grouped into three categories—plan, policy, and process. Plan is where you consider your goals and the outcomes that you want to achieve and then design your cloud environment to simplify those outcomes. Policy focuses on the fact that you will need to implement some of those goals in either the IAM policy language or as code (such as infrastructure-as-code). The Process category will look at an iterative approach to continuous improvement. Let’s begin.
1. Begin with coarse-grained controls
Most systems have relationships, and these relationships can be visualized. For example, AWS accounts relationships can be visualized as a hierarchy, with an organization’s management account and groups of AWS accounts within that hierarchy, and principals and policies within those accounts, as shown in Figure 3.
Figure 3: Icicle diagram representing an account hierarchy
When discussing least privilege, it’s tempting to put excessive focus on the policies at the bottom of the hierarchy, but you should reverse that thinking if you want to implement least privilege at scale. Instead, this strategy focuses on coarse-grained controls, which refer to a top-level, broader set of controls. Examples of these broad controls include multi-account strategy, service control policies, blocking public access, and data perimeters.
Before you implement coarse-grained controls, you must consider which controls will achieve the outcomes you desire. After the relevant coarse-grained controls are in place, you can tailor the permissions down the hierarchy by using more fine-grained controls along the way. The next strategy reviews the first coarse-grained control we recommend.
2. Use accounts as strong boundaries around resources
Although you can start with a single AWS account, we encourage customers to adopt a multi-account strategy. As customers continue to use the cloud, they often need explicit security boundaries, the ability to control limits, and billing separation. The isolation designed into an AWS account can help you meet these needs.
Customers can group individual accounts into different assortments (organizational units) by using AWS Organizations. Some customers might choose to align this grouping by environment (for example: Dev, Pre-Production, Test, Production) or by business units, cost center, or some other option. You can choose how you want to construct your organization, and AWS has provided prescriptive guidance to assist customers when they adopt a multi-account strategy.
Similarly, you can use this approach for grouping security controls. As you layer in preventative or detective controls, you can choose which groups of accounts to apply them to. When you think of how to group these accounts, consider where you want to apply your security controls that could affect permissions.
AWS accounts give you strong boundaries between accounts (and the entities that exist in those accounts). As shown in Figure 4, by default these principals and resources cannot cross their account boundary (represented by the red dotted line on the left).
Figure 4: Account hierarchy and account boundaries
In order for these accounts to communicate with each other, you need to explicitly enable access by adding narrow permissions. For use cases such as cross-account resource sharing, or cross-VPC networking, or cross-account role assumptions, you would need to explicitly enable the required access by creating the necessary permissions. Then you could review those permissions by using IAM Access Analyzer.
One type of analyzer within IAM Access Analyzer, external access, helps you identify resources (such as S3 buckets, IAM roles, SQS queues, and more) in your organization or accounts that are shared with an external entity. This helps you identify if there’s potential for unintended access that could be a security risk to your organization. Although you could use IAM Access Analyzer (external access) with a single account, we recommend using it at the organization level. You can configure an access analyzer for your entire organization by setting the organization as the zone of trust, to identify access allowed from outside your organization.
To get started, you create the analyzer and it begins analyzing permissions. The analysis may produce findings, which you can review for intended and unintended access. You can archive the intended access findings, but you’ll want to act quickly on the unintended access to mitigate security risks.
In summary, you should use accounts as strong boundaries around resources, and use IAM Access Analyzer to help validate your assumptions and find unintended access permissions in an automated way across the account boundaries.
3. Prioritize short-term credentials
When it comes to access control, shorter is better. Compared to long-term access keys or passwords that could be stored in plaintext or mistakenly shared, a short-term credential is requested dynamically by using strong identities. Because the credentials are being requested dynamically, they are temporary and automatically expire. Therefore, you don’t have to explicitly revoke or rotate the credentials, nor embed them within your application.
In the context of IAM, when we’re discussing short-term credentials, we’re effectively talking about IAM roles. We can split the applicable use cases of short-term credentials into two categories—short-term credentials for builders and short-term credentials for applications.
Builders (human users) typically interact with the AWS Cloud in one of two ways; either through the AWS Management Console or programmatically through the AWS CLI. For console access, you can use direct federation from your identity provider to individual AWS accounts or something more centralized through IAM Identity Center. For programmatic builder access, you can get short-term credentials into your AWS account through IAM Identity Center using the AWS CLI.
However, organizations might still have long-term secrets, like database credentials, that need to be stored somewhere. You can store these secrets with AWS Secrets Manager, which will encrypt the secret by using an AWS KMS encryption key. Further, you can configure automatic rotation of that secret to help reduce the risk of those long-term secrets.
4. Enforce broad security invariants
Security invariants are essentially conditions that should always be true. For example, let’s assume an organization has identified some core security conditions that they want enforced:
You can enable these conditions by using service control policies (SCPs) at the organization level for groups of accounts using an organizational unit (OU), or for individual member accounts.
Notice these words—block, disable, and prevent. If you’re considering these actions in the context of all users or all principals except for the administrators, that’s where you’ll begin to implement broad security invariants, generally by using service control policies. However, a common challenge for customers is identifying what conditions to apply and the scope. This depends on what services you use, the size of your organization, the number of teams you have, and how your organization uses the AWS Cloud.
Some actions have inherently greater risk, while others may have nominal risk or are more easily reversible. One mental model that has helped customers to consider these issues is an XY graph, as illustrated in the example in Figure 5.
Figure 5: Using an XY graph for analyzing potential risk versus frequency of use
The X-axis in this graph represents the potential risk associated with using a service functionality within a particular account or environment, while the Y-axis represents the frequency of use of that service functionality. In this representative example, the top-left part of the graph covers actions that occur frequently and are relatively safe—for example, read-only actions.
The functionality in the bottom-right section is where you want to focus your time. Consider this for yourself—if you were to create a similar graph for your environment—what are the actions you would consider to be high-risk, with an expected low or rare usage within your environment? For example, if you enable CloudTrail for logging, you want to make sure that someone doesn’t invoke the CloudTrail StopLogging API operation or delete the CloudTrail logs. Another high-risk, low-usage example could include restricting AWS Direct Connect or network configuration changes to only your network administrators.
Over time, you can use the mental model of the XY graph to decide when to use preventative guardrails for actions that should never happen, versus conditional or alternative guardrails for situational use cases. You could also move from preventative to detective security controls, while accounting for factors such as the user persona and the environment type (production, development, or testing). Finally, you could consider doing this exercise broadly at the service level before thinking of it in a more fine-grained way, feature-by-feature.
You can think of IAM as a toolbox that offers many tools that provide different types of value. We can group these tools into two broad categories: guardrails and grants.
Guardrails are the set of tools that help you restrict or deny access to your accounts. At a high level, they help you figure out the boundary for the set of permissions that you want to retain. SCPs are a great example of guardrails, because they enable you to restrict the scope of actions that principals in your account or your organization can take. Permissions boundaries are another great example, because they enable you to safely delegate the creation of new principals (roles or users) and permissions by setting maximum permissions on the new identity.
Although guardrails help you restrict access, they don’t inherently grant any permissions. To grant permissions, you use either an identity-based policy or resource-based policy. Identity policies are attached to principals (roles or users), while resource-based policies are applied to specific resources, such as an S3 bucket.
A common question is how to decide when to use an identity policy versus a resource policy to grant permissions. IAM, in a nutshell, seeks to answer the question: who can access what? Can you spot the nuance in the following policy examples?
You likely noticed the difference here is that with identity-based (principal) policies, the principal is implicit (that is, the principal of the policy is the entity to which the policy is applied), while in a resource-based policy, the principal must be explicit (that is, the principal has to be specified in the policy). A resource-based policy can enable cross-account access to resources (or even make a resource effectively public), but the identity-based policies likewise need to allow the access to that cross-account resource. Identity-based policies with sufficient permissions can then access resources that are “shared.” In essence, both the principal and the resource need to be granted sufficient permissions.
When thinking about grants, you can address the “who” angle by focusing on the identity-based policies, or the “what” angle by focusing on resource-based policies. For additional reading on this topic, see this blog post. For information about how guardrails and grants are evaluated, review the policy evaluation logic documentation.
This blog post walked through the first five (of nine) strategies for achieving least privilege at scale. For the remaining four strategies, see Part 2 of this series.
If you have feedback about this post, submit comments in the Comments section below. If you have questions about this post, contact AWS Support.
With AWS Audit Manager, you can map your compliance requirements to AWS usage data and continually audit your AWS usage as part of your risk and compliance assessment. Today, Audit Manager introduces a common control library that provides common controls with predefined and pre-mapped AWS data sources.
The common control library is based on extensive mapping and reviews conducted by AWS certified auditors, verifying that the appropriate data sources are identified for evidence collection. Governance, Risk and Compliance (GRC) teams can use the common control library to save time time when mapping enterprise controls into Audit Manager for evidence collection, reducing their dependence on information technology (IT) teams.
Using the common control library, you can view the compliance requirements for multiple frameworks (such as PCI or HIPAA) associated with the same common control in one place, making it easier to understand your audit readiness across multiple frameworks simultaneously. In this way, you don’t need to implement different compliance standard requirements individually and then review the resulting data multiple times for different compliance regimes.
Additionally, by using controls from this library, you automatically inherit improvements as Audit Manager updates or adds new data sources, such as additional AWS CloudTrail events, AWS API calls, AWS Config rules, or maps additional compliance frameworks to common controls. This eliminates the efforts required by GRC and IT teams to constantly update and manage evidence sources and makes it easier to benefit from additional compliance frameworks that Audit Manager adds to its library.
Let’s see how this works in practice with an example.
Using AWS Audit Manager common control library A common scenario for an airline is to implement a policy so that their customer payments, including in-flight meals and internet access, can only be taken via credit card. To implement this policy, the airline develops an enterprise control for IT operations that says that “customer transactions data is always available.” How can they monitor whether their applications on AWS meet this new control?
Acting as their compliance officer, I open the Audit Manager console and choose Control library from the navigation bar. The control library now includes the new Common category. Each common control maps to a group of core controls that collect evidence from AWS managed data sources and makes it easier to demonstrate compliance with a range of overlapping regulations and standards. I look through the common control library and search for “availability.” Here, I realize the airline’s expected requirements map to common control High availability architecture in the library.
I expand the High availability architecture common control to see the underlying core controls. There, I notice this control doesn’t adequately meet all the company’s needs because Amazon DynamoDB is not in this list. DynamoDB is a fully managed database, but given extensive usage of DynamoDB in their application architecture, they definitely want their DynamoDB tables to be available when their workload grows or shrinks. This might not be the case if they configured a fixed throughput for a DynamoDB table.
I look again through the common control library and search for “redundancy.” I expand the Fault tolerance and redundancy common control to see how it maps to core controls. There, I see the Enable Auto Scaling for Amazon DynamoDB tables core control. This core control is relevant for the architecture that the airline has implemented but the whole common control is not needed.
Additionally, common control High availability architecture already includes a couple of core controls that check that Multi-AZ replication on Amazon Relational Database Service (RDS) is enabled, but these core controls rely on an AWS Config rule. This rule doesn’t work for this use case because the airline does not use AWS Config. One of these two core controls also uses a CloudTrail event, but that event does not cover all scenarios.
As the compliance officer, I would like to collect the actual resource configuration. To collect this evidence, I briefly consult with an IT partner and create a custom control using a Customer managed source. I select the api-rds_describedbinstances API call and set a weekly collection frequency to optimize costs.
Implementing the custom control can be handled by the compliance team with minimal interaction needed from the IT team. If the compliance team has to reduce their reliance on IT, they can implement the entire second common control (Fault tolerance and redundancy) instead of only selecting the core control related to DynamoDB. It might be more than what they need based on their architecture, but the acceleration of velocity and reduction of time and effort for both the compliance and IT teams is often a bigger benefit than optimizing the controls in place.
I now choose Framework library in the navigation pane and create a custom framework that includes these controls. Then, I choose Assessments in the navigation pane and create an assessment that includes the custom framework. After I create the assessment, Audit Manager starts collecting evidence about the selected AWS accounts and their AWS usage.
By following these steps, a compliance team can precisely report on the enterprise control “customer transactions data is always available” using an implementation in line with their system design and their existing AWS services.
Things to know The common control library is available today in all AWS Regions where AWS Audit Manager is offered. There is no additional cost for using the common control library. For more information, see AWS Audit Manager pricing.
This new capability streamlines the compliance and risk assessment process, reducing the workload for GRC teams and simplifying the way they can map enterprise controls into Audit Manager for evidence collection. To learn more, see the AWS Audit Manager User Guide.
Amazon CloudWatch Logs announces today a new log class called Infrequent Access. This new log class offers a tailored set of capabilities at a lower cost for infrequently accessed logs, enabling customers to consolidate all their logs in one place in a cost-effective manner.
As customers’ applications continue to scale and grow, so does the volume of logs generated. To limit the increase of logging costs, many customers are forced to make hard trade-offs. For example, some customers limit the logs generated by their applications, which can hinder the visibility of the application, or choose a different solution for different log types, which adds complexity and inefficiencies in managing different logging solutions. For instance, customers may send logs needed for real-time analytics and alerting to CloudWatch Logs and send more detailed logs needed for debugging and troubleshooting to a lower-cost solution that doesn’t have as many features as CloudWatch. In the end, these workarounds can impact the observability of the application, because customers need to navigate across multiple solutions to see their logs.
The Infrequent Access log class allows you to build a holistic observability solution using CloudWatch by centralizing all your logs in one place to ingest, query, and store your logs in a cost-efficient way. Infrequent Access is 50 percent lower per GB ingestion price than Standard log class. It provides a tailored set of capabilities for customers that don’t need advanced features like Live Tail, metric extraction, alarming, or data protection that the Standard log class provides. With Infrequent Access, you can still get the benefits of fully managed ingestion, storage, and the ability to deep dive using CloudWatch Logs Insights.
The following table shows a side-by-side comparison of the features that the new Infrequent Access and the Standard log classes have.
When to use the new Infrequent Access log class Use the Infrequent Access log class when you have a new workload that doesn’t require advanced features provided by the Standard log class. One important consideration is that when you create a log group with a specific log class, you cannot change that log group log class afterward.
The Infrequent Access log class is suitable for debug logs or web server logs because they are quite verbose and rarely require any of the advanced functionality that the Standard log class provides.
Another good workload for the Infrequent Access log class is an Internet of Things (IoT) fleet sending detailed logs that are only accessed for after the fact forensic analysis after the event. In addition, the Infrequent Access log class is a good choice for workloads where logs need to be stored for compliance because they will be queried infrequently.
Once you have the new log group created, you can start using it in your workloads. For this example, I will configure a web application to send debug logs to this log group. After a while of the web application executes for a while, you can go back to the log group, where you see a new log stream.
When you select a log stream, you will be directed to CloudWatch Logs Insights.
Using the same familiar CloudWatch Logs Insights experience you get with Standard Class, you can create queries and search those logs to find relevant information, and you can analyze all the logs quickly in one place.
Available now The new Infrequent Access log class is now available in all AWS Regions except the China and GovCloud Regions. You can start using it and enjoy a more cost-effective way to collect, store, and analyze your logs in a fully managed experience.
To learn more about the new log class, you can check the CloudWatch Logs user guide dedicated page for the Infrequent Access log class.
We are announcing new features in AWS Health to help you manage planned lifecycle events for your AWS resources and dynamically track the completion of actions that your team takes at the resource-level to ensure continued smooth operations of your applications. Some examples of planned lifecycle events are an Amazon Elastic Kubernetes Service (Amazon EKS) Kubernetes version end of standard support, Amazon Relational Database Service (Amazon RDS) certificate rotations, and end of support for other open source software, to name a few.
These features include:
The ability to dynamically track the completion of actions at the resource level where possible, to minimize disruption to applications.
Timely visibility into upcoming planned lifecycle events, using notifications at least 90 days in advance for minor changes, and 180 days in advance for major changes, whenever possible.
A standardized data format that helps you prepare and take actions. It integrates AWS Health events programmatically with your preferred operational tools, using AWS Health API.
An organization-wide visibility into planned lifecycle events for teams that manage workloads across the company with delegated administrator. This means that central teams such as Cloud Center of Excellence (CCoE) teams, no longer need to use the management account to access the organizational view.
How it Works Planned lifecycle events are available through the AWS Health Dashboard, AWS Health API, and EventBridge. You can automate the management of AWS Health events across your organization by creating rules on EventBridge that includes the “source”: [“aws.health”] value to receive AWS Health notifications or initiate actions based on the rules created. For example, if AWS Health publishes an event about your EC2 instances, then you can use these notifications to take action and update or replace your resources as needed. You can view the planned lifecycle events for your AWS resources in the Scheduled changes tab.
Table View – Organizational level
To prioritize events, you can now see scheduled changes in a calendar view. The event has a start time to indicate when the change commences. The status remains as Upcoming until the change occurs or all of the affected resources have been actioned. The event status changes to Completed when all of the affected resources have been actioned. You can also deselect event statuses that you don’t want to focus on. To show more specific event details, select an event to open the split panel view to the right or the bottom of the screen.
When selecting the Affected resources tab on the detailed view of an event, customers can see relevant account information that can help you reach out to the right people to resolve impaired resources.
Affected resources view – Account level
Integration with Other AWS Services Using EventBridge integrations that already exist in AWS Health, you can send change events, and their fully managed lifecycles to other tools such as JIRA, ServiceNow, and AWS Systems Manager OpsCenter. EventBridge sends all updates to events (for example, timestamps, resource status, and more) to these tools, allowing you to track the status of events in your preferred tooling.
EventBridge integrations
Now Available Planned lifecycle events for AWS Health are available in all AWS Regions where AWS Health is available except China and GovCloud Regions. To learn more, visit the AWS Health user guide. You can submit your questions to AWS re:Post for AWS Health, or through your usual AWS Support contacts.
Governance plays a crucial role in AWS environments, as it ensures compliance, security, and operational efficiency.
In this Let’s Architect!, we aim to provide valuable insights and best practices on how to configure governance appropriately within a company’s AWS infrastructure. By implementing these best practices, you can establish robust controls, enhance security, and maintain compliance, enabling your organization to fully leverage the power of AWS services while mitigating risks and maximizing operational efficiency.
If you are hungry for more information on governance, check out the Architecture Center’s management and governance page, where you can find a collection of AWS solutions, blueprints, and best practices on this topic.
As global financial and regulated industry organizations increasingly turn to AWS for scaling their operations, they face the critical challenge of balancing growth with stringent governance and control regulatory requirements.
During this re:Invent 2022 session, Global Payments sheds light on how they leverage AWS cloud operations services to address this challenge head-on. By utilizing AWS Service Catalog, they streamline the deployment of pre-approved, compliant resources and services across their AWS accounts. This not only expedites the provisioning process but also ensures that all resources meet the required regulatory standards.
Maintaining security and compliance throughout the entire deployment process is critical.
In this video, you will discover how cfn-guard can be utilized to validate your deployment pipelines built using AWS CloudFormation. By defining and applying custom rules, cfn-guard empowers you to enforce security policies, prevent misconfigurations, and ensure compliance with regulatory requirements. Moreover, by leveraging cdk-nag, you can catch potential security vulnerabilities and compliance risks early in the development process.
Learn how to use AWS CloudFormation and the AWS Cloud Development Kit to deploy cloud applications in regulated environments while enforcing security controls
AWS customers often utilize AWS Organizations to effectively manage multiple AWS accounts. There are numerous advantages to employing this approach within an organization, including grouping workloads with shared business objectives, ensuring compliance with regulatory frameworks, and establishing robust isolation barriers based on ownership. Customers commonly utilize separate accounts for development, testing, and production purposes. However, as the number of these accounts grows, the need arises for a centralized approach to establish control mechanisms and guidelines.
In this AWS Security Blog post, we will guide you through various techniques that can enhance the utilization of AWS Organizations’ service control policies (SCPs) in a multi-account environment.
Having a single pane of glass where all Amazon CloudWatch Logs are displayed is crucial for effectively monitoring and understanding the overall performance and health of a system or application.
The AWS Centralized Logging solution facilitates the aggregation, examination, and visualization of CloudWatch Logs through a unified dashboard.
This solution streamlines the consolidation, administration, and analysis of log files originating from diverse sources, including access audit logs, configuration change records, and billing events. Furthermore, it enables the collection of CloudWatch Logs from numerous AWS accounts and Regions.
This blog post was written by Abeer Naffa’, Sr. Solutions Architect, Solutions Builder AWS, David Filiatrault, Principal Security Consultant, AWS and Jared Thompson, Hybrid Edge SA Specialist, AWS.
In this post, we will explore how organizations can use AWS Control Tower landing zone and AWS Organizations custom guardrails to enable compliance with data residency requirements on AWS Outposts rack. We will discuss how custom guardrails can be leveraged to limit the ability to store, process, and access data and remain isolated in specific geographic locations, how they can be used to enforce security and compliance controls, as well as, which prerequisites organizations should consider before implementing these guardrails.
Data residency is a critical consideration for organizations that collect and store sensitive information, such as Personal Identifiable Information (PII), financial, and healthcare data. With the rise of cloud computing and the global nature of the internet, it can be challenging for organizations to make sure that their data is being stored and processed in compliance with local laws and regulations.
One potential solution for addressing data residency challenges with AWS is to use Outposts rack, which allows organizations to run AWS infrastructure on premises and in their own data centers. This lets organizations store and process data in a location of their choosing. An Outpost is seamlessly connected to an AWS Region where it has access to the full suite of AWS services managed from a single plane of glass, the AWS Management Console or the AWS Command Line Interface (AWS CLI). Outposts rack can be configured to utilize landing zone to further adhere to data residency requirements.
The landing zones are a set of tools and best practices that help organizations establish a secure and compliant multi-account structure within a cloud provider. A landing zone can also include Organizations to set policies – guardrails – at the root level, known as Service Control Policies (SCPs) across all member accounts. This can be configured to enforce certain data residency requirements.
When leveraging Outposts rack to meet data residency requirements, it is crucial to have control over the in-scope data movement from the Outposts. This can be accomplished by implementing landing zone best practices and the suggested guardrails. The main focus of this blog post is on the custom policies that restrict data snapshots, prohibit data creation within the Region, and limit data transfer to the Region.
Prerequisites
Landing zone best practices and custom guardrails can help when data needs to remain in a specific locality where the Outposts rack is also located. This can be completed by defining and enforcing policies for data storage and usage within the landing zone organization that you set up. The following prerequisites should be considered before implementing the suggested guardrails:
1. AWS Outposts rack
AWS has installed your Outpost and handed off to you. An Outpost may comprise of one or more racks connected together at the site. This means that you can start using AWS services on the Outpost, and you can manage the Outposts rack using the same tools and interfaces that you use in AWS Regions.
2. Landing Zone Accelerator on AWS
We recommend using Landing Zone Accelerator on AWS (LZA) to deploy a landing zone for your organization. Make sure that the accelerator is configured for the appropriate Region and industry. To do this, you must meet the following prerequisites:
A clear understanding of your organization’s compliance requirements, including the specific Region and industry rules in which you operate.
Knowledge of the different LZAs available and their capabilities, such as the compliance frameworks with which you align.
Have the necessary permissions to deploy the LZAs and configure it for your organization’s specific requirements.
Note that LZAs are designed to help organizations quickly set up a secure, compliant multi-account environment. However, it’s not a one-size-fits-all solution, and you must align it with your organization’s specific requirements.
3. Set up the data residency guardrails
Using Organizations, you must make sure that the Outpost is ordered within a workload account in the landing zone.
Figure 1: Landing Zone Accelerator – Outposts workload on AWS high level Architecture
Utilizing Outposts rack for regulated components
When local regulations require regulated workloads to stay within a specific boundary, or when an AWS Region or AWS Local Zone isn’t available in your jurisdiction, you can still choose to host your regulated workloads on Outposts rack for a consistent cloud experience. When opting for Outposts rack, note that, as part of the shared responsibility model, customers are responsible for attesting to physical security, access controls, and compliance validation regarding the Outposts, as well as, environmental requirements for the facility, networking, and power. Utilizing Outposts rack requires that you procure and manage the data center within the city, state, province, or country boundary for your applications’ regulated components, as required by local regulations.
Procuring two or more racks in the diverse data centers can help with the high availability for your workloads. This is because it provides redundancy in case of a single rack or server failure. Additionally, having redundant network paths between Outposts rack and the parent Region can help make sure that your application remains connected and continue to operate even if one network path fails.
However, for regulated workloads with strict service level agreements (SLA), you may choose to spread Outposts racks across two or more isolated data centers within regulated boundaries. This helps make sure that your data remains within the designated geographical location and meets local data residency requirements.
In this post, we consider a scenario with one data center, but consider the specific requirements of your workloads and the regulations that apply to determine the most appropriate high availability configurations for your case.
Outposts rack workload data residency guardrails
Organizations provide central governance and management for multiple accounts. Central security administrators use SCPs with Organizations to establish controls to which all AWS Identity and Access Management (IAM) principals (users and roles) adhere.
Now, you can use SCPs to set permission guardrails. A suggested preventative controls for data residency on Outposts rack that leverage the implementation of SCPs are shown as follows. SCPs enable you to set permission guardrails by defining the maximum available permissions for IAM entities in an account. If an SCP denies an action for an account, then none of the entities in the account can take that action, even if their IAM permissions let them. The guardrails set in SCPs apply to all IAM entities in the account, which include all users, roles, and the account root user.
Upon finalizing these prerequisites, you can create the guardrails for the Outposts Organization Unit (OU).
Note that while the following guidelines serve as helpful guardrails – SCPs – for data residency, you should consult internally with legal and security teams for specific organizational requirements.
To exercise better control over workloads in the Outposts rack and prevent data transfer from Outposts to the Region or data storage outside the Outposts, consider implementing the following guardrails. Additionally, local regulations may dictate that you set up these additional guardrails.
When your data residency requirements require restricting data transfer/saving to the Region, consider the following guardrails:
If your data residency requirements mandate restrictions on data storage in the Region, consider implementing this guardrail to prevent the use of S3 in the Region.
c. If your data residency requirements mandate restrictions on data storage in the Region, consider implementing “DenyDirectTransferToRegion” guardrail.
Out of Scope is metadata such as tags, or operational data such as KMS keys.
If your data residency requirements require limitations on data storage in the Region, consider implementing this guardrail “DenySnapshotsToRegion” and “DenySnapshotsNotOutposts” to restrict the use of snapshots in the Region.
a. Deny creating snapshots of your Outpost data in the Region “DenySnapshotsToRegion”
Make sure to update the Outposts “<outpost_arn_pattern>”.
b. Deny copying or modifying Outposts Snapshots “DenySnapshotsNotOutposts”
Make sure to update the Outposts “<outpost_arn_pattern>”.
Note: “<outpost_arn_pattern>” default is arn:aws:outposts:*:*:outpost/*
This guardrail helps to prevent the launch of Amazon EC2 instances or creation of network interfaces in non-Outposts subnets. It is advisable to keep data residency workloads within the Outposts rather than the Region to ensure better control over regulated workloads. This approach can help your organization achieve better control over data residency workloads and improve governance over your AWS Organization.
Make sure to update the Outposts subnets “<outpost_subnet_arns>”.
When implementing data residency guardrails on Outposts rack, consider backup and disaster recovery strategies to make sure that your data is protected in the event of an outage or other unexpected events. This may include creating regular backups of your data, implementing disaster recovery plans and procedures, and using redundancy and failover systems to minimize the impact of any potential disruptions. Additionally, you should make sure that your backup and disaster recovery systems are compliant with any relevant data residency regulations and requirements. You should also test your backup and disaster recovery systems regularly to make sure that they are functioning as intended.
Additionally, the provided SCPs for Outposts rack in the above example do not block the “logs:PutLogEvents”. Therefore, even if you implemented data residency guardrails on Outpost, the application may log data to CloudWatch logs in the Region.
Highlights
By default, application-level logs on Outposts rack are not automatically sent to Amazon CloudWatch Logs in the Region. You can configure CloudWatch logs agent on Outposts rack to collect and send your application-level logs to CloudWatch logs.
logs: PutLogEvents does transmit data to the Region, but it is not blocked by the provided SCPs, as it’s expected that most use cases will still want to be able to use this logging API. However, if blocking is desired, then add the action to the first recommended guardrail. If you want specific roles to be allowed, then combine with the ArnNotLike condition example referenced in the previous highlight.
Conclusion
The combined use of Outposts rack and the suggested guardrails via AWS Organizations policies enables you to exercise better control over the movement of the data. By creating a landing zone for your organization, you can apply SCPs to your Outposts racks that will help make sure that your data remains within a specific geographic location, as required by the data residency regulations.
Note that, while custom guardrails can help you manage data residency on Outposts rack, it’s critical to thoroughly review your policies, procedures, and configurations to make sure that they are compliant with all relevant data residency regulations and requirements. Regularly testing and monitoring your systems can help make sure that your data is protected and your organization stays compliant.
As we kick off 2023, I wanted to take a moment to highlight the top posts from 2022. Without further ado, here are the top 10 AWS DevOps Blog posts of 2022.
Sylvia Qi, Senior DevOps Architect, and Sebastian Carreras, Senior Cloud Application Architect, guide us through utilizing infrastructure as code (IaC) to automate GitLab Runner deployment on Amazon EC2.
Lerna Ekmekcioglu, Senior Solutions Architect, and Jack Iu, Global Solutions Architect, demonstrate best practices for multi-Region deployments using HashiCorp Terraform, AWS CodeBuild, and AWS CodePipeline.
Praveen Kumar Jeyarajan, Senior DevOps Consultant, and Vaidyanathan Ganesa Sankaran, Sr Modernization Architect, discuss unit testing Python-based AWS Glue Jobs in AWS CodePipeline.
James Bland, APN Global Tech Lead for DevOps, and Welly Siauw, Sr. Partner solutions architect, discuss the challenges of architecting Jenkins for scale and high availability (HA).
Harish Vaswani, Senior Cloud Application Architect, and Rafael Ramos, Solutions Architect, explain how you can configure and use tfdevops to easily enable Amazon DevOps Guru for your existing AWS resources created by Terraform.
Arun Donti, Senior Software Engineer with Twitch, demonstrates how to integrate cdk-nag into an AWS Cloud Development Kit (AWS CDK) application to provide continual feedback and help align your applications with best practices.
Adam Thomas, Senior Software Development Engineer, demonstrate how you can use Smithy to define services and SDKs and deploy them to AWS Lambda using a generated client.
A big thank you to all our readers! Your feedback and collaboration are appreciated and help us produce better content.
As companies increasingly adopt machine learning (ML) for their business applications, they are looking for ways to improve governance of their ML projects with simplified access control and enhanced visibility across the ML lifecycle. A common challenge in that effort is managing the right set of user permissions across different groups and ML activities. For example, a data scientist in your team that builds and trains models usually requires different permissions than an MLOps engineer that manages ML pipelines. Another challenge is improving visibility over ML projects. For example, model information, such as intended use, out-of-scope use cases, risk rating, and evaluation results, is often captured and shared via emails or documents. In addition, there is often no simple mechanism to monitor and report on your deployed model behavior.
That’s why I’m excited to announce a new set of ML governance tools for Amazon SageMaker.
As an ML system or platform administrator, you can now use Amazon SageMaker Role Manager to define custom permissions for SageMaker users in minutes, so you can onboard users faster. As an ML practitioner, business owner, or model risk and compliance officer, you can now use Amazon SageMaker Model Cards to document model information from conception to deployment and Amazon SageMaker Model Dashboard to monitor all your deployed models through a unified dashboard.
Let’s dive deeper into each tool, and I’ll show you how to get started.
Introducing Amazon SageMaker Role Manager SageMaker Role Manager lets you define custom permissions for SageMaker users in minutes. It comes with a set of predefined policy templates for different personas and ML activities. Personas represent the different types of users that need permissions to perform ML activities in SageMaker, such as data scientists or MLOps engineers. ML activities are a set of permissions to accomplish a common ML task, such as running SageMaker Studio applications or managing experiments, models, or pipelines. You can also define additional personas, add ML activities, and your managed policies to match your specific needs. Once you have selected the persona type and the set of ML activities, SageMaker Role Manager automatically creates the required AWS Identity and Access Management (IAM) role and policies that you can assign to SageMaker users.
A Primer on SageMaker and IAM Roles A role is an IAM identity that has permissions to perform actions with AWS services. Besides user roles that are assumed by a user via federation from an Identity Provider (IdP) or the AWS Console, Amazon SageMaker requires service roles (also known as execution roles) to perform actions on behalf of the user. SageMaker Role Manager helps you create these service roles:
SageMaker Compute Role – Gives SageMaker compute resources the ability to perform tasks such as training and inference, typically used via PassRole. You can select the SageMaker Compute Role persona in SageMaker Role Manager to create this role. Depending on the ML activities you select in your SageMaker service roles, you will need to create this compute role first.
SageMaker Service Role – Some AWS services, including SageMaker, require a service role to perform actions on your behalf. You can select the Data Scientist, MLOps, or Custom persona in SageMaker Role Manager to start creating service roles with custom permissions for your ML practitioners.
Now, let me show you how this works in practice.
There are two ways to get to SageMaker Role Manager, either through Getting started in the SageMaker console or when you select Add user in the SageMaker Studio Domain control panel.
I start in the SageMaker console. Under Configure role, select Create a role. This opens a workflow that guides you through all required steps.
Let’s assume I want to create a SageMaker service role with a specific set of permissions for my team of data scientists. In Step 1, I select the predefined policy template for the Data Scientist persona.
I can also define the network and encryption settings in this step by selecting Amazon Virtual Private Cloud (Amazon VPC) subnets, security groups, and encryption keys.
In Step 2, I select what ML activities data scientists in my team need to perform.
Some of the selected ML activities might require you to specify the Amazon Resource Name (ARN) of the SageMaker Compute Role so SageMaker compute resources have the ability to perform the tasks.
In Step 3, you can attach additional IAM policies and add tags to the role if needed. Tags help you identify and organize your AWS resources. You can use tags to add attributes such as project name, cost center, or location information to a role. After a final review of the settings in Step 4, select Submit, and the role is created.
In just a few minutes, I set up a SageMaker service role, and I’m now ready to onboard data scientists in SageMaker with custom permissions in place.
Introducing Amazon SageMaker Model Cards SageMaker Model Cards helps you streamline model documentation throughout the ML lifecycle by creating a single source of truth for model information. For models trained on SageMaker, SageMaker Model Cards discovers and autopopulates details such as training jobs, training datasets, model artifacts, and inference environment. You can also record model details such as the model’s intended use, risk rating, and evaluation results. For compliance documentation and model evidence reporting, you can export your model cards to a PDF file and easily share them with your customers or regulators.
To start creating SageMaker Model Cards, go to the SageMaker console, select Governance in the left navigation menu, and select Model cards.
Select Create model card to document your model information.
Introducing Amazon SageMaker Model Dashboard SageMaker Model Dashboard lets you monitor all your models in one place. With this bird’s-eye view, you can now see which models are used in production, view model cards, visualize model lineage, track resources, and monitor model behavior through an integration with SageMaker Model Monitor and SageMaker Clarify. The dashboard automatically alerts you when models are not being monitored or deviate from expected behavior. You can also drill deeper into individual models to troubleshoot issues.
To access SageMaker Model Dashboard, go to the SageMaker console, select Governance in the left navigation menu, and select Model dashboard.
Note: The risk rating shown above is for illustrative purposes only and may vary based on input provided by you.
Now Available Amazon SageMaker Role Manager, SageMaker Model Cards, and SageMaker Model Dashboard are available today at no additional charge in all the AWS Regions where Amazon SageMaker is available except for the AWS GovCloud and AWS China Regions.
To learn more, visit ML governance with Amazon SageMaker and check the developer guide.
When operating a business, you have to find the right balance between speed and control for your cloud operations. On one side, you want to have the ability to quickly provision the cloud resources you need for your applications. At the same time, depending on your industry, you need to maintain compliance with regulatory, security, and operational best practices.
AWS Config provides rules, which you can run in detective mode to evaluate if the configuration settings of your AWS resources are compliant with your desired configuration settings. Today, we are extending AWS Config rules to support proactive mode so that they can be run at any time before provisioning and save time spent to implement custom pre-deployment validations.
When creating standard resource templates, platform teams can run AWS Config rules in proactive mode so that they can be tested to be compliant before being shared across your organization. When implementing a new service or a new functionality, development teams can run rules in proactive mode as part of their continuous integration and continuous delivery (CI/CD) pipeline to identify noncompliant resources.
You can also use AWS CloudFormation Guard in your deployment pipelines to check for compliance proactively and ensure that a consistent set of policies are applied both before and after resources are provisioned.
Let’s see how this works in practice.
Using Proactive Compliance with AWS Config In the AWS Config console, I choose Rules in the navigation pane. In the rules table, I see the new Enabled evaluation mode column that specifies whether the rule is proactive or detective. Let’s set up my first rule.
I choose Add rule, and then I enter rds-storage in the AWS Managed Rules search box to find the rds-storage-encrypted rule. This rule checks whether storage encryption is enabled for your Amazon Relational Database Service (RDS) DB instances and can be added in proactive or detective evaluation mode. I choose Next.
In the Evaluation mode section, I turn on proactive evaluation. Now both the proactive and detective evaluation switches are enabled.
I leave all the other settings to their default values and choose Next. In the next step, I review the configuration and add the rule.
Now, I can use proactive compliance via the AWS Config API (including the AWS Command Line Interface (CLI) and AWS SDKs) or with CloudFormation Guard. In my CI/CD pipeline, I can use the AWS Config API to check the compliance of a resource before creating it. When deploying using AWS CloudFormation, I can set up a CloudFormation hook to proactively check my configuration before the actual deployment happens.
Let’s do an example using the AWS CLI. First, I call the StartProactiveEvaluationResponse API with in input the resource ID (for reference only), the resource type, and its configuration using the CloudFormation schema. For simplicity, in the database configuration, I only use the StorageEncrypted option and set it to true to pass the evaluation. I use an evaluation timeout of 60 seconds, which is more than enough for this rule.
I get back in output the ResourceEvaluationId that I use to check the evaluation status using the GetResourceEvaluationSummary API. In the beginning, the evaluation is IN_PROGRESS. It usually takes a few seconds to get a COMPLIANT or NON_COMPLIANT result.
As expected, the Amazon RDS configuration is compliant to the rds-storage-encrypted rule. If I repeat the previous steps with StorageEncrypted set to false, I get a noncompliant result.
If more than one rule is enabled for a resource type, all applicable rules are run in proactive mode for the resource evaluation. To find out individual rule-level compliance for the resource, I can call the GetComplianceDetailsByResource API:
If, when looking at these details, your desired rule is not invoked, be sure to check that proactive mode is turned on.
Availability and Pricing Proactive compliance will be available in all commercial AWS Regions where AWS Config is offered but it might take a few days to deploy this new capability across all these Regions. I’ll update this post when this deployment is complete. To see which AWS Config rules can be turned into proactive mode, see the Developer Guide.
You are charged based on the number of AWS Config rule evaluations recorded. A rule evaluation is recorded every time a resource is evaluated for compliance against an AWS Config rule. Rule evaluations can be run in detective mode and/or in proactive mode, if available. If you are running a rule in both detective mode and proactive mode, you will be charged for only the evaluations in detective mode. For more information, see AWS Config pricing.
To provide the best experiences, we use technologies like cookies to store and/or access device information. Consenting to these technologies will allow us to process data such as browsing behavior or unique IDs on this site. Not consenting or withdrawing consent, may adversely affect certain features and functions.
Functional
Always active
The technical storage or access is strictly necessary for the legitimate purpose of enabling the use of a specific service explicitly requested by the subscriber or user, or for the sole purpose of carrying out the transmission of a communication over an electronic communications network.
Preferences
The technical storage or access is necessary for the legitimate purpose of storing preferences that are not requested by the subscriber or user.
Statistics
The technical storage or access that is used exclusively for statistical purposes.The technical storage or access that is used exclusively for anonymous statistical purposes. Without a subpoena, voluntary compliance on the part of your Internet Service Provider, or additional records from a third party, information stored or retrieved for this purpose alone cannot usually be used to identify you.
Marketing
The technical storage or access is required to create user profiles to send advertising, or to track the user on a website or across several websites for similar marketing purposes.
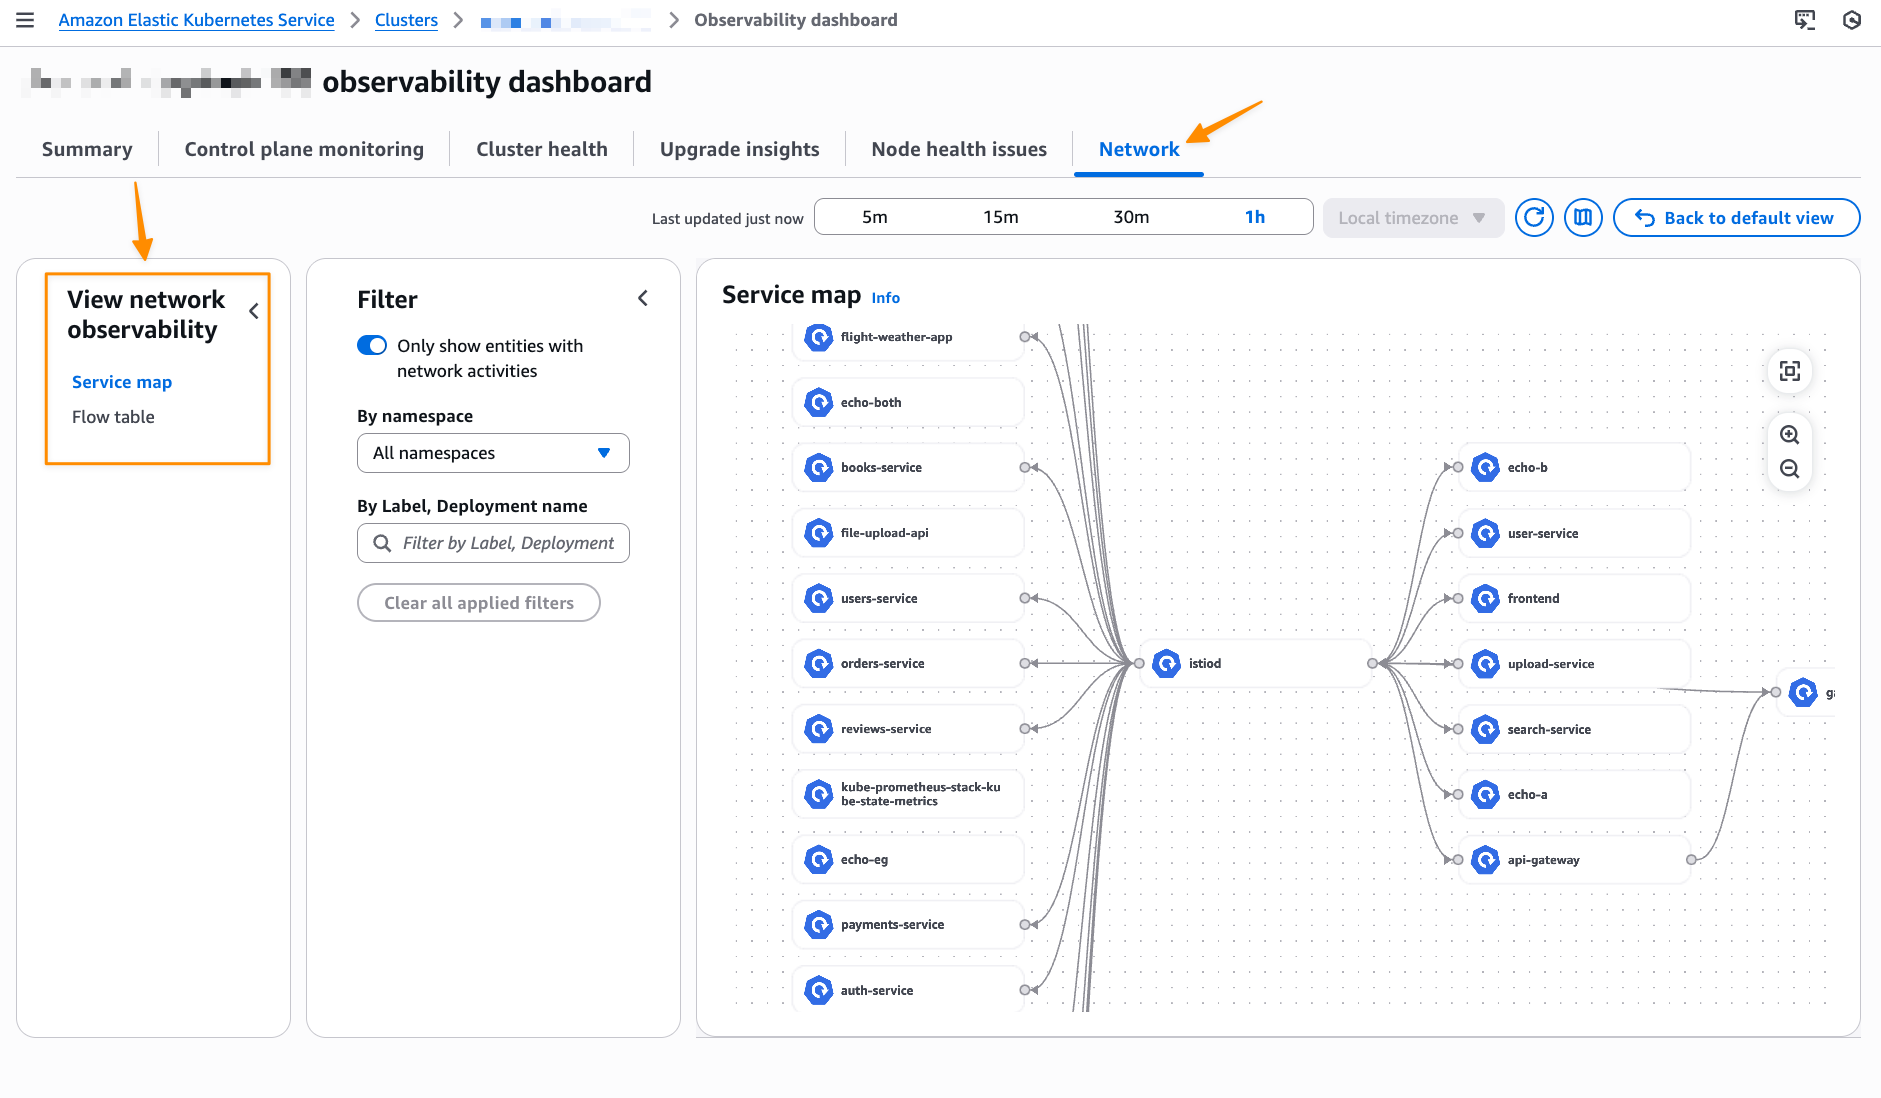
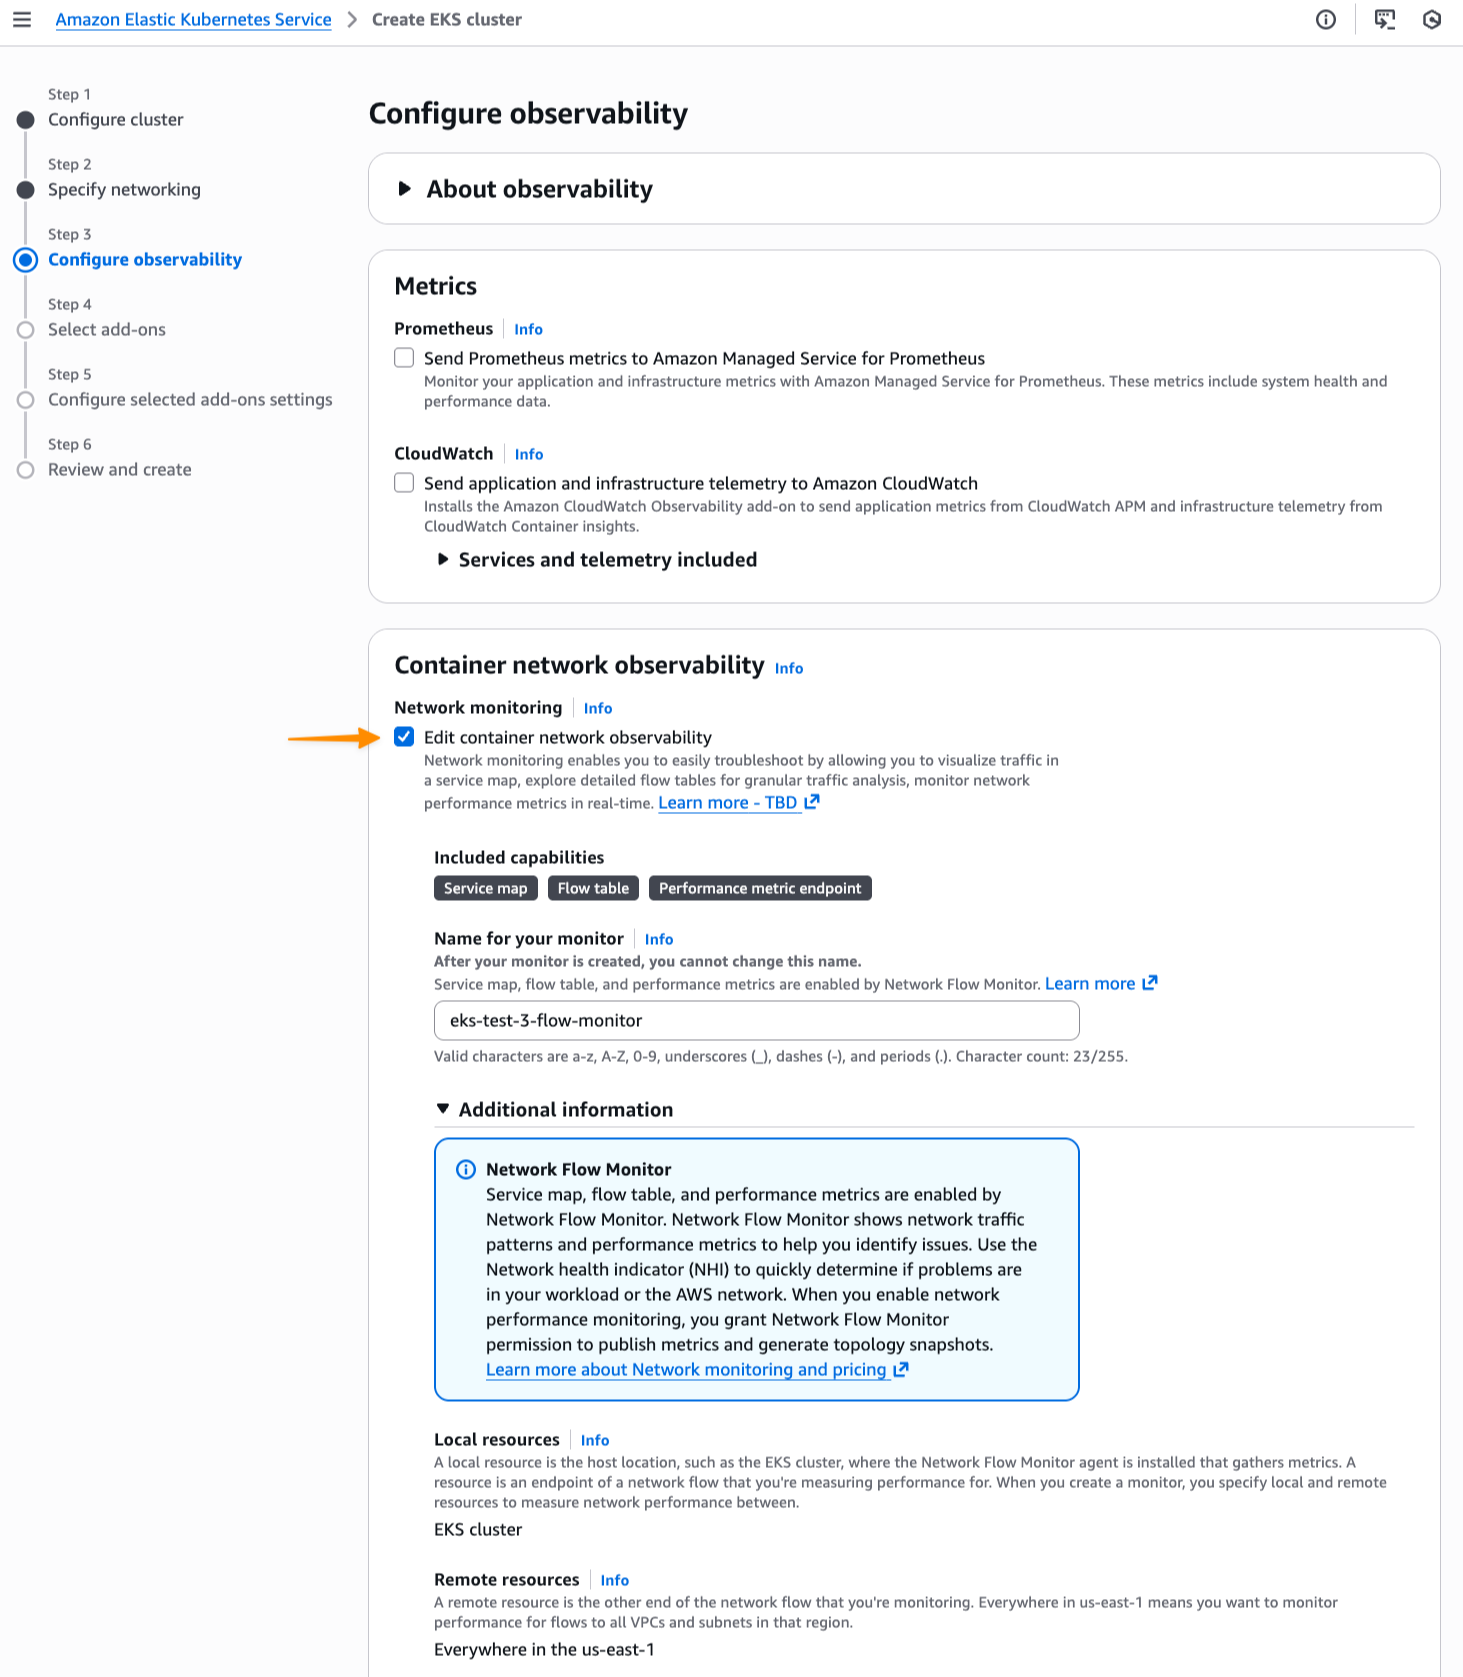
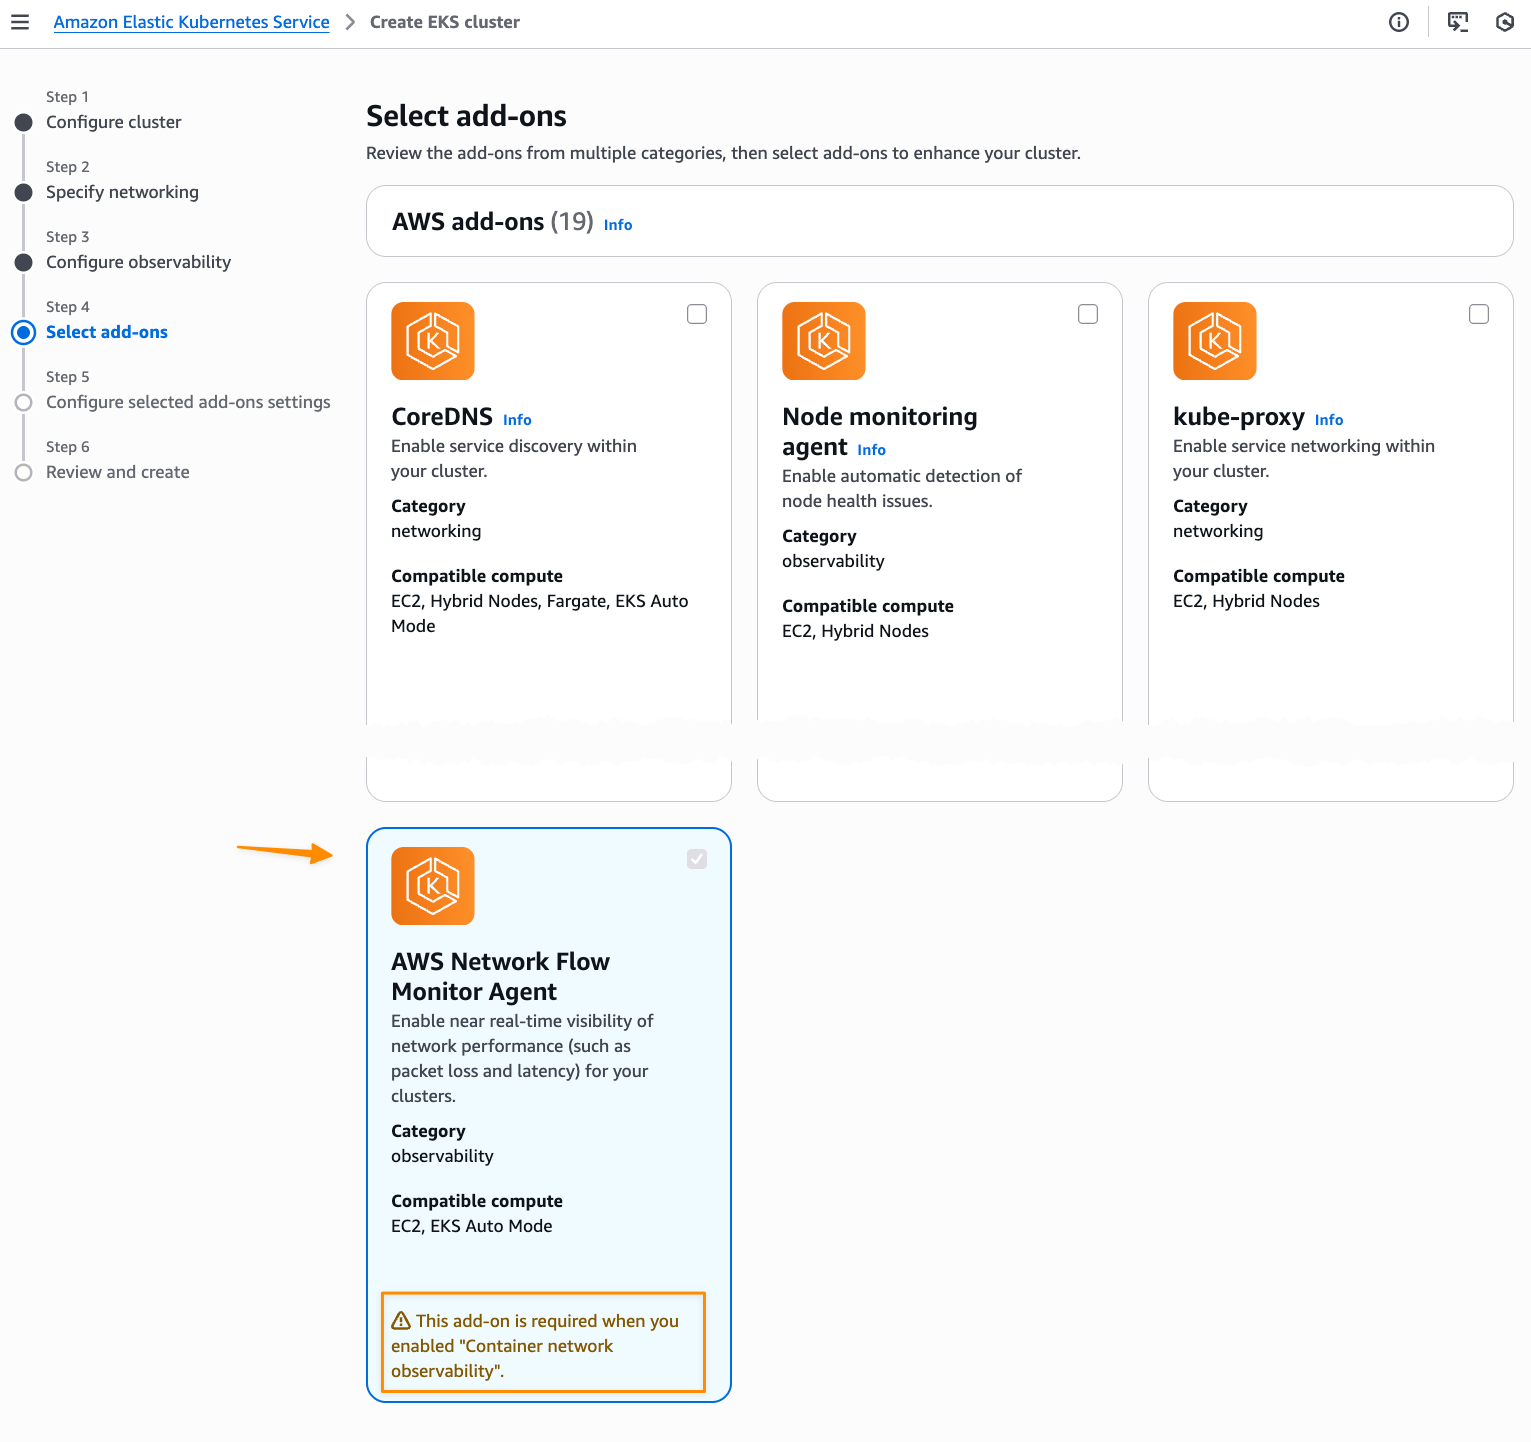
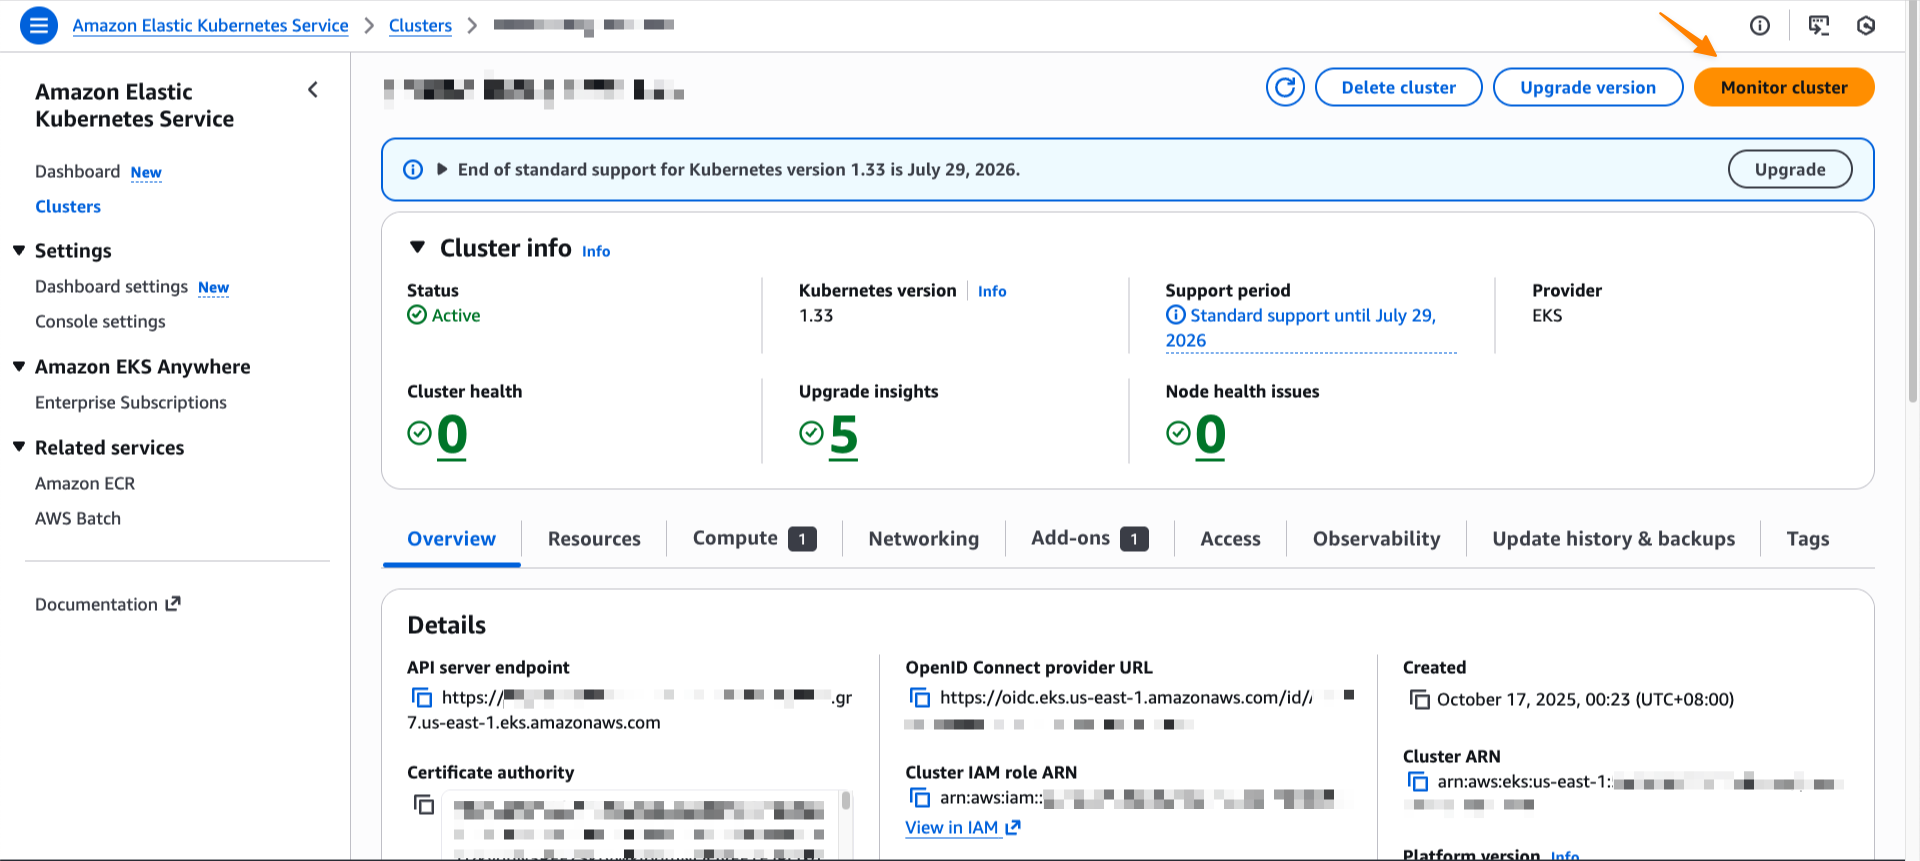
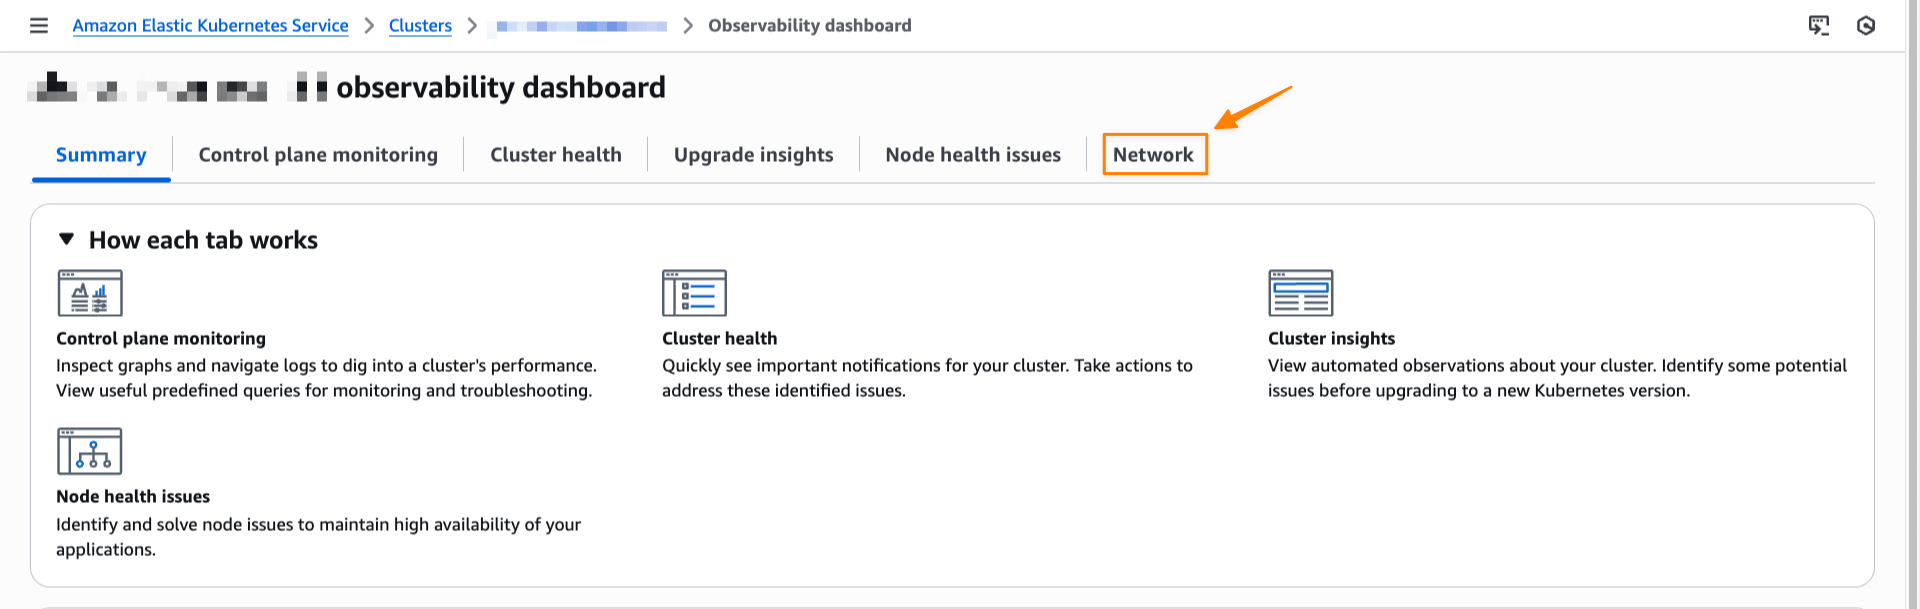
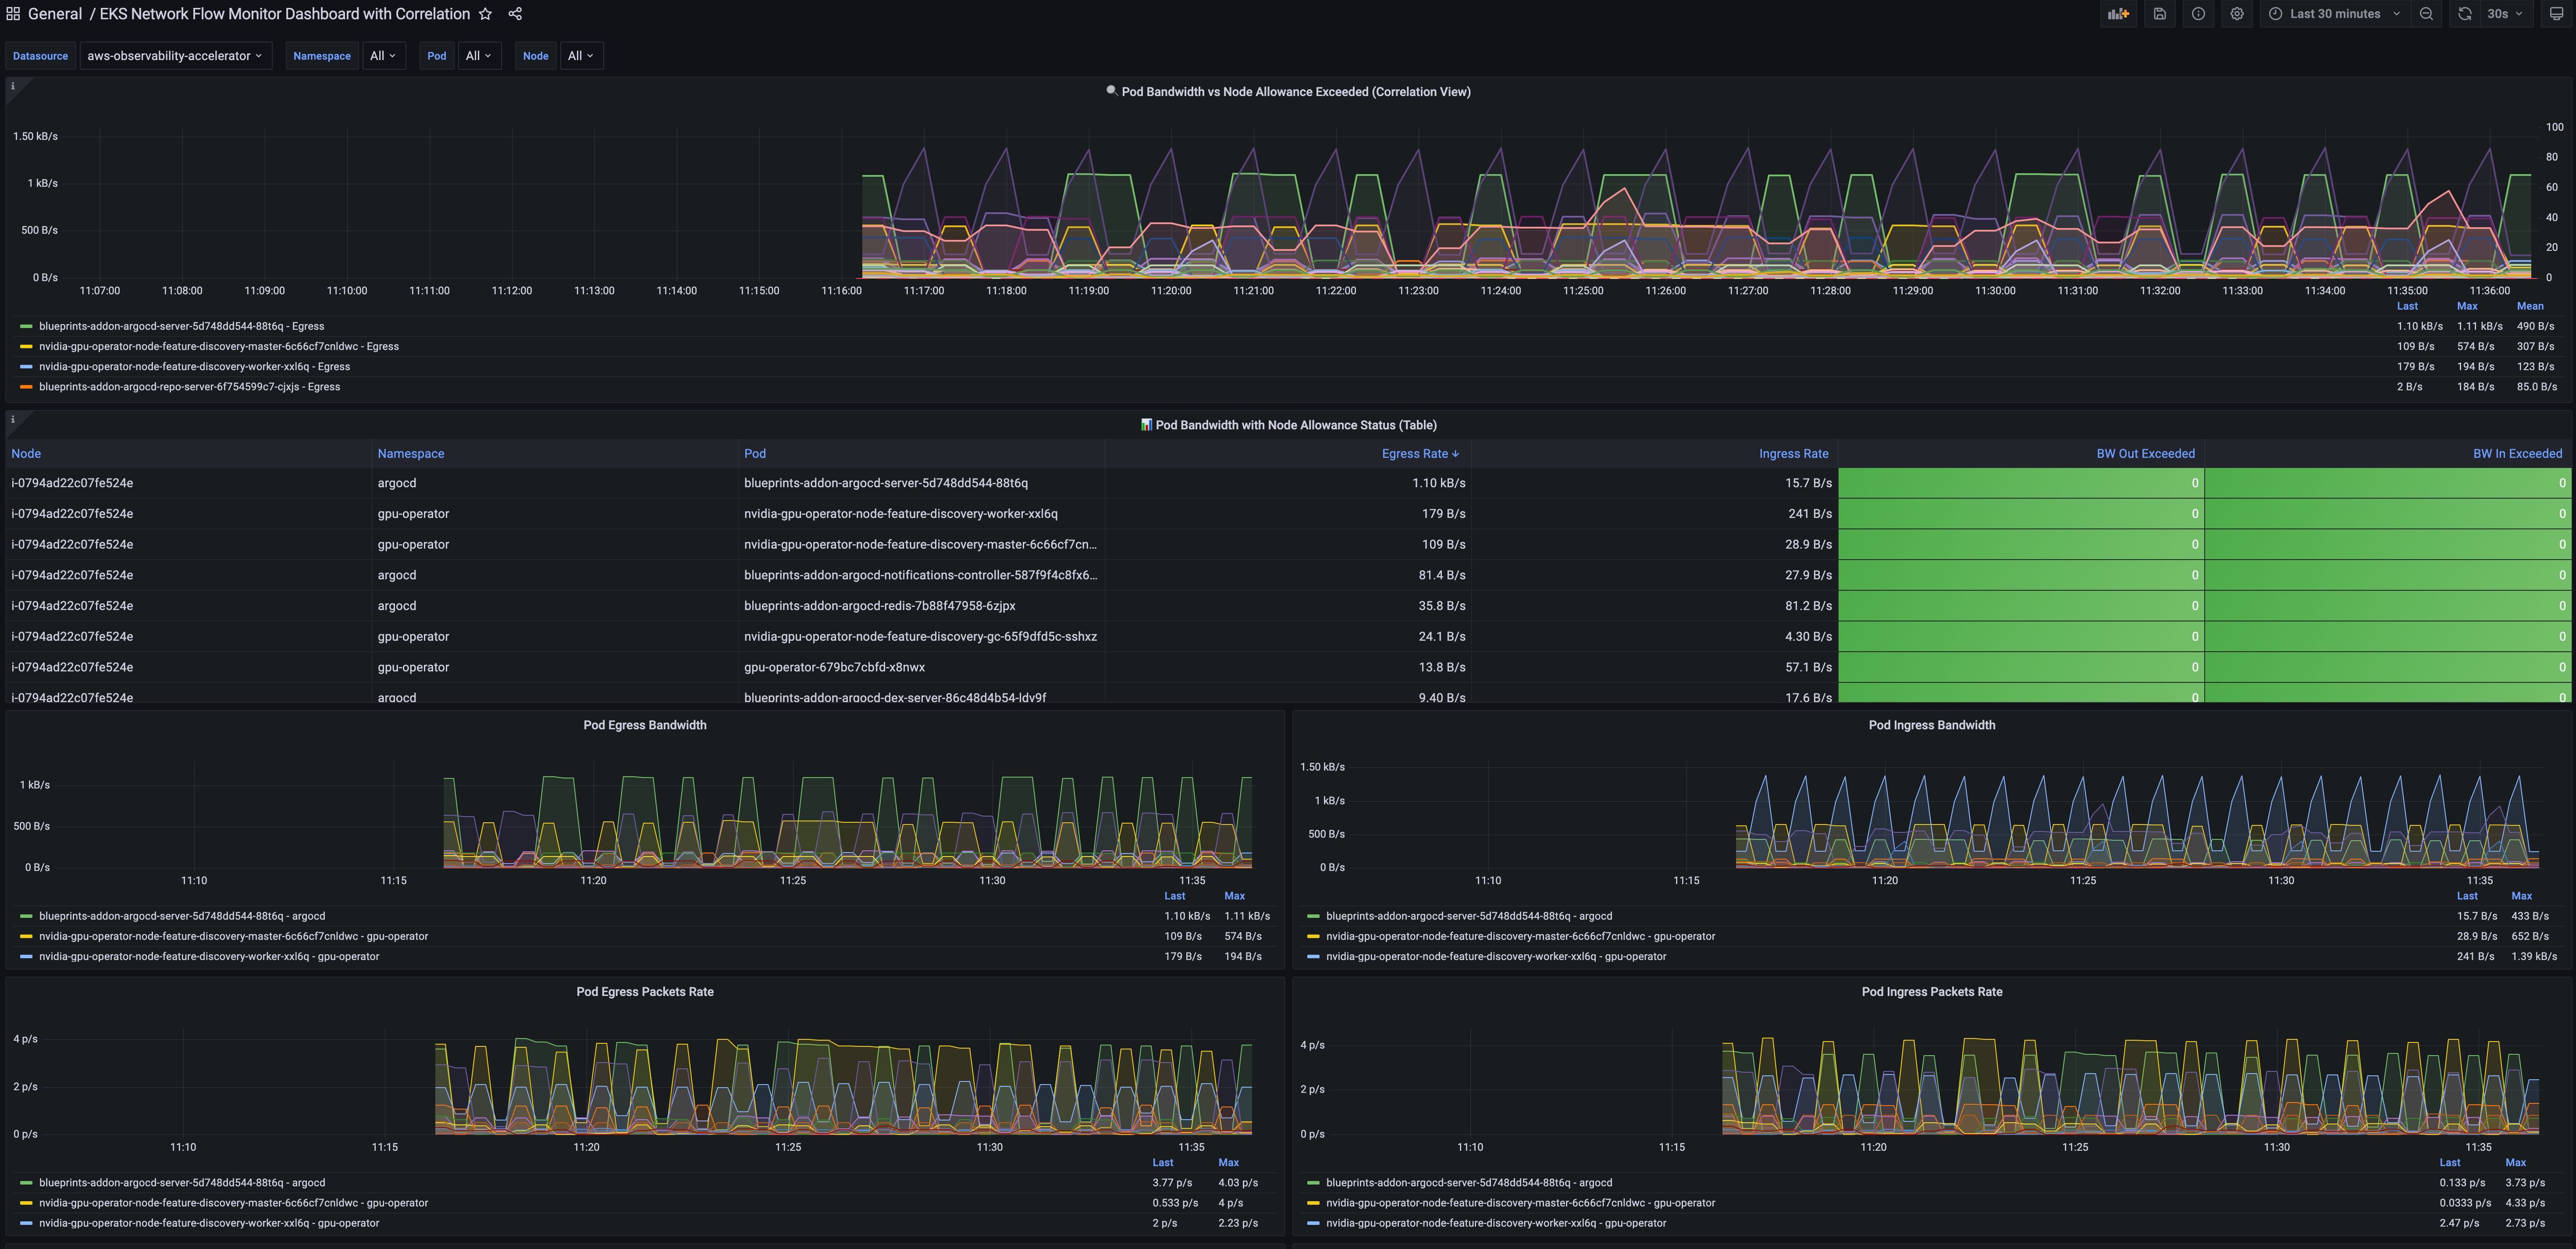
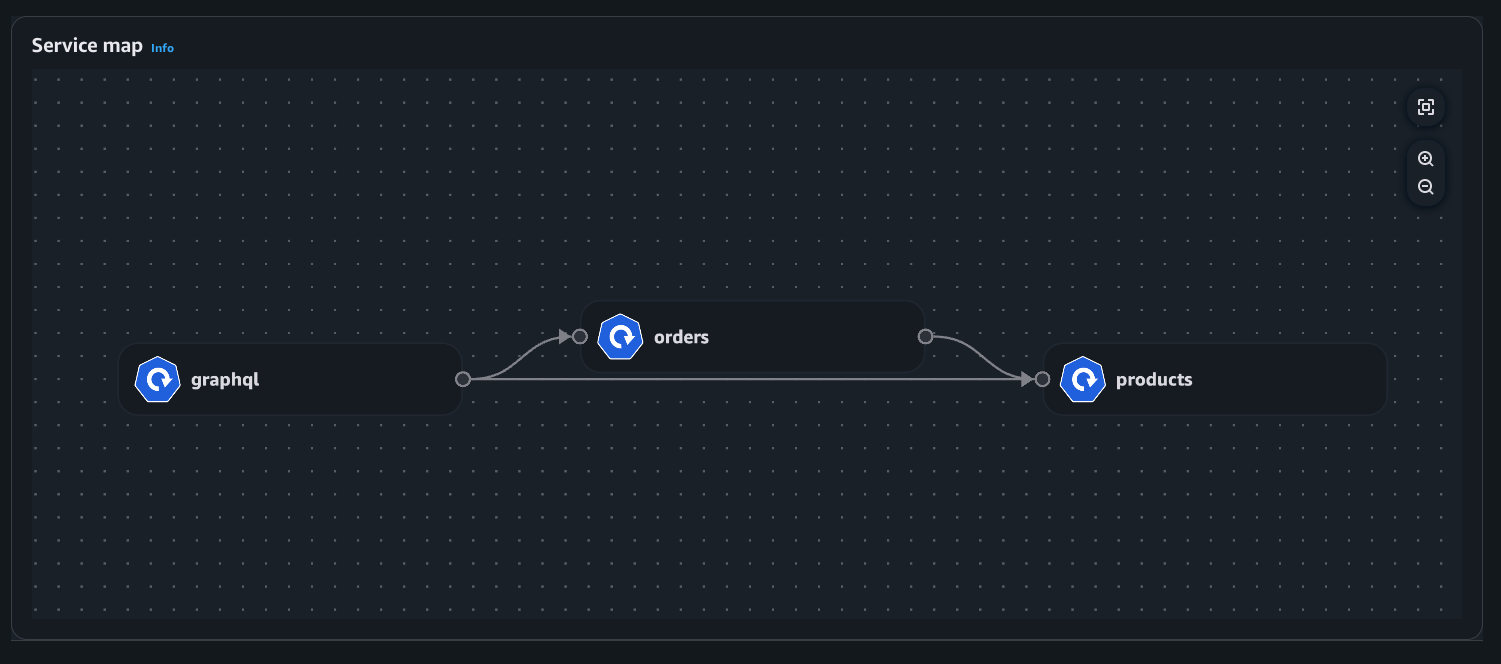
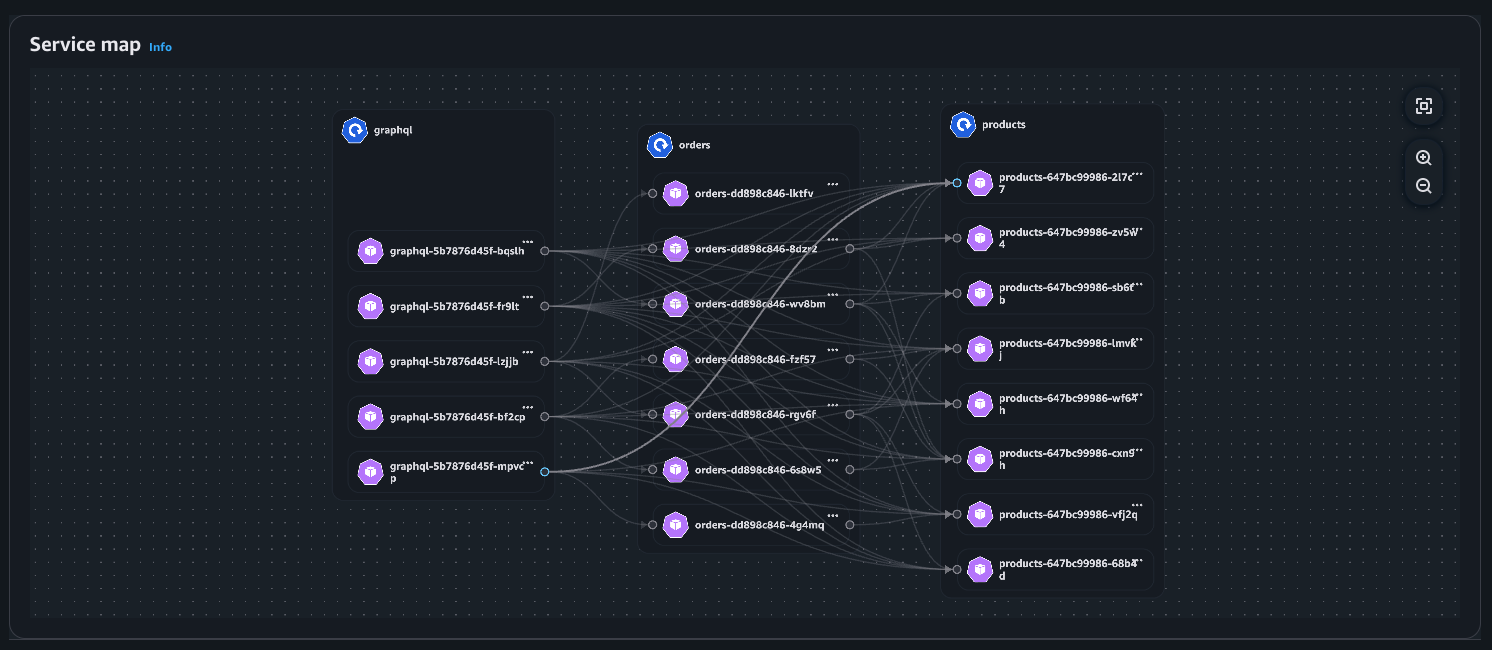
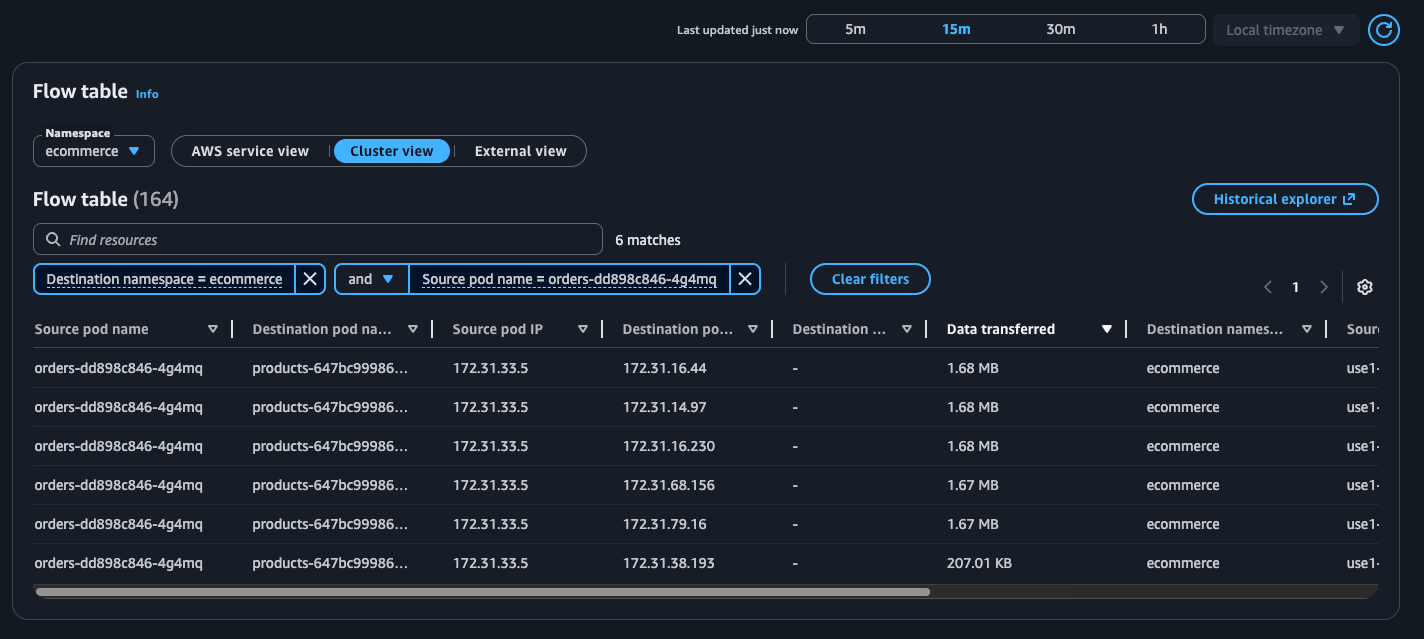
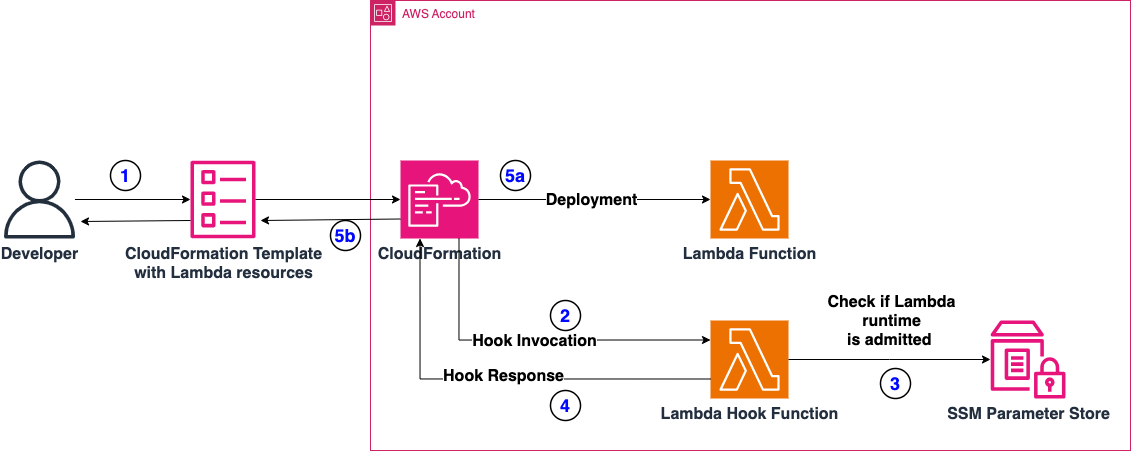
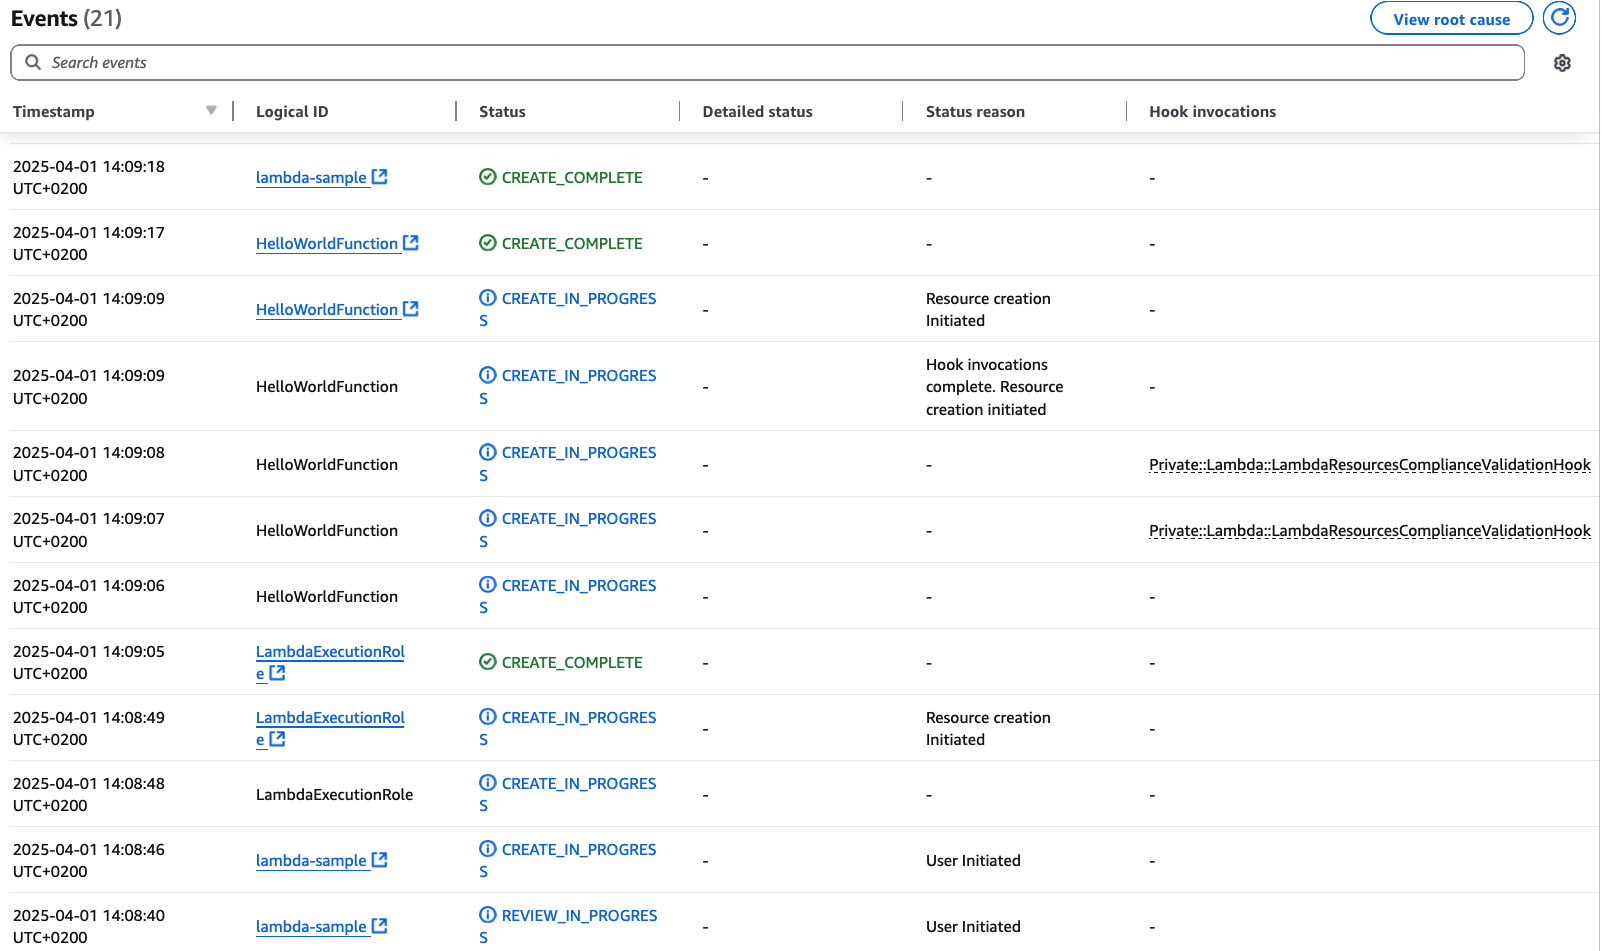
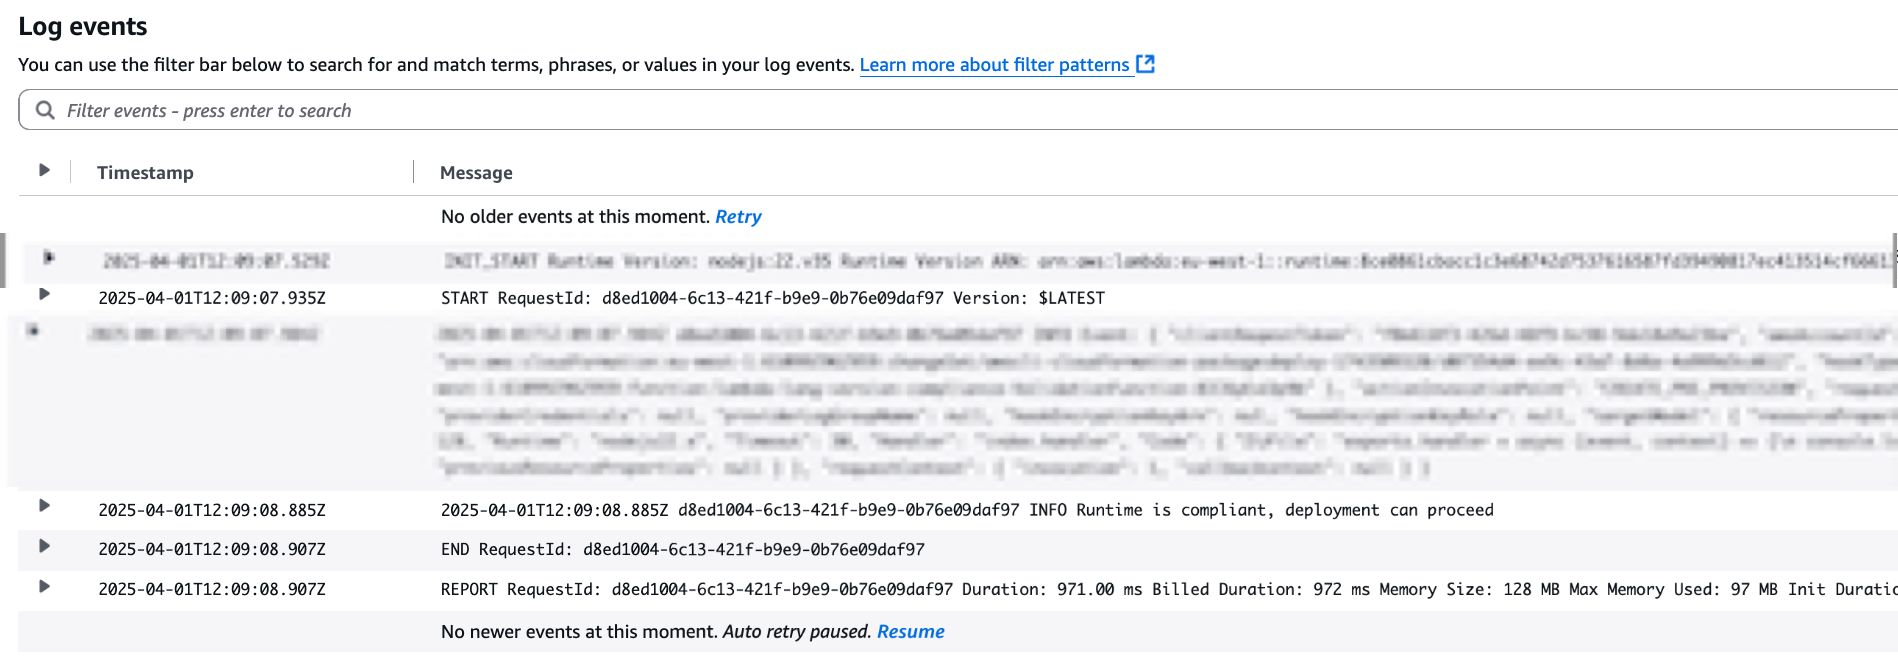
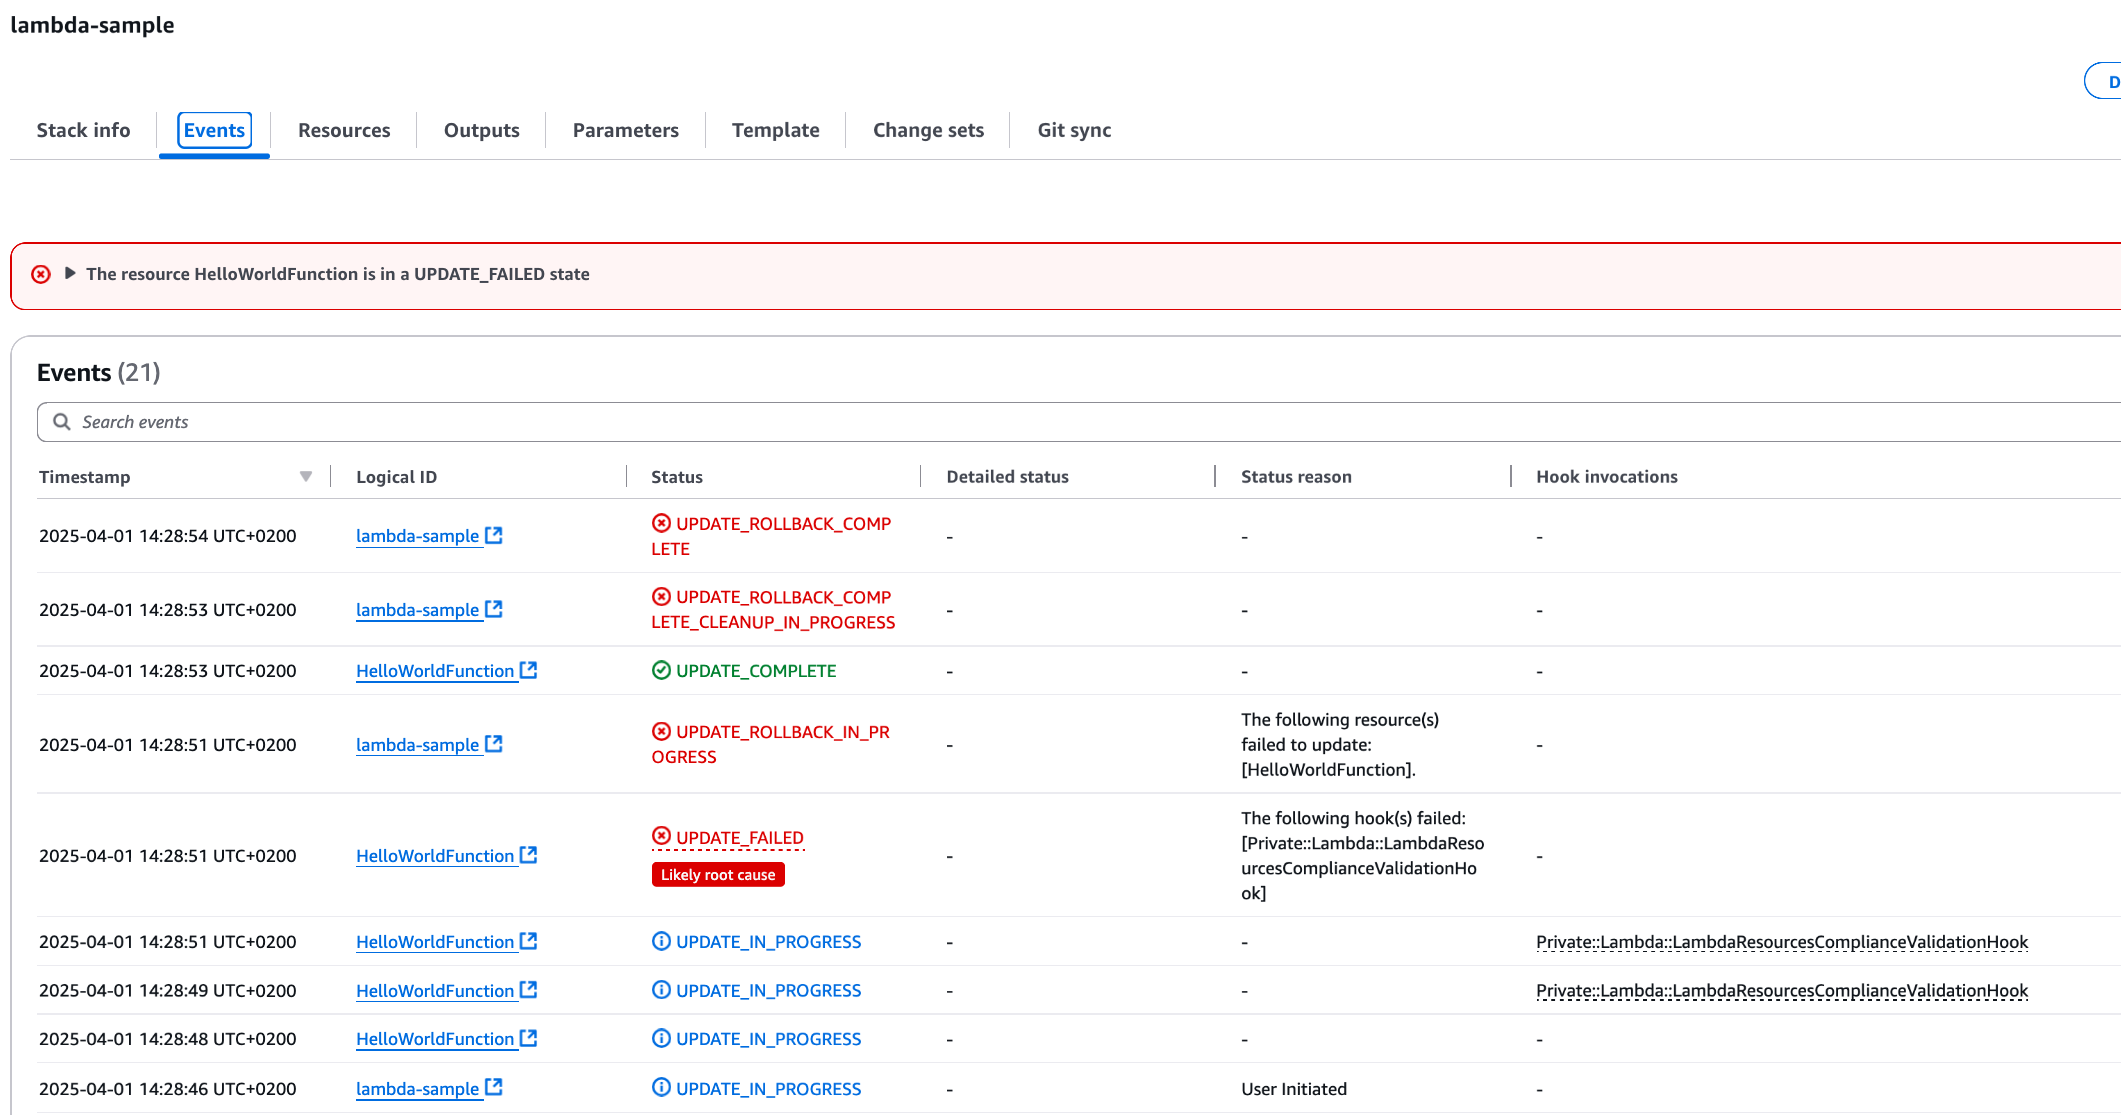
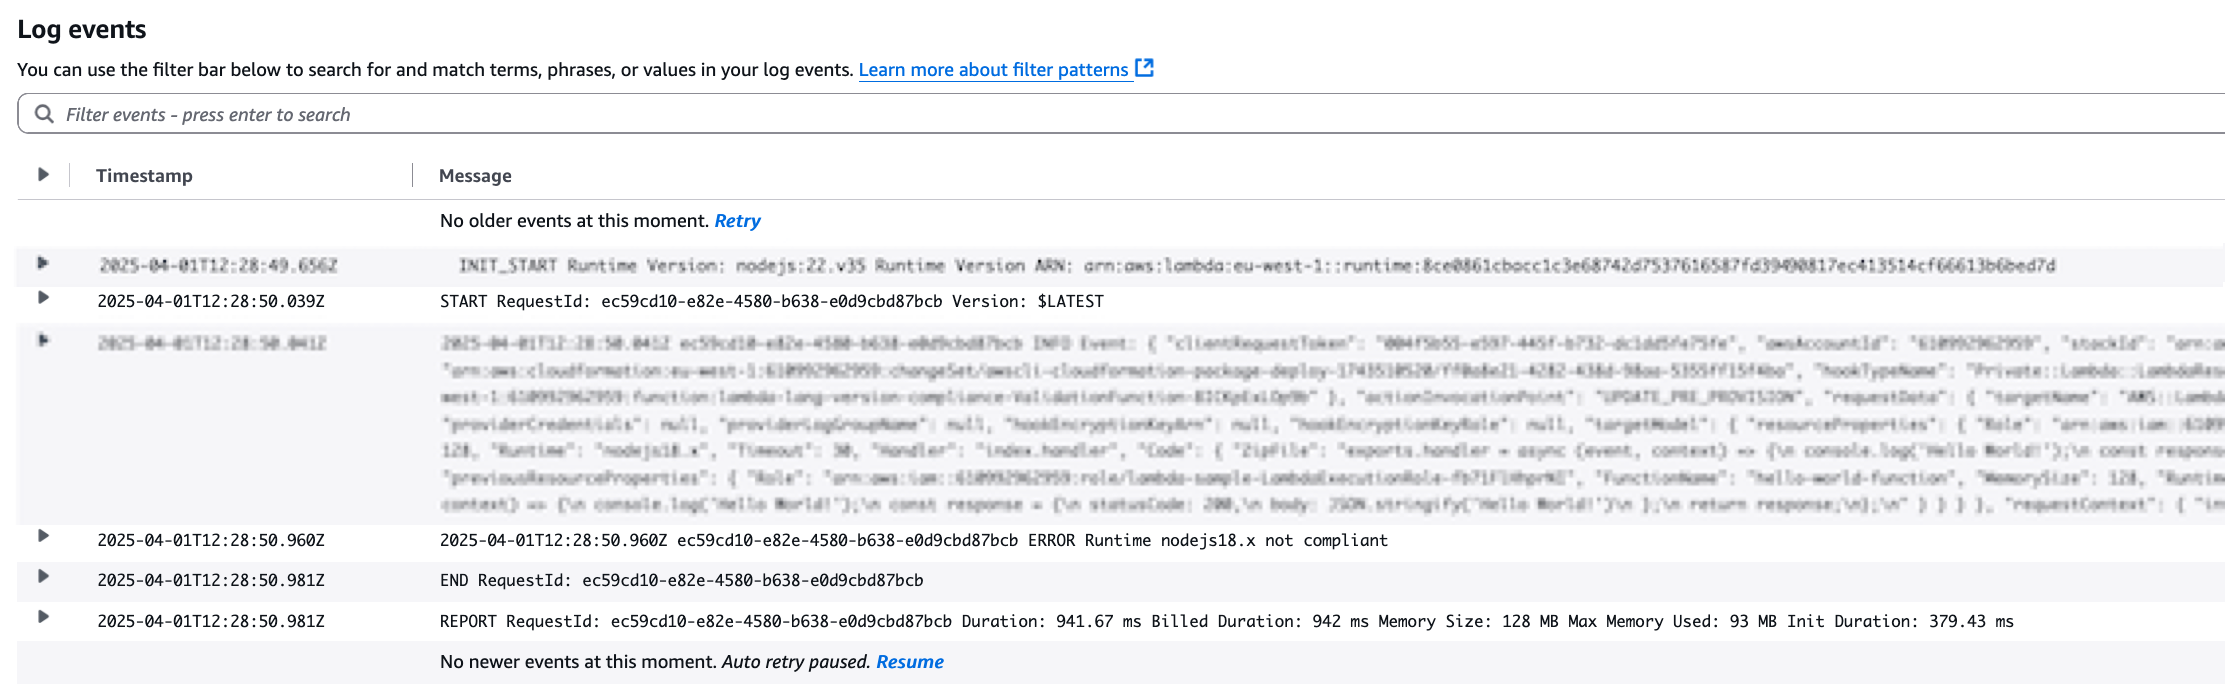


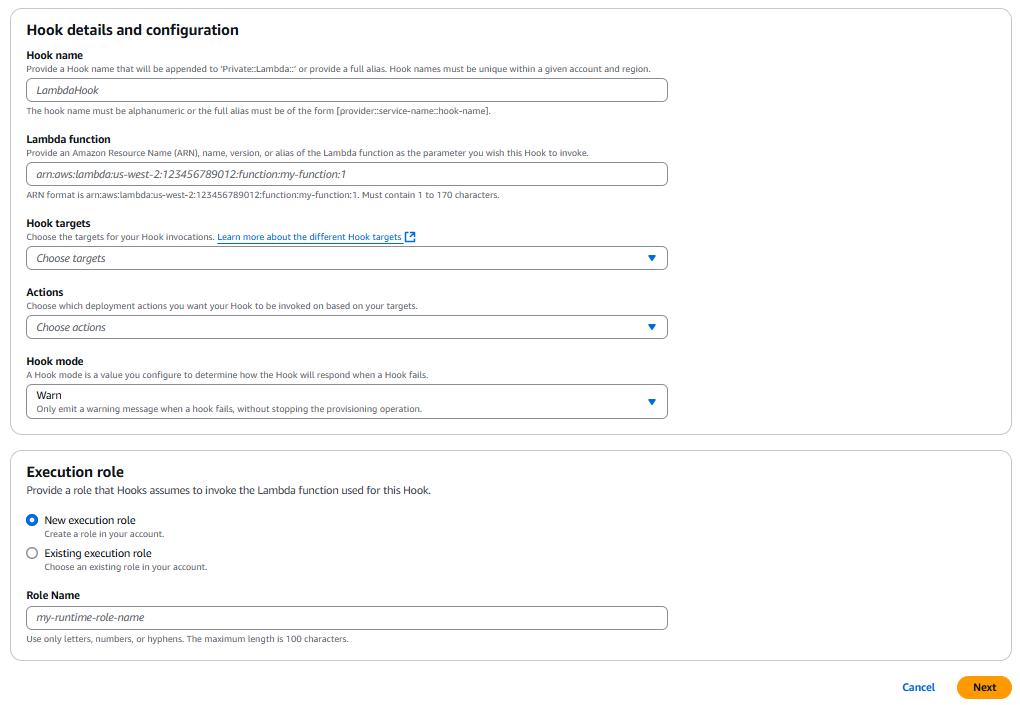


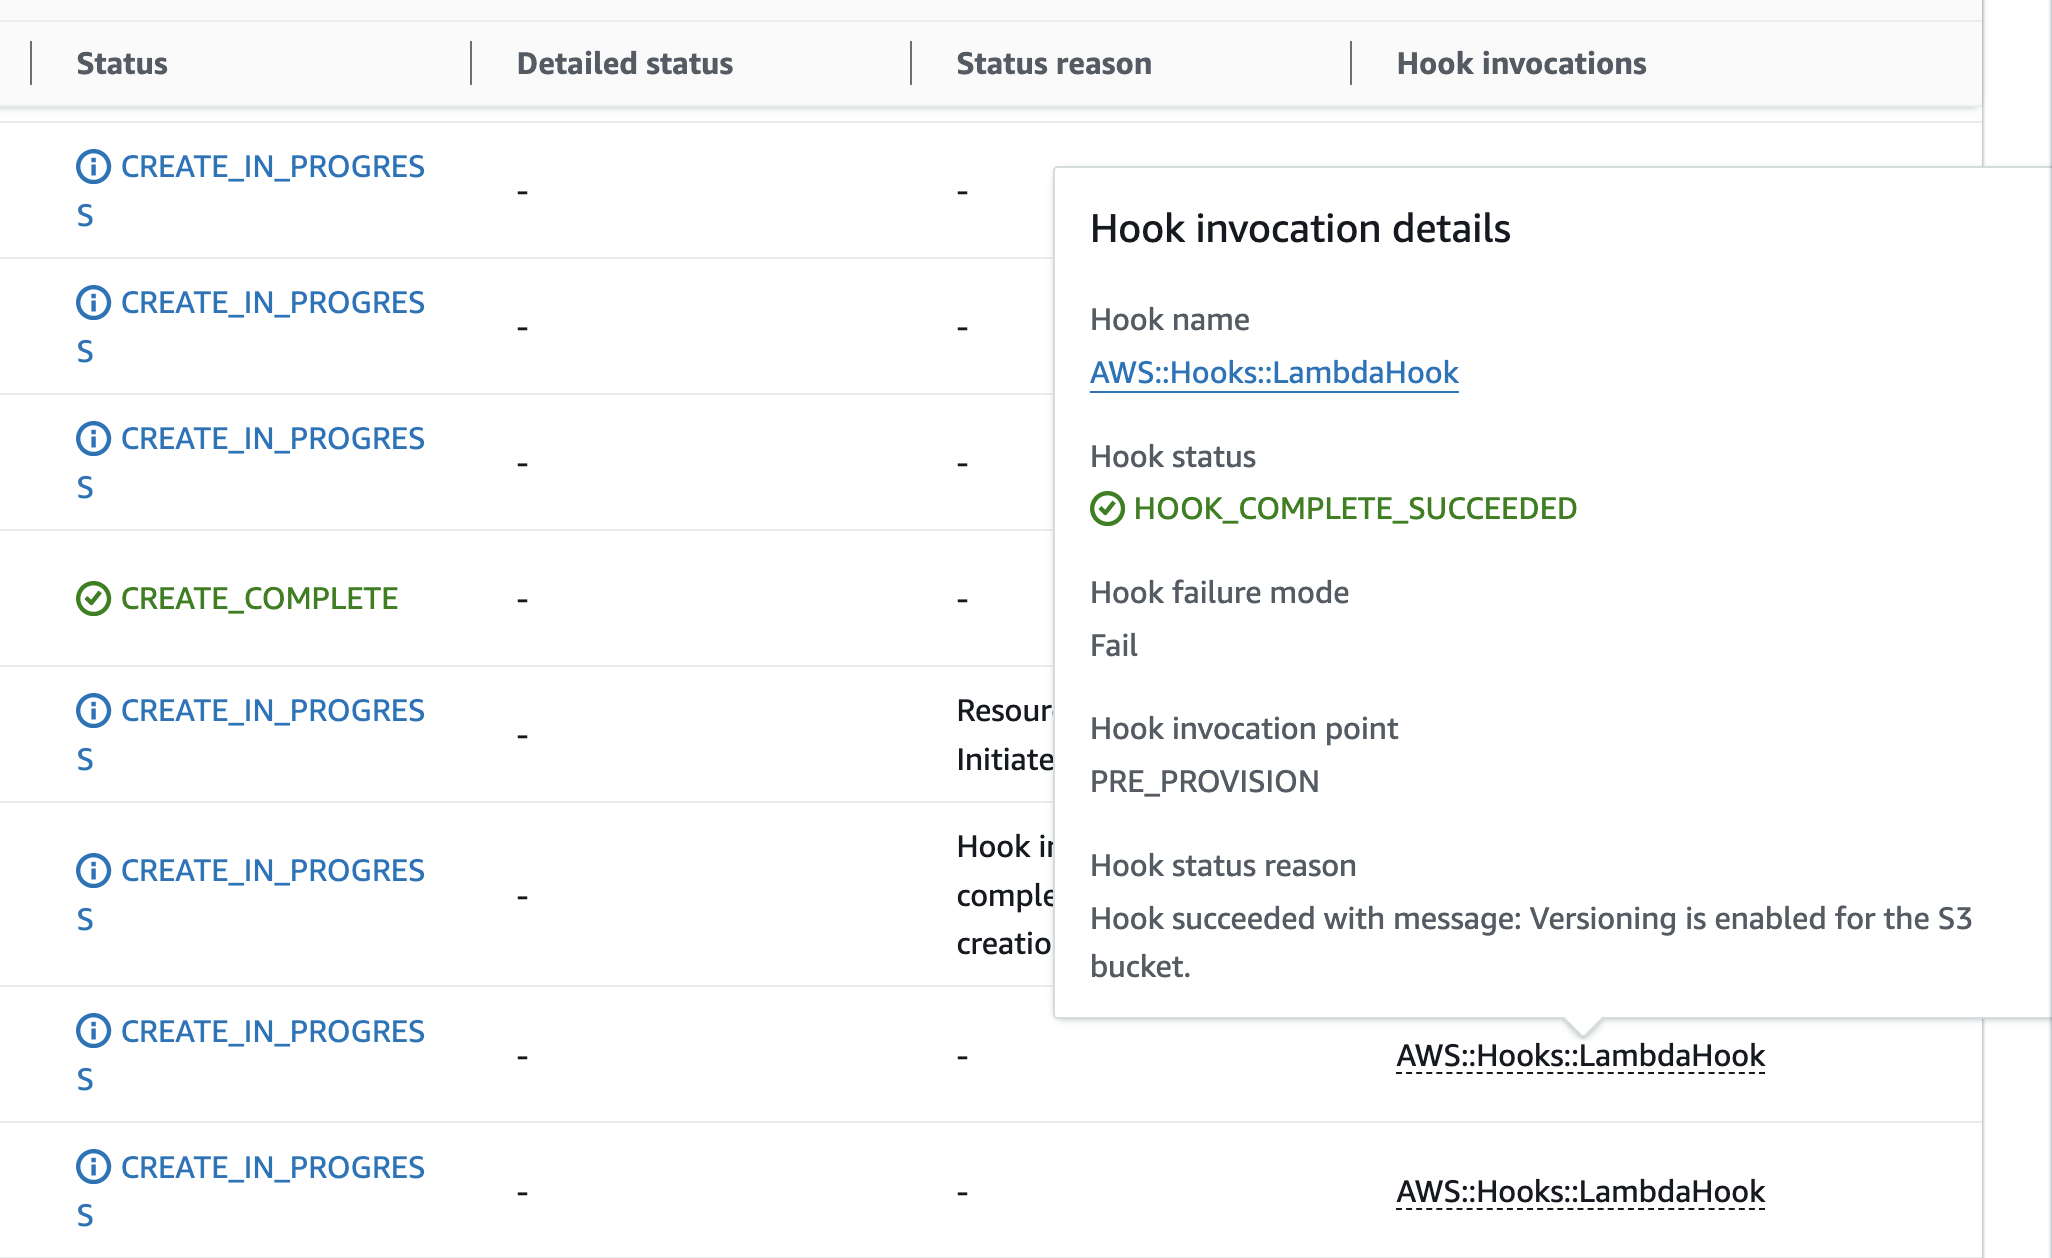

 Stella Hie is a Sr. Product Manager Technical for AWS Infrastructure as Code. She focuses on proactive control and governance space, working on delivering the best experience for customers to use AWS solutions safely. Outside of work, she enjoys hiking, playing piano, and watching live shows.


 Sumalatha Bachu is Senior Director, Technology at FINRA. She manages Big Data Operations which includes managing petabyte-scale data and complex workloads processing in cloud. Additionally, she is an expert in developing Enterprise Application Monitoring and Observability Solutions, Operational Data Analytics, & Machine Learning Model Governance work flows. Outside of work, she enjoys doing yoga, practicing singing, and teaching in her free time.
 PremKiran Bejjam is Lead Engineer Consultant at FINRA, specializing in developing resilient and scalable systems. With a keen focus on designing monitoring solutions to enhance infrastructure reliability, he is dedicated to optimizing system performance. Beyond work, he enjoys quality family time and continually seeks out new learning opportunities.
 Akhil Chalamalasetty is Director, Market Regulation Technology at FINRA. He is a Big Data subject matter expert specializing in building cutting edge solutions at scale along with optimizing workloads, data, and its processing capabilities. Akhil enjoys sim racing and Formula 1 in his free time.