All posts by Nyein Chan Zaw

Monitoring Sensor Data with Zabbix and Modbus Protocol

Post Syndicated from Nyein Chan Zaw original https://blog.zabbix.com/monitoring-sensor-data-with-zabbix-and-modbus-protocol/29471/

This week’s blog entry comes to us from Nyein Chan Zaw, who is based in Bangkok, Thailand and works as an Infrastructure Specialist for Green Will Solution. Read on to see how he uses his integrating a Modbus protocol with Zabbix to monitor data from temperature, humidity, and smoke sensors — and display their metrics on a Zabbix dashboard.

Step 1: Collecting Sensor Data via Modbus Protocol

This snapshot shows how all three sensors are synchronized with the Modbus protocol, confirming that the communication is operational.

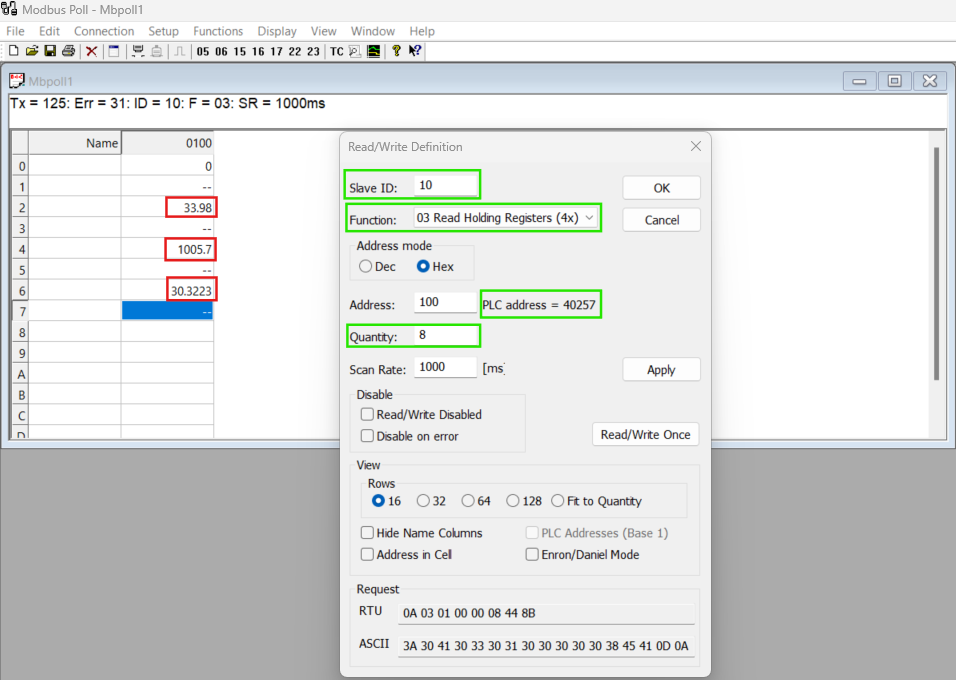
In the initial setup, the temperature, humidity, and smoke sensors transmit their data to the Modbus protocol. This data synchronization can be visualized using Modbus polling software, where the values from each sensor are displayed in real-time.

Step 2: Configuring Modbus Files on Zabbix Agent

This snapshot demonstrates the configuration of three MB files corresponding to the three sensors.

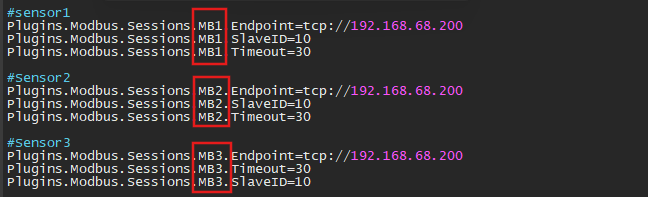
To enable Zabbix to communicate with Modbus, the Modbus configuration (MB) files must be set up in the Zabbix Agent configuration file on the Zabbix server. Each sensor requires an individual MB configuration entry, specifying the Modbus parameters such as function code, register address, and data type.

Step 3: Creating a Host for Modbus Protocol in Zabbix

Next, a Zabbix host must be created to represent the Modbus protocol device.

This snapshot highlights the host creation process with the associated IP address and configuration details.

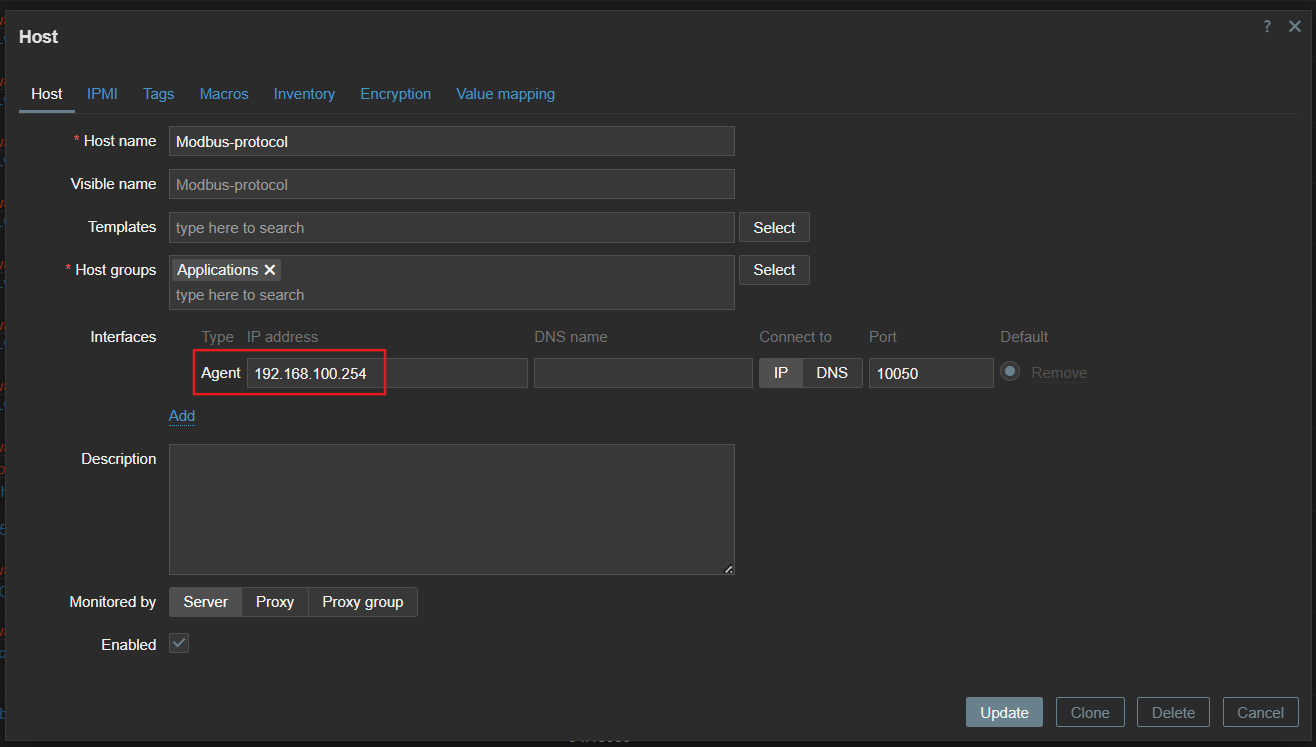
During this process, assign the Modbus protocol’s IP address as the host’s interface. Configure the interface to communicate with the Zabbix server using the Zabbix agent.

Step 4: Configuring Items for Each Sensor

Each sensor requires an item in Zabbix to capture its data.

This snapshot shows how items are configured for each sensor.

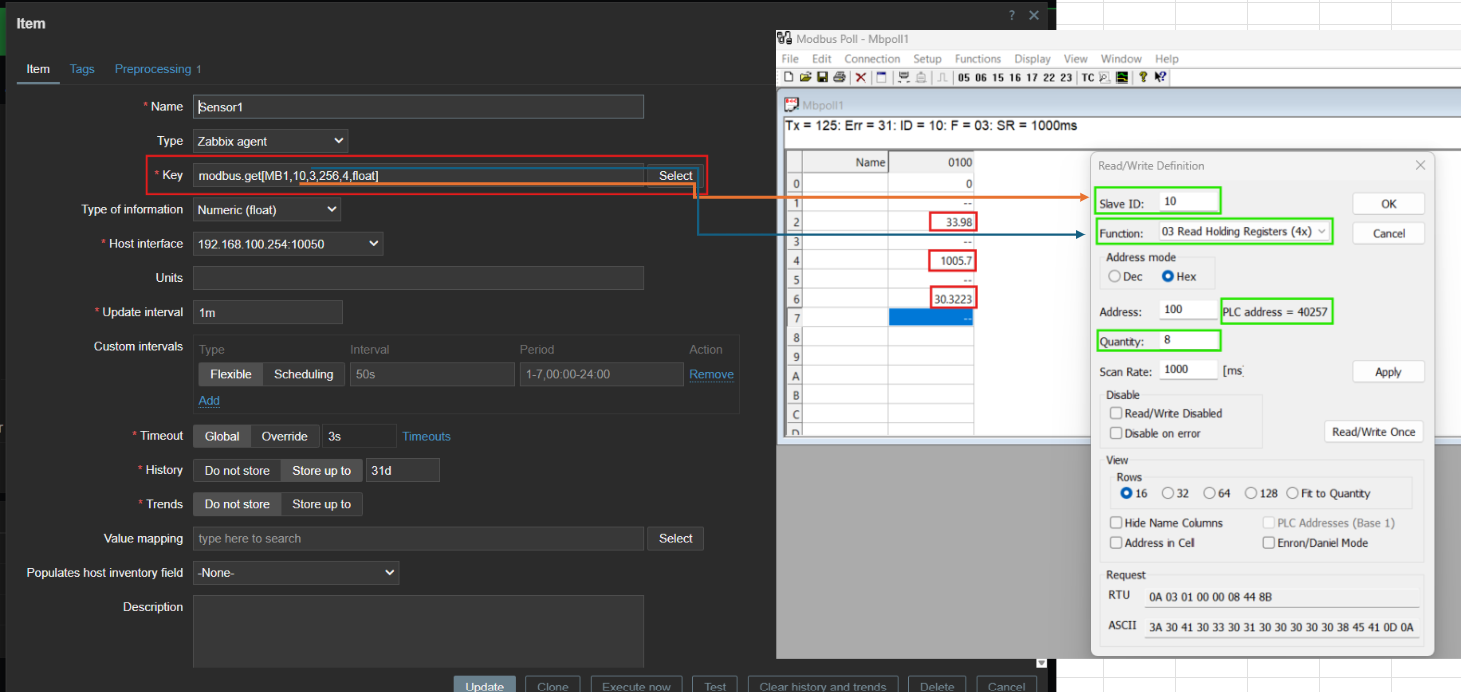
For every item, specify the Name for identification (e.g., Temperature Sensor). Define the Key, which includes the Modbus protocol function and register settings, to ensure accurate data retrieval.

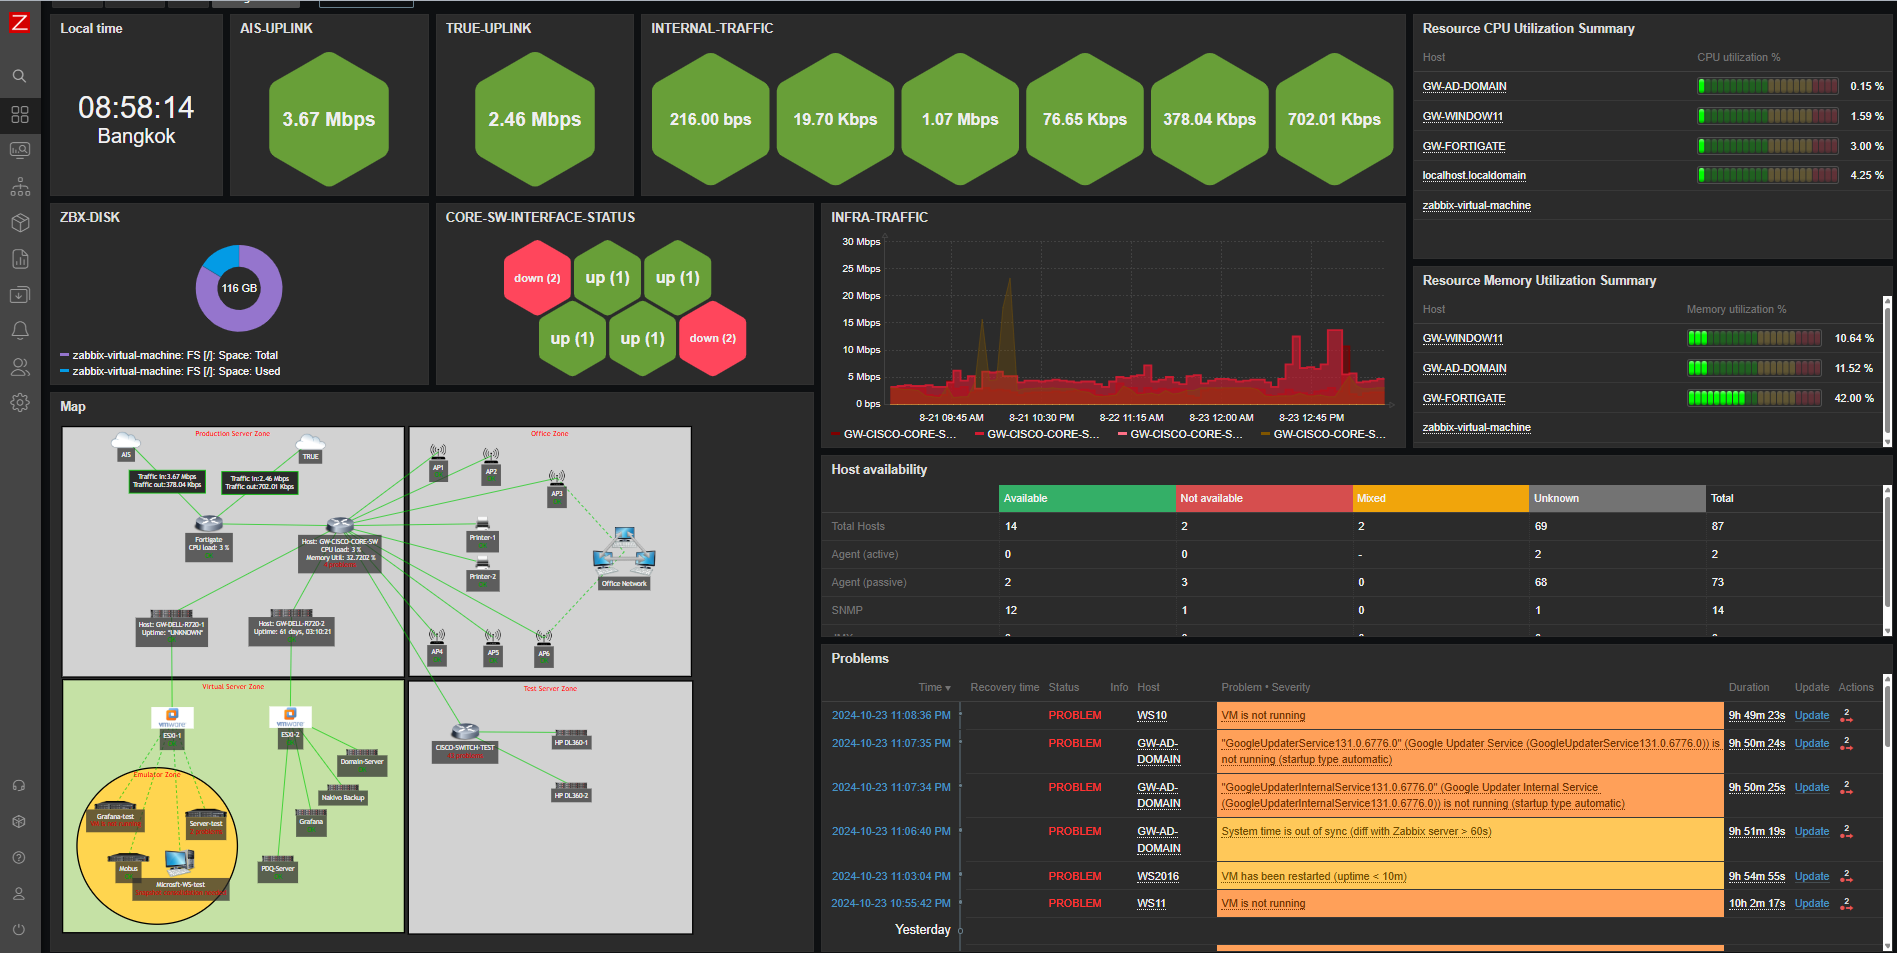
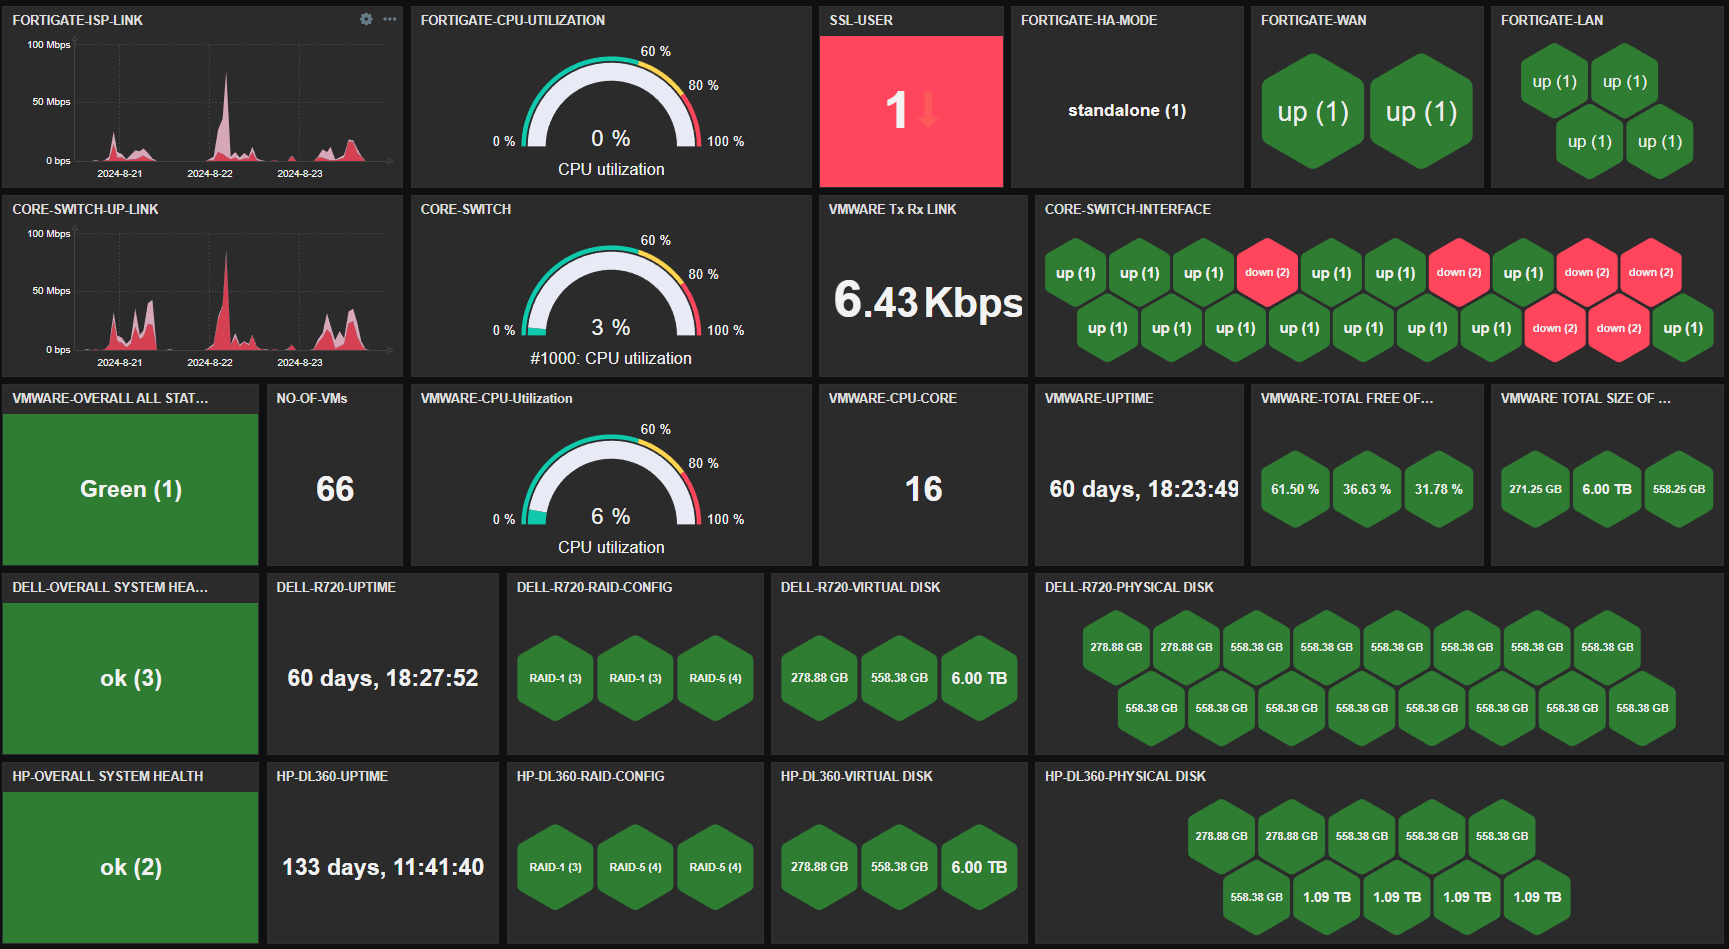
Step 5: Viewing and Utilizing Sensor Data in Zabbix

This snapshot displays the Zabbix dashboard, showcasing data from all three sensors.

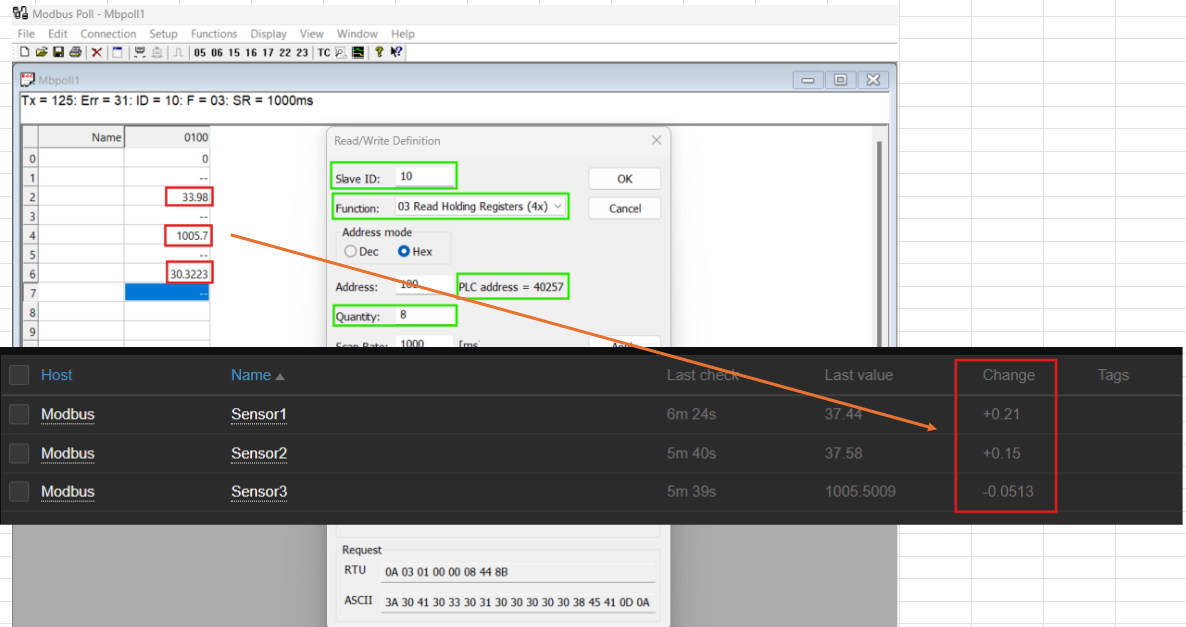
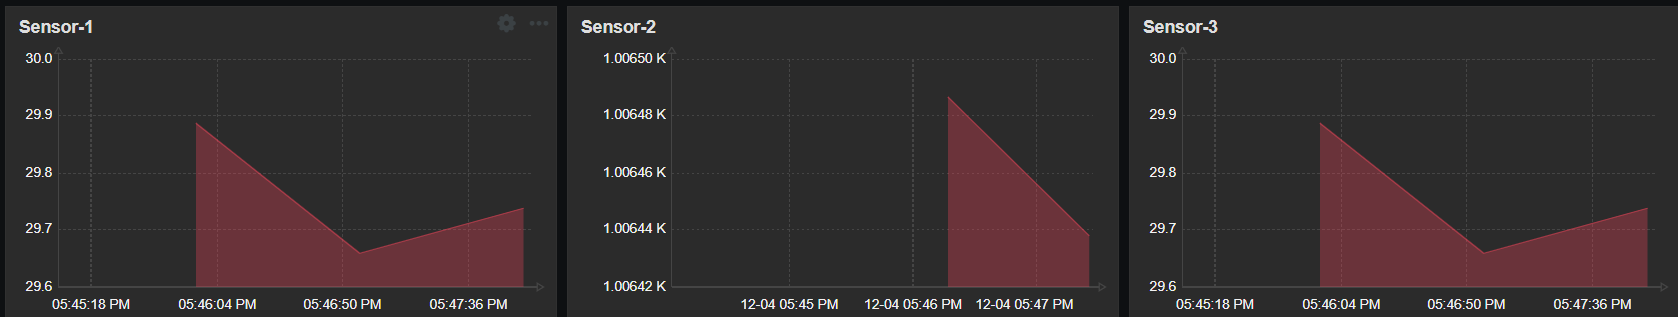
Once the host and items are configured, Zabbix starts collecting data from the Modbus protocol. This data is displayed in the Zabbix interface, where metrics for temperature, humidity, and smoke are updated in real-time. Additionally, a custom dashboard can be created to visualize all three sensors’ data at a glance, providing actionable insights for monitoring and decision-making.

Conclusion

Integrating Modbus with Zabbix streamlines the monitoring of sensor data, making it easy to collect, visualize, and act upon critical metrics. This process demonstrates Zabbix’s flexibility and scalability in managing industrial protocols and data sources, ensuring robust monitoring for diverse applications.

If you’re looking to implement similar solutions or need help integrating Modbus with Zabbix, feel free to reach out in the comments below!

The post Monitoring Sensor Data with Zabbix and Modbus Protocol appeared first on Zabbix Blog.

Monitoring a Complex Infrastructure Environment with Zabbix

Post Syndicated from Nyein Chan Zaw original https://blog.zabbix.com/monitoring-a-complex-infrastructure-environment-with-zabbix/28954/

Inviting the members of our global community to share their Zabbix dashboards with us prompted a flood of fascinating responses, and we’re highlighting a few of the most interesting submissions here on our blog. This week’s entry comes to us from Nyein Chan Zaw, who is based in Bangkok, Thailand and works as an Infrastructure Specialist for Green Will Solution. Read on to see how he uses his Zabbix dashboard to monitor a highly intricate infrastructure in real time. 

I appreciate the chance to share my dashboard, and I would also like to share a use case that demonstrates the practical implementation of Zabbix for real-time infrastructure monitoring.

This Zabbix dashboard provides a comprehensive view of the network’s real-time health, server availability, traffic patterns, and key performance metrics of essential infrastructure components. It is designed for monitoring production, office, and virtual server zones, including network devices, physical servers, and virtual machines. The current view is the first page of a two-page dashboard, which focuses on general network monitoring:

The second page is dedicated solely to monitoring infrastructure nodes:

Key features monitored

Traffic Monitoring: The dashboard tracks real-time traffic from critical network uplinks, including AIS and TRUE, offering visibility into bandwidth usage (e.g., 64.50 Kbps and 13.05 Kbps). It also monitors internal traffic and key devices like the FortiGate firewall, helping ensure optimal network performance and security.

Host Health Monitoring: CPU and memory utilization for top hosts (e.g., GW-WINDOW11, GW-AD-DOMAIN) are displayed, enabling efficient resource management. Alerts are triggered for high resource usage, allowing for a proactive response to performance issues.

Disk Usage: Disk space on key hosts, such as the Zabbix virtual machine and other core servers, is monitored to avoid file system over-utilization, which can lead to potential service interruptions.

Availability Overview: The dashboard provides a summary of host availability, including how many are available, unavailable, or have unknown statuses. Monitoring methods like active agent and SNMP are also shown, giving an overall view of network health.

Visual Topology Map: A detailed network map shows the production, office, virtual, and test zones, along with devices and connections. This visualization aids in quickly identifying problem areas and understanding how systems are interlinked.

Severity and Problem Monitoring: The dashboard classifies issues by severity, from critical problems to warnings. Real-time issues (such as VM downtime or system failures) are highlighted, enabling the team to resolve issues quickly.

Performance Metrics: Graphs display performance metrics, such as bandwidth usage and CPU load, offering insights into system bottlenecks or overuse, particularly in critical devices like firewalls.

Impact

This Zabbix dashboard enables an infrastructure team to efficiently monitor network performance, manage resource usage, and ensure device availability. The clear visual interface helps quickly identify issues, reducing downtime and ensuring higher reliability of critical services.

Conclusion

The first page of the dashboard demonstrates Zabbix’s capabilities for centralized monitoring across large infrastructures. By integrating data from network devices, servers, and virtual machines, it empowers IT teams to make informed decisions and address issues before they escalate. The second page provides a detailed focus on the infrastructure nodes, ensuring that all critical systems are effectively monitored for optimal operation across the IT environment.

The post Monitoring a Complex Infrastructure Environment with Zabbix appeared first on Zabbix Blog.