LMT is a mobile GSM/UMTS/LTE operator in Latvia. Founded on January 2, 1992, it was the first mobile network operator in the country. In addition to providing mobile network and ISP services, LMT uses innovative technologies and solutions to develop and maintain a variety of IT solutions for public and private organizations. Currently, LMT is the largest telecommunications service provider in the country, with over 1,660 base stations and over 1.5 million users as of 2024.
The challenge
LMT utilizes a variety of monitoring solutions for a variety of purposes – from tools performing and monitoring ping responses to vendor-specific solutions and all-in-one tools such as Zabbix. LMT has 2 data centers, and since the vast majority of services delivered by LMT can be considered critical, most of the relevant infrastructure is duplicated across them.
Multiple Zabbix instances are used in the environment, including Zabbix 5.0 with MySQL database backend, Zabbix 7.0 with PostgreSQL, and TimescaleDB. Over 3,000 hosts with approximately 500,000 items are monitored by Zabbix.
The solution
Here is one example of how Zabbix is used to monitor switch cabinets in LMT data centers. Switch cabinets contain devices to measure the electric current, which support Modbus protocol and which can in turn be used to collect data.
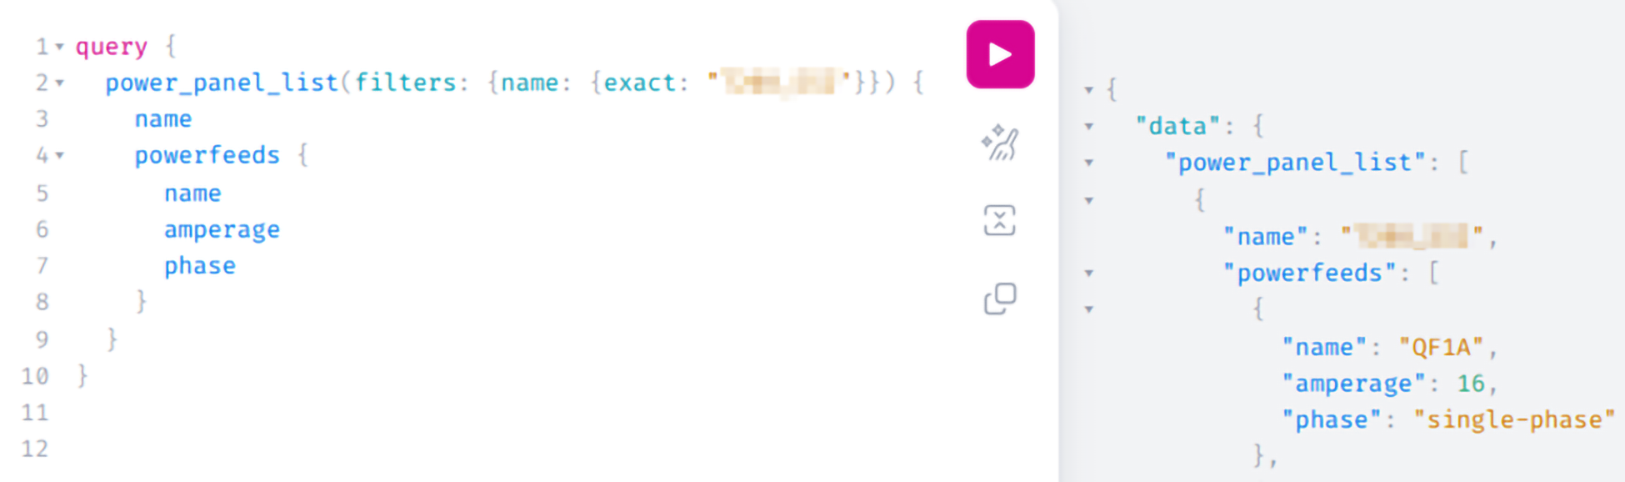
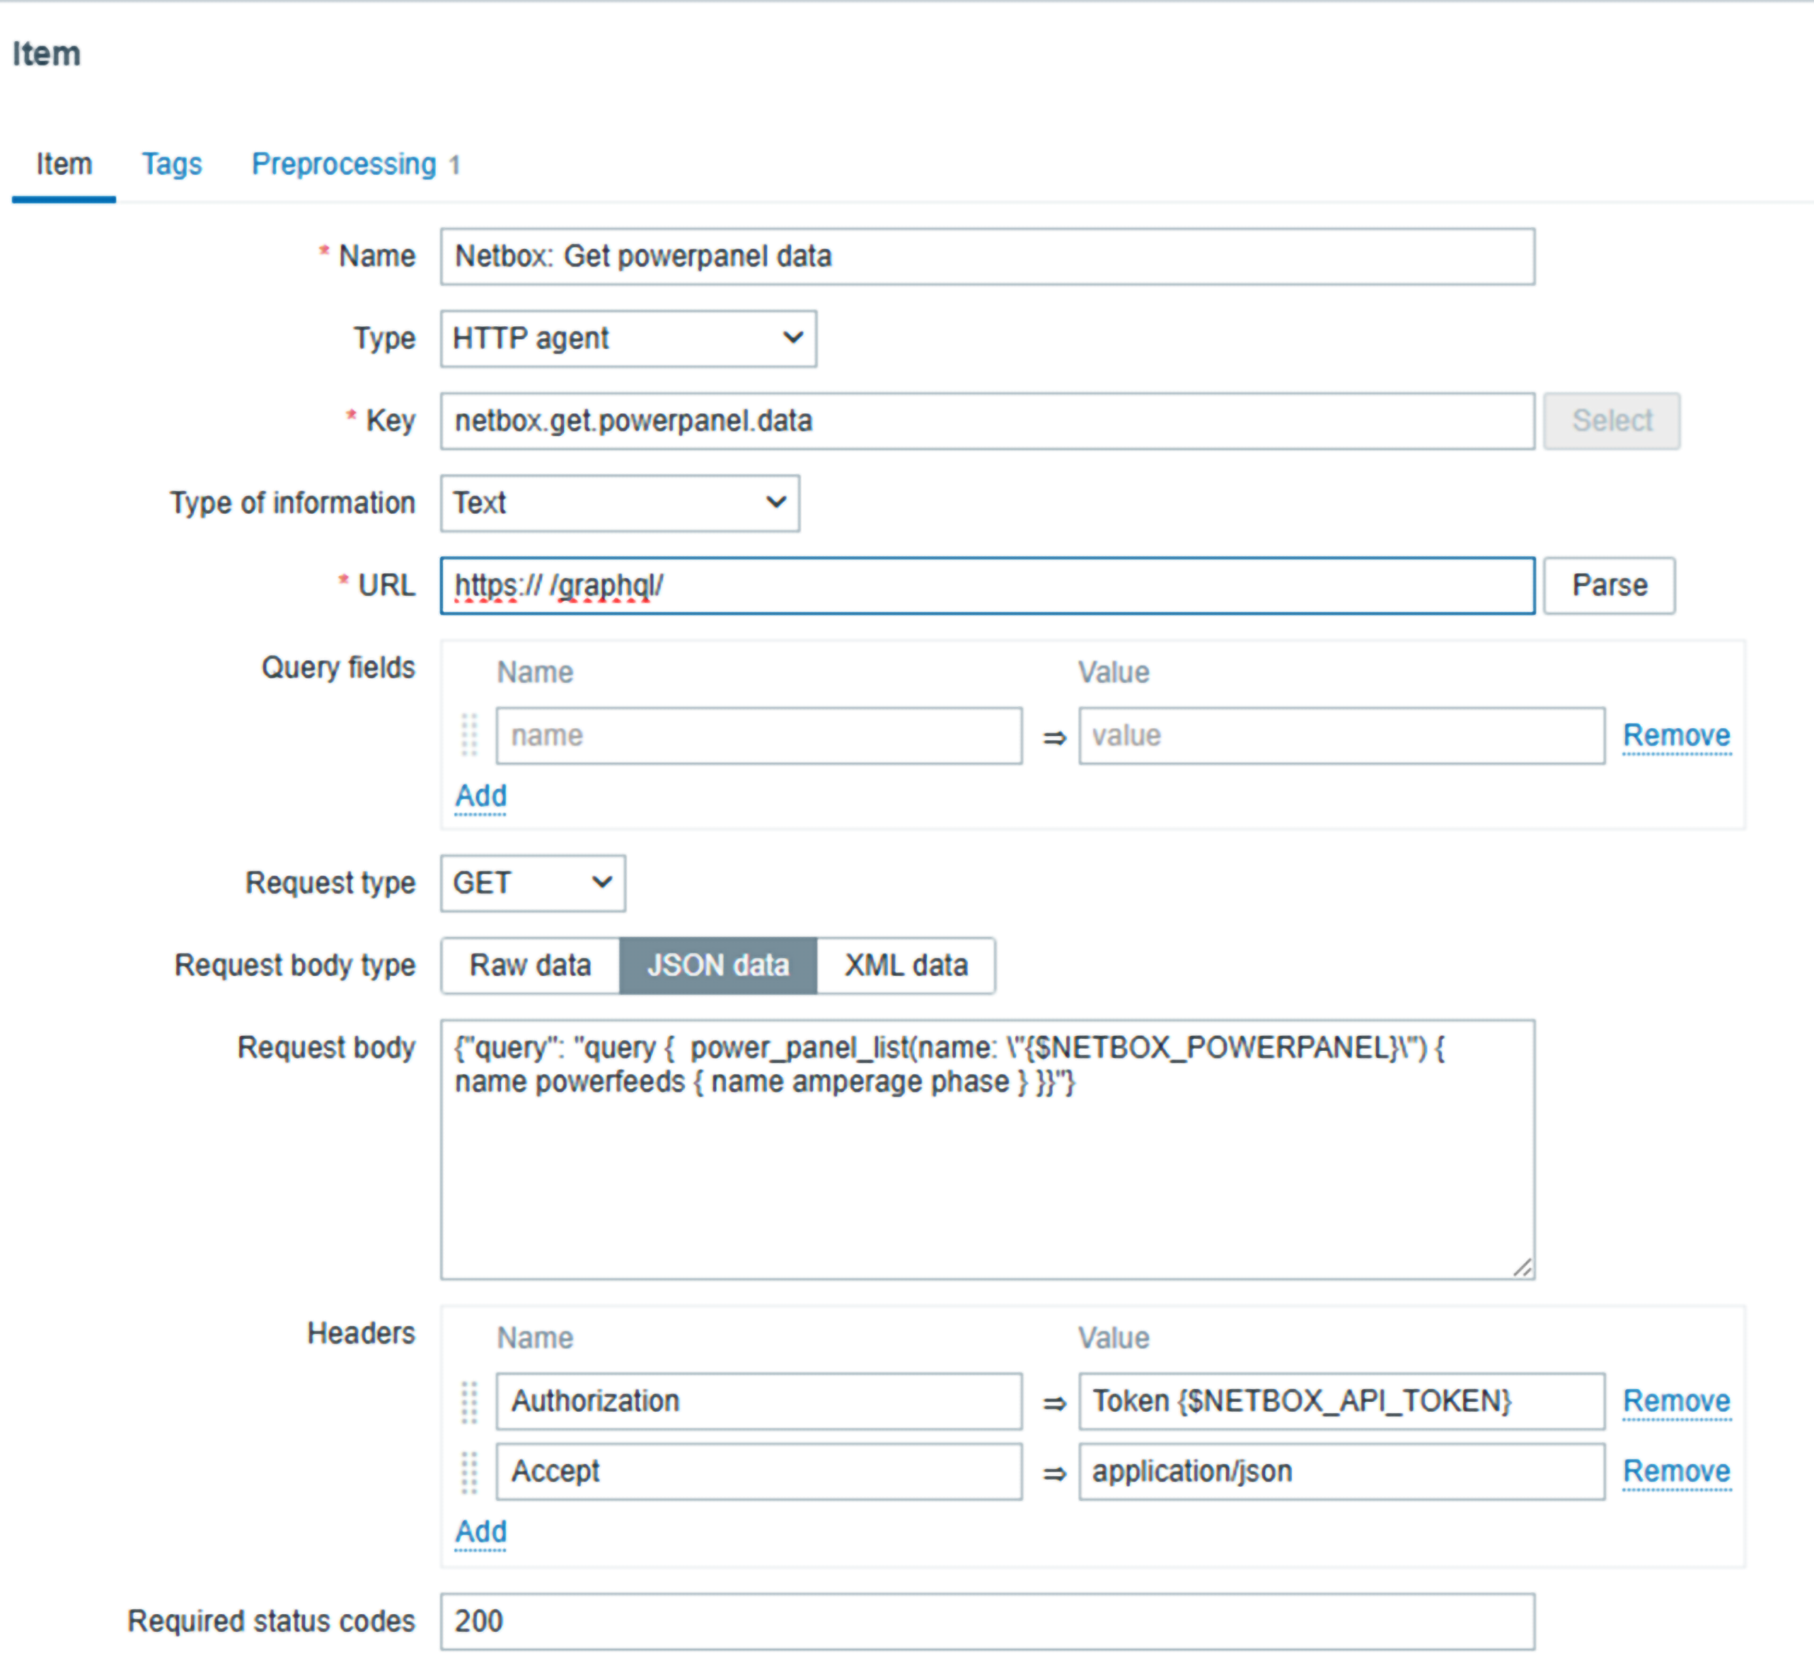
Modbus monitoring was achieved by using Zabbix agent2 with the official Modbus plugin. This was combined with NetBox and GraphQL. NetBox was used as the source of truth, providing information about power feed and various electrical characteristics, such as voltage, amperage, utilization, phase, and more. The data was collected from NetBox via HTTP agent checks and GraphQL, and a JSON result was created by utilizing Zabbix preprocessing features.
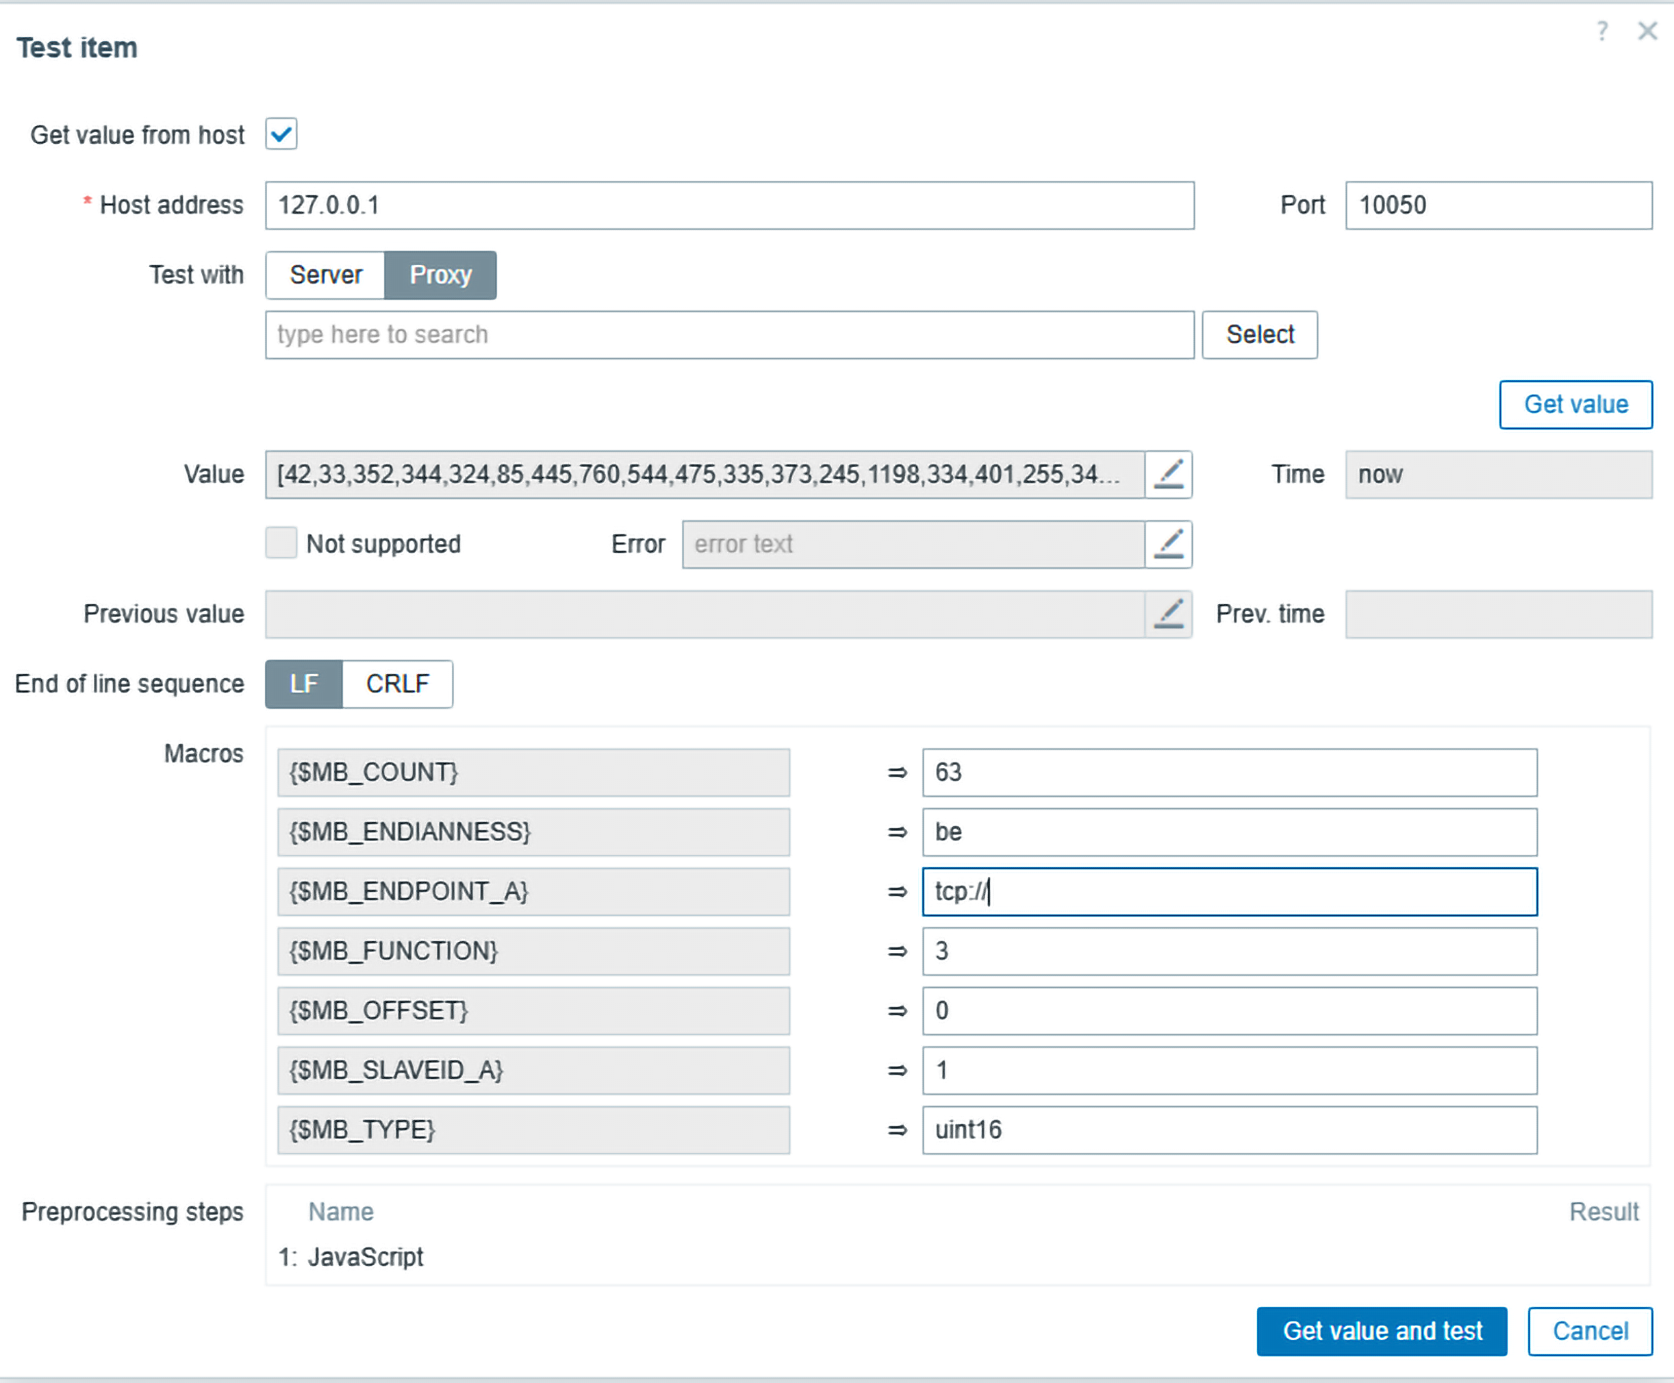
The information collected from NetBox is combined with Modbus data collection utilizing Zabbix agent2. The data collected by Zabbix agent2 is preprocessed after the collection. The collected data is normalized and used by Zabbix low-level discovery features to automatically create Zabbix items and triggers for the available resources. Finally, the resulting data is visualized on Zabbix dashboards.
The results
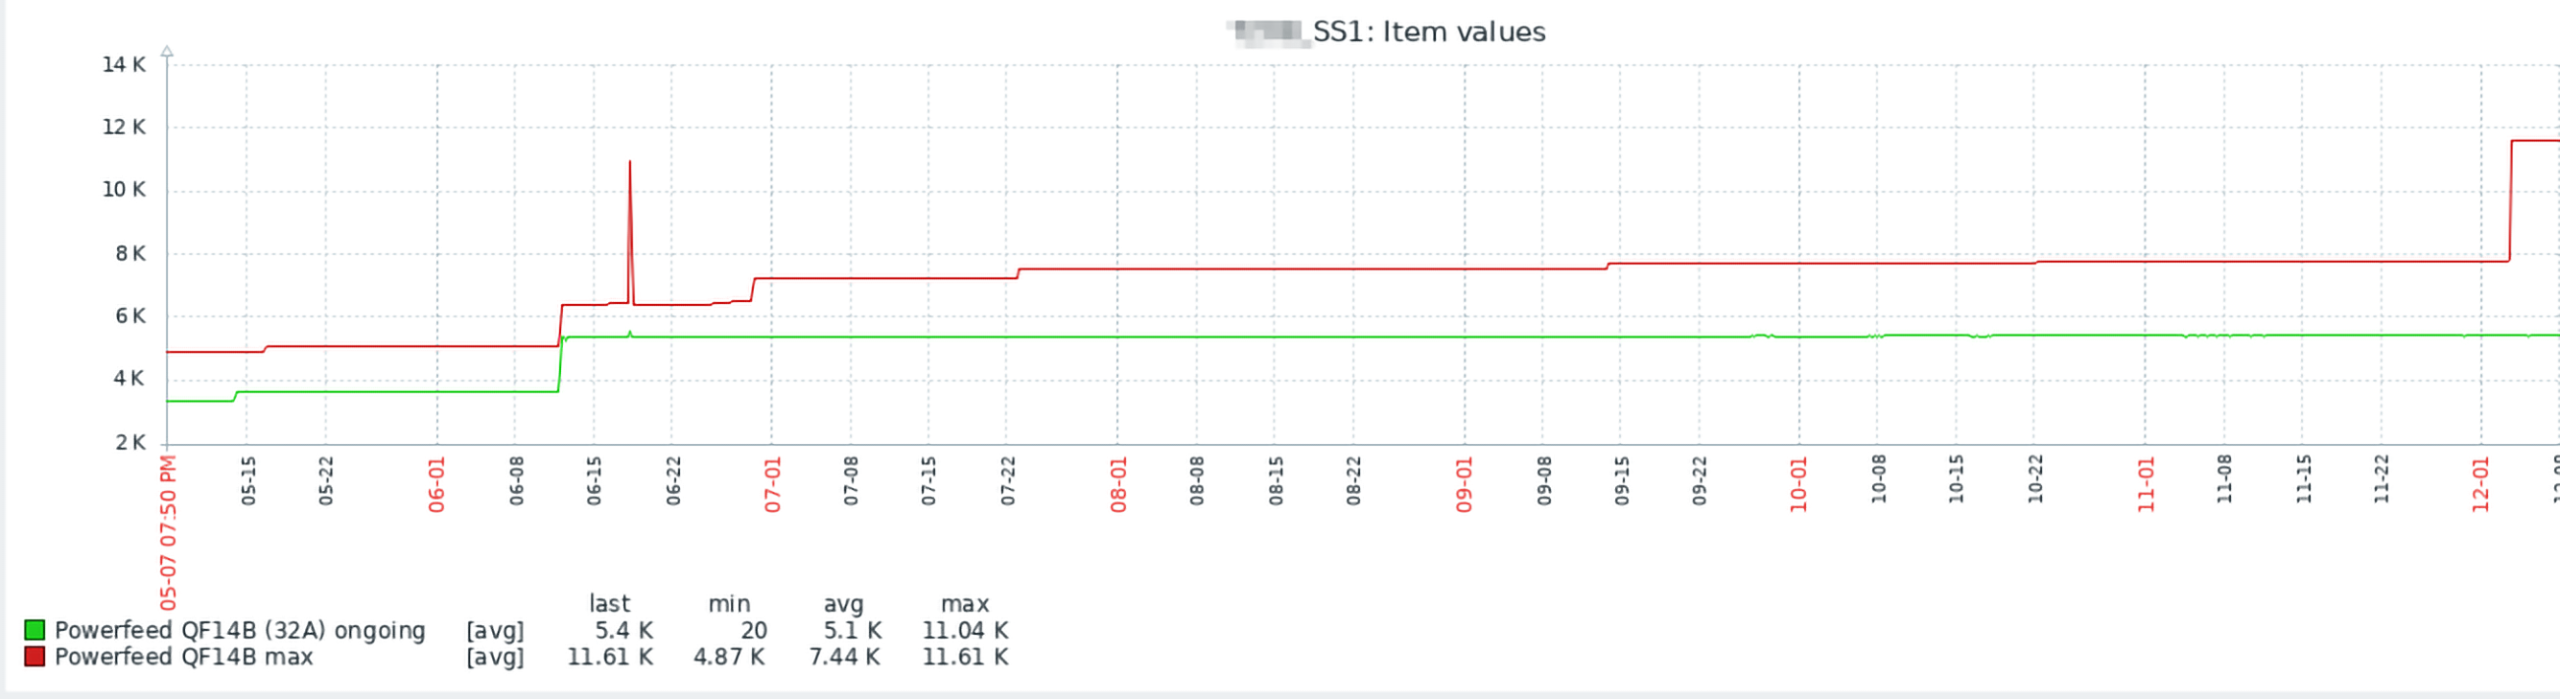
Monitoring with Zabbix has made reacting to changes in the monitored power feed (detecting spikes, observing gradual power feed changes, etc.) a much simpler proposition for LMT, which in turn improves service for its millions of users.
In conclusion
Zabbix has proven itself to be an ideal solution for telecommunications clients, making it easier than ever to keep track of network health and performance, driving a more positive customer experience and greater revenue growth in the process.
To learn more about what Zabbix can do for customers in telecommunications, get in touch with us.
One of the great advantages of Zabbix is its extensible and modular architecture. This allows the platform to be enhanced with third-party modules, significantly expanding its functionalities without compromising the stability of the core system. The ECharts-Zabbix module is an excellent example of this flexibility in action.
Table of Contents
What is the ECharts-Zabbix module?
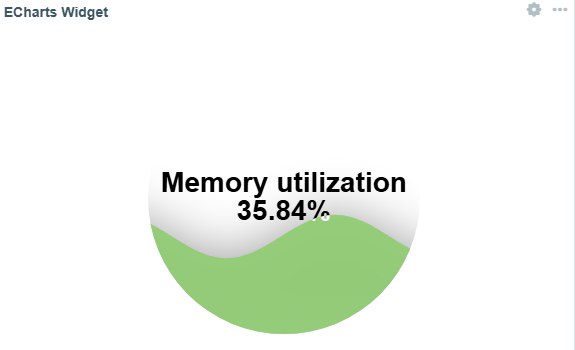
ECharts-Zabbix is a module that adds customizable widgets to Zabbix, using the ECharts library to create interactive and dynamic visualizations of your monitoring data. This module complements Zabbix’s standard visual capabilities, enabling richer and more informative graphical representation of complex monitoring environments.
What are the key features available with ECharts in Zabbix?
By integrating ECharts and Zabbix, you gain access to:
Multiple chart types (line, bar, pie, gauge, scatter, heatmap, and more)
Complete customization of colors, styles, legends, and tooltips
Fluid animations for a better user experience
Compatibility with Zabbix light and dark themes
Direct integration with data without the need for external tools
Responsive visualizations that adapt to different screen sizes
Helper functions for data formatting and dynamic color generation
Installation and configuration
Installing modules in Zabbix is easy thanks to the platform’s flexibility:
Extract the files to the modules folder of your Zabbix server
In the Zabbix frontend, go to Administration > General > Modules
Find the ECharts-Zabbix module in the list and click “Enable”
The widget will be available for use in Zabbix dashboards and screens
Practical use cases
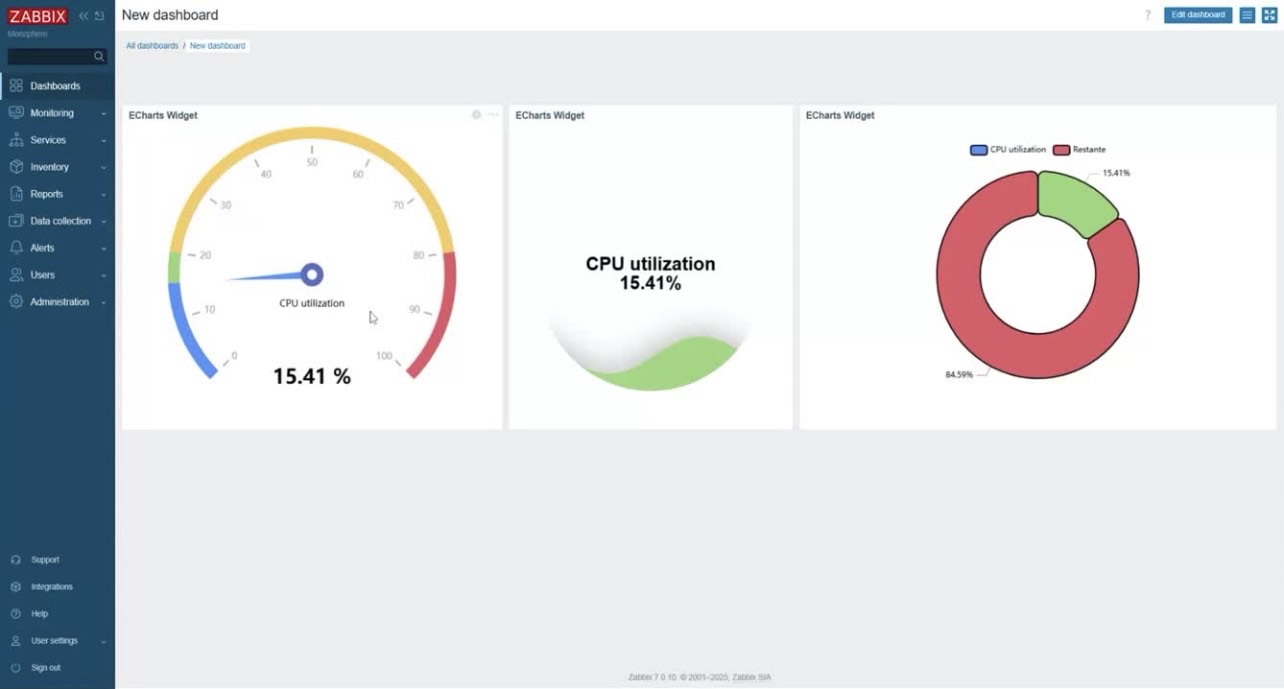
Server performance monitoring with Gauge charts
Gauge charts are ideal for visualizing metrics such as CPU, memory, and disk usage. The flexibility of Zabbix combined with ECharts allows you to create impressive visual panels that clearly show the current state of these metrics:
Zabbix has a growing ecosystem of modules and integrations, developed by both the community and specialized companies like Monzphere, which contributes the ECharts-Zabbix module. This development dynamic demonstrates how Zabbix has evolved to become a truly extensible platform.
To learn more about the ECharts-Zabbix module and other solutions for Zabbix, you can visit our official GitHub repository or Monzphere’s website.
Conclusion
Zabbix’s modular architecture is one of its greatest differentiators, allowing the platform to grow and adapt to the specific needs of each monitoring environment. The ECharts-Zabbix module is an excellent example of how this flexibility can be leveraged to transform the data visualization experience in Zabbix.
For modern monitoring environments where clear and effective data visualization is essential, the combination of Zabbix with specialized modules represents a complete and adaptable solution. Try expanding your Zabbix with the ECharts module and discover how it can transform your monitoring dashboards!
Inviting the members of our global community to share their Zabbix dashboards with us prompted a flood of fascinating responses, and we’re highlighting a few of the most interesting submissions here on our blog. This week’s entry comes to us from Nyein Chan Zaw, who is based in Bangkok, Thailand and works as an Infrastructure Specialist for Green Will Solution. Read on to see how he uses his Zabbix dashboard to monitor a highly intricate infrastructure in real time.
I appreciate the chance to share my dashboard, and I would also like to share a use case that demonstrates the practical implementation of Zabbix for real-time infrastructure monitoring.
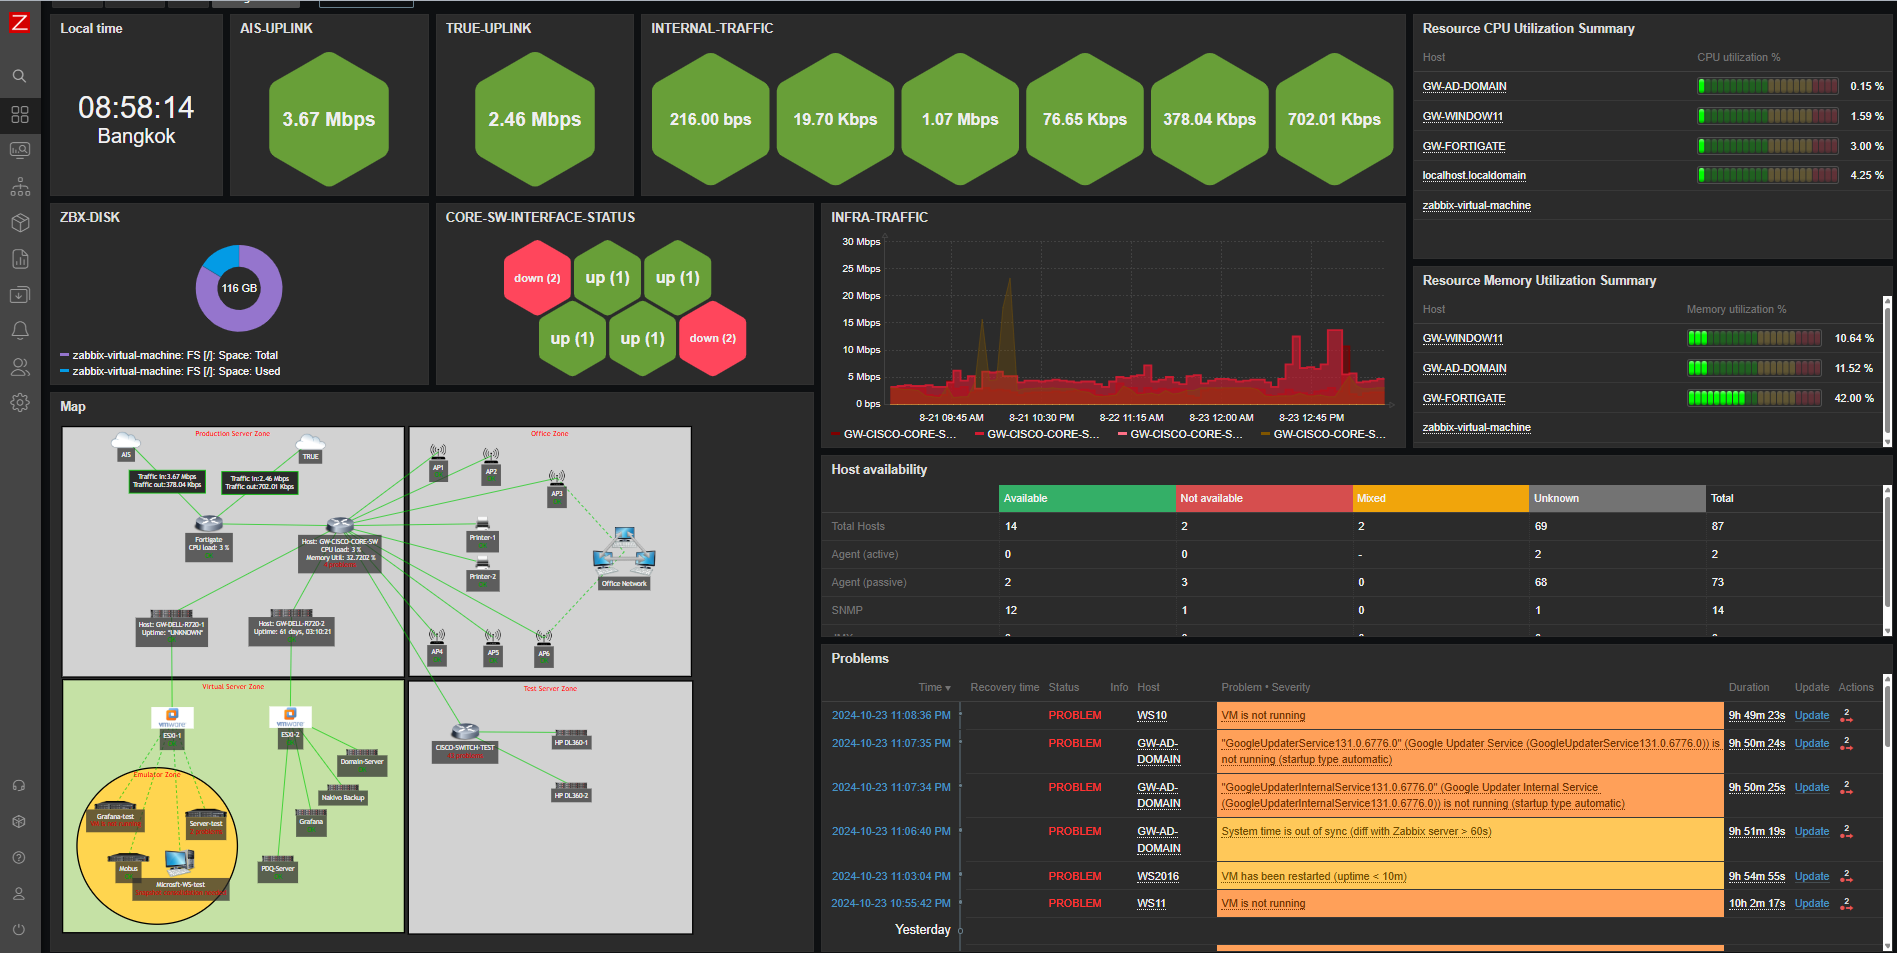
This Zabbix dashboard provides a comprehensive view of the network’s real-time health, server availability, traffic patterns, and key performance metrics of essential infrastructure components. It is designed for monitoring production, office, and virtual server zones, including network devices, physical servers, and virtual machines. The current view is the first page of a two-page dashboard, which focuses on general network monitoring:
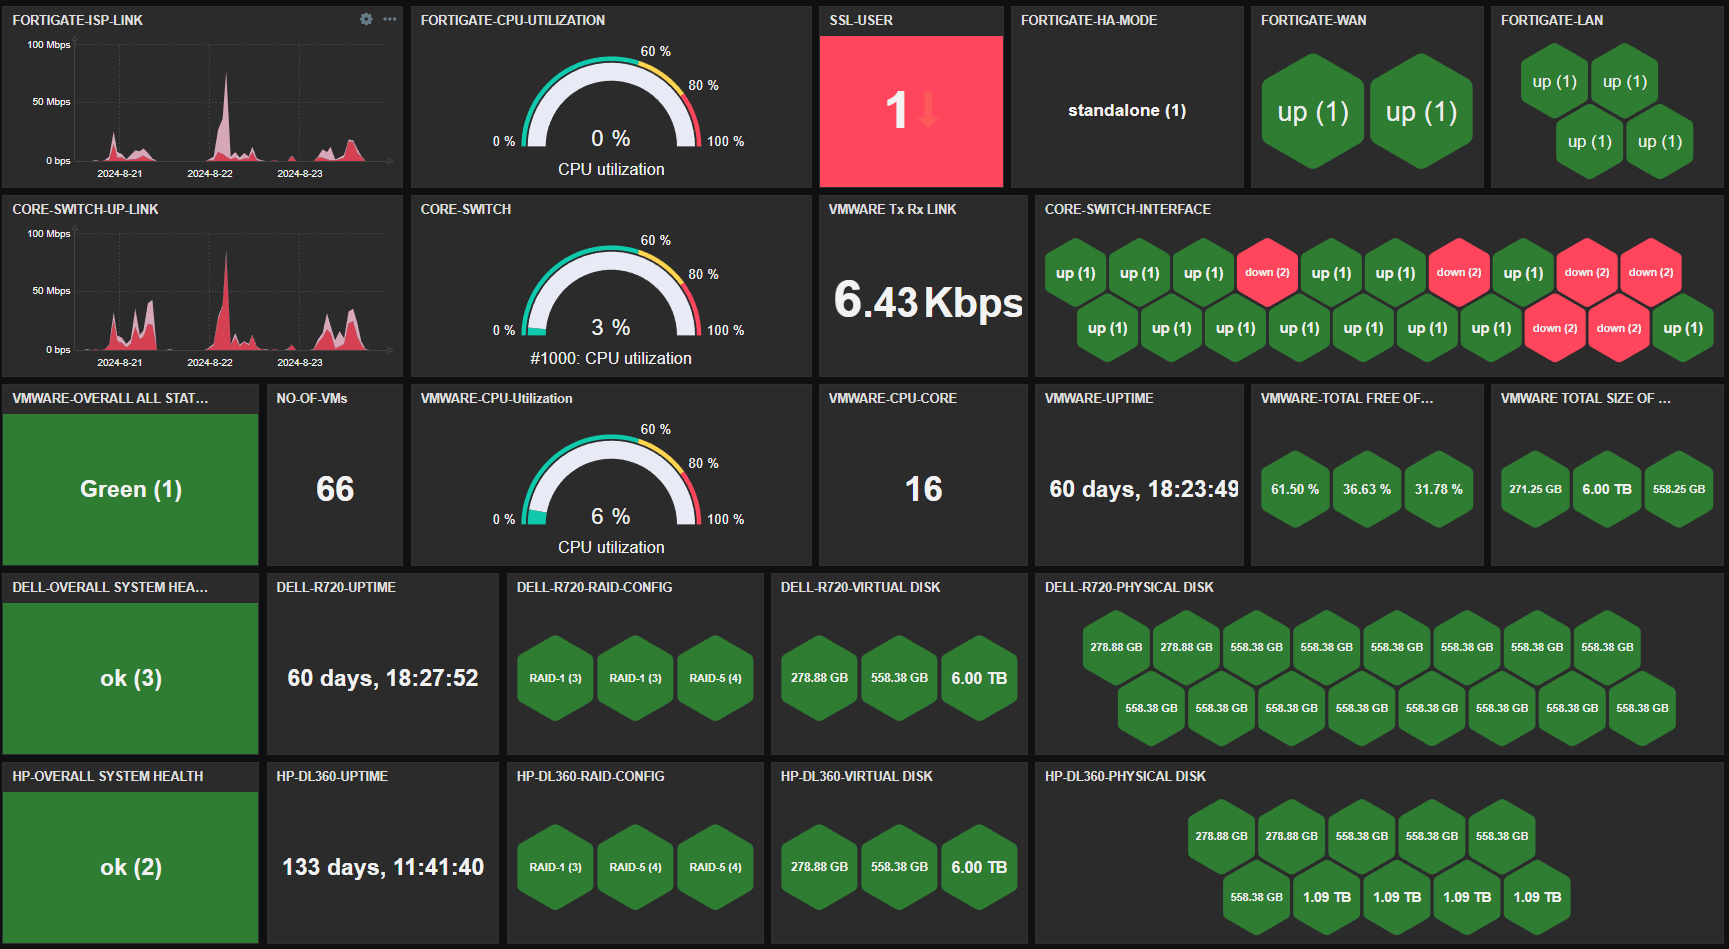
The second page is dedicated solely to monitoring infrastructure nodes:
Key features monitored
Traffic Monitoring: The dashboard tracks real-time traffic from critical network uplinks, including AIS and TRUE, offering visibility into bandwidth usage (e.g., 64.50 Kbps and 13.05 Kbps). It also monitors internal traffic and key devices like the FortiGate firewall, helping ensure optimal network performance and security.
Host Health Monitoring: CPU and memory utilization for top hosts (e.g., GW-WINDOW11, GW-AD-DOMAIN) are displayed, enabling efficient resource management. Alerts are triggered for high resource usage, allowing for a proactive response to performance issues.
Disk Usage: Disk space on key hosts, such as the Zabbix virtual machine and other core servers, is monitored to avoid file system over-utilization, which can lead to potential service interruptions.
Availability Overview: The dashboard provides a summary of host availability, including how many are available, unavailable, or have unknown statuses. Monitoring methods like active agent and SNMP are also shown, giving an overall view of network health.
Visual Topology Map: A detailed network map shows the production, office, virtual, and test zones, along with devices and connections. This visualization aids in quickly identifying problem areas and understanding how systems are interlinked.
Severity and Problem Monitoring: The dashboard classifies issues by severity, from critical problems to warnings. Real-time issues (such as VM downtime or system failures) are highlighted, enabling the team to resolve issues quickly.
Performance Metrics: Graphs display performance metrics, such as bandwidth usage and CPU load, offering insights into system bottlenecks or overuse, particularly in critical devices like firewalls.
Impact
This Zabbix dashboard enables an infrastructure team to efficiently monitor network performance, manage resource usage, and ensure device availability. The clear visual interface helps quickly identify issues, reducing downtime and ensuring higher reliability of critical services.
Conclusion
The first page of the dashboard demonstrates Zabbix’s capabilities for centralized monitoring across large infrastructures. By integrating data from network devices, servers, and virtual machines, it empowers IT teams to make informed decisions and address issues before they escalate. The second page provides a detailed focus on the infrastructure nodes, ensuring that all critical systems are effectively monitored for optimal operation across the IT environment.
At AWS, we often hear from customers that they want expanded security coverage for the multiple services that they use on AWS. However, alert fatigue is a common challenge that customers face as we introduce new security protections. The challenge becomes how to operationalize, identify, and prioritize alerts that represent real risk.
In this post, we highlight recent enhancements to Amazon Detective finding groups visualizations. We show you how Detective automatically consolidates multiple security findings into a single security event—called finding groups—and how finding group visualizations help reduce noise and prioritize findings that present true risk. We incorporate additional services like Amazon GuardDuty, Amazon Inspector, and AWS Security Hub to highlight how effective findings groups is at consolidating findings for different AWS security services.
Overview of solution
This post uses several different services. The purpose is twofold: to show how you can enable these services for broader protection, and to show how Detective can help you investigate findings from multiple services without spending a lot of time sifting through logs or querying multiple data sources to find the root cause of a security event. These are the services and their use cases:
GuardDuty – a threat detection service that continuously monitors your AWS accounts and workloads for malicious activity. If potential malicious activity, such as anomalous behavior, credential exfiltration, or command and control (C2) infrastructure communication is detected, GuardDuty generates detailed security findings that you can use for visibility and remediation. Recently, GuardDuty released the following threat detections for specific services that we’ll show you how to enable for this walkthrough: GuardDuty RDS Protection, EKS Runtime Monitoring, and Lambda Protection.
Amazon Inspector – an automated vulnerability management service that continually scans your AWS workloads for software vulnerabilities and unintended network exposure. Like GuardDuty, Amazon Inspector sends a finding for alerting and remediation when it detects a software vulnerability or a compute instance that’s publicly available.
Security Hub – a cloud security posture management service that performs automated, continuous security best practice checks against your AWS resources to help you identify misconfigurations, and aggregates your security findings from integrated AWS security services.
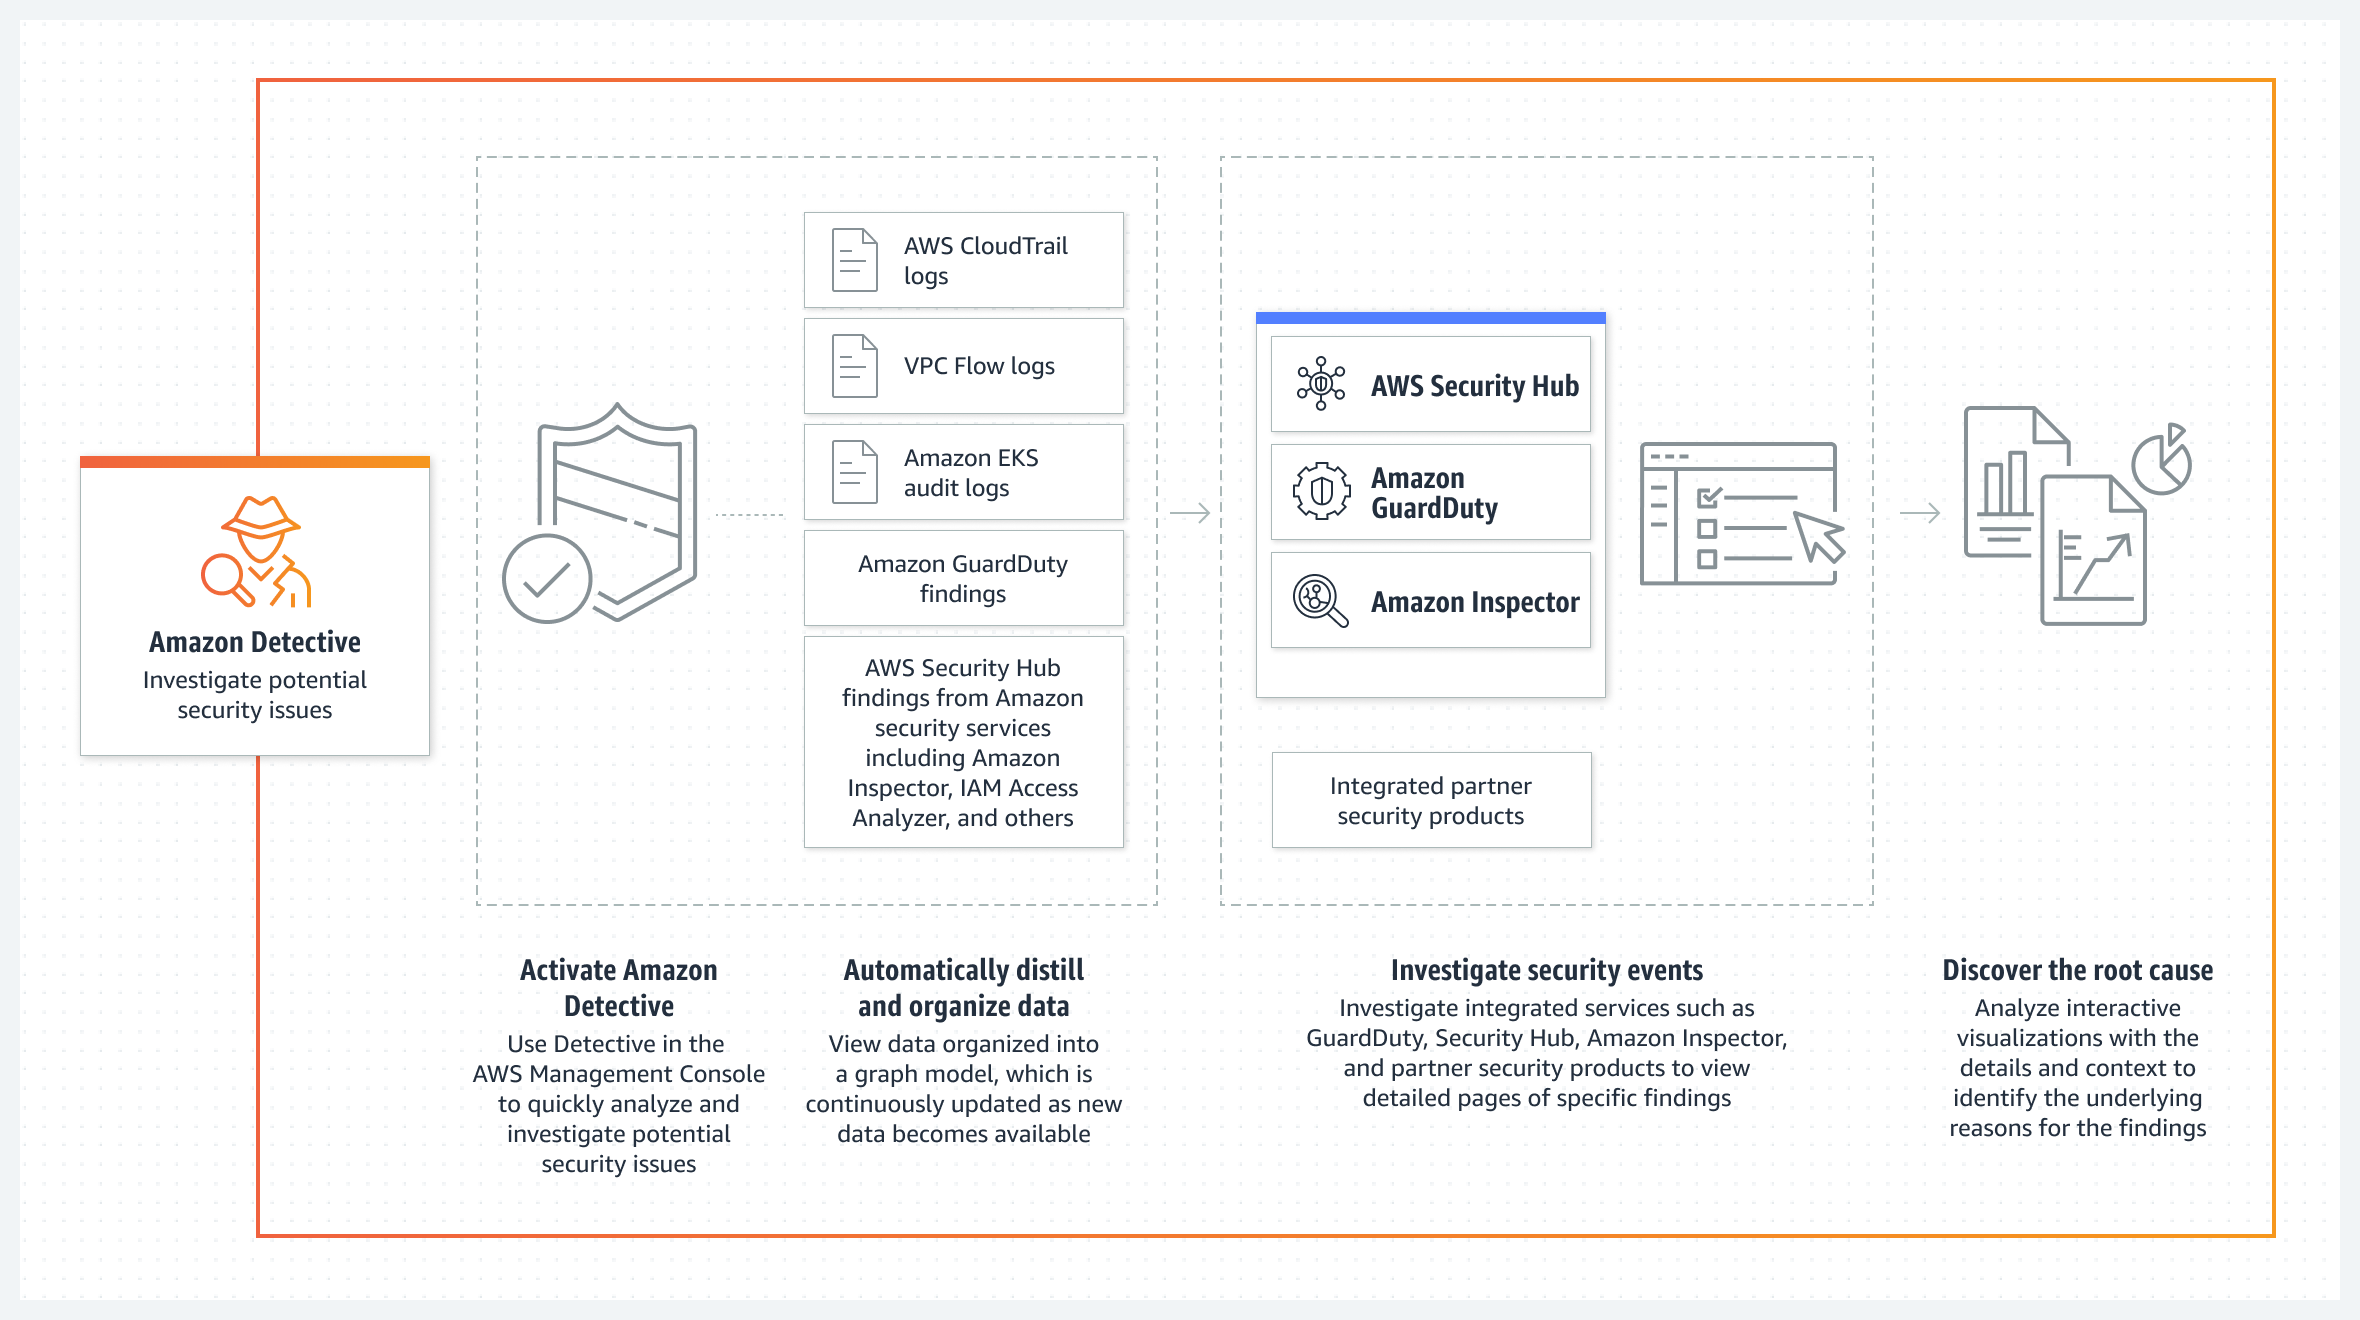
Detective – a security service that helps you investigate potential security issues. It does this by collecting log data from AWS CloudTrail, Amazon Virtual Private Cloud (Amazon VPC) flow logs, and other services. Detective then uses machine learning, statistical analysis, and graph theory to build a linked set of data called a security behavior graph that you can use to conduct faster and more efficient security investigations.
The following diagram shows how each service delivers findings along with log sources to Detective.
Figure 1: Amazon Detective log source diagram
Enable the required services
If you’ve already enabled the services needed for this post—GuardDuty, Amazon Inspector, Security Hub, and Detective—skip to the next section. For instructions on how to enable these services, see the following resources:
Each of these services offers a free 30-day trial and provides estimates on charges after your trial expires. You can also use the AWS Pricing Calculator to get an estimate.
To enable the services across multiple accounts, consider using a delegated administrator account in AWS Organizations. With a delegated administrator account, you can automatically enable services for multiple accounts and manage settings for each account in your organization. You can view other accounts in the organization and add them as member accounts, making central management simpler. For instructions on how to enable the services with AWS Organizations, see the following resources:
The next step is to enable the latest detections in GuardDuty and learn how Detective can identify multiple threats that are related to a single security event.
If you’ve already enabled the different GuardDuty protection plans, skip to the next section. If you recently enabled GuardDuty, the protections plans are enabled by default, except for EKS Runtime Monitoring, which is a two-step process.
For the next steps, we use the delegated administrator account in GuardDuty to make sure that the protection plans are enabled for each AWS account. When you use GuardDuty (or Security Hub, Detective, and Inspector) with AWS Organizations, you can designate an account to be the delegated administrator. This is helpful so that you can configure these security services for multiple accounts at the same time. For instructions on how to enable a delegated administrator account for GuardDuty, see Managing GuardDuty accounts with AWS Organizations.
To enable EKS Protection
Sign in to the GuardDuty console using the delegated administrator account, choose Protection plans, and then choose EKS Protection.
In the Delegated administrator section, choose Edit and then choose Enable for each scope or protection. For this post, select EKS Audit Log Monitoring, EKS Runtime Monitoring, and Manage agent automatically, as shown in Figure 2. For more information on each feature, see the following resources:
To enable these protections for current accounts, in the Active member accounts section, choose Edit and Enable for each scope of protection.
To enable these protections for new accounts, in the New account default configuration section, choose Edit and Enable for each scope of protection.
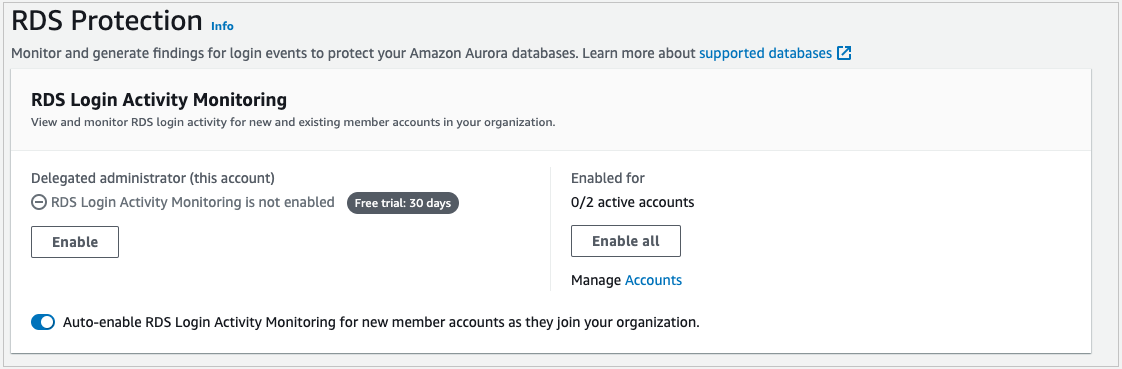
To enable RDS Protection
The next step is to enable RDS Protection. GuardDuty RDS Protection works by analysing RDS login activity for potential threats to your Amazon Aurora databases (MySQL-Compatible Edition and Aurora PostgreSQL-Compatible Editions). Using this feature, you can identify potentially suspicious login behavior and then use Detective to investigate CloudTrail logs, VPC flow logs, and other useful information around those events.
Navigate to the RDS Protection menu and under Delegated administrator (this account), select Enable and Confirm.
In the Enabled for section, select Enable all if you want RDS Protection enabled on all of your accounts. If you want to select a specific account, choose Manage Accounts and then select the accounts for which you want to enable RDS Protection. With the accounts selected, choose Edit Protection Plans, RDS Login Activity, and Enable for X selected account.
(Optional) For new accounts, turn on Auto-enable RDS Login Activity Monitoring for new member accounts as they join your organization.
Figure 2: Enable EKS Runtime Monitoring
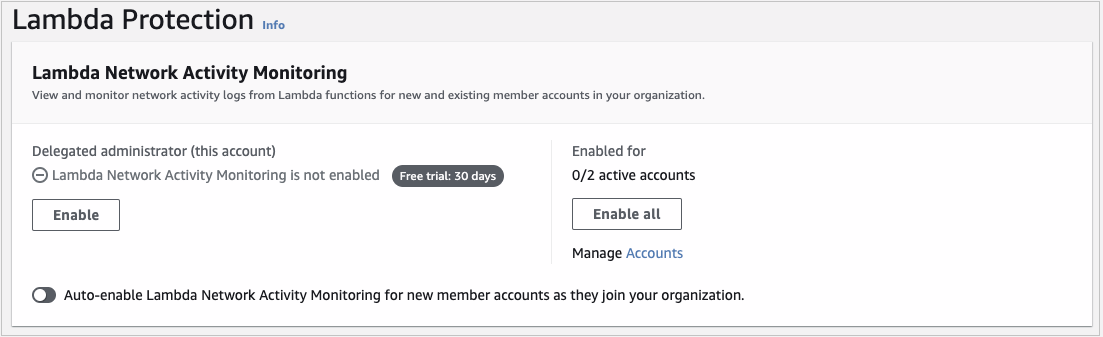
To enable Lambda Protection
The final step is to enable Lambda Protection. Lambda Protection helps detect potential security threats during the invocation of AWS Lambda functions. By monitoring network activity logs, GuardDuty can generate findings when Lambda functions are involved with malicious activity, such as communicating with command and control servers.
Navigate to the Lambda Protection menu and under Delegated administrator (this account), select Enable and Confirm.
In the Enabled for section, select Enable all if you want Lambda Protection enabled on all of your accounts. If you want to select a specific account, choose Manage Accounts and select the accounts for which you want to enable RDS Protection. With the accounts selected, choose Edit Protection Plans, Lambda Network Activity Monitoring, and Enable for X selected account.
(Optional) For new accounts, turn on Auto-enable Lambda Network Activity Monitoring for new member accounts as they join your organization.
Now that you’ve enabled these new protections, GuardDuty will start monitoring EKS audit logs, EKS runtime activity, RDS login activity, and Lambda network activity. If GuardDuty detects suspicious or malicious activity for these log sources or services, it will generate a finding for the activity, which you can review in the GuardDuty console. In addition, you can automatically forward these findings to Security Hub for consolidation, and to Detective for security investigation.
Detective data sources
If you have Security Hub and other AWS security services such as GuardDuty or Amazon Inspector enabled, findings from these services are forwarded to Security Hub. With the exception of sensitive data findings from Amazon Macie, you’re automatically opted in to other AWS service integrations when you enable Security Hub. For the full list of services that forward findings to Security Hub, see Available AWS service integrations.
With each service enabled and forwarding findings to Security Hub, the next step is to enable the data source in Detective called AWS security findings, which are the findings forwarded to Security Hub. Again, we’re going to use the delegated administrator account for these steps to make sure that AWS security findings are being ingested for your accounts.
To enable AWS security findings
Sign in to the Detective console using the delegated administrator account and navigate to Settings and then General.
Choose Optional source packages, Edit, select AWS security findings, and then choose Save.
Figure 5: Enable AWS security findings
When you enable Detective, it immediately starts creating a security behavior graph for AWS security findings to build a linked dataset between findings and entities, such as RDS login activity from Aurora databases, EKS runtime activity, and suspicious network activity for Lambda functions. For GuardDuty to detect potential threats that affect your database instances, it first needs to undertake a learning period of up to two weeks to establish a baseline of normal behavior. For more information, see How RDS Protection uses RDS login activity monitoring. For the other protections, after suspicious activity is detected, you can start to see findings in both GuardDuty and Security Hub consoles. This is where you can start using Detective to better understand which findings are connected and where to prioritize your investigations.
Detective behavior graph
As Detective ingests data from GuardDuty, Amazon Inspector, and Security Hub, as well as CloudTrail logs, VPC flow logs, and Amazon Elastic Kubernetes Service (Amazon EKS) audit logs, it builds a behavior graph database. Graph databases are purpose-built to store and navigate relationships. Relationships are first-class citizens in graph databases, which means that they’re not computed out-of-band or by interfering with relationships through querying foreign keys. Because Detective stores information on relationships in your graph database, you can effectively answer questions such as “are these security findings related?”. In Detective, you can use the search menu and profile panels to view these connections, but a quicker way to see this information is by using finding groups visualizations.
Finding groups visualizations
Finding groups extract additional information out of the behavior graph to highlight findings that are highly connected. Detective does this by running several machine learning algorithms across your behavior graph to identify related findings and then statically weighs the relationships between those findings and entities. The result is a finding group that shows GuardDuty and Amazon Inspector findings that are connected, along with entities like Amazon Elastic Compute Cloud (Amazon EC2) instances, AWS accounts, and AWS Identity and Access Management (IAM) roles and sessions that were impacted by these findings. With finding groups, you can more quickly understand the relationships between multiple findings and their causes because you don’t need to connect the dots on your own. Detective automatically does this and presents a visualization so that you can see the relationships between various entities and findings.
Enhanced visualizations
Recently, we released several enhancements to finding groups visualizations to aid your understanding of security connections and root causes. These enhancements include:
Dynamic legend – the legend now shows icons for entities that you have in the finding group instead of showing all available entities. This helps reduce noise to only those entities that are relevant to your investigation.
Aggregated evidence and finding icons – these icons provide a count of similar evidence and findings. Instead of seeing the same finding or evidence repeated multiple times, you’ll see one icon with a counter to help reduce noise.
More descriptive side panel information – when you choose a finding or entity, the side panel shows additional information, such as the service that identified the finding and the finding title, in addition to the finding type, to help you understand the action that invoked the finding.
Label titles – you can now turn on or off titles for entities and findings in the visualization so that you don’t have to choose each to get a summary of what the different icons mean.
To use the finding groups visualization
Open the Detective console, choose Summary, and then choose View all finding groups.
Choose the title of an available finding group and scroll down to Visualization.
Under the Select layout menu, choose one of the layouts available, or choose and drag each icon to rearrange the layout according to how you’d like to see connections.
For a complete list of involved entities and involved findings, scroll down below the visualization.
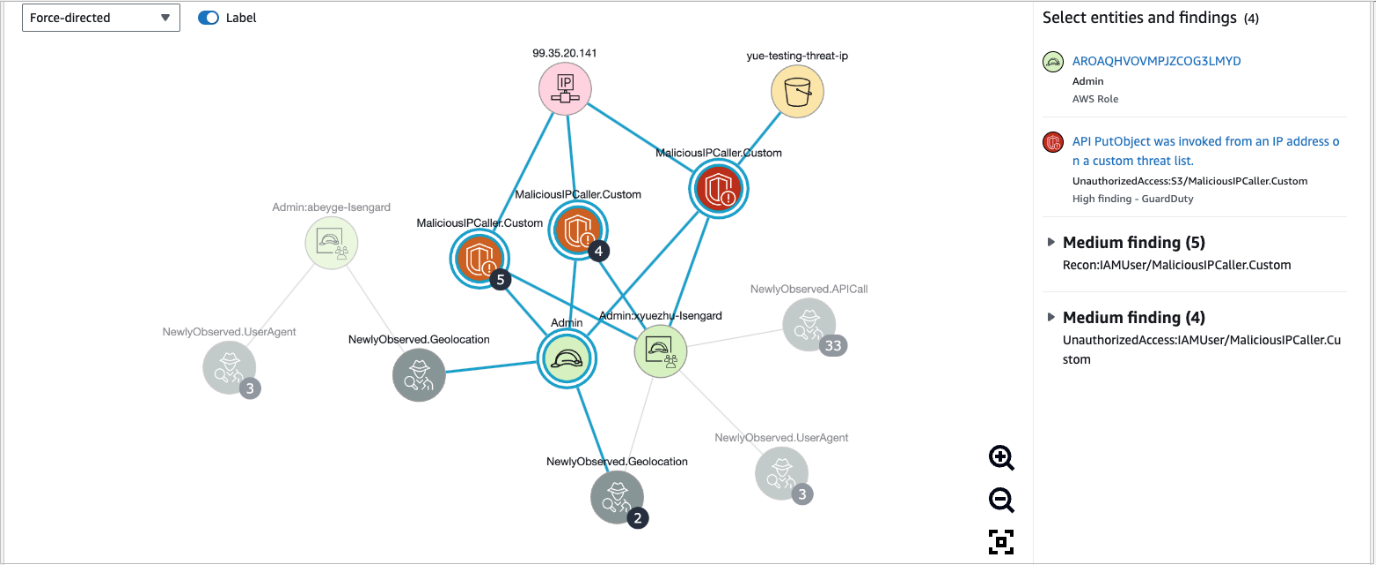
Figure 6 shows an example of how you can use finding groups visualization to help identify the root cause of findings quickly. In this example, an IAM role was connected to newly observed geolocations, multiple GuardDuty findings detected malicious API calls, and there were newly observed user agents from the IAM session. The visualization can give you high confidence that the IAM role is compromised. It also provides other entities that you can search against, such as the IP address, S3 bucket, or new user agents.
Figure 6: Finding groups visualization
Now that you have the new GuardDuty protections enabled along with the data source of AWS security findings, you can use finding groups to more quickly visualize which IAM sessions have had multiple findings associated with unauthorized access, or which EC2 instances are publicly exposed with a software vulnerability and active GuardDuty finding—these patterns can help you determine if there is an actual risk.
Conclusion
In this blog post, you learned how to enable new GuardDuty protections and use Detective, finding groups, and visualizations to better identify, operationalize, and prioritize AWS security findings that represent real risk. We also highlighted the new enhancements to visualizations that can help reduce noise and provide summaries of detailed information to help reduce the time it takes to triage findings. If you’d like to see an investigation scenario using Detective, watch the video Amazon Detective Security Scenario Investigation.
Group, aggregate, and visualize your collected metrics with the Graph widget to obtain additional insights.
Sometimes simple graphs may not be sufficient – we may need to visualize data trends, display all metrics matching a pattern, or define custom draw styles for specific metrics.
The Graph widget allows you to visualize your metrics in an advanced fashion:
Customize your graph draw styles
Select between displaying History or Trend values
Calculate and display aggregated metric values on the fly
Define custom aggregation intervals
Define flexible problem display logic
Visually group metrics by defining item and host data sets
Check out the video to learn how to visualize your metrics by using the Graph widget.
How to visualize data with the Graph widget:
Navigate to Monitoring → Dashboards – All Dashboards
Click Create Dashboard to create a new Dashboard
Left-click on an empty space and select Add Widget
Select Widget type – Graph
Type in the data set host and item patterns
Use wildcard symbol ‘*‘ to match multiple hosts/items
Click Add new data set to add a second data set
Fill in the host pattern and item pattern to match a different set of metrics
For both data sets, select an Aggregation function, Aggregation interval, and Aggregate – Data set
Observe how metrics get aggregated in the graph on the fly
Tips and best practices:
Wildcards can be used in host and item pattern matching
The Overrides section can be used to further customize a particular set of items
Items within a single data set will use the same base color
With Zabbix Summit Online 2021 just around the corner, it’s time to have a quick overview of the 6.0 LTS features that we can expect to see featured during the event. The Zabbix 6.0 LTS release aims to deliver some of the long-awaited enterprise-level features while also improving the general user experience, performance, scalability, and many other aspects of Zabbix.
Native Zabbix server cluster
Many of you will be extremely happy to hear that Zabbix 6.0 LTS release comes with out-of-the-box High availability for Zabbix Server. This means that HA will now be supported natively, without having to use external tools to create Zabbix Server clusters.
The native Zabbix Server cluster will have a speech dedicated to it during the Zabbix Summit Online 2021. You can expect to learn both the inner workings of the HA solution, the configuration and of course the main benefits of using the native HA solution. You can also take a look at the in-development version of the native Zabbix server cluster in the latest Zabbix 6.0 LTS alpha release.
Business service monitoring and root cause analysis
Service monitoring is also about to go through a significant redesign, focusing on delivering additional value by providing robust Business service monitoring (BSM)features. This is achieved by delivering significant additions to the existing service status calculation logic. With features such as service weights, service status analysis based on child problem severities, ability to calculate service status based on the number or percentage of children in a problem state, users will be able to implement BSM on a whole new level. BSM will also support root cause analysis – users will be informed about the root cause problem of the service status change.
All of this and more, together with examples and use cases will be covered during a separate speech dedicated to BSM. In addition, some of the BSM features are available in the latest Zabbix 6.0 LTS alpha release – with more to come as we continue working on the Zabbix 6.0 release.
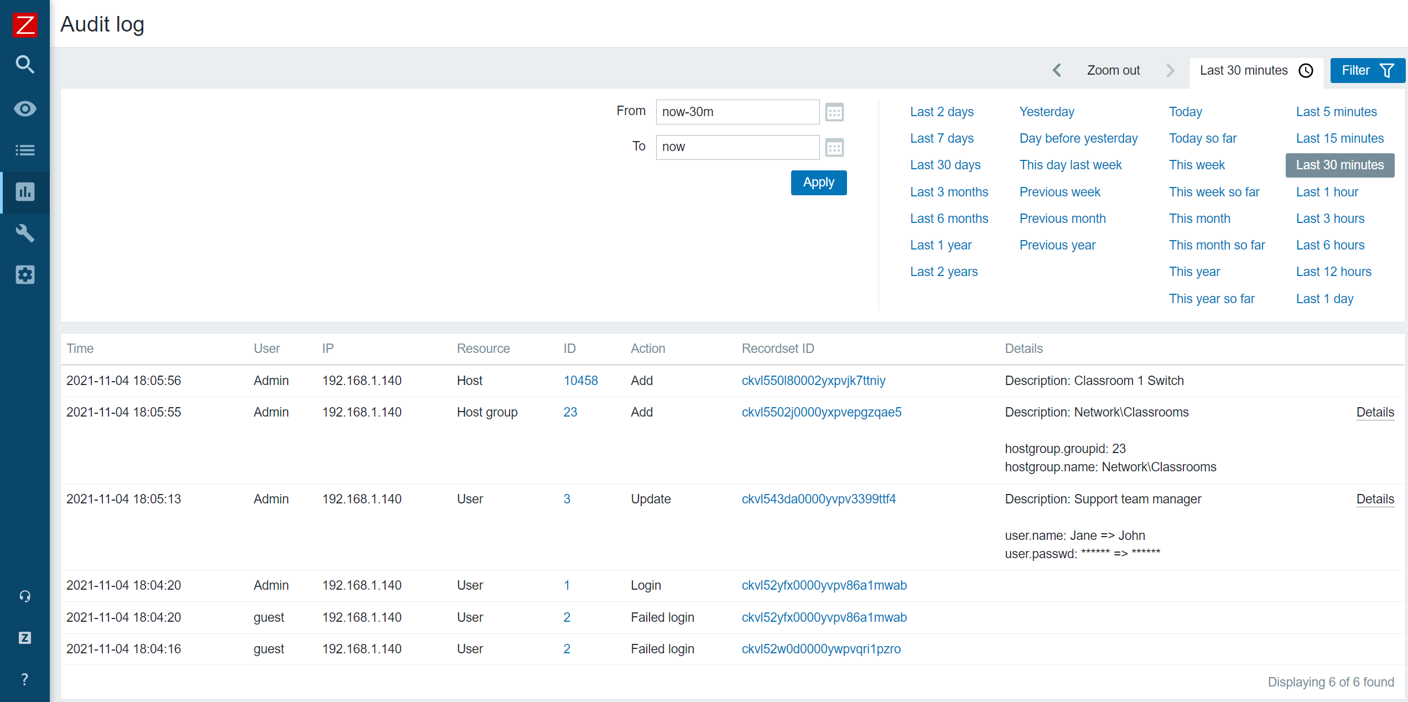
Audit log redesign
The Audit log is another existing feature that has received a complete redesign. With the ability to log each and every change performed both by the Zabbix Server and Zabbix Frontend, the Audit log will become an invaluable source of audit information. Of course, the redesign also takes performance into consideration – the redesign was developed with the least possible performance impact in mind.
The audit log is constantly in development and the current Zabbix 6.0 LTS alpha release offers you an early look at the feature. We will also be covering the technical details of the new audit log implementation during the Summit and will explain how we are able to achieve minimal performance impact with major improvements to Zabbix audit logging.
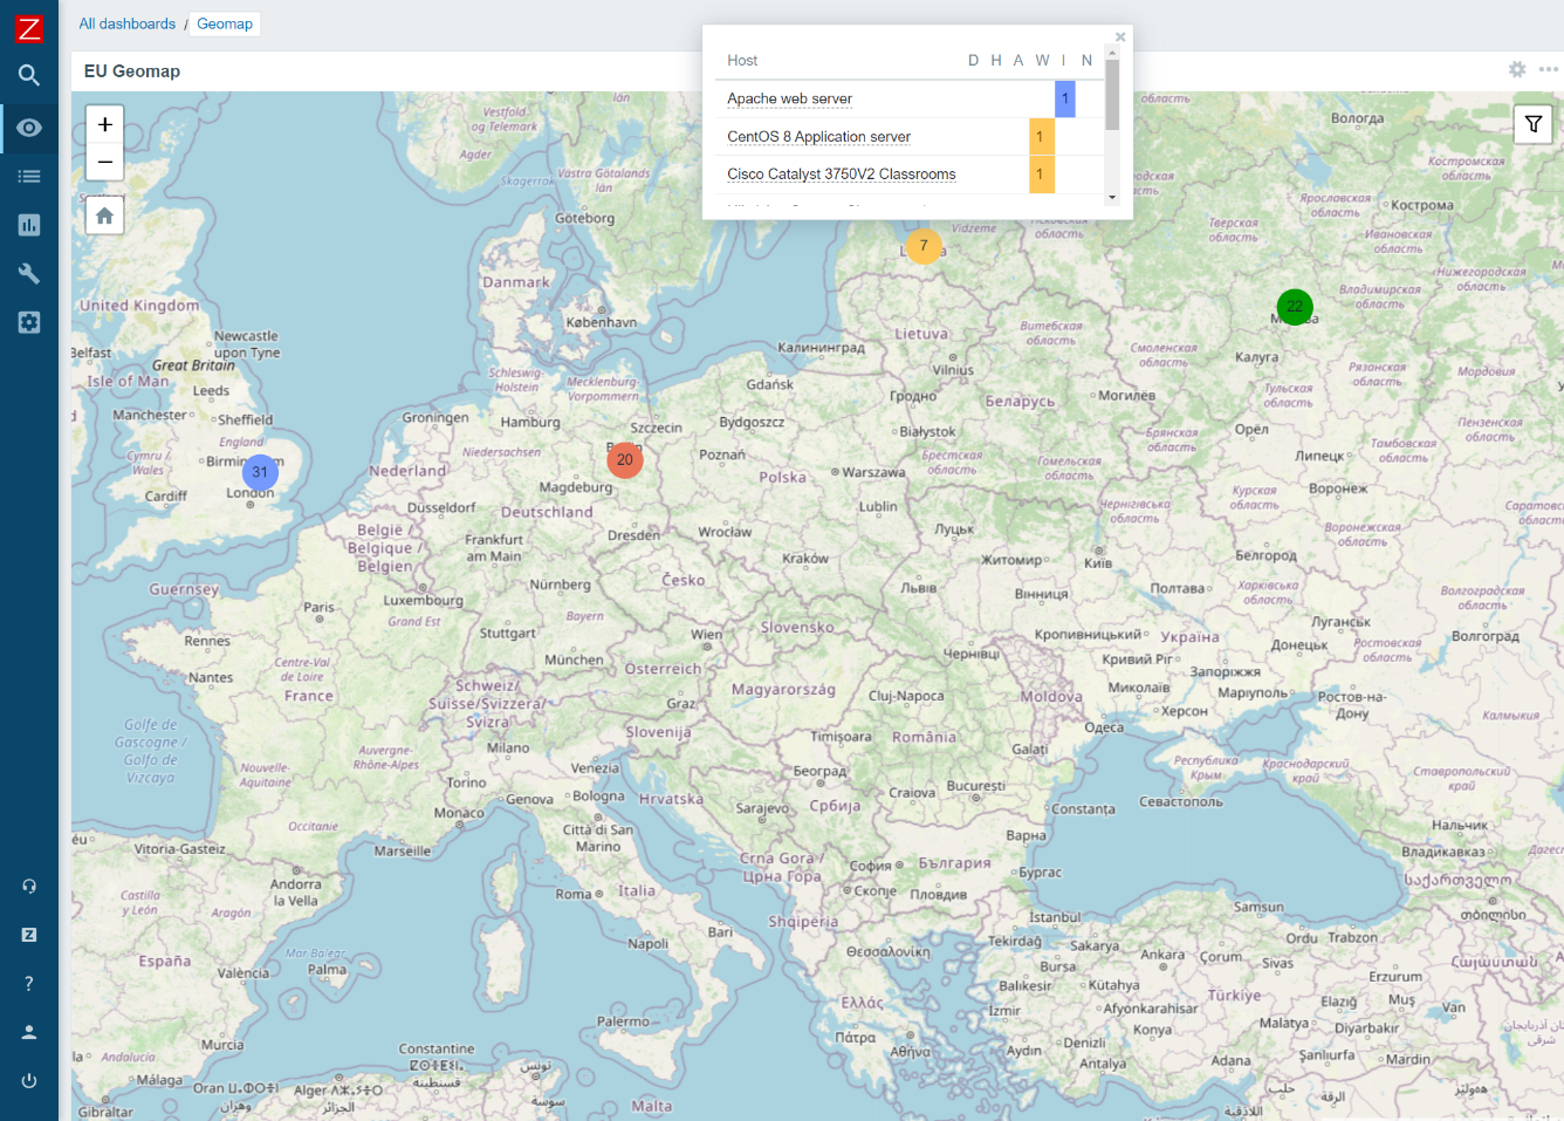
Geographical maps
With Geographical maps, our users can finally display their entities on a geographical map based on the coordinates of the entity. Geographical maps can be used with multiple geographical map providers and display your hosts with their most severe problems. In addition, geographical maps will react dynamically to Zoom levels and support filtering.
The latest Zabbix 6.0 Alpha release includes the Geomap widget – feel free to deploy it in your QA environment, check out the different map providers, filter options and other great features that come with this widget.
Machine learning
When it comes to problem detection, Zabbix 6.0 LTS will deliver multiple trend new functions. A specific set of functions provides machine learning functionality for Anomaly detection and Baseline monitoring.
The topic will be covered in-depth during the Zabbix Summit Online 2021. We will look at the configuration of the new functions and also take a deeper dive at the logic and algorithms used under the hood.
During the Zabbix Summit Online 2021, we will also cover many other new features, such as:
New Dashboard widgets
New items for Zabbix Agent
New templates and integrations
Zabbix login password complexity settings
Performance improvements for Zabbix Server, Zabbix Proxy, and Zabbix Frontend
UI and UX improvements
Zabbix login password complexity requirements
New history and trend functions
And more!
Not only will you get the chance to have an early look at many new features not yet available in the latest alpha release, but also you will have a great chance to learn the inner workings of the new features, the upgrade and migration process to Zabbix 6.0 LTS and much more!
We are extremely excited to share all of the new features with our community, so don’t miss out – take a look at the full Zabbix Summit online 2021 agenda and register for the event by visiting our Zabbix Summit page, and we will see you at the Zabbix Summit Online 2021 on November 25!
The collective thoughts of the interwebz
Manage Consent
To provide the best experiences, we use technologies like cookies to store and/or access device information. Consenting to these technologies will allow us to process data such as browsing behavior or unique IDs on this site. Not consenting or withdrawing consent, may adversely affect certain features and functions.
Functional
Always active
The technical storage or access is strictly necessary for the legitimate purpose of enabling the use of a specific service explicitly requested by the subscriber or user, or for the sole purpose of carrying out the transmission of a communication over an electronic communications network.
Preferences
The technical storage or access is necessary for the legitimate purpose of storing preferences that are not requested by the subscriber or user.
Statistics
The technical storage or access that is used exclusively for statistical purposes.The technical storage or access that is used exclusively for anonymous statistical purposes. Without a subpoena, voluntary compliance on the part of your Internet Service Provider, or additional records from a third party, information stored or retrieved for this purpose alone cannot usually be used to identify you.
Marketing
The technical storage or access is required to create user profiles to send advertising, or to track the user on a website or across several websites for similar marketing purposes.