All posts by Sergey Konoplev

Best practices for Amazon Redshift Lambda User-Defined Functions

Post Syndicated from Sergey Konoplev original https://aws.amazon.com/blogs/big-data/best-practices-for-amazon-redshift-lambda-user-defined-functions/

While working with Lambda User-Defined Functions (UDFs) in Amazon Redshift, knowing best practices may help you streamline the respective feature development and reduce common performance bottlenecks and unnecessary costs.

You wonder what programming language could improve your UDF performance, how else can you use batch processing benefits, what concurrency management considerations might be applicable in your case? In this post, we answer these and other questions by providing a consolidated view of practices to improve your Lambda UDF efficiency. We explain how to choose a programming language, use existing libraries effectively, minimize payload sizes, manage return data, and batch processing. We discuss scalability and concurrency considerations at both the account and per-function levels. Finally, we examine the benefits and nuances of using external services with your Lambda UDFs.

Background

Amazon Redshift is a fast, petabyte-scale cloud data warehouse service that makes it simple and cost-effective to analyze data using standard SQL and existing business intelligence tools.

AWS Lambda is a compute service that lets you run code without provisioning or managing servers, supporting a wide variety of programming languages, automatically scaling your applications.

Amazon Redshift Lambda UDFs allows you to run Lambda functions directly from SQL, which unlock such capabilities like external API integration, unified code deployment, better compute scalability, cost separation.

Prerequisites

  • AWS account setup requirements
  • Basic Lambda function creation knowledge
  • Amazon Redshift cluster access and UDF permissions.

Performance optimization best practices

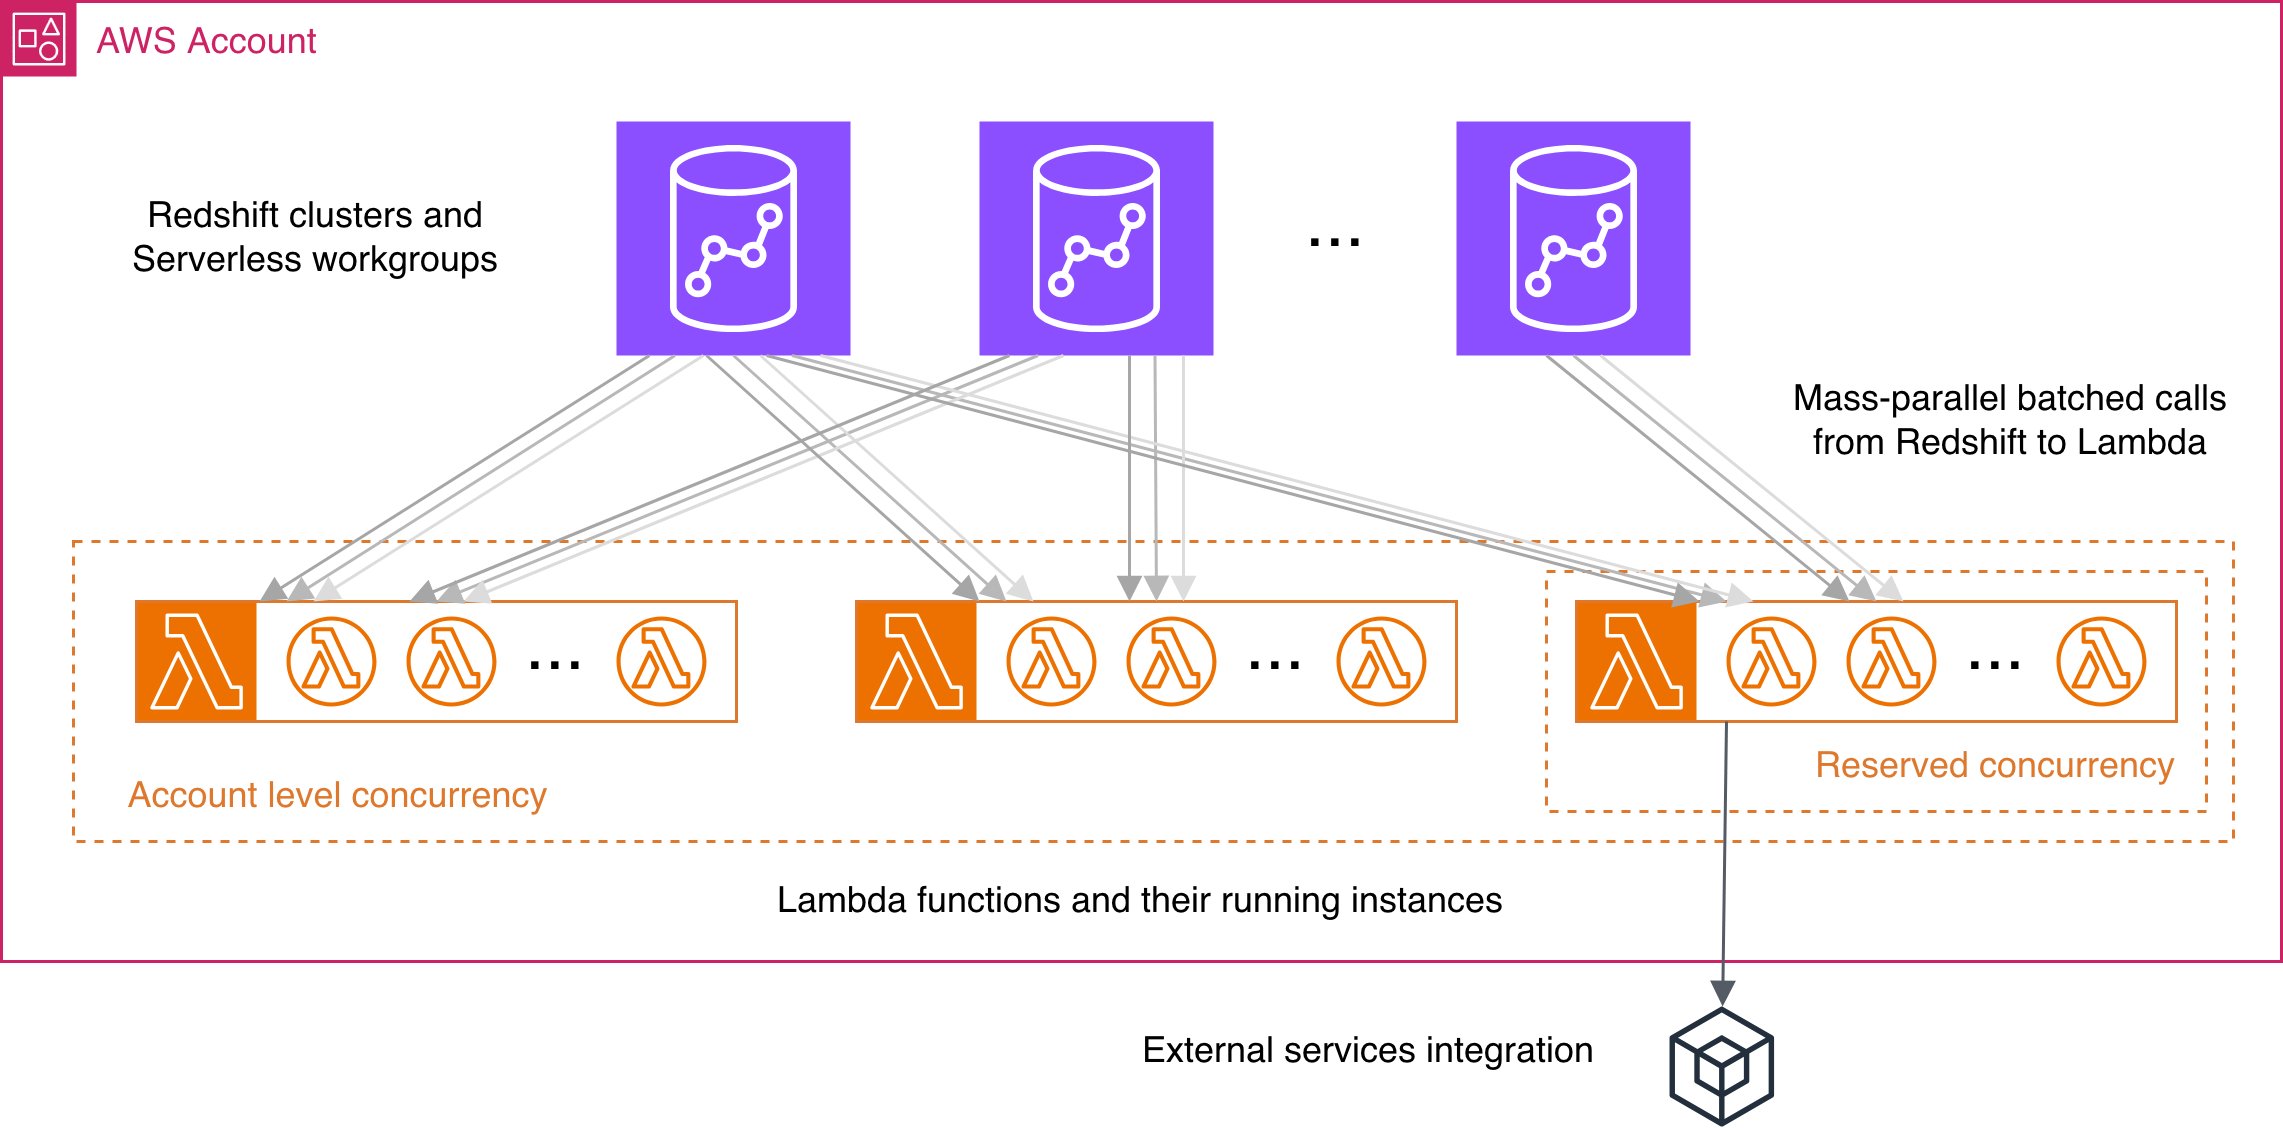
The following diagram contains necessary visual references from the best practices description.
Use efficient programming languages

You can choose from Lambda’s wide variety of runtime environments and programming languages. This choice affects both the performance and billing. More performant code may help reduce the cost of Lambda compute and improve SQL query speed. Faster SQL queries could also help reduce costs for Redshift Serverless and potentially improve throughput for Provisioned clusters depending on your specific workload and configuration.

When choosing a programming language for your Lambda UDFs, benchmarks may help predict performance and cost implications. The famous Debian’s Benchmarks Game Team provides publicly available insights for different languages in their micro-benchmark results. For example, their Python vs Golang comparison shows up to 2 orders of magnitude run time improvement and twice memory consumption reduction if you could use Golang instead of Python. That may positively reflect on both Lambda UDF performance and Lambda costs for the respective scenarios.

Use existing libraries efficiently

For every language provided by Lambda, you can explore the whole collection of libraries to help you implement tasks better from the speed and resource consumption point of view. When transitioning to Lambda UDFs, review this aspect carefully.

For instance, if your Python function manipulates datasets, it might be worth considering using the Pandas library.

Avoid unnecessary data in payloads

Lambda limits request and response payload size to 6 MB for synchronous invocations. Considering that, Redshift is doing best effort to batch the values so that the number of batches (and hence the Lambda calls) would be minimal which reduces the communication overhead. So, the unnecessary data, like one added for future use but not immediately actionable, may reduce efficiency of this effort.

Keep in mind returning data size

Because, from the point of view of Redshift, each Lambda function is a closed system, it is impossible to know what size the returned data can possibly be before executing the function. In this case, if the returned payload is higher than the Lambda payload limit, Redshift will have to retry with the outbound batch of a lower size. That will continue until a fit return payload will be achieved. While it is the best effort, the process might bring a notable overhead.

In order to avoid this overhead, you might use the knowledge of your Lambda code, to directly set the maximum batch size on the Redshift side using the MAX_BATCH_SIZE clause in your Lambda UDF definition.

Use benefits of processing values in batches

Batched calls provide new optimization opportunities to your UDFs. Having a batch of many values passed to the function at once, allows to use various optimization techniques.

For example, memoization (result caching), when your function can avoid running the same logic on the same values, hence reducing the total execution time. The standard Python library functools provides convenient caching and Least Recently Used (LRU) caching decorators implementing exactly that.

Scalability and concurrency management

Increase the account-level concurrency

Redshift uses advanced congestion control to provide the best performance in a highly competitive environment. Lambda provides a default concurrency limit of 1,000 concurrent execution per AWS Region for an account. However, if the latter is not enough, you can always request the account level quota increase for Lambda concurrency, which might be as high as tens of thousands.

Note that even with a restricted concurrency space, our Lambda UDF implementation will do the best effort to minimize the congestion and equalize the chances for function calls across Redshift clusters in your account.

Restrict function concurrency with reserved concurrency

If you want to isolate some of the Lambda functions in a restricted concurrency scope, for example you have a data science team experimenting with embedding generation using Lambda UDFs and you don’t want them to affect your account’s Lambda concurrency much, you might want to set a reserved concurrency for their specific functions to operate with.

Learn more about reserved concurrency in Lambda.

Integration and external services

Call existing external services for optimal execution

In some cases, it might be worth considering using existing external services or components of your application instead of re-implementing the same tasks yourself in the Lambda code. For example, you can use Open Policy Agent (OPA) for policy checking, a managed service Protegrity to protect your sensitive data, there are also a variety of services providing hardware acceleration for computationally heavy tasks.

Note that some services have their own batching control with a limited batch size. For that we implemented a per-function batch row count setting MAX_BATCH_ROWS as a clause in the Lambda UDF definition.

To learn more on the external service interaction using Lambda UDFs refer the following links:

Conclusion

Lambda UDFs provide a way to extend your data warehouse capabilities. By implementing the best practices from this post, you may help optimize your Lambda UDFs for performance and cost efficiency.The key takeaways from this post are:

  • performance optimization, showing how to choose efficient programming languages and tools, minimize payload sizes, and leverage batch processing to reduce execution time and costs
  • scalability management, showing how to configure appropriate concurrency settings at both account and function levels to handle varying workloads effectively
  • integration efficiency, explaining how to benefit from external services to avoid reinventing functionality while maintaining optimal performance.

For more information, visit the Redshift documentation and explore the integration examples referenced in this post.

About the author

Sergey Konoplev

Sergey Konoplev

Sergey is a Senior Database Engineer on the Amazon Redshift team who is driving a range of initiatives from operations to observability to AI-tooling, including pushing the boundaries of Lambda UDF. Outside of work, Sergey catches waves in Pacific Ocean and enjoys reading aloud (and voice acting) for his daughter.

Query and visualize Amazon Redshift operational metrics using the Amazon Redshift plugin for Grafana

Post Syndicated from Sergey Konoplev original https://aws.amazon.com/blogs/big-data/query-and-visualize-amazon-redshift-operational-metrics-using-the-amazon-redshift-plugin-for-grafana/

Grafana is a rich interactive open-source tool by Grafana Labs for visualizing data across one or many data sources. It’s used in a variety of modern monitoring stacks, allowing you to have a common technical base and apply common monitoring practices across different systems. Amazon Managed Grafana is a fully managed, scalable, and secure Grafana-as-a-service solution developed by AWS in collaboration with Grafana Labs.

Amazon Redshift is the most widely used data warehouse in the cloud. You can view your Amazon Redshift cluster’s operational metrics on the Amazon Redshift console, use AWS CloudWatch, and query Amazon Redshift system tables directly from your cluster. The first two options provide a set of predefined general metrics and visualizations. The last one allows you to use the flexibility of SQL to get deep insights into the details of the workload. However, querying system tables requires knowledge of system table structures. To address that, we came up with a consolidated Amazon Redshift Grafana dashboard that visualizes a set of curated operational metrics and works on top of the Amazon Redshift Grafana data source. You can easily add it to an Amazon Managed Grafana workspace, as well as to any other Grafana deployments where the data source is installed.

This post guides you through a step-by-step process to create an Amazon Managed Grafana workspace and configure an Amazon Redshift cluster with a Grafana data source for it. Lastly, we show you how to set up the Amazon Redshift Grafana dashboard to visualize the cluster metrics.

Solution overview

The following diagram illustrates the solution architecture.

Architecture Diagram

The solution includes the following components:

  • The Amazon Redshift cluster to get the metrics from.
  • Amazon Managed Grafana, with the Amazon Redshift data source plugin added to it. Amazon Managed Grafana communicates with the Amazon Redshift cluster via the Amazon Redshift Data Service API.
  • The Grafana web UI, with the Amazon Redshift dashboard using the Amazon Redshift cluster as the data source. The web UI communicates with Amazon Managed Grafana via an HTTP API.

We walk you through the following steps during the configuration process:

  1. Configure an Amazon Redshift cluster.
  2. Create a database user for Amazon Managed Grafana on the cluster.
  3. Configure a user in AWS Single Sign-On (AWS SSO) for Amazon Managed Grafana UI access.
  4. Configure an Amazon Managed Grafana workspace and sign in to Grafana.
  5. Set up Amazon Redshift as the data source in Grafana.
  6. Import the Amazon Redshift dashboard supplied with the data source.

Prerequisites

To follow along with this walkthrough, you should have the following prerequisites:

  • An AWS account
  • Familiarity with the basic concepts of the following services:
    • Amazon Redshift
    • Amazon Managed Grafana
    • AWS SSO

Configure an Amazon Redshift cluster

If you don’t have an Amazon Redshift cluster, create a sample cluster before proceeding with the following steps. For this post, we assume that the cluster identifier is called redshift-demo-cluster-1 and the admin user name is awsuser.

  1. On the Amazon Redshift console, choose Clusters in the navigation pane.
  2. Choose your cluster.
  3. Choose the Properties tab.

Redshift Cluster Properties

To make the cluster discoverable by Amazon Managed Grafana, you must add a special tag to it.

  1. Choose Add tags. Redshift Cluster Tags
  2. For Key, enter GrafanaDataSource.
  3. For Value, enter true.
  4. Choose Save changes.

Redshift Cluster Tags

Create a database user for Amazon Managed Grafana

Grafana will be directly querying the cluster, and it requires a database user to connect to the cluster. In this step, we create the user redshift_data_api_user and apply some security best practices.

  1. On the cluster details page, choose Query data and Query in query editor v2.Query Editor v2
  2. Choose the redshift-demo-cluster-1 cluster we created previously.
  3. For Database, enter the default dev.
  4. Enter the user name and password that you used to create the cluster.
  5. Choose Create connection.Redshift SU
  6. In the query editor, enter the following statements and choose Run:
CREATE USER redshift_data_api_user PASSWORD '<password>' CREATEUSER;
ALTER USER redshift_data_api_user SET readonly TO TRUE;
ALTER USER redshift_data_api_user SET query_group TO 'superuser';

The first statement creates a user with superuser privileges necessary to access system tables and views (make sure to use a unique password). The second prohibits the user from making modifications. The last statement isolates the queries the user can run to the superuser queue, so they don’t interfere with the main workload.

In this example, we use service managed permissions in Amazon Managed Grafana and a workspace AWS Identity and Access Management (IAM) role as an authentication provider in the Amazon Redshift Grafana data source. We create the database user redshift_data_api_user using the AmazonGrafanaRedshiftAccess policy.

Configure a user in AWS SSO for Amazon Managed Grafana UI access

Two authentication methods are available for accessing Amazon Managed Grafana: AWS SSO and SAML. In this example, we use AWS SSO.

  1. On the AWS SSO console, choose Users in the navigation pane.
  2. Choose Add user.
  3. In the Add user section, provide the required information.

SSO add user

In this post, we select Send an email to the user with password setup instructions. You need to be able to access the email address you enter because you use this email further in the process.

  1. Choose Next to proceed to the next step.
  2. Choose Add user.

An email is sent to the email address you specified.

  1. Choose Accept invitation in the email.

You’re redirected to sign in as a new user and set a password for the user.

  1. Enter a new password and choose Set new password to finish the user creation.

Configure an Amazon Managed Grafana workspace and sign in to Grafana

Now you’re ready to set up an Amazon Managed Grafana workspace.

  1. On the Amazon Grafana console, choose Create workspace.
  2. For Workspace name, enter a name, for example grafana-demo-workspace-1.
  3. Choose Next.
  4. For Authentication access, select AWS Single Sign-On.
  5. For Permission type, select Service managed.
  6. Chose Next to proceed.AMG Workspace configure
  7. For IAM permission access settings, select Current account.AMG permission
  8. For Data sources, select Amazon Redshift.
  9. Choose Next to finish the workspace creation.Redshift to workspace

You’re redirected to the workspace page.

Next, we need to enable AWS SSO as an authentication method.

  1. On the workspace page, choose Assign new user or group.SSO new user
  2. Select the previously created AWS SSO user under Users and Select users and groups tables.SSO User

You need to make the user an admin, because we set up the Amazon Redshift data source with it.

  1. Select the user from the Users list and choose Make admin.
  2. Go back to the workspace and choose the Grafana workspace URL link to open the Grafana UI.AMG workspace
  3. Sign in with the user name and password you created in the AWS SSO configuration step.

Set up an Amazon Redshift data source in Grafana

To visualize the data in Grafana, we need to access the data first. To do so, we must create a data source pointing to the Amazon Redshift cluster.

  1. On the navigation bar, choose the lower AWS icon (there are two) and then choose Redshift from the list.
  2. For Regions, choose the Region of your cluster.
  3. Select the cluster from the list and choose Add 1 data source.Choose Redshift Cluster
  4. On the Provisioned data sources page, choose Go to settings.
  5. For Name, enter a name for your data source.
  6. By default, Authentication Provider should be set as Workspace IAM Role, Default Region should be the Region of your cluster, and Cluster Identifier should be the name of the chosen cluster.
  7. For Database, enter dev.
  8. For Database User, enter redshift_data_api_user.
  9. Choose Save & Test.Settings for Data Source

A success message should appear.

Data source working

Import the Amazon Redshift dashboard supplied with the data source

As the last step, we import the default Amazon Redshift dashboard and make sure that it works.

  1. In the data source we just created, choose Dashboards on the top navigation bar and choose Import to import the Amazon Redshift dashboard.Dashboards in the plugin
  2. Under Dashboards on the navigation sidebar, choose Manage.
  3. In the dashboards list, choose Amazon Redshift.

The dashboard appear, showing operational data from your cluster. When you add more clusters and create data sources for them in Grafana, you can choose them from the Data source list on the dashboard.

Clean up

To avoid incurring unnecessary charges, delete the Amazon Redshift cluster, AWS SSO user, and Amazon Managed Grafana workspace resources that you created as part of this solution.

Conclusion

In this post, we covered the process of setting up an Amazon Redshift dashboard working under Amazon Managed Grafana with AWS SSO authentication and querying from the Amazon Redshift cluster under the same AWS account. This is just one way to create the dashboard. You can modify the process to set it up with SAML as an authentication method, use custom IAM roles to manage permissions with more granularity, query Amazon Redshift clusters outside of the AWS account where the Grafana workspace is, use an access key and secret or AWS Secrets Manager based connection credentials in data sources, and more. You can also customize the dashboard by adding or altering visualizations using the feature-rich Grafana UI.

Because the Amazon Redshift data source plugin is an open-source project, you can install it in any Grafana deployment, whether it’s in the cloud, on premises, or even in a container running on your laptop. That allows you to seamlessly integrate Amazon Redshift monitoring into virtually all your existing Grafana-based monitoring stacks.

For more details about the systems and processes described in this post, refer to the following:


About the Authors

Sergey Konoplev is a Senior Database Engineer on the Amazon Redshift team. Sergey has been focusing on automation and improvement of database and data operations for more than a decade.

Milind Oke is a Data Warehouse Specialist Solutions Architect based out of New York. He has been building data warehouse solutions for over 15 years and specializes in Amazon Redshift.