Post Syndicated from Lorenzo Nicora original https://aws.amazon.com/blogs/big-data/process-millions-of-observability-events-with-apache-flink-and-write-directly-to-prometheus/
AWS recently announced support for a new Apache Flink connector for Prometheus. The new connector, contributed by AWS to the Flink open source project, adds Prometheus and Amazon Managed Service for Prometheus as a new destination for Flink.
In this post, we explain how the new connector works. We also show how you can manage your Prometheus metrics data cardinality by preprocessing raw data with Flink to build real-time observability with Amazon Managed Service for Prometheus and Amazon Managed Grafana.
Amazon Managed Service for Prometheus is a secure, serverless, scaleable, Prometheus-compatible monitoring service. You can use the same open source Prometheus data model and query language that you use today to monitor the performance of your workloads without having to manage the underlying infrastructure. Flink connectors are software components that move data into and out of an Amazon Managed Service for Apache Flink application. You can use the new connector to send processed data to an Amazon Managed Service for Prometheus destination starting with Flink version 1.19. With Amazon Managed Service for Apache Flink, you can transform and analyze data in real time. There are no servers and clusters to manage, and there is no compute and storage infrastructure to set up.
Observability beyond compute
In an increasingly connected world, the boundary of systems extends beyond compute assets, IT infrastructure, and applications. Distributed assets such as Internet of Things (IoT) devices, connected cars, and end-user media streaming devices are an integral part of business operations in many sectors. The ability to observe every asset of your business is key to detecting potential issues early, improving the experience of your customers, and protecting the profitability of the business.
Metrics and time series
It is helpful to think of observability as three pillars: metrics, logs, and traces. The most relevant pillar for distributed devices, like IoT, is metrics. This is because metrics can capture measurements from sensors or counting of specific events emitted by the device.
Metrics are series of samples of a given measurement at specific times. For example, in the case of a connected vehicle, they can be the readings from the electric motor RPM sensor. Metrics are normally represented as time series, or sequences of discrete data points in chronological order. Metrics’ time series are normally associated with dimensions, also called labels or tags, to help with classifying and analyzing the data. In the case of a connected vehicle, labels might be something like the following:
- Metric name – For example, “Electric Motor RPM”
- Vehicle ID – A unique identifier of the vehicle, like the Vehicle Identification Number (VIN)
Prometheus as a specialized time series database
Prometheus is a popular solution for storing and analyzing metrics. Prometheus defines a standard interface for storing and querying time series. Commonly used in combination with visualization tools like Grafana, Prometheus is optimized for real-time dashboards and real-time alerting.
Often considered mainly for observing compute resources, like containers or applications, Prometheus is actually a specialized time series database that can effectively be used to observe different types of distributed assets, including IoT devices.
Amazon Managed Service for Prometheus is a serverless, Prometheus-compatible monitoring service. See What is Amazon Managed Service for Prometheus? to learn more about Amazon Managed Service for Prometheus.
Effectively processing observability events, at scale
Handling observability data at scale becomes more challenging, due to the number of assets and unique metrics, especially when observing massively distributed devices, for the following reasons:
- High cardinality – Each device emits multiple metrics or types of events, each to be tracked independently.
- High frequency – Devices might emit events very frequently, multiple times per second. This might result in a large volume of raw data. This aspect in particular represents the main difference from observing compute resources, which are usually scraped at longer intervals.
- Events arrive at irregular intervals and out of order – Unlike compute assets that are usually scraped at regular intervals, we often see delays of transmission or temporarily disconnected devices, which cause events to arrive at irregular intervals. Concurrent events from different devices might follow different paths and arrive at different times.
- Lack of contextual information – Devices often transmit over channels with limited bandwidth, such as GPRS or Bluetooth. To optimize communication, events seldom contain contextual information, such as device model or user detail. However, this information is required for an effective observability.
- Derive metrics from events – Devices often emit specific events when specific facts happen. For example, when the vehicle ignition is turned on or off, or when a warning is emitted by the onboard computer. These are not direct metrics. However, counting and measuring the rates of these events are valuable metrics that can be inferred from these events.
Effectively extracting value from raw events requires processing. Processing might happen on read, when you query the data, or upfront, before storing.
Storing and analyzing raw events
The common approach with observability events, and with metrics in particular, is “storing first.” You can simply write the raw metrics into Prometheus. Processing, such as grouping, aggregating, and calculating derived metrics, happens “on query,” when data is extracted from Prometheus.
This approach might become particularly inefficient when you’re building real-time dashboards or alerting, and your data has very high cardinality or high frequency. As a time series database is continuously queried, a large volume of data is repeatedly extracted from the storage and processed. The following diagram illustrates this workflow.

Preprocessing raw observability events
Preprocessing raw events before storing shifts the work left, as illustrated in the following diagram. This increases the efficiency of real-time dashboards and alerts, allowing the solution to scale.

Apache Flink for preprocessing observability events
Preprocessing raw observability events requires a processing engine that allows you to do the following:
- Enrich events efficiently, looking up reference data and adding new dimensions to the raw events. For example, adding the vehicle model based on the vehicle ID. Enrichment allows adding new dimensions to the time series, enabling analysis otherwise impossible.
- Aggregate raw events over time windows, to reduce frequency. For example, if a vehicle emits an engine temperature measurement every second, you can emit a single sample with the average over 5 seconds. Prometheus can efficiently aggregate frequent samples on read. However, ingesting data with a frequency much higher than what is useful for dashboarding and real-time alerting is not an efficient use of Prometheus ingestion throughout and storage.
- Aggregate raw events over dimensions, to reduce cardinality. For example, aggregating some measurement per vehicle model.
- Calculate derived metrics applying arbitrary logic. For example, counting the number of warning events emitted by each vehicle. This also enables analysis otherwise impossible using only Prometheus and Grafana.
- Support event-time semantics, to aggregate over time events from different sources.
Such a preprocessing engine must also be able to scale and process the large volume of input raw events, and to process data with low latency—normally subsecond or single-digit seconds—to enable real-time dashboards and altering. To address these requirements, we see many customers using Flink.
Apache Flink meets the aforementioned requirements. Flink is a framework and distributed stream processing engine, designed to perform computations at in-memory speed and at scale. Amazon Managed Service for Apache Flink offers a fully managed, serverless experience, allowing you to run your Flink applications without managing infrastructure or clusters.
Amazon Managed Service for Apache Flink can process the ingested raw events. The resulting metrics, with lower cardinality and frequency, and additional dimensions, can be written to Prometheus for a more effective visualization and analysis. The following diagram illustrates this workflow.

Integrating Apache Flink and Prometheus
The new Flink Prometheus connector allows Flink applications to seamlessly write preprocessed time series data to Prometheus. No intermediate component is needed, and there is no requirement to implement a custom integration. The connector is designed to scale, using the ability of Flink to scale horizontally, and optimizing the writes to a Prometheus backend using a Remote-Write interface.
Example use case
AnyCompany is a car rental company managing a fleet of hundreds of thousands hybrid connected vehicles, in multiple regions. Each vehicle continuously transmits measurements from several sensors. Each sensor emits a sample every second or more frequently. Vehicles also communicate warning events when something wrong is detected by the onboard computer. The following diagram illustrates the workflow.

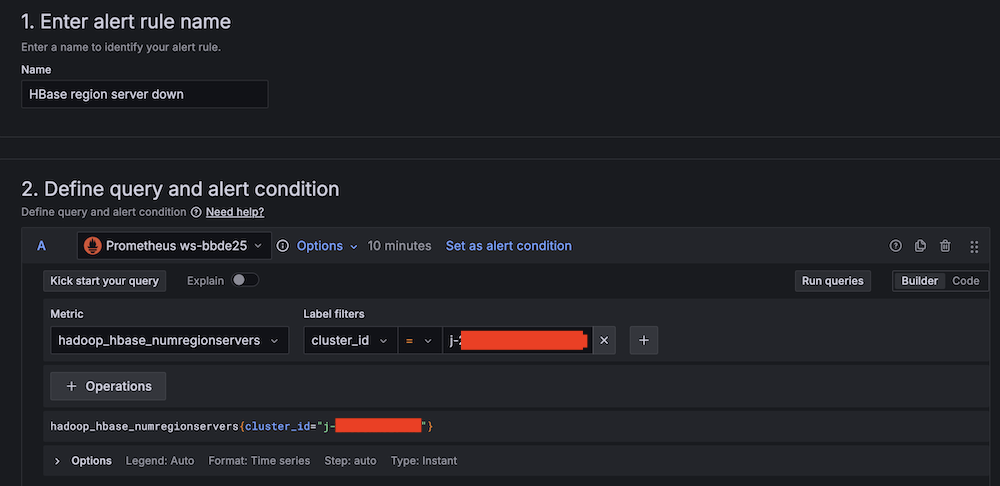
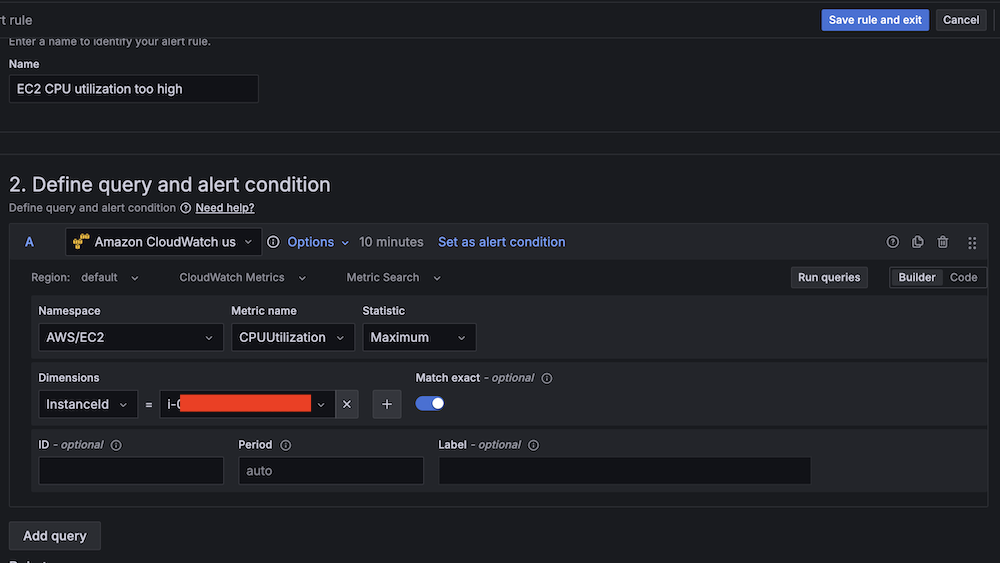
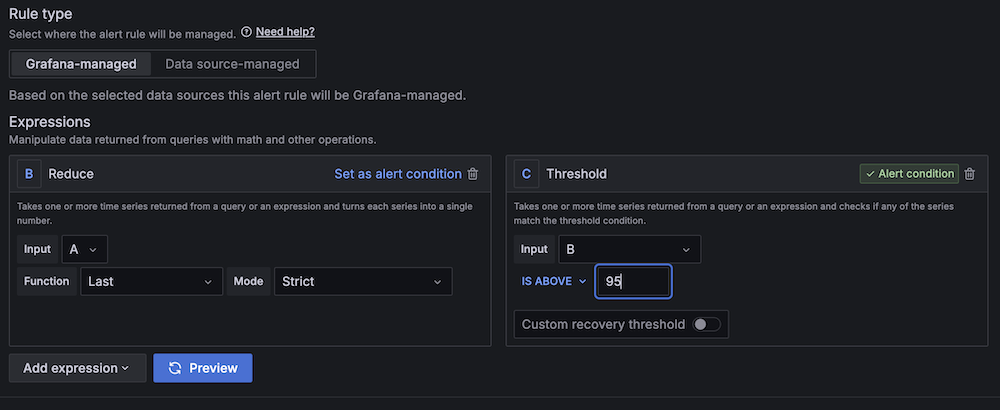
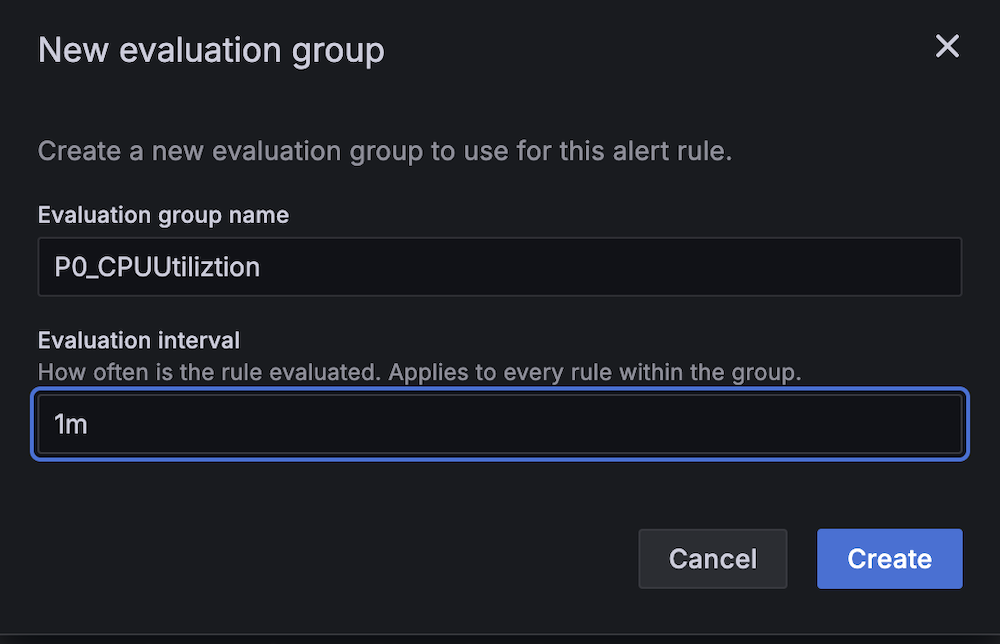
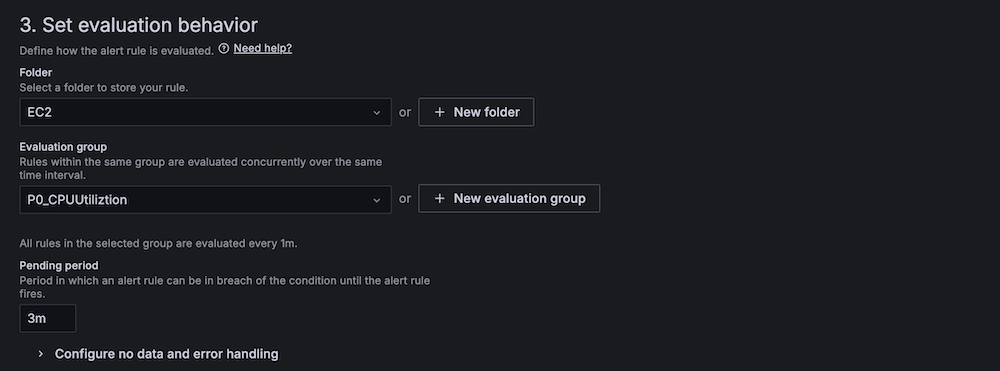
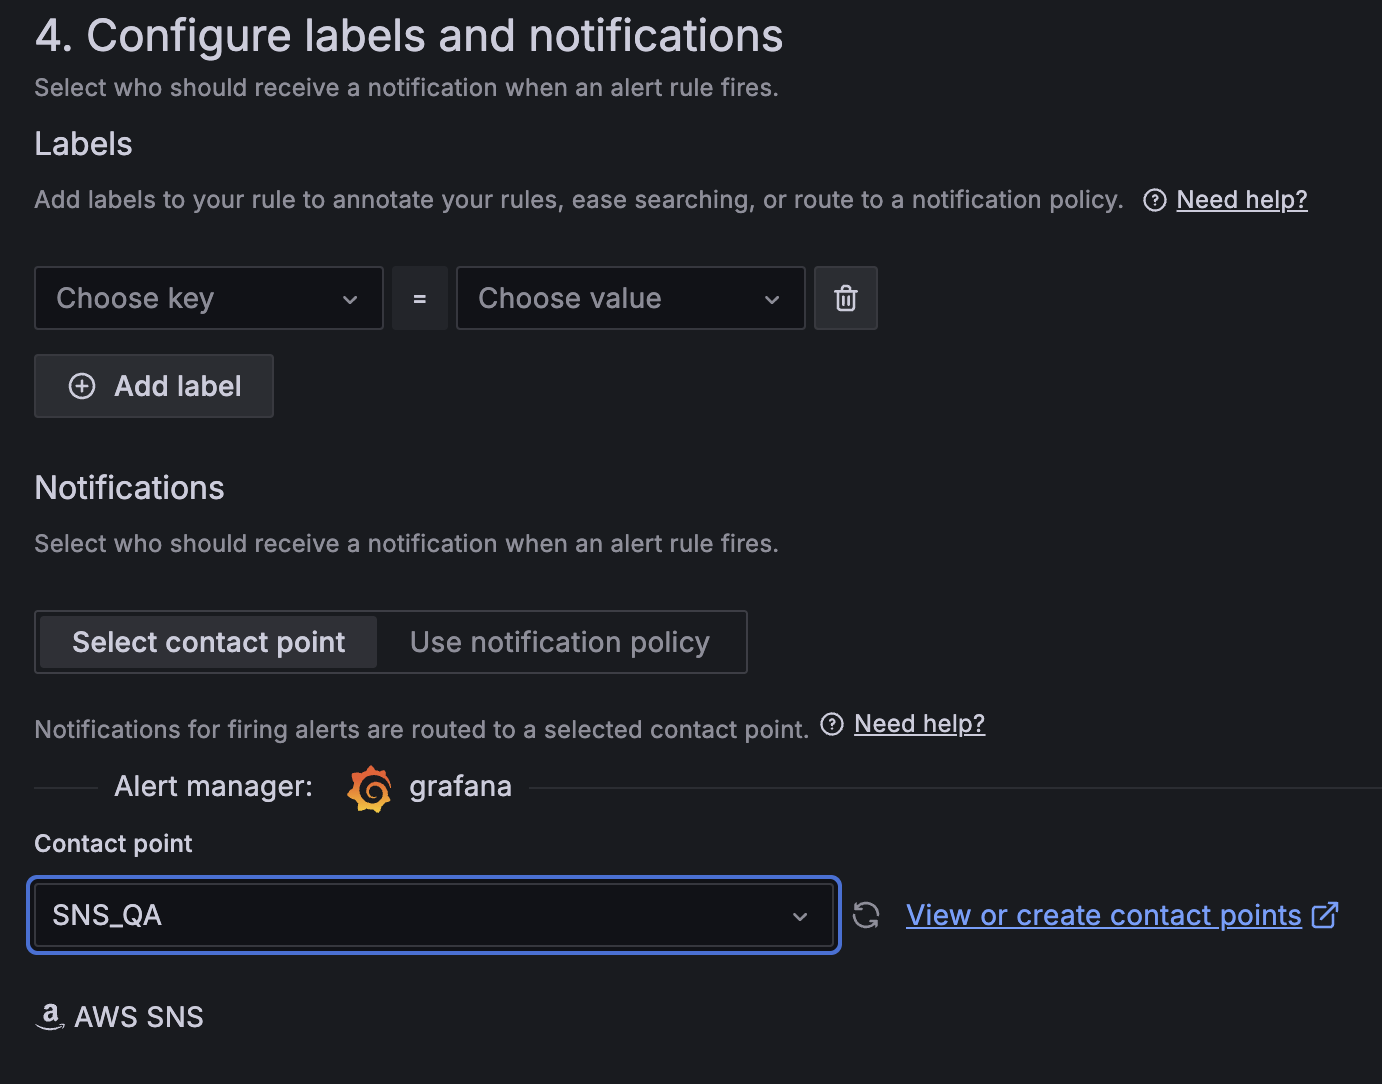
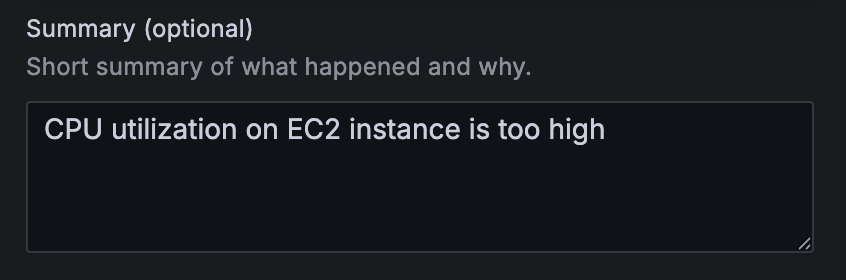
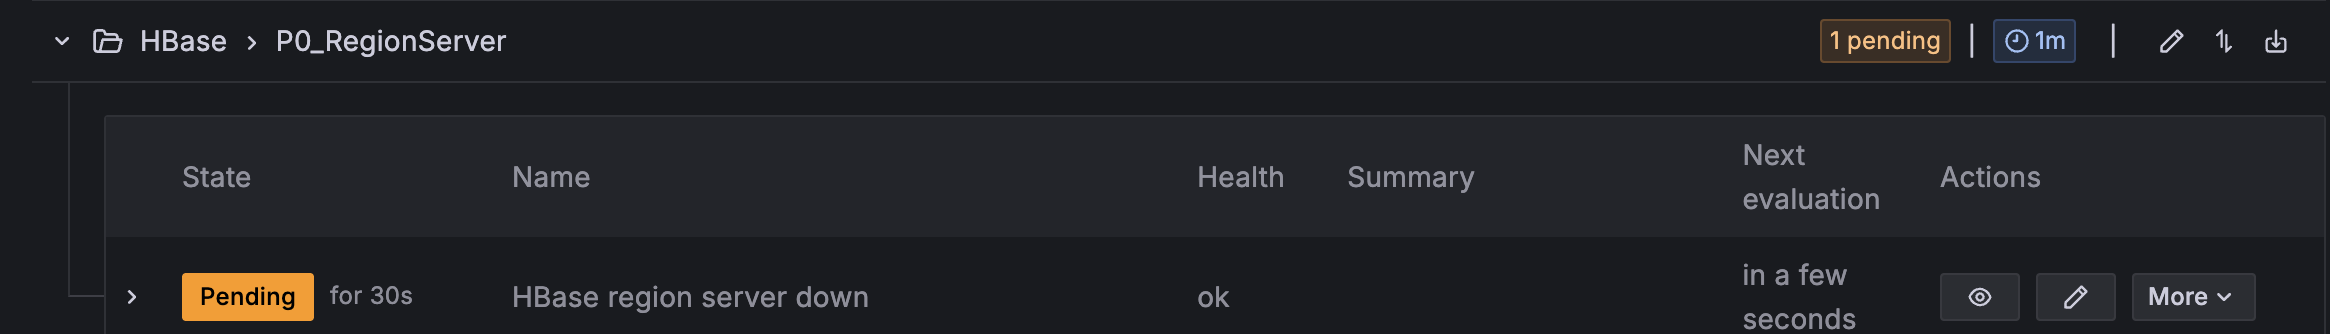
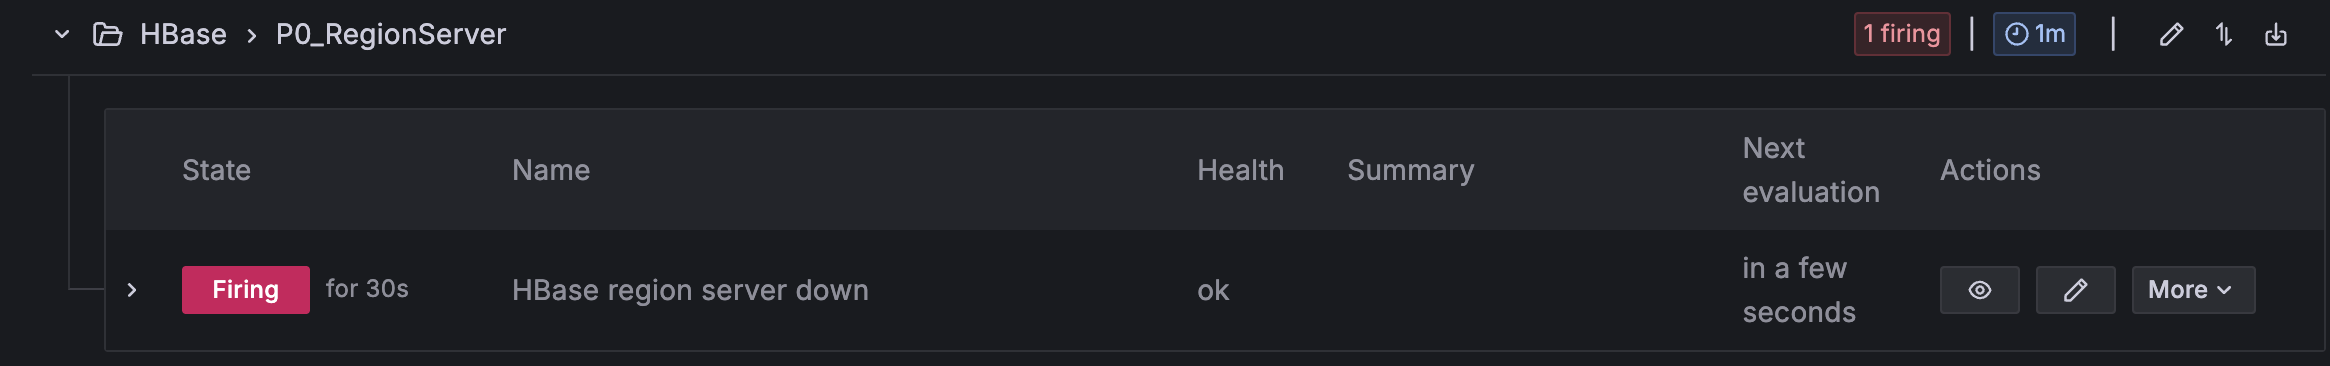
AnyCompany is planning to use Amazon Managed Service for Prometheus and Amazon Managed Grafana to visualize vehicle metrics and set up custom alerts.
However, building a real-time dashboard based on raw data, as transmitted by the vehicles, might be complicated and inefficient. Each vehicle might have hundreds of sensors, each of them resulting in a separate time series to display. Additionally, AnyCompany wants to monitor the behavior of different vehicle models. Unfortunately, the events transmitted by the vehicles only contain the VIN. The model can be inferred by looking up (joining) some reference data.
To overcome these challenges, AnyCompany has built a preprocessing stage based on Amazon Managed Service for Apache Flink. This stage has the following capabilities:
- Enrich the raw data by adding the vehicle model, and looking up reference data based on the vehicle identification.
- Reduce the cardinality, aggregating the results per vehicle model, available after the enrichment step.
- Reduce the frequency of the raw metrics to reduce write bandwidth, aggregating over time windows of a few seconds.
- Calculate derived metrics based on multiple raw metrics. For example, determine whether a vehicle is in motion when either the internal combustion engine or the electrical motor are rotating.
The result of preprocessing are more actionable metrics. A dashboard built on these metrics can, for example, help determine whether the last software update released over-the-air to all vehicles of a specific model in specific regions, is causing issues.
Using the Flink Prometheus connector, the preprocessor application can write directly to Amazon Managed Service for Prometheus, without intermediate components.
Nothing prevents you from choosing to write raw metrics with full cardinality and frequency to Prometheus, allowing you to drill down to the single vehicle. The Flink Prometheus connector is designed to scale by batching and parallelizing writes.
Solution overview
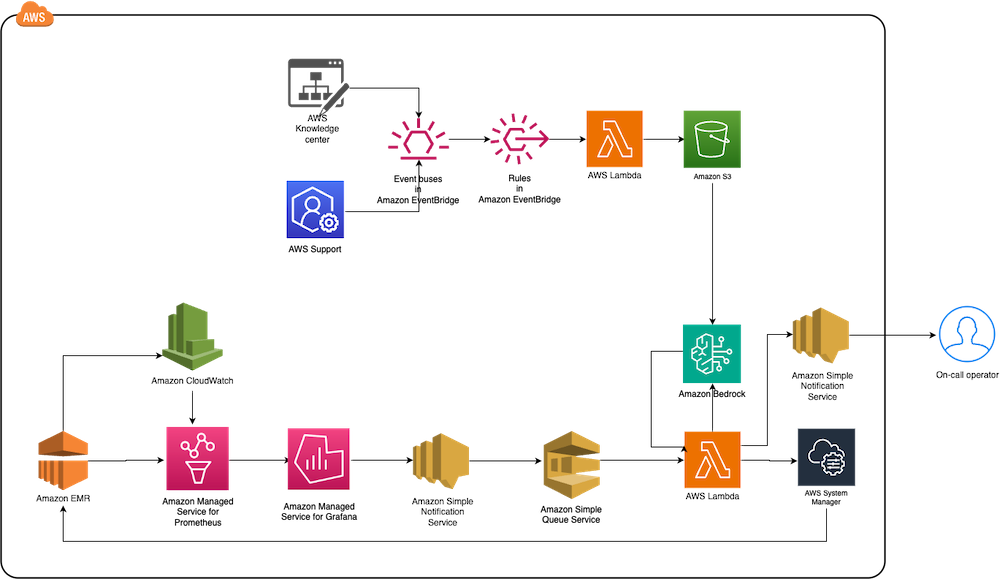
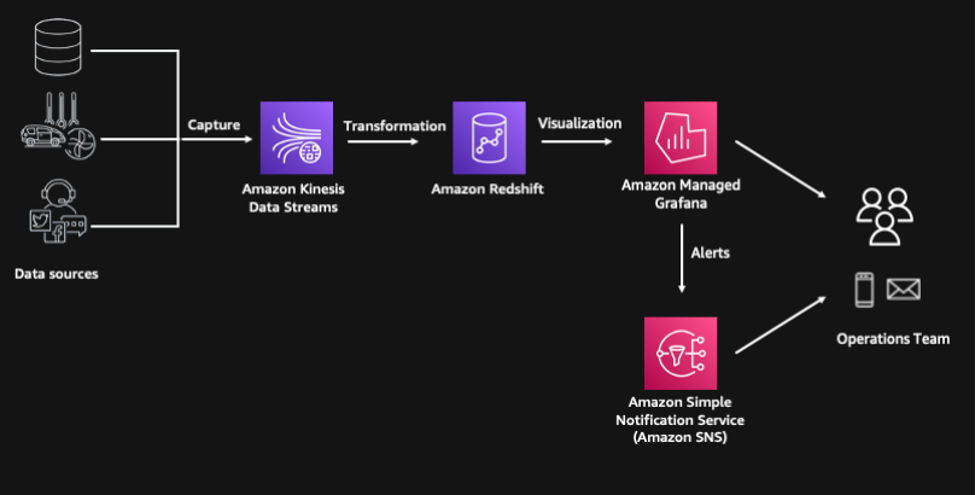
The following GitHub repository contains a fictional end-to-end example covering this use case. The following diagram illustrates the architecture of this example.

The workflow consists of the following steps:
- Vehicles, radio transmission, and ingestion of IoT events have been abstracted away, and replaced by a data generator that produces raw events for a hundred thousand fictional vehicles. For simplicity, the data generator is itself an Amazon Managed Service for Apache Flink application.
- Raw vehicle events are sent to a stream storage service. In this example, we use Amazon Managed Streaming for Apache Kafka (Amazon MSK).
- The core of the system is the preprocessor application, running in Amazon Managed Service for Apache Flink. We will dive deeper into the details of the processor in the following sections.
- Processed metrics are directly written to the Prometheus backend, in Amazon Managed Service for Prometheus.
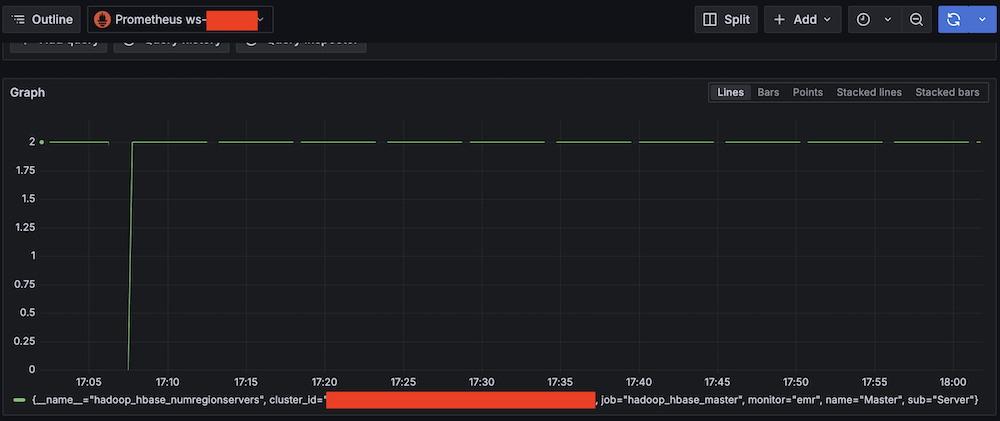
- Metrics are used to generate real-time dashboards on Amazon Managed Grafana.
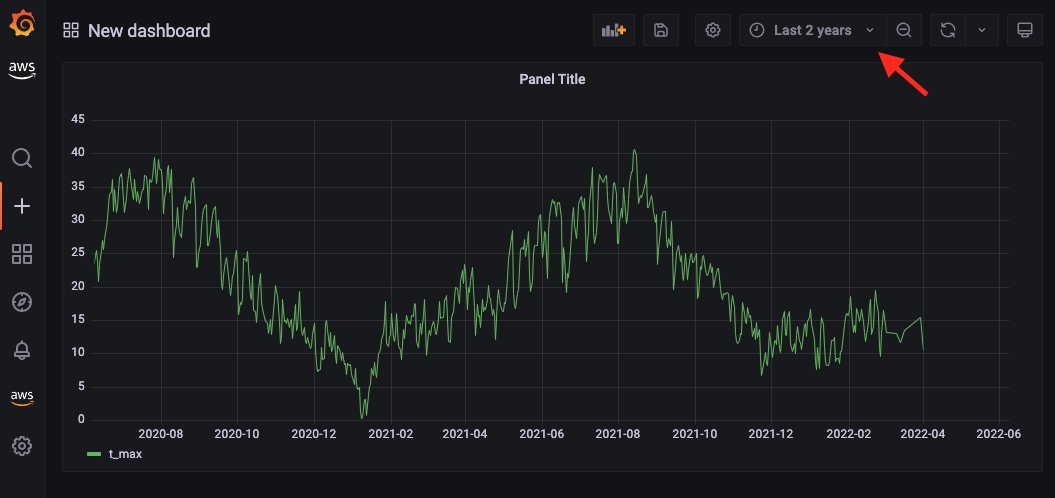
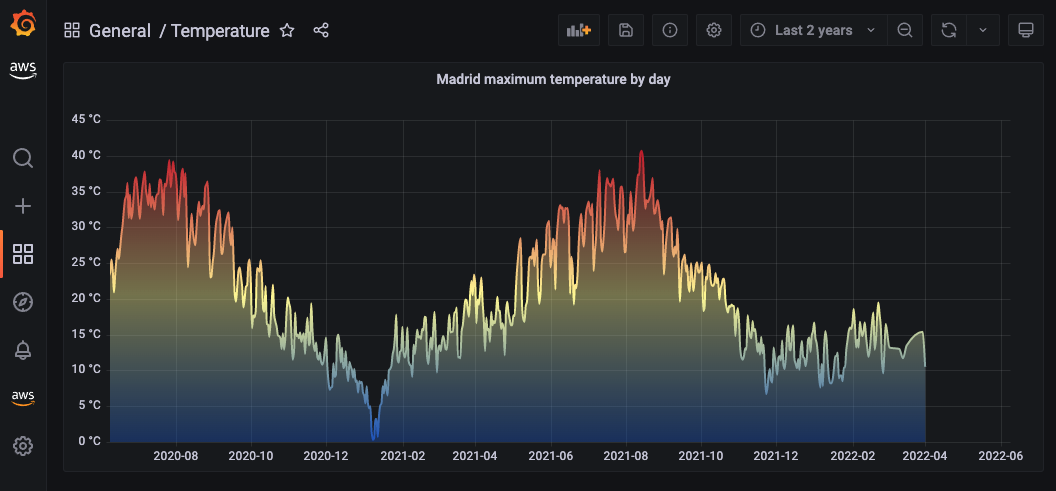
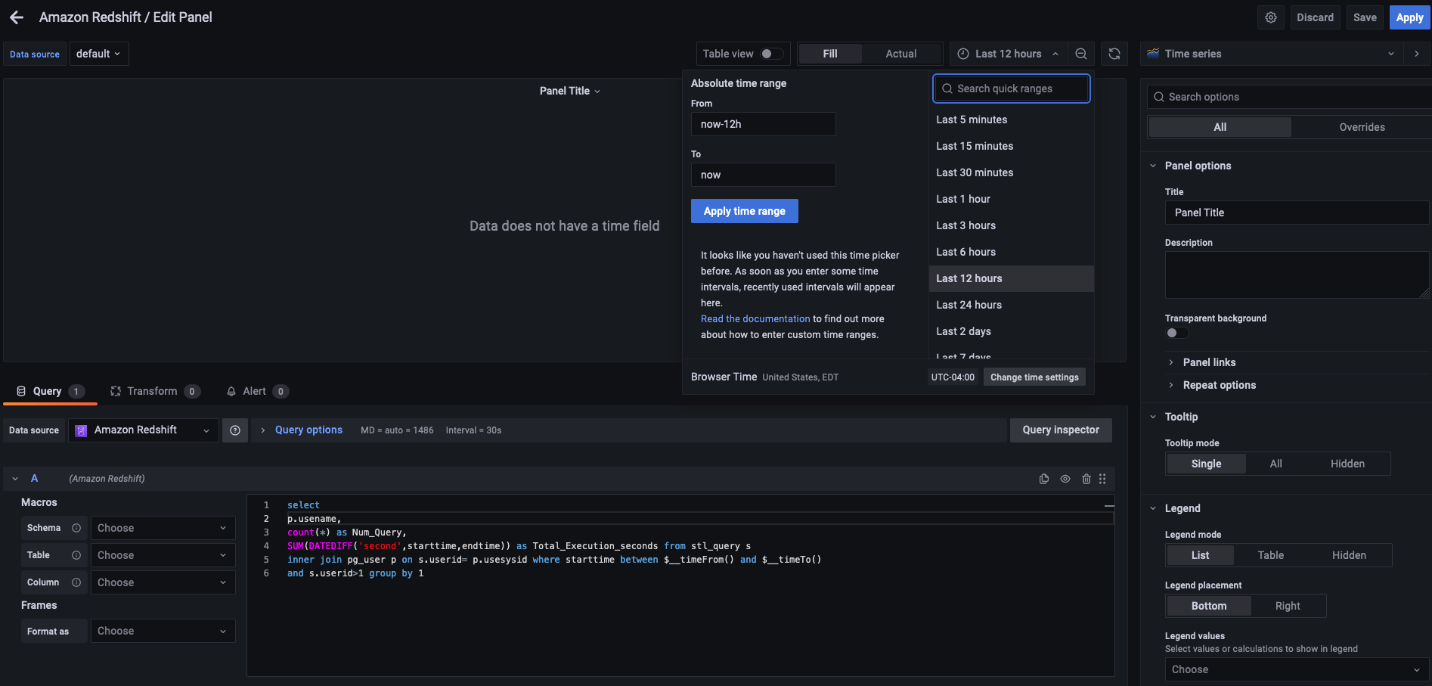
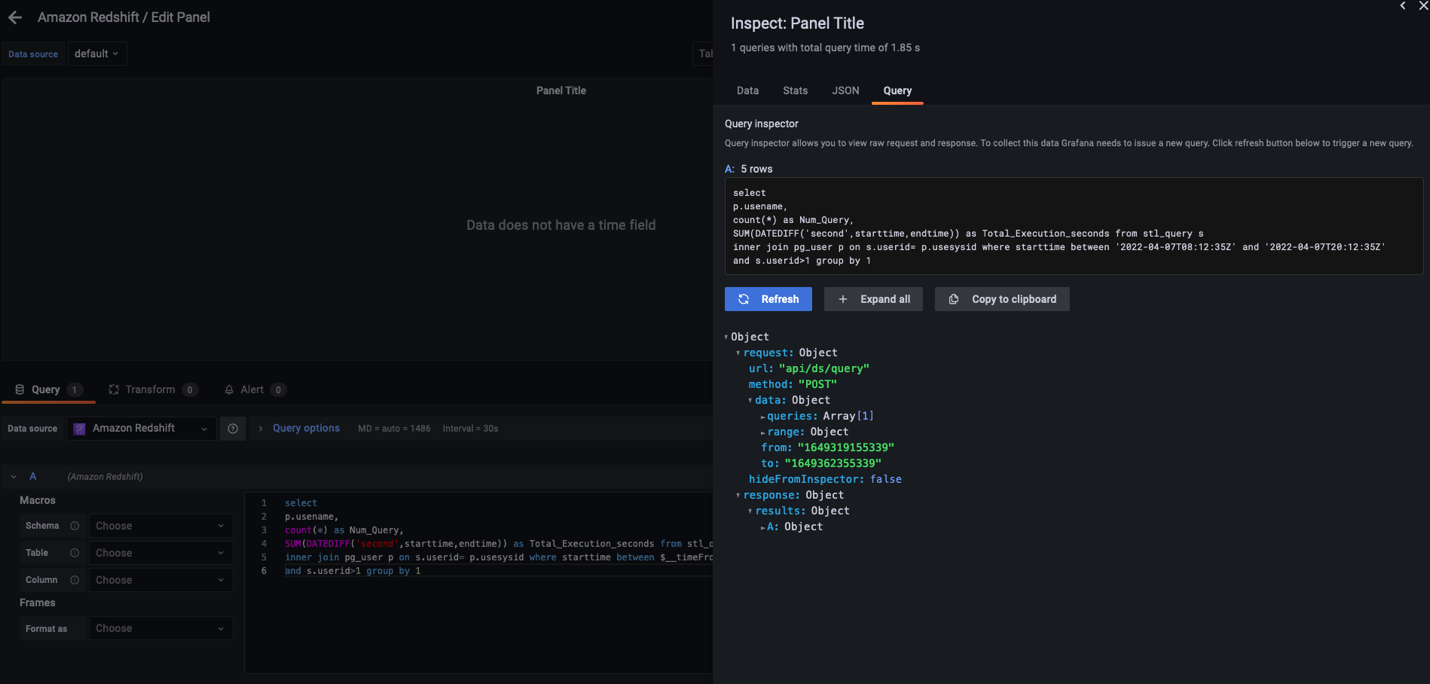
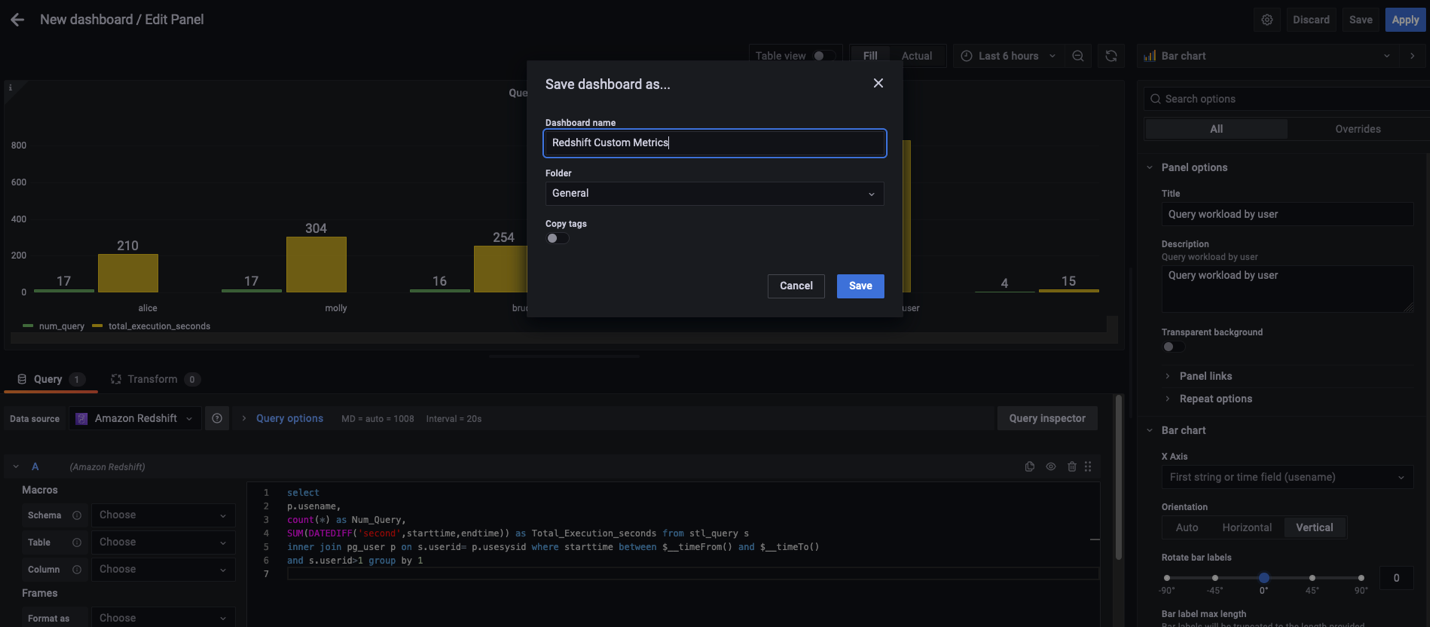
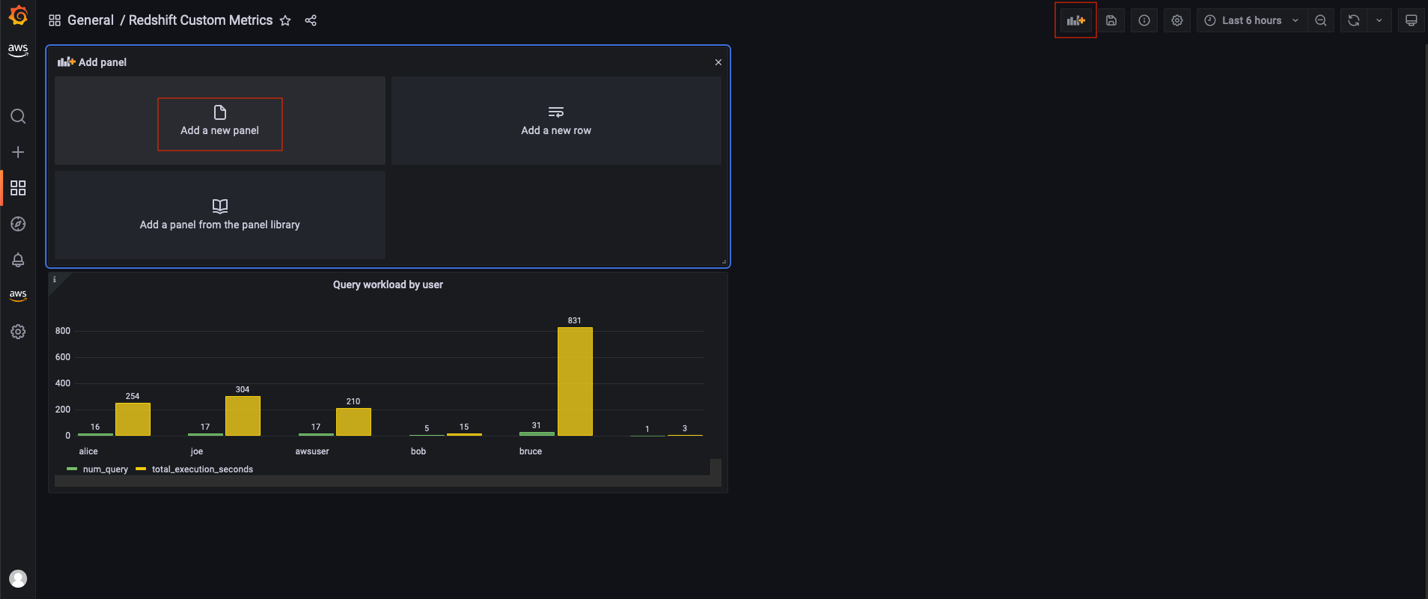
The following screenshot shows a sample dashboard.

Raw vehicle events
Each vehicle transmits three metrics almost every second:
- Internal combustion (IC) engine RPM
- Electric motor RPM
- Number of reported warnings
The raw events are identified by the vehicle ID and the region where the vehicle is located.
Preprocessor application
The following diagram illustrates the logical flow of the preprocessing application running in Amazon Managed Service for Apache Flink.

The workflow consists of the following steps:
- Raw events are ingested from Amazon MSK from Flink Kafka source.
- An enrichment operator adds the vehicle model, which is not contained in the raw events. This additional dimension is then used to aggregate the raw events. The resulting metrics have only two dimensions: vehicle model and region.
- Raw events are then aggregated over time windows (5 seconds) to reduce frequency. In this example, the aggregation logic also generates a derived metric: the number of vehicles in motion. A new metric can be derived from raw metrics with arbitrary logic. For the sake of the example, a vehicle is considered “in motion” if either the IC engine or electric motor RPM metric are not zero.
- The processed metrics are mapped into the input data structure of the Flink Prometheus connector, which maps directly to the time series records expected by the Prometheus Remote-Write interface. Refer to the connector documentation for more details.
- Finally, the metrics are sent to Prometheus using the Flink Prometheus connector. Write authentication, required by Amazon Managed Service for Prometheus, is seamlessly enabled using the Amazon Managed Service for Prometheus request signer provided with the connector. Credentials are automatically derived from the AWS Identity and Access Management (IAM) role of the Amazon Managed Service for Apache Flink application. No additional secret or credential is required.
In the GitHub repository, you can find the step-by-step instructions to set up the working example and create the Grafana dashboard.
Flink Prometheus connector key features
The Flink Prometheus connector allows Flink applications to write processed metrics to Prometheus, using the Remote-Write interface.
The connector is designed to scale write throughput by:
- Parallelizing writes, using the Flink parallelism capability
- Batching multiple samples in a single write request to the Prometheus endpoint
Error handling complies with Prometheus Remote-Write 1.0 specifications. The specifications are particularly strict about malformed or out-of-order data rejected by Prometheus.
When a malformed or out-of-order write is rejected, the connector discards the offending write request and continues, preferring data freshness over completeness. However, the connector makes data loss observable, emitting WARN log entries and exposing metrics that measure the volume of discarded data. In Amazon Managed Service for Apache Flink, these connector metrics can be automatically exported to Amazon CloudWatch.
Responsibilities of the user
The connector is optimized for efficiency, write throughput, and latency. Validation of incoming data would be particularly expensive in terms of CPU utilization. Additionally, different Prometheus backend implementations enforce constraints differently. For these reasons, the connector doesn’t validate incoming data before writing to Prometheus.
The user is responsible of making sure that the data sent to the Flink Prometheus connector follows the constraints enforced by the particular Prometheus implementations they are using.
Ordering
Ordering is particularly relevant. Prometheus expects that samples belonging to the same time series—samples with the same metric name and labels—are written in time order. The connector makes sure ordering is not lost when data is partitioned to parallelize writes.
However, the user is responsible for retaining the ordering upstream in the pipeline. To achieve this, the user must carefully design data partitioning within the Flink application and the stream storage. Only partitioning by key must be used, and partitioning keys must compound the metric name and all labels that will be used in Prometheus.
Conclusion
Prometheus is a specialized time series database, designed for building real-time dashboards and altering. Amazon Managed Service for Prometheus is a fully managed, serverless backend compatible with the Prometheus open source standard. Amazon Managed Grafana allows you to build real-time dashboards, seamlessly interfacing with Amazon Managed Service for Prometheus.
You can use Prometheus for observability use cases beyond compute resource, to observe IoT devices, connected cars, media streaming devices, and other highly distributed assets providing telemetry data.
Directly visualizing and analyzing high-cardinality and high-frequency data can be inefficient. Preprocessing raw observability events with Amazon Managed Service for Apache Flink shifts the work left, greatly simplifying the dashboards or alerting you can build on top of Amazon Managed Service for Prometheus.
For more information about running Flink, Prometheus, and Grafana on AWS, see the resources of these services:
For more information about the Flink Prometheus integration, see the Apache Flink documentation.
About the authors
 Lorenzo Nicora works as Senior Streaming Solution Architect at AWS, helping customers across EMEA. He has been building cloud-centered, data-intensive systems for over 25 years, working across industries both through consultancies and product companies. He has used open-source technologies extensively and contributed to several projects, including Apache Flink, and is the maintainer of the Flink Prometheus connector.
 Francisco Morillo is a Senior Streaming Solutions Architect at AWS. Francisco works with AWS customers, helping them design real-time analytics architectures using AWS services, supporting Amazon MSK and Amazon Managed Service for Apache Flink. He is also a main contributor to the Flink Prometheus connector.


 Balaji Mohan is a Senior Delivery Consultant specializing in application and data modernization to the cloud. His business-first approach provides seamless transitions, aligning technology with organizational goals. Using cloud-centered architectures, he delivers scalable, agile, and cost-effective solutions, driving innovation and growth.
 Senthil Ramasamy is a Senior Database Consultant at Amazon Web Services. He works with AWS customers to provide guidance and technical assistance on database services, helping them with database migrations to the AWS Cloud and improving the value of their solutions when using AWS.
 Muthu Pitchaimani is a Search Specialist with Amazon OpenSearch Service. He builds large-scale search applications and solutions. Muthu is interested in the topics of networking and security, and is based out of Austin, Texas.


 Noritaka Sekiyama is a Principal Big Data Architect on the AWS Glue team. He is responsible for building software artifacts to help customers. In his spare time, he enjoys cycling with his new road bike.
 Xiaoxi Liu is a Software Development Engineer on the AWS Glue team. Her passion is building scalable distributed systems for efficiently managing big data on the cloud, and her concentrations are distributed system, big data, and cloud computing.
 Akira Ajisaka is a Senior Software Development Engineer on the AWS Glue team. He likes open source software and distributed systems. In his spare time, he enjoys playing arcade games.
 Shenoda Guirguis is a Senior Software Development Engineer on the AWS Glue team. His passion is in building scalable and distributed data infrastructure and processing systems. When he gets a chance, Shenoda enjoys reading and playing soccer.
 Sean Ma is a Principal Product Manager on the AWS Glue team. He has an 18-year track record of innovating and delivering enterprise products that unlock the power of data for users. Outside of work, Sean enjoys scuba diving and college football.
 Mohit Saxena is a Senior Software Development Manager on the AWS Glue team. His team focuses on building distributed systems to enable customers with interactive and simple to use interfaces to efficiently manage and transform petabytes of data seamlessly across data lakes on Amazon S3, databases and data-warehouses on cloud.


![As the user configures their EventBridge Rule, for the Creation method they have chosen "Custom pattern (JSON editor) write an event pattern in JSON." For the Event pattern editor just below they have entered {"source":["aws.devops-guru"]}](https://d2908q01vomqb2.cloudfront.net/7719a1c782a1ba91c031a682a0a2f8658209adbf/2023/04/19/eventbridge.png)


 Ajit Puthiyavettle is a Solution Architect working with enterprise clients, architecting solutions to achieve business outcomes. He is passionate about solving customer challenges with innovative solutions. His experience is with leading DevOps and security teams for enterprise and SaaS (Software as a Service) companies. Recently he is focussed on helping customers with Security, ML and HCLS workload.


 Paul Villena is an Analytics Solutions Architect in AWS with expertise in building modern data and analytics solutions to drive business value. He works with customers to help them harness the power of the cloud. His areas of interests are infrastructure-as-code, serverless technologies and coding in Python.


 Milind Oke is a Data Warehouse Specialist Solutions Architect based out of New York. He has been building data warehouse solutions for over 15 years and specializes in Amazon Redshift.