Tag Archives: Cloud Data warehouse

Stored procedure enhancements in Amazon Redshift

Post Syndicated from Milind Oke original https://aws.amazon.com/blogs/big-data/stored-procedure-enhancements-in-amazon-redshift/

Amazon Redshift is a fully managed, petabyte-scale data warehouse service in the cloud. With Amazon Redshift, you can analyze all your data to derive holistic insights about your business and your customers. It supports stored procedures where prepared SQL code is saved and the code can be reused over and over again.

Stored procedures are commonly used to encapsulate logic for data transformation, data validation, and business-specific logic. By combining multiple SQL steps into a stored procedure, you can create reusable code blocks that can run together as a single transaction or multiple individual transactions. You can also schedule stored procedures to automate data processing on Amazon Redshift. For more information, refer to Bringing your stored procedures to Amazon Redshift.

In the Redshift stored procedure default atomic transaction mode, a call to a Redshift stored procedure will create its own transaction when the call starts or is part of the existing transaction if an explicit transaction is opened before the stored procedure is called. All the statements inside a procedure behave as if they are in a single transaction block that ends when the stored procedure call finishes. A nested call to another procedure is treated like any other SQL statement and operates within the context of the same transaction as the caller. Statements for TRUNCATE, COMMIT, and ROLLBACK and the exception handling block with arbitrary SQL statements close the current transaction and start a new transaction implicitly. This behavior can cause challenges in migration to Amazon Redshift from other systems like Teradata.

In this post, we discuss the enhancements to Amazon Redshift stored procedures for non-atomic transaction mode. This mode provides enhanced transaction controls that enable you to automatically commit the statements inside the stored procedure.

Non-atomic transaction mode

The new non-atomic transaction mode feature provides three enhancements on stored procedures in Amazon Redshift:

  • Unless the DML or DDL statements are part of an explicit open transaction, each statement in the stored procedure will run in its own implicit transaction and a new transaction will be opened to handle following statements. If an explicit transaction is opened, then all subsequent statements are run and remain un-committed until an explicit transaction control command (COMMIT or ROLLBACK) is run to end the transaction.
  • Amazon Redshift will not re-raise the exception after the exception handler statements are complete. Therefore, a new RAISE statement without any INFO or EXCEPTION has been provided to re-throw the exception caught by the exception handling block. This RAISE statement without any INFO or EXCEPTION will only be allowed in the exception handling block.
  • Also, the new START TRANSACTION statement begins an explicit transaction inside the non-atomic transaction mode stored procedure. Use the existing transaction control command (COMMIT or ROLLBACK) to end the explicitly started transaction.
    • Amazon Redshift does not support sub-transactions so if there is already an open transaction, then calling this statement again will do nothing, and no error is raised.
    • If an explicit transaction is still open when the nonatomic transaction mode stored procedure call ends, then the explicit transaction remains open until a transaction control command is run in the session.
    • If the session disconnects before running a transaction control command, the whole transaction is automatically rolled back.

Additional restrictions

Some restrictions have also been introduced for Redshift stored procedures:

  • For nesting stored procedure calls, all the procedures must be created in the same transaction mode, no matter if it’s in atomic (default) transaction mode or the new non-atomic transaction mode
  • You can’t nest stored procedures across the two transaction modes (atomic and non-atomic)
  • You can’t set the SECURITY DEFINER option or SET configuration_parameter option for non-atomic transaction mode stored procedures

Impact to cursors

Cursors in non-atomic transaction mode stored procedures will behave differently compared to the default atomic transaction mode:

  • Cursor statements will need an explicit transaction block before beginning the cursor to ensure that each iteration of the cursor loop is not auto-committed.
  • To return a cursor from non-atomic transaction mode stored procedure, you will need an explicit transaction block before beginning the cursor. Otherwise, the cursor will be closed when the SQL statement inside the loop is automatically committed.

Advantages

The following are key advantages of this feature from a user perspective:

  • It provides the capability to lift and shift Teradata stored procedures to run in Teradata session mode. This helps in seamless migrations from traditional data warehouses like Teradata and SQL Server.
  • It enables Amazon Redshift to provide more flexible operations inside of stored procedures when encountering errors and exceptions. Amazon Redshift can now preserve previous action’s state before reaching an exception.

Syntax

The new optional keyword NONATOMIC has been added to the stored procedure definition syntax, as shown in the following code:

CREATE [ OR REPLACE ] PROCEDURE sp_procedure_name
( [ [ argname ] [ argmode ] argtype [, ...] ] )
[ NONATOMIC ]
AS $$
procedure_body
$$ LANGUAGE plpgsql

This optional keyword creates the stored procedure under the non-atomic transaction mode. If you don’t specify the keyword, then the default atomic mode will be the transaction mode when creating the stored procedure.

NONATOMIC means each DML and DDL statement in the procedure will be implicitly committed.

Without non-atomic mode, the procedure will create its own transaction when the call starts or be part of the existing transaction if an explicit transaction is opened before it is called. Every statement within the stored procedure will belong to this one transaction.

Example of NONATOMIC mode

Let’s consider the customer contact table custcontacts, which stores customer primary and secondary contact phone numbers:

CREATE table custcontacts(
custid int4 not null,
primaryphone char(10),
secondaryphone char(10));

We insert three sample customer records with no contact values:

INSERT INTO custcontacts VALUES (101, 'xxxxxxxxxx', 'xxxxxxxxxx');
INSERT INTO custcontacts VALUES (102, 'xxxxxxxxxx', 'xxxxxxxxxx');
INSERT INTO custcontacts VALUES (103, 'xxxxxxxxxx', 'xxxxxxxxxx');

You need to create a stored procedure to update the primary and secondary phone numbers. The requirement is not to roll back updates to the primary contact number if updates to the secondary contact number fail for some reason.

You can achieve this by creating the stored procedure with the NONATOMIC keyword. The NONATOMIC keyword ensures that each statement in the stored procedure runs in its own implicit transaction block. Therefore, if the UPDATE statement for the secondary phone fails, then it won’t roll back the data update made to the primary phone. See the following code:

CREATE PROCEDURE sp_update_custcontacts(cid int4,pphone char(15),sphone char(15)) NONATOMIC AS
$$
BEGIN
UPDATE custcontacts SET primaryphone=pphone WHERE custid=cid;
UPDATE custcontacts SET secondaryphone=sphone WHERE custid=cid;
END;
$$
LANGUAGE plpgsql;

Now let’s call the stored procedure passing the secondary phone number with more than 10 digits, which will fail in the secondaryphone UPDATE statement due to incorrect length:

call sp_update_custcontacts(101,'1234567890','345443345324');

The preceding procedure call will update the primary phone number successfully. The secondary phone number update fails. However, the primaryphone update will not roll back because it ran in its own implicit transaction block due to the NONATOMIC clause in the stored procedure definition.

select * from custcontacts;

custcontacts | primaryphone | secondaryphone
-------------+---------------+---------------
101 | 1234567890 | XXXXXXXXXX
102 | XXXXXXXXXX | XXXXXXXXXX
103 | XXXXXXXXXX | XXXXXXXXXX

Exception handling in NONATOMIC mode

Exceptions are handled in stored procedures differently based on the atomic or non-atomic mode:

  • Atomic (default) – Exceptions are always re-raised
  • Non-atomic – Exceptions are handled and you can choose to re-raise or not

Let’s continue with the previous example to illustrate exception handling in non-atomic mode.

Create the following table to log exceptions raised by stored procedures:

CREATE TABLE procedure_log
(log_timestamp timestamp, procedure_name varchar(100), error_message varchar(255));

Now update the sp_update_custcontacts() procedure to handle exceptions. Note that we’re adding an EXCEPTION block in the procedure definition. It inserts a record in the procedure_log table in the event of an exception.

CREATE OR REPLACE PROCEDURE sp_update_custcontacts(cid int4,pphone char(15),sphone char(15)) NONATOMIC AS
$$
BEGIN
UPDATE custcontacts SET primaryphone=pphone WHERE custid=cid;
UPDATE custcontacts SET secondaryphone=sphone WHERE custid=cid;
EXCEPTION
WHEN OTHERS THEN
INSERT INTO procedure_log VALUES (getdate(), 'sp_update_custcontacts', sqlerrm);
END;
$$
LANGUAGE plpgsql;

Now create one more stored procedure, which will call the preceding procedure. It also has an EXCEPTION block and inserts a record in the procedure_log table in the event of an exception.

CREATE PROCEDURE sp_update_customer() NONATOMIC AS
$$
BEGIN
-- Let us assume you have additional staments here to update other fields. For this example, ommitted them for simplifiction.
-- Nested call to update contacts
call sp_update_custcontacts(101,'1234567890','345443345324');
EXCEPTION
WHEN OTHERS THEN
INSERT INTO procedure_log VALUES (getdate(), 'sp_update_customer', sqlerrm);
END;
$$
LANGUAGE plpgsql;

Let’s call the parent procedure we created:

call sp_update_customer();

This in turn will call the sp_update_custcontacts() procedure. The inner procedure sp_update_custcontacts() will fail because we’re updating the secondary phone with an invalid value. The control will enter the EXCEPTION block of the sp_update_custcontacts() procedure and make an insert into the procedure_log table.

However, it will not re-raise the exception in non-atomic mode. Therefore, the parent procedure sp_update_customer() will not get the exception passed from the sp_update_custcontacts() procedure. The control will not enter the EXCEPTION block of the sp_update_customer() procedure.

If you query the procedure_log table, you will see an entry only for the error handled by the sp_update_custcontacts() procedure:

select * from procedure_log;

Procedure Log Output

Now redefine the sp_update_custcontacts() procedure with the RAISE statement:

CREATE PROCEDURE sp_update_custcontacts(cid int4,pphone char(15),sphone char(15)) NONATOMIC AS
$$
BEGIN
UPDATE custcontacts SET primaryphone=pphone WHERE custid=cid;
UPDATE custcontacts SET secondaryphone=sphone WHERE custid=cid;
EXCEPTION
WHEN OTHERS THEN
INSERT INTO procedure_log VALUES (getdate(), 'sp_update_custcontacts', sqlerrm);
RAISE;
END;
$$
LANGUAGE plpgsql;

Let’s call the parent stored procedure sp_update_customer() again:

call sp_update_customer();

Now the inner procedure sp_update_custcontacts() will re-raise the exception to the parent procedure sp_update_customer() after handling the exception in its own EXCEPTION block. Then the control will reach the EXCEPTION block in the parent procedure and insert another record into the procedure_log table.

If you query the procedure_log table now, you will see two entries: one by the inner procedure sp_update_custcontacts() and another by the parent procedure sp_update_customer(). This demonstrates that the RAISE statement in the inner procedure re-raised the exception.

select * from procedure_log;

Procedure log output

Explicit START TRANSACTION statement in non-atomic mode

You can issue a START TRANSACTION statement to begin a transaction block inside the stored procedure. It will open a new transaction inside the stored procedure. For examples, refer to Nonatomic mode stored procedure transaction management.

Conclusion

In this post, we discussed the enhancements to Redshift stored procedures for non-atomic transaction mode, which provides enhanced transaction controls to enable you to automatically commit the statements inside the stored procedure. This mode also enables easier migration to Amazon Redshift from other systems like Teradata. Try out these enhancements and let us know your experience in comments.


About the Authors

Milind Oke is a Data Warehouse Specialist Solutions Architect based out of New York. He has been building data warehouse solutions for over 15 years and specializes in Amazon Redshift.

Satesh Sonti is a Sr. Analytics Specialist Solutions Architect based out of Atlanta, specialized in building enterprise data platforms, data warehousing, and analytics solutions. He has over 17 years of experience in building data assets and leading complex data platform programs for banking and insurance clients across the globe.

Kiran Chinta is a Software Development Manager at Amazon Redshift. He leads a strong team in query processing, SQL language, data security, and performance. Kiran is passionate about delivering products that seamlessly integrate with customers’ business applications with the right ease of use and performance. In his spare time, he enjoys reading and playing tennis.

Huichen Liu is a software development engineer on the Amazon Redshift query processing team. She focuses on query optimization, statistics and SQL language features. In her spare time, she enjoys hiking and photography.
Visualize database privileges on Amazon Redshift using Grafana

Post Syndicated from Yota Hamaoka original https://aws.amazon.com/blogs/big-data/visualize-database-privileges-on-amazon-redshift-using-grafana/

Amazon Redshift is a fully managed, petabyte-scale data warehouse service in the cloud. Amazon Redshift enables you to use SQL for analyzing structured and semi-structured data with best price performance along with secure access to the data.

As more users start querying data in a data warehouse, access control is paramount to protect valuable organizational data. Database administrators want to continuously monitor and manage user privileges to maintain proper data access in the data warehouse. Amazon Redshift provides granular access control on the database, schema, table, column, row, and other database objects by granting privileges to roles, groups, and users from a SQL interface. To monitor privileges configured in Amazon Redshift, you can retrieve them by querying system tables.

Although Amazon Redshift provides a broad capability of managing access to database objects, we have heard from customers that they want to visualize and monitor privileges without using a SQL interface. In this post, we introduce predefined dashboards using Grafana which visualizes database privileges without writing SQL. This dashboard will help database administrators to reduce the time spent on database administration and increase the frequency of monitoring cycles.

Database security in Amazon Redshift

Security is the top priority at AWS. Amazon Redshift provides four levels of control:

  • Cluster management
  • Cluster connectivity
  • Database access
  • Temporary database credentials and single sign-on

This post focuses on database access, which relates to user access control against database objects. For more information, see Managing database security.

Amazon Redshift uses the GRANT command to define permissions in the database. For most database objects, GRANT takes three parameters:

  • Identity – The entity you grant access to. This could be a user, role, or group.
  • Object – The type of database object. This could be a database, schema, table or view, column, row, function, procedure, language, datashare, machine leaning (ML) model, and more.
  • Privilege – The type of operation. Examples include CREATE, SELECT, ALTER, DROP, DELETE, and INSERT. The level of privilege depends on the object.

To remove access, use the REVOKE command.

Additionally, Amazon Redshift offers granular access control with the Row-level security (RLS) feature. You can attach or detach RLS policies to identities with the ATTACH RLS POLICY and DETACH RLS POLICY commands, respectively. See RLS policy ownership and management for more details.

Generally, database administrator monitors and reviews the identities, objects, and privileges periodically to ensure proper access is configured. They also need to investigate access configurations if database users face permission errors. These tasks require a SQL interface to query multiple system tables, which can be a repetitive and undifferentiated operation. Therefore, database administrators need a single pane of glass to quickly navigate through identities, objects, and privileges without writing SQL.

Solution overview

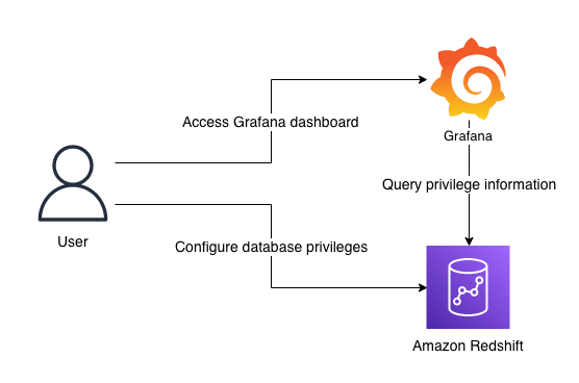
The following diagram illustrates the solution architecture and its key components:

  • Amazon Redshift contains database privilege information in system tables.
  • Grafana provides a predefined dashboard to visualize database privileges. The dashboard runs queries against the Amazon Redshift system table via the Amazon Redshift Data API.

Note that the dashboard focuses on visualization. SQL interface is required to configure privileges in Amazon Redshift. You can use query editor v2, a web-based SQL interface which enables users to run SQL commands from a browser.

Prerequisites

Before moving to the next section, you should have the following prerequisites:

While Amazon Managed Grafana controls the plugin version and updates periodically, local Grafana allows user to control the version. Therefore, local Grafana could be an option if you need earlier access for the latest features. Refer to plugin changelog for released features and versions.

Import the dashboards

After you have finished the prerequisites, you should have access to Grafana configured with Amazon Redshift as a data source. Next, import two dashboards for visualization.

  1. In Grafana console, go to the created Redshift data source and click Dashboards
  2. Import the Amazon Redshift Identities and Objects
  3. Go to the data source again and import the Amazon Redshift Privileges

Each dashboard will appear once imported.

Amazon Redshift Identities and Objects dashboard

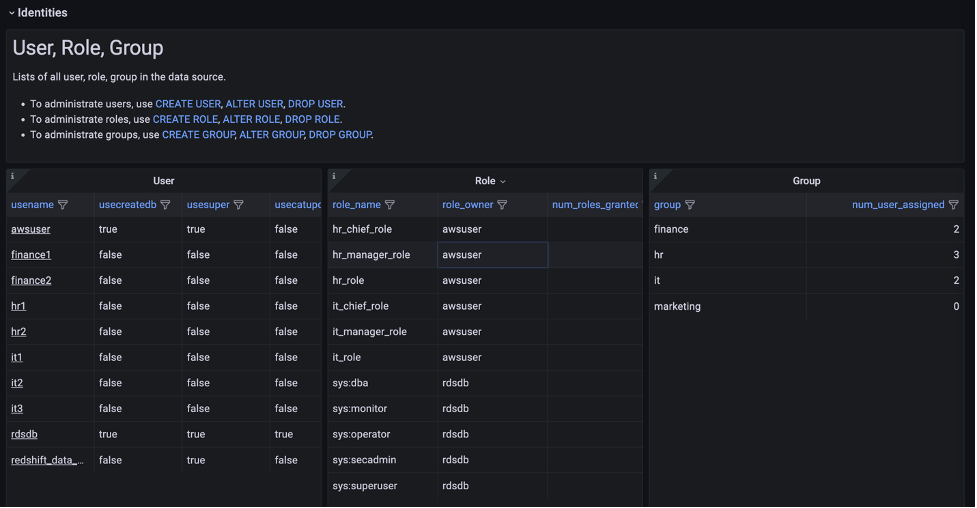
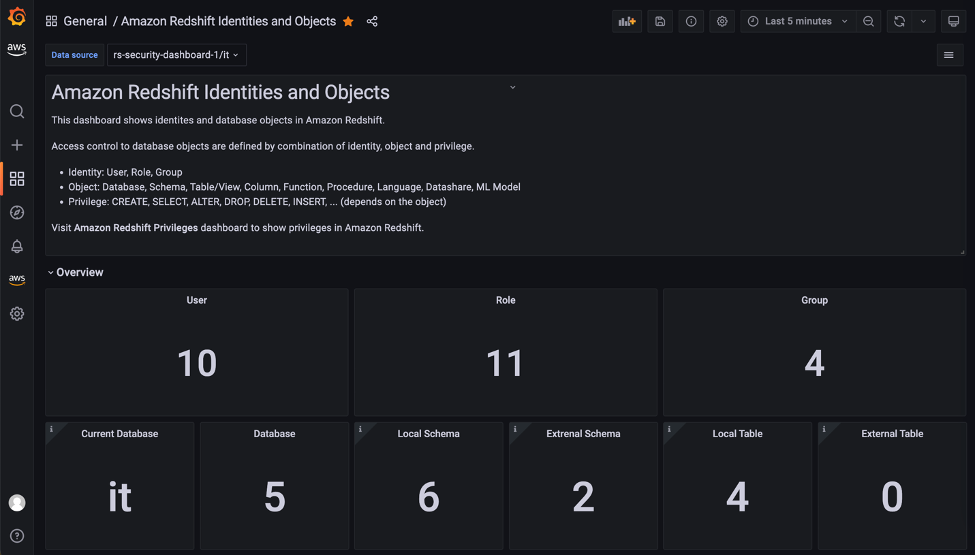
The Amazon Redshift Identities and Objects dashboard shows identites and database objects in Amazon Redshift, as shown in the following screenshot.

The Identities section shows the detail of each user, role, and group in the source database.

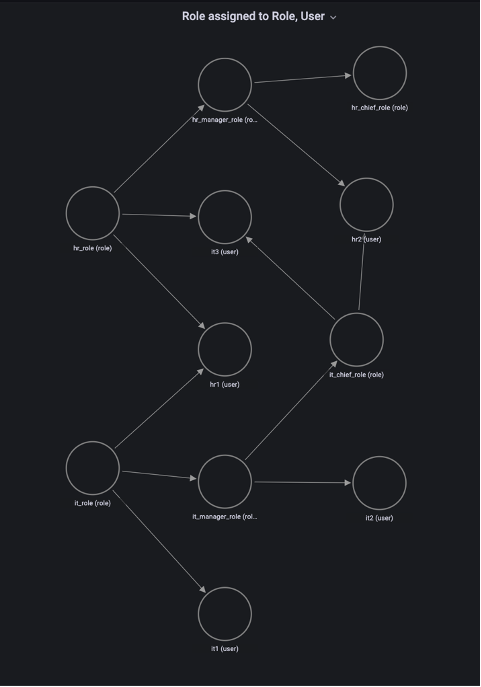
One of the key features in this dashboard is the Role assigned to Role, User section, which uses a node graph panel to visualize the hierarchical structure of roles and users from multiple system tables. This visualization can help administrators quickly examine which roles are inherited to users instead of querying multiple system tables. For more information about role-based access, refer to Role-based access control (RBAC).

Amazon Redshift Privileges dashboard

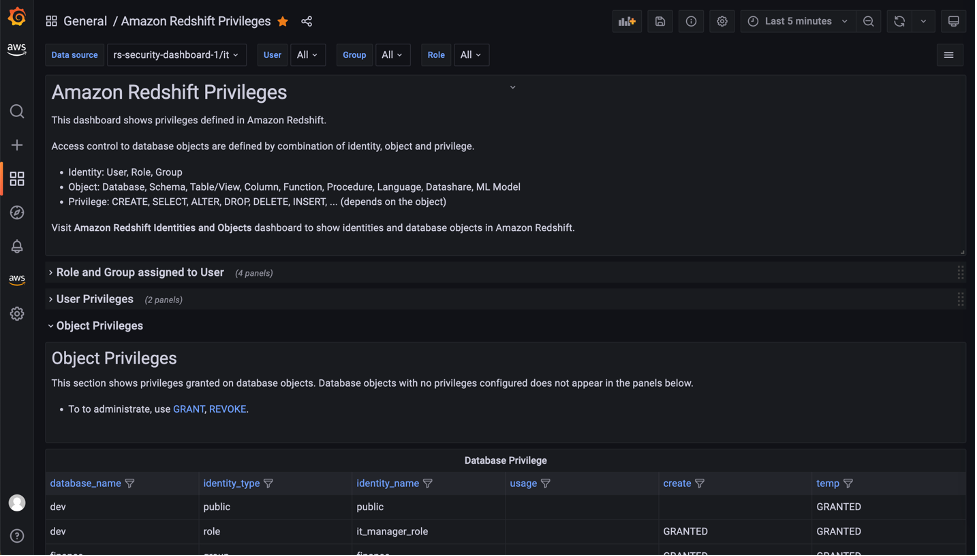
The Amazon Redshift Privileges dashboard shows privileges defined in Amazon Redshift.

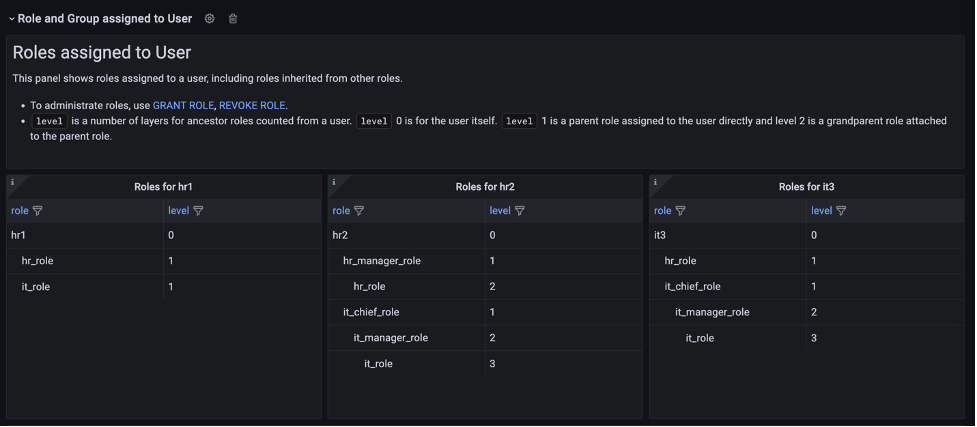
In the Role and Group assigned to User section, open the Role assigned to User panel to list the roles for a specific user. In this panel, you can list and compare roles assigned to multiple users. Use the User drop-down at the top of the dashboard to select users.

The dashboard will refresh immediately and show filtered result for selected users. Following screenshot is the filtered result for user hr1, hr2 and it3.

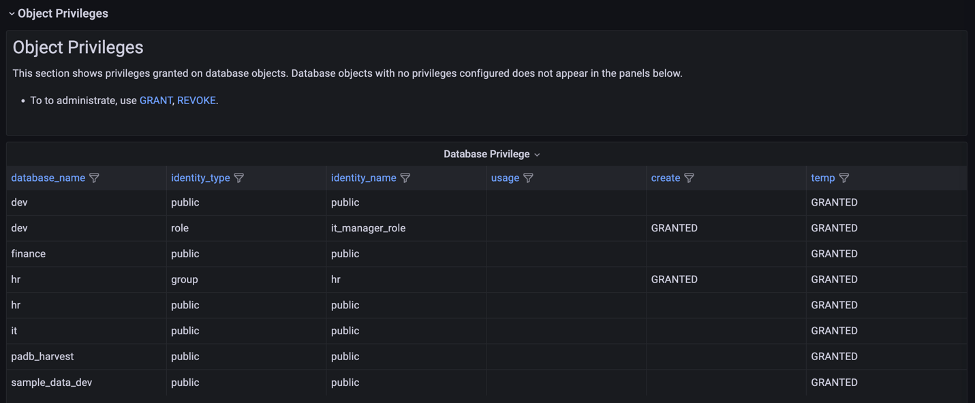
The Object Privileges section shows the privileges granted for each database object and identity. Note that objects with no privileges granted are not listed here. To show the full list of database objects, use the Amazon Redshift Identities and Objects dashboard.

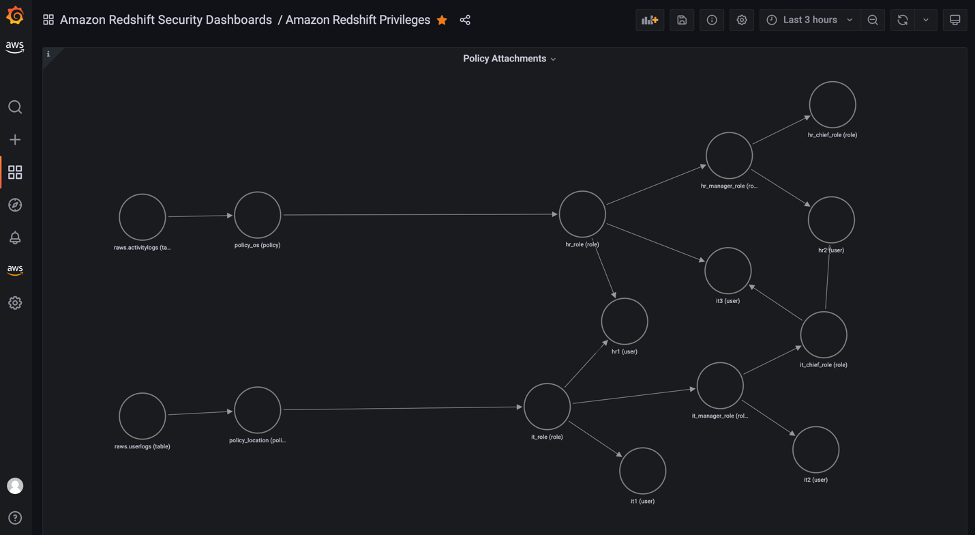
The Object Privileges (RLS) section contains visualizations for row-level security (RLS). The Policy attachments panel enables you to examine RLS configuration by visualizing relation between of tables, policies, roles and users.

Conclusion

In this post, we introduced a visualization for database privileges of Amazon Redshift using predefined Grafana dashboards. Database administrators can use these dashboards to quickly navigate through identities, objects, and privileges without writing SQL. You can also customize the dashboard to meet your business requirements. The JSON definition file of this dashboard is maintained as part of OSS in the Redshift data source for Grafana GitHub repository.

For more information about the topics described to in this post, refer to the following:


About the author

Yota Hamaoka is an Analytics Solution Architect at Amazon Web Services. He is focused on driving customers to accelerate their analytics journey with Amazon Redshift.

Query and visualize Amazon Redshift operational metrics using the Amazon Redshift plugin for Grafana

Post Syndicated from Sergey Konoplev original https://aws.amazon.com/blogs/big-data/query-and-visualize-amazon-redshift-operational-metrics-using-the-amazon-redshift-plugin-for-grafana/

Grafana is a rich interactive open-source tool by Grafana Labs for visualizing data across one or many data sources. It’s used in a variety of modern monitoring stacks, allowing you to have a common technical base and apply common monitoring practices across different systems. Amazon Managed Grafana is a fully managed, scalable, and secure Grafana-as-a-service solution developed by AWS in collaboration with Grafana Labs.

Amazon Redshift is the most widely used data warehouse in the cloud. You can view your Amazon Redshift cluster’s operational metrics on the Amazon Redshift console, use AWS CloudWatch, and query Amazon Redshift system tables directly from your cluster. The first two options provide a set of predefined general metrics and visualizations. The last one allows you to use the flexibility of SQL to get deep insights into the details of the workload. However, querying system tables requires knowledge of system table structures. To address that, we came up with a consolidated Amazon Redshift Grafana dashboard that visualizes a set of curated operational metrics and works on top of the Amazon Redshift Grafana data source. You can easily add it to an Amazon Managed Grafana workspace, as well as to any other Grafana deployments where the data source is installed.

This post guides you through a step-by-step process to create an Amazon Managed Grafana workspace and configure an Amazon Redshift cluster with a Grafana data source for it. Lastly, we show you how to set up the Amazon Redshift Grafana dashboard to visualize the cluster metrics.

Solution overview

The following diagram illustrates the solution architecture.

Architecture Diagram

The solution includes the following components:

  • The Amazon Redshift cluster to get the metrics from.
  • Amazon Managed Grafana, with the Amazon Redshift data source plugin added to it. Amazon Managed Grafana communicates with the Amazon Redshift cluster via the Amazon Redshift Data Service API.
  • The Grafana web UI, with the Amazon Redshift dashboard using the Amazon Redshift cluster as the data source. The web UI communicates with Amazon Managed Grafana via an HTTP API.

We walk you through the following steps during the configuration process:

  1. Configure an Amazon Redshift cluster.
  2. Create a database user for Amazon Managed Grafana on the cluster.
  3. Configure a user in AWS Single Sign-On (AWS SSO) for Amazon Managed Grafana UI access.
  4. Configure an Amazon Managed Grafana workspace and sign in to Grafana.
  5. Set up Amazon Redshift as the data source in Grafana.
  6. Import the Amazon Redshift dashboard supplied with the data source.

Prerequisites

To follow along with this walkthrough, you should have the following prerequisites:

  • An AWS account
  • Familiarity with the basic concepts of the following services:
    • Amazon Redshift
    • Amazon Managed Grafana
    • AWS SSO

Configure an Amazon Redshift cluster

If you don’t have an Amazon Redshift cluster, create a sample cluster before proceeding with the following steps. For this post, we assume that the cluster identifier is called redshift-demo-cluster-1 and the admin user name is awsuser.

  1. On the Amazon Redshift console, choose Clusters in the navigation pane.
  2. Choose your cluster.
  3. Choose the Properties tab.

Redshift Cluster Properties

To make the cluster discoverable by Amazon Managed Grafana, you must add a special tag to it.

  1. Choose Add tags. Redshift Cluster Tags
  2. For Key, enter GrafanaDataSource.
  3. For Value, enter true.
  4. Choose Save changes.

Redshift Cluster Tags

Create a database user for Amazon Managed Grafana

Grafana will be directly querying the cluster, and it requires a database user to connect to the cluster. In this step, we create the user redshift_data_api_user and apply some security best practices.

  1. On the cluster details page, choose Query data and Query in query editor v2.Query Editor v2
  2. Choose the redshift-demo-cluster-1 cluster we created previously.
  3. For Database, enter the default dev.
  4. Enter the user name and password that you used to create the cluster.
  5. Choose Create connection.Redshift SU
  6. In the query editor, enter the following statements and choose Run:
CREATE USER redshift_data_api_user PASSWORD '<password>' CREATEUSER;
ALTER USER redshift_data_api_user SET readonly TO TRUE;
ALTER USER redshift_data_api_user SET query_group TO 'superuser';

The first statement creates a user with superuser privileges necessary to access system tables and views (make sure to use a unique password). The second prohibits the user from making modifications. The last statement isolates the queries the user can run to the superuser queue, so they don’t interfere with the main workload.

In this example, we use service managed permissions in Amazon Managed Grafana and a workspace AWS Identity and Access Management (IAM) role as an authentication provider in the Amazon Redshift Grafana data source. We create the database user redshift_data_api_user using the AmazonGrafanaRedshiftAccess policy.

Configure a user in AWS SSO for Amazon Managed Grafana UI access

Two authentication methods are available for accessing Amazon Managed Grafana: AWS SSO and SAML. In this example, we use AWS SSO.

  1. On the AWS SSO console, choose Users in the navigation pane.
  2. Choose Add user.
  3. In the Add user section, provide the required information.

SSO add user

In this post, we select Send an email to the user with password setup instructions. You need to be able to access the email address you enter because you use this email further in the process.

  1. Choose Next to proceed to the next step.
  2. Choose Add user.

An email is sent to the email address you specified.

  1. Choose Accept invitation in the email.

You’re redirected to sign in as a new user and set a password for the user.

  1. Enter a new password and choose Set new password to finish the user creation.

Configure an Amazon Managed Grafana workspace and sign in to Grafana

Now you’re ready to set up an Amazon Managed Grafana workspace.

  1. On the Amazon Grafana console, choose Create workspace.
  2. For Workspace name, enter a name, for example grafana-demo-workspace-1.
  3. Choose Next.
  4. For Authentication access, select AWS Single Sign-On.
  5. For Permission type, select Service managed.
  6. Chose Next to proceed.AMG Workspace configure
  7. For IAM permission access settings, select Current account.AMG permission
  8. For Data sources, select Amazon Redshift.
  9. Choose Next to finish the workspace creation.Redshift to workspace

You’re redirected to the workspace page.

Next, we need to enable AWS SSO as an authentication method.

  1. On the workspace page, choose Assign new user or group.SSO new user
  2. Select the previously created AWS SSO user under Users and Select users and groups tables.SSO User

You need to make the user an admin, because we set up the Amazon Redshift data source with it.

  1. Select the user from the Users list and choose Make admin.
  2. Go back to the workspace and choose the Grafana workspace URL link to open the Grafana UI.AMG workspace
  3. Sign in with the user name and password you created in the AWS SSO configuration step.

Set up an Amazon Redshift data source in Grafana

To visualize the data in Grafana, we need to access the data first. To do so, we must create a data source pointing to the Amazon Redshift cluster.

  1. On the navigation bar, choose the lower AWS icon (there are two) and then choose Redshift from the list.
  2. For Regions, choose the Region of your cluster.
  3. Select the cluster from the list and choose Add 1 data source.Choose Redshift Cluster
  4. On the Provisioned data sources page, choose Go to settings.
  5. For Name, enter a name for your data source.
  6. By default, Authentication Provider should be set as Workspace IAM Role, Default Region should be the Region of your cluster, and Cluster Identifier should be the name of the chosen cluster.
  7. For Database, enter dev.
  8. For Database User, enter redshift_data_api_user.
  9. Choose Save & Test.Settings for Data Source

A success message should appear.

Data source working

Import the Amazon Redshift dashboard supplied with the data source

As the last step, we import the default Amazon Redshift dashboard and make sure that it works.

  1. In the data source we just created, choose Dashboards on the top navigation bar and choose Import to import the Amazon Redshift dashboard.Dashboards in the plugin
  2. Under Dashboards on the navigation sidebar, choose Manage.
  3. In the dashboards list, choose Amazon Redshift.

The dashboard appear, showing operational data from your cluster. When you add more clusters and create data sources for them in Grafana, you can choose them from the Data source list on the dashboard.

Clean up

To avoid incurring unnecessary charges, delete the Amazon Redshift cluster, AWS SSO user, and Amazon Managed Grafana workspace resources that you created as part of this solution.

Conclusion

In this post, we covered the process of setting up an Amazon Redshift dashboard working under Amazon Managed Grafana with AWS SSO authentication and querying from the Amazon Redshift cluster under the same AWS account. This is just one way to create the dashboard. You can modify the process to set it up with SAML as an authentication method, use custom IAM roles to manage permissions with more granularity, query Amazon Redshift clusters outside of the AWS account where the Grafana workspace is, use an access key and secret or AWS Secrets Manager based connection credentials in data sources, and more. You can also customize the dashboard by adding or altering visualizations using the feature-rich Grafana UI.

Because the Amazon Redshift data source plugin is an open-source project, you can install it in any Grafana deployment, whether it’s in the cloud, on premises, or even in a container running on your laptop. That allows you to seamlessly integrate Amazon Redshift monitoring into virtually all your existing Grafana-based monitoring stacks.

For more details about the systems and processes described in this post, refer to the following:


About the Authors

Sergey Konoplev is a Senior Database Engineer on the Amazon Redshift team. Sergey has been focusing on automation and improvement of database and data operations for more than a decade.

Milind Oke is a Data Warehouse Specialist Solutions Architect based out of New York. He has been building data warehouse solutions for over 15 years and specializes in Amazon Redshift.