Post Syndicated from Yota Hamaoka original https://aws.amazon.com/blogs/big-data/visualize-database-privileges-on-amazon-redshift-using-grafana/
Amazon Redshift is a fully managed, petabyte-scale data warehouse service in the cloud. Amazon Redshift enables you to use SQL for analyzing structured and semi-structured data with best price performance along with secure access to the data.
As more users start querying data in a data warehouse, access control is paramount to protect valuable organizational data. Database administrators want to continuously monitor and manage user privileges to maintain proper data access in the data warehouse. Amazon Redshift provides granular access control on the database, schema, table, column, row, and other database objects by granting privileges to roles, groups, and users from a SQL interface. To monitor privileges configured in Amazon Redshift, you can retrieve them by querying system tables.
Although Amazon Redshift provides a broad capability of managing access to database objects, we have heard from customers that they want to visualize and monitor privileges without using a SQL interface. In this post, we introduce predefined dashboards using Grafana which visualizes database privileges without writing SQL. This dashboard will help database administrators to reduce the time spent on database administration and increase the frequency of monitoring cycles.
Database security in Amazon Redshift
Security is the top priority at AWS. Amazon Redshift provides four levels of control:
- Cluster management
- Cluster connectivity
- Database access
- Temporary database credentials and single sign-on
This post focuses on database access, which relates to user access control against database objects. For more information, see Managing database security.
Amazon Redshift uses the GRANT command to define permissions in the database. For most database objects, GRANT takes three parameters:
- Identity – The entity you grant access to. This could be a user, role, or group.
- Object – The type of database object. This could be a database, schema, table or view, column, row, function, procedure, language, datashare, machine leaning (ML) model, and more.
- Privilege – The type of operation. Examples include CREATE, SELECT, ALTER, DROP, DELETE, and INSERT. The level of privilege depends on the object.
To remove access, use the REVOKE command.
Additionally, Amazon Redshift offers granular access control with the Row-level security (RLS) feature. You can attach or detach RLS policies to identities with the ATTACH RLS POLICY and DETACH RLS POLICY commands, respectively. See RLS policy ownership and management for more details.
Generally, database administrator monitors and reviews the identities, objects, and privileges periodically to ensure proper access is configured. They also need to investigate access configurations if database users face permission errors. These tasks require a SQL interface to query multiple system tables, which can be a repetitive and undifferentiated operation. Therefore, database administrators need a single pane of glass to quickly navigate through identities, objects, and privileges without writing SQL.
Solution overview
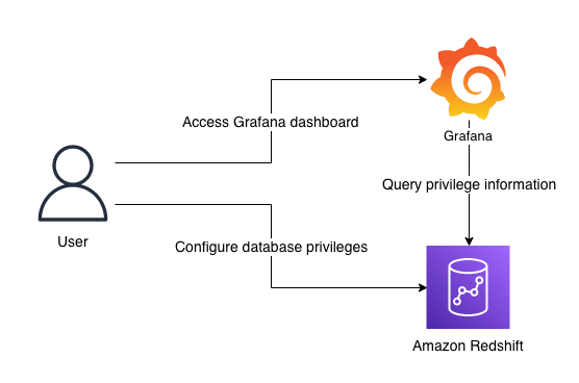
The following diagram illustrates the solution architecture and its key components:
- Amazon Redshift contains database privilege information in system tables.
- Grafana provides a predefined dashboard to visualize database privileges. The dashboard runs queries against the Amazon Redshift system table via the Amazon Redshift Data API.
Note that the dashboard focuses on visualization. SQL interface is required to configure privileges in Amazon Redshift. You can use query editor v2, a web-based SQL interface which enables users to run SQL commands from a browser.
Prerequisites
Before moving to the next section, you should have the following prerequisites:
- An AWS account
- Create an Amazon Redshift cluster
- Setup Amazon Managed Grafana or local Grafana
- To setup with Amazon Managed Grafana, go through the following sections in Query and visualize Amazon Redshift operational metrics using the Amazon Redshift plugin for Grafana:
- Configure an Amazon Redshift cluster
- Configure an Amazon Managed Grafana workspace and sign in to Grafana
- Create a database user for Amazon Managed Grafana
- Configure a user in AWS SSO for Amazon Managed Grafana UI access
- Configure an Amazon Managed Grafana workspace and sign in to Grafana
- Set up an Amazon Redshift data source in Grafana
- To setup with local Grafana, first install Grafana following the official setup documentation. Next, go through the following sections in Query and visualize Amazon Redshift operational metrics using the Amazon Redshift plugin for Grafana:
- Create a database user for Amazon Managed Grafana
- Set up an Amazon Redshift data source in Grafana
- To setup with Amazon Managed Grafana, go through the following sections in Query and visualize Amazon Redshift operational metrics using the Amazon Redshift plugin for Grafana:
While Amazon Managed Grafana controls the plugin version and updates periodically, local Grafana allows user to control the version. Therefore, local Grafana could be an option if you need earlier access for the latest features. Refer to plugin changelog for released features and versions.
Import the dashboards
After you have finished the prerequisites, you should have access to Grafana configured with Amazon Redshift as a data source. Next, import two dashboards for visualization.
- In Grafana console, go to the created Redshift data source and click Dashboards
- Import the Amazon Redshift Identities and Objects
- Go to the data source again and import the Amazon Redshift Privileges
Each dashboard will appear once imported.
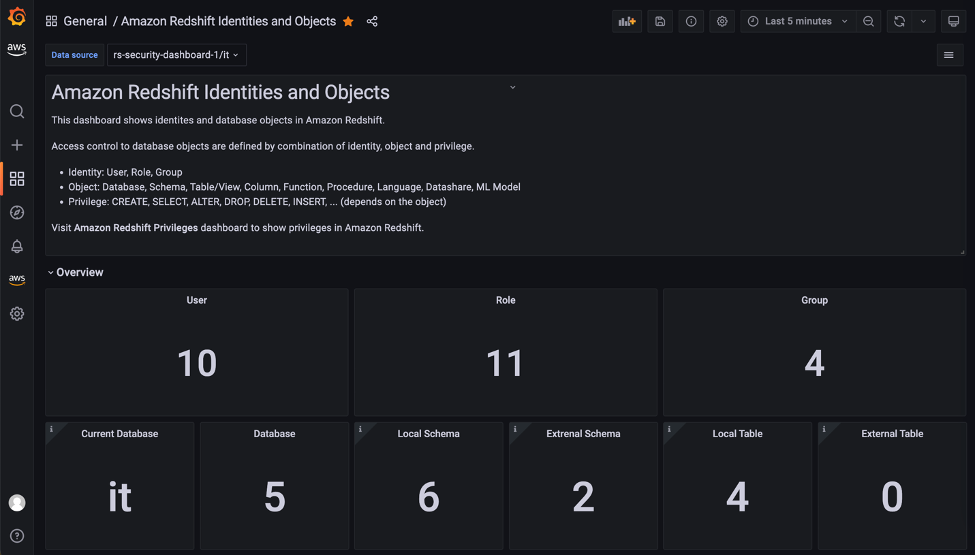
Amazon Redshift Identities and Objects dashboard
The Amazon Redshift Identities and Objects dashboard shows identites and database objects in Amazon Redshift, as shown in the following screenshot.
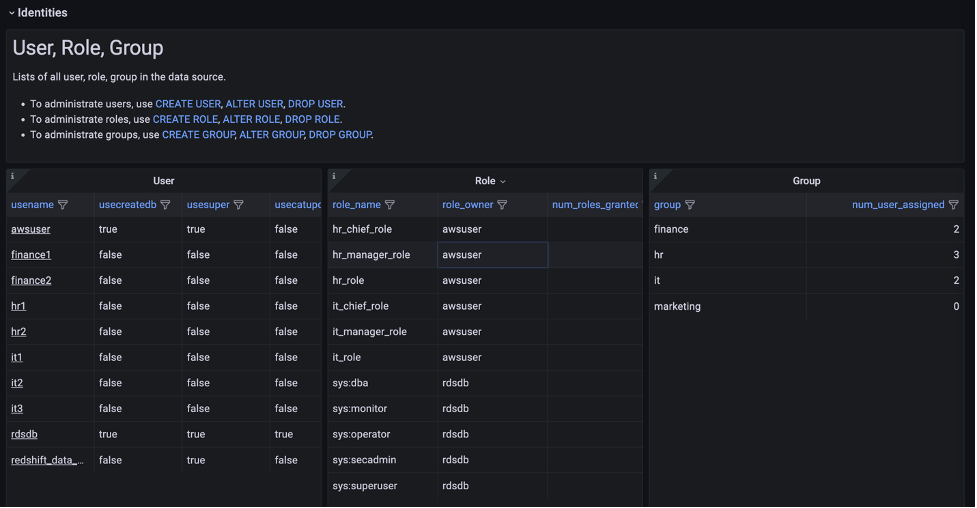
The Identities section shows the detail of each user, role, and group in the source database.
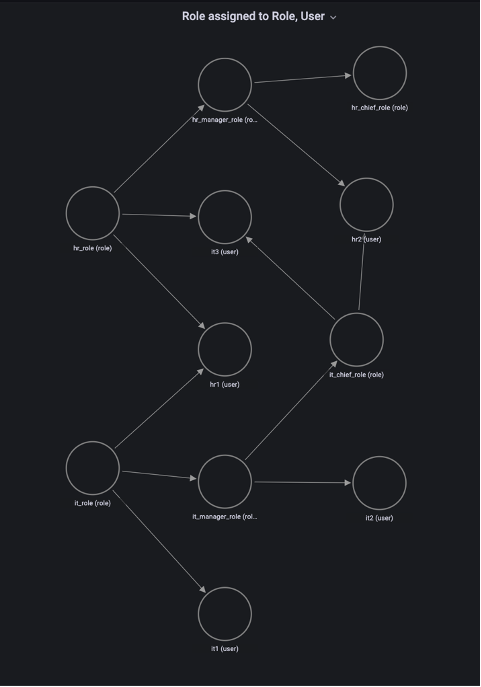
One of the key features in this dashboard is the Role assigned to Role, User section, which uses a node graph panel to visualize the hierarchical structure of roles and users from multiple system tables. This visualization can help administrators quickly examine which roles are inherited to users instead of querying multiple system tables. For more information about role-based access, refer to Role-based access control (RBAC).
Amazon Redshift Privileges dashboard
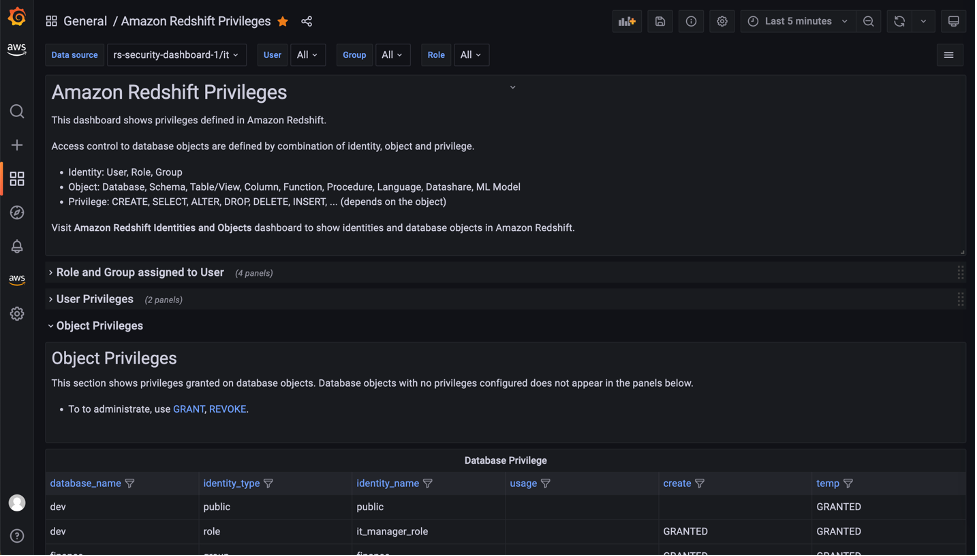
The Amazon Redshift Privileges dashboard shows privileges defined in Amazon Redshift.
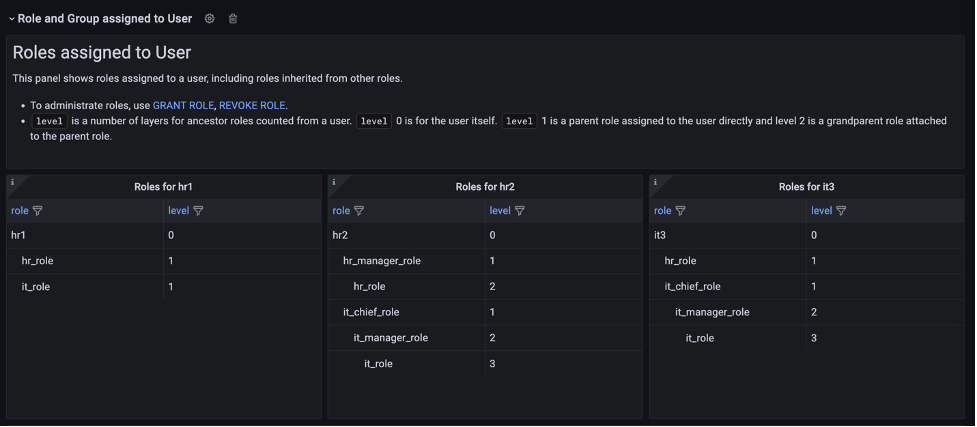
In the Role and Group assigned to User section, open the Role assigned to User panel to list the roles for a specific user. In this panel, you can list and compare roles assigned to multiple users. Use the User drop-down at the top of the dashboard to select users.
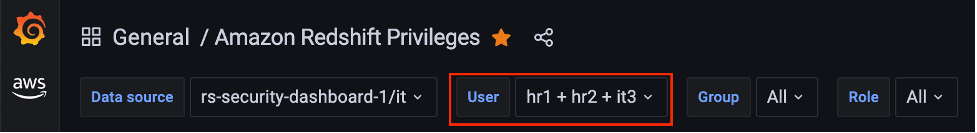
The dashboard will refresh immediately and show filtered result for selected users. Following screenshot is the filtered result for user hr1, hr2 and it3.
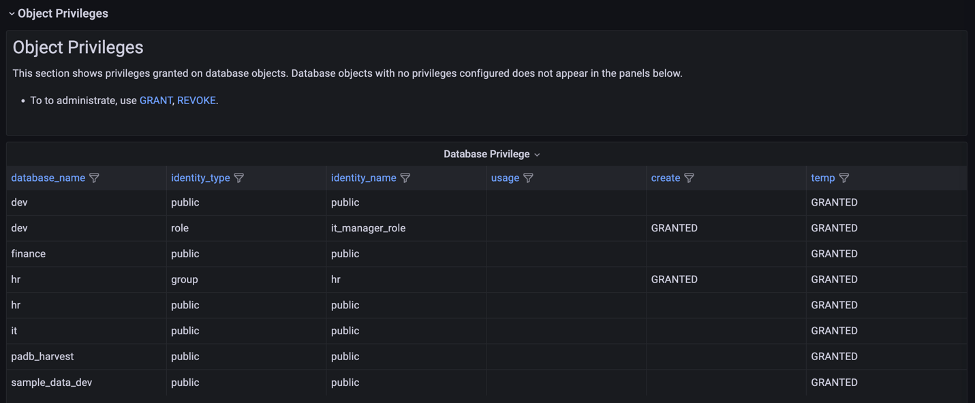
The Object Privileges section shows the privileges granted for each database object and identity. Note that objects with no privileges granted are not listed here. To show the full list of database objects, use the Amazon Redshift Identities and Objects dashboard.
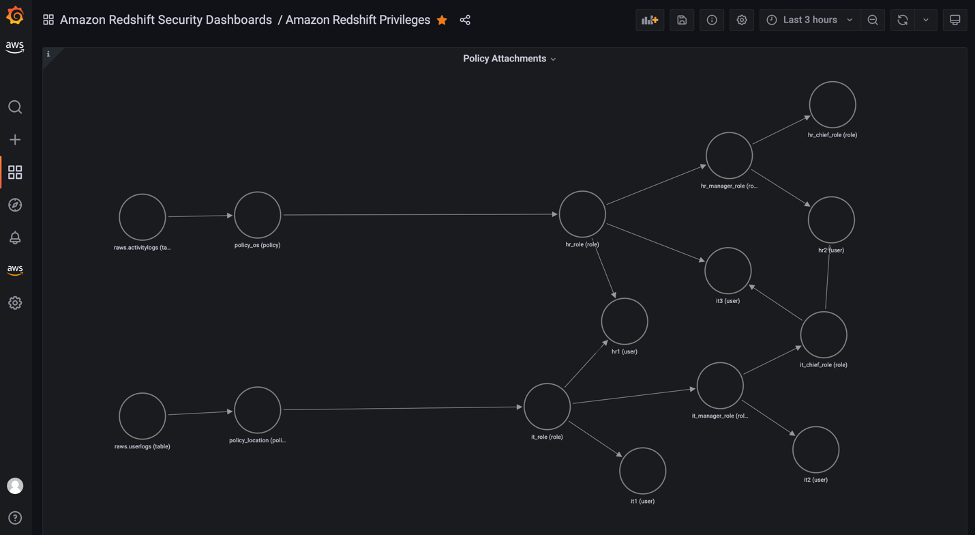
The Object Privileges (RLS) section contains visualizations for row-level security (RLS). The Policy attachments panel enables you to examine RLS configuration by visualizing relation between of tables, policies, roles and users.
Conclusion
In this post, we introduced a visualization for database privileges of Amazon Redshift using predefined Grafana dashboards. Database administrators can use these dashboards to quickly navigate through identities, objects, and privileges without writing SQL. You can also customize the dashboard to meet your business requirements. The JSON definition file of this dashboard is maintained as part of OSS in the Redshift data source for Grafana GitHub repository.
For more information about the topics described to in this post, refer to the following:
- Redshift data source for Grafana document
- Redshift data source for Grafana GitHub repository
- Monitor all your Redshift clusters in Grafana with the new Amazon Redshift data source plugin
- Query and visualize Amazon Redshift operational metrics using the Amazon Redshift plugin for Grafana
About the author

Yota Hamaoka is an Analytics Solution Architect at Amazon Web Services. He is focused on driving customers to accelerate their analytics journey with Amazon Redshift.


 Milind Oke is a Data Warehouse Specialist Solutions Architect based out of New York. He has been building data warehouse solutions for over 15 years and specializes in Amazon Redshift.