Post Syndicated from Shibu Nair original https://aws.amazon.com/blogs/architecture/boosting-resiliency-with-an-ml-based-telemetry-analytics-architecture/
Data proliferation has become a norm and as organizations become more data driven, automating data pipelines that enable data ingestion, curation, and processing is vital. Since many organizations have thousands of time-bound, automated, complex pipelines, monitoring their telemetry information is critical. Keeping track of telemetry data helps businesses monitor and recover their pipelines faster which results in better customer experiences.
In our blog post, we explain how you can collect telemetry from your data pipeline jobs and use machine learning (ML) to build a lower- and upper-bound threshold to help operators identify anomalies in near-real time.
The applications of anomaly detection on telemetry data from job pipelines are wide-ranging, including these and more:
- Detecting abnormal runtimes
- Detecting jobs running slower than expected
- Proactive monitoring
- Notifications
Key tenets of telemetry analytics
There are five key tenets of telemetry analytics, as in Figure 1.

Figure 1. Key tenets of telemetry analytics
The key tenets for near real-time telemetry analytics for data pipelines are:
- Collecting the metrics
- Aggregating the metrics
- Identify anomaly
- Notify and resolve issues
- Persist for compliance reasons, historical trend analysis, and to visualize
This blog post describes how customers can easily implement these steps by using AWS native no-code, low-code (AWS LCNC) solutions.
ML-based telemetry analytics solution architecture
The architecture defined here helps customers incrementally enable features with AWS LCNC solutions by leveraging AWS managed services to avoid the overhead of infrastructure provisioning. Most of the steps are configurations of the features provided by AWS services. This enables customers to make their applications resilient by tracking and resolving anomalies in near real time, as in Figure 2.
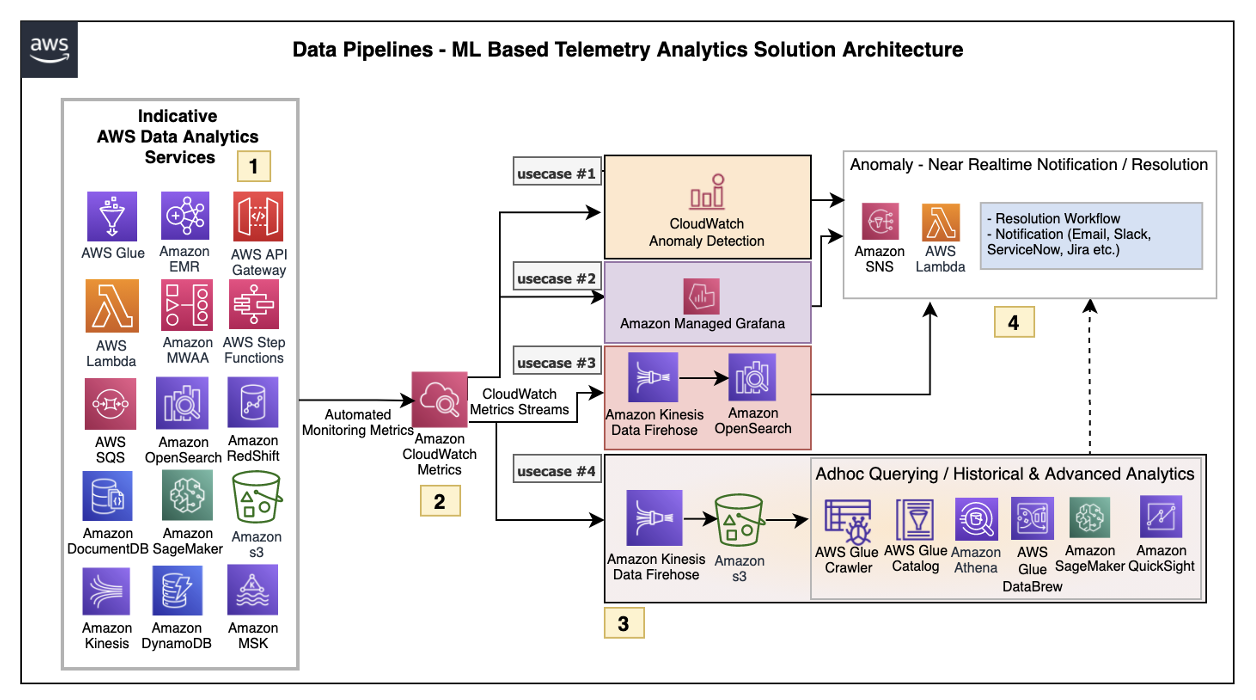
Figure 2. ML-based telemetry analytics solution architecture
Let’s explore each of the architecture steps in detail.
1. Indicative AWS data analytics services: Choose from a broad range of AWS analytics services, including data movement, data storage, data lakes, big data analytics, log analytics, and streaming analytics to business intelligence, ML, and beyond. This diagram shows a subset of these data analytics services. You may use one or a combination of many, depending on your use case.
2. Amazon CloudWatch metrics for telemetry analytics: Collecting and visualizing real-time logs, metrics, and event data is a key step in any process. CloudWatch helps you accomplish these tasks without any infrastructure provisioning. Almost every AWS data analytics service is integrated with CloudWatch to enable automatic capturing of the detailed metrics needed for telemetry analytics.
3. Near real-time use case examples: Step three presents practical, near real-time use cases that represent a range of real-world applications, one or more of which may apply to your own business needs.
Use case 1: Anomaly detection
CloudWatch provides the functionality to apply anomaly detection for a metric. The key business use case of this feature is to apply statistical and ML algorithms on a per-metrics basis of business critical applications to proactively identify issues and raise alarms.
The focus is on a single set of metrics that will be important for the application’s functioning—for example, AWS Lambda metrics of a 24/7 credit card company’s fraud monitoring application.
Use case 2: Unified metrics using Amazon Managed Grafana
For proper insights into telemetry data, it is important to unify metrics and collaboratively identify and troubleshoot issues in analytical systems. Amazon Managed Grafana helps to visualize, query, and corelate metrics from CloudWatch in near real-time.
For example, Amazon Managed Grafana can be used to monitor container metrics for Amazon EMR running on Amazon Elastic Kubernetes Service (Amazon EKS), which supports processing high-volume data from business critical Internet of Things (IoT) applications like connected factories, offsite refineries, wind farms, and more.
Use case 3: Combined business and metrics data using Amazon OpenSearch Service
Amazon OpenSearch Service provides the capability to perform near real-time, ML-based interactive log analytics, application monitoring, and search by combining business and telemetry data.
As an example, customers can combine AWS CloudTrail logs for AWS logins, Amazon Athena, and Amazon RedShift query access times with employee reference data to detect insider threats.
This log analytics use case architecture integrates into OpenSearch, as in Figure 3.

Figure 3. Log analytics use case architecture overview with OpenSearch
Use case 4: ML-based advanced analytics
Using Amazon Simple Storage Service (Amazon S3) as data storage, data lake customers can tap into AWS analytics services such as the AWS Glue Catalog, AWS Glue DataBrew, and Athena for preparing and transforming data, as well as build trend analysis using ML models in Amazon SageMaker. This mechanism helps with performing ML-based advanced analytics to identify and resolve recurring issues.
4. Anomaly resolution: When an alert is generated either by CloudWatch alarm, OpenSearch, or Amazon Managed Grafana, you have the option to act on the alert in near-real time. Amazon Simple Notification Service (Amazon SNS) and Lambda can help build workflows. Lambda also helps integrate with ServiceNow ticket creation, Slack channel notifications, or other ticketing systems.
Simple data pipeline example
Let’s explore another practical example using an architecture that demonstrates how AWS Step Functions orchestrates Lambda, AWS Glue jobs, and crawlers.
To report an anomaly on AWS Glue jobs based on total number of records processed, you can leverage the glue.driver.aggregate.recordsRead CloudWatch metric and set up a CloudWatch alarm based on anomaly detection, Amazon SNS topic for notifications, and Lambda for resolution, as in Figure 4.
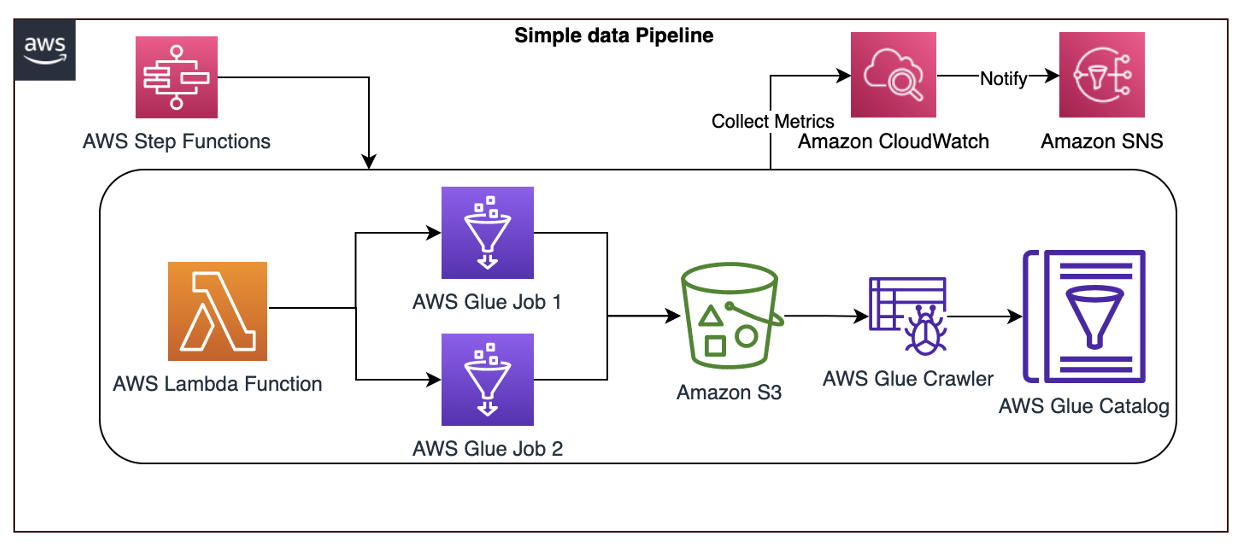
Figure 4. AWS Step Functions orchestrating Lamba, AWS Glue jobs, and crawlers
Here are the steps involved in the architecture proposed:
- CloudWatch automatically captures the metric
glue.driver.aggregate.recordsReadfrom AWS Glue jobs. - Customers set a CloudWatch alarm based on the anomaly detection of
glue.driver.aggregate.recordsReadmetric and set a notification to Amazon SNS topic. - CloudWatch applies a ML algorithm to the metric’s past data and creates a model of metric’s expected values.
- When the number of records increases significantly, the metric from the CloudWatch anomaly detection model notifies the Amazon SNS topic.
- Customers can notify an email group and trigger a Lambda function to resolve the issue, or create tickets in their operational monitoring system.
- Customers can also unify all the AWS Glue metrics using Amazon Managed Grafana. Using Amazon S3, data lake customers can crawl and catalog the data in the AWS Glue catalog and make it available for ad-hoc querying. Amazon SageMaker can be used for custom model training and inferencing.
Conclusion
In this blog post, we covered a recommended architecture to enable near-real time telemetry analytics for data pipelines, anomaly detection, notification, and resolution. This provides resiliency to the customer applications by proactively identifying and resolving issues.

