Security updates have been issued by Debian (webkit2gtk), Fedora (curl, dotnet6.0, dotnet7.0, ghostscript, kernel-headers, kernel-tools, libopenmpt, openssh, and samba), Mageia (virtualbox), Red Hat (java-1.8.0-openjdk and java-11-openjdk), and Scientific Linux (java-1.8.0-openjdk and java-11-openjdk).
In 2022, we launched the Radar Domain Rankings, with top lists of the most popular domains based on how people use the Internet globally. The lists are calculated using a machine learning model that uses aggregated 1.1.1.1 resolver data that is anonymized in accordance with our privacy commitments. While the top 100 list is updated daily for each location, typically the first results of that list are stable over time, with the big names such as Google, Facebook, Apple, Microsoft and TikTok leading. Additionally, these global big names appear for the majority of locations.
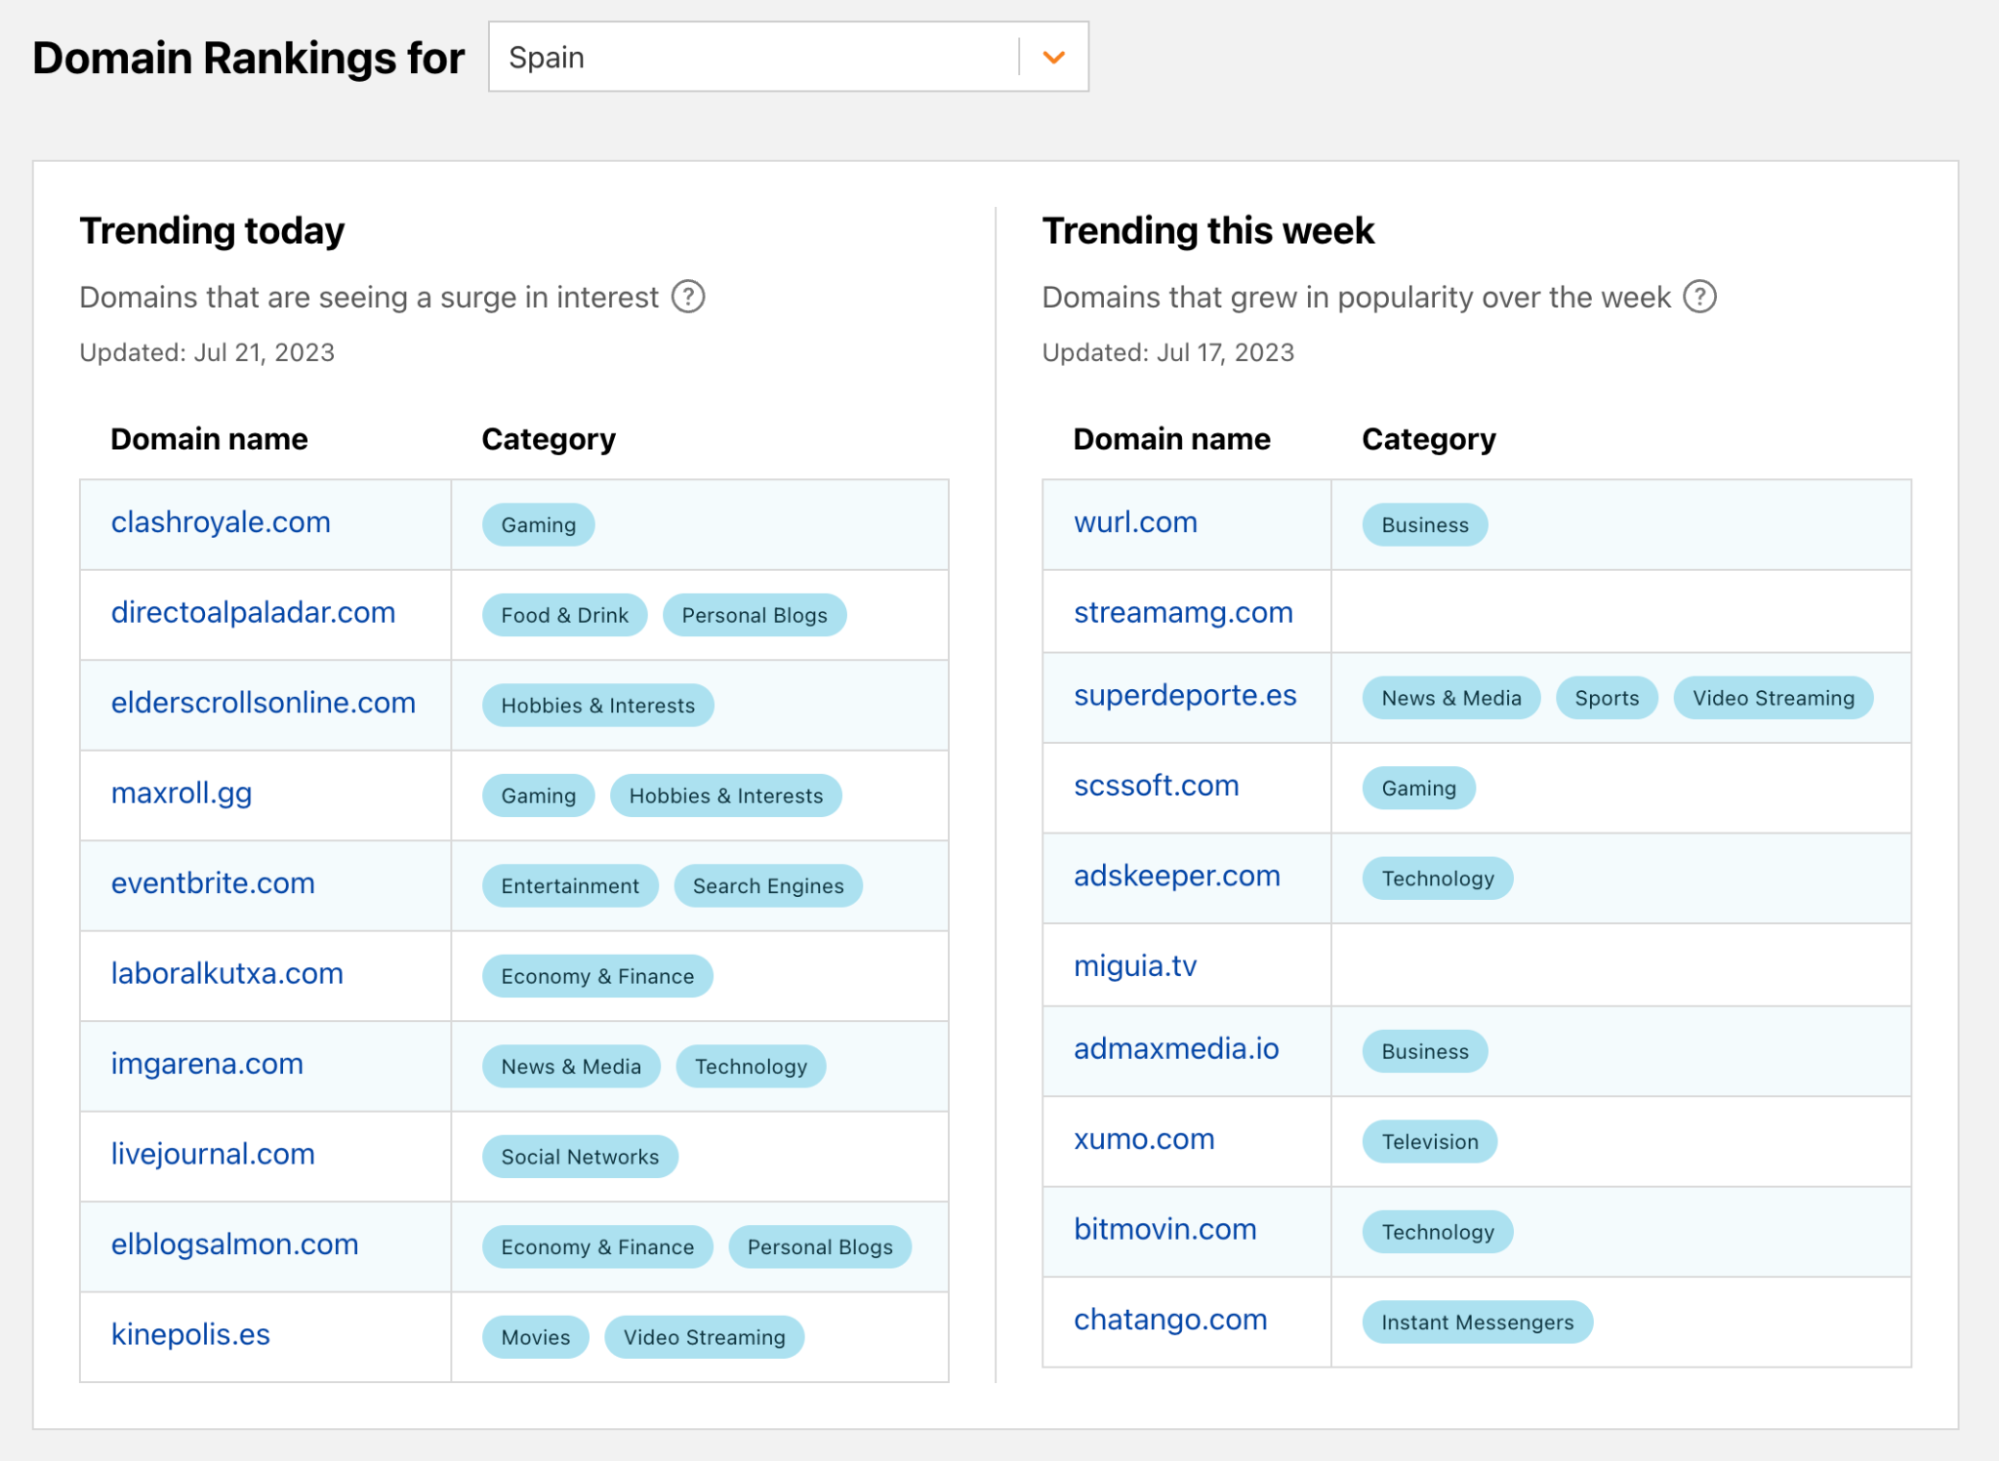
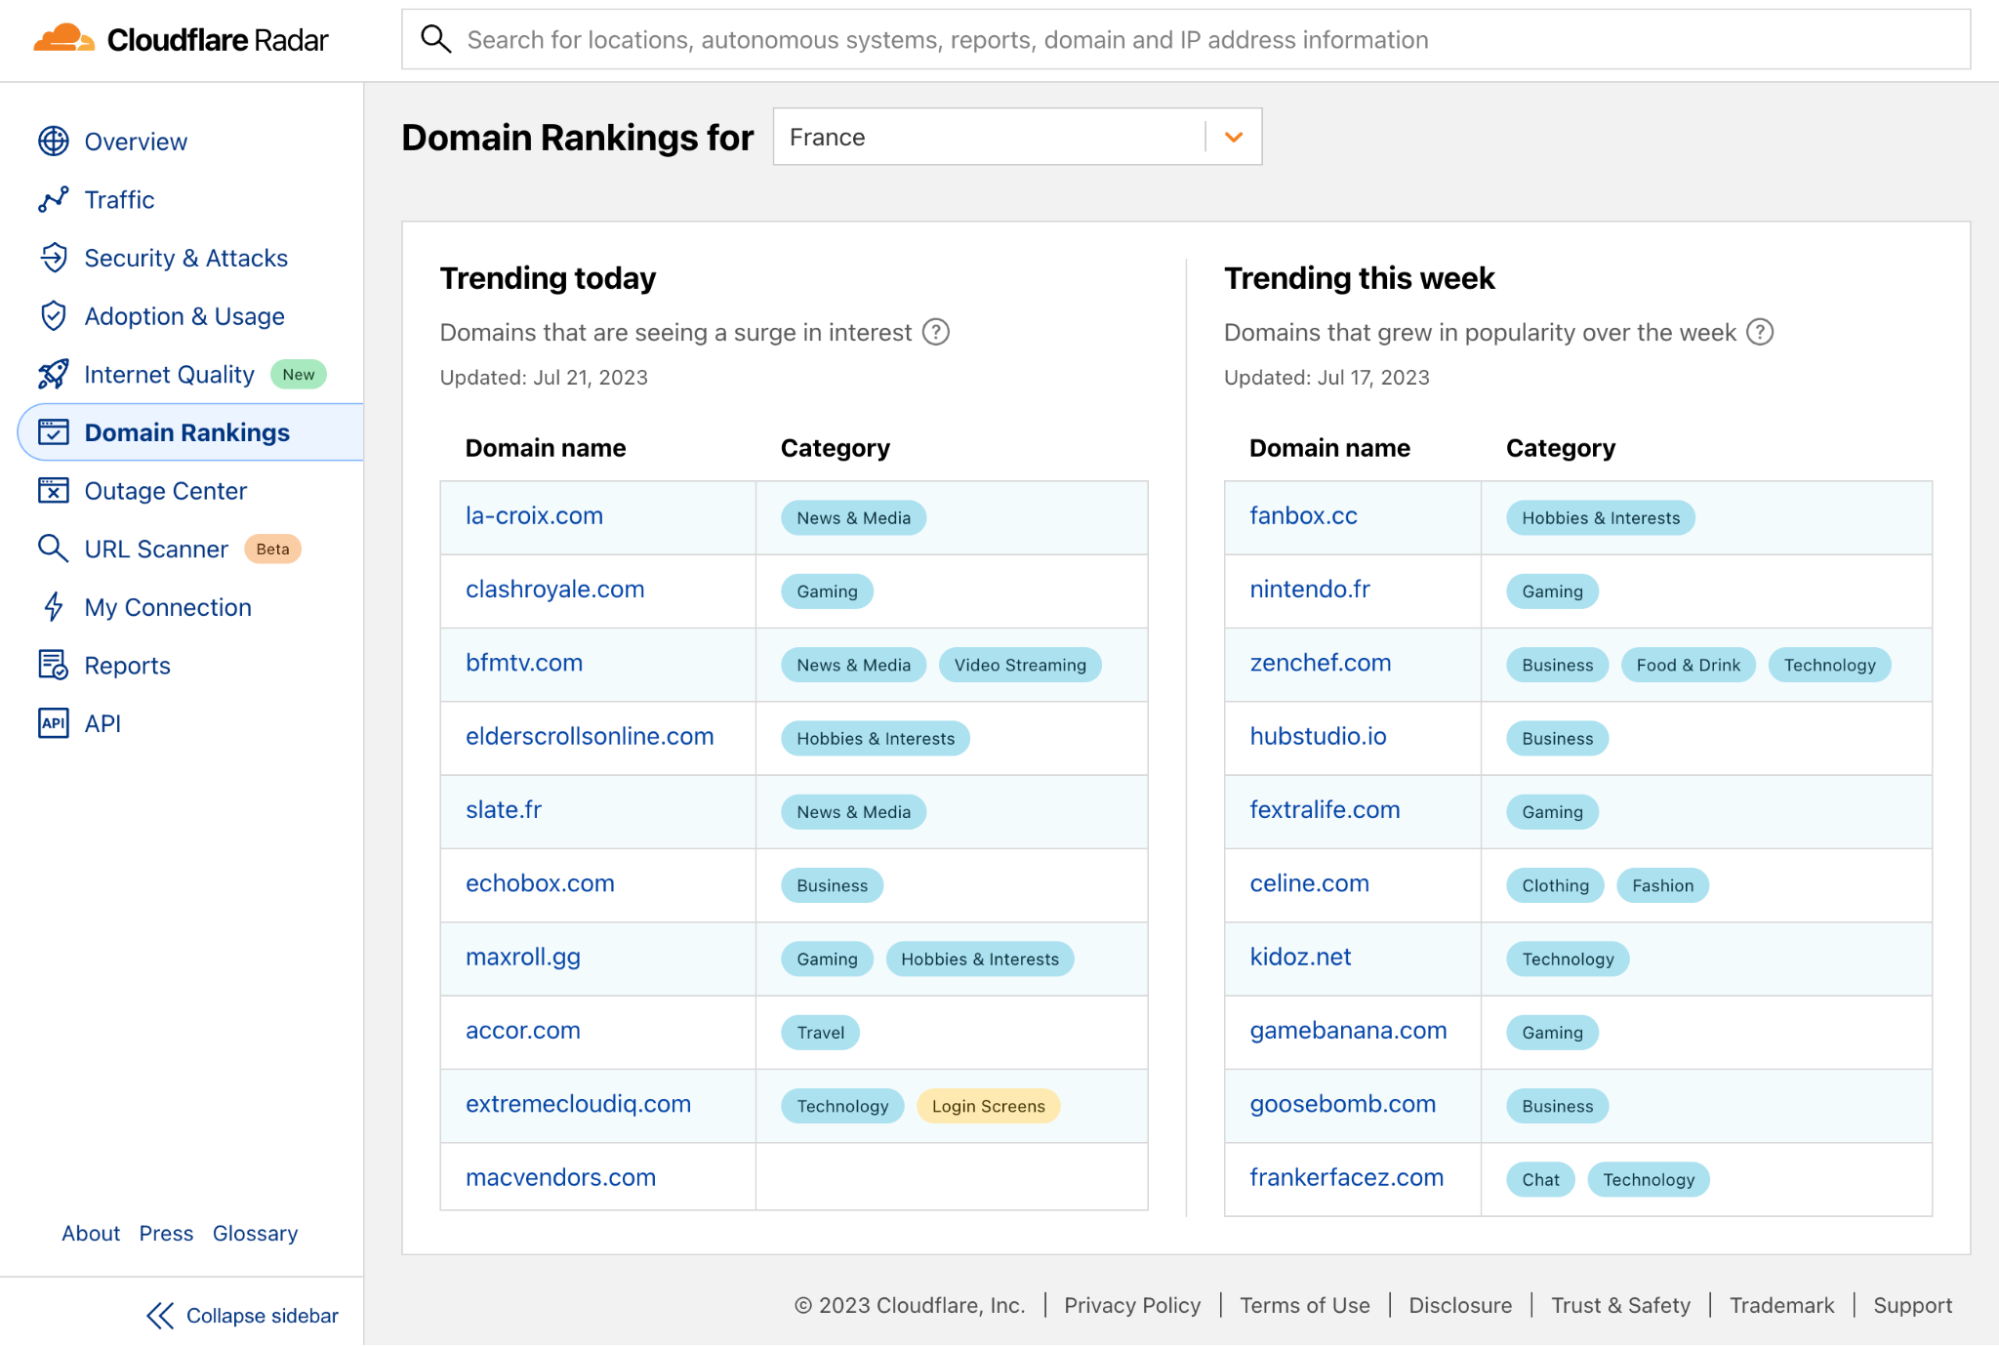
Today, we are improving our Domain Rankings page and adding Trending Domains lists. The new data shows which domains are currently experiencing an increase in popularity. Hence, while with the top popular domains we aim to show domains of broad appeal and of interest to many Internet users, with the trending domains we want to show domains that are generating a surge in interest.
How we generate the Trending Domains
When we started looking at the best way to generate a list of trending domains, we needed to answer the following questions:
What type of popularity changes do we want to capture?
What should we use as a baseline to calculate the change?
And how do we quantify it?
We soon realized that we needed two lists. One reflecting sudden increased interest related to a particular event or a topic, showing spikes in popularity in domains that jump in the ranking from one day to the next, and another one reflecting steady growth in popularity, showing domains that are increasing their user base over a longer period.
For this reason, we are launching both the Trending Today and Trending This Week top 10 lists to capture the two different types of popularity increase.
To select the baseline for calculating the increase in popularity, we analyzed the volatility of the Radar Domain Ranking list for different top list sizes. The advantage of starting with the Radar Ranking lists is that they already incorporate a good popularity metric that quantifies the estimated relative size of the user population that accesses a domain over some period of time. You can read more about how we define popularity in our “Goodbye, Alexa. Hello, Cloudflare Radar Domain Rankings” blog.
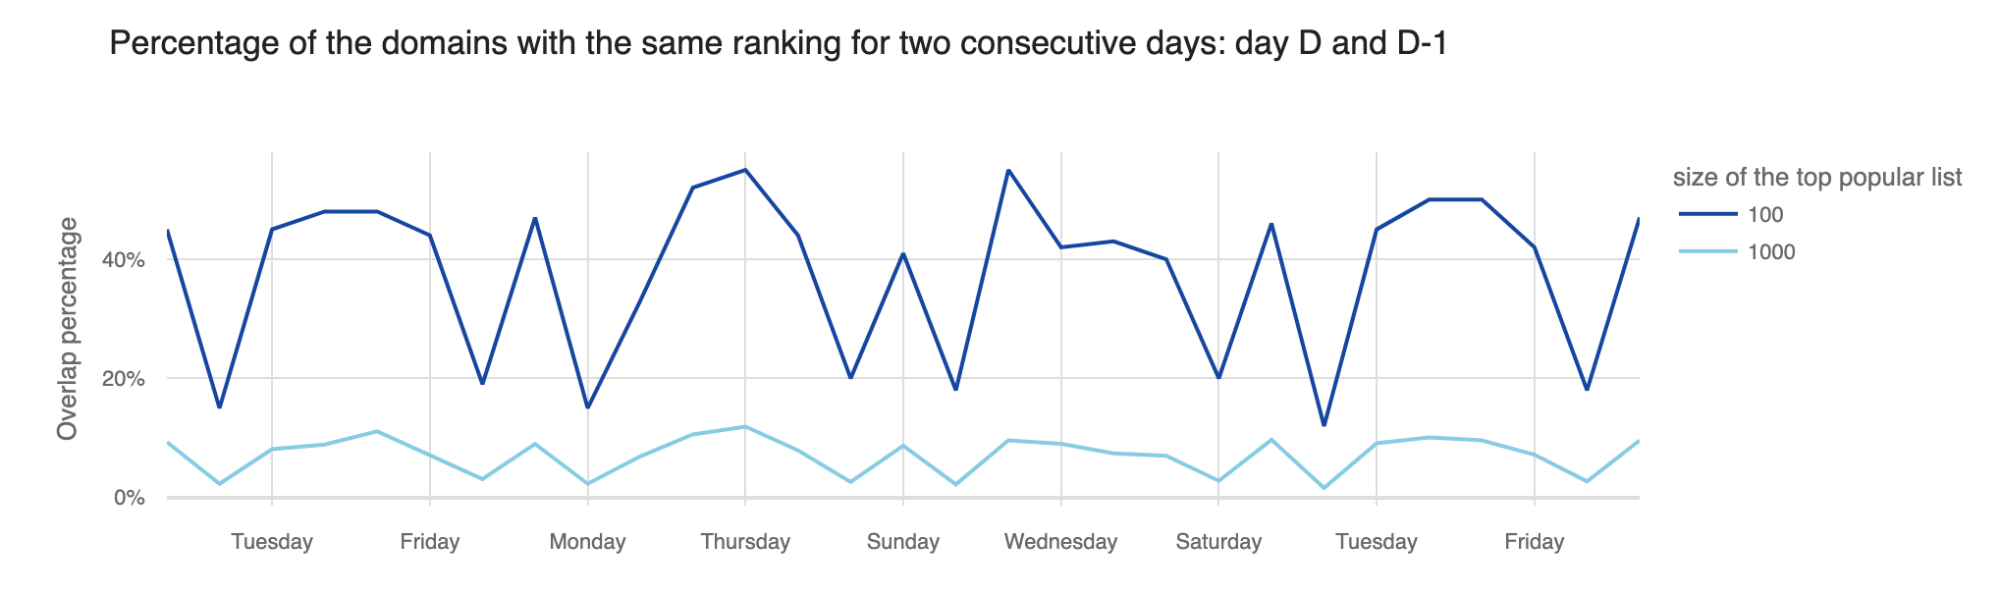
As expected, smaller list sizes were more stable, meaning the percentage of domains in the top 100 that changed the ranking from one day to the next was much lower than the percentage of domains that changed in the top 10,000. Hence, to have a dynamic daily list of trending domains, we had to look beyond the top 100 most popular domains.
However, we did not want to go all the way to the long tail of the list, as we already know that the ranks there are based on “significantly smaller and hence less reliable numbers” (see the paper "A Long Way to the Top: Significance, Structure, and Stability of Internet Top Lists"). Hence, we selected an appropriate list size for each location, based on the distribution of the number of DNS queries per domain. For example, for the Worldwide trending list we analyzed the top 20,000 most popular domains, for Brazil we looked at the top 10,000, Angola 5,000 and for the Faroe Islands top 500.
Trending Today
We then evaluated how much the domains change rank from one day to the next.
We saw that on average, the biggest changes in the top lists, from one day to the next, happen from Fridays to Saturdays and from Sundays to Mondays, and hence on Saturdays and Mondays the lists have the least overlap with the lists of the previous day. We also compared the rank changes from one day to the next corresponding weekday, say from one Monday to the next and saw that on average, rankings on Mondays typically have more overlap with the rankings of the previous Mondays, than with the rankings of Sunday. From this we decided that in order to capture which domains are trending due to the weekend effect, we needed to compare the domain's daily rank to the rank of the previous day(s), and not of the corresponding weekday.
However, we also did not want to show as trending those domains that highly oscillate in the rankings, jumping up and down from one day to the next, showing up as trending every few days. Hence, we could not simply compare the daily rank with the rank from the day before. Instead, as a compromise between capturing the most recent trends, including the weekend trends, but still filtering out the domains whose ranking oscillates over a short period of time, we decided to compare the domain's daily rank with its best rank of the previous four days.
Then, to calculate the increase in popularity, we simply calculate the percentage change in the current rank compared to the best rank of the previous four days.
Trending This Week
For calculating the domains steadily growing over the week, we used a slightly different approach.
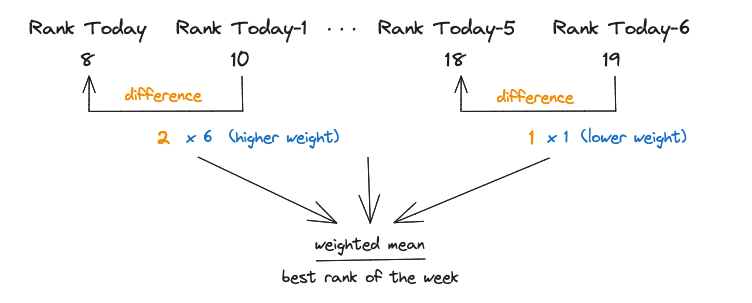
We want to highlight domains that keep improving their rank day by day and especially those that have been really trending in the most recent days. Therefore, we decided not to directly compare the current rank with the best rank during the previous week. Instead, we looked at the weighted average per day rank improvement and compared it with the best rank of the previous six days, with more recent days being given more weight.
Example trending domains
What do these lists look like at the end? We compiled the lists for the eventful days of June 21 to 24.
On June 22, nba.com was trending in 28 locations, shown in the table below, the United States, as expected, but also Austria, Australia and Japan, to name a few, reflecting the interest in the events of NBA Draft 2023.
Trending Today data from Friday, June 23, 2023:
Location
Trending rank
Domain
Albania
5
nba.com
Argentina
9
nba.com
Australia
1
nba.com
Austria
9
nba.com
Belgium
5
nba.com
Canada
5
nba.com
Chile
6
nba.com
Colombia
3
nba.com
Dominican Republic
5
nba.com
Greece
2
nba.com
Honduras
6
nba.com
Hong Kong
1
nba.com
India
7
nba.com
Indonesia
4
nba.com
Ireland
3
nba.com
Japan
9
nba.com
Mexico
2
nba.com
New Zealand
1
nba.com
Norway
1
nba.com
Philippines
1
nba.com
Poland
9
nba.com
Serbia
2
nba.com
South Korea
3
nba.com
Taiwan
1
nba.com
Thailand
1
nba.com
Ukraine
1
nba.com
United States
6
nba.com
Venezuela
4
nba.com
Two domains trending in multiple locations on Saturday, June 24, were: rt.com, a Russian news site in English, and liveuamap.com, a site with interactive map of Ukraine. These are probably the effects of the events related to the Wagner group on June 23 and 24. Related to the same events, domain jetphotos.com was trending on the same day in Russia, Norway and Albania.
Trending Today data from Saturday, June 24, 2023:
Location
Trending rank
Domain
Armenia
4
rt.com
Australia
5
rt.com
Belgium
2
rt.com
Bulgaria
9
rt.com
Canada
6
rt.com
Denmark
6
rt.com
Greece
6
rt.com
Italy
2
rt.com
Kazakhstan
8
rt.com
Lebanon
4
rt.com
Netherlands
8
rt.com
Papua New Guinea
9
rt.com
Singapore
2
rt.com
Spain
6
rt.com
Turkey
4
rt.com
United Kingdom
5
rt.com
United States
3
rt.com
Uzbekistan
2
rt.com
Other domains trending in various locations on Friday and Saturday were different Gaming and Video Streaming domains such as roblox.com, twitch.tv and callofduty.com, showing an increased interest in gaming activities as the weekend approaches.
Yet another interesting effect of the weekend was the presence of five weather forecast sites on the top 10 trending sites on Friday, in Croatia, showing preoccupation with the summer weekend plans.
Trending Today in Croatia (data from Friday, June 23, 2023)
Trending rank
Domain
Category
1
lightningmaps.org
Weather; Education
2
freemeteo.com.hr
Weather
3
Vrijeme.hr (Croatian Meteorological and Hydrological Service)
Politics, Advocacy, and Government-Related
4
arso.gov.si
5
rain-alarm.com
Weather; News & Media
6
sorbs.net
Information Security
7
neverin.hr
Information Technology
8
meteo.hr (Croatian Meteorological and Hydrological Service)
Business
9
gamespot.com
Gaming; Video Streaming
10
grad.hr
Business
These were all examples of daily trending domains, but what domains have steadily grown in popularity that week?
In multiple countries we had travel sites trending that week, sites such as booking.com, rentcars.com and amadeus.com, as many people were making their summer vacation plans. Weather forecast, specifically windy.com domain, was also trending the whole week in locations such as the Dominican Republic, Saint Lucia and Reunion, which was not surprising as the hurricane season began.
Trending This Week (Week June 17 -23, 2023)
Dominican Republic
Reunion
Saint Lucia
cecomsa.com
atera.com
adition.com
blur.io
sharethis.com
windy.com
pxfuel.com
windy.com
bbc.co.uk
windy.com
baidu.com
ampproject.org
mihoyo.com
inmobi.com
aniview.com
Final words
Both Trending Today and Trending This Week top 10 lists are now available on Radar starting today and on Radar API. Feel free to explore them and see what is trending on the Internet.
Visit Cloudflare Radar for additional insights around (Internet disruptions, routing issues, Internet traffic trends, attacks, Internet quality, etc.). Follow us on social media at @CloudflareRadar (Twitter), cloudflare.social/@radar (Mastodon), and radar.cloudflare.com (Bluesky), or contact us via e-mail.
Popular domains are domains of broad appeal based on how people use the Internet. Trending domains are domains that are generating a surge in interest.
Supposedly Google is starting a pilot program of disabling Internet connectivity from employee computers:
The company will disable internet access on the select desktops, with the exception of internal web-based tools and Google-owned websites like Google Drive and Gmail. Some workers who need the internet to do their job will get exceptions, the company stated in materials.
Linus has released 6.5-rc3 for testing.
“Things continue to look pretty normal – there’s nothing here that would
seem to stand out, with both the commit counts and the diffs looking pretty
much normal for rc3“.
Meanwhile, Greg Kroah-Hartman has released the large 6.4.5, 6.1.40, and 5.15.121
stable updates; each contains another set of important fixes.
Твърде много хора ми препратиха статията на Христо и Марин Генчеви в Гласове, за да се накарам да я прочета въпреки къде е публикувана.
Тестът е пълен с грешки и крещящо неразбиране на демографските процеси в последните 100 години. Та сипвам си чаша вино и описвам най-очевидните:
Оставям настрана съчиненията какво е направил Бисмарк през 1881 и най-вече защо, но обвързването на каквато и да е форма на социална система с намаляващата раждаемост е подвеждаща до абсурдна. Демографският преход е феномен наблюдаван във всички индустриални общества до ден днешен и идва скоро след урбанизация и специализиране на голяма част от обществото. Сещайте се за повече фабрики и офиси и по-малко земеделие и крехка самодостатъчност. Често идва след бум в раждаемостта причинена от напредъка медицината, някакво здравеопазване и сносна инфраструктура, която не позволява на 2 до 5 от 12-те раждания на жена в началото на 20-ти век да са мъртвородени, а още 4-5 да не доживеят до венчило. Това виждаме и в България.
Прескачат после към соца 80 години по-късно, но там социалните мерки като градини и ясли са въведени, защото са осъзнали, че имат нужда и от жените да работят във фабриките. В голяма степен факта, че се хвалим колко жени имаме в инженерните науки днес е страничен резултат от именно това.
Коефициентът на плодовитост не е среден брой на децата, които една жена има между 15 и 49 г. Да отворят методологията на НСИ най-малкото. Най-общо казано това е индекс показващ колко деца би имала една жена, ако решенията и възможностите ѝ да има деца съвпадаха през целия ѝ живота с тези на жени от различни възрасти родили през дадената година. С други думи едно поколение жени може да има през една година или период нисък коефициент и пак да има толкова деца, колкото родителите си, но просто по-късно – точно каквото наблюдаваме сега. И България се пише с „я“ накрая.
Спадът през 90-те беше продължение на тенденция започнала още 70-те на база отново главно урбанизацията и подобрено здравеопазване, но се задълбочи заради кризите, несигурността и пропадането именно на социалните системи, които описват.
Скокът до преди 15 години се захранваше отчасти с повишаващата се сигурност, но най-вече с решения за първо или следващи деца отлагани от 90-те в някои двойки. Тези сигнали се виждат ясно във възрастовото разпределение на родилките в този период и особено около 2009-та.
Скокът през 2022-ра на 1.78 е странен, но всъщност има просто обяснение – преброяването показа, че има по-малко жени в детеродна възраст. Следва да коригираме старите данни както се прави с оценката на населението след всяко преброяване. Така ще видим същото плавно покачване, както в последните 10 години.
Индексът на плодовитост е един фактор, но е безсмислен най-малкото без да смяташ средната възраст и относителния брой жени в детеродна възраст. Отделно за развитието на населението и повъзрастовата смъртност и демографския преход като цяло. Да не говорим за емиграцията и шовинизма ни, който в голяма степен спира така нужната ни имиграция, а в немалка степен – и емигрантите да се върнат.
Нищо от това няма общо с връщането към някакъв традиционализъм. Всъщност, нарастването на консервативни настроения в едно общество винаги съпровождат застаряването на това общество. Младите са тези, които носят промяна, готови са да поставят установеното под въпрос и да не се водят по предразсъдъците на родителите си. Всъщност, готовността на повече двойки да имат деца е въпреки това наблюдение и заради вече описаното икономическо развитие. Към него може да добавим и елементи като повече сигурност за майките, все повече гъвкавост в работното място, мобилност и покачващ се среден размер на жилищата в градовете.
Не на последно място – да гледаш единствено две точки в развитието на една метрика от многото определящи демографската ситуация и да вадиш генерални изводи за обществото, църквата и семейството не е нещо, което си заслужава сериозно отношение, но ей на – обърнах му някакво.
Измина още една седмица, изпълнена с жега – и метеорологична, и политическа. Президентът и „Възраждане“ упорито се опитват да стигнат до границите на политическата система и на обществената поносимост. Първият – посредством свръхактивност, надхвърляща правомощията му, и все повече обиди към несъгласните с позициите на Русия. Вторите – чрез все повече омраза и заплахи, като актуалната форма на омраза за „възрожденци“ е антисемитизмът.
Продължаваме не с политика, а с наука. Ако в жегата имате чувството, че мозъкът ви ни приема, ни предава, от новата статия на Анастасия Орманджиева „Как си комуникират мозъкът и имунната система“ ще научите, че той поне си общува с имунната ви система, както и тя – с него.Това на пръв поглед може да изглежда успокоително, но е свързано с нещо не толкова приятно – автоимунните заболявания. И понеже стресът може да ни докара някоя от онези в общия случай нелечими (макар и обикновено не смъртоносни) автоимунни болести, да си припомним съвета от „Пътеводител на галактическия стопаджия“ на Дъглас Адамс – не този за хавлията, а „Без паника“.
Направихме плавен преход от науката към литературата. В рубриката „На второ четене“ Стефан Иванов ни предлага „Летният брат“от нидерландския автор Яп Робен в превод на Мария Енчева. Колкото и невероятно да звучи, Стефан е на мнение, че това е една от най-подходящите книги за четене през ваканцията и на плажа или пък в планината, изобщо – където и да си почиваме. В книгата се разказва – брутално нежно, без да е елементарно сантиментално или манипулативно – как двама братя, единият от които с увреждане, прекарват лятото заедно с баща си.
След като сме получили здравословна и освежаваща литературна храна за мозъка си, може да се върнем към политиката. И по-конкретно – към местните избори в столицата. „Ами ако ГЕРБ издигне Росен Желязков?“, пита Емилия Милчева в тазседмичния си коментар. Този път може и да има битка за София, но тя ще изглежда по странен начин, защото главните опоненти са в не-коалиция, а между тях гори не-любов. Докато ГЕРБ неавтентично се изказва от името на „автентичното дясно“, неофициално се говори, че настоящият председател на парламента Росен Желязков загрява за кметската битка. Ако това е вярно, според Емилия битката ще е истинска.
Продължавам с тема, която следя от години (извинявайте, че ви занимавам със себе си, но какво да се прави, като съм дежурна по бюлетин). Става дума за (не)забелязването на хомофобията от страна на политическите субекти в България. Във връзка с това се случи нещо важно: ПП и ДБ казаха думата „хомофобия“ в заглавието на своя официална позиция. Дано обаче не си останат с едното казване, а и направят каквото зависи от тях за ограничаването на хомофобията.
Но да се върнем на лятото. Едно от спасенията в жегата са доматите. А в статията си You say tomatl, I say домат Екатерина Петрова ни разказва откъде идват различните названия на домата. Златни, райски, любовни, обожаеми – това са все определения, присъстващи в различните имена на доматите. Дали пък няма да се окаже, че забраненият плод в райската градина всъщност е домат, пита се Екатерина Петрова.
Време е за обичайните ми препоръки. Започвам с доматите. И с динята, таратора, водата (за мен – с парче лимон, ако може) – изобщо всичко, което ви разхлажда в летните жеги.
Пък ако не сте отписали напълно Българското Черноморие и Бургас ви е на път, защо не посетите изложба на открито, част от фотографския фестивал „ФотоФабрика“ по случай 10-тата му годишнината? Тя може да се види до 20 август на кейовата стена на Морската гара, срещу входа на бургаския филиал на Националната художествена академия (НХА). Ето начин да захраните мозъка си с прекрасни снимки на световни и български фотографи. За да не е толкова зает с имунната ви система.
Приятно четене, разхлаждане и естетически удоволствия!
To provide the best experiences, we use technologies like cookies to store and/or access device information. Consenting to these technologies will allow us to process data such as browsing behavior or unique IDs on this site. Not consenting or withdrawing consent, may adversely affect certain features and functions.
Functional
Always active
The technical storage or access is strictly necessary for the legitimate purpose of enabling the use of a specific service explicitly requested by the subscriber or user, or for the sole purpose of carrying out the transmission of a communication over an electronic communications network.
Preferences
The technical storage or access is necessary for the legitimate purpose of storing preferences that are not requested by the subscriber or user.
Statistics
The technical storage or access that is used exclusively for statistical purposes.The technical storage or access that is used exclusively for anonymous statistical purposes. Without a subpoena, voluntary compliance on the part of your Internet Service Provider, or additional records from a third party, information stored or retrieved for this purpose alone cannot usually be used to identify you.
Marketing
The technical storage or access is required to create user profiles to send advertising, or to track the user on a website or across several websites for similar marketing purposes.