Configure monitoring, limits, and alarms in Amazon Redshift Serverless to keep costs predictable

Post Syndicated from Satesh Sonti original https://aws.amazon.com/blogs/big-data/configure-monitoring-limits-and-alarms-in-amazon-redshift-serverless-to-keep-costs-predictable/

Amazon Redshift Serverless makes it simple to run and scale analytics in seconds. It automatically provisions and intelligently scales data warehouse compute capacity to deliver fast performance, and you pay only for what you use. Just load your data and start querying right away in the Amazon Redshift Query Editor or in your favorite business intelligence (BI) tool. Redshift Serverless measures data warehouse capacity in Redshift Processing Units (RPUs), and you can configure base RPUs anywhere between 8–512. You can start with your preferred RPU capacity or defaults and adjust anytime later.

In this post, we share how you can monitor your workloads running on Redshift Serverless through three approaches: the Redshift Serverless console, Amazon CloudWatch, and system views. We also show how to set up guardrails via alerts and limits for Redshift Serverless to keep your costs predictable.

Method 1: Monitor through the Redshift Serverless console

You can view all user queries, including Data Manipulation Language (DML) statements, Data Definition Language (DDL) statements, and Data Control Language (DCL), through the Redshift Serverless console. You can also view the RPU consumption to run these workloads on a single page. You can also apply filters based on time, database, users, and type of queries.

Prerequisites for monitoring access

A superuser has access to monitor all workloads and resource consumption by default. If other users need monitoring access through the Redshift Serverless console, then the superuser can provide necessary access by performing the following steps:

  1. Create a policy with necessary privileges and assign this policy to required users or roles.
  2. Grant query monitoring permission to the user or role.

For more information, refer to Granting access to monitor queries.

Query monitoring

In this section, we walk through the Redshift Serverless console to see query history, database performance, and resource usage. We also go through monitoring options and how to set filters to narrow down results using filter attributes.

  1. On the Redshift Serverless console, under Monitoring in the navigation pane, choose Query and database monitoring.
  2. Open the workgroup you want to monitor.
  3. In the Metric filters section, expand Additional filtering options.
  4. You can set filters for time range, aggregation time interval, database, query category, SQL, and users.

Query and database monitoring

Two tabs are available, Query history and Database performance. Use the Query history tab for obtaining details at a per-query level, and the Database performance tab for reviewing performance aggregated across queries. Both these tabs are filtered based off the selections you made.

Under Query history, you will see the Query runtime graph. Use this graph to look into query concurrency (queries that are running in the same time frame). You can choose a query to view more query run details, for example, queries that took longer to run than you expected.

Query runtime monitoring dashbaord

In the Queries and loads section, you can see all queries by default, but you can also filter by status to view completed, running, and failed queries.

Query history screen

Navigate to the Database Performance tab in the Query and database monitoring section to view the following:

  • Queries completed per second – Average number of queries completed per second
  • Queries duration –Average amount of time to complete a query
  • Database connections – Number of active database connections
  • Running and Queued queries – Total number of running and queued queries at a Resource monitoring

To monitor your resources, complete the following steps:

  1. On the Redshift Serverless console, choose Resource monitoring under Monitoring in the navigation pane.

The default workgroup will be selected by default, but you can choose the workgroup you would like to monitor.

  1. In the Metric filters section, expand Additional filtering options.
  2. Choose a 1-minute time interval (for example) and review the results.

You can also try different ranges to see the results.

Screen to apply metric filters

On the RPU capacity used graph, you can see how Redshift Serverless is able to scale RPUs in a matter of minutes. This gives a visual representation of peaks and lows in your consumption over your chosen period of time.

RPU capacity consumption

You also see the actual compute usage in terms of RPU-seconds for the workload you ran.
RPU Seconds consumed

Method 2: Monitor metrics in CloudWatch

Redshift Serverless publishes serverless endpoint performance metrics to CloudWatch. The Amazon Redshift CloudWatch metrics are data points for operational monitoring. These metrics enable you to monitor performance of your serverless workgroups (compute) and usage of namespaces (data). CloudWatch allows you to centrally monitor your serverless endpoints in one AWS account, or also cross-account and cross-Region.

  • On the CloudWatch console, under Metrics in the navigation pane, choose All metrics.
  • On the Browse tab, choose AWS/Redshift-Serverless to get to a collection of metrics for Redshift Serverless usage.

Redshift Serverless in Amazon CloudWatch

  • Choose Workgroup to view workgroup-related metrics.

Workgroups and Namespaces

From the list, you can check your particular workgroup and the metrics available (in this example, ComputeSeconds and ComputeCapacity). You should see the graph is updated and charting your data.

Redshift Serverless Workgroup Metrics

  • To name the graph, choose the pencil icon next to the graph title and enter a graph name (for example, dataanalytics-serverless), then choose Apply.

Rename CloudWatch Graph

  • On the Browse tab, choose AWS/Redshift-Serverless and choose Namespace this time.
  • Select the namespace you want to monitor and the metrics of interest.

Redshift Serverless Namespace Metrics

You can add additional metrics to your graph. To centralize monitoring, you can add these metrics to an existing CloudWatch dashboard or a new dashboard.

  • On the Actions menu, choose Add to dashboard.

Redshift Serverless Namespace Metrics

Method 3: Granular monitoring using system views

System views in Redshift Serverless are used to monitor workload performance and RPU usage at a granular level over a period of time. These query monitoring system views have been simplified to include monitoring for DDL, DML, COPY, and UNLOAD queries. For a complete list of system views and their uses, refer to Monitoring views.

SQL Notebook

You can download the SQL notebook with most used system views queries. These queries help to answer most frequently asked monitoring questions listed below.

  • How to monitor queries based on status?
  • How to monitor specific query elapsed time breakdown details?
  • How to monitor workload breakdown by query count, and percentile run time?
  • How to monitor detailed steps involved in query execution?
  • How to monitor Redshift serverless usage cost by day?
  • How to monitor data loads (copy commands)?
  • How to monitor number of sessions, and connections?

You can import this in Query Editor V2.0 and run the queries connecting to the Redshift Serverless workgroup you would like to monitor.

Set limits to control costs

When you are creating your serverless endpoint, the base capacity is defaulted to 128 RPUs. However, you can change it at creation time or later via the Redshift Serverless console.

  1. On the details page of your serverless workgroup, choose the Limits tab.
  2. In the Base capacity section, choose Edit.
  3. You can specify Base capacity from 8–512 RPUs, in increments of 8.

Each RPU provides 16 GB memory, so the lowest base 8 RPU is compute with 128 GB memory, and highest base 512 RPU is compute with 8 TB memory.

Edit base RPU capacity

Usage limits

To configure usage capacity limits to limit your overall Redshift Serverless bill, complete the following steps:

  1. In the Usage limits section, choose Manage usage limits.
  2. To control RPU usage, set the maximum RPU-hours by frequency. You can set Frequency to Daily, Weekly, and Monthly.
  3. For Usage limit (RPU hours), enter your preferred value.
  4. For Action, choose Alert, Log to system table, or Turn off user queries.

Set RPU usage limit

Optionally, you can select an existing Amazon Simple Notification Service (Amazon SNS) topic or create a new SNS topic, and subscribe via email to this SNS topic to be notified when usage limits have been met.

Query monitoring rules for Redshift Serverless

To prevent wasteful resource utilization and runaway costs caused by poorly rewritten queries, you can implement query monitoring rules via query limits on your Redshift Serverless workgroup. For more information, refer to WLM query monitoring rules. The query monitoring rules in Redshift Serverless stop queries that meet the limit that has been set up in the rule. To receive notifications and automate notifications on Slack, refer to Automate notifications on Slack for Amazon Redshift query monitoring rule violations.

To set up query limits, complete the following steps:

  1. On the Redshift Serverless console, choose Workgroup configuration in the navigation pane.
  2. Choose a workgroup to monitor.
  3. On the workgroup details page, under Query monitoring rules, choose Manage query limits.

You can add up to 10 query monitoring rules to each serverless workgroup.

Set query limits

The serverless workgroup will go to a Modifying state each time you add or remove a limit.

Let’s take an example where you have to create a serverless workgroup for your dashboards. You know that dashboard queries typically complete in under a minute. If any dashboard query takes more than a minute, it could indicate a poorly written query or a query that hasn’t been tested well, and has incorrectly been released to production.

For this use case, we set a rule with Limit type as Query execution time and Limit (seconds) as 60.

Set required limit

The following screenshot shows the Redshift Serverless metrics available for setting up query monitoring rules.

Query Monitoring Metrics on CloudWatch

Configure alarms

Alarms are very useful because they enable you to make proactive decisions about your Redshift Serverless endpoint. Any usage limits that you set up will automatically show as alarms on the Redshift Serverless console, and are created as CloudWatch alarms.

Additionally, you can set up one or more CloudWatch alarms on any of the metrics listed in Amazon Redshift Serverless metrics.

For example, setting an alarm for DataStorage over a threshold value would keep track of the storage space that your serverless namespace is using for your data.

To create an alarm for your Redshift Serverless instance, complete the following steps:

  1. On the Redshift Serverless console, under Monitoring in the navigation pane, choose Alarms.
  2. Choose Create alarm.

Set Alarms from console

  1. Choose your level of metrics to monitor:
    • Workgroup
    • Namespace
    • Snapshot storage

If we select Workgroup, we can choose from the workgroup-level metrics shown in the following screenshot.

Workgroup Level Metrics

The following screenshot shows how we can set up alarms at the namespace level along with various metrics that are available to use.

Namespace Level Metrics

The following screenshot shows the metrics available at the snapshot storage level.

Snapshot level metrics

If you are starting new, then please start with most commonly used metrics listed below. Please also Create a billing alarm to monitor your estimated AWS charges.

  • ComputeSeconds
  • ComputeCapacity
  • DatabaseConnections
  • EstimatedCharges
  • DataStorage
  • QueriesFailed

Notifications

After you define your alarm, provide a name and a description, and choose to enable notifications.

Amazon Redshift uses an SNS topic to send alarm notifications. For instructions to create an SNS topic, refer to Creating an Amazon SNS topic. You must subscribe to the topic to receive the messages published to it. For instructions, refer to Subscribing to an Amazon SNS topic.

You can also monitor event notifications to be aware of the changes in your Redshift Serverless Datawarehouse. Please refer Amazon Redshift Serverless event notifications with Amazon EventBridge for further details.

Clean up

To clean up your resources, delete the workgroup and namespace you used for trying the monitoring approaches discussed in this post.

Cleanup

Conclusion

In this post, we covered how to perform monitoring activities on Redshift Serverless through the Redshift Serverless console, system views, and CloudWatch, and how to keep costs predictable. Try the monitoring approaches discussed in this post and let us know your feedback in the comments.


About the Authors

Satesh Sonti is a Sr. Analytics Specialist Solutions Architect based out of Atlanta, specialized in building enterprise data platforms, data warehousing, and analytics solutions. He has over 17 years of experience in building data assets and leading complex data platform programs for banking and insurance clients across the globe.

Harshida Patel is a Specialist Principal Solutions Architect, Analytics with AWS.

Raghu Kuppala is an Analytics Specialist Solutions Architect experienced working in the databases, data warehousing, and analytics space. Outside of work, he enjoys trying different cuisines and spending time with his family and friends.

Ashish Agrawal is a Sr. Technical Product Manager with Amazon Redshift, building cloud-based data warehouses and analytics cloud services. Ashish has over 24 years of experience in IT. Ashish has expertise in data warehouses, data lakes, and platform as a service. Ashish has been a speaker at worldwide technical conferences.

Enable data analytics with Talend and Amazon Redshift Serverless

Post Syndicated from Tamara Astakhova original https://aws.amazon.com/blogs/big-data/enable-data-analytics-with-talend-and-amazon-redshift-serverless/

This is a guest post co-written with Cameron Davie from Talend.

Today, in order to accelerate and scale data analytics, companies are looking for an approach to minimize infrastructure management and predict computing needs for different types of workloads, including spikes and ad hoc analytics.

The integration of Talend Cloud and Talend Stitch with Amazon Redshift Serverless can help you achieve successful business outcomes without data warehouse infrastructure management.

In this post, we demonstrate how Talend easily integrates with Redshift Serverless to help you accelerate and scale data analytics with trusted data.

About Redshift Serverless

Redshift Serverless makes it simple to run and scale analytics without having to manage your data warehouse infrastructure. Data scientists, developers, and data analysts can access meaningful insights and build data-driven applications with zero maintenance. Redshift Serverless automatically provisions and intelligently scales data warehouse capacity to deliver fast performance for even the most demanding and unpredictable workloads, and you pay only for what you use. You can load your data and start querying in your favorite business intelligence (BI) tools, build machine learning (ML) models in SQL, or combine your data with third-party data for new insights because Redshift Serverless seamlessly integrates with your data landscape. Existing Amazon Redshift customers can migrate their Redshift clusters to Redshift Serverless using the Amazon Redshift console or API without making changes to their applications and have the advantage of using this capability.

About Talend

Talend is an AWS ISV Partner with the Amazon Redshift Ready Product designation and AWS Competencies in both Data and Analytics and Migration. Talend Cloud combines data integration, data integrity, and data governance in a single, unified platform that makes it easy to collect, transform, clean, govern, and share your data. Talend Stitch is fully managed, scalable service that helps replicate data into your cloud data warehouse and quickly access analytics to make better, faster decisions.

Solution overview

The integration of Talend with Amazon Redshift adds new features and capabilities. As of this writing, Talend has 14 distinct native connectivity and configuration components for Amazon Redshift, which are fully documented in the Talend Help Center.

From the Talend Studio interface, there are no differences or changes required to support or access a Redshift Serverless instance or provisioned cluster.

In the following sections, we detail the steps to integrate the Talend Studio interface with Redshift Serverless.

Prerequisites

To complete the integration, you need a Redshift Serverless data warehouse. For setup instructions, see the Getting Started Guide. You also need a Talend Cloud account and Talend Studio. For setup instructions, see the Talend Cloud installation guide.

Integrate Talend Studio with Redshift Serverless

In the Talend Studio interface, you first create and establish a connection to Redshift Serverless. Then you add an output component to standard loading from your desired source into your Redshift Serverless data warehouse, using the established connection. The alternative step is to use a bulk loading component to load large amounts of data directly to your Redshift Serverless data warehouse, using the tRedshiftBulkExec component. Complete the following steps:

  1. Configure a tRedshiftConnection component to connect to Redshift Serverless:
    • For Database, choose Amazon Redshift.
    • Leave the values for Property Type and Driver version as default.
    • For Host, enter the Redshift Serverless endpoint’s host URL.
    • For Port, enter 5349.
    • For Database, enter your database name.
    • For Schema, enter your preferred schema.
    • For Username and Password, enter your user name and password, respectively.

Follow security best practices by using a strong password policy and regular password rotation to reduce the risk of password-based attacks or exploits.

For more information on how to connect to a database, refer to tDBConnection.

After you create the connection object, you can add an output component to your Talend Studio job. The output component defines that the data being processed in the job’s workflow will land in Redshift Serverless. The following examples show standard output and bulk loading output.

  1. Add a tRedshiftOutput database component.

tRedshiftOutput database component

  1. Configure the tRedshiftOutput database component to write, update, make changes to the connected Redshift Serverless data warehouse.
  2. When using the tRedshiftOutput component, select Use an existing component and choose the connection you created.

This step makes sure that this component is pre-configured.

tDBOutput component

For more information on how to set up a tDBOutput component, see tDBOutput.

  1. Alternatively, you can configure a tRedshiftBulkExec database component to run the insert operations on the connected Redshift Serverless data warehouse.

Using the tRedshiftBulkExec database component allows you to mass load data files directly from Amazon Simple Storage Service (Amazon S3) into Redshift Serverless as tables. The following screenshot illustrates that Talend is able to use connection information in a job across multiple components, saving time and effort when establishing connections to both Amazon Redshift and Amazon S3.

  1. When using the tRedshiftBulkExec component, select Use an existing component for Database settings and choose the connection you created.

This makes sure that this component is preconfigured.

  1. For S3 Setting, select Use an existing S3 connection and enter your existing connection that you will configure separately.

tDBBulkExec component

For more information on how to set up a tDBBulkExec component, see tDBBulkExec.

As well as Talend Cloud for enterprise-level data transformation needs, you could also use Talend Stitch to handle data ingestion and data replication to Redshift Serverless. All configuration for ingestion or replicating data from your desired sources to Redshift Serverless is done in a single input screen.

  1. Provide the following parameters:
    • For Display Name, enter your preferred display name for this connection.
    • For Description, enter a description of the connection. This is optional.
    • For Host, enter the Redshift Serverless endpoint’s host URL.
    • For Port, enter 5349.
    • For Database, enter your database name.
    • For Username and Password, enter your user name and password, respectively.

All support documents and information (including diagrams, steps, and screenshots) can be found in the Talend Cloud and Talend Stitch documentation.

Summary

In this post, we demonstrated how the integration of Talend with Redshift Serverless helps you quickly integrate multiple data sources into a fully managed, secure platform and immediately enable business-wide analytics.

Check out AWS Marketplace and sign up for a free trial with Talend. For more information about Redshift Serverless, refer to the Getting Started Guide.


About the Authors

Tamara Astakhova is a Sr. Partner Solutions Architect in Data and Analytics at AWS. She has over 18 years of experience in the architecture and development of large-scale data analytics systems. Tamara is working with strategic partners helping them build complex AWS-optimized architectures.

Cameron Davie is a Principal Solutions Engineer for the Tech Alliances team. He oversees the technical responsibilities of Talend’s most strategic ISV partnerships. Cameron has been with Talend for 6 years in this role, working directly as the primary technical resource for partners such as AWS, Snowflake, and more. Cameron’s role at Talend is primarily focused on technical enablement and evangelism. This includes showcasing key capabilities of our partners’ solution internally as well as demonstrating Talend’s core technical capabilities with the technical sellers at Talend’s strategic ISV partners. Cameron is a veteran of ISV partnerships and enterprise software, with over 23 years of experience. Before Talend, he spent 14 years at SAP on their OEM/Embedded Solutions partnership team.

Maneesh Sharma is a Senior Database Engineer at AWS with more than a decade of experience designing and implementing large-scale data warehouse and analytics solutions. He collaborates with various Amazon Redshift Partners and customers to drive better integration.

[$] A discussion on Linux in space

Post Syndicated from original https://lwn.net/Articles/938779/

There was something of a space theme that pervaded the Embedded Linux
Conference (ELC) portion of the 2023 Embedded
Open Source Summit
(EOSS), which is an umbrella event for various
sub-conferences related to embedded open-source development. That may
partly be because one of the organizers of EOSS (and ELC), Tim Bird,
described himself as “a bit of a space junkie”; he made that observation
during a panel session that he led on embedded Linux in space. Bird and
four panelists discussed various aspects of the use of Linux in
space-related systems, including where it has been used, the
characteristics and challenges of aerospace deployments, certification of
Linux for aerospace use, and more.

Security updates for Tuesday

Post Syndicated from original https://lwn.net/Articles/939179/

Security updates have been issued by Debian (python-git and renderdoc), Red Hat (edk2, kernel, kernel-rt, and kpatch-patch), Slackware (kernel), SUSE (firefox, libcap, openssh, openssl-1_1, python39, and zabbix), and Ubuntu (cinder, ironic, nova, python-glance-store, python-os-brick, frr, graphite-web, and openssh).

Intel APX Advanced Performance Extensions and AVX10 For Next-Gen CPUs

Post Syndicated from Cliff Robinson original https://www.servethehome.com/intel-apx-advanced-performance-extensions-and-avx10-for-next-gen-cpus/

Intel has a new AVX10 ISA to unify next-gen vector compute for P-cores and E-cores as well as Intel APX Advanced Performance Extensions

The post Intel APX Advanced Performance Extensions and AVX10 For Next-Gen CPUs appeared first on ServeTheHome.

New York Using AI to Detect Subway Fare Evasion

Post Syndicated from Bruce Schneier original https://www.schneier.com/blog/archives/2023/07/new-york-using-ai-to-detect-subway-fare-evasion.html

The details are scant—the article is based on a “heavily redacted” contract—but the New York subway authority is using an “AI system” to detect people who don’t pay the subway fare.

Joana Flores, an MTA spokesperson, said the AI system doesn’t flag fare evaders to New York police, but she declined to comment on whether that policy could change. A police spokesperson declined to comment.

If we spent just one-tenth of the effort we spend prosecuting the poor on prosecuting the rich, it would be a very different world.

От А1 с любов

Post Syndicated from Йовко Ламбрев original https://www.toest.bg/from-a1-with-love/

От А1 с любов

22 май 2023 г. Налагаше се да бъда в движение из града през почти целия ден, а в същото време трябваше да поддържам активна комуникация по телефона и в чата с колегите по различни теми и проекти. Всичко щеше да бъде наред, ако изведнъж в късния следобед телефоните им не замлъкнаха. Нямах телефонна връзка и с никого от мениджмънта на компанията. Намерихме се чрез служебния чат, където стана ясно, че мобилният оператор „А1 България“ едностранно и без да посочи конкретна причина, просто е спрял телефоните на всички, включени в групата на фирмата.

Над два месеца по-късно проблемът още няма решение, нито пък от А1 са дали рационално обяснение, в което да не прозира опит за натиск от позицията на силата. Разпитвайки наоколо, попаднах и на други подобни случаи, което предполага, че

всичко това може би не е случайно, а прилича на установена търговска практика.

Заех се да пиша този текст по няколко причини. Като служител на една от засегнатите компании имах възможност да наблюдавам развоя на казуса съвсем отблизо. Освен това, разравяйки фактите, попаднах на стряскащо идентични случаи с други дългогодишни клиенти на мобилния оператор. А съм наясно, че тъй като телекомите са едни от най-големите рекламодатели, примери за техни скандални практики трудно ще получат отразяване в по-големите медии.

Случаят с „Новарто“

„Новарто“ е българска ИТ компания, която от 15 години е клиент на „A1 България“. Досега двете дружества не са имали никакви юридически или други спорове.

Тази година ръководството на „Новарто“ решава да смени мобилния оператор, вместо да поднови договора си с А1. Фирмата подготвя заявлението за пренос на номерата, но изчаква да наближи крайният срок на договора, който изтича на 4 юни. Междувременно от „Новарто“ споделят с обслужващия търговец на А1, че разглеждат и други оферти.

На 22 май в 16:09 ч. управителят на „Новарто“ Борислав Минков получава имейл от Димитър С. Димитров, мениджър „Големи клиенти“ в „A1 България“. Той го уведомява, че считано от същия ден, договорът за мобилните услуги се прекратява едностранно от телекома на основание Раздел 9 от Общите условия на „А1 България“. Петдесет и девет минути по-късно, в 17:08 ч., всички SIM карти от фирмената група на „Новарто“ се превръщат в непотребни парченца пластмаса. А служителите заедно с мениджърите на компанията остават недостъпни по телефона за колегите, клиентите и бизнес партньорите си, както и за семействата и приятелите си.

Цитираният Раздел 9 от Общите условия на „А1 България“, разписан в над две страници, обхваща всички различни хипотези, при които договорът за мобилни услуги може да бъде прекратен от клиента или от оператора. Иначе казано, в позоваването на целия раздел няма полезна конкретика, която да изясни

защо едностранно и с едночасово предизвестие се прекратява договор, който фактически не е изтекъл.

При това развитие „Новарто“ изисква от новия си мобилен оператор да задейства веднага подготвеното заявление за пренос на номерата. За съжаление, това се оказва закъснял ход – наближава краят на работното време, а на следващия ден A1 отказва преноса, обосновавайки се с прекратения договор заради нарушени Общи условия.

Обичайната процедура за пренос на номера от един телеком към друг изисква клиентът да заяви това при новия си оператор, който служебно препраща заявката към стария. Той от своя страна следва да уведоми клиента си, че номерът или номерата му са заявени за пренос (прави се, за да се избегнат евентуални опити за злоупотреба) и че може да дължи някакви неустойки (за предсрочно прекратяване на договора, за невърнати устройства и др.). Обикновено преносът се осъществява в рамките на няколко дни.

В конкретния случай старият оператор („A1 България“) предсрочно прекратява договора, изпреварвайки заявлението за пренос.

Така, когато такова заявление постъпи, той вече може да твърди, че клиентът няма активен договор, и на това основание да откаже преноса. Негативният ефект е двоен – клиентът остава без комуникации за неопределен период, а същевременно не може да премести номерата си към друг оператор.

Представете си, че сте търговска фирма, която приема поръчки по телефона, и в един момент никой не може да се свърже с вас. А дори да вземете нови телефонни номера, имате стотици клиенти, които трябва да уведомите за това. Или както споделя Борислав Минков, телефонът или имейлът само на пръв поглед са някаква поредица от букви и цифри, а в действителност са жива връзка с бизнес партньорите ти. Когато някой ти отнеме тази връзка, той не просто възпрепятства бизнеса ти, а ограничава човешкото ти общуване – защото зад всеки телефонен номер всъщност стои човек.

Юридически доказването на вреди и пропуснати ползи е трудно упражнение, но Минков добавя и втори план за размисъл, защото, случайно или не,

както „A1 България“, така и „Новарто“ са партньори на немския софтуерен гигант SAP – и в този смисъл се явяват конкуренти.

Факт, за който Минков се надява, че ще заинтересува Комисията за защита на конкуренцията.

Жалба от страна на „Новарто“ е подадена също в Комисията за регулиране на съобщенията, изпратено е и писмо до оглавяващия отдела за вътрешен одит в Telekom Austria Group – компанията майка на „A1 България“.

От името на „Тоест“ се обърнах към г-жа Илияна Захариева, директор „Корпоративни комуникации“, със следните въпроси:

  1. Каква е причината за едностранното предсрочно прекратяване на услугите по упоменатия договор с „Новарто“ ООД?
  2. Счита ли „А1 България“ за добра търговска практика едностранното предсрочно прекратяване на услуги по действащ договор, без детайлно и аргументирано посочване на причина за това?
  3. Как ще коментирате страничния ефект на това едностранно предсрочно прекратяване, който води до невъзможност клиентът Ви да ползва услугите от Вас, нито да може да пренесе номерата си при друг мобилен оператор?

Г-жа Захариева не отговори на въпросите ми, но потвърди, че от „A1 България“ са запознати със случая, който тя определи като частен казус, и обясни, че поради тази причина не може да коментира детайли, без да сподели данни за сметките, задълженията и транзакциите на „Новарто“. Тя повтори, че договорът е прекратен едностранно, на основание нарушаване на Общите условия – отново без друга конкретика.

Официалната позиция по случая от страна на „A1 България“, получена над месец след жалбата на „Новарто“, повтаря за пореден път всичко известно дотук. Добавен е обаче един детайл. Операторът претендира, че компанията „Новарто“ поне три пъти е просрочила плащания на дължими фактури.

От А1 с любов

Борислав Минков не отрича, че е открил няколко фактури, на които „Новарто“ е просрочила плащанията, но е категоричен, че са били неволни забавяния с не повече от два-три дни, а не системно поведение. И това е за целия период от 15 години, през които двете компании са имали търговски взаимоотношения. Минков задава и следния очевиден въпрос:

Ако това е било системно нарушение от наша страна, защо A1 никога не са реагирали? Защо досега не са прекратили отношенията си с нас, а го правят едва когато научиха, че ще ги сменим?

Междувременно в конферентен разговор с въпросния мениджър „Големи клиенти“ Димитър С. Димитров и с регионалния мениджър Иван С. Иванов, проведен в първите дни след прекратяването на договора, Минков получава предложение „да преподпише с A1 и да забравят за случилото се“. Или „да компенсира A1 с друг двугодишен договор, който да им възстанови загубения оборот“. Той отказва.

В крайна сметка „Новарто“ подписва нов договор с друг оператор, прежалвайки старите си номера. Това, естествено, води до сътресения в бизнеса и комуникациите, докато всички контрагенти научат новите телефонни номера на служителите, които работят с тях. Процесът отнема време и не е лесен.

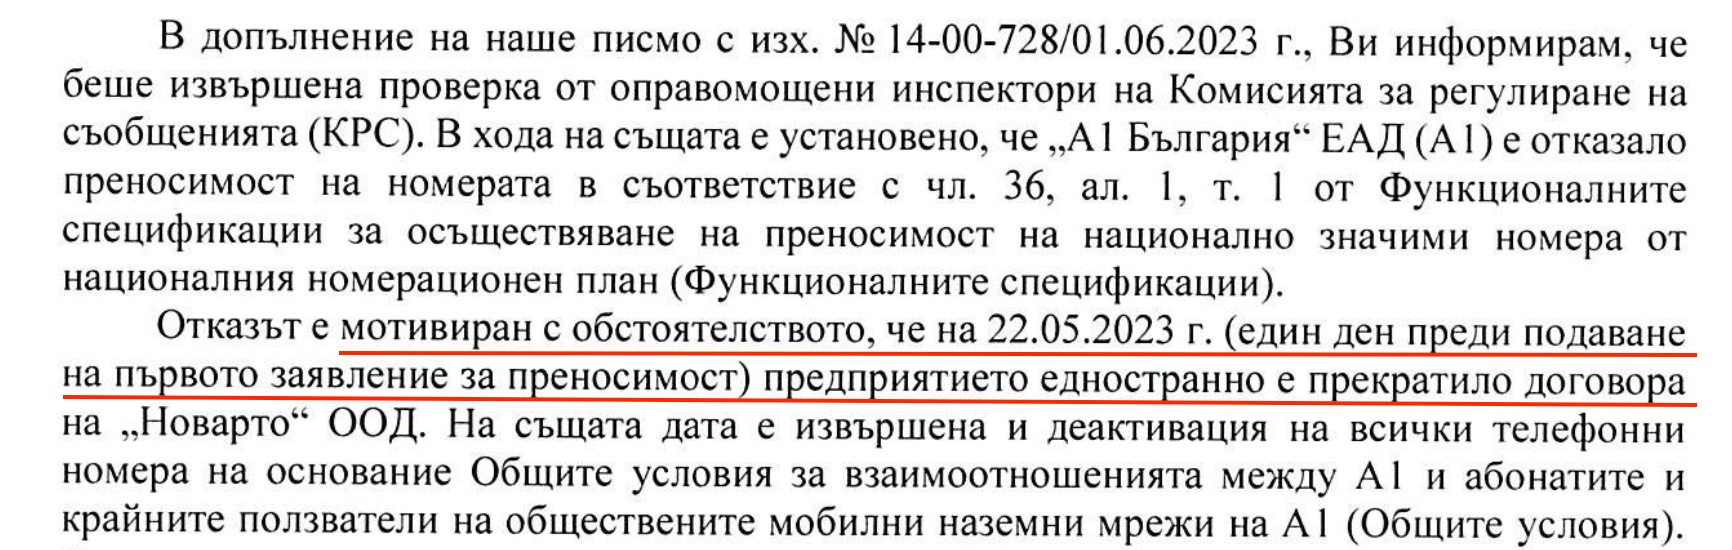
На 7 юли „Новарто“ получава отговор и на жалбата си до Комисията за регулиране на съобщенията, която заявява, че „A1 България“ е отказала преноса на номерата в съответствие с регулаторните изисквания (чл. 36, ал. 1, т. 1 от Функционалните спецификации), тъй като преди подаване на заявлението за преносимост номерата са били деактивирани, тоест несъществуващи.

От А1 с любов

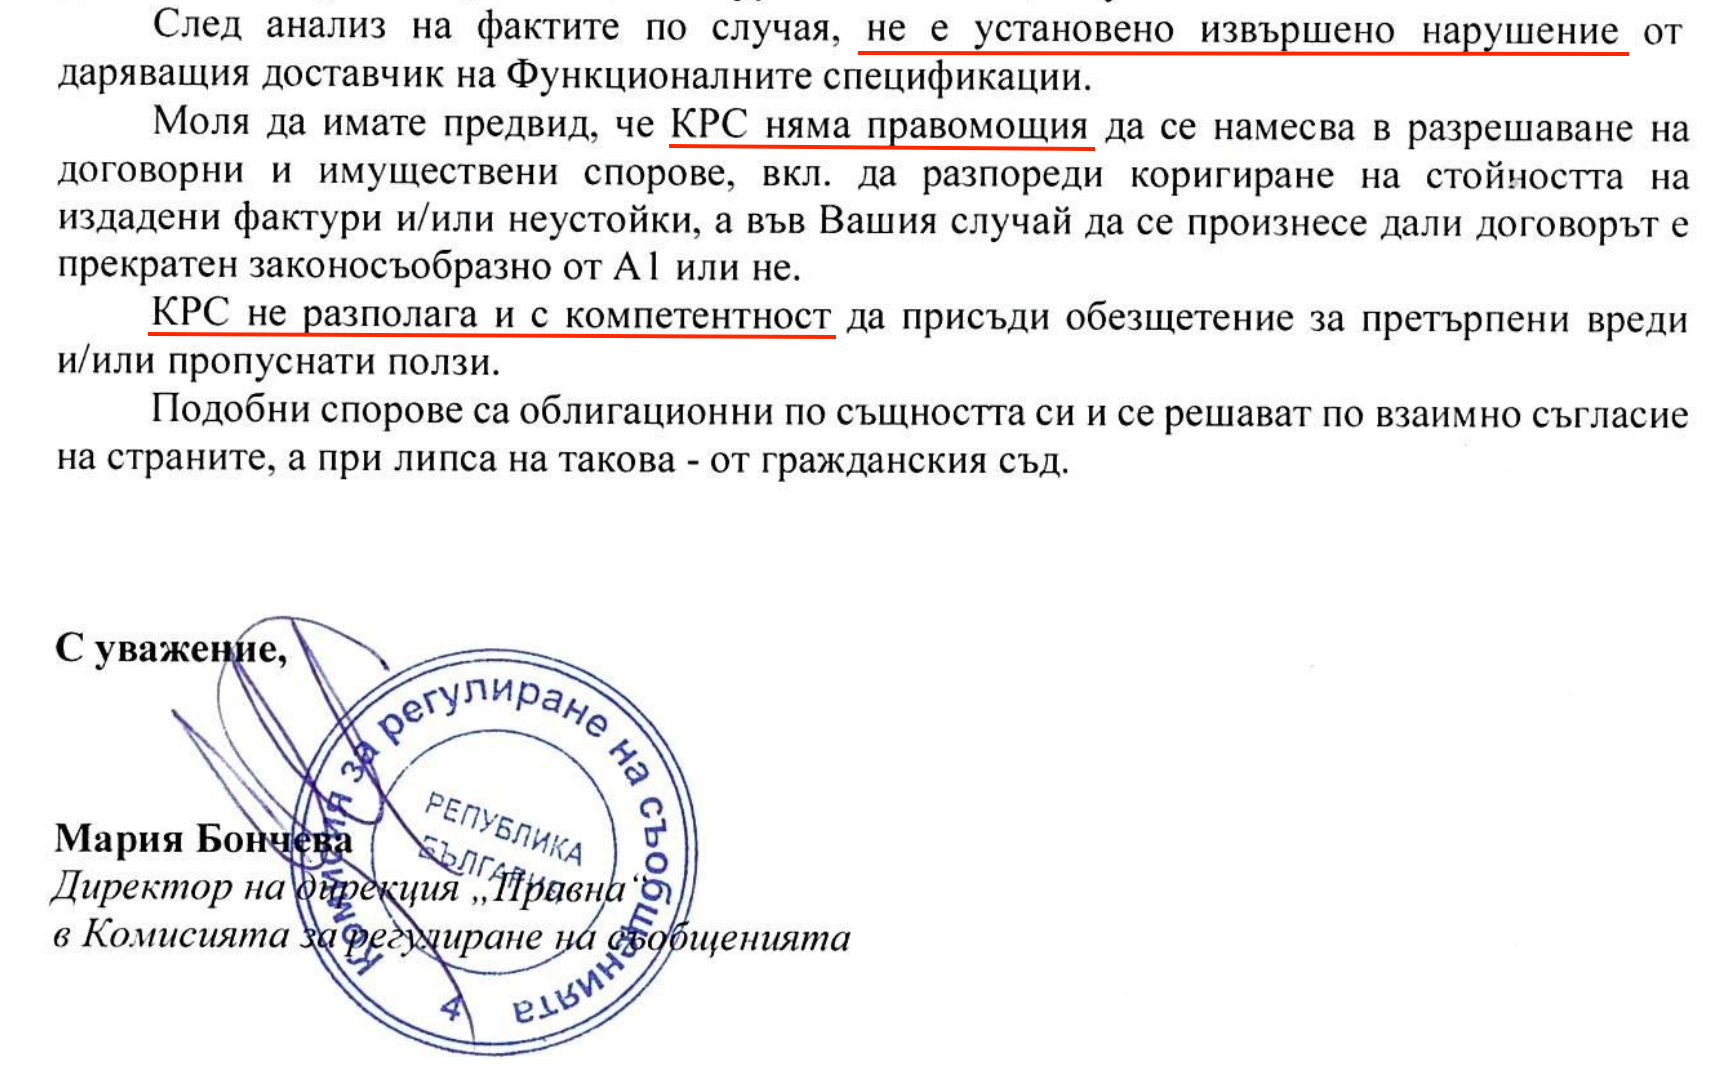
КРС подчертава и че „няма правомощия да се намесва в разрешаване на договорни и имуществени спорове“, а в конкретния случай – „да се произнесе дали договорът е прекратен законосъобразно от A1, или не“.

От А1 с любов

Дали от „A1 България“ не разчитат именно на това?

Те формално изпълняват регулаторните изисквания, но си позволяват търговски практики, граничещи с изнудване, защото разчитат, че клиентите им ще се огънат, осъзнавайки колко трудно ще е да защитят правата си, освен по съдебен път. Въпреки че това е скъп и бавен процес, Борислав Минков е категоричен, че ще съди „A1 България“. И не е сам в това си намерение.

И още от същото

Месец след случая с „Новарто“ разговарям с Николай Александриев, управител на транспортната компания „Никми Транс“, и историята, която той споделя, е сякаш копирана под индиго. По думите му, неговата фирма е клиент на „A1 България“ от поне 15 години и никога през това време не са имали нагласата да сменят своя мобилен оператор. Александриев твърди, че месечните им сметки към A1 са били между 2500 и 3500 лв., което включва услуги за мобилна телефония, интернет, телевизия и GPS контрол на превозните им средства.

С годините обаче договорът им с А1 започва да изглежда все по-неизгоден, особено в сравнение с предложенията на други телекоми. „И въпреки това – споделя с мен Николай Александриев – аз им казах, че не искам да сменям оператора, а искам да ми предложат това, което бих получил другаде.“ Обещават му го, но връщат проектодоговор, в който това не личи. „Дадох го на мои служители да го прочетат, да не би аз нещо да пропускам“, отбелязва Александриев с неприкрита ирония.

Обажда им се, че предложението не е каквото е очаквал, провеждат среща в офиса му на 26 юни, около 16 ч., и получава уверения от своя акаунт мениджър, че ще говорят отново на следващия ден. На 27 юни обаче, в 9:02 ч., Александриев получава SMS, че всички договори и услуги се прекратяват едностранно от „А1 България“.

Камионите ми са по Европа и останах без комуникация с шофьорите. Добре че повечето имаха и лични телефони. Обадих се от друг телефон на акаунт мениджъра ни Стоян, който ми обясни, че причината за прекратяването е, защото не сме подписали договора. Майка ми, която е служителка във фирмата, също го намира по Viber и той ѝ казва същото: „Подпишете си договора и веднага ще ви бъдат пуснати услугите.“

„Договорът ви беше ли вече изтекъл?“, питам г-н Александриев. „Да, беше изтекъл, но имам клауза, според която той се превръща в безсрочен, а не се прекратява.“ Питам го и дали има официално становище все пак на какво основание операторът прави това. „Поради неплатени фактури – отговаря той, – но срокът ми за плащане е до 29 юни, а това се случва на 27-ми.“

Разговорът ни приключва с категорична декларация от негова страна, че ще води дело срещу „А1 България“.

Докато разнищвах двата случая, се запознах и с друг човек, вече пенсионер, оттеглил се от бизнеса, но преди две-три години преминал през много подобна ситуация. Неговият разказ потвърждава, че

тези практики на „А1 България“ не са нови.

Разговарях с Кирил Паскалев по телефона, а случаят е свързан с фирмата, която е представлявал – „Майнинг Конструкшън Къмпани“. Един ден услугите, които „A1 България“ предоставя на компанията, са спрени, а на Паскалев му е обяснено, че ще бъдат подновени само ако преподпише нов договор с нови условия. Те са по-неизгодни от тези, на които фирмата му е била досега. Паскалев подписва договора, за да спаси номерата си, и веднага след като услугите са възстановени, подава искане за пренос към друг оператор, след което плаща и неустойка на „A1 България“ за прекратения толкова скоро нов договор. Откупил се скъпо, но за фирмата било много важно да запази номерата, с които е известна на клиентите си.

Задънена улица

Успях да стигна до тези няколко случая без особени усилия. Имам и премълчани истории, които потърпевшите не желаят да споделят публично, защото все още са в някакви взаимоотношения с A1 и не искат допълнителни проблеми. Вероятно и други като тях са преглътнали и премълчали, защото се оказва, че един телеком е в състояние да спре комуникациите, а така – и бизнеса на свои клиенти, позовавайки се на изсмукани от пръстите причини. С едничката цел да запази месечните си обороти. И може да превърне тази лоша търговска практика в модел.

Потърпевшите компании не могат да разчитат на Комисията за защита на потребителите, защото договорите им с други контрагенти са търговски взаимоотношения. Комисията за регулиране на съобщенията се ограничава до контрола върху техническите и функционалните спецификации. А за да се сезира Комисията за защита на конкуренцията, е нужна специална ситуация, свързана с директен конкурент.

Така за фирмите остава да разчитат единствено на съда, където процедурата е бавна, развръзката ще отнеме месеци или години, а те през това време трябва да работят, тоест да разполагат със средства за комуникация с клиентите си и служителите си. Не могат и да претендират за хипотетични нанесени вреди, макар те да са очевидни – всички юристи, с които „Тоест“ се консултира, потвърдиха, че трудно се признават пропуснати ползи, защото съдът изисква реални измерими доказателства.

Всичко това е известно на телекомите.

Остава единствено моралният компас дали да се възползват от това „пазарно предимство“.

Цитираните в материала казуси са свързани с A1, защото първият случай ме провокира да потърся и други, но това съвсем не означава, че същите похвати не може да се използват и от други телекоми. Източник на „Тоест“, обвързан с A1, но пожелал анонимност, твърди, че тези и подобни практики са привнесени от друг оператор заедно с хора от висшия мениджмънт, които са преминали от единия отбор в другия.

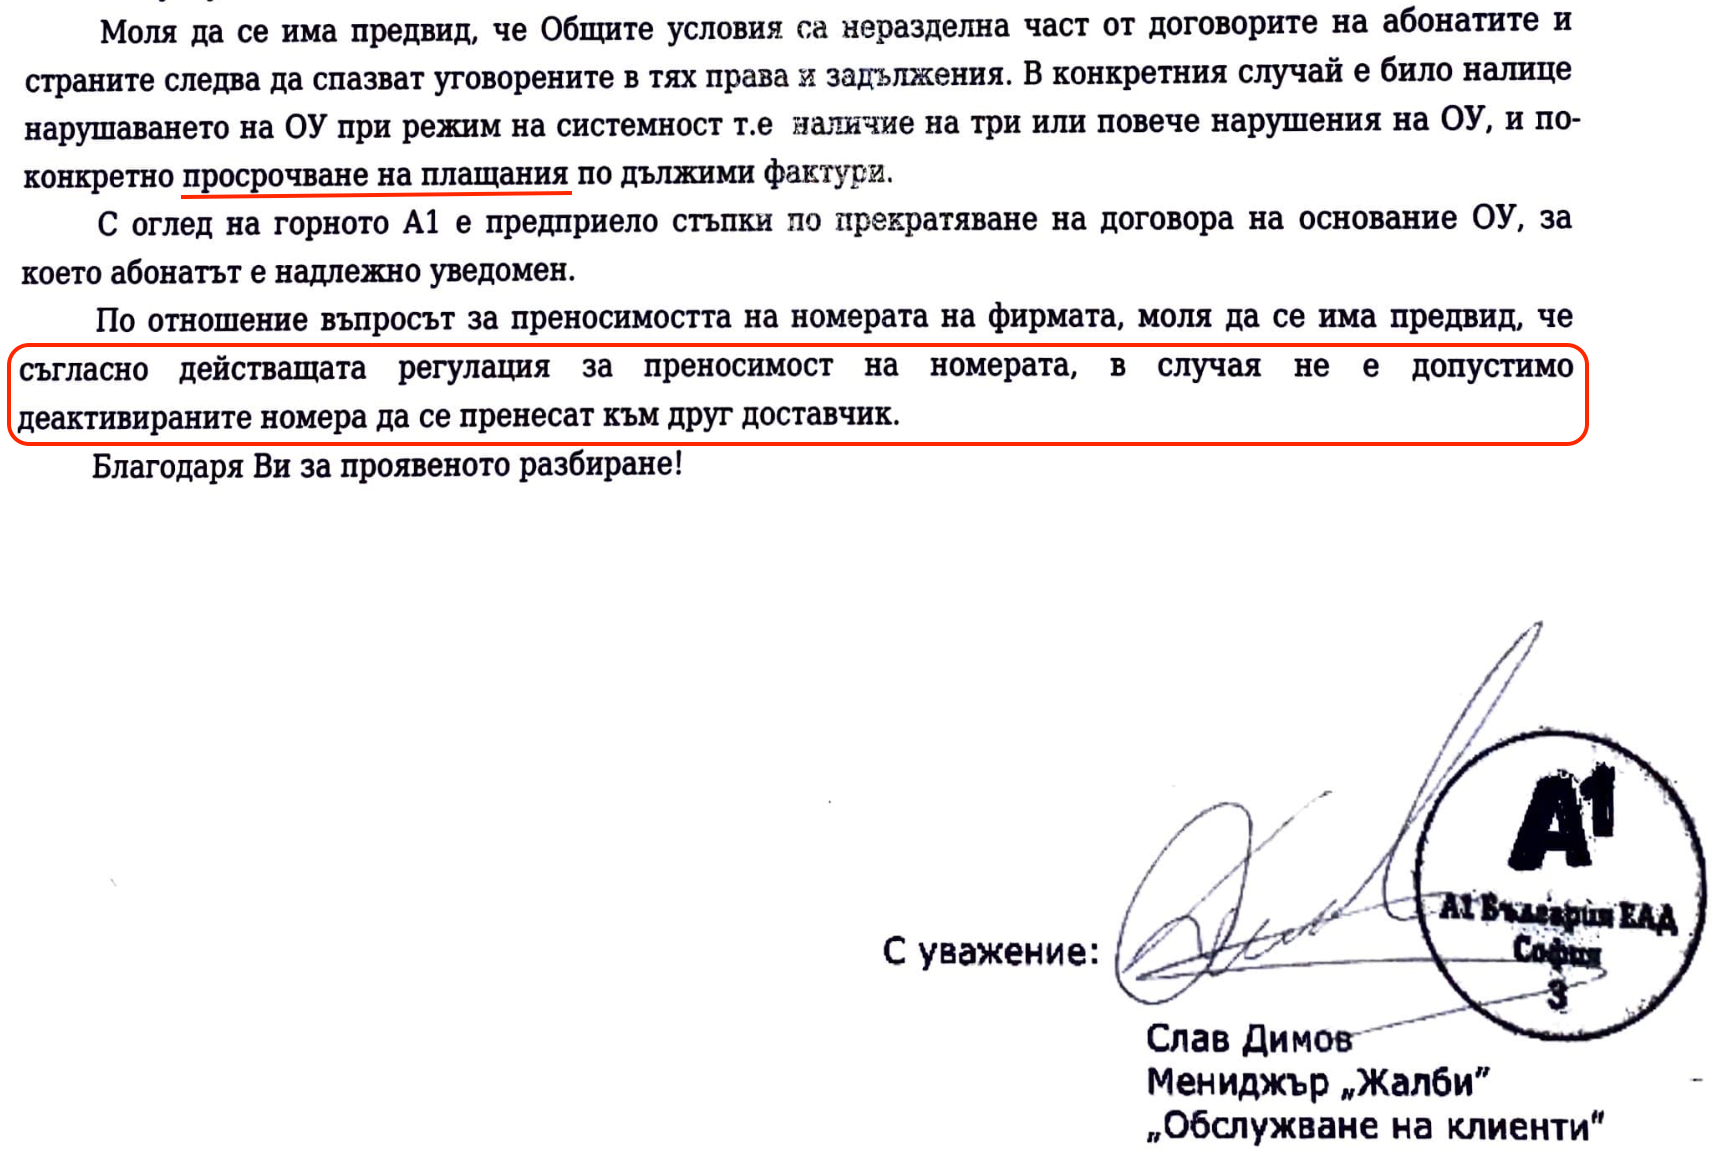
„Съгласно действащата регулация – пише Слав Димов, мениджър „Жалби“ в A1 – в случая не е допустимо деактивираните номера да се пренесат към друг доставчик.“ Това е повече от признание, че в действащата регулация е намерена много удобна вратичка: едностранно, с един имейл или SMS, в рамките на час или дори незабавно прекратяваш договора с клиента (правомерно или не – после ще спорим в съда, ако изобщо стигнем дотам); той не може да си пренесе номерата към друг оператор, защото са деактивирани, тоест несъществуващи; така поставяш клиента пред дилемата да загуби номерата си, а оттам – и връзката с клиентите си, или да преподпише с теб при каквито условия определиш.

Наложително е тази вратичка спешно да бъде затворена. Ако ни пука за бизнеса на всички ни.

How Cloudflare is staying ahead of the AMD Zen vulnerability known as “Zenbleed”

Post Syndicated from Derek Chamorro original http://blog.cloudflare.com/zenbleed-vulnerability/

How Cloudflare is staying ahead of the AMD Zen vulnerability known as “Zenbleed”

How Cloudflare is staying ahead of the AMD Zen vulnerability known as “Zenbleed”

Google Project Zero revealed a new flaw in AMD's Zen 2 processors in a blog post today. The 'Zenbleed' flaw affects the entire Zen 2 product stack, from AMD's EPYC data center processors to the Ryzen 3000 CPUs, and can be exploited to steal sensitive data stored in the CPU, including encryption keys and login credentials. The attack can even be carried out remotely through JavaScript on a website, meaning that the attacker need not have physical access to the computer or server.

Cloudflare’s network includes servers using AMD’s Zen line of CPUs. We have patched our entire fleet of potentially impacted servers with AMD’s microcode to mitigate this potential vulnerability. While our network is now protected from this vulnerability, we will continue to monitor for any signs of attempted exploitation of the vulnerability and will report on any attempts we discover in the wild. To better understand the Zenbleed vulnerability, read on.

Background

Understanding how a CPU executes programs is crucial to comprehending the attack's workings. The CPU works with an arithmetic processing unit called the ALU. The ALU is used to perform mathematical tasks. Operations like addition, multiplication, and floating-point calculations fall under this category. The CPU's clock signal controls the application-specific digital circuitry that the ALU uses to carry out these functions.

For data to reach  the ALU, it has to pass through a series of storage systems. These include secondary memory, primary memory, cache memory, and CPU registers. Since the registers of the CPU are the target of this attack, we will go into a little more depth. Depending on the design of the computer, the CPU registers can store either 32 or 64 bits of information. The ALU can access the data in these registers and complete the operation.

As the demands on CPUs have increased, there has been a need for faster ways to perform calculations. Advanced Vector Extensions (or AVX) were developed to speed up the processing of large data sets by applications. AVX are extensions to the x86 instruction set architecture, which are relevant to x86-based CPUs from Intel and AMD. With the help of compatible software and the extra instruction set, compatible processors could handle more complex tasks. The primary motivation for developing this instruction set was to speed up operations associated with data compression, image processing, and cryptographic computations.

The vector data used by AVX instructions is stored in 16 YMM registers, each of which is 256 bits in size. The Y-register in the XMM register set is where the 128-bit values are stored, hence the name. Instructions from the arithmetic, logic, and trigonometry families of the AVX standard all make use of the YMM registers. They can also be used to keep masks, data that is used to filter out certain vector components.

Vectorized operations can be executed with great efficiency using the YMM registers. Applications that process large amounts of data stand to gain significantly from them, but they are increasingly the focus of malicious activity.

The attack

Speculative execution attacks have previously been used to compromise CPU registers. These are an attack variant that takes advantage of the speculative execution capabilities of modern CPUs. Computer processors use a method called speculative execution to speed up processing times. A CPU will execute an instruction speculatively if it has no way of knowing whether or not it will be executed. If it turns out that the CPU was unable to carry out the instruction, it will simply discard the data.

Because of their potential use for storing private information, AVX registers are especially susceptible to these kinds of attacks. Cryptographic keys and passwords, for instance, could be accessed by an attacker via a speculative execution attack on the AVX registers.

As mentioned above, Project Zero discovered a vulnerability in AMD's Zen 2-architecture-based CPUs, wherein data from another process and/or thread could be stored in the YMM registers, a 256-bit series of extended registers, potentially allowing an attacker access to sensitive information. This vulnerability is caused by a register not being written to 0 correctly under specific microarchitectural circumstances. Although this error is associated with speculative execution, it is not a side channel vulnerability.

This attack works by manipulating register files to force a mispredicted command. First, there is a trigger to XMM Register Merge Optimization2, which ironically is a hardware mitigation that can be used to protect against speculative execution attacks, followed by a register remapping (a technique used in computer processor design to resolve name conflicts between physical registers and logical registers) and then a mispredicted instruction call to vzeroupper, an instruction that is used to zero the upper half of the YMM and ZMM registers.

Since the register file is shared by all the processes running on the same physical core, this exploit can be used to eavesdrop on even the most fundamental system operations by monitoring the data being transferred between the CPU and the rest of the computer.

Fixing the bleed

Because of the exact timing for this to successfully execute, this vulnerability, CVE-2023-20593, is classified with a CVSS score of 6.5 (Medium). AMD's mitigation is implemented via the MSR register, which turns off a floating point optimization that otherwise would have allowed a move operation.

The following microcode updates have applied to our entire server fleet that contain potentially affected AMD Zen processors. We have seen no evidence of the bug being exploited and were able to patch our entire network within hours of the vulnerability’s disclosure. We will continue to monitor traffic across our network for any attempts to exploit the bug and report on our findings.

AWS Week in Review – Redshift+Forecast, CodeCatalyst+GitHub, Lex Analytics, Llama 2, and Much More – July 24, 2023

Post Syndicated from Jeff Barr original https://aws.amazon.com/blogs/aws/aws-week-in-review-redshiftforecast-codecatalystgithub-lex-analytics-llama-2-and-much-more-july-24-2023/

Summer is in full swing here in Seattle and we are spending more time outside and less at the keyboard. Nevertheless, the launch machine is running at full speed and I have plenty to share with you today. Let’s dive in and take a look!

Last Week’s Launches
Here are some launches that caught my eye:

Amazon Redshift – Amazon Redshift ML can now make use of an integrated connection to Amazon Forecast. You can now use SQL statements of the form CREATE MODEL to create and train forecasting models from your time series data stored in Redshift, and then use these models to make forecasts for revenue, inventory, demand, and so forth. You can also define probability metrics and use them to generate forecasts. To learn more, read the What’s New and the Developer’s Guide.

Amazon CodeCatalyst – You can now trigger Amazon CodeCatalyst workflows from pull request events in linked GitHub repositories. The workflows can perform build, test, and deployment operations, and can be triggered when the pull requests in the linked repositories are opened, revised, or closed. To learn more, read Using GitHub Repositories with CodeCatalyst.

Amazon Lex – You can now use the Analytics on Amazon Lex dashboard to review data-driven insights that will help you to improve the performance of your Lex bots. You get a snapshot of your key metrics, and the ability to drill down for more. You can use conversational flow visualizations to see how users navigate across intents, and you can review individual conversations to make qualitative assessments. To learn more, read the What’s New and the Analytics Overview.

Llama2 Foundation Models – The brand-new Llama 2 foundation models from Meta are now available in Amazon SageMaker JumpStart. The Llama 2 model is available in three parameter sizes (7B, 13B, and 70B) with pretrained and fine-tuned variations. You can deploy and use the models with a few clicks in Amazon SageMaker Studio, and you can also use the SageMaker Python SDK (code and docs) to access them programmatically. To learn more, read Llama 2 Foundation Models from Meta are Now Available in Amazon SageMaker JumpStart and the What’s New.

X in Y – We launched some existing services and instances types in additional AWS Regions:

For a full list of AWS announcements, be sure to keep an eye on the What’s New at AWS page.

Other AWS News
Here are some additional blog posts and news items that you might find interesting:

AWS Open Source News and Updates – My colleague Ricardo has published issue 166 of his legendary and highly informative AWS Open Source Newsletter!

CodeWhisperer in Action – My colleague Danilo wrote an interesting post to show you how to Reimagine Software Development With CodeWhisperer as Your AI Coding Companion.

News Blog Survey – If you have read this far, please consider taking the AWS Blog Customer Survey. Your responses will help us to gauge your satisfaction with this blog, and will help us to do a better job in the future. This survey is hosted by an external company, so the link does not lead to our web site. AWS handles your information as described in the AWS Privacy Notice.

CDK Integration Tests – The AWS Application Management Blog wrote a post to show you How to Write and Execute Integration Tests for AWS CDK Applications.

Event-Driven Architectures – The AWS Architecture Blog shared some Best Practices for Implementing Event-Driven Architectures in Your Organization.

Amazon Connect – The AWS Contact Center Blog explained how to Manage Prompts Programmatically with Amazon Connect.

Rodents – The AWS Machine Learning Blog showed you how to Analyze Rodent Infestation Using Amazon SageMaker Geospatial Capabilities.

Secrets Migration – The AWS Security Blog published a two-part series that discusses migrating your secrets to AWS Secrets Manager (Part 1: Discovery and Design, Part 2: Implementation).

Upcoming AWS Events
Check your calendar and sign up for these AWS events:

AWS Storage Day – Join us virtually on August 9th to learn about how to prepare for AI/ML, deliver holistic data protection, and optimize storage costs for your on-premises and cloud data. Register now.

AWS Global Summits – Attend the upcoming AWS Summits in New York (July 26), Taiwan (August 2 & 3), São Paulo (August 3), and Mexico City (August 30).

AWS Community Days – Attend upcoming AWS Community Days in The Philippines (July 29-30), Colombia (August 12), and West Africa (August 19).

re:Invent – Register now for re:Invent 2023 in Las Vegas (November 27 to December 1).

That’s a Wrap
And that’s about it for this week. I’ll be sharing additional news this coming Friday on AWS on Air – tune in and say hello!

— Jeff;

Zenbleed: an AMD Zen 2 speculative vulnerability

Post Syndicated from original https://lwn.net/Articles/939099/

Tavis Ormandy reports
on a vulnerability that he has found in “all Zen 2 class processors”
from AMD. (Wayback Machine link as the original site is overloaded.) It can
allow local attackers to recover data used in string
operations; “If you remove the first word from the string ‘hello world’,
what should the result be? This is the story of how we discovered that the
answer could be your root password!
” The report has lots of details,
including an exploit; AMD has released a microcode
update
to address the problem.

We now know that basic operations like strlen, memcpy and strcmp will use
the vector registers – so we can effectively spy on those operations
happening anywhere on the system! It doesn’t matter if they’re happening in
other virtual machines, sandboxes, containers, processes, whatever!

This works because the register file is shared by everything on the same
physical core. In fact, two hyperthreads even share the same physical
register file.

[$] Randomness for kmalloc()

Post Syndicated from original https://lwn.net/Articles/938637/

The kernel’s address-space layout randomization is intended to make life
harder for attackers by changing the placement of kernel text and data at
each boot. With this randomization, an attacker cannot know ahead of time
where a vulnerable target will be found on any given system. There are
techniques, though, that can be effective without knowing precisely where a
given object is stored. As a way of hardening systems against such
attacks, the kernel will be gaining yet another form of randomization.

Debian adds RISC-V as an official architecture

Post Syndicated from original https://lwn.net/Articles/939095/

The Debian project is now
supporting 64-bit RISC-V systems
as an official architecture. Some
work remains to be done, though:

However before you rush to update your sources.list file, I want to
warn you that the archive is currently almost empty, and that only
the sid and experimental suites are available. The procedure is to
rebootstrap the port within the official archive, which means we
won’t import the full debian-ports archive.

Best practices for implementing event-driven architectures in your organization

Post Syndicated from Emanuele Levi original https://aws.amazon.com/blogs/architecture/best-practices-for-implementing-event-driven-architectures-in-your-organization/

Event-driven architectures (EDA) are made up of components that detect business actions and changes in state, and encode this information in event notifications. Event-driven patterns are becoming more widespread in modern architectures because:

  • they are the main invocation mechanism in serverless patterns.
  • they are the preferred pattern for decoupling microservices, where asynchronous communications and event persistence are paramount.
  • they are widely adopted as a loose-coupling mechanism between systems in different business domains, such as third-party or on-premises systems.

Event-driven patterns have the advantage of enabling team independence through the decoupling and decentralization of responsibilities. This decentralization trend in turn, permits companies to move with unprecedented agility, enhancing feature development velocity.

In this blog, we’ll explore the crucial components and architectural decisions you should consider when adopting event-driven patterns, and provide some guidance on organizational structures.

Division of responsibilities

The communications flow in EDA (see What is EDA?) is initiated by the occurrence of an event. Most production-grade event-driven implementations have three main components, as shown in Figure 1: producers, message brokers, and consumers.

Three main components of an event-driven architecture

Figure 1. Three main components of an event-driven architecture

Producers, message brokers, and consumers typically assume the following roles:

Producers

Producers are responsible for publishing the events as they happen. They are the owners of the event schema (data structure) and semantics (meaning of the fields, such as the meaning of the value of an enum field). As this is the only contract (coupling) between producers and the downstream components of the system, the schema and its semantics are crucial in EDA. Producers are responsible for implementing a change management process, which involves both non-breaking and breaking changes. With introduction of breaking changes, consumers are able to negotiate the migration process with producers.

Producers are “consumer agnostic”, as their boundary of responsibility ends when an event is published.

Message brokers

Message brokers are responsible for the durability of the events, and will keep an event available for consumption until it is successfully processed. Message brokers ensure that producers are able to publish events for consumers to consume, and they regulate access and permissions to publish and consume messages.

Message brokers are largely “events agnostic”, and do not generally access or interpret the event content. However, some systems provide a routing mechanism based on the event payload or metadata.

Consumers

Consumers are responsible for consuming events, and own the semantics of the effect of events. Consumers are usually bounded to one business context. This means the same event will have different effect semantics for different consumers. Crucial architectural choices when implementing a consumer involve the handling of unsuccessful message deliveries or duplicate messages. Depending on the business interpretation of the event, when recovering from failure a consumer might permit duplicate events, such as with an idempotent consumer pattern.

Crucially, consumers are “producer agnostic”, and their boundary of responsibility begins when an event is ready for consumption. This allows new consumers to onboard into the system without changing the producer contracts.

Team independence

In order to enforce the division of responsibilities, companies should organize their technical teams by ownership of producers, message brokers, and consumers. Although the ownership of producers and consumers is straightforward in an EDA implementation, the ownership of the message broker may not be. Different approaches can be taken to identify message broker ownership depending on your organizational structure.

Decentralized ownership

Ownership of the message broker in a decentralized ownership organizational structure

Figure 2. Ownership of the message broker in a decentralized ownership organizational structure

In a decentralized ownership organizational structure (see Figure 2), the teams producing events are responsible for managing their own message brokers and the durability and availability of the events for consumers.

The adoption of topic fanout patterns based on Amazon Simple Queue Service (SQS) and Amazon Simple Notification Service (SNS) (see Figure 3), can help companies implement a decentralized ownership pattern. A bus-based pattern using Amazon EventBridge can also be similarly utilized (see Figure 4).

Topic fanout pattern based on Amazon SQS and Amazon SNS

Figure 3. Topic fanout pattern based on Amazon SQS and Amazon SNS

Events bus pattern based on Amazon EventBridge

Figure 4. Events bus pattern based on Amazon EventBridge

The decentralized ownership approach has the advantage of promoting team independence, but it is not a fit for every organization. In order to be implemented effectively, a well-established DevOps culture is necessary. In this scenario, the producing teams are responsible for managing the message broker infrastructure and the non-functional requirements standards.

Centralized ownership

Ownership of the message broker in a centralized ownership organizational structure

Figure 5. Ownership of the message broker in a centralized ownership organizational structure

In a centralized ownership organizational structure, a central team (we’ll call it the platform team) is responsible for the management of the message broker (see Figure 5). Having a specialized platform team offers the advantage of standardized implementation of non-functional requirements, such as reliability, availability, and security. One disadvantage is that the platform team is a single point of failure in both the development and deployment lifecycle. This could become a bottleneck and put team independence and operational efficiency at risk.

Streaming pattern based on Amazon MSK and Kinesis Data Streams

Figure 6. Streaming pattern based on Amazon MSK and Kinesis Data Streams

On top of the implementation patterns mentioned in the previous section, the presence of a dedicated team makes it easier to implement streaming patterns. In this case, a deeper understanding on how the data is partitioned and how the system scales is required. Streaming patterns can be implemented using services such as Amazon Managed Streaming for Apache Kafka (MSK) or Amazon Kinesis Data Streams (see Figure 6).

Best practices for implementing event-driven architectures in your organization

The centralized and decentralized ownership organizational structures enhance team independence or standardization of non-functional requirements respectively. However, they introduce possible limits to the growth of the engineering function in a company. Inspired by the two approaches, you can implement a set of best practices which are aimed at minimizing those limitations.

Best practices for implementing event-driven architectures

Figure 7. Best practices for implementing event-driven architectures

  1. Introduce a cloud center of excellence (CCoE). A CCoE standardizes non-functional implementation across engineering teams. In order to promote a strong DevOps culture, the CCoE should not take the form of an external independent team, but rather be a collection of individual members representing the various engineering teams.
  2. Decentralize team ownership. Decentralize ownership and maintenance of the message broker to producing teams. This will maximize team independence and agility. It empowers the team to use the right tool for the right job, as long as they conform to the CCoE guidelines.
  3. Centralize logging standards and observability strategies. Although it is a best practice to decentralize team ownership of the components of an event-driven architecture, logging standards and observability strategies should be centralized and standardized across the engineering function. This centralization provides for end-to-end tracing of requests and events, which are powerful diagnosis tools in case of any failure.

Conclusion

In this post, we have described the main architectural components of an event-driven architecture, and identified the ownership of the message broker as one of the most important architectural choices you can make. We have described a centralized and decentralized organizational approach, presenting the strengths of the two approaches, as well as the limits they impose on the growth of your engineering organization. We have provided some best practices you can implement in your organization to minimize these limitations.

Further reading:
To start your journey building event-driven architectures in AWS, explore the following:

Inkscape 1.3 released

Post Syndicated from original https://lwn.net/Articles/939035/

Version
1.3
of the Inkscape drawing editor has been released. “With version
1.3 of Inkscape, you’ll find improved performance, several new features,
and a solid set of improvements to a few existing ones
“. Changes
include a new shape-builder tool, a “document resources” dialog for the
management of drawings, a new pattern editor, and more.

The collective thoughts of the interwebz