Tag Archives: апи

How to write a webhook for Zabbix

Post Syndicated from Andrey Biba original https://blog.zabbix.com/how-to-write-a-webhook-for-zabbix/25298/

As you know, a picture is worth a thousand words. Therefore, I would like to share the process of creating a webhook from scratch. In this article, we will walk through the creation process step by step – starting with studying the target service with which Zabbix will integrate and finishing with tests for sending events from Zabbix. Although it may seem complicated, writing your own integrations is not so difficult.

Preparation

First, we need to decide what we want to see as a result of the webhook. In most cases, the services to which we will send events are divided into 2 types:

  • Messengers to which you can send messages. For example, Telegram, Slack, Discord, etc.
  • Service Desks where you can open, close, and update tickets. For example, Jira, Redmine, ServiceNow, etc.

In both cases, the principle of creating a webhook will not differ – the difference is only in the complexity of one type from the other.

In this article, I will describe the process of creating a webhook for messengers – and specifically for Line messenger.

After we have decided on the type, we need to find out whether this service supports the possibility of API requests and, if it does, what is required for this. Usually, all the services you want to integrate Zabbix with have somewhat detailed documentation about the API methods they support. By the way, Zabbix also has its own API, which is documented in detail.

After we are done studying the Line documentation, we find out that messages are sent using the POST method to the https://api.line.me/v2/bot/message/push endpoint, using the Line bot token in the request header for authorization and passing a specially formatted JSON in the request body with the content of the message. Confused? No problem. Let’s take a closer look.

HTTP requests

The operation of the API is based on HTTP requests, which are executed with parameters provided by the developers of this API.

Several types of HTTP requests are used more often than others:

  • GET – is perhaps the most common one that all of us encounter on a daily basis. This request only involves getting data. For example, the browser used a GET request from the web server to fetch the article you are currently reading.
  • POST – is a request that sends data to a resource. This is exactly the case when we want to pass something to the service using API requests.
  • PUT – is much less common than the previous 2, but no less important. This query replaces the values in a resource.

These are not all HTTP request methods, but these three will suffice for a general introduction.

We are done with methods. Let’s move on to the endpoint.

An endpoint is a permanent address of a resource via which we transfer, receive, or change data. In this case, https://api.line.me/v2/bot/message/push is the endpoint that accepts POST requests to send messages.

So, the method and the endpoint are defined. What’s next?

Generally, any HTTP request consists of:

  1. URL
  2. Method
  3. Headers
  4. Body
HTTP request structure

We have already dealt with the first two, but the headers and the request body remain.

Headers usually contain service information that allows you to process a request correctly. For example, the Content-Type: application/json header implies that our request body should be interpreted as a json object. Also, quite often, authorization information is passed in the headers. As in the case of Line, the Authorization: Bearer {channel access token} header contains the authorization token of the bot on behalf of which messages will be sent.

The request body usually contains the information we want to pass on to the service. In our case, this will be the subject and body of the event in Zabbix.

Checking the service API

The documentation is good, but it is necessary to check that everything we read works exactly how it is documented. It is not uncommon that a service can be developed faster than the documentation can keep up with it. So field testing never hurts. Excluding unexpected behavior will significantly reduce the time spent searching for problems.

I recommend using Postman to work with API requests – a handy tool that saves time. But for this article, we will use cURL due to its prevalence and ease of use.

I will not describe the process of creating the Line Bot API token because this is not directly related to the article. However, for those interested in this process, I will leave a link here.

As we have already found out, the request type will be POST, the access point URL is https://api.line.me/v2/bot/message/push, and additional headers must be passed: Content-Type: application/json which specifies the type of data to be sent (in our case it is JSON) and Authorization: Bearer {token value}. And the messages themselves are in JSON format. For example, I used 2 messages – “Hello, world1” and “Hello, world2”. As a result, I got the following query:

After executing the request, we got the expected result of 2 messages that came to the messenger, which were in the request body.

Excellent! So half of the work has already been done: there is a ready-made request that works in manual mode and successfully sends messages to Line. The only thing left is to put the necessary information in the right places and automate the process using JS and Zabbix.

Integration with Zabbix

After successfully completing the tests, go to Zabbix, create a new notification method in the Administration section, select the webhook type, and name it Line.

For webhook integrations with external services, Zabbix uses the built-in JavaScript engine on Duktape. Parameters are passed to the script, which is used to build the logic of the webhook. As a result of the script, tags can be returned that will be assigned to the event. This is usually necessary in case of integration with service desks in order to be able to update the status of tickets.

Let’s take a closer look at the webhook setup interface.

The Media type section contains the general settings for the new media type:

  • Name – Name of the media type.
  • Type – The type of media type. There are 4 types: email, SMS, webhook, and script.
  • Parameters – This is a list of variables passed to the code. All necessary data can be passed through parameters: event id, event type, trigger severity, event source, etc. You can specify macros and text values in parameters. The parameters are passed as a JSON string, accessible through the built-in variable value.
  • Script – JS script describing the logic of the webhook.
  • Timeout – The time after which the script will be terminated.
  • Process tags   – If this option is enabled, the webhook will support generating tags for events sent using this hook.
  • Include event menu entry – This option makes the Menu Entry Name and Menu Entry URL fields available for use.
  • Menu entry name – The text displayed in the event dropdown menu for the Menu entry URL submitted using this hook.
  • Menu entry URL – A link to an external resource in the event menu.
  • Description – A text field that contains a description of the notification method.
  • Enabled – an Option that allows enabling or disabling the media type.

The Message templates section contains templates that are used by webhook to send alerts. Each template contains:

  • Message type – The event type to which the message will apply. For example, Problem – when the trigger fires and Problem recovery – when the problem is resolved.
  • Subject  – The headline of the message.
  • Message – A message template that contains useful information about the event. For example, event time, date, event name, host name, etc.

The Options section contains additional options:

  • Concurrent sessions – The number of concurrent sessions to send an alert.
  • Attempts – The number of retries in case of send failure.
  • Attempt interval  – The frequency of attempts to send an alert.

When writing your own webhook, you can take an existing one as a basis – Zabbix has more than thirty ready-made webhook solutions of varying complexity. All basic functions are usually repeated from hook to hook with little or no change at all, as are the parameters passed to them.

Let’s set the following parameters:

It is convenient to set parameter values with macros. A macro is a variable in Zabbix that contains a specific value. Macros allow you to optimize and automate your work. They can be used in various places, such as triggers, filters, alerts, and so on.

A little more about each macro separately in order to understand why each of them is needed:

  • {ALERT.SUBJECT} – The subject of the event message. This value is taken from the Subject field of the corresponding Message template type.
  • {ALERT.MESSAGE} – The event message body. This value is taken from the Message field of the corresponding Message template type.
  • {EVENT.ID} – The event id in Zabbix. Could be used for generating a link to an event
  • {EVENT.NSEVERITY} – The numerical definition of the event’s severity from 0-5. We will use this to change the message in case of different severity.
  • {EVENT.SOURCE} – The event source. Needed to handle events correctly. In most cases, we are interested in triggers; this corresponds to source value 0.
  • {EVENT.UPDATE.STATUS} – Returns 1 if it is an update event. For example, in case of acknowledge operations or a change in severity.
  • {EVENT.VALUE} – The event state. 0 for recovery and 1 for the problem.
  • {ALERT.SENDTO} – The field from the media type assigned to the user. It returns the ID of the user or group in the Line, where it will be necessary to send a message
  • {TRIGGER.DESCRIPTION} – A macro that will be expanded if the event source is a trigger. Returns the description of the trigger
  • {TRIGGER.ID} – The trigger ID. Required to generate a link to an event in Zabbix

Webhooks can use other macros if needed. A list of all macros can be viewed on the documentation page. Be careful – not all macros can be used in webhooks.

Writing the script

Before writing the script, let’s define the main points that the webhook will need to be able to perform:

  • the script should describe the logic for sending messages
  • handle possible errors
  • logging for debugging

I will not describe the entire code in order not to repeat the same type of blocks and concentrate only on important aspects.

To send messages, let’s write a function that will accept messages and params variables. We got the following function:

function sendMessage(messages, params) {
    // Declaring variables
    var response,
        request = new HttpRequest();

    // Adding the required headers to the request
    request.addHeader('Content-Type: application/json');
    request.addHeader('Authorization: Bearer ' + params.bot_token);

    // Forming the request that will send the message
    response = request.post('https://api.line.me/v2/bot/message/push', JSON.stringify({
        "to": params.send_to,
        "messages": messages
    }));

    // If the response is different from 200 (OK), return an error with the content of the response
    if (request.getStatus() !== 200) {
        throw "API request failed: " + response;
    }
}

Of course, this is not a reference function, and depending on the requirements for the request may differ. There may be other required headers and a different request body. In some cases, it may be necessary to add an additional step to obtain authorization data through another API request.

In this case, the request to send a message returns an empty {} object, so it makes no sense to return it from the function. But for example, when sending a message to Telegram, an object with data about this message is returned. If you pass this data to tags, you can write logic that will change the already sent message – for example, in case of closing or updating the problem.

Now let’s describe a function that will accept webhook parameters and validate their values. In the example, we will not describe all the conditions because they are of the same type:

function validateParams(params) {
    // Checking that the bot_token parameter is a string and not empty
    if (typeof params.bot_token !== 'string' || params.bot_token.trim() === '') {
        throw 'Field "bot_token" cannot be empty';
    }

    // Checking that the event_source parameter is only a number from 0-3
    if ([0, 1, 2, 3].indexOf(parseInt(params.event_source)) === -1) {
        throw 'Incorrect "event_source" parameter given: "' + params.event_source + '".nMust be 0-3.';
    }

    // If an event of type "Discovery" or "Autoregistration" set event_value 1, 
    // which means "Problem", and we will process these events same as problems
    if (params.event_source === '1' || params.event_source === '2') {
        params.event_value = '1';
    }

    ...

    // Checking that trigger_id is a number and not equal to zero
    if (isNaN(params.trigger_id) && params.event_source === '0') {
        throw 'field "trigger_id" is not a number';
    }
}

As you can see from the code, in most cases these are simple checks that allow you to avoid errors associated with the input data. Validation is necessary because there is no guarantee that the expected value will be in the parameter.

The main block of code is placed inside the try…catch block in order to correctly handle errors:

try {
    // Declaring the params variable and writing the webhook parameters to it
    var params = JSON.parse(value);

    // Calling the validation function and passing parameters to it for verification
    validateParams(params);

    // If the event is a trigger and it is in the problem status, compose the message body
    if (params.event_source === '0' && params.event_value === '1') {
        var line_message = [
            {
                "type": "text",
                "text": params.alert_subject + 'nn' +
                    params.alert_message + 'n' + params.trigger_description
            }
        ];
    }

    ...

    // Sending a composed message
    sendMessage(line_message, params);

    // Returning OK so that the webhook understands that the script has completed with OK status
    return 'OK';
}
catch (err) {
    // Adding a log function so in case of problems you can see the error in the Zabbix server console
    Zabbix.log(4, '[ Line Webhook ] Line notification failed : ' + err);

    // In case of an error, return it from the webhook
    throw 'Line notification failed : ' + err;
}

Here we assign parameter values to the params variable, then validate them using the validateParams() function, describe the main conditions for generating a message, and send this message to the messenger. At the same time, the try…catch block allows you to catch all errors, log them to Zabbix and return them in a readable form to the user in the web interface.

For writing webhooks in Zabbix, there is a guideline dedicated to this topic. Please read this information because it will help you write better code and avoid common mistakes.

Testing

After we’ve finished with the webhook script, it’s time to test how our code works. To do this, Zabbix provides a function to send test messages. Go to the AdministrationMedia types, find Line, and click on the Test button opposite it. In the window that appears, fill in all the fields with the necessary data and press the Test button. Check the messenger and see that the message came with the data we specified in the test.

Ready-made Line integration can be found in the Zabbix git repository and in all recent Zabbix instance builds.

Troubleshooting

Of course, everything in the article looks like I did it on the first attempt and did not encounter a single error or problem. Naturally, this is not the case in practice. Work with each new product includes Research & Development. How can you catch errors and, most importantly, understand the problem?

Well, as I wrote earlier – read the documentation and test all requests before writing code. At this stage, it is easiest to catch all the problems. The response to the HTTP request will explicitly describe the error. For example, if you make a mistake in the request body and send an object with incorrect values, the service will return the body with an error description and the response status 400 (Bad request).

There are several options for debugging in case of errors that may occur when writing a webhook script:

  • Focus on the errors displayed when the notification method is executed. For example, if you mistyped or set the wrong name of the function and variable.
  • Include logging in the code for displaying service information. For example, while you are in the script development stage, the result of the function can be logged using the Zabbix.log() function. Zabbix supports 6 debug levels (0-5), which can be set in this function. Usually, webhooks use level 4, which contains information for debugging.
  • Use the zabbix_js utility. You can transfer a file with a script and parameters to it. You can read more about it here.

Conclusion

I hope this article has helped you better understand how webhooks work in Zabbix and highlighted the basic steps for creating, diagnosing, and preparing to write your integration. The Zabbix community is constantly adding custom templates and media types. I expect that after reading this article, more people will be interested in creating their own webhooks and sharing them with the community. We appreciate any contribution to the development and expansion of the base of integration solutions.

Questions

Q: I don’t know JS, but I know other languages. Is native support of other languages planned in Zabbix, such as Python?

A: For now, there are no such plans.

Q: Are there any restrictions with writing a JS script for a webhook?

A: Yes, there are. The built-in Duktape engine is used to execute the code, and it does not have all the functionality that is available in the latest JS releases. Therefore, I recommend that you read the documentation of this engine and the built-in objects to learn more about the available methods.

Partnering with civil society to track Internet shutdowns with Radar Alerts and API

Post Syndicated from Jocelyn Woolbright original https://blog.cloudflare.com/partnering-with-civil-society-to-track-shutdowns/

Partnering with civil society to track Internet shutdowns with Radar Alerts and API

This post is also available in 简体中文, 繁體中文, 日本語, 한국어, Deutsch, Français and Español.

Partnering with civil society to track Internet shutdowns with Radar Alerts and API

Internet shutdowns have long been a tool in government toolboxes when it comes to silencing opposition and cutting off access from the outside world. The KeepItOn campaign by Access Now, a group that defends the digital rights of global Internet users, documented at least 182 Internet shutdowns in 34 countries in 2021. Many of these shutdowns occurred during public protests, elections, and wars as an extreme form of censorship in places like Afghanistan, Democratic Republic of the Congo, Ukraine, India, and Iran.

There are a range of ways governments block or slow communications, including throttling, IP blocking, DNS interference, mobile data shutoffs, and deep packet inspection, all with similar goals: exerting control over information.

Although Internet shutdowns are largely public, it is difficult to document and track the ways in which governments implement them. The shutdowns not only impact people’s ability to participate in civil and political life and the economy but also have grave consequences for trust in democratic institutions.

We have reported on these shutdowns in the past, and for Cloudflare Impact Week, we want to tell you more about how we work with civil society organizations to provide tools to track and document the scope of these disruptions. We want to support their critical work and provide the tools they need so they can demand accountability and condemn the use of shutdowns to silence dissent.

Radar Internet shutdown alerts for civil society

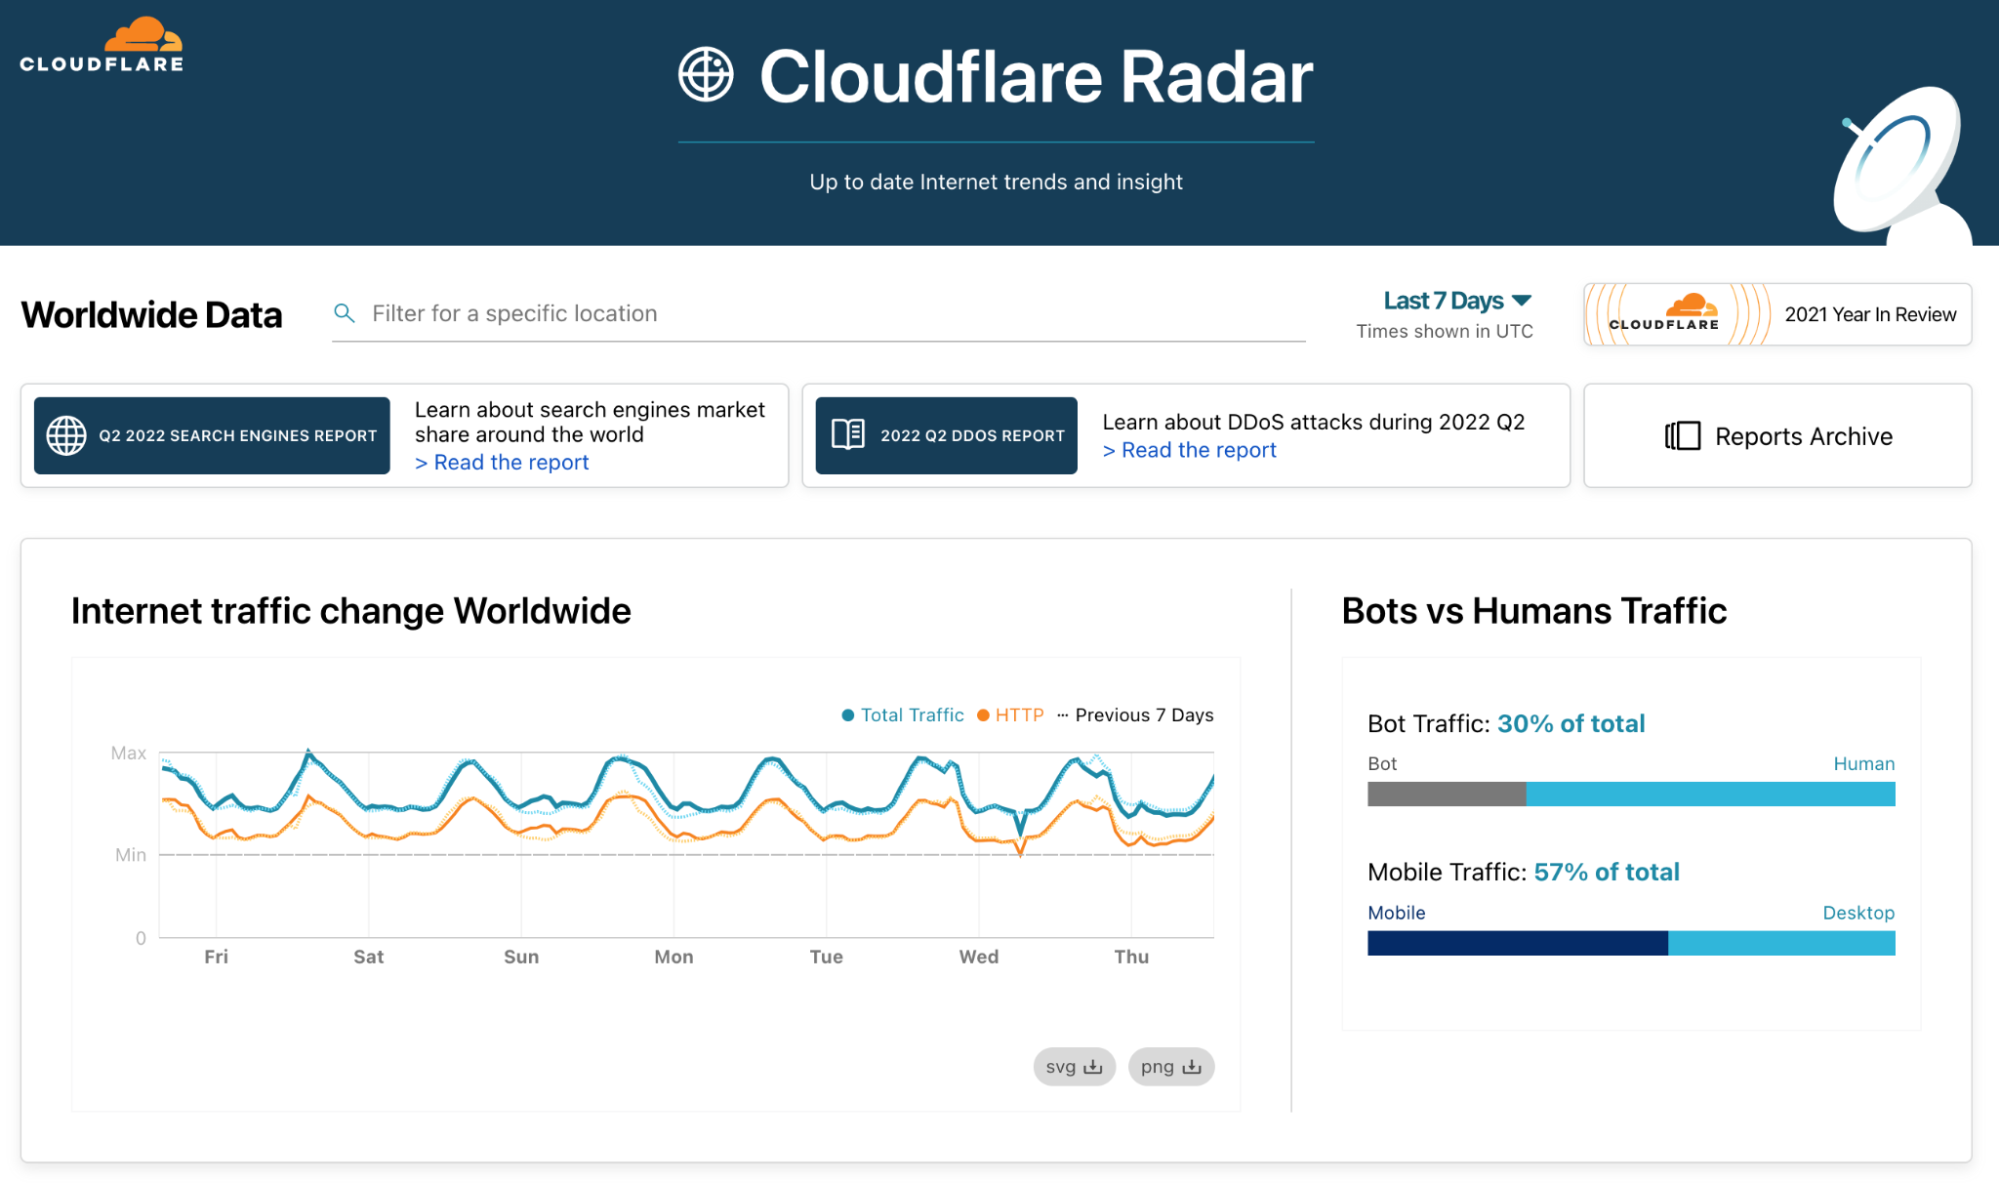
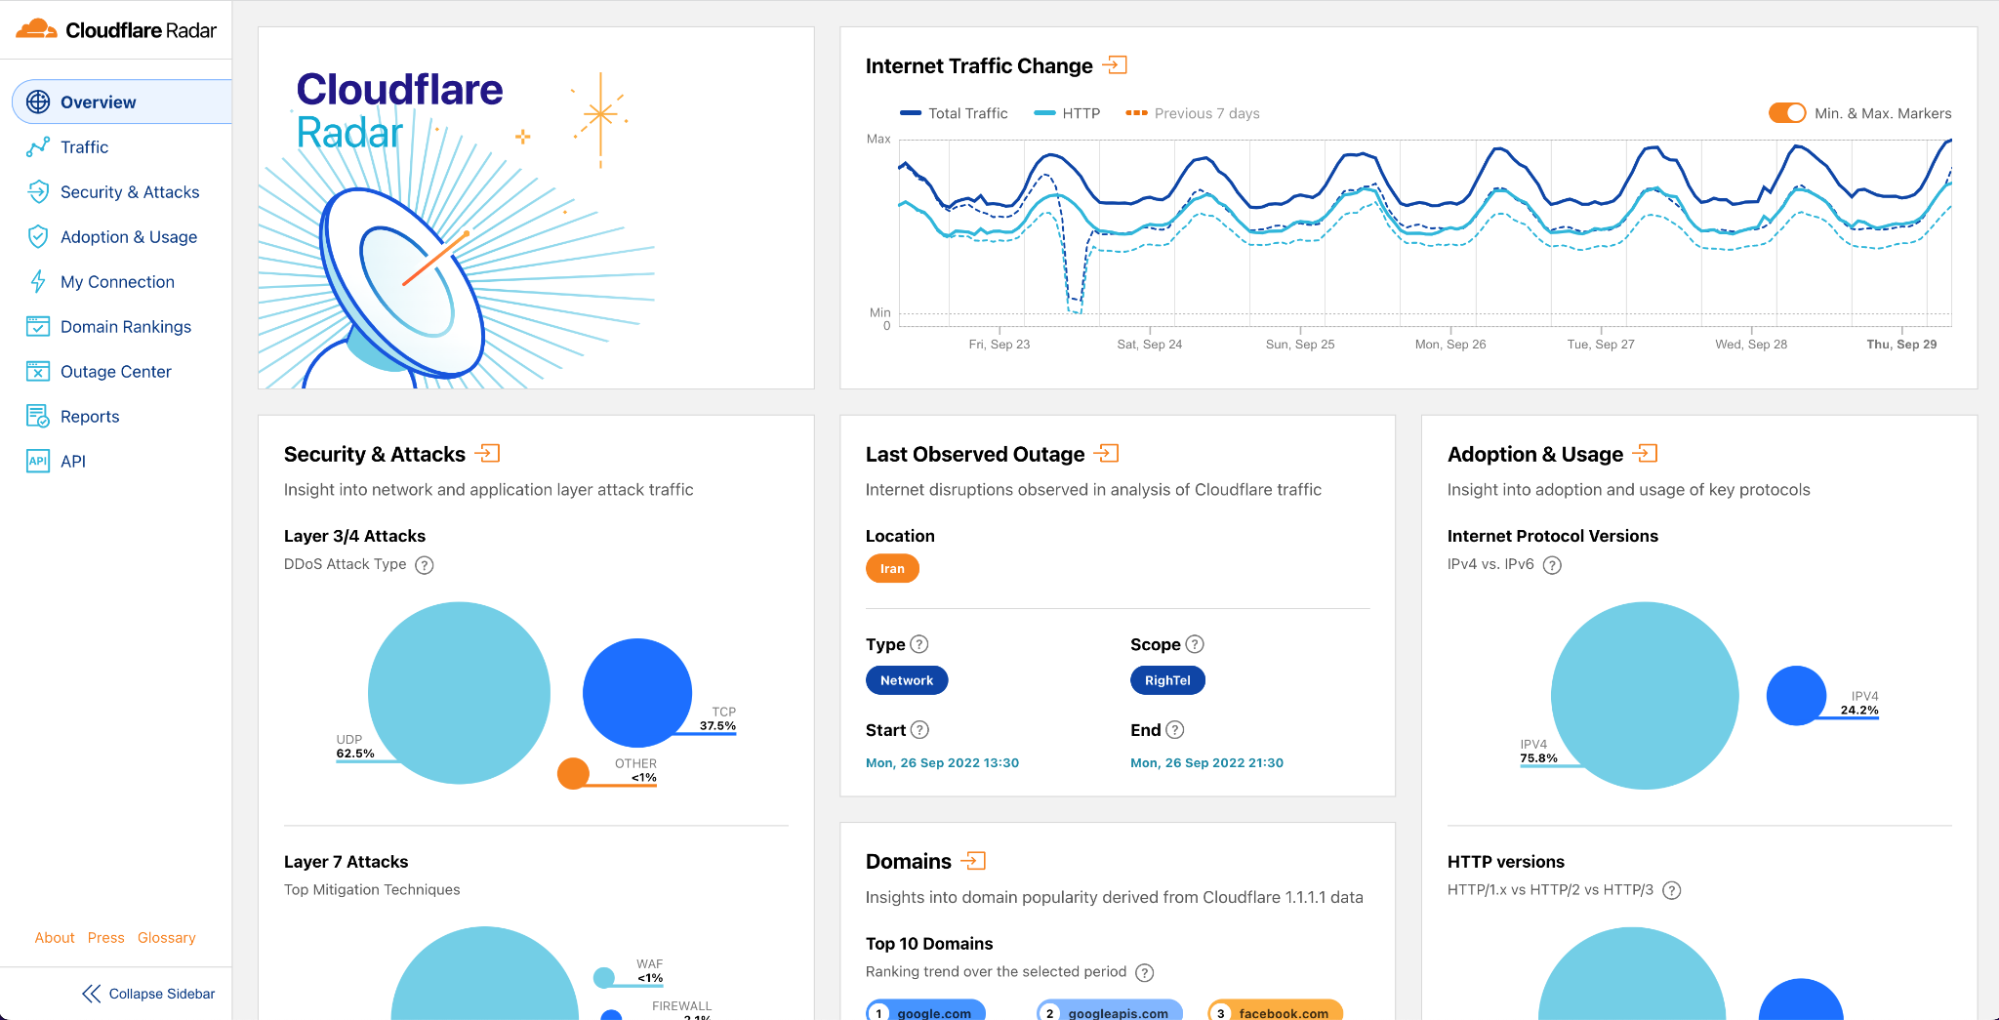
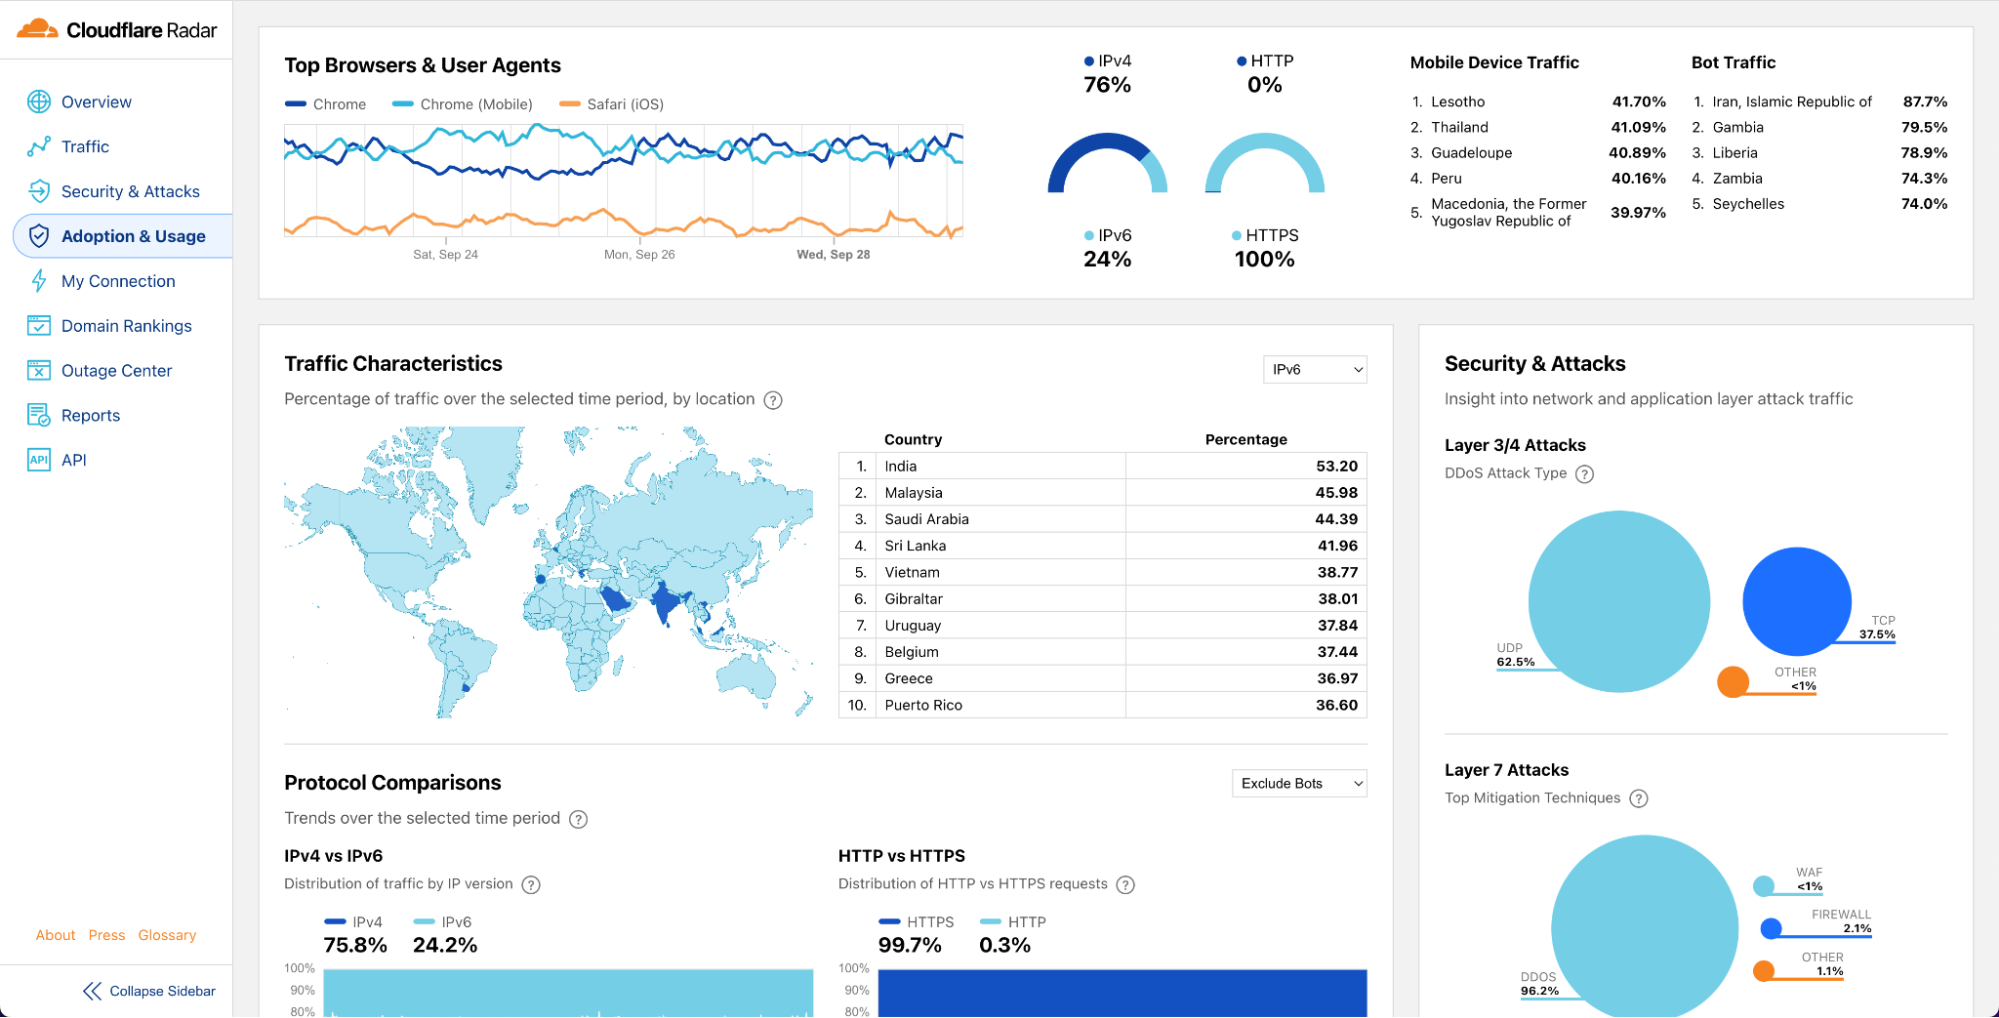
We launched Radar in 2020 to shine light on the Internet’s patterns, insights, threats, and trends based on aggregated data from our network. Once we launched Radar, we found that many civil society organizations and those who work in democracy-building use Radar to track trends in countries to better understand the rise and fall of Internet usage.

Internally, we had an alert system for potential Internet disruptions that we use as an early warning regarding shifts in network patterns and incidents. When we engaged with these organizations that use Radar to track Internet trends, we learned more about how our internal tool to identify traffic distributions could be useful for organizations that work with human rights defenders on the ground that are impacted by these shutdowns.

To determine the best way to provide a tool to alert organizations when Cloudflare has seen these disruptions, we spoke with organizations such as Access Now, Internews, The Carter Center, National Democratic Institute, Internet Society, and the International Foundation for Electoral Systems. After our conversations, we launched Radar Internet shutdown alerts in 2021 to provide alerts on when Cloudflare has detected significant drops in traffic with the hope that the information is used to document, track, and hold institutions accountable for these human rights violations.

Since 2021, we have been providing these alerts to civil society partners to track these shutdowns. As we have collected feedback to improve the alerts, we have seen many partners looking for more ways to integrate Radar and the alerts into their existing tracking mechanisms. With this, we announced Radar 2.0 with API access for free so academics, data sleuths, civil society, human rights organizations, and other web enthusiasts can analyze, visualize, and investigate Internet usage across the globe, based on data from our global network. In addition, we launched Cloudflare Radar Outage Center to archive Internet outages and make it easier for civil society organizations, journalists/news media, and impacted parties to track past shutdowns.

Highlighting the work of our civil society partners to track Internet shutdowns

We believe our job at Cloudflare is to build tools that improve privacy and security for a range of players on the Internet. With this, we want to highlight the work of our civil society partners. These organizations are pushing back against targeted shutdowns that inflict lasting damage to democracies around the world. Here are their stories.

Access Now

Partnering with civil society to track Internet shutdowns with Radar Alerts and API

Access Now’s #KeepItOn coalition was launched in 2016 to help unite and organize the efforts of activists and organizations across the world to end Internet shutdowns. It now represents more than 280 organizations from 105 countries across the globe. The goal of STOP Project (Shutdown Tracker Optimization Project) is ultimately to document and report shutdowns accurately, which requires diligent verification. Access Now regularly uses multiple sources to identify and understand the shutdown, the choice and combination of which depends on where and how the shutdown occurred.

The tracker uses both quantitative and qualitative data to record the number of Internet shutdowns in the world in a given year and to characterize the nature of the shutdowns, including their magnitude, scope, and causes.

Zach Rosson, #KeepItOn Data Analyst, Access Now, details, “Sometimes, we confirm an Internet shutdown through means such as technical measurement, while at other times we rely upon contextual information, such as news reports or personal accounts. We also work hard to document how a particular shutdown was ordered and how it impacted society, including why and how it happened.

On how Access Now’s #KeepItOn coalition uses Cloudflare Radar, Rosson says, We use Radar Internet shutdown alerts in both email and tweet form, as a trusted source to help verify a shutdown occurrence. These alerts and their underlying measurements are used as primary sources in our dataset when compiling shutdowns for our annual report, so they are used in an archival sense as well. Cloudflare Radar is sometimes the first place that we hear about a shutdown, which is quite useful in a rapid response context, since we can quickly mobilize to verify the shutdown and have strong evidence when advocating against it.

The recorded instances of shutdowns include events reported through local or international news sources that are included in the dataset, from local actors through Access Now’s Digital Security Helpline or the #KeepItOn Coalition email list, or directly from telecommunication and Internet companies.

Rosson notes, When it comes to Radar 2.0 and API, we plan to use these resources to speed up our response, verification, and publication of shutdown data as compiled from different sources. Thus, the Cloudflare Radar Outage Center (CROC) and related API endpoint will be very useful for us to access timely information on shutdowns, either through visual inspection of the CROC in the short term or through using the API to pull data into a centralized database in the long term.

Internet Society: ISOC

Partnering with civil society to track Internet shutdowns with Radar Alerts and API

On the Internet Society Pulse platform, Susannah Gray, Director, Communications, Internet Society, explains that they strive to curate meaningful information around a government-mandated Internet shutdown by using data from multiple trusted sources, and making it available to everyone, everywhere in an easy-to-understand manner. ISOC does this by monitoring Internet traffic using various tools, including Radar. When they see something that might indicate that an Internet shutdown is in progress, they check if the shutdown meets their  criteria. For a shutdown to appear on the Pulse Shutdowns Tracker it needs to meet all the following requirements. It must:

  • Be artificially induced, as evident from reputable sources, including government statements and orders.
  • Remove Internet access.
  • Affect access to a group of people.

Once ISOC is certain that a shutdown is the result of government action, and isn’t the result of technical errors, routing misconfigurations, or infrastructure failures, they prepare an incident page, collate related measurements from their trusted data partners, and then publish the information on the Pulse shutdowns tracker.

ISOC uses many resources to track shutdowns. Gray explains, Radar Internet shutdown alerts are incredibly useful for bringing incidents to our attention as they are happening. The easy access to the data provided helps us assess the nature of an outage. If an outage is established as a government-mandated shutdown, we often use screenshots of Radar charts on the Pulse shutdowns tracker incident page to help illustrate how traffic stopped flowing in and out of a country during the shutdown. We provide a link back to the Radar platform so that people interested in getting more in-depth data can find out more.

ISOC’s aim has never been to be the first to report a government-mandated shutdown: instead, their mission is to report accurate and meaningful information about the shutdown and explore its impact on the economy and society.

Gray adds, For Radar 2.0 and the API, we plan to use it as part of the data aggregation tool we are developing. This internal tool will combine several outage alert and monitoring tools and sources into one single system so that we are able to track incidents more efficiently.

Open Observatory of Network Interference: OONI

Partnering with civil society to track Internet shutdowns with Radar Alerts and API

OONI is a nonprofit that measures Internet censorship, including the blocking of websites, instant messaging apps, and circumvention tools. Cloudflare Radar is one of the main public data sources that they use when examining reported Internet connectivity shutdowns. For example, OONI relied on Radar data when reporting on shutdowns in Iran amid ongoing protests. In 2022, the team launched the Measurement Aggregation Toolkit (MAT), which enables the public to track censorship worldwide and create their own charts based on real-time OONI data. OONI also forms partnerships with multiple digital rights organizations that use OONI tools and data to monitor and respond to censorship events in their regions.

Maria Xynou, OONI Research and Partnerships Director, explains Cloudflare Radar is one of the main public data sources that OONI has referred to when examining reported internet connectivity shutdowns. Specifically, OONI refers to Cloudflare Radar to check whether the platform provides signals of a reported internet connectivity shutdown; compare Cloudflare Radar signals with those visible in other, relevant public data sources (such as IODA, and Google traffic data).

Tracking the shutdowns of tomorrow

As we work with more organizations in the human rights space and learn how our global network can be used for good, we are eager to improve and create new tools to protect human rights in the digital age.

If you would like to be added to Radar Internet Shutdown alerts, please contact [email protected] and follow the Cloudflare Radar alert Twitter page and Cloudflare Radar Outage Center (CROC). For access to the Radar API, please visit Cloudflare Radar.

How Cloudflare uses Terraform to manage Cloudflare

Post Syndicated from Michael Wolf original https://blog.cloudflare.com/terraforming-cloudflare-at-cloudflare/

How Cloudflare uses Terraform to manage Cloudflare

How Cloudflare uses Terraform to manage Cloudflare

Configuration management is far from a solved problem. As organizations scale beyond a handful of administrators, having a secure, auditable, and self-service way of updating system settings becomes invaluable. Managing a Cloudflare account is no different. With dozens of products and hundreds of API endpoints, keeping track of current configuration and making bulk updates across multiple zones can be a challenge. While the Cloudflare Dashboard is great for analytics and feature exploration, any changes that could potentially impact users really should get a code review before being applied!

This is where Cloudflare’s Terraform provider can come in handy. Built as a layer on top of the cloudflare-go library, the provider allows users to interface with the Cloudflare API using stateful Terraform resource declarations. Not only do we actively support this provider for customers, we make extensive use of it internally! In this post, we hope to provide some best practices we’ve learned about managing complex Cloudflare configurations in Terraform.

Why Terraform

Unsurprisingly, we find Cloudflare’s products to be pretty useful for securing and enhancing the performance of services we deploy internally. We use DNS, WAF, Zero Trust, Email Security, Workers, and all manner of experimental new features throughout the company. This dog-fooding allows us to battle-harden the services we provide to users and feed our desired features back to the product teams all while running the backend of Cloudflare. But, as Cloudflare grew, so did the complexity and importance of our configuration.

When we were a much smaller company, we only had a handful of accounts with designated administrators making changes on behalf of their colleagues. However, over time this handful of accounts grew into hundreds with each managed by separate teams. Independent accounts are useful in that they allow service-owners to make modifications that can’t impact others, but it comes with overhead.

We faced the challenge of ensuring consistent security policies, up-to-date account memberships, and change visibility. While our  accounts were still administered by kind human stewards, we had numerous instances of account members not being removed after they transferred to a different team. While this never became a security incident, it demonstrated the shortcomings of manually provisioning account memberships. In the case of a production service migration, the administrator executing the change would often hop on a video call and ask for others to triple-check an IP address, ruleset, or access policy update. It was an era of looking through the audit logs to see what broke a service.

We wanted to make it easier for developers and users to make the changes they wanted without having to reach out to an administrator. Defining our configuration in code using Terraform has allowed us to keep tabs on the complexity of configuration while improving visibility and change management practices. By dogfooding the Cloudflare Terraform provider, we’ve been able to ensure:

  • Modifications to accounts are peer reviewed by the team that owns an account.
  • Each change is tied to a user, commit, and a ticket explaining the rationale for the change.
  • API Tokens are tied to service accounts rather than individual human users, meaning they survive team changes and offboarding.
  • Account configuration can be audited by anyone at the company for current state, accuracy, and security without needing to add everyone as a member of every account.
  • Large changes, such as enforcing hard keys can be done rapidly– even in a single pull request.
  • Configuration can be easily copied and reused across accounts to promote best practices and speed up development.
  • We can use and iterate on our awesome provider and provide a better experience to other users (shoutout in particular to Jacob!).

Terraform in CI/CD

Terraform has a fairly mature open source ecosystem, built from years of running-in-production experience. Thus, there are a number of ways to make interacting with the system feel as comfortable to developers as git. One of these tools is Atlantis.

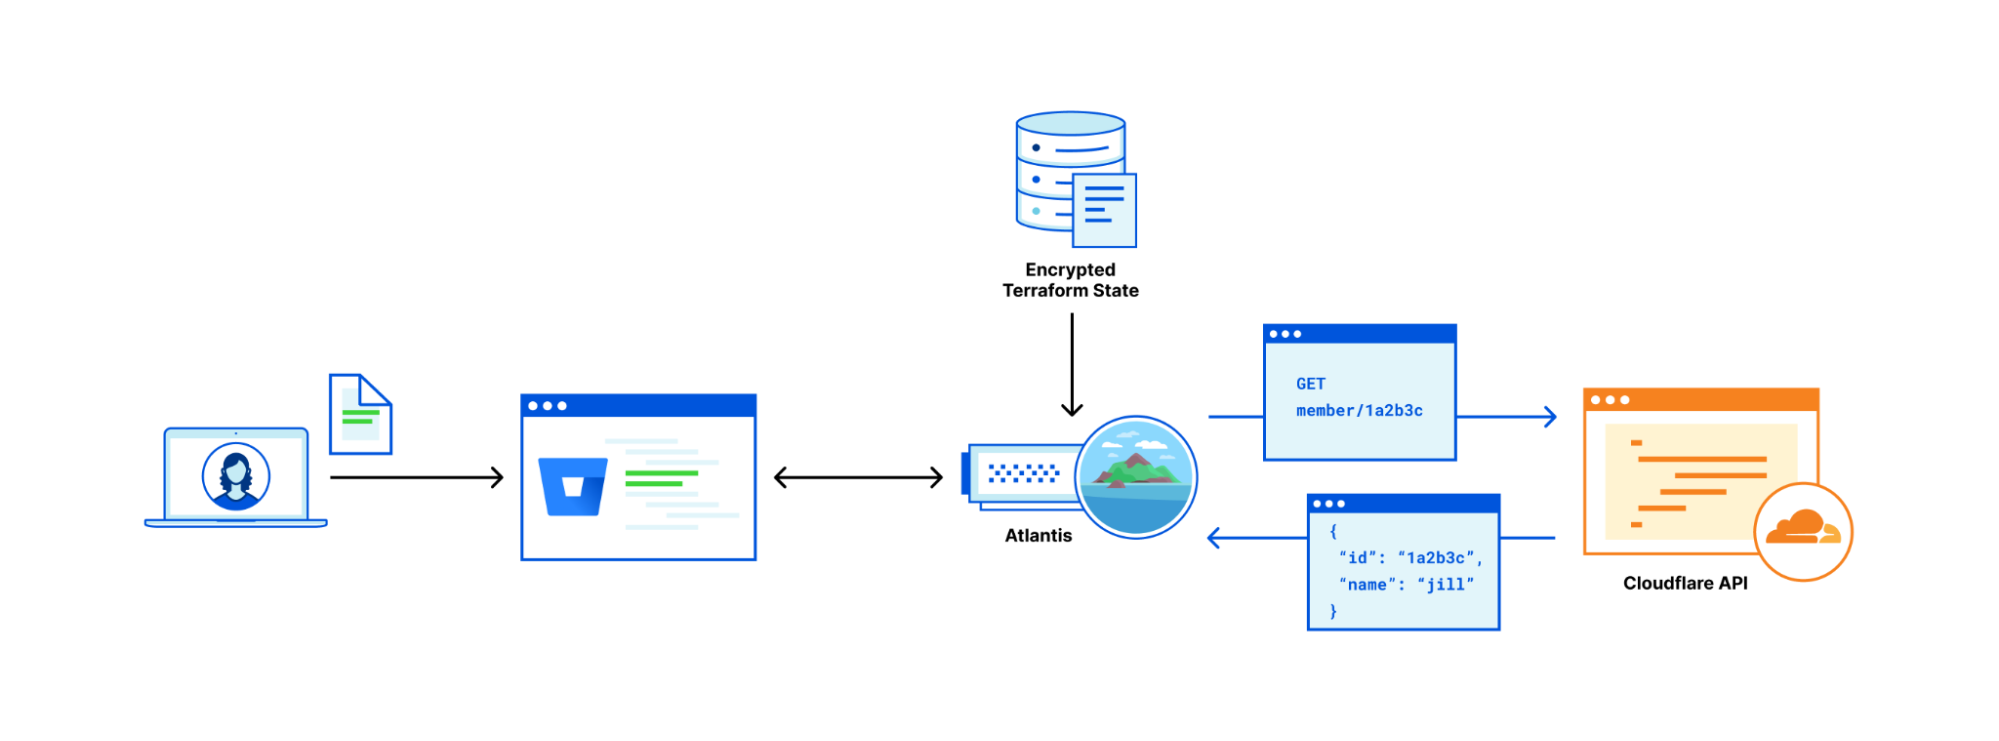
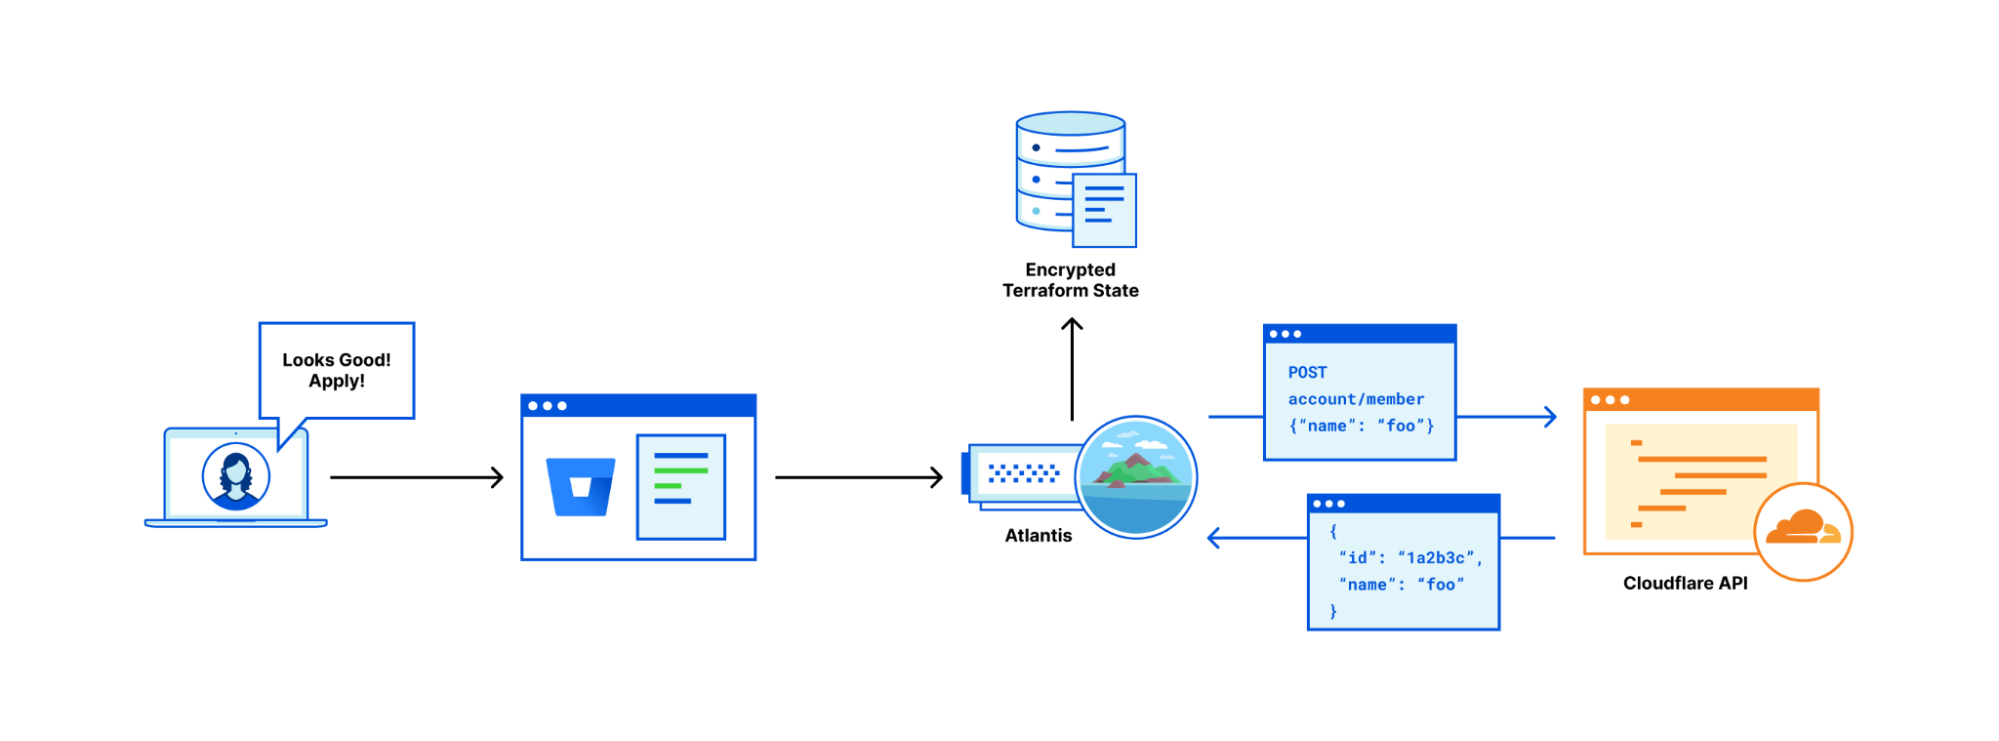
Atlantis acts as continuous integration/continuous delivery (CI/CD) for Terraform; fitting neatly into version control workflows, and giving visibility into the changes being deployed in each code change. We use Atlantis to display Terraform plans (effectively a diff in configuration) within pull requests and apply the changes after the pull request has been approved. Having all the output from the terraform provider in the comments of a pull request means there’s no need to fiddle with the state locally or worry about where a state lock is coming from. Using Terraform CI/CD like this makes configuration management approachable to developers and non-technical folks alike.

In this example pull request, I’m adding a user to the cloudflare-cool-account (see the code in the next section). Once the PR is opened, Bitbucket posts a webhook to Atlantis, telling it to run a `terraform plan` using this branch. The resulting comment is placed in the pull request. Notice that this pull request can’t be applied or merged yet as it doesn’t have an approval! Once the pull request is approved, I would comment “atlantis apply”, wait for Atlantis to post a comment containing the output of the command, and merge the pull request if that output looks correct.

How Cloudflare uses Terraform to manage Cloudflare

Our Terraforming Cloudflare architecture consists of a monorepo with one directory (and tfstate) for each internally-owned Cloudflare account. This keeps all of our Cloudflare configuration centralized for easier oversight while remaining neatly organized.

It will be possible in a future (as of this writing) release to manage multiple Cloudflare accounts in the same tfstate, but we’ve found that accounts in our use generally map fairly neatly onto teams. Teams can be configured as CODEOWNERS for a given directory and be tagged on any pull requests to that account. With teams owning separate accounts and each account having a separate tfstate, it’s rare for pull requests to get stuck waiting for a lock on the tfstate. Team-account-sized states remain relatively small, meaning that they also build quickly. Later on, we’ll share some of the other optimizations we’ve made to keep the repo user-friendly.

Each of our terraform states, given that they include secrets (including the API key!), is stored encrypted in an internal datastore. When a pull request is opened, Atlantis reaches out to a piece of middleware (that we may open source once it’s cleaned up a bit) that retrieves and decrypts the state for processing. Once the pull request is applied, the state is encrypted and put away again.

How Cloudflare uses Terraform to manage Cloudflare

We execute a daily Terraform apply across all tfstates to capture any unintended config drift and rotate certificates when they approach expiration. This prevents unrelated changes from popping up in pull request diffs and causing confusion. While we could run more frequent state applies to ensure Terraform remains firmly up to date, once-a-day rectification strikes a balance between code enforcement and avoiding state locks while users are running Terraform plans in pull requests.

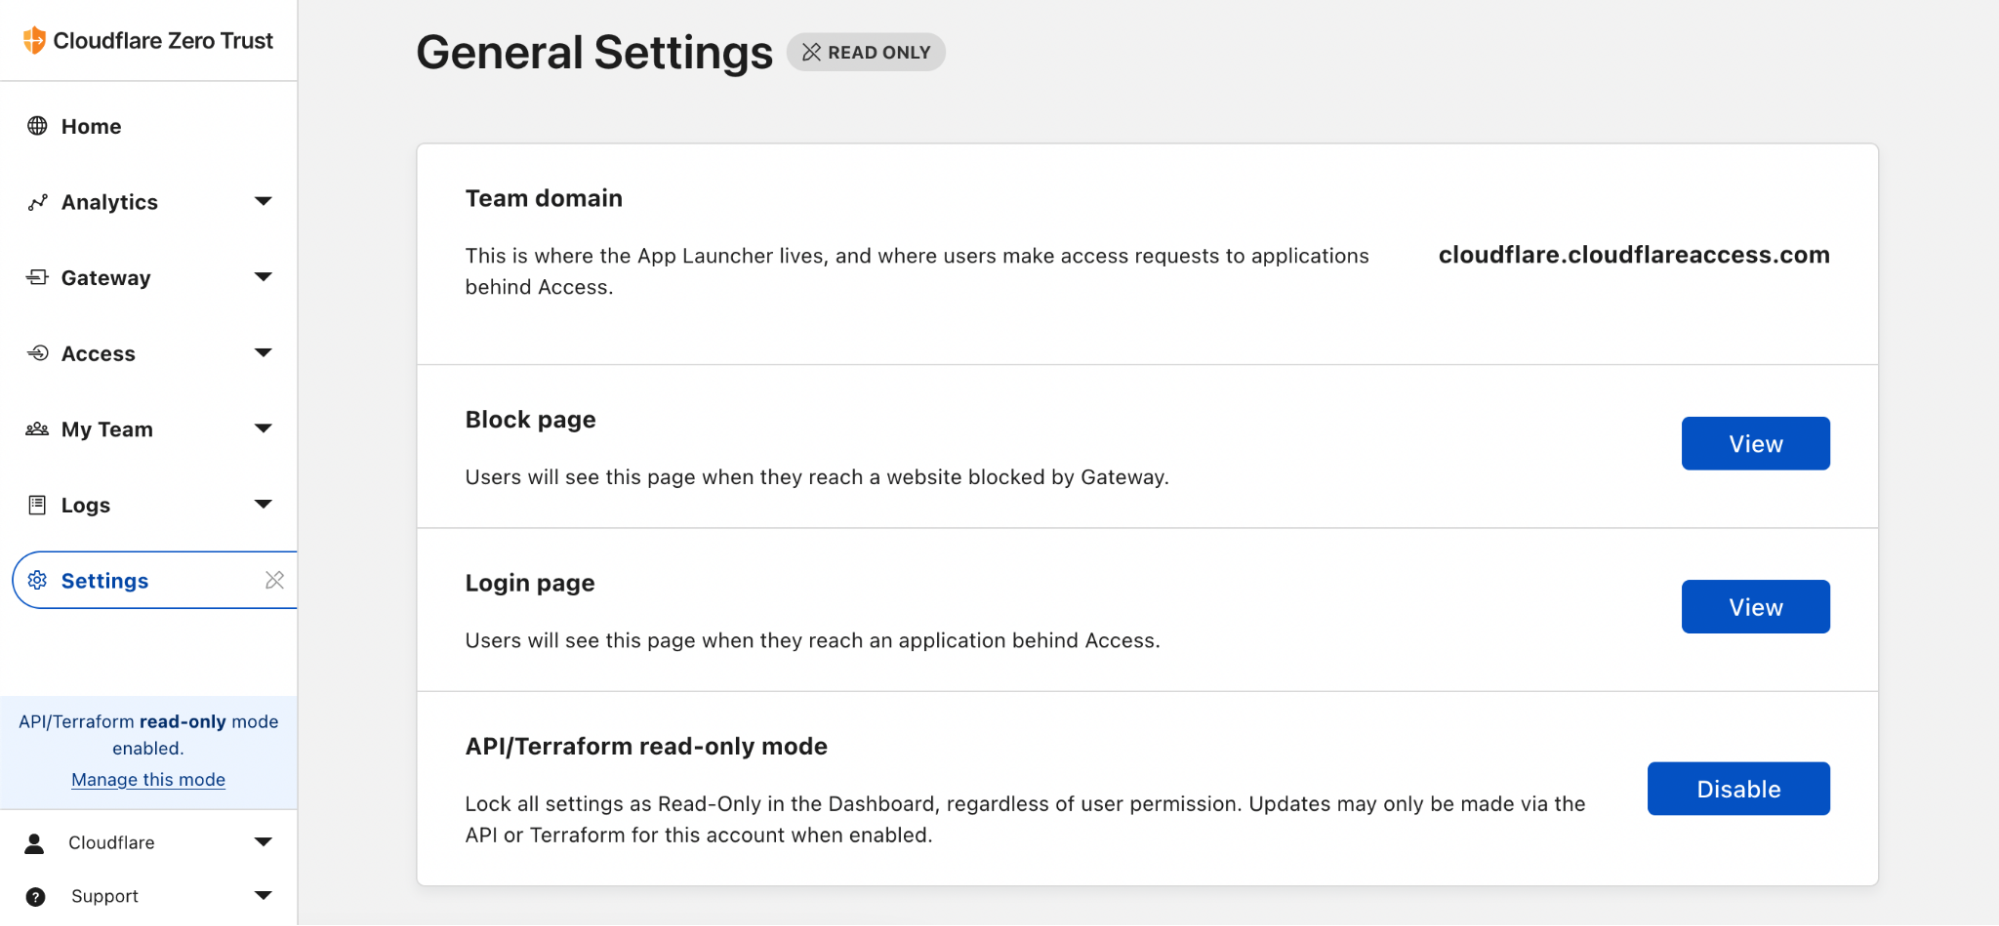
One of the problems that we encountered during our transition to Terraform is that folks were in the habit of making updates to configuration in the Dashboard and were still able to edit settings there. Thus, we didn’t always have a single source of truth for our configuration in code. It also meant the change would get mysteriously (to them) reverted the next day! So that’s why I’m excited to share a new Zero Trust Dashboard toggle that we’ve been turning on for our accounts internally: API/Terraform read-only mode.

How Cloudflare uses Terraform to manage Cloudflare
Easily one of my favorite new features

With this button, we’re able to politely prevent manual changes to your Cloudflare account’s Zero Trust configuration without removing permissions from the set of users who can fix settings manually in a break-glass emergency scenario. Check out how you can enable this setting in your Zero Trust organization.

Slick Snippets and Terraforming Recommendations

As our Terraform repository has matured, we’ve refined how we define Cloudflare resources in code. By finding a sweet spot between code reuse and readability, we’ve been able to minimize operational overhead and generally let users get their work done. Here’s a couple of useful snippets that have been particularly valuable to us.

Account Membership

This allows for defining a fairly straightforward mapping of user emails to account privileges without code duplication or complex modules. We pull the list of human-friendly names of account roles from the API to show user permission assignments at a glance. Note: status is a new argument that allows for accounts to be added without sending an email to the user; perfect for when an organization is using SSO. (Thanks patrobinson for the feature request and mblackman for the PR!)

variables.tf
—-
data "cloudflare_account_roles" "my_account" {
	account_id = var.account_id
}

locals {
  roles = {
	for role in data.cloudflare_account_roles.my_account.roles :
  	role.name => role
  }
}

members.tf
—-
locals {
  users = {
    emerson = {
      roles = [
        local.roles["Administrator"].id
      ]
    }
    lucian = {
      roles = [
        local.roles["Super Administrator - All Privileges"].id
      ]
    }
    walruto = {
      roles = [
        local.roles_by_name["Audit Logs Viewer"].id,
        local.roles_by_name["Cloudflare Access"].id,
        local.roles_by_name["DNS"].id
      ]
  }
}

resource "cloudflare_account_member" "account_member" {
  for_each  	= local.users
  account_id	= var.account_id
  email_address = "${each.key}@cloudflare.com"
  role_ids  	= each.value.roles
  status            = "accepted"
}

Defining Auto-Refreshing Access Service Tokens

The GitHub issue and provider change that enabled automatic Access service token refreshes actually came from a need inside Cloudflare. Here’s how we ended up implementing it. We begin by defining a set of services that need to connect to our hostnames that are protected by Access. Each of these tokens are created and stored in a secret key value store. Next, we reference those access tokens by ID in the target Access policies. Once this has run, the service owner or the service itself can retrieve the credentials from the data store. (Note: we’re using Vault here, but any storage provider could be used in its place).

tokens.tf
—
locals {
  service_tokens = toset([
    "customer-service",     # TICKET-120
    "full-service",               # TICKET-128
    "quality-of-service"      # TICKET-420 
    "room-service"            # TICKET-927
  ])
}

resource "cloudflare_access_service_token" "token" {
  for_each   = local.service_tokens
  account_id = var.account_id
  name   	= each.key
  min_days_for_renewal = 30
}

resource "vault_generic_secret" "access_service_token" {
  for_each   = local.service_tokens
  path = "kv/secrets/${each.key}/access_service_token"
  disable_read = true

  data_json = jsonencode({
	client_id        = cloudflare_access_service_token.token["${each.key}"].client_id,
client_secret = cloudflare_access_service_token.token["${each.key}"].client_secret
  })
}

super_cool_hostname.tf
—
resource "cloudflare_access_application" "super_cool_hostname" {
  account_id             	            = var.account_id
  name                   	            = "Super Cool Hostname"
  domain                 	            = "supercool.hostname.tld"
}

resource "cloudflare_access_policy" "super_cool_hostname_service_access" {
  application_id = cloudflare_access_application.super_cool_hostname.id
  zone_id    	= data.cloudflare_zone.hostname_tld.id
  name       	= "TICKET-927 Allow Room Service "
  decision   	= "non_identity"
  precedence 	= 1
  include {
	service_token = [cloudflare_access_service_token.token["room-service"].id]
  }
}

mTLS (Authenticated Origin Pulls) certificate creation and rotation

To further defense-in-depth objectives, we’ve been rolling out mTLS throughout our internal systems. One of the places where we can take advantage of our Terraform provider is in defining AOP (Authenticated Origin Pulls) certificates to lock down the Cloudflare-edge-to-origin connection. Anyone who has managed certificates of any kind can speak to the headaches they can cause. Having certificate configurations in Terraform takes out the manual work of rotation and expiration.

In this example we’re defining hostname-level AOP as opposed to zone-level AOP. We start by cutting a certificate for each hostname. Once again we’re using Vault for certificate creation, but other backends could be used just as well. This certificate is created with a (not-shown) 30 day expiration, but set to renew automatically. This means once the time-to-expiration is equal to min_seconds_remaining, the resource will be automatically tainted and replaced on the next Terraform run. We like to give this automation plenty of room before expiration to take into account holiday seasons and avoid sending alerts to humans when the alerts hit seven days to expiration. For the rest of this snippet, the certificate is uploaded to Cloudflare and the ID from that upload is then placed in the AOP configuration for the given hostname. The create_before_destroy meta-argument ensures that the replacement certificate is uploaded successfully before we remove the certificate that’s currently in place.

locals {
  hostnames = toset([
	"supercool.hostname.tld",
            "thatsafinelooking.hostname.tld"
  ])
}

resource "vault_pki_secret_backend_cert" "vault_cert" {
  for_each          	      = local.hostnames
  backend           	      = "pki-aop"
  name              	      = "default"
  auto_renew         	      = true
  common_name       	      = "${each.key}.aop.pki.vault.cfdata.org"
  min_seconds_remaining = 864000 // renew when there are 10 days left before expiration
}

resource "cloudflare_authenticated_origin_pulls_certificate" "aop_cert" {
  for_each  = local.hostnames
  zone_id   = data.cloudflare_zone.hostname_tld.id
  type 	      = "per-hostname"

  certificate = vault_pki_secret_backend_cert.vault_cert["${each.key}"].certificate
  private_key = vault_pki_secret_backend_cert.vault_cert["${each.key}"].private_key

  lifecycle {
	create_before_destroy = true
  }
}

resource "cloudflare_authenticated_origin_pulls" "aop_config" {
  for_each                           	= local.hostnames
  zone_id    	                        = data.cloudflare_zone.hostname_tld.id
  authenticated_origin_pulls_certificate = cloudflare_authenticated_origin_pulls_certificate.aop_cert["${each.key}"].id
  hostname                           	= "${each.key}"
  enabled                            	= true
}

Terraform recommendations

The comfortable automation that we’ve achieved thus far did not come without some hair-pulling. Below are a few of the learnings that have allowed us to maintain the repository as a side project run by two engineers (shoutout David).

Store your state somewhere safe

It feels worth repeating that the tfstate contains secrets including any API keys you’re using with providers and the default location of the tfstate is in the current working directory. It’s very easy to accidentally commit this to source control. By defining a backend, the state can be stored with a cloud storage provider, in a secure location on a filesystem, in a database, or even Cloudflare Workers! Wherever the state is stored, make sure it is encrypted.

Choose simplicity, avoid modules

Modules are intended to reduce code repetition for well-defined chunks of systems such as “I want three clusters of whizz-bangs in locations A, C, and F.” If cloud-computing was like Factorio, this would be amazing. However, financial, technical, and physical constraints mean subtle differences in systems develop over time such as “I want fewer whizz-bangs in C and the whizz-bangs in F should get a different network topology.” In Terraform, implementation logic of these requirements is moved to the module code. HCL is absolutely not the place to write decipherable conditionals. While module versioning prevents having to make every change backwards-compatible, keeping module usage up-to-date becomes another chore for repository maintainers.

An understandable code base is a user-friendly codebase. It’s rare that a deeply cryptic error will return from a misconfigured resource definition. Conversely, modules, especially custom ones, can lead users on a head-scratching adventure. This kind of system can’t scale with confused users.

A few well-designed for_each loops (we’re obviously fans) can achieve similar objectives as modules without the complexity. It’s fine to use plain old resources too! Especially when there are more than a handful of varying arguments, it’s more valuable for the configuration to be clear than to be eloquent. For example: an account_member resource makes sense to be in a for_loop, but a page_rule probably doesn’t.

Keep tfstates small

Maintaining quick pull-request-to-plan turnaround keeps Terraform from feeling like a burden on users’ time. Furthermore, if a plan is taking 30 minutes to run, a rollback in the case of an issue would also take 30 minutes! This post describes our single-account-to-tfstate model.

However, after noticing slow-downs coming from the large number of AOP certificate configurations in a big zone, we moved that code to a separate tfstate. We were able to make this change because AOP configuration is fairly self-contained. To ensure there would be no fighting between the states, we kept the API token permissions for each tfstate mutually exclusive of each other. Our Atlantis Terraform plans typically finish under five minutes. If it feels impossible to keep the size of a tfstate down to a reasonable amount of time, it may be worth considering a different tool for that bit of configuration management.

Know when to use a Different tool

Terraform isn’t a panacea. We generally don’t use Terraform to manage DNS records, for example. We use OctoDNS which integrates more neatly into our infrastructure automation. DNS records can quickly add up to long state-rendering times and are often dynamically generated from systems that Terraform doesn’t know about. To avoid conflicts, there should only ever be one system publishing changes to DNS records.

We also haven’t figured out a maintainable way of managing Workers scripts in Terraform. When a .js script in the Terraform directory changes, Terraform isn’t aware of it. This means a change needs to occur somewhere else in a .tf file before the plan diff is generated. It likely isn’t an unsolvable issue, but doesn’t seem particularly worth cramming into Terraform when there are better options for Worker management like Wrangler.

Looking forward

We’re continuing to invest in the Cloudflare Terraforming experience both for our own use and for the benefit of our users. With the provider, we hope to offer a comfortable and scalable method of interacting with Cloudflare products. Hopefully this post has presented some useful suggestions to anyone interested in adopting Cloudflare-configuration-as-code. Don’t hesitate to reach out on the GitHub project for troubleshooting, bug reports, or feature requests. For more in depth documentation on using Terraform to manage your Cloudflare account, read on here. And if you don’t have a Cloudflare account already, click here to get started.

The Cloudflare API now uses OpenAPI schemas

Post Syndicated from Garrett Galow original https://blog.cloudflare.com/open-api-transition/

The Cloudflare API now uses OpenAPI schemas

The Cloudflare API now uses OpenAPI schemas

Today, we are announcing the general availability of OpenAPI Schemas for the Cloudflare API. These are published via GitHub and will be updated regularly as Cloudflare adds and updates APIs. OpenAPI is the widely adopted standard for defining APIs in a machine-readable format. OpenAPI Schemas allow for the ability to plug our API into a wide breadth of tooling to accelerate development for ourselves and customers. Internally, it will make it easier for us to maintain and update our APIs. Before getting into those benefits, let’s start with the basics.

What is OpenAPI?

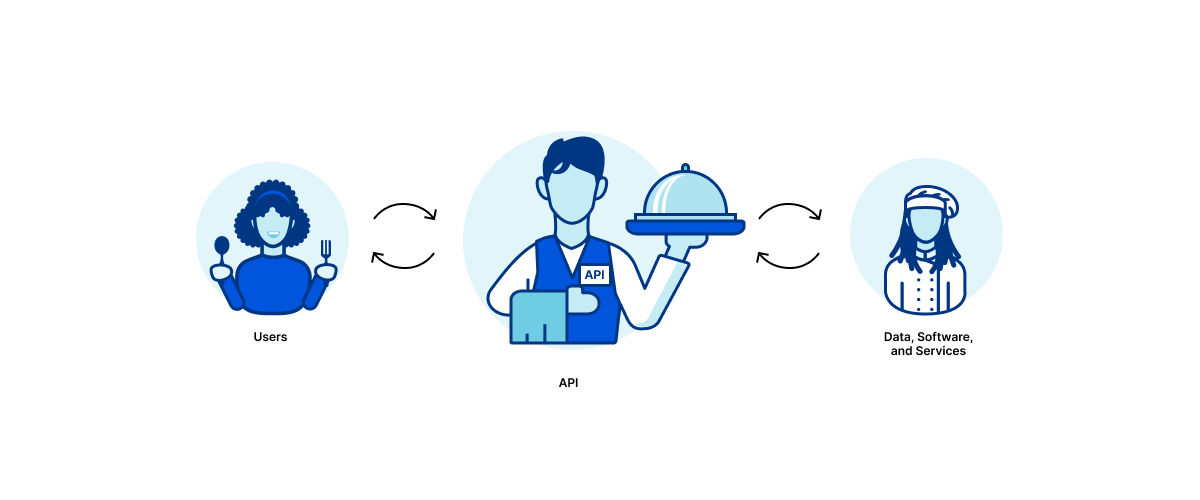
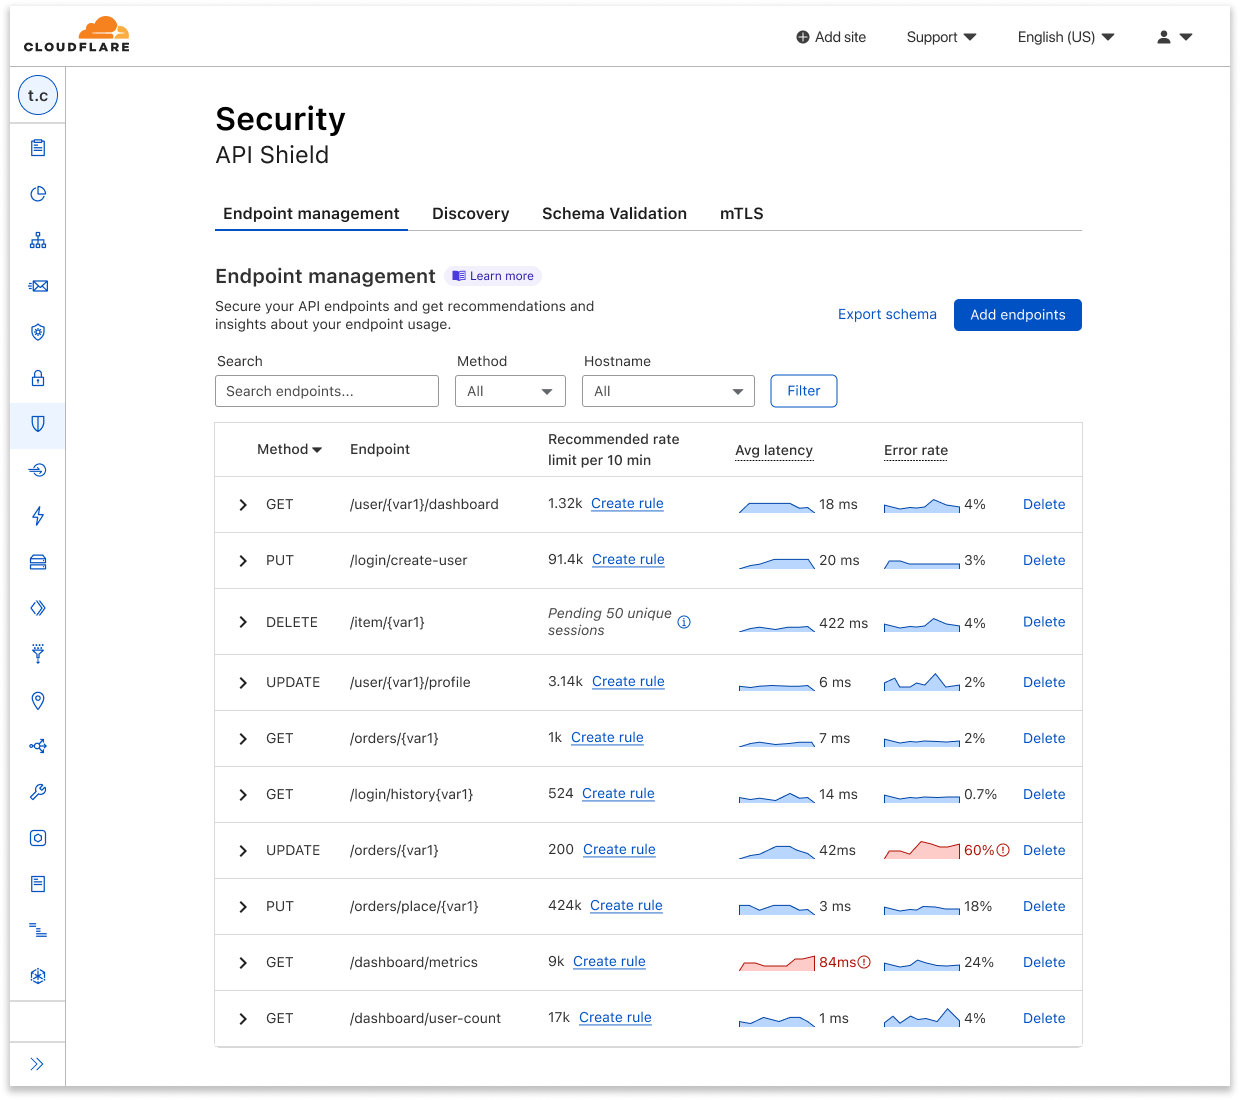
Much of the Internet is built upon APIs (Application Programming Interfaces) or provides them as services to clients all around the world. This allows computers to talk to each other in a standardized fashion. OpenAPI is a widely adopted standard for how to define APIs. This allows other machines to reliably parse those definitions and use them in interesting ways. Cloudflare’s own API Shield product uses OpenAPI schemas to provide schema validation to ensure only well-formed API requests are sent to your origin.

Cloudflare itself has an API that customers can use to interface with our security and performance products from other places on the Internet. How do we define our own APIs? In the past we used a standard called JSON Hyper-Schema. That had served us well, but as time went on we wanted to adopt more tooling that could both benefit ourselves internally and make our customer’s lives easier. The OpenAPI community has flourished over the past few years providing many capabilities as we will discuss that were unavailable while we used JSON Hyper-Schema. As of today we now use OpenAPI.

You can learn more about OpenAPI itself here. Having an open, well-understood standard for defining our APIs allows for shared tooling and infrastructure to be used that can read these standard definitions. Let’s take a look at a few examples.

Uses of Cloudflare’s OpenAPI schemas

Most customers won’t need to use the schemas themselves to see value. The first system leveraging OpenAPI schemas is our new API Docs that were announced today. Because we now have OpenAPI schemas, we leverage the open source tool Stoplight Elements to aid in generating this new doc site. This allowed us to retire our previously custom-built site that was hard to maintain. Additionally, many engineers at Cloudflare are familiar with OpenAPI, so we gain teams can write new schemas more quickly and are less likely to make mistakes by using a standard that teams understand when defining new APIs.

There are ways to leverage the schemas directly, however. The OpenAPI community has a huge number of tools that only require a set of schemas to be able to use. Two such examples are mocking APIs and library generation.

Mocking Cloudflare’s API

Say you have code that calls Cloudflare’s API and you want to be able to easily run unit tests locally or integration tests in your CI/CD pipeline. While you could just call Cloudflare’s API in each run, you may not want to for a few reasons. First, you may want to run tests frequently enough that managing the creation and tear down of resources becomes a pain. Also, in many of these tests you aren’t trying to validate logic in Cloudflare necessarily, but your own system’s behavior. In this case, mocking Cloudflare’s API would be ideal since you can gain confidence that you aren’t violating Cloudflare’s API contract, but without needing to worry about specifics of managing real resources. Additionally, mocking allows you to simulate different scenarios, like being rate limited or receiving 500 errors. This allows you to test your code for typically rare circumstances that can end up having a serious impact.

As an example, Spotlight Prism could be used to mock Cloudflare’s API for testing purposes. With a local copy of Cloudflare’s API Schemas you can run the following command to spin up a local mock server:

$ docker run --init --rm \
  -v /home/user/git/api-schemas/openapi.yaml:/tmp/openapi.yaml \
  -p 4010:4010 stoplight/prism:4 \
  mock -h 0.0.0.0 /tmp/openapi.yaml

Then you can send requests to the mock server in order to validate that your use of Cloudflare’s API doesn’t violate the API contract locally:

$ curl -sX PUT localhost:4010/zones/f00/activation_check \
  -Hx-auth-email:[email protected] -Hx-auth-key:foobarbaz | jq
{
  "success": true,
  "errors": [],
  "messages": [],
  "result": {
    "id": "023e105f4ecef8ad9ca31a8372d0c353"
  }
}

This means faster development and shorter test runs while still catching API contract issues early before they get merged or deployed.

Library generation

Cloudflare has libraries in many programming languages like Terraform and Go, but we don’t support every possible programming language. Fortunately, using a tool like openapi generator, you can feed in Cloudflare’s API schemas and generate a library in a wide range of languages to then use in your code to talk to Cloudflare’s API. For example, you could generate a Java library using the following commands:

git clone https://github.com/openapitools/openapi-generator
cd openapi-generator
mvn clean package
java -jar modules/openapi-generator-cli/target/openapi-generator-cli.jar generate \
   -i https://raw.githubusercontent.com/cloudflare/api-schemas/main/openapi.yaml \
   -g java \
   -o /var/tmp/java_api_client

And then start using that client in your Java code to talk to Cloudflare’s API.

How Cloudflare transitioned to OpenAPI

As mentioned earlier, we previously used JSON Hyper-Schema to define our APIs. We have roughly 600 endpoints that were already defined in the schemas. Here is a snippet of what one endpoint looks like in JSON Hyper-Schema:

{
      "title": "List Zones",
      "description": "List, search, sort, and filter your zones.",
      "rel": "collection",
      "href": "zones",
      "method": "GET",
      "schema": {
        "$ref": "definitions/zone.json#/definitions/collection_query"
      },
      "targetSchema": {
        "$ref": "#/definitions/response_collection"
      },
      "cfOwnership": "www",
      "cfPlanAvailability": {
        "free": true,
        "pro": true,
        "business": true,
        "enterprise": true
      },
      "cfPermissionsRequired": {
        "enum": [
          "#zone:read"
        ]
      }
    }

Let’s look at the same endpoint in OpenAPI:

/zones:
    get:
      description: List, search, sort, and filter your zones.
      operationId: zone-list-zones
      responses:
        4xx:
          content:
            application/json:
              schema:
                allOf:
                - $ref: '#/components/schemas/components-schemas-response_collection'
                - $ref: '#/components/schemas/api-response-common-failure'
          description: List Zones response failure
        "200":
          content:
            application/json:
              schema:
                $ref: '#/components/schemas/components-schemas-response_collection'
          description: List Zones response
      security:
      - api_email: []
        api_key: []
      summary: List Zones
      tags:
      - Zone
      x-cfPermissionsRequired:
        enum:
        - '#zone:read'
      x-cfPlanAvailability:
        business: true
        enterprise: true
        free: true
        pro: true

You can see that the two look fairly similar and for the most part the same information is contained in each including method type, a description, and request and response definitions (although those are linked in $refs). The value of migrating from one to the other isn’t the change in how we define the schemas themselves, but in what we can do with these schemas. Numerous tools can parse the latter, the OpenAPI, while much fewer can parse the former, the JSON Hyper-Schema.

If this one API was all that made up the Cloudflare API, it would be easy to just convert the JSON Hyper-Schema into the OpenAPI Schema by hand and call it a day. Doing this 600 times, however, was going to be a huge undertaking. When considering that teams are constantly adding new endpoints, it would be impossible to keep up. It was also the case that our existing API docs used the existing JSON Hyper-Schema, so that meant that we would need to keep both schemas up to date during any transition period. There had to be a better way.

Auto conversion

Given both JSON Hyper-Schema and OpenAPI are standards, it reasons that it should be possible to take a file in one format and convert to the other, right? Luckily the answer is yes! We built a tool that took all existing JSON Hyper-Schema and output fully compliant OpenAPI schemas. This of course didn’t happen overnight, but because of existing OpenAPI tooling, we could iteratively improve the auto convertor and run OpenAPI validation tooling over the output schemas to see what issues the conversion tool still had.

After many iterations and improvements to the conversion tool, we finally had fully compliant OpenAPI Spec schemas being auto-generated from our existing JSON Hyper-Schema. While we were building this tool, teams kept adding and updating the existing schemas and our Product Content team was also updating text in the schemas to make our API docs easier to use. The benefit of this process is we didn’t have to slow any of that work down since anything that changed in the old schemas was automatically reflected in the new schemas!

Once the tool was ready, the remaining step was to decide when and how we would stop making updates to the JSON Hyper-Schemas and move all teams to the OpenAPI Schemas. The (now old) API docs were the biggest concern, given they only understood JSON Hyper-Schema. Thanks to the help of our Developer Experience and Product Content teams, we were able to launch the new API docs today and can officially cut over to OpenAPI today as well!

What’s next?

Now that we have fully moved over to OpenAPI, more opportunities become available. Internally, we will be investigating what tooling we can adopt in order to help reduce the effort of individual teams and speed up API development. One idea we are exploring is automatically creating openAPI schemas from code notations. Externally, we now have the foundational tools necessary to begin exploring how to auto generate and support more programming language libraries for customers to use. We are also excited to see what you may do with the schemas yourself, so if you do something cool or have ideas, don’t hesitate to share them with us!

The road to a more standards-compliant Workers API

Post Syndicated from James M Snell original https://blog.cloudflare.com/standards-compliant-workers-api/

The road to a more standards-compliant Workers API

The road to a more standards-compliant Workers API

Earlier this year, we announced our participation in a new W3C Community Group for the advancement of Web-interoperable API standards. Since then, this new WinterCG has been hard at work identifying the common API standards around which all JavaScript runtimes can build. Today I just want to give a peek at some work the WinterCG has been doing; and show off some of the improvements we have been making in the Workers runtime to increase alignment with Web Platform standards around event handling, task cancellation using AbortController, text encoding and decoding, URL parsing and pattern matching, and streams support.

The WinterCG Minimum Common Web Platform API

Right at the start of the WinterCG activity, the group took some time to evaluate and compare the various non-browser JavaScript runtimes such as Node.js, Deno, Bun, and Workers with the purpose of identifying the Web Platform APIs they all had in common. Following a very simple criteria, we looked at the standard APIs that were already implemented and supported by at least two of these runtimes and compiled those into a list that the WinterCG calls the “Minimum Common Web Platform API“. This list will serve as the basis for what the community group defines as the minimum set of Web Platform APIs that should be implemented consistently across runtimes that claim to be “Web-interoperable”.

The current list is straightforward:

AbortController ReadableStreamDefaultController
AbortSignal ReadableStreamDefaultReader
ByteLengthQueuingStrategy SubtleCrypto
CompressionStream TextDecoder
CountQueuingStrategy TextDecoderStream
Crypto TextEncoder
CryptoKey TextEncoderStream
DecompressionStream TransformStream
DOMException TransformStreamDefaultController
Event URL
EventTarget URLPattern
ReadableByteStreamController URLSearchParams
ReadableStream WritableStream
ReadableStreamBYOBReader WritableStreamDefaultController
ReadableStreamBYOBRequest  

In addition to these, the WinterCG also expects Web-interoperable runtimes to have implementations of the atob(), btoa(), queueMicrotask(), structuredClone(), setTimeout(), clearTimeout(), setInterval(), clearInterval(), console, and crypto.subtle APIs available on the global scope.

Today, we are happy to say that the Workers runtime has compliant or nearly compliant implementations of every one of these WinterCG Minimum Common Web Platform APIs. Some of these APIs intentionally diverge from the standards either due to backwards compatibility concerns, Workers-specific features, or performance optimizations. Other APIs diverge still because we are still in the process of updating them to align with the specifications.

Improving standards compliance in the Workers runtime

The Workers runtime has, from the beginning, had the mission to align its developer experience with JavaScript and Web Platform standards as much as possible. Over the past year we have worked hard to continue advancing that mission forward both by improving the standards-compliance of existing APIs such as Event, EventTarget, URL, and streams; and the introduction of new Web Platform APIs such as URLPattern, encoding streams, and compression streams.

Event and EventTarget

The Workers runtime has provided an implementation of the Event and EventTarget Web Platform APIs from the very beginning. These were, however, only limited implementations of what the WHATWG DOM specification defines. Specifically, Workers had only implemented the bare minimum of the Event API that it itself needed to operate.

Today, the Event and EventTarget implementations in Workers provide a more complete implementation.

Let’s look at the official definition of Event as defined by the WHATWG DOM standard:

[Exposed=*]
interface Event {
  constructor(DOMString type, optional EventInit eventInitDict = {});
 
  readonly attribute DOMString type;
  readonly attribute EventTarget? target;
  readonly attribute EventTarget? srcElement; // legacy
  readonly attribute EventTarget? currentTarget;
  sequence<EventTarget> composedPath();
 
  const unsigned short NONE = 0;
  const unsigned short CAPTURING_PHASE = 1;
  const unsigned short AT_TARGET = 2;
  const unsigned short BUBBLING_PHASE = 3;
  readonly attribute unsigned short eventPhase;
 
  undefined stopPropagation();
           attribute boolean cancelBubble; // legacy alias of .stopPropagation()
  undefined stopImmediatePropagation();
 
  readonly attribute boolean bubbles;
  readonly attribute boolean cancelable;
           attribute boolean returnValue;  // legacy
  undefined preventDefault();
  readonly attribute boolean defaultPrevented;
  readonly attribute boolean composed;
 
  [LegacyUnforgeable] readonly attribute boolean isTrusted;
  readonly attribute DOMHighResTimeStamp timeStamp;
 
  undefined initEvent(DOMString type, optional boolean bubbles = false, optional boolean cancelable = false); // legacy
};
 
dictionary EventInit {
  boolean bubbles = false;
  boolean cancelable = false;
  boolean composed = false;
};

Web Platform API specifications are always written in terms of a definition language called Web IDL. Every attribute defined in the interface is a property that is exposed on the object. Event objects, then, are supposed to have properties like type, target, srcElement, currentTarget, bubbles, cancelable, returnValue, defaultPrevented, composed, isTrusted, and timeStamp. They are also expected to have methods such as composedPath(), stopPropagation(), and stopImmediatePropagation(). Because most of these were not immediately needed by Workers, most were not provided originally.

Today, all standard, non-legacy properties and methods defined by the specification are available for use:

 const event = new Event('foo', {
    bubbles: false,
    cancelable: true,
    composed: true,
  });
 
  console.log(event.bubbles);
  console.log(event.cancelable);
  console.log(event.composed);
  
  addEventListener('foo', (event) => {
    console.log(event.eventPhase);  // 2 AT_TARGET
    console.log(event.currentTarget);
    console.log(event.composedPath());
  });
 
  dispatchEvent(event);

While we were at it, we also fixed a long standing bug in the implementation of Event that prevented user code from properly subclassing the Event object to create their own custom event types. This change is protected by a compatibility flag that is now enabled by default for all Workers using a compatibility date on or past 2022-01-31.

  class MyEvent extends Event {
    constructor() {
      super('my-event')
    }
 
    get type() { return super.type.toUpperCase() }
  }
 
  const myEvent = new MyEvent();
  // Previously, this would print "my-event" instead of "MY-EVENT" as expected.
  console.log(myEvent.type);

The EventTarget implementation has also been updated to support once handlers (event handlers that are triggered at-most once then automatically unregistered), cancelable handlers (using AbortSignal), and event listener objects, all in line with the standard.

Using a one-time event handler

  addEventListener('foo', (event) => {
    console.log('printed only once');
  }, {
    once: true
  });
 
  dispatchEvent(new Event('foo'));
  dispatchEvent(new Event('foo'));

Once handlers are key for preventing memory leaks in your applications when you know that a particular event is only ever going to be emitted once, or whenever you only care about handling it once. The stored reference to the function or object that is handling the event is removed immediately upon the first invocation, allowing the memory to be garbage collected.

Using a cancelable event handler

  const ac = new AbortController();
 
  addEventListener('foo', (event) => {
    console.log('not printed at all');
  }, {
    signal: ac.signal
  });
 
  ac.abort();
 
  dispatchEvent(new Event('foo'));

Using an event listener object

While passing a function to addEventListener() is the most common case, the standard actually allows an event listener to be an object with a handleEvent() method as well.

  const listener = {
    handleEvent(event) {
      console.log(event.type);
    }
  };
 
  addEventListener('foo', listener);
  addEventListener('bar', listener);
 
  dispatchEvent(new Event('foo'));
  dispatchEvent(new Event('bar'));

AbortController and AbortSignal

As illustrated in the cancelable event example above, we have also introduced an implementation of the AbortController and AbortSignal APIs into Workers. These provide a standard, and interoperable way of signaling cancellation of several kinds of tasks.

The AbortController/AbortSignal pattern is straightforward: An AbortSignal is just a type of EventTarget that will emit a single “abort” event when it is triggered:

  const ac = new AbortController();
 
  ac.signal.addEventListener('abort', (event) => {
    console.log(event.reason);  // 'just because'
  }, { once: true });
 
  ac.abort('just because');

The AbortController is used to actually trigger the abort event, optionally with a reason argument that is passed on to the event. The reason is typically an Error object but can be any JavaScript value.

The AbortSignal can only be triggered once, so the “abort” event should only ever be emitted once.

It is also possible to create AbortSignals that timeout after a specified period of time:

const signal = AbortSignal.timeout(10);

Or an AbortSignal that is pre-emptively triggered immediately on creation (these will never actually emit the “abort” event):

const signal = AbortSignal.abort('for reasons');

Currently, within Workers, AbortSignal and AbortController has been integrated with the EventTarget, fetch(), and streams APIs in alignment with the relevant standard specifications for each.

Using AbortSignal to cancel a fetch()

  const ac = new AbortController();
 
  const res = fetch('https://example.org', {
    signal: ac.signal
  });
 
  ac.abort(new Error('canceled'))
 
  try {
    await res;
  } catch (err) {
    console.log(err);
  }

TextEncoderStream and TextDecoderStream

The Workers runtime has long provided basic implementations of the TextEncoder and TextDecoder APIs. Initially, these were limited to only supporting encoding and decoding of UTF-8 text. The standard definition of TextDecoder, however, defines a much broader range of text encodings that are now fully supported by the Workers implementation. Per the standard, TextEncoder currently only supports UTF-8.

  const win1251decoder = new TextDecoder("windows-1251");
  const bytes = new Uint8Array([
    207, 240, 232, 226, 229, 242, 44, 32, 236, 232, 240, 33,
  ]);
  console.log(win1251decoder.decode(bytes)); // Привет, мир!

In addition to supporting the full range of encodings defined by the standard, Workers also now provides implementations of the TextEncoderStream and TextDecoderStream, which provide TransformStream implementations that apply encoding and decoding to streaming data:

  const { writable, readable } = new TextDecoderStream("windows-1251");
 
  const writer = writable.getWriter();
  writer.write(new Uint8Array([
    207, 240, 232, 226, 229, 242, 44, 32, 236, 232, 240, 33,
  ]));
 
  const reader = readable.getReader();
  const res = await reader.read();
  console.log(res.value); // Привет, мир!

Using the encoding streams requires the use of the transformstream_enable_standard_constructor compatibility flag.

CompressionStream and DecompressionStream

Streaming compression and decompression is also now supported in the runtime using the standard CompressionStream and DecompressionStream APIs.

const ds = new DecompressionStream('gzip');
const decompressedStream = blob.stream().pipeThrough(ds);

const cs = new CompressionStream('gzip');
const compressedStream = blob.stream().pipeThrough(cs);

These are TransformStream implementations that fully conform to the standard definitions. Use of the compression streams does not require a compatibility flag to enable.

URL and URLPattern

Similar to Event, there has been an implementation of the Web Platform standard URL API available within Workers from nearly the beginning. But also like Event, the implementation was not entirely compatible with the standard.

The incompatibilities were subtle, for instance, in the original implementation, the URL string “https://a//b//c//” would be parsed incorrectly as “https://a/b/c” (note that the extra empty path segments are removed) whereas the standard parsing algorithm would produce “https://a//b//c/” as a result. Such inconsistent results were causing interoperability issues with JavaScript written to run across multiple JavaScript runtimes and needed to be fixed.

A new implementation of the URL parsing algorithm has been provided, and as of October 31, 2022 it has been enabled by default for all newly deployed Workers. Older Workers can begin using the new implementation by updating their compatibility dates to 2022-10-31 or by enabling the url_standard compatibility flag.

Along with the updated URL implementation, Workers now provides an implementation of the standard URLPattern API.

URLPattern provides a regular-expression-like syntax for matching a URL string against a pattern. For instance, consider this example taken from the MDN documentation for URLPattern:

  // Matching a pathname
  let pattern1 = new URLPattern('https://example.com/books/:id')
  // same as
  let pattern2 = new URLPattern(
    '/books/:id',
    'https://example.com',
  );
  // or
  let pattern3 = new URLPattern({
    protocol: 'https',
    hostname: 'example.com',
    pathname: '/books/:id',
  });
  // or
  let pattern4 = new URLPattern({
    pathname: '/books/:id',
    baseURL: 'https://example.com',
  });

ReadableStream, WritableStream, and TransformStream

Last, but absolutely not least, our most significant effort over the past year has been providing new standards compliant implementations of the ReadableStream, WritableStream, and TransformStream APIs.

The Workers runtime has always provided an implementation of these objects but they were never fully conformant to the standard. User code was not capable of creating custom ReadableStream and WritableStream instances, and TransformStreams were limited to simple identity pass-throughs of bytes. The implementations have been updated now to near complete compliance with the standard (near complete because we still have a few edge cases and features we are working on).

The new streams implementation will be enabled by default in all new Workers as of November 30, 2022, or can be enabled earlier using the streams_enable_constructors and transformstream_enable_standard_constructor compatibility flags.

Creating a custom ReadableStream

async function handleRequest(request) {
  const enc = new TextEncoder();

  const rs = new ReadableStream({
    pull(controller) {
      controller.enqueue(enc.encode('hello world'));
      controller.close();
    }
  });

  return new Response(rs);
}

The new implementation supports both “regular” and “bytes” ReadableStream types, supports BYOB readers, and includes performance optimizations for both tee() and pipeThrough().

Creating a custom WritableStream

  const ws = new WritableStream({
    write(chunk) {
      console.log(chunk);  // "hello world"
    }
  });
 
  const writer = ws.getWriter();
  writer.write("hello world");

WritableStreams are fairly simple objects that can accept any JavaScript value written to them.

Creating a custom TransformStream

  const { readable, writable } = new TransformStream({
    transform(chunk, controller) {
      controller.enqueue(chunk.toUpperCase());
    }
  });
 
  const writer = writable.getWriter();
  const reader = readable.getReader();
 
  writer.write("hello world");
 
  const res = await reader.read();
  console.log(res.value);  // "HELLO WORLD"

It has always been possible in Workers to call new TransformStream() (with no arguments) to create a limited version of a TransformStream that only accepts bytes and only acts as a pass-through, passing the bytes written to the writer on to the reader without any modification.

That original implementation is now available within Workers using the IdentityTransformStream class.

  const { readable, writable } = new IdentityTransformStream();
 
  const writer = writable.getWriter();
  const reader = readable.getReader();
 
  const enc = new TextEncoder();
  const dec = new TextDecoder();
 
  writer.write(enc.encode("hello world"));
 
  const res = await reader.read();
  console.log(dec.decode(res.value));  // "hello world"

If your code is using new TransformStream() today as this kind of pass-through, the new implementation will continue to work except for one very important difference: the old, non-standard implementation of new TransformStream() supported BYOB reads on the readable side (i.e. readable.getReader({ mode: 'byob' })). The new implementation (enabled via a compatibility flag and becoming the default on November 30 ) does not support BYOB reads as required by the stream standard.

What’s next

It is clear that we have made a lot of progress in improving the standards compliance of the Workers runtime over the past year, but there is far more to do. Next we will be turning our attention to the implementation of the fetch() and WebSockets APIs, as well as actively seeking closer alignment with other runtimes through collaboration in the Web-interoperable Runtimes Community Group.

If you are interested in helping drive the implementation of Web Platform APIs forward, and advancing interoperability between JavaScript runtime environments, the Workers Runtime team at Cloudflare is hiring! Reach out, or see our open positions here.

The home page for Internet insights: Cloudflare Radar 2.0

Post Syndicated from Joao Sousa Botto original https://blog.cloudflare.com/radar2/

The home page for Internet insights: Cloudflare Radar 2.0

The home page for Internet insights: Cloudflare Radar 2.0

Cloudflare Radar was launched two years ago to give everyone access to the Internet trends, patterns and insights Cloudflare uses to help improve our service and protect our customers.

Until then, these types of insights were only available internally at Cloudflare. However, true to our mission of helping build a better Internet, we felt everyone should be able to look behind the curtain and see the inner workings of the Internet. It’s hard to improve or understand something when you don’t have clear visibility over how it’s working.

On Cloudflare Radar you can find timely graphs and visualizations on Internet traffic, security and attacks, protocol adoption and usage, and outages that might be affecting the Internet. All of these can be narrowed down by timeframe, country, and Autonomous System (AS). You can also find interactive deep dive reports on important subjects such as DDoS and the Meris Botnet. It’s also possible to search for any domain name to see details such as SSL usage and which countries their visitors are coming from.

Since launch, Cloudflare Radar has been used by NGOs to confirm the Internet disruptions their observers see in the field, by journalists looking for Internet trends related to an event in a country of interest or at volume of cyberattacks as retaliation to political sanctions, by analysts looking at the prevalence of new protocols and technologies, and even by brand PR departments using Cloudflare Radar data to analyze the online impact of a major sports event.

Cloudflare Radar has clearly become an important tool for many and, most importantly, we find it has helped shed light on parts of the Internet that deserve more attention and investment.

The home page for Internet insights: Cloudflare Radar 2.0

Introducing Cloudflare Radar 2.0

What has made Cloudflare Radar so valuable is that the data and insights it contains are unique and trustworthy. Cloudflare Radar shows aggregate data from across the massive spectrum of Internet traffic we see every day, presenting you with datasets you won’t find elsewhere.

However, there were still gaps. Today, on the second anniversary of Cloudflare Radar, we are launching Cloudflare Radar 2.0 in beta. It will address three common pieces of feedback from users:

  • Ease of finding insights and data. The way information was structured on Cloudflare Radar made finding information daunting for some people. We are redesigning Cloudflare Radar so that it becomes a breeze.
  • Number of insights. We know many users have wanted to see insights about other important parts of the Internet, such as email. We have also completely redesigned the Cloudflare Radar backend so that we can quickly add new insights over the coming months (including insights into email).

  • Sharing insights. The options for sharing Cloudflare Radar insights were limited. We will now provide you the options you want, including downloadable and embeddable graphs, sharing to social media platforms, and an API.

Finding insights and data

On a first visit to the redesigned Cloudflare Radar homepage one will notice:

  • Prominent and intuitive filtering capabilities on the top bar. A global search bar is also coming soon.
  • Content navigation on the sidebar.
  • Content cards showing glanceable and timely information.
The home page for Internet insights: Cloudflare Radar 2.0

The content you find on the homepage are what we call “quick bytes”. Those link you to more in-depth content for that specific topic, which can also be found through the sidebar navigation.

At the top of the page you can search for a country, autonomous system number (ASN), domain, or report to navigate to a home page for that specific content. For example, the domain page for google.com:

The home page for Internet insights: Cloudflare Radar 2.0

The navigation sidebar allows you to find more detailed insights and data related to Traffic, Security & Attacks, Adoption & Usage, and Domains. (We will be adding additional topic areas in the future.) It also gives you quick access to the Cloudflare Radar Outage Center, a tool for tracking Internet disruptions around the world and to which we are dedicating a separate blog post, and to Radar Reports, which are interactive deep dive reports on important subjects such as DDoS and the Meris Botnet.

The home page for Internet insights: Cloudflare Radar 2.0

Within these topic pages (such as the one for Adoption & Usage shown above), you will find the quick bytes for the corresponding topic at the top, and quick bytes for related topics on the right. The quick bytes on the right allow you to quickly glance at and navigate to related sections.

In the middle of the page are the more detailed charts for the topic you’re exploring.

Sharing insights

Cloudflare Radar’s reason to exist is to make Internet insights available to everyone, but historically we haven’t been as flexible as our users would want. People could download a snapshot of the graph, but not much more.

With Cloudflare Radar 2.0 we will be introducing three major new ways of using Radar insights and data:

  • Social share. Cloudflare Radar 2.0 charts have a more modern and clean look and feel, and soon you’ll be able to share them directly on the social media platform of your choice. No more dealing with low quality screenshots.
  • Embeddable charts. The beautiful charts will also be able to be embedded directly into your webpage or blog – it will work just like a widget, always showing up-to-date information.
  • API. If you like the data on Cloudflare Radar but want to manipulate it further for analysis, visualization, or for posting your own charts, you’ll have the Cloudflare Radar API available to you starting today.

For example, the last seven days of HTTP traffic data for Portugal can be obtained from https://api.cloudflare.com/client/v4/radar/http/timeseries/device_type?dateRange=7d&location=PT

Note: The API is available today. To use the Cloudflare API you need an API token or key (more details here). Embedding charts and sharing directly to social are new features to be released later this year.

Technology changes

Cloudflare Radar 2.0 was built on a new technology stack; we will write a blog post about why and how we did it soon. A lot changed: we now have proper GraphQL data endpoints and a public API, the website runs on top of Cloudflare Pages and Workers, and we’re finally doing server-side rendering using Remix. We adopted SVG whenever possible, built our reusable data visualization components system, and are using Cosmos for visual TDD. These foundational changes will provide a better UX/UI to our users and give us speed when iterating and improving Cloudflare Radar in the future.

We hope you find this update valuable, and recommend you keep an eye on radar.cloudflare.com to see the new insights and topics we’ll be adding regularly. If you have any feedback, please send it to us through the Cloudflare Community.

Backups to the rescue!

Post Syndicated from Nathan Liefting original https://blog.zabbix.com/backups-to-the-rescue/23442/

In this blog post, you will learn how to set up backups for your Zabbix environment. There’s a wide variety of different options when it comes to taking backups of our Zabbix environment, for us, it will just be a matter of choosing the right fit.


Introduction

Monitoring is an important part of our IT infrastructure and often times when our monitoring isn’t working for a certain period, we feel like we are blind as to what is going on with our different IT components. As such, taking backups of our Zabbix environment is an important part of running a production Zabbix environment, as we do want to be prepared for a possible issue that might corrupt or even lose our data. It’s always a possibility and as such we should be prepared.
For Zabbix, there are a few different methods on how to take backups and it all starts at the database level. Both the Zabbix frontend as well as the Zabbix server write their data into the Zabbix database as we can see in the illustration below:

This means that both our configuration as well as all of our collected values are present in the same Zabbix database and if we take a database backup, we back up (almost) everything we need. So, let’s start there and have a look at how we can make a database backup.

How to

MySQL backups

Let’s start with the most used variant of Zabbix databases: MySQL and it’s forks like MariaDB and Percona. All of them can easily be backed up using built-in functionality like the MySQL Dump command and we can then use other industry standards to get things going. First, we have to understand the tables in our database though. Most of the tables in your Zabbix environment contain configuration data and as such, they are all important to backup. There are a few tables that we need to consider, however, as they can contain Giga or even Terabytes of data. These are the History, Trends and Events tables:

It is possible to omit these tables from your backup and make smaller, more manageable backups. To make the backup we can then start using tools like MySQL Dump:

Once we have taken a backup, we can easily import that back into our environment using the MySQL Import command or simply using the cat command:

Do not forget, taking and importing large backups can take a long time. This completely depends on your MySQL database performance tuning settings as well as the underlying resources like CPU, Memory and Disk I/O. Also, make sure to check out the MySQL documentation:

MySQL Dump:  https://dev.mysql.com/doc/refman/8.0/en/mysqldump.html / https://mariadb.com/kb/en/making-backups-with-mysqldump/

MySQL Import: https://dev.mysql.com/doc/refman/8.0/en/mysqlimport.html / https://mariadb.com/kb/en/mysqlimport/


Alternatively, it’s also possible to create backups using tools like xtrabackup and mariadbbackup.

PostgreSQL backups

We can actually use the same kinds of methods for the PostgreSQL backups. Keep the required tables in mind and fire away with the built-in tools:


Then we can restore it by loading the file into postgres:

What about the configuration files?

Once we have a database backup, everything is backed up, right? Well, almost everything. With just a database backup we are quite safe, but (and this is oftentimes overlooked) there are a lot of configuration files and perhaps even custom scripts we need to take into account! There are three parts to this story – the Zabbix server, the Zabbix frontend, and also the Zabbix additional components. All of them have their own set of configuration files and locations that are used for storing custom scripts.

The Zabbix frontend location and configuration files can be different, depending on the environment, as we have a few choices to make. Are we running Apache or Nginx? On what Linux distribution? All of these have to be considered when making configuration backups. In general, the locations for the configuration would be:

/etc/nginx/
/etc/httpd/
/etc/apache2

There’s also a symlink to the Zabbix frontend configuration file located in /etc/zabbix/ but we will get to that one in a bit.

Then we have the Zabbix server itself, which keeps its configuration in /etc/zabbix/ and if we’re following best practices any script should be placed in /usr/lib/zabbix. So we need:

/etc/zabbix/
/usr/lib/zabbix

Let’s add them to the list and find a method to back up these files. Crontab is a built-in tool that we can use, but there are definitely other (perhaps better) solutions out there. Let’s add the following to cron:

I also added a find command here, which will serve as our roll-over or rotation toll. It will find files older than 180 days and delete them from /mnt/backup/config_files/. Make sure to pick a good (network) folder to store these files as it’s important to keep these safe. Feel free to change the number of days you’d like to store the files for.

What about the additional components like Zabbix proxy, Zabbix Java gateway and Zabbix web service (used for PDF reporting)?. Well, these have configuration files as well. Make sure to run a backup on the devices running these additional components. As for Zabbix proxies – they have the same file locations as Zabbix server:

For Zabbix Java gateway and Zabbix web service, we can omit the /usr/lib/zabbix/ folder.

Don’t forget the import/export files!

In general, database backups are slow to make, but also slow to import back unless we do not include the history/trends in the backup. But even then, restoring an entire database simply because someone made an error on a single template is a hassle. Zabbix ships with the built-in frontend export functionality, allowing us to export (and then import) entire parts of the configuration instantly! We can use these for a number of different parts of the configuration:

  • Hosts
  • Templates
  • Media types
  • Maps
  • images
  • Host groups (API ONLY)
  • Template groups (API ONLY)

All of these are available through the Zabbix API allowing us to choose whether we do a manual configuration backup from the frontend, as well as providing us with automation options using that API. You could even manage and update your Zabbix configuration from GIT entirely if you write the right scripts for this.

Frontend backups

To run an export from the frontend simply go to one of the supported sections like Configuration | Templates and select the export data format. When selecting multiple entities, keep in mind that they will all be exported to a single file.

We can then make our edits and import files from the frontend as well:

For Templates this will even result in a nice diff pop-up window, detailing all the changes, deletes and additions to the templates:


API backups

For the API things get a little more complicated as we need to select a mode of execution. Of course, it’s possible to do a curl command from the CLI or even use something like Postman:

Request body

The response will then look something like this:

But this feature really starts to shine once we combine it with our own automation scripts. Use it wisely!

High availability

So, what about high availability? Isn’t that some form of a backup?

Well yes and no. High availability is not an “IT backup” in the form of making sure we can recover something that is broken. But it is a backup in the way that if a Zabbix server instance fails, another one takes over for it. HA is somewhat out of scope for this blog post, but it’s still worth mentioning. There are several solutions to set up Zabbix as a full high availability cluster. For MySQL we can use a Primary/Primary setup, for the frontend we can use load balancing techniques like HAProxy and for the Zabbix server, we can use the built-in high availability method. Combine all of these together and you’ll definitely be able to serve your every (production ready!) need.

Conclusion

To conclude, there are many options to start taking backups of our Zabbix environment. It all starts at the database and these backups are definitely vital to keep things safe in case of disaster. When making the backups, do not forget about the configuration files and custom scripts as well as the frontend backup option. Combining all of these solutions will safeguard our environment, but if that isn’t enough – do not forget about industry standards like snapshots. Even further safeguarding our environment on multiple levels.

I hope you enjoyed reading this blog post. If you have any questions or need help configuring anything on your Zabbix setup feel free to contact me and the team at Opensource ICT Solutions. We build a ton of cool integrations like this and much more!

Nathan Liefting

https://oicts.com

A close up of a logo Description automatically generated

The post Backups to the rescue! appeared first on Zabbix Blog.

API Endpoint Management and Metrics are now GA

Post Syndicated from Jin-Hee Lee original https://blog.cloudflare.com/api-management-metrics/

API Endpoint Management and Metrics are now GA

API Endpoint Management and Metrics are now GA

The Internet is an endless flow of conversations between computers. These conversations, the  constant exchange of information from one computer to another, are what allow us to interact with the Internet as we know it. Application Programming Interfaces (APIs) are the vital channels that carry these conversations, and their usage is quickly growing: in fact, more than half of the traffic handled by Cloudflare is for APIs, and this is increasing twice as fast as traditional web traffic.

In March, we announced that we’re expanding our API Shield into a full API Gateway to make it easy for our customers to protect and manage those conversations. We already offer several features that allow you to secure your endpoints, but there’s more to endpoints than their security. It can be difficult to keep track of many endpoints over time and understand how they’re performing. Customers deserve to see what’s going on with their API-driven domains and have the ability to manage their endpoints.

Today, we’re excited to announce that the ability to save, update, and monitor the performance of all your API endpoints is now generally available to API Shield customers. This includes key performance metrics like latency, error rate, and response size that give you insights into the overall health of your API endpoints.

API Endpoint Management and Metrics are now GA

A Refresher on APIs

The bar for what we expect an application to do for us has risen tremendously over the past few years. When we open a browser, app, or IoT device, we expect to be able to connect to data instantly, compare dozens of flights within seconds, choose a menu item from a food delivery app, or see the weather for ten locations at once.

How are applications able to provide this kind of dynamic engagement for their users? They rely on APIs, which provide access to data and services—either from the application developer or from another company. APIs are fundamental in how computers (or services) talk to each other and exchange information.

You can think of an API as a waiter: say a customer orders a delicious bowl of Mac n Cheese. The waiter accepts this order from the customer, communicates the request to the chef in a format the chef can understand, and then delivers the Mac n Cheese back to the customer (assuming the chef has the ingredients in stock). The waiter is the crucial channel of communication, which is exactly what the API does.

API Endpoint Management and Metrics are now GA

Managing API Endpoints

The first step in managing APIs is to get a complete list of all the endpoints exposed to the internet. API Discovery automatically does this for any traffic flowing through Cloudflare. Undiscovered APIs can’t be monitored by security teams (since they don’t know about them) and they’re thus less likely to have proper security policies and best practices applied. However, customers have told us they also want the ability to manually add and manage APIs that are not yet deployed, or they want to ignore certain endpoints (for example those in the process of deprecation). Now, API Shield customers can choose to save endpoints found by Discovery or manually add endpoints to API Shield.

But security vulnerabilities aren’t the only risk or area of concern with APIs – they can be painfully slow or connections can be unsuccessful. We heard questions from our customers such as: what are my most popular endpoints? Is this endpoint significantly slower than it was yesterday? Are any endpoints returning errors that may indicate a problem with the application?

That’s why we built Performance Metrics into API Shield, which allows our customers to quickly answer these questions themselves with real-time data.

Prioritizing Performance

API Endpoint Management and Metrics are now GA

Once you’ve discovered, saved, or removed endpoints, you want to know what’s going well and what’s not. To end-users, a huge part of what defines the experience as “going well” is good performance. Poor performance can lead to a frustrating experience: when you’re shopping online and press a button to check out, you don’t want to wait around for minutes for the page to load. And you certainly never want to see a dreaded error symbol telling you that you can’t get what you came for.

Exposing performance metrics of API endpoints puts concrete numerical data into your developers’ hands to tell you how things are going. When things are going poorly, these dashboard metrics will point out exactly which aspect of performance is causing concern: maybe you expected to see a spike in requests, but find out that request count is normal and latency is just higher than usual.

Empowering our customers to make data-driven decisions to better manage their APIs ends up being a win for our customers and our customers’ customers, who expect to seamlessly engage with the domain’s APIs and get exactly what they came for.

Management and Performance Metrics in the Dashboard

So, what’s available today? Log onto your Cloudflare dashboard, go to the domain-level Security tab, and open up the API Shield page. Here, you’ll see the Endpoint Management tab, which shows you all the API endpoints that you’ve saved, alongside placeholders for metrics that will soon be gathered.

API Endpoint Management and Metrics are now GA

Here you can easily delete endpoints you no longer want to track, or click manually add additional endpoints. You can also export schemas for each host to share internally or externally.

API Endpoint Management and Metrics are now GA

Once you’ve saved the endpoints that you want to keep tabs on, Cloudflare will start collecting data on its performance and make it available to you as soon as possible.

In Endpoint Management, you can see a few summary metrics in the collapsed view of each endpoint, including recommended rate limits, average latency, and error rate. It can be difficult to tell whether things are going well or not just from seeing a value alone, so we added sparklines that show relative performance, comparing an endpoint’s current metrics with its usual or previous data.

API Endpoint Management and Metrics are now GA

If you want to view further details about a given endpoint, you can expand it for additional metrics such as response size and errors separated by 4xx and 5xx. The expanded view also allows you to view all metrics at a single timestamp by hovering over the charts.

API Endpoint Management and Metrics are now GA

For each saved endpoint, customers can see the following metrics:

  • Request count: total number of requests to the endpoint over time.
  • Rate limiting recommendation per 10 minutes, which is guided by the request count.
  • Latency: average origin response time, in milliseconds (ms). How long does it take from the moment a visitor makes a request to the moment the visitor gets a response back from the origin?
  • Error rate vs. overall traffic: grouped by 4xx, 5xx, and their sum.
  • Response size: average size of the response (in bytes) returned to the request.

You can toggle between viewing these metrics on a 24-hour period or a 7-day period, depending on the scale on which you’d like to view your data. And in the expanded view, we provide a percentage difference between the averages of the current vs. the previous period. For example, say I’m viewing my metrics on a 24-hour timeline. My average latency yesterday was 10 ms, and my average latency today is 30 ms, so the dashboard shows a 200% increase. We also use anomaly detection to bring attention to endpoints that have concerning performance changes.

API Endpoint Management and Metrics are now GA

Additional improvements to Discovery and Schema Validation

As part of making endpoint management GA, we’re also adding two additional enhancements to API Shield.

First, API Discovery now accepts cookies — in addition to authorization headers — to discover endpoints and suggest rate limiting thresholds. Previously, you could only identify an API session with HTTP headers, which didn’t allow customers to protect endpoints that use cookies as session identifiers. Now these endpoints can be protected as well. Simply go to the API Shield tab in the dashboard, choose edit session identifiers, and either change the type, or click Add additional identifier.

API Endpoint Management and Metrics are now GA

Second, we added the ability to validate the body of requests via Schema Validation for all customers. Schema Validation allows you to provide an OpenAPI schema (a template for your API traffic) and have Cloudflare block non-conformant requests as they arrive at our edge. Previously, you provided specific headers, cookies, and other features to validate. Now that we can validate the body of requests, you can use Schema Validation to confirm every element of a request matches what is expected. If a request contains strange information in the payload, we’ll notice. Note: customers who have already uploaded schemas will need to re-upload to take advantage of body validation.

Take a look at our developer documentation for more details on both of these features.

Get started

Endpoint Management, performance metrics, schema exporting, discovery via cookies, and schema body validation are all available now for all API Shield customers. To use them, log into the Cloudflare dashboard, click on Security in the navigation bar, and choose API Shield. Once API Shield is enabled, you’ll be able to start discovering endpoints immediately. You can also use all features through our API.

If you aren’t yet protecting a website with Cloudflare, it only takes a few minutes to sign up.

Handy Tips #37: Collecting metrics from HTTP endpoints with HTTP agent items

Post Syndicated from Arturs Lontons original https://blog.zabbix.com/handy-tips-37-collecting-metrics-from-http-endpoints-with-http-agent-items/23160/

Collect metrics from HTTP endpoints such as web application APIs by defining HTTP agent items.

Collecting metrics from web services and applications is a complex affair usually done by scripting around CLIs and APIs. Organizations require an efficient way to monitor such and endpoints and react to collected data.

Collect and react to data from web services and applications with Zabbix HTTP agent items:

  • Collect metrics agentlessly using HTTP/HTTPS protocols
  • Collect metrics in bulk to reduce the number of outgoing requests

  • Zabbix preprocessing can be utilized to extract the required metrics from the response
  • Select from multiple HTTP authentication types

Check out the video to learn how to define HTTP items and collect metrics from HTTP endpoints.

Define HTTP items and collect metrics from HTTP endpoints:

  1. Navigate to ConfigurationHosts and find your host
  2. Open the Items section and press the Create item button
  3. Select TypeHTTP agent
  4. Provide the item key, name and URL
  5. For now, set the Type of information to Text
  6. Optionally, provide the request body and required status codes
  7. Press the Test button and then press Get value and test
  8. Save the resulting value to help you define the preprocessing steps
  9. Navigate to the Preprocessing tab
  10. Define a JSONPath preprocessing step to extract a value from the previous test result
  11. Navigate to the Item section
  12. Change the Type of information to Numeric (float)
  13. Perform the item test one more time
  14. Press Add to add the item

Tips and best practices
  • HTTP item check is executed by Zabbix server or Zabbix proxy
  • Zabbix will follow redirects if the Follow redirects option is checked
  • HTTP items have their own Timeout parameter defined in the item configuration
  • Receiving a status code not listed in the Required status codes field will result in the item becoming unsupported

Learn how to automate your Zabbix configuration workflows and integrate Zabbix with external systems by signing up for the Automation and Integration with Zabbix API course. During the course, students will learn how to use the Zabbix API by implementing different use cases under the guidance of a Zabbix certified trainer.

The post Handy Tips #37: Collecting metrics from HTTP endpoints with HTTP agent items appeared first on Zabbix Blog.

API Security: Best Practices for a Changing Attack Surface

Post Syndicated from Ray Cochrane original https://blog.rapid7.com/2022/06/27/api-security-best-practices-for-a-changing-attack-surface/

API Security: Best Practices for a Changing Attack Surface

API usage is skyrocketing. According to the latest State of the API Report, API requests increased by 56% last year to a total of 855 million, and Google says the growth isn’t expected to slow any time soon.

APIs – short for application programming interfaces – are a critical component of how applications are built. They control the type of requests that occur between programs, how requests are made, and the format of those requests.

The huge increase in usage stems from the important role APIs – and web applications more broadly – play in digital transformation. APIs have helped facilitate the transition from monolithic applications to microservices. They’ve enabled businesses to provide user-oriented API-based services for B2B use cases, including automation and integration. And they’re integral to modern web applications, which are no longer just HTML with links but rich user interfaces, built as single-page apps with REST API backends. Nearly every modern application utilizes – or is – an API.

Today, it’s almost impossible to do anything online without interacting with an API. That’s why cyberattacks are increasingly targeting APIs, and they’ve become a large part of the application attack surface.

Why securing APIs is important

APIs are a lucrative target that can allow hackers to gain access to an otherwise secure system and exploit vulnerabilities. Not only do APIs often suffer from the same vulnerabilities as web applications – like broken access controls, injections, security misconfigurations, and vulnerabilities inherited from other dependent code libraries – but they are also more susceptible to resource consumption and rate limiting issues due to the automated nature of their users.

Due to a lack of knowledge in the market, it’s also common that legacy issues from early APIs are carried forward. For example, not all APIs will be fronted by an API gateway, with older APIs sitting in the background with little or no protection simply due to a lack of awareness of them. Many unused APIs will also not have been decommissioned, as newer APIs are produced and replace them as a product evolves, due to a lack of standard process and bad practice. This can leave legacy APIs vulnerable to attacks.

How to secure an API

The first step in securing your APIs is to audit your environment and/or applications to take an inventory of what APIs you have and which ones you’re actually utilizing. Then, you must understand the purpose of each individual API to allow you to validate that it is working as expected. You must also understand the expected behavior of the API to allow identification of threats more readily by being able to capture abnormal activity. Once you have a firm understanding of what the API’s functionality is and what expected behavior is, you can then both manage and test your API more effectively and efficiently.

API management is a key element for API security. APIs not only require the same controls as web apps but also additional controls specific to the API’s unique function. Documentation and version control of APIs is of vital importance, as one product can have multiple APIs – even hundreds or thousands.

Poor management can lead to issues with legacy and defunct APIs, as you will often find that only a small portion of APIs pass through an API gateway. Meanwhile, older APIs – which haven’t been decommissioned, or which teams simply aren’t aware of – can sit in the background with no protection. The probability of known vulnerabilities with older APIs is also significantly higher, which amplifies the risk profile.

The same legacy issues can also lead to coverage gaps, and calls that are outside of an API gateway could leave a blind spot when it comes to intra-API calls. Publishing and clearly defining your API will simplify users’ understanding of the API, allowing them to connect in the most appropriate and effective way. Ensuring your API is appropriately monitored is a key management technique. Continuously undertaking performance checks will allow you to understand if the API is under stress from being overloaded. It can also provide an indication of traffic volumes to monitor usage, potentially gauge malicious activity (via audit logs), and judge whether you need to scale up your operation. Lastly, having a response plan in place for attacks is a vital control in API security, allowing for a rapid but controlled response to potential threats.

There have been many recent examples of API-based attacks, such as those experienced by WordPress – and even on the dating scene with Bumble’s recent vulnerability issues. Some simple but effective steps you can take to secure your API and reduce the risk of such exposures include:

  • Authentication: Do you have a control in place to understand who’s calling your API?
  • Authorization: Should the person calling be able to access this data?
  • Encryption: Have you encrypted your network traffic?
  • Traffic management: Have you set rate limits or thresholds to keep a customer from pulling too much data or running scripts to tie up an API?
  • Audit logging: Effective logging ensures you can understand what normal traffic looks like and allows you to identify abnormal activity.

How to test your API

API testing is still evolving to keep up with the increase in volume and complexity. While manual API security testing can be done with traditional testing tools, and fully automated API security testing is partially supported by most major DAST solutions, there are many open-source tools written for guided API security testing. API testing used in conjunction with proper API management will increase API security.

API testing is most effective when you have a full risk profile of your business – i.e. you are fully aware of all of your APIs (including legacy or defunct APIs) to ensure you have no blindspots that could be exposed or manipulated. Taking time to identify vulnerabilities in API frameworks, your network, configuration, and policy all enhance your API security.

Anticipating threats by understanding expected behavior and having adequate testing in place will allow for proactive coverage and enhanced protection and threat identification.

Finally, you must continuously test your endpoint to ensure protection is maintained at all times and optimum security is in place. The ability to identify and block security risks before they occur is vital in the fight to provide the best protection against threats to your API.

Additional reading:

NEVER MISS A BLOG

Get the latest stories, expertise, and news about security today.

XSS in JSON: Old-School Attacks for Modern Applications

Post Syndicated from Julius Callahan original https://blog.rapid7.com/2022/05/04/xss-in-json-old-school-attacks-for-modern-applications/

XSS in JSON: Old-School Attacks for Modern Applications

I recently wrote a blog post on injection-type vulnerabilities and how they were knocked down a few spots from 1 to 3 on the new OWASP Top 10 for 2022. The main focus of that article was to demonstrate how stack traces could be — and still are — used via injection attacks to gather information about an application to further an attacker’s goal. In that post, I skimmed over one of my all time favorite types of injections: cross-site scripting (XSS).

In this post, I’ll cover this gem of an exploit in much more depth, highlighting how it has managed to adapt to the newer environments of today’s modern web applications, specifically the API and Javascript Object Notation (JSON).

I know the term API is thrown around a lot when referencing web applications these days, but for this post, I will specifically be referencing requests made from the front end of a web application to the back end via ajax (Asynchronous JavaScript and XML) or more modern approaches like the fetch method in JavaScript.

Before we begin, I’d like to give a quick recap of what XSS is and how a legacy application might handle these types of requests that could trigger XSS, then dive into how XSS still thrives today in modern web applications via the methods mentioned so far.

What is cross-site scripting?

There are many types of XSS, but for this post, I’ll only be focusing on persistent XSS, which is sometimes referred to as stored XSS.

XSS is a type of injection attack, in which malicious scripts are injected into otherwise benign and trusted websites. XSS attacks occur when an attacker uses a web application to execute malicious code — generally in the form of a browser-side script like JavaScript, for example — against an unsuspecting end user. Flaws that allow these attacks to succeed are quite widespread and occur anywhere a web application accepts an input from a user without sanitizing, validating, escaping, or encoding it.

Because the end user’s browser has no way to know not to trust the malicious script, the browser will execute the script. Because of this broken trust, attackers typically leverage these vulnerabilities to steal victims’ cookies, session tokens, or other sensitive information retained by the browser. They could also redirect to other malicious sites, install keyloggers or crypto miners, or even change the content of the website.

Now for the “stored” part. As the name implies, stored XSS generally occurs when the malicious payload has been stored on the target server, usually in a database, from input that has been submitted in a message forum, visitor log, comment field, form, or any parameter that lacks proper input sanitization.

What makes this type of XSS so much more damaging is that, unlike reflected XSS – which only affects specific targets via cleverly crafted links – stored XSS affects any and everyone visiting the compromised site. This is because the XSS has been stored in the applications database, allowing for a much larger attack surface.

Old-school apps

Now that we’ve established a basic understanding of stored XSS, let’s go back in time a few decades to when web apps were much simpler in their communications between the front-end and back-end counterparts.

Let’s say you want to change some personal information on a website, like your email address on a contacts page. When you enter in your email address and click the update button, it triggers the POST method to send the form data to the back end to update that value in a database. The database updates the value in a table, then pushes a response back to the web applications front end, or UI, for you to see. This would usually result in the entire page having to reload to display only a very minimal amount of change in content, and while it’s very inefficient, nonetheless the information would be added and updated for the end user to consume.

In the example below, clicking the update button submits a POST form request to the back-end database where the application updates and stores all the values, then provides a response back to the webpage with the updated info.

XSS in JSON: Old-School Attacks for Modern Applications

XSS in JSON: Old-School Attacks for Modern Applications

Old-school XSS

As mentioned in my previous blog post on injection, I give an example where an attacker enters in a payload of <script>alert(“This is XSS”)</script> instead of their email address and clicks the update button. Again, this triggers the POST method to take our payload and send it to the back-end database to update the email table, then pushes a response back to the front end, which gets rendered back to the UI in HTML. However, this time the email value being stored and displayed is my XSS payload, <script>alert(“This is XSS”)</script>, not an actual email address.

XSS in JSON: Old-School Attacks for Modern Applications

As seen above, clicking the “update” button submits the POST form data to the back end where the database stores the values, then pushes back a response to update the UI as HTML.

XSS in JSON: Old-School Attacks for Modern Applications

However, because our payload is not being sanitized properly, our malicious JavaScript gets executed by the browser, which causes our alert box to pop up as seen below.

XSS in JSON: Old-School Attacks for Modern Applications

While the payload used in the above example is harmless, the point to drive home here is that we were able to get the web application to store and execute our JavaScript all through a simple contact form. Anyone visiting my contact page will see this alert pop up because my XSS payload has been stored in the database and gets executed every time the page loads. From this point on, the possible damage that could be done here is endless and only limited by the attacker’s imagination… well, and their coding skills.  

New-school apps

In the first example I gave, when you updated the email address on the contact page and the request was fulfilled by the backend, the entire page would reload in order to display the newly created or updated information. You can see how inefficient this is, especially if the only thing changing on the page is a single line or a few lines of text. Here is where ajax and/or the fetch method comes in.

Ajax, or the fetch method, can be used to get data from or post data to a remote source, then update the front-end UI of that web application without having to refresh the page. Only the content from the specific request is updated, not the entire page, and that is the key difference between our first example and this one.

And a very popular format for said data being sent and received is JavaScript Object Notation, most commonly known as JSON. (Don’t worry, I’ll get back to those curly braces in just a bit.)

New-school XSS

(Well, not really, but it sounds cool.)

Now, let’s pretend we’ve traveled back to the future and our contact page has been rewritten to use ajax or the fetch method to send and receive data to and from the database. From the user’s point of view, nothing has changed — still the same ol’ form. But this time, when the email address is being updated, only the contact form refreshes. The entire page and all of its contents do not refresh like in the previous version, which is a major win for efficiency and user experience.

Below is an example of what a POST might look like formatted in JSON.

XSS in JSON: Old-School Attacks for Modern Applications

“What is JSON?” you might ask. Short for JavaScript Object Notation, it is a lightweight text format for storing and transferring data and is most commonly used when sending data to and from servers. Remember those curly braces I mentioned earlier? Well, one quick and easy way to spot JSON is the formatting and the use of curly braces.

In the example above, you can see what our new POST looks like using ajax or the fetch method in JavaScript. While the end result is no different than before, as seen in the example below, the method that was used to update the page is quite different. The key difference here is that the data we’re wanting to update is being treated as just that: data, but in the form of JSON as opposed to HTML.

XSS in JSON: Old-School Attacks for Modern Applications

Now, let’s inject the same XSS payload into the same email field and hit update.  In the example below, you can see that our POST request has been wrapped in curly braces, using JSON, and is formatted a bit differently than previously before being sent to the back end to be processed.

XSS in JSON: Old-School Attacks for Modern Applications

XSS in JSON: Old-School Attacks for Modern Applications

In the example above, you can see that the application is allowing my email address to be the XSS payload in its entirety. However, the JavaScript here is only being displayed and not being executed as code by the browser, so the alert “pop” message never gets triggered as in the previous example. That again is the key difference from the original way we were fulfilling the requests versus our new, more modern way — or in short, using JSON instead of HTML.

Now you might be asking yourself, what’s wrong with allowing the XSS payload to be the email address if it’s only being displayed and not being executed as JavaScript by the browser. That is a valid question, but hear me out.

See, I’ve been working in this industry long enough to know that the two most common responses to a question or statement regarding cybersecurity begin with either “that depends…” or “what if…”  I’m going to go with the latter here and throw a couple what-ifs at you.

Now that my XSS is stored in your database, it’s only a matter of time before this ticking time bomb goes off. Just because my XSS is being treated as JSON and not HTML now does not mean that will always be the case, and attackers are betting on this.

Here are a few scenarios.

Scenario 1

What if team B handles this data differently from team A? What if team B still uses more traditional methods of sending and receiving data to and from the back end and does leverage the use of HTML and not JSON?

In that case, the XSS would most likely eventually get executed. It might not affect the website that the XSS was originally injected into, but the stored data can be (and usually is) also used elsewhere. The XSS stored in that database is probably going to be shared and used by multiple other teams and applications at some point. The odds of all those different teams leveraging the exact same standards and best practices are slim to none, and attackers know this.  

Scenario 2

What if, down the road, a developer using more modern techniques like ajax or the fetch method to send and receive data to and from the back end decides to use the .innerHTML property instead of .innerTEXT to load that JSON into the UI? All bets are off, and the stored XSS that was previously being protected by those lovely curly braces will now most likely get executed by the browser.

Scenario 3

Lastly, what if the current app had been developed to use server-side rendering, but a decision from higher up has been made that some costs need to be cut and that the company could actually save money by recoding some of their web apps to be client-side rather than server-side?

Previously, the back end was doing all the work, including sanitizing all user input, but now the shift will be for the browser to do all the heavy lifting. Good luck spotting all the XSS stored in the DB — in its previous state, it was “harmless,” but now it could get rendered to the UI as HTML, allowing the browser to execute said stored XSS. In this scenario, a decision that was made upstream will have an unexpected security impact downstream, both figuratively and literally — a situation that is all too well-known these days.

Final thoughts

Part of my job as a security advisor is to, well, advise. And it’s these types of situations that keep me up at night. I come across XSS in applications every day, and while I may not see as many fun and exciting “pops” as in years past, I see something a bit more troubling.

This type of XSS is what I like to call a “sleeper vuln” – laying dormant, waiting for the right opportunity to be woken up. If I didn’t know any better, I’d say XSS has evolved and is aware of its new surroundings. Of course, XSS hasn’t evolved, but the applications in which it lives have.

At the end of the day, we’re still talking about the same XSS from its conception, the same XSS that has been on the OWASP Top 10 for decades — what we’re really concerned about is the lack of sanitization or handling of user input. But now, with the massive adoption of JavaScript frameworks like Angular, libraries like React, the use of APIs, and the heavy reliance on them to handle the data properly, we’ve become complacent in our duties to harden applications the proper way.

There seems to be a division in camps around XSS in JSON. On the one hand, some feel that since the JavaScript isn’t being executed by the browser, everything is fine. Who cares if an email address (or any data for that matter) is potentially dangerous — as long as it’s not being executed by the browser. And on the other hand, you have the more fundamentalist, dare I say philosophical thought that all user input should never be trusted: It should always be sanitized, regardless of whether it’s treated as data or not — and not solely because of following best coding and security practices, but also because of the “that depends” and “what if” scenarios in the world.  

I’d like to point out in my previous statement above, that “as long as” is vastly different from cannot.” “As long as” implies situational awareness and that a certain set of criteria need to be met for it to be true or false, while “cannot” is definite and fixed, regardless of the situation or criteria. “As long as the XSS is wrapped in curly braces” means it does not pose a risk in its current state but could in other states. But if input is sanitized and escaped properly, the XSS would never exist in the first place, and thus it “cannot” or could not be executed by the browser, ever.

I guess I cannot really complain too much about these differences of opinions though. The fact that I’m even having these conversations with others is already a step in the right direction. But what does concern me is that it’s 2022, and we’re still seeing XSS rampant in applications, but because it’s wrapped in JSON somehow makes it acceptable. One of the core fundamentals of my job is to find and prioritize risk, then report. And while there is always room for discussion around the severity of these types of situations, lots of factors have to be taken into consideration, a spade isn’t always a spade in application security, or cybersecurity in general for that matter. But you can rest assured if I find XSS in JSON in your environment, I will be calling it out.  

I hope there will be a future where I can look back and say, “Remember that one time when curly braces were all that prevented your website from getting hacked?” Until then, JSON or not, never trust user data, and sanitize all user input (and output for that matter). A mere { } should never be the difference between your site getting hacked or not.

Additional reading:

NEVER MISS A BLOG

Get the latest stories, expertise, and news about security today.

Streamlining evidence collection with AWS Audit Manager

Post Syndicated from Nicholas Parks original https://aws.amazon.com/blogs/security/streamlining-evidence-collection-with-aws-audit-manager/

In this post, we will show you how to deploy a solution into your Amazon Web Services (AWS) account that enables you to simply attach manual evidence to controls using AWS Audit Manager. Making evidence-collection as seamless as possible minimizes audit fatigue and helps you maintain a strong compliance posture.

As an AWS customer, you can use APIs to deliver high quality software at a rapid pace. If you have compliance-focused teams that rely on manual, ticket-based processes, you might find it difficult to document audit changes as those changes increase in velocity and volume.

As your organization works to meet audit and regulatory obligations, you can save time by incorporating audit compliance processes into a DevOps model. You can use modern services like Audit Manager to make this easier. Audit Manager automates evidence collection and generates reports, which helps reduce manual auditing efforts and enables you to scale your cloud auditing capabilities along with your business.

AWS Audit Manager uses services such as AWS Security Hub, AWS Config, and AWS CloudTrail to automatically collect and organize evidence, such as resource configuration snapshots, user activity, and compliance check results. However, for controls represented in your software or processes without an AWS service-specific metric to gather, you need to manually create and provide documentation as evidence to demonstrate that you have established organizational processes to maintain compliance. The solution in this blog post streamlines these types of activities.

Solution architecture

This solution creates an HTTPS API endpoint, which allows integration with other software development lifecycle (SDLC) solutions, IT service management (ITSM) products, and clinical trial management systems (CTMS) solutions that capture trial process change amendment documentation (in the case of pharmaceutical companies who use AWS to build robust pharmacovigilance solutions). The endpoint can also be a backend microservice to an application that allows contract research organizations (CRO) investigators to add their compliance supporting documentation.

In this solution’s current form, you can submit an evidence file payload along with the assessment and control details to the API and this solution will tie all the information together for the audit report. This post and solution is directed towards engineering teams who are looking for a way to accelerate evidence collection. To maximize the effectiveness of this solution, your engineering team will also need to collaborate with cross-functional groups, such as audit and business stakeholders, to design a process and service that constructs and sends the message(s) to the API and to scale out usage across the organization.

To download the code for this solution, and the configuration that enables you to set up auto-ingestion of manual evidence, see the aws-audit-manager-manual-evidence-automation GitHub repository.

Architecture overview

In this solution, you use AWS Serverless Application Model (AWS SAM) templates to build the solution and deploy to your AWS account. See Figure 1 for an illustration of the high-level architecture.

Figure 1. The architecture of the AWS Audit Manager automation solution

Figure 1. The architecture of the AWS Audit Manager automation solution

The SAM template creates resources that support the following workflow:

  1. A client can call an Amazon API Gateway endpoint by sending a payload that includes assessment details and the evidence payload.
  2. An AWS Lambda function implements the API to handle the request.
  3. The Lambda function uploads the evidence to an Amazon Simple Storage Service (Amazon S3) bucket (3a) and uses AWS Key Management Service (AWS KMS) to encrypt the data (3b).
  4. The Lambda function also initializes the AWS Step Functions workflow.
  5. Within the Step Functions workflow, a Standard Workflow calls two Lambda functions. The first looks for a matching control within an assessment, and the second updates the control within the assessment with the evidence.
  6. When the Step Functions workflow concludes, it sends a notification for success or failure to subscribers of an Amazon Simple Notification Service (Amazon SNS) topic.

Deploy the solution

The project available in the aws-audit-manager-manual-evidence-automation GitHub repository contains source code and supporting files for a serverless application you can deploy with the AWS SAM command line interface (CLI). It includes the following files and folders:

src Code for the application’s Lambda implementation of the Step Functions workflow.
It also includes a Step Functions definition file.
template.yml A template that defines the application’s AWS resources.

Resources for this project are defined in the template.yml file. You can update the template to add AWS resources through the same deployment process that updates your application code.

Prerequisites

This solution assumes the following:

  1. AWS Audit Manager is enabled.
  2. You have already created an assessment in AWS Audit Manager.
  3. You have the necessary tools to use the AWS SAM CLI (see details in the table that follows).

For more information about setting up Audit Manager and selecting a framework, see Getting started with Audit Manager in the blog post AWS Audit Manager Simplifies Audit Preparation.

The AWS SAM CLI is an extension of the AWS CLI that adds functionality for building and testing Lambda applications. The AWS SAM CLI uses Docker to run your functions in an Amazon Linux environment that matches Lambda. It can also emulate your application’s build environment and API.

To use the AWS SAM CLI, you need the following tools:

AWS SAM CLI Install the AWS SAM CLI
Node.js Install Node.js 14, including the npm package management tool
Docker Install Docker community edition

To deploy the solution

  1. Open your terminal and use the following command to create a folder to clone the project into, then navigate to that folder. Be sure to replace <FolderName> with your own value.

    mkdir Desktop/<FolderName> && cd $_

  2. Clone the project into the folder you just created by using the following command.

    git clone https://github.com/aws-samples/aws-audit-manager-manual-evidence-automation.git

  3. Navigate into the newly created project folder by using the following command.

    cd aws-audit-manager-manual-evidence-automation

  4. In the AWS SAM shell, use the following command to build the source of your application.

    sam build

  5. In the AWS SAM shell, use the following command to package and deploy your application to AWS. Be sure to replace <DOC-EXAMPLE-BUCKET> with your own unique S3 bucket name.

    sam deploy –guided –parameter-overrides paramBucketName=<DOC-EXAMPLE-BUCKET>

  6. When prompted, enter the AWS Region where AWS Audit Manager was configured. For the rest of the prompts, leave the default values.
  7. To activate the IAM authentication feature for API gateway, override the default value by using the following command.

    paramUseIAMwithGateway=AWS_IAM

To test the deployed solution

After you deploy the solution, run an invocation like the one below for an assessment (using curl). Be sure to replace <YOURAPIENDPOINT> and <AWS REGION> with your own values.

curl –location –request POST
‘https://<YOURAPIENDPOINT>.execute-api.<AWS REGION>.amazonaws.com/Prod’ \
–header ‘x-api-key: ‘ \
–form ‘payload=@”<PATH TO FILE>”‘ \
–form ‘AssessmentName=”GxP21cfr11″‘ \
–form ‘ControlSetName=”General requirements”‘ \
–form ‘ControlIdName=”11.100(a)”‘

Check to see that your file is correctly attached to the control for your assessment.

Form-data interface parameters

The API implements a form-data interface that expects four parameters:

  1. AssessmentName: The name for the assessment in Audit Manager. In this example, the AssessmentName is GxP21cfr11.
  2. ControlSetName: The display name for a control set within an assessment. In this example, the ControlSetName is General requirements.
  3. ControlIdName: this is a particular control within a control set. In this example, the ControlIdName is 11.100(a).
  4. Payload: this is the file representing evidence to be uploaded.

As a refresher of Audit Manager concepts, evidence is collected for a particular control. Controls are grouped into control sets. Control sets can be grouped into a particular framework. The assessment is considered an implementation, or an instance, of the framework. For more information, see AWS Audit Manager concepts and terminology.

To clean up the deployed solution

To clean up the solution, use the following commands to delete the AWS CloudFormation stack and your S3 bucket. Be sure to replace <YourStackId> and <DOC-EXAMPLE-BUCKET> with your own values.

aws cloudformation delete-stack –stack-name <YourStackId>
aws s3 rb s3://<DOC-EXAMPLE-BUCKET> –force

Conclusion

This solution provides a way to allow for better coordination between your software delivery organization and compliance professionals. This allows your organization to continuously deliver new updates without overwhelming your security professionals with manual audit review tasks.

Next steps

There are various ways to extend this solution.

  1. Update the API Lambda implementation to be a webhook for your favorite software development lifecycle (SDLC) or IT service management (ITSM) solution.
  2. Modify the steps within the Step Functions state machine to more closely match your unique compliance processes.
  3. Use AWS CodePipeline to start Step Functions state machines natively, or integrate a variation of this solution with any continuous compliance workflow that you have.

Learn more AWS Audit Manager, DevOps, and AWS for Health and start building!

 
If you have feedback about this post, submit comments in the Comments section below. If you have questions about this post, contact AWS Support.

Want more AWS Security news? Follow us on Twitter.

Nicholas Parks

Nicholas Parks

Nicholas has been using AWS since 2010 across various enterprise verticals including healthcare, life sciences, financial, retail, and telecommunications. Nicholas focuses on modernizations in pursuit of new revenue as well as application migrations. He specializes in Lean, DevOps cultural change, and Continuous Delivery.

Brian Tang

Brian Tang

Brian Tang is an AWS Solutions Architect based out of Boston, MA. He has 10 years of experience helping enterprise customers across a wide range of industries complete digital transformations by migrating business-critical workloads to the cloud. His core interests include DevOps and serverless-based solutions. Outside of work, he loves rock climbing and playing guitar.

Ексклузивни документи по #АПИГейт Замесени в инхаусите са преназначени начело на „Автомагистрали“ и АПИ

Post Syndicated from Николай Марченко original https://bivol.bg/%D0%B7%D0%B0%D0%BC%D0%B5%D1%81%D0%B5%D0%BD%D0%B8-%D0%B2-%D0%B8%D0%BD%D1%85%D0%B0%D1%83%D1%81%D0%B8%D1%82%D0%B5-%D1%81%D0%B0-%D0%BF%D1%80%D0%B5%D0%BD%D0%B0%D0%B7%D0%BD%D0%B0%D1%87%D0%B5%D0%BD%D0%B8.html

петък 4 февруари 2022


Вицепремиерът и министър на регионалното развитие от квотата на „Има такъв народ“ Гроздан Караджов е назначил замесени в “инхаус” сделки за укрепване на свлачища и АМ “Хемус” в управителния съвет…

Cloudflare Partner Program Now Supports SASE & Zero Trust Managed Services

Post Syndicated from Matthew Harrell original https://blog.cloudflare.com/zero-trust-managed-services/

Cloudflare Partner Program Now Supports SASE & Zero Trust Managed Services

Cloudflare Partner Program Now Supports SASE & Zero Trust Managed Services

The importance of the Cloudflare Partner Network was on full display in 2021, with record level partner growth in 2021 and aiming even higher in 2022. We’ve been listening to our partners and working to constantly strengthen our ability to deliver value for businesses of all types. An area we identified we could do better, is a program to support “service partners” that want to wrap managed and professional services around Cloudflare products. Today, we are excited to announce the next evolution of the Cloudflare Channel and Alliances Partner Program to specifically enable partners that provide services around Cloudflare products with recurring revenue streams as they equip businesses of all sizes and types with Cloudflare’s leading Zero Trust and SASE solutions.

Cloudflare Partner Program Now Supports SASE & Zero Trust Managed Services

Core to enabling Services Partners are some exciting enhancements:

  • New Program Paths
  • New Managed Services Partner (MSP) Accreditation.
  • New Support & Go-To-Market Motions

New Program Paths

We have seen a 29% increase in ransom DDoS attacks over the past year and a 175% increase just last quarter. Partners continue to be on the front lines helping mitigate and prevent disruption from these events as they extend our services. Our goal for 2022 is to arm our partners with the tools to address these increased threats to their customers’ infrastructure and applications, like Office365. We know the painstaking efforts that Services Partners make to build compelling offerings and provide the best customer outcomes. To that end, we’ve enhanced the Cloudflare Channel and Alliances Partner Program to not only focus on extending security, performance, and reliability to more customers, but provide a services-first approach for partners. We are committing to the growth of MSP & MSSP partners who share Cloudflare’s mission of helping to build a better Internet.

We’ve been building out the Cloudflare Partner Network for years, working alongside businesses of all sizes and types including our world-wide system integrator partners like Rackspace, as well as partners across EMEA, APAC like Blazeclan, and Kingsoft in China, to name a few. Working with enthusiastic, targeted partners has given us the opportunity to build a program to deliver a robust yet tailored program to support our partners’ ever-evolving needs from network transformations and application modernization, to Zero Trust solutions and onwards.

“Rackspace offers expert consultative services and 24×7 managed support based on Cloudflare’s web application security, secure Internet access, gateway and browsing technologies. With Rackspace Elastic Engineering for Security and Cloudflare’s cutting-edge cloud solutions, we’ll be able to help our customers fast-forward to a modern, Zero Trust approach to securing their teams, applications and infrastructure.”
Gary Alterson, Vice President of Security Services at Rackspace Technology

“We are excited to participate in Cloudflare’s new Services Partner Program.  Cloudflare provides the advanced cloud technology at the center of digital business models.  As a Cloudflare MSP Elite partner, we are able to leverage their innovative cloud solutions with embedded, network edge security to give our customers single-pane-of-glass reporting and policy management across internet applications.”
Veeraj Thaploo, CTO, Blazeclan technologies

Advanced Managed Services Partners

The entry point for partners that are providing managed IT services for small to midsize organizations who are fanatical about providing the best customer experience by leveraging Cloudflare’s extensive platform. Advanced MSP Partners will have access to tools that will help embed Cloudflare into their services offerings to deliver unique, outcome-based SASE and Zero Trust solutions.

Elite Managed Services Partners

Reserved for global partners that possess resource-intense engagement in IT consulting, advisory, and large scale services in the Large Enterprise segment. Elite MSP Partners will have access to dedicated technical and sales resources as well as a named Partner Success Manager to guide growth and business development around their Cloudflare-based services practice. In addition, these partners will have access to executive leadership and marketing programs to develop joint go-to-market functions.

Services-Only Partnerships

Invite-only for partners to deliver general professional services, highly technical services such as Application Modernization via Cloudflare Workers development, Implementation and Migration Services, and Security Assessments.

New Managed Services Partner Accreditation (AMSP)

Helping build a better Internet isn’t simple. Providing managed services for a wide range of customer types and sizes requires a targeted but ever-evolving approach. To support the new Services Program, we’ve introduced a new Certification course that provides the foundational tools for creating the Cloudflare customer experience. Course highlights include best practices for services design, implementation, and providing ongoing technical and relationship management. Services Partners provide customers with a seamless experience from implementation to configuration to ongoing services; here are some of the highlights:

  • New Enablement path for MSP Partners – L1/ L2 Support + Account Management
  • New Customer Success Enablement path for Services Partners
  • New Specialist Accreditation for Cloudflare Zero Trust
Cloudflare Partner Program Now Supports SASE & Zero Trust Managed Services

New Support & Go-To-Market Motions

Technical Services Managers & Partner Success

Regional resources dedicated to helping partners develop, drive, and expand their Cloudflare-based services offerings, specifically centered around SASE and Zero Trust.

Tenant API Provisioning

Our Partner Platform was built to be extensible, and we’re excited to announce that all of our partners can support the provisioning and deployment of a leading Zero Trust suite of products.

MSP-only Licensing Plan

MSPs and MSSPs deliver finished goods and need cost-efficient ways to deliver customer outcomes. We’ve heard this from our partners, and we are developing a licensing plan that enables MSPs to sell their services powered by the Cloudflare One platform.

Transform your Customer’s Network

We’ve been working diligently to build the pilot program throughout this past year, and are eager to work with the next cohort of service partners that want to help build a better Internet for customers. We’re just getting started in providing a tailored and targeted foundation for the Cloudflare Partner Ecosystem.

Cloudflare Services Partner Offering Menu

Cloudflare Partner Program Now Supports SASE & Zero Trust Managed Services

Come join us!

During the initial launch phase, we are working with a select group of partners, and are looking forward to expanding and growing with even more partnerships. Our goal is to enable partners that are creating cloud-based security solutions and that want to join us, to further our mission to help build a better Internet. If you believe your organization would be a great fit for this program, we would love to chat with you.

More Information:

Become a Partner: Partner Portal or reach out to [email protected].

Zabbix meets television – Clever use of Zabbix features by Wolfgang Alper / Zabbix Summit Online 2021

Post Syndicated from Wolfgang Alper original https://blog.zabbix.com/zabbix-meets-television-clever-use-of-zabbix-features-by-wolfgang-alper-zabbix-summit-online-2021/19181/

TV broadcasting infrastructures have seen many great paradigm shifts over the years. From TV to live streaming – the underlying architecture consists of many moving parts supplied by different vendors and solutions. Any potential problems can cause critical downtimes, which are simply not acceptable. Let’s look at how Zabbix fits right into such a dynamic and ever-changing environment.

The full recording of the speech is available on the official Zabbix Youtube channel.

In this post, I will talk about how Zabbix is used in ZDF – Zweites Deutsche Fernsehen (Second German Television). I will specifically focus on the most unique and interesting use cases, and I hope that you will be able to use this knowledge in your next project.

ZDF – Some history

Before we move on with our unique use cases, I would like to introduce you to the history of ZDF. This will help you understand the scope and the potential complexity and scale of the underlying systems and company policies.

  • In 1961, the federal states established a central non-profit television broadcaster – Zweites Deutsches Fernsehen
  • In 1963 on April 1, ZDF officially went on air and had reached 61 percent of television viewers
  • On the Internet, a selection of programs is offered via live stream or video-on-demand through the ZDFmediathek, which has been in existence since 2001
  • Since February 2013, ZDF has been broadcasting its programs around the clock as an internet live stream
  • As of today, ZDF is one of the largest public broadcasters in Europe with permanent bureaus worldwide and is also present on various platforms like Youtube, Facebook, etc.

Here we can see that over the years, ZDF has made some major leaps – from a television broadcaster with the majority percentage of viewers to offering on-demand video service and moving to 24/7 internet live streams. ZDF has also scaled up its presence along with multiple different digital platforms as well as its physical presence all over the globe.

Integrating Zabbix with an external infrastructure monitoring system

In our first use case, we will cover integrating Zabbix with an external infrastructure monitoring system. As opposed to monitoring IT metrics like hard drive space, memory usage, or CPU loads – this external system is responsible for monitoring devices like power generators, transmission stations, and other similar components. The idea was to pass the states of these components to Zabbix. This way, Zabbix would serve as a central “Umbrella” monitoring system.

In addition, the components that are monitored by the external system have states and severities, but the severities are not static and can vary depending on the monitored component. What this means is that each component could generate problems of varying severities. We had to figure out a way to assign the correct severities to each of the external components. Our approach was split into multiple steps:

  • Use Zabbix built-in HTTP check to get LLD discovery data
    • The external monitoring system provides an API, which we can use to obtain the necessary LLD information by using the HTTP checks
    • Zabbix-sender was used for testing since the HTTP items support receiving data from it
  • Use Zabbix built-in HTTP check as a collector to obtain the component status metrics
  • Define item prototypes as dependant items to extract data from collector item
  • Create “smart “trigger prototypes to respect severity information from the LLD data

The JSON below is an example of the LLD data that we are receiving from the external monitoring systems. In addition to component names, descriptions, and categories, we are also providing the severity information. The severities that have a value of -1 are not used, while other severities are cross-checked with the status value retrieved from the returned metrics:

{
"{#NAME}": "generator-secondary",
"{#DISPLAYNAME}": "Secondary power generator",
"{#DESCRIPTION}": "Secondary emergency power generator",
"{#CATEGORY}": "Powersupply",
"{#PRIORITY.INFORMATION}": -1,
"{#PRIORITY.WARNING}": -1,
"{#PRIORITY.AVERAGE}": -1,
"{#PRIORITY.HIGH}": 1,
"{#PRIORITY.DISASTER}": 2
}

Below we can see the returned metrics – the component name and its current status. For example, status = 1 value references the {#PRIORITY.HIGH} from the LLD JSON data.

"generator-primary": {
"status": 0,
"message": "Generator is healthy."
},
"generator-secondary": {
"status": 1,
"message": "Generator is not working properly."
},

We can see that the first generator returns status = 0, which means that the generator is healthy and there are no problems, while the secondary generator is currently not working properly – status = 1 and should generate a problem with severity High.

Below we can see how the item prototypes are created for each of the components – one item prototype collects the message information, while the other collects the current status of the component. We use JSONPath preprocessing to obtain these values from our master item.

As for the trigger prototypes – we have defined a trigger prototype for each of the trigger severities. The trigger prototypes will then create triggers depending on the information contained in the LLD macros for a given component.

As you can see, the trigger expressions are also quite simple – each trigger simply checks if the last received component status matches the specific trigger threshold status value.

The resulting metrics provide us both the status value and the component status message. As we can see, the triggers are also generating problems with dynamic severities.

Improving the solution with LLD overrides

The solution works – but we can do better! You might have already guessed the underlying issue with this approach: our LLD rule creates triggers for every severity, even if it isn’t used. The threshold value for these unused triggers will use value -1, which we will never receive, so the unused triggers will always stay in the OK state. Effectively – we have created 5 trigger definitions, while in our example, we require only 2 triggers.

How can we resolve this? Thankfully, Zabbix provides just the right tool for the job – LLD Overrides! We have created 5 overrides on our discovery rule – one for each severity:

In the override conditions, we will specify that if the value contained in the priority LLD macros is equal to -1, we will not be discovering the trigger of the specific severity.

The final result looks much cleaner – now we have only two trigger definitions instead of five. 


This is a good example of how we can use LLD together with master items obtaining data from external APIs and also improve the LLD logic by using LLD overrides.

“Sphinx” application monitoring using Graylog REST API

For our second example, we will be monitoring the Sphinx application by using the Graylog REST API. Graylog is a log management tool that we use for log collection – it is not used for any kind of alerting. We also have an application called Sphinx, which consists of three components – a Web component, an App component, and a WCF Gateway component. Our goal here is to:

  • Use Zabbix for evaluating error messages related to Sphinx from Graylog
  • Monitor the number of errors in user-defined time intervals for different components and alert when a threshold is exceeded
  • Analyze the incoming error message and prepare them for a user-friendly output sorted by error types

The main challenges posed by this use-case are:

  • How to obtain Sphinx component information from Graylog
  • How to handle certificate problems (DH_KEY_TOO_SMALL / Diffie-Hellman key) due to an outdated version of the installed Graylog server
  • How to sort the error messages coming in “Free form” without explicit error types

Collecting the data from Graylog

Since the Graylog application used in the current scenario was outdated, we had to work around the certificate issues by using the Zabbix external check item type. Once again, we will be using master and dependent item logic – we will create three master items (one for each component) and retrieve the component data. All additional information will be retrieved by the dependent items as to not cause extra performance impact by flooding the Graylog API endpoint. The data itself was parsed and sorted by using Javascript preprocessing. The dependent item prototypes are used here to create the items for the obtained stats and the data used for visualizing each error type on a user-friendly dashboard.

Let’s take a look at the detailed workflow for this use case:

  • An External check for scanning the Graylog stream Sphinx App Raw
  • A dependent item which analyzes and filters the raw data by using preprocessing Sphinx App Raw Filtered
  • This dependent item is used as a master item for our LLD Sphinx App Error LLD
  • The same dependent item is also used as a master item for our item prototypes – Sphinx App Error count and Sphinx App Error List

Effectively this means that we perform only a single call to the Graylog API, and all of the heavy lifting is done by the dependent item in the middle of our workflow.
The following workflow is used to obtain the information only about the App component – remember, we have two other components where this will have to be implemented – Web and Gateway.

In total, we will have three master items for each of the APP components:

They will use the following shell script to execute the REST API call to the Graylog API:

graylog2zabbix.sh[{$GRAYLOG_USERNAME},{$GRAYLOG_PASSWORD},{HOST.CONN},{$GRAYLOG_PORT},search/universal/relative?
query=name%3Asphinx-app%20AND%20stage%3Aproduction%20AND%20level%3A(ERROR%20OR
%20FATAL)&amp;range=1800&amp;limit=50&amp;filter=streams%3A60000a8c1c09f9862279966e&amp;fields=name%2Clevel
%2Cmessage&amp;decorate=true]

The data that we obtain this way is extremely hard to work with without any additional processing. It very much looks like a set of regular log entries – this complicates the execution of any kind of logic in reaction to receiving this kind of data:

For this reason, we have created a dependent item, which uses preprocessing to filter and sort this data. The dependent item preprocessing is responsible for:

  • Analyzing the error messages
  • Defining the error type
  • Sorting the raw data so that we can work with it more easily

We have defined two preprocessing steps to process this data. We have the JSONPath preprocessing step to select the message from the response and a Javascript preprocessing script that does the heavy lifting. You can see the Javascript script below. It uses Regex and performs data preparation and sorting. In the last line, you can see that the data is transformed back into JSON, so we can work with it down the line by using the JSONpath preprocessing steps for our dependent items.

Below we can see the result. The data stream has been sorted and arranged by error types, which you can see on the left-hand side. All of the logged messages are now children that belong to one of these error types.

We have also created  3 LLD rules – one for each component. These LLD rules create items for each error type for each component. To achieve this, there is also some additional JSONPath and Javascript preprocessing done on the LLD rule itself:

The end result is a dashboard that uses the collected information to display the error count per component. Attached to the graph, we can see some additional details regarding the log messages related to the detected errors.

Monitoring of TV broadcast trucks

I would like to finish up this bost by talking about a completely different use case – monitoring of TV broadcast trucks!

In comparison to the previous use cases – the goals and challenges here are quite unique. We are interested in a completely different set of metrics and have to utilize a different approach to obtain them. Our goals are:

  • Monitor several metrics from different systems used in the TV broadcast truck
  • Monitor the communication availability and quality between the broadcast truck and the transmitting station
  • Only monitor the broadcast truck when it is in use

One of the main challenges for this use case is avoiding false alarms. How can we avoid false positives if a broadcast truck can be put into operation at any time without notifying the monitoring team? The end goal is to monitor the truck when it’s in use and stop monitoring it when it’s not in use.

  • Each broadcast truck is represented by a host in Zabbix – this way, we can easily put it into maintenance
  • A control host is used to monitor the connection states of all broadcasting trucks
  • We decided on creating a middleware application that would be able to implement start/stop monitoring logic
    • This was achieved by switching the maintenance on/off by using the Zabbix API
  • A specific application in the broadcasting truck then tells Zabbix how long to monitor it and when to enable the maintenance for the said truck

Below we can see the truck monitoring workflow. The truck control host gets the status for each truck to decide when to start monitoring the truck. The middleware then starts/stops the monitoring of a truck by using Zabbix API to control the maintenance periods for the trucks. Once a truck is in service, it also passes the monitoring duration to the middleware, so the middleware can decide when the monitoring of a specific truck should be turned off.

Next, let’s look at the truck control workflow from the Zabbix side.

  • Each broadcast truck is represented by a single trigger on the control host
    • The trigger actions forward the information that the truck maintenance period should be disabled to the middleware
  • Middleware uses the Zabbix API to disable the maintenance for the specific truck
  • The truck is now monitored
  • The truck forwards the Monitoring duration to the middleware
  • Once the monitoring duration is over, the middleware enables the maintenance for the specific truck

Finally, the trucks are displayed on a map which can be placed on our dashboards. The map displays if the truck is maintenance (not active) and if it has any problems. This way, we can easily monitor our broadcast truck fleet.

From gathering data from external systems to performing complex data transformations with preprocessing and monitoring our whole fleet of broadcast trucks – I hope you found these use cases useful and were able to learn a thing or two about the flexibility of different Zabbix features!

The post Zabbix meets television – Clever use of Zabbix features by Wolfgang Alper / Zabbix Summit Online 2021 appeared first on Zabbix Blog.

Landscape of API Traffic

Post Syndicated from Daniele Molteni original https://blog.cloudflare.com/landscape-of-api-traffic/

Landscape of API Traffic

Landscape of API Traffic

In recent years we have witnessed an explosion of Internet-connected applications. Whether it is a new mobile app to find your soulmate, the latest wearable to monitor your vitals, or an industrial solution to detect corrosion, our life is becoming packed with connected systems.

How is the Internet changing because of this shift? This blog provides an overview of how Internet traffic is evolving as Application Programming Interfaces (APIs) have taken the centre stage among the communication technologies. With help from the Cloudflare Radar team, we have harnessed the data from our global network to provide this snapshot of global APIs in 2021.

The huge growth in API traffic comes at a time when Cloudflare has been introducing new technologies that protect applications from nascent threats and vulnerabilities. The release of API Shield with API Discovery, Schema Validation, mTLS and API Abuse Detection has provided customers with a set of tools designed to protect their applications and data based on how APIs work and their challenges.

We are also witnessing increased adoption of new protocols. Among encryption protocols, for example, TLS v1.3 has become the most used protocol for APIs on Cloudflare while, for transport protocols, we saw an uptake of QUIC and gRPC (Cloudflare support announced in 2018 and 2020 respectively).

In the following sections we will quantify the growth of APIs and identify key industries affected by this shift. We will also look at the data to better understand the source and type of traffic we see on our network including how much malicious traffic our security systems block.

Why is API use exploding?

By working closely with our customers and observing the broader trends and data across our network in application security, we have identified three main trends behind API adoption: how applications are built is changing, API-first businesses are thriving, and finally machine-to-machine and human-to-machine communication is evolving.

During the last decade, APIs became popular because they allowed developers to separate backend and frontend, thus creating applications with better user experience. The Jamstack architecture is the most recent trend highlighting this movement, where technologies such as JavaScript, APIs and markup are being used to create responsive and high-performance applications. The growth of microservices and serverless architectures are other drivers behind using efficient HTTP-powered application interfaces.

APIs are also enabling companies to innovate their business models. Across many industries there is a trend of modularizing complex processes by integrating self-contained workflows and operations. The product has become the service delivered via APIs, allowing companies to scale and monetize their new capabilities. Financial Services is a prime example where a monolithic industry with vertically integrated service providers is giving way to a more fragmented landscape. The new Open Banking standard (PSD2) is an example of how small companies can provide modular financial services that can be easily integrated into larger applications. Companies like TrueLayer have productized APIs, allowing e-commerce organizations to onboard new sellers to a marketplace within seconds or to deliver more efficient payment options for their customers. A similar shift is happening in the logistics industry as well, where Shippo allows the same e-commerce companies to integrate with services to initiate deliveries, print labels, track goods and streamline the returns process. And of course, everything is powered by APIs.

Finally, the increase of connected devices such as wearables, sensors and robots are driving more APIs, but another aspect of this is the way manual and repetitive tasks are being automated. Infrastructure-as-Code is an example of relying on APIs to replace manual processes that have been used to manage Internet Infrastructure in the past. Cloudflare is itself a product of this trend as our solutions allow customers to use services like Terraform to configure how their infrastructure should work with our products.

Labelling traffic

The data presented in the following paragraphs is based on the total traffic proxied by Cloudflare and traffic is classified according to the Content-Type header generated in the response phase. Only requests returning a 200 response were included in the analysis except for the analysis in the ‘Security’ section where other error codes were included. Traffic generated by identified bots is not included.

When looking at trends, we compare data from the first week of February 2021 to the first week of December 2021. We chose these dates to compare how traffic changed over the year but excluding January which is affected by the holiday season.

Specifically, API traffic is labelled based on responses with types equal application/json, application/xml, and text/xml, while Web accounts for text/html, application/x-javascript, application/javascript, text/css, and text/javascript. Requests categorised as Text are text/plain; Binary are application/octet-stream; Media includes all image types, video and audio.

Finally, Other catches everything that doesn’t clearly fall into the labels above, which includes empty and unknown. Part of this traffic might be API and the categorisation might be missing due to the client or server not adding a Content-Type header.

API use in 2021

We begin by examining the current state of API traffic at our global network and the types of content served. During the first week of December 2021, API calls represented 54% of total requests, up from 52% during the first week of February 2021.

Landscape of API Traffic

When looking at individual data types, API was by far the fastest growing data type (+21%) while Web only grew by 10%. Media (such as images and videos) grew just shy of 15% while binary was the only traffic that in aggregate experienced a reduction of 6%.

Landscape of API Traffic

In summary, APIs have been one of the drivers of the traffic growth experienced by the Cloudflare network in 2021. APIs account for more than half of the total traffic generated by end users and connected devices, and they’re growing twice as fast as traditional web traffic.

New industries are contributing to this increase

We analysed where this growth comes from in terms of industry and application types. When looking at the total volume of API traffic, unsurprisingly the general Internet and Software industry accounts for almost 40% of total API traffic in 2021. The second-largest industry in terms of size is Cryptocurrency (7% of API traffic) followed by Banking and Retail (6% and 5% of API traffic respectively).

The following chart orders industries according to their API traffic growth. Banking, Retail and Financial Services have experienced the largest year-on-year growth with 70%, 51% and 50% increases since February 2021, respectively.

Landscape of API Traffic

The growth of Banking and Financial Services traffic is aligned with the trends we have observed anecdotally in the sector. The industry has seen the entrance of a number of new platforms that aggregate accounts from different providers, streamline transactions, or allow investing directly from apps, all of which rely heavily on APIs. The new “challenger banks” movement is an example where newer startups are offering captivating mobile services based on APIs while putting pressure on larger institutions to modernise their infrastructure and applications.

A closer look at the API characteristics

Generally speaking, a RESTful API request is a call to invoke a function. It includes the address of a specific resource (the endpoint) and the action you want to perform on that resource (method). A payload might be present to carry additional data and HTTP headers might be populated to add information about the origin of the call, what software is requesting data, requisite authentication credentials, etc. The method (or verb) expresses the action you want to perform, such as retrieve information (GET) or update information (POST).

It’s useful to understand the composition and origin of API traffic, such as the most commonly used methods, the most common protocol used to encode the payload, or what service generates traffic (like Web, mobile apps, or IoT). This information will help us identify the macro source of vulnerabilities and design and deploy the best tools to protect traffic.

Methods

The vast majority of API traffic is the result of POST or GET requests (98% of all requests). POST itself accounts for 53.4% of all requests and GET 44.4%. Generally speaking, GET tends to transfer sensitive data in the HTTP request header, query and in the response body, while POST typically transfers data in the request header and body. While many security tools apply to both of these types of calls, this distinction can be useful when deploying tools such as API Schema Validation (request and response) or Data Loss Prevention/Sensitive Data Detection (response), both launched by Cloudflare in March 2021.

Landscape of API Traffic

Payload encoding review

API payloads encode data using different rules and languages that are commonly referred to as transport protocols. When looking at the breakdown between two of the most common protocols, JSON has by far the largest number of requests (~97%) while XML has a smaller share of requests as it still carries the heaviest traffic. In the following figure, JSON and XML are compared in terms of response sizes. XML is the most verbose protocol and the one handling the largest payloads while JSON is more compact and results in smaller payloads.

Landscape of API Traffic

Since we have started supporting gRPC (September 2020), we have seen a steady increase in gRPC traffic and many customers we speak with are in the planning stages of migrating from JSON to gRPC, or designing translation layers at the edge from external JSON callers to internal gRPC services.

Source of API traffic

We can look at the HTTP request headers to better understand the origin and intended use of the API. The User-Agent header allows us to identify what type of client made the call, and we can divide it into three broader groups: “browser”, “non-browser” and “unknown” (which indicates that the User-Agent header was not set).

About 38% of API calls are made by browsers as part of a web application built on top of backend APIs. Here, the browser loads an HTML page and populates dynamic fields by generating AJAX API calls against the backend service. This paradigm has become the de-facto standard as it provides an effective way to build dynamic yet flexible Web applications.

The next 56% comes from non-browsers, including mobile apps and IoT devices with a long tail of different types (wearables, connected sport equipment, gaming platforms and more). Finally, approximately 6% are “unknown” and since well-behaving browsers and tools like curl send a User-Agent by default, one could attribute much of this unknown to programmatic or automated tools, some of which could be malicious.

Landscape of API Traffic

Encryption

A key aspect of securing APIs against snooping and tampering is encrypting the session. Clients use SSL/TLS to authenticate the server they are connecting with, for example, by making sure it is truly their cryptocurrency vendor. The benefit of transport layer encryption is that after handshaking, all application protocol bytes are encrypted, providing both confidentiality and integrity assurances.

Cloudflare launched the latest version of TLS (v1.3) in September 2016, and it was enabled by default on some properties in May 2018. When looking at API traffic today, TLS v1.3 is the most adopted protocol with 55.9% of traffic using it. The vulnerable v1.0  and v1.1 were deprecated in March 2021 and their use has virtually disappeared.

Transport security protocol December 2021
TLS 1.3 55.9%
TLS 1.2 32.7%
QUIC 8.4%
None 2.8%
TLS 1.0 0.3%

The protocol that is growing fastest is QUIC. While QUIC can be used to carry many types of application protocols, Cloudflare has so far focused on HTTP/3, the mapping of HTTP over IETF QUIC. We started supporting draft versions of QUIC in 2018 and when QUIC version 1 was published as RFC 9000 in May 2021, we enabled it for everyone the next day. QUIC uses the TLS 1.3 handshake but has its own mechanism for protecting and securing packets. Looking at HTTP-based API traffic, we see HTTP/3 going from less than 3% in early February 2021 to more than 8% in December 2021. This growth broadly aligns RFC 9000 being published and during the periodHTTP/3 support being stabilized and enabled in a range of client implementations.

Mutual TLS, which is often used for mobile or IoT devices, accounts for 0.3% of total API traffic. Since we released the first version of mTLS in 2017 we’ve seen a growing number of inquiries from users across all Cloudflare plans, as we have recently made it easier for customers to start using mTLS with Cloudflare API Shield. Customers can now use Cloudflare dashboard to issue and manage certificates with one-click avoiding all the complexity of having to manage a Private Key Infrastructure and root certificates themselves.

Finally, unencrypted traffic can provide a great opportunity for attackers to access plain communications. The total unencrypted API traffic dropped from 4.6% of total requests in early 2021 to 2.6% in December 2021. This represents a significant step forward in establishing basic security for all API connections.

Security

Given the huge amount of traffic that Cloudflare handles every second, we can look for trends in blocked traffic and identify common patterns in threats or attacks.

When looking at the Cloudflare security systems, an HTML request is twice as likely to be blocked than an API request. Successful response codes (200, 201, 301 and 302) account for 91% of HTML and 97% of API requests, while 4XX error codes (like 400, 403, 404) are generated for 2.8% of API calls as opposed to 7% of HTML. Calls returning 5XXs codes (such as Internal Server Error, Bad Gateway, Service Unavailable) are almost nonexistent for APIs (less than 0.2% of calls) while are almost 2% of requests for HTML.

The relatively larger volume of unmitigated API requests can be explained by the automated nature of APIs, for example more API calls are generated in order to render a page that would require a single HTML request. Malicious or malformed requests are therefore diluted in a larger volume of calls generated by well-behaving automated systems.

Landscape of API Traffic

We can further analyse the frequency of specific error codes to get a sense of what the most frequent malformed (and possibly malicious) requests are. In the following figure, we plot the share of a particular error code when compared to all 4XXs.

Landscape of API Traffic

We can identify three groups of issues all equally likely (excluding the more obvious “404 Not Found” case): “400 Bad Request” (like malformed, invalid request), “429 Too Many Requests” (“Rate Limiting”), and the combination of Authentication and Authorization issues (“403 Forbidden” and “401 Unauthorized”). Those codes are followed by a long tail of other errors, including “422 Unprocessable Entity”, “409 Conflict”, and “402 Payment Required”.

This analysis confirms that the most common attacks rely on sending non-compliant requests, brute force efforts (24% of generated 4XXs are related to rate limiting), and accessing resources with invalid authentication or permission.

We can further analyse the reason why calls were blocked (especially relative to the 400s codes) by looking at what triggered the Cloudflare WAF. The OWASP and the Cloudflare Managed Ruleset are tools that scan incoming traffic looking for fingerprints of known vulnerabilities (such as SQLi, XSS, etc.) and they can provide context on what attack was detected.

A portion of the blocked traffic has triggered a managed rule for which we can identify the threat category. Although a malicious request can match multiple categories, the WAF assigns it to the first threat that is identified. User-Agent anomaly is the most common reason why traffic is blocked. This is usually triggered by the lack of or by a malformed User-Agent header, capturing requests that do not provide enough credible information on what type of client has sent the request. The next most common threat is cross-site scripting. After these two categories, there is a long tail of other anomalies that were identified.

Landscape of API Traffic

Conclusions

More than one out of two requests we process is an API call, and industries such as Banking, Retail and Financial Services are leading in terms of adoption and growth.

Furthermore, API calls are growing twice as fast as HTML traffic, making it an ideal candidate for new security solutions aimed at protecting customer data.

Maximum redirects, minimum effort: Announcing Bulk Redirects

Post Syndicated from Sam Marsh original https://blog.cloudflare.com/maximum-redirects-minimum-effort-announcing-bulk-redirects/

Maximum redirects, minimum effort: Announcing Bulk Redirects

404: Not Found

Maximum redirects, minimum effort: Announcing Bulk Redirects

The Internet is a dynamic place. Websites are constantly changing as technologies and business practices evolve. What was front-page news is quickly moved into a sub-directory. To ensure website visitors continue to see the correct webpage even if it has been moved, administrators often implement URL redirects.

A URL redirect is a mapping from one location on the Internet to another, effectively telling the visitor’s browser that the location of the page has changed, and where they can now find it. This is achieved by providing a virtual ‘link’ between the content’s original and new location.

URL Redirects have typically been implemented as Page Rules within Cloudflare, up to a maximum of 125 URL redirects per zone. This limitation meant customers with a need for more URL redirects had to implement alternative solutions such Cloudflare Workers to achieve their goals.

To simplify the management and implementation of URL redirects at scale we have created Bulk Redirects. Bulk Redirects is a new product that allows an administrator to upload and enable hundreds of thousands of URL redirects within minutes, without having to write a single line of code.

We’ve moved!

Mail forwarding is a product offered by postal services such as USPS and Royal Mail that allows you to continue to receive letters and parcels even if they are sent to an address where you no longer reside.

The postal services achieve this by effectively maintaining a register of your new location and your old location. This allows the systems to detect ‘this letter is for Sam Marsh at address A, but he now lives at address B, therefore send the mail there’.

Maximum redirects, minimum effort: Announcing Bulk Redirects
Photo by Christian Lue on Unsplash

This problem can be solved by manually updating my bank, online shops, etc. and having them send the parcels and letters directly to my new address. However, that assumes I know of every person and business who has my address. And it also relies on those people to remember I moved address and make updates on their side. For example, Grandma Marsh might have forgotten about my new address — I’ve moved a lot — and she may send my birthday card to my old address. Or all those Christmas cards from people who I don’t speak with regularly. Those will go to my old address also.  To solve this, I can use mail forwarding to ensure I still receive my cards and other mail, even though I no longer live at that address.

URL redirects are the Internet equivalent of mail forwarding.

URL redirects are effectively a table with two columns; what traffic am I looking for, and where should I send that traffic to? This mapping allows an administrator to define “whenever visitors go to https://www.cloudflare.com/bots I want to redirect them to the new location https://www.cloudflare.com/pg-lp/bot-mitigation-fight-mode.

With this technology, our sales and marketing teams can use the vanity URL all across the Internet, safe in the knowledge that should the backend systems change they won’t need to go to all the places this URL has been posted and update it. Instead, the intermediary system that handles the URL redirects can be updated. One location. Not thousands.

Why use URL redirects?

URL redirects are used to solve a number of use cases. One such common use case is to use URL redirects to force all visitors to connect to the website over a secure HTTPS connection, instead of via plain HTTP, to improve security. It’s such a common use case we created a toggle in the Cloudflare dashboard, “Always use HTTPS”, which redirects all HTTP requests to HTTPS when enabled.

URL redirects are also used for vanity domains and hyperlinks. In these scenarios, URL redirects are deployed to provide a mapping of short, user-friendly URLs to long, server-friendly URLs.  Not only are shorter URLs more memorable, but they are better scoring from an SEO perspective. According to Backlinko, ‘Excessively long URLs may hurt a page’s search engine visibility. In fact, several industry studies have found that short URLs tend to have a slight edge in Google’s search results.’.

Maximum redirects, minimum effort: Announcing Bulk Redirects
Photo by Hal Gatewood on Unsplash

Another use case is where a company may have a local domain for each of their markets, which they want to redirect back to the main website, e.g., redirect www.example.fr and www.example.de to www.example.com/eu/fr and www.example.com/eu/de, respectively.

This also covers company acquisition, where a company is acquired and the acquiring company wants to redirect hyperlinks to the relevant pages on their own website, e.g., redirect www.example.com to www.companyB.com/portfolio/example.

Finally, one of the most common use cases for URL redirects is to maintain uptime during a website migration. As companies migrate their websites from one platform to another, or one domain to another, URL redirects ensure visitors continue to see the correct content. Without these URL redirects, hyperlinks in emails, blogs, marketing brochures, etc. would fail to load, potentially costing the business revenue in lost sales and brand damage. For example, www.example.com/products/golf/product-goes-here would redirect to the new website at products.example.com/golf/product-goes-here.

How are URL redirects implemented today?

Ensuring these URL redirects are executed correctly is often the job of the reverse proxy — a server which sits between the client and the origin whose job is, amongst many others, to re-route received traffic to the correct destination.

For example, when using NGINX, a popular web server, the administrator would have a line in the config similar to the one below to implement a URL redirect:

`rewrite ^/oldpage$ http://www.example.com/newpage permanent;`

Historically, these web servers were located physically within a company’s data center. Administrators then had full control over the URLs received, and could create the redirect rules as and when needed.

As the world rapidly migrates on-premise applications and solutions to the cloud, administrators can find themselves in a situation where they can no longer do what they previously could. Not being responsible for the origin has a number of benefits, but it also comes with drawbacks such as lack of ‘control’. Previously, an administrator could quickly add a few config lines to the web server in front of their ecommerce platform. Moving to an online hosted platform makes this much more difficult to do.

As such, administrators have moved to platforms like Cloudflare where functionality such as URL redirects can be implemented in the cloud without the need to have administrator access to the origin.

The first way to implement a URL Redirect in Cloudflare is via a Forwarding URL Page Rule. Users can create a Page Rule which matches on a specific URL and redirects matching traffic to another specific URL, along with a status code — either a permanent redirect (301) or a temporary redirect (302):

Maximum redirects, minimum effort: Announcing Bulk Redirects

Another method is to use Cloudflare Workers to implement URL redirects, either individually or as a map. For example, the code below is used to create a URL redirect map which runs when the Worker is invoked:

const redirectMap = new Map([
 ["/bulk1", "https://" + externalHostname + "/redirect2"],
 ["/bulk2", "https://" + externalHostname + "/redirect3"],
 ["/bulk3", "https://" + externalHostname + "/redirect4"],
 ["/bulk4", "https://google.com"],
])

This snippet is taken from the Cloudflare Workers examples library and can be used to scale beyond the 125 URL redirect limit of Page Rules. However, it does require the administrator to be comfortable working with code and correctly configuring their Cloudflare Workers.

Introducing: Bulk Redirects

Speaking with Cloudflare users about URL redirects and their experience with our product offerings, “Give me a product which lets me upload thousands of URL redirects to Cloudflare via a GUI” was a very common request. Customers we interviewed typically wanted a simple way to upload a list of ‘from,to,response code’ without having to write a single line of code. And that’s what we are announcing today.

Bulk Redirects is now available for all Cloudflare plans. It is an account/organization-level product capable of supporting hundreds of thousands of URL redirects, all configured via the dashboard without having to write a single line of code.

The system is implemented in two parts. The first part is the Bulk Redirect List. This is effectively the redirect map, or ‘edge dictionary’, where users can upload their URL redirects:

Maximum redirects, minimum effort: Announcing Bulk Redirects

Each URL redirect within the list contains three main elements. The first two elements are Source URL (the URL we are looking for) and Target URL (the URL we are going to redirect matching traffic to).

There is also the Status code. This is the ‘type’ of redirect. In addition to 301 (Moved Permanently) and 302 (Moved Temporarily) redirects, we have added support for the newer 307 (Temporary Redirect) and 308 (Permanent Redirect) redirect status codes.

We have added support for specifying destination ports within the Target URL field also, allowing URL redirects to non-standard ports, e.g., “Target URL: www.example.com:8443”.

If you have many URL redirects, you can upload them via a CSV file.

There are also four additional parameters available for each individual URL redirect.

Firstly, we have added two options to replace the ambiguity and confusion caused by the use of asterisks as wildcards. Take this source URL as an example: *.example.com/a/b. Would you expect www.example.com/a/b to match? How about example.com/a/b, or www.example.com/path*? Asterisks used as wildcards cause confusion and misunderstanding, and also increase the cost of implementation and maintenance from an engineering perspective. Therefore, we are not implementing them in Bulk Redirects.

Instead, we have added two discrete options: Include subdomains and Subpath matching. The Include subdomains option, once enabled, will match all subdomains to the left of the domain portion of the URL as well as the domain specified. For example, if there is a URL redirect with a source URL of example.com/a then traffic to b.example.com/a and c.b.example.com/a will also be redirected.

The Subpath matching option focuses on the opposite end of the URL. If this option is enabled, the redirect applies to the URL as well as all its subpaths. For example, if we have a URL redirect on www.example.com/foo with subpath matching enabled, we will match on that specific URL as well as all subpaths, e.g., www.example.com/foo/a, www.example.com/foo/a/, ` www.example.com/foo/a/b/c`, etc., but not www.example.com/foobar.

These options provide a tremendous amount of flexibility and granularity for each URL redirect. However, for most use cases only the source URL, target URL, and status code options will need to be set.

Secondly, we have added two options relating to retaining portions of the original HTTP request: Preserve path suffix and Preserve query string. If subpath matching is enabled, Preserve path suffix can be used to copy the URI path from the originally requested URL and add it to the destination URL. For example, if there is a URL redirect of Source URL: example.co.uk, Target URL: www.example.com/a, then requests to example.co.uk/target will be redirected to www.example.com/a/target with both options enabled. Preserve query string can be used independently of the other options, and carries forward the URI query from the originally requested URL to the new URL.

Lists by themselves do not provide any redirection, they are simply the ‘lookup table’. To enable them we need to reference them via a Bulk Redirect Rule.

The rules themselves are very simple. By default, the user experience is to provide a name for the rule, a description, and select the Bulk Redirect List that should be invoked.

Maximum redirects, minimum effort: Announcing Bulk Redirects

For users who require more granularity and control there are additional settings available under the Advanced options toggle. Within this section there are two editable sections:  Expression and Key.

Maximum redirects, minimum effort: Announcing Bulk Redirects

The first field, Expression, specifies the conditions that must be met in order for the rule to run. By default, all URL redirects of the specified list will apply.

The second field, Key, is closely related to the expression. The key is used in combination with the specified list to select the URL redirect to apply. The field used for the key should always be the same as the field used in the expression, i.e., the key should be http.request.full_uri if the field in the expression is http.request.full_uri, or conversely, the key should be raw.http.request.full_uri if the field in the expression is raw.http.request.full_uri.

There are two main use cases for modifying these settings. Firstly, users can edit these options to increase specificity in the trigger, e.g., ip.src.country == "GB" and http.request.full_uri in $redirect_list. This is useful for ensuring Bulk Redirect Lists are only applied when a visitor comes from specific countries, subnets, or ASNs — or also only applying a URL redirect list if the visitor is a verified bot, or the bot score is >35.

Secondly, users can edit these options to amend the URL being matched and used as a lookup in the given list, i.e., the user may choose to have URL redirects in their list(s) specifically for URLs that would be normalized, e.g., URLs containing specific percent-encoding.  To ensure these URL redirects still trigger, the settings in Advanced options should be used to edit the expression and key to use the raw.http.request.full_uri field instead.

Automating via the API

Another way to manage bulk redirects is via our API. Customers wishing to automate the addition of bulk redirects can use the API to either simply add URL redirects to an existing list, or automate the entire workflow — creating a list, adding URL redirects to the list, and enabling the list via a new redirect rule.

There are three main calls when creating bulk redirects via the API:

  1. Create the redirect list
  2. Load with URL redirects
  3. Enable via a rule (You will also need to create the ruleset if doing this for the first time).

For step 1, first create a mass redirect list via the API call:

curl --location --request POST 'https://api.cloudflare.com/client/v4/accounts/<ACCOUNT_ID>/rules/lists' \
--header 'X-Auth-Email: <EMAIL_ADDRESS>' \
--header 'Content-Type: application/json' \
--header 'X-Auth-Key: <API_KEY>' \
--data-raw '{
 "name": "my_redirect_list_2",
 "description": "My redirect list 2",
 "kind": "redirect"
}'

The output will look similar to:

{
  "result": {
    "id": "499b94da726d4dbc9ce6bf6c96ef8b6a",
    "name": "my_redirect_list_2",
    "description": "My redirect list 2",
    "kind": "redirect",
    "num_items": 0,
    "num_referencing_filters": 0,
    "created_on": "2021-12-04T06:43:43Z",
    "modified_on": "2021-12-04T06:43:43Z"
  },
  "success": true,
  "errors": [],
  "messages": []
}

Capture the value of “id”, as this is the list id we will then add URL redirects to.

Next, in step 2 we will add URL redirects to our newly created list by executing a POST call to the id we captured previously – with our URL redirects in the body:

curl --location --request POST 'https://api.cloudflare.com/client/v4/accounts/<ACCOUNT_ID>/rules/lists/<LIST_ID>/items' \
--header 'X-Auth-Email: <EMAIL_ADDRESS>' \
--header 'Content-Type: application/json' \
--header 'X-Auth-Key: <API_KEY>' \
--data-raw '[
 {
   "redirect": {
     "source_url": "www.example.com/a",
     "target_url": "https://www.example.net/a"
   }
 },
 {
   "redirect": {
     "source_url": "www.example.com/b",
     "target_url": "https://www.example.net/a/b",
     "status_code": 307,
     "include_subdomains": true
   }
 },
 {
   "redirect": {
     "source_url": "www.example.com/c",
     "target_url": "www.example.net/c",
     "status_code": 307,
     "include_subdomains": true
   }   
 }
]'

The output will look similar to:

{
  "result": {
    "operation_id": "491ab6411acf4a12a6c72df1385b095a"
  },
  "success": true,
  "errors": [],
  "messages": []
}

In step 3 we enable this list by creating a new mass redirect rule within the mass redirect account-level ruleset.

Note, if this is the first time you are creating a redirect rule you will need to use a different API call to create the ruleset. See the documentation here for more details. All subsequent updates to the rulesets are made by calls similar to below.

Firstly, we need to find our account-level rulesets id. To do this we need to get a list of all account-level rulesets and look for the ruleset with the phase http_request_redirect:

curl --location --request GET 'https://api.cloudflare.com/client/v4/accounts/<ACCOUNT_ID>/rulesets \
--header 'X-Auth-Email: <EMAIL_ADDRESS>' \
--header 'Content-Type: application/json' \
--header 'X-Auth-Key: <API_KEY>'

The output will look similar to:

{
   "result": [
       {
           "id": "efb7b8c949ac4650a09736fc376e9aee",
           "name": "Cloudflare Managed Ruleset",
           "description": "Created by the Cloudflare security team, this ruleset is designed to provide fast and effective protection for all your applications. It is frequently updated to cover new vulnerabilities and reduce false positives.",
           "source": "firewall_managed",
           "kind": "managed",
           "version": "34",
           "last_updated": "2021-10-25T18:33:27.512161Z",
           "phase": "http_request_firewall_managed"
       },
       {
           "id": "4814384a9e5d4991b9815dcfc25d2f1f",
           "name": "Cloudflare OWASP Core Ruleset",
           "description": "Cloudflare's implementation of the Open Web Application Security Project (OWASP) ModSecurity Core Rule Set. We routinely monitor for updates from OWASP based on the latest version available from the official code repository",
           "source": "firewall_managed",
           "kind": "managed",
           "version": "33",
           "last_updated": "2021-10-25T18:33:29.023088Z",
           "phase": "http_request_firewall_managed"
       },
       {
           "id": "5ff4477e596448749d67da859230ac3d",
           "name": "My redirect ruleset",
           "description": "",
           "kind": "root",
           "version": "1",
           "last_updated": "2021-12-04T06:32:58.058744Z",
           "phase": "http_request_redirect"
       }
   ],
   "success": true,
   "errors": [],
   "messages": []
}

Our redirect ruleset is at the bottom of the output. Next we will add our new bulk redirect rule to this ruleset:

curl --location --request PUT 'https://api.cloudflare.com/client/v4/accounts/<ACCOUNT_ID>/rulesets/<RULESET_ID> \
--header 'X-Auth-Email: <EMAIL_ADDRESS>' \
--header 'Content-Type: application/json' \
--header 'X-Auth-Key: <API_KEY> \
--data-raw '{
     "rules": [
   {
     "expression": "http.request.full_uri in $my_redirect_list",
     "description": "Bulk Redirect rule 2",
     "action": "redirect",
     "action_parameters": {
       "from_list": {
         "name": "my_redirect_list_2",
         "key": "http.request.full_uri"
       }
     }
   }
 ]
}'

The output will look similar to:

{
  "result": {
    "id": "5ff4477e596448749d67da859230ac3d",
    "name": "My redirect ruleset",
    "description": "",
    "kind": "root",
    "version": "2",
    "rules": [
      {
        "id": "615cf6ac24c04f439138fdc16bd20535",
        "version": "1",
        "action": "redirect",
        "action_parameters": {
          "from_list": {
            "name": "my_redirect_list_2",
            "key": "http.request.full_uri"
          }
        },
        "expression": "http.request.full_uri in $my_redirect_list",
        "description": "Bulk Redirect rule 2",
        "last_updated": "2021-12-04T07:04:16.701379Z",
        "ref": "615cf6ac24c04f439138fdc16bd20535",
        "enabled": true
      }
    ],
    "last_updated": "2021-12-04T07:04:16.701379Z",
    "phase": "http_request_redirect"
  },
  "success": true,
  "errors": [],
  "messages": []
}

With those API calls executed, our new list is created, loaded with URL redirects and enabled by the bulk redirect rule. Visitors to the URLs specified in our list will now be redirected appropriately.

Account-level benefits

One of the driving forces behind this product is the desire to make life easier for those customers with a large number of zones on Cloudflare. For these customers, URL redirects are a pain point when using Page Rules, as they need to navigate into each zone and configure URL redirects one at a time. This doesn’t scale very well.

Bulk Redirects add real value for customers in this situation. Instead of having to navigate into 400 zones and create one or two Page Rules for each, an administrator can now create and upload a single Bulk Redirect List, which contains all the URL redirects for the zones under management.

This means that if the customer simply wants 399 of those 400 zones to redirect to the “primary zone”, they can create a bulk redirect list with 399 entries, all pointing to example.com, and enable the Subpath matching and Include subdomains options on each. This vastly simplifies the management of the estate.

The same premise also applies to SSL for SaaS customers. For example, if example.com has 20 custom hostnames in their zone, customers can now create a Bulk Redirect List and Rule for each custom hostname, grouping each customer’s URL redirects into their own logical buckets.

Bulk Redirects is a game changer for companies with a large number of zones and customers under management.

Allowances

Bulk Redirects are available for all accounts. The packaging model for Bulk Redirects closely resembles that of “IP Lists”. Accounts are entitled to a set number of Edge Rules (from which “Bulk Redirect Rules” draws down), Bulk Redirect Lists, and URL Redirects depending on the highest Cloudflare plan within their account.

Feature Enterprise Business Pro Free
Edge Rules (for use of Bulk Redirect Rules) 50+ 15 15 15
Bulk Redirect Lists 25+ 5 5 5
URL Redirects 10,000+ 500 500 20

For example, an account with ten zones, all on the Free plan, would be entitled to 15 Edge Rules, 5 Bulk Redirect Lists, and 20 URL Redirects that can be stored within those lists.

An account with one Pro zone and 2 Free plan zones would be entitled to 15 Edge Rules, 5 Bulk Redirect Lists, and 500 URL Redirects that can be stored within those lists.

Enterprise customers have a default of 10,000 URL Redirects to be used across 25 lists. However, these numbers are negotiable on enquiry.

Planned enhancements

We intend to make a number of incremental improvements to the product in the coming months, specifically to the list experience to allow for the editing of URL redirects and also for searching within lists.

In the near future we intend to bring to market a product to fulfill the other common request for URL redirects, and deliver ‘Dynamic URL Redirects’. Whilst Bulk Redirects supports hundreds of thousands of URL redirects, those URL redirects are relatively prescriptive — from a.com/b to b.com/a, for example.  There is still a requirement for supporting more complex, rich URL redirects, e.g., device-specific URL redirects, country-specific URL redirects, URL redirects that allow regular expressions in their target URL, and so forth. We aspire to offer a full range of functionality to support as many use cases as possible.

Try it now

Bulk Redirects can be used to improve operations, simplify complex configurations, and ease website management, amongst many other use cases.  Try out Bulk Redirects yourself today.

Advanced Zabbix API – 5 API use cases to improve your API workfows

Post Syndicated from Arturs Lontons original https://blog.zabbix.com/advanced-zabbix-api-5-api-use-cases-to-improve-your-api-workfows/16801/

As your monitoring infrastructures evolve, you might hit a point when there’s no avoiding using the Zabbix API. The Zabbix API can be used to automate a particular part of your day-to-day workflow, troubleshoot your monitoring or to simply analyze or get statistics about a specific set of entities.

In this blog post, we will take a look at some of the more advanced API methods and specific method parameters and learn how they can be used to improve your API workflows.

1. Count entities with CountOutput

Let’s start with gathering some statistics. Let’s say you have to count the number of some matching entities – here we can use the CountOutput parameter. For a more advanced use case – what if we have to count the number of events for some time period? Let’s combine countOutput with time_from and time_till (in unixtime) and get the number of events created for the month of November. Let’s get all of the events for the month of November that have the Disaster severity:

{
"jsonrpc": "2.0",
"method": "event.get",
"params": {
"output": "extend",
"time_from": "1635717600",
"time_till": "1638223200",
"severities": "5",
"countOutput": "true"
},
"auth": "xxxxxx",
"id": 1
}

2. Use API to perform Configuration export/import

Next, let’s take a look at how we can use the configuration.export method to export one of our templates in yaml:

{
"jsonrpc": "2.0",
"method": "configuration.export",
"params": {
"options": {
"templates": [
"10001"
]
},
"format": "yaml"
},
"auth": "xxxxxx",
"id": 1
}

Now let’s copy and paste the result of the export and import the template into another environment. It’s extremely important to remember that for this method to work exactly as we intend to, we need to include the parameters that specify the behavior of particular entities contained in the configuration string, such as items/value maps/templates, etc. For example, if I exclude the templates parameter here, no templates will be imported.

{
"jsonrpc": "2.0",
"method": "configuration.import",
"params": {
"format": "yaml",
"rules": {
"valueMaps": {
"createMissing": true,
"updateExisting": true
},
"items": {
"createMissing": true,
"updateExisting": true,
"deleteMissing": true
},
"templates": {
"createMissing": true,
"updateExisting": true
},

"templateLinkage": {
"createMissing": true
}
},
"source": "zabbix_export:\n version: '5.4'\n date: '2021-11-13T09:31:29Z'\n groups:\n -\n uuid: 846977d1dfed4968bc5f8bdb363285bc\n name: 'Templates/Operating systems'\n templates:\n -\n uuid: e2307c94f1744af7a8f1f458a67af424\n template: 'Linux by Zabbix agent active'\n name: 'Linux by Zabbix agent active'\n 
...
},
"auth": "xxxxxx",
"id": 1
}

3. Expand trigger functions and macros with expand parameters

Using trigger.get to obtain information about a particular set of triggers is a relatively common practice. One particular caveat that we have to consider is that by default macros in trigger name, expression or descriptions are not expanded. To expand the available macros we need to use the expand parameters:

{
"jsonrpc": "2.0",
"method": "trigger.get",
"params": {
"triggerids": "18135",
"output": "extend",
"expandExpression":"1",
"selectFunctions": "extend"
},
"auth": "xxxxxx",
"id": 1
}

4. Obtaining additional LLD information for a discovered item

If we wish to display additional LLD information for a discovered entity, in this case – an item, we can use the selectDiscoveryRule and selectItemDiscovery parameters.
While selectDiscoveryRule will provide the ID of the LLD rule that created the item, selectItemDiscovery can point us at the parent item prototype id from which the item was created, last discovery time, item prototype key, and more.

The example below will return the item details and will also provide the LLD rule and Item prototype IDs, the time when the lost item will be deleted and the last time the item was discovered:

{
"jsonrpc": "2.0",
"method": "item.get",
"params": {
"itemids":"36717",
"selectDiscoveryRule":"1",
"selectItemDiscovery":["lastcheck","ts_delete","parent_itemid"]
}, "auth":"xxxxxx",
"id": 1
}

5. Searching through the matched entities with search parameters

Zabbix API provides a couple of standard parameters for performing a search. With search parameter, we can search string or text fields and try to find objects based on a single or multiple entries. searchByAny parameter is capable of extending the search – if you set this as true, we will search by ANY of the criteria in the search array, instead of trying to find an entity that matches ALL of them (default behavior).

The following API call will find items that match agent and Zabbix keys on a particular template:

{
"jsonrpc": "2.0",
"method": "item.get",
"params": {
"output": "extend",
"templateids": "10001",
"search": {
"key_": ["agent.","zabbix"]
},
"searchByAny":"true",
"sortfield": "name"
},
"auth": "xxxxxx",
"id": 1
}

Feel free to take the above examples, change them around so they fit your use case and you should be able to quite easily implement them in your environment. There are many other use cases that we might potentially cover down the line – if you have a specific API use case that you wish for us to cover, feel free to leave a comment under this post and we just might cover it in one of the upcoming blog posts!

Simplifying Zabbix API workflows with named Zabbix API tokens

Post Syndicated from Arturs Lontons original https://blog.zabbix.com/simplifying-zabbix-api-workflows-with-named-zabbix-api-tokens/16653/

Zabbix API enables you to collect any and all information from your Zabbix instance by using a multitude of API methods. You can even utilize Zabbix API calls in your HTTP items. For example, this can be used to monitor the number of particular sets of metrics and visualize their growth over time. With named Zabbix API tokens, such use cases are a lot more simple to implement.

Before Zabbix 5.4 we had to perform the user.login API call to obtain the authentication token. Once the user session was closed, we had to relog, obtain the new authentication token and use it in the subsequent API calls.

With the pre-defined named Zabbix API tokens, you don’t have to constantly check if the authentication token needs to be updated. Starting from Zabbix 5.4 you can simply create a new named Zabbix API token with an expiration date and use it in your API calls.

Creating a new named Zabbix API token

The Zabbix API token creation process is extremely simple. All you have to do is navigate to Administration – General – API tokens and create a new API token. The named API tokens are created for a particular user and can have an optional expiration date and time – otherwise, the tokens are defined without an expiry date.

You can create a named API token in the API tokens section, under Administration – General

Once the Token has been created, make sure to store it somewhere safe, since you won’t be able to recover it afterward. If the token is lost – you will have to recreate it.

Make sure to store the auth token!

Don’t forget, that when defining a role for the particular API user, we can restrict which API methods this user has access to.

Simplifying API tasks with the named API token

There are many different use cases where you could implement Zabbix API calls to collect some additional information. For this blog post, I will create an HTTP item that uses item.get API call to monitor the number of unsupported items.

To achieve that, I will create an HTTP item on a host (This can be the default Zabbix server host or a host dedicated to collecting metrics via Zabbix API calls) and provide the API call in the request body. Since the named API token now provides a static authentication token until it expires, I can simply use it in my API call without the need to constantly keep it updated.

An HTTP agent item that uses a Zabbix API call in its request body

{
    "jsonrpc": "2.0",
    "method": "item.get",
    "params": {
			"countOutput":"1",
			 "filter": {
 "state": "1"
 }
    },
    "id": 2,
    "auth": "b72be8cf163438aacc5afa40a112155e307c3548ae63bd97b87ff4e98b1f7657"
}

HTTP item request body, which returns a count of unsupported items

I will also use regular expression preprocessing to obtain the numeric value from the API call result – otherwise, we won’t be able to graph our value or calculate trends for it.

Regular expression preprocessing step to obtain a numeric value from our Zabbix API call result

Utilizing Zabbix API scripts in Actions

In one of our previous blog posts, we covered resolving problems automatically with the event.acknowledge API method. The logic defined in the blog post was quite complex since we needed to keep an eye out for the authentication tokens and use a custom script to keep them up to date. With named Zabbix API tokens, this use case is a lot more simple.

All I have to do is create an Action operation script containing my API call and pass it to an action operation.

Action operation script that invokes Zabbix event.acknowledge API method

curl -sk -X POST -H "Content-Type: application/json" -d "
{
\"jsonrpc\": \"2.0\",
\"method\": \"event.acknowledge\",
\"params\": {
\"eventids\": \"{EVENT.ID}\",
\"action\": 1,
\"message\": \"Problem resolved.\"
},
\"auth\": \"<Place your authentication token here>",
\"id\": 2
}" <Place your Zabbix API endpoint URL here>

Problem remediation script example

Now my problems will get closed automatically after the time period which I have defined in my action.

Action operation which runs our event.acknowledge Zabbix API script

These are but a few examples that we can now achieve by using API tokens. A lot of information can be obtained and filtered in a unique way via Zabbix API, thus providing you with a granular analysis of your monitored environment. If you have recently upgraded to Zabbix 5.4 or plan to upgrade to Zabbix 6.0 LTS in the future, I would recommend implementing named Zabbix API tokens to simplify your day-to-day workflow and consider the possibilities that this new feature opens up for you.

If you have any questions or if you wish to share your particular use case for data collection or task automation with Zabbix API – feel free to share them in the comments section below!

Practical API Design at Netflix, Part 2: Protobuf FieldMask for Mutation Operations

Post Syndicated from Netflix Technology Blog original https://netflixtechblog.com/practical-api-design-at-netflix-part-2-protobuf-fieldmask-for-mutation-operations-2e75e1d230e4

By Ricky Gardiner, Alex Borysov

Background

In our previous post, we discussed how we utilize FieldMask as a solution when designing our APIs so that consumers can request the data they need when fetched via gRPC. In this blog post we will continue to cover how Netflix Studio Engineering uses FieldMask for mutation operations such as update and remove.

Example: Netflix Studio Production

Money Heist (La casa de papel) / Netflix

Previously we outlined what a Production is and how the Production Service makes gRPC calls to other microservices such as the Schedule Service and Script Service to retrieve schedules and scripts (aka screenplay) for a particular production such as La Casa De Papel. We can take that model and showcase how we can mutate particular fields on a production.

Mutating Production Details

Let’s say we want to update the format field from LIVE_ACTION to HYBRID as our production has added some animated elements. A naive way for us to solve this is to add an updateProductionFormatRequest method and gRPC endpoint just to update the productionFormat:

This allows us to update the production format for a particular production but what if we then want to update other fields such as titleor even multiple fields such as productionFormat, schedule, etc? Building on top of this we could just implement an update method for every field: one for Production format, another for title and so on:

This can become unmanageable when maintaining our APIs due to the number of fields on the Production. What if we want to update more than one field and do it atomically in a single RPC? Creating additional methods for various combinations of fields will lead to an explosion of mutation APIs. This solution is not scalable.

Instead of trying to create every single combination possible, another solution could be to have an UpdateProduction endpoint that requires all fields from the consumer:

The issue with this solution is two-fold as the consumer must know and provide every single required field in a Production even if they just want to update one field such as the format. The other issue is that since a Production has many fields the request payload can become quite large particularly if the production has schedule or scripts information.

What if, instead of all the fields, we send only the fields we actually want to update, and leave all other fields unset? In our example, we would only set the production format field (and ID to reference the production):

This could work if we never need to remove or blank out any fields. But what if we want to remove the value of the title field? Again, we can introduce one-off methods like RemoveProductionTitle, but as discussed above, this solution does not scale well. What if we want to remove a value of a nested field such as the planned launch date field from the schedule? We would end up adding remove RPCs for every individual nullable sub-field.

Utilizing FieldMask for Mutations

Instead of numerous RPCs or requiring a large payload, we can utilize a FieldMask for all our mutations. The FieldMask will list all of the fields we would like to explicitly update. First, let’s update our proto file to add in the UpdateProductionRequest, which will contain the data we want to update from a production, and a FieldMask of what should be updated:

Now, we can use a FieldMask to make mutations. We can update the format by creating a FieldMask for the format field by using the FieldMaskUtil.fromStringList() utility method which constructs a FieldMask for a list of field paths in a certain type. In this case, we will have one type, but will build upon this example later:

Since our FieldMask only specifies the format field that will be the only field that is updated even if we provide more data in ProductionUpdateOperation. It becomes easier to add or remove more fields to our FieldMask by modifying the paths. Data that is provided in the payload but not added in a path of a FieldMask will not be updated and simply ignored in the operation. But, if we omit a value it will perform a remove mutation on that field. Let’s modify our example above to showcase this and update the format but remove the planned launch date, which is a nested field on the ProductionSchedule as “schedule.planned_launch_date”:

In this example, we are performing both update and remove mutations as we have added “format” and “schedule.planned_launch_date” paths to our FieldMask. When we provide this in our payload these fields will be updated to the new values, but when building our payload we are only providing the format and omitting the schedule.planned_launch_date. Omitting this from the payload but having it defined in our FieldMask will function as a remove mutation:

Empty / Missing Field Mask

When a field mask is unset or has no paths, the update operation applies to all the payload fields. This means the caller must send the whole payload or, as mentioned above, any unset fields will be removed.

This convention has an implication on schema evolution: when a new field is added to the message, all the consumers must start sending its value on the update operation or it will get removed.

Suppose we want to add a new field: production budget. We will extend both the Production message, and ProductionUpdateOperation:

If there is a consumer that doesn’t know about this new field or hasn’t updated client stubs yet, it can accidentally null the budget field out by not sending the FieldMask in the update request.

To avoid this issue, the producer should consider requiring the field mask for all the update operations. Another option would be to implement a versioning protocol: force all callers to send their version numbers and implement custom logic to skip fields not present in the old version.

Bella Ciao

In this blog post series, we have gone over how we use FieldMask at Netflix and how it can be a practical and scalable solution when designing your APIs.

API designers should aim for simplicity, but make their APIs open for extension and evolution. It’s often not easy to keep APIs simple and future-proof. Utilizing FieldMask in APIs helps us achieve both simplicity and flexibility.


Practical API Design at Netflix, Part 2: Protobuf FieldMask for Mutation Operations was originally published in Netflix TechBlog on Medium, where people are continuing the conversation by highlighting and responding to this story.