Aruba Central is a SaaS solution that allows you to manage your Enterprise Aruba network environment. Due to the increasing number of cloud migrations, we can expect that more and more Aruba customers will move their on-premise environment to it, which will also mean a change in their monitoring environment. In this article, I will show you how to switch to API- based monitoring using Aruba Central and Zabbix. All custom resources mentioned can be found in my repository.
Aruba Central’s API
Oauth 2.0 is used, so you can forget the simple token management. At the end it is great, but for monitoring purposes it is overkill. There is pretty good documentation (referred to later) regarding how you can generate your access token, but after two hours it expires so you need to continually refresh it. To do this, you must use a refresh token, which can help you to get a new access token AND a new refresh token.
Within two hours, use the latest refresh token to repeat this action again. At this point you can imagine that this is not something you can implement easily by using the Zabbix GUI only. Well, maybe with some javascript magic, but otherwise there is no native support for this logic at this point of time. So how can we do this? In short:
Generate your client credentials
Generate your first token
Schedule the token refresh for every two hours
Update your host macro via Zabbix API
Use the token in Zabbix HTTP agent checks
Monitor your environment based on JSONPath pre-processing
Initial steps within Aruba Central
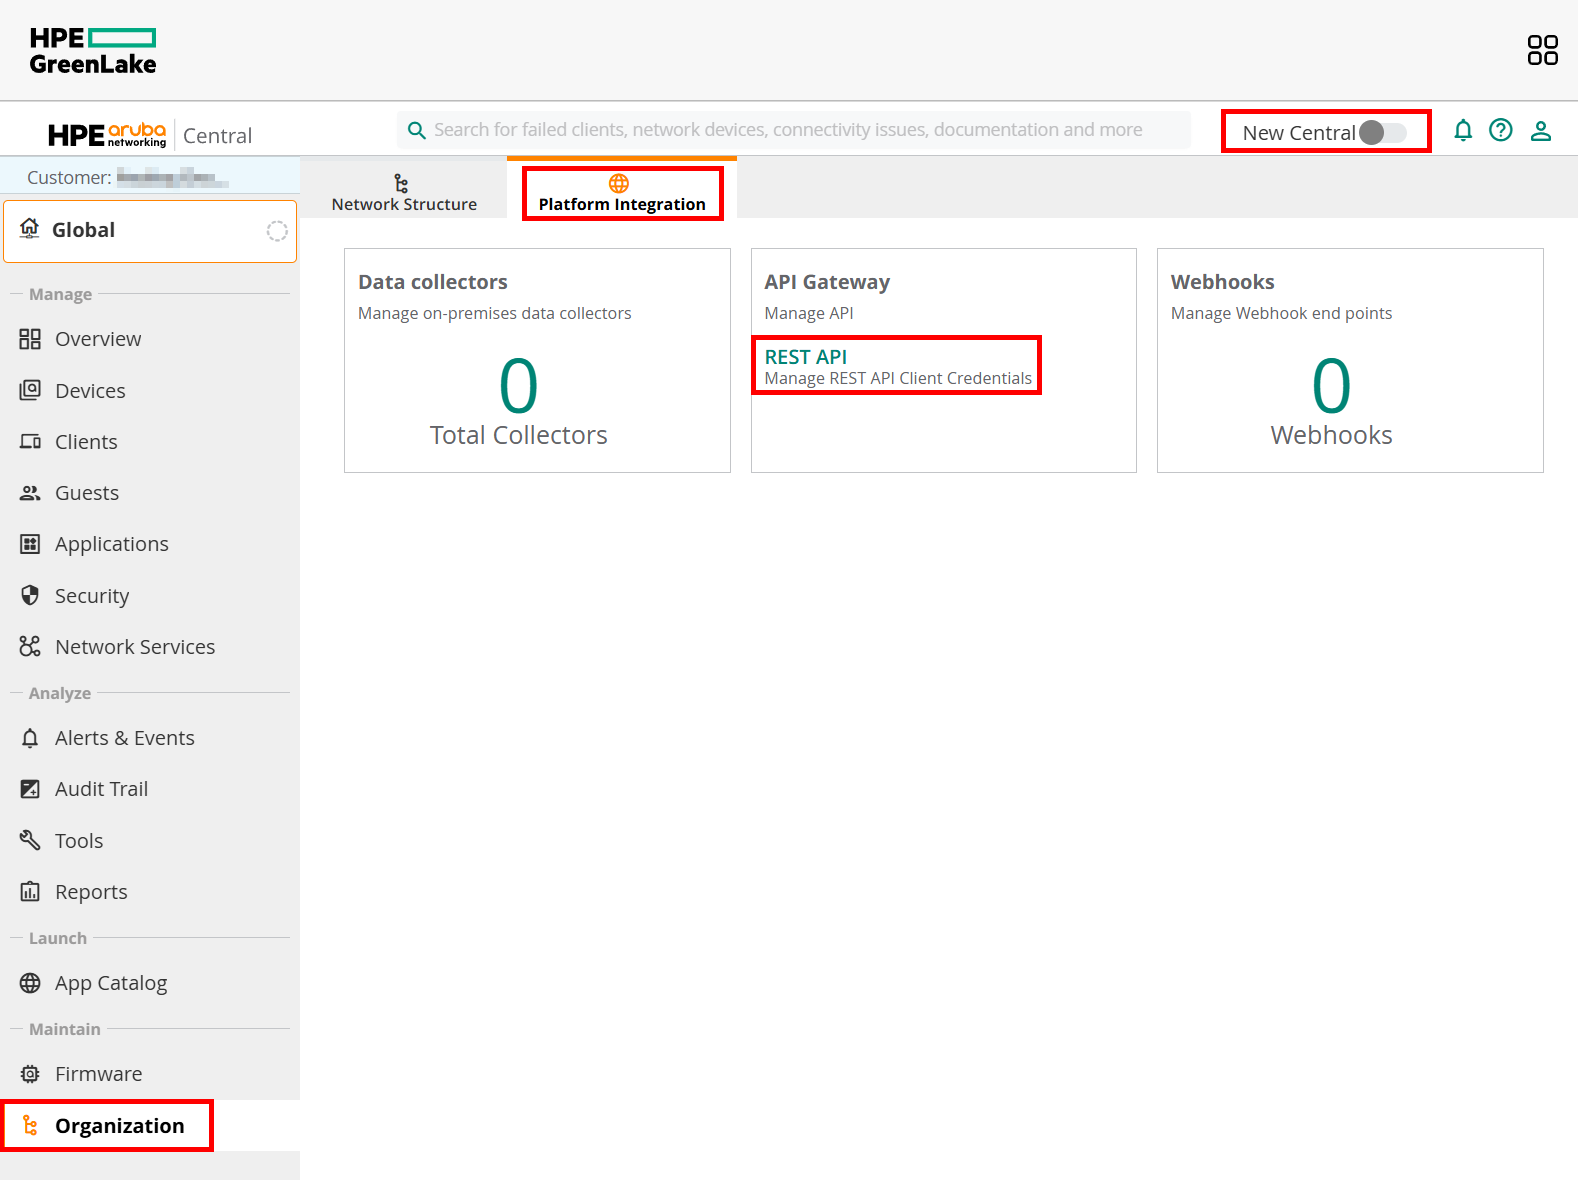
To manage your API access, you need to launch your “HPE Aruba Networking Central” application, so do NOT look into your workspace modules – the “Personal API clients” menu is NOT what we are looking for. Turn off the “New Central” view – at this point the early access version is not so useful (hopefully it will change soon).
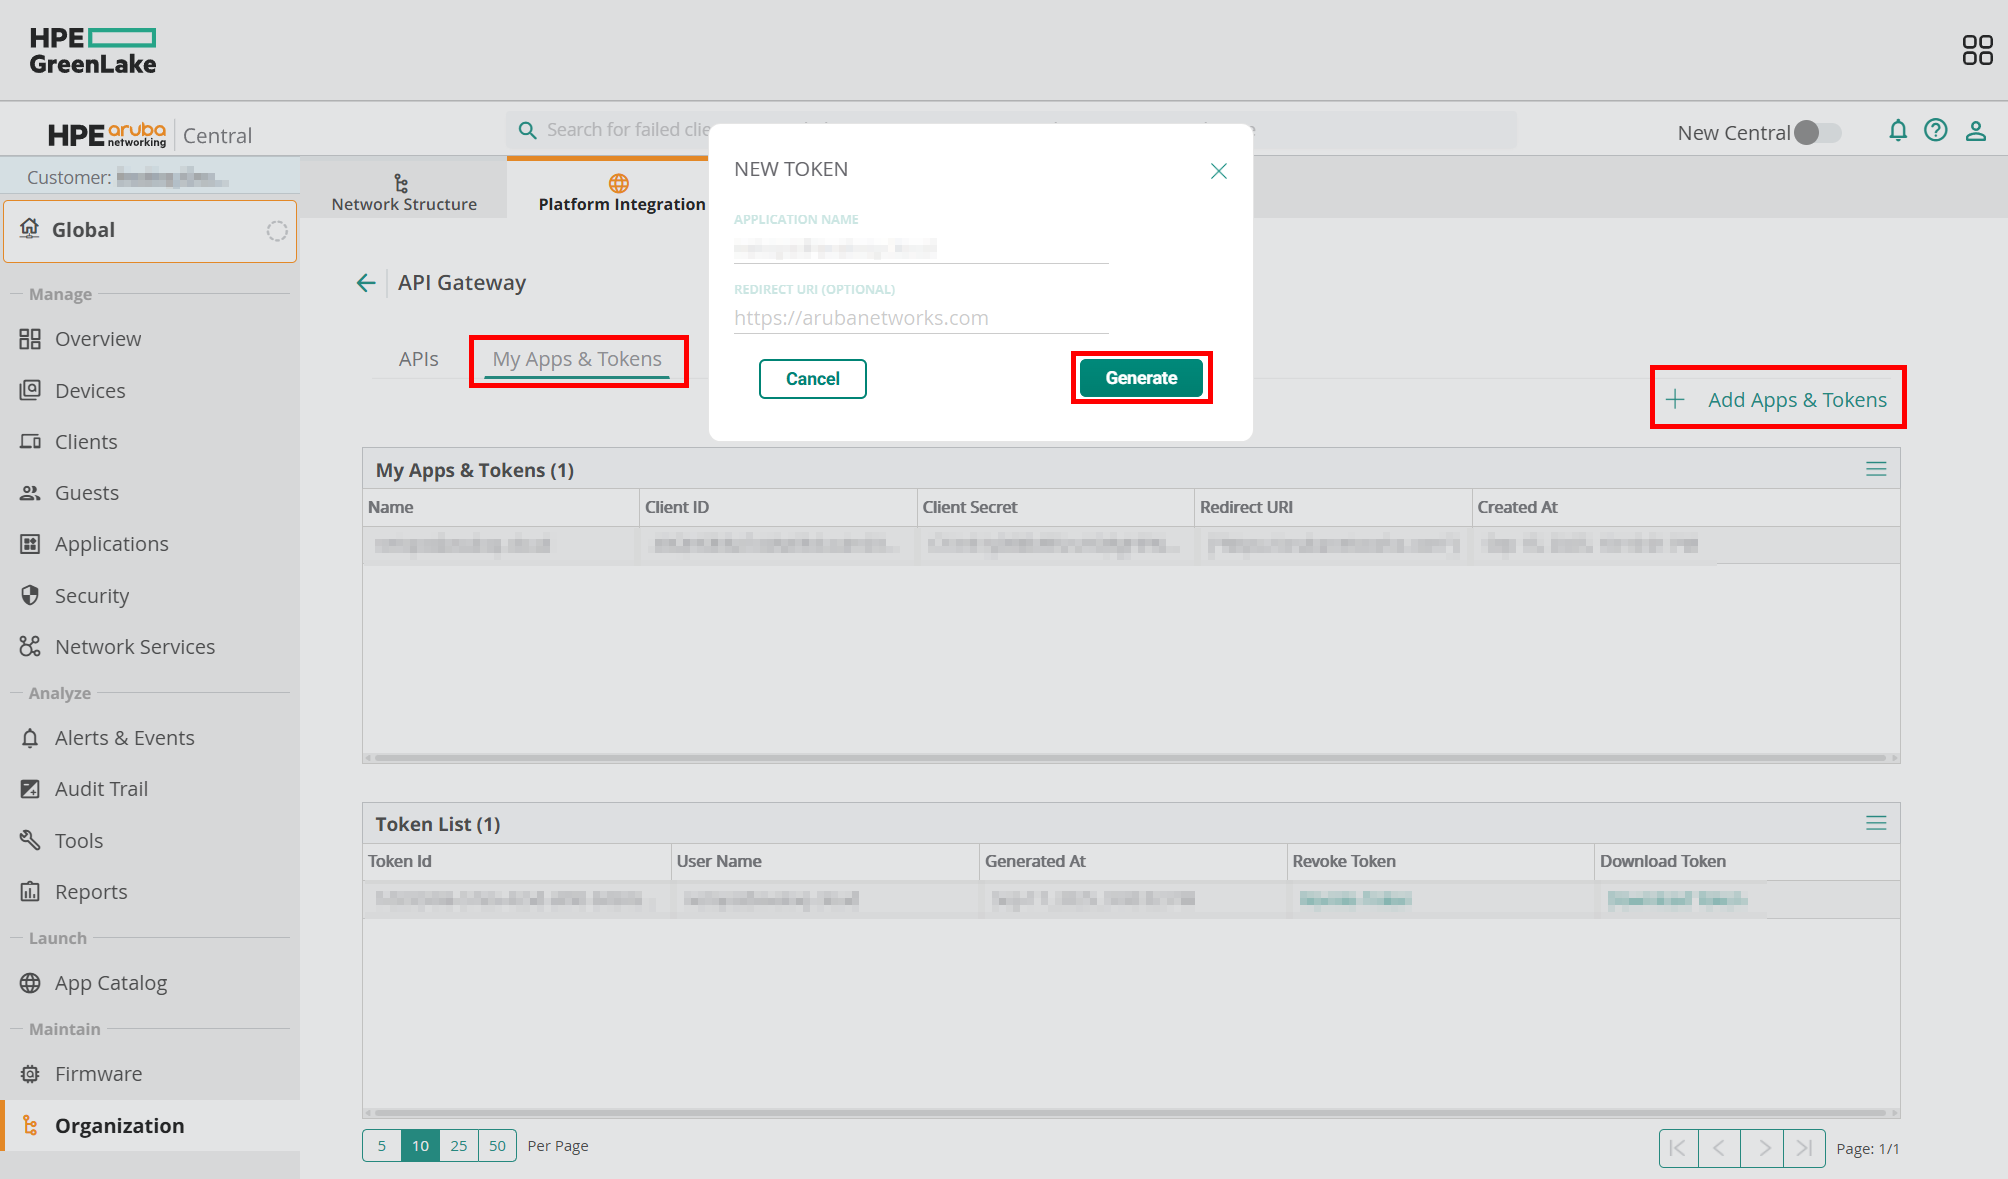
The first time you get there, you will not see any items, but under the “My Apps & Tokens” tab you can click the “Add Apps & Tokens” button and generate it. Technically, this is already enough to start to monitoring your network infrastructure, but within two hours it would stop. So the relevant data for us are the “Client ID” and “Client Secret.” Feel free to revoke the recently created token at the bottom area as we do not need it.
Record your credentials
For this article, I am using a simple file to store all the credentials, which will be sourced into a bash script. Please keep in mind that storing your sensitive credentials in a single file is a BAD practice! Your SECO/CISO would probably have a few words with you about it, so please consider a better approach. A more secure way would be to use some Key Vault solution (like Azure, AWS, Google, or Hashicorp). Anyway, let’s continue with this unsecure example:
#!/bin/bash

### ZABBIX VARS ###

# URL of your zabbix instance (assuming you do not use the "/zabbix" ending, if yes, then add it to the end)
zabbix_url="https://your.zabbix.instance.net"
# Your Zabbix API token. If you do not know how to get it, check the documentation.
zabbix_api_token="1234_your_zabbix_api_key_5678"
# Create a host with a macro, remain at the "Macros" tab, turn on debug mode, look for "[hostmacroid] =>"
zabbix_macro_id="12345"

### ARUBA VARS ###
# To find yours, go here and check "Table: Domain URLs for API Gateway Access"
base_url="YOUR_ARUBA_CENTRAL_BASE_URL"
# Click on your profile in the Central app and you will find it there: 32 char long hexa string
client_id="YOUR_CLIENT_ID"
# provided in the previous step
client_secret="YOUR_CLIENT_ID"
# provided in the previous step
customer_id="YOUR_CUSTOMER_ID"
# your login credential
account_username="YOUR_CENTRAL_LOGIN_USERNAME"
# your login credential
account_password="YOUR_CENTRAL_LOGIN_PASSWORD"
# to be populated later
csrftoken=""
session=""
auth_code=""
Get or refresh your token and update the Zabbix host macro
The next steps are based on the official Aruba documentation, which you can find here. Please remember that there are many ways to achieve our target – this is just one example and probably not the most optimal one. Feel free to change / improve it with your code in your preferred scripting language.
The below script assumes that the file containing the credentials (previous step) is named as “variables” and located in the folder named “central.”
Filename: aruba_central_token_new.sh
Purpose: To be used for first time token generation. Later, you only have to refresh your token with the script after this one.
Remarks: Aruba is limiting this API query set, so you can run it only ONCE every 30 minutes! If you made a typo somewhere, wait 30 minutes before your next attempt or tweak the result files.
Purpose: To refresh your existing token. It is expecting an existing refresh token in the “token_refresh.latest” file, so better to run the previous script one time before this.
Remarks: You can run this script as many times you want, but it will result in new tokens only once per every two hours (when the current one expires). Therefore, refreshing too frequently is pointless.
In my case, both the scripts and variables files are in the same “central” folder, which is in a git repository. Each time I call one of the scripts, it will record the new tokens in files, which are committed and pushed to the repo. In my own implementation, this is how I call the refresh script and sync the result with my repo:
You must run your refresh script at least once per every two hours. To make this happen you have many options, including:
cron (old-school, outdated way)
systemctl timer (a better way, but only if it is monitored)
Jenkins / Github Actions/etc.
Zabbix itself, by calling your bash script
In my case, Jenkins does the scheduling and execution and the job is monitored via Zabbix.
Monitor your network infrastructure
When everything is in place, then the monitoring part is pretty simple. The usual JSONPath based logic can be used. API call documentation can be found here. The template contains only the wireless components, since I do not have my switches in Central. Implementing the switching part should not be difficult – just have a look at the “Switch” section, then clone and adjust one of your “get” items.
Screenshots
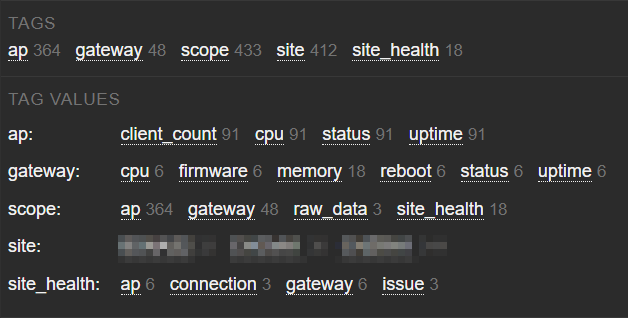
Latest data – tag based filtering:
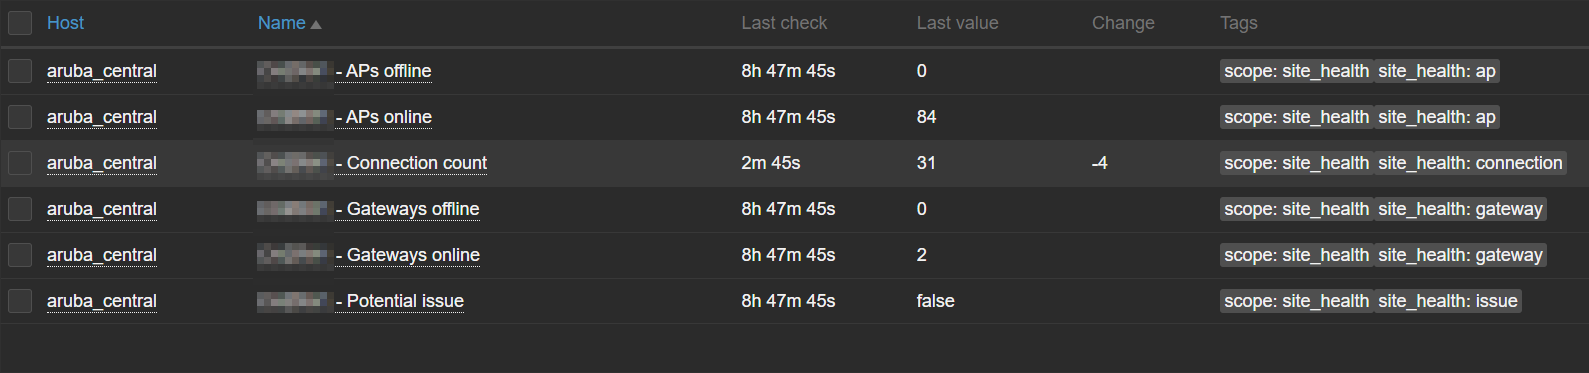
Latest data – Site health
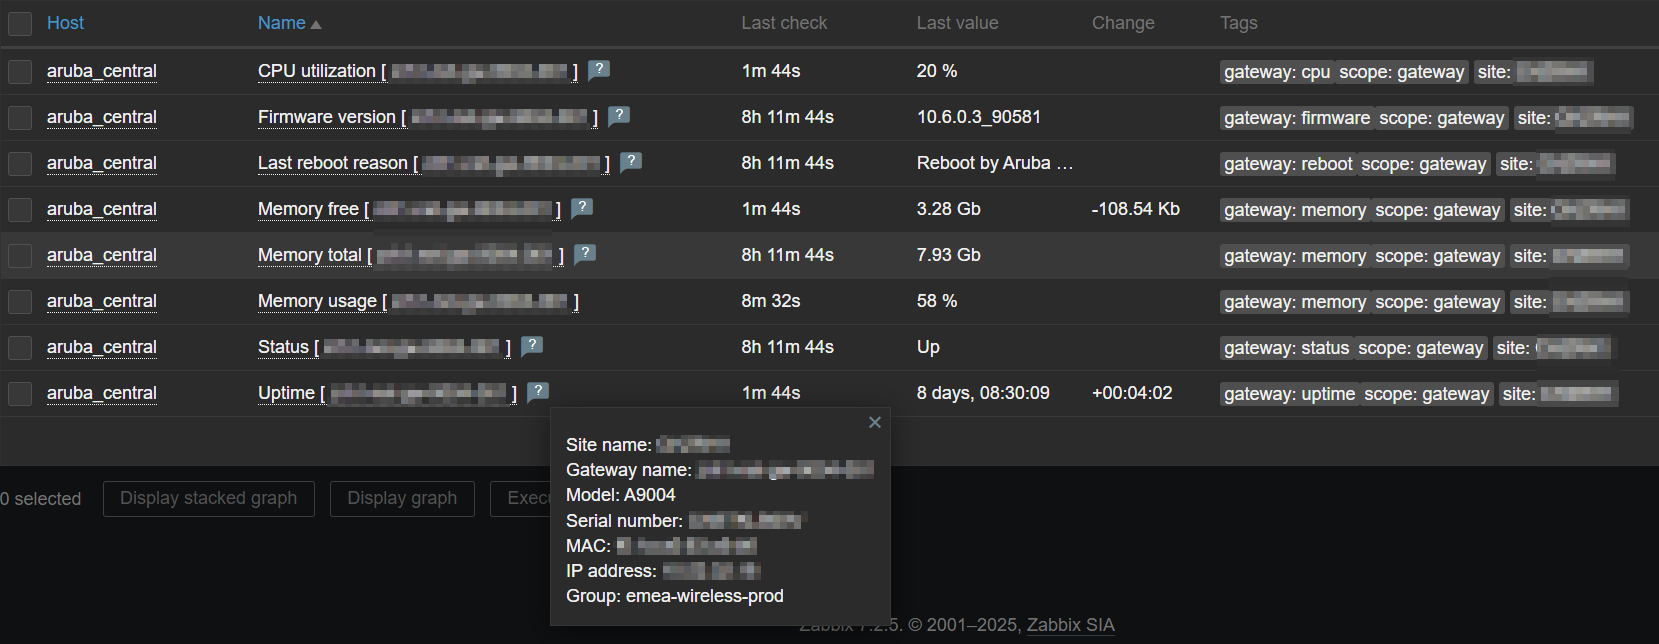
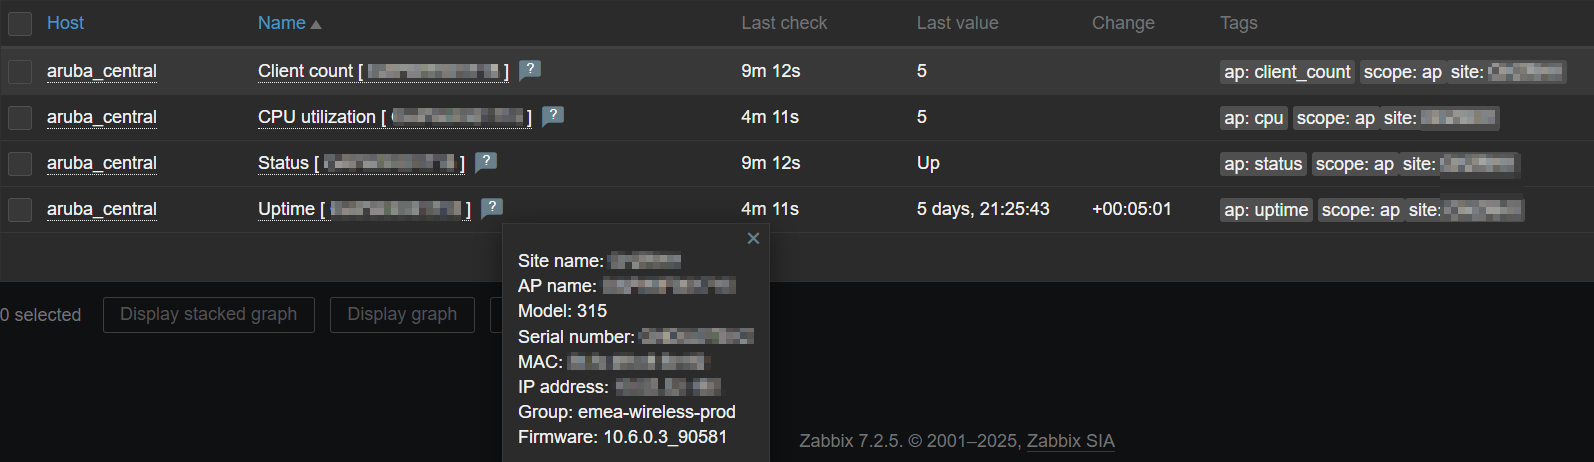
Latest data – Gateway info
Latest data – AP info
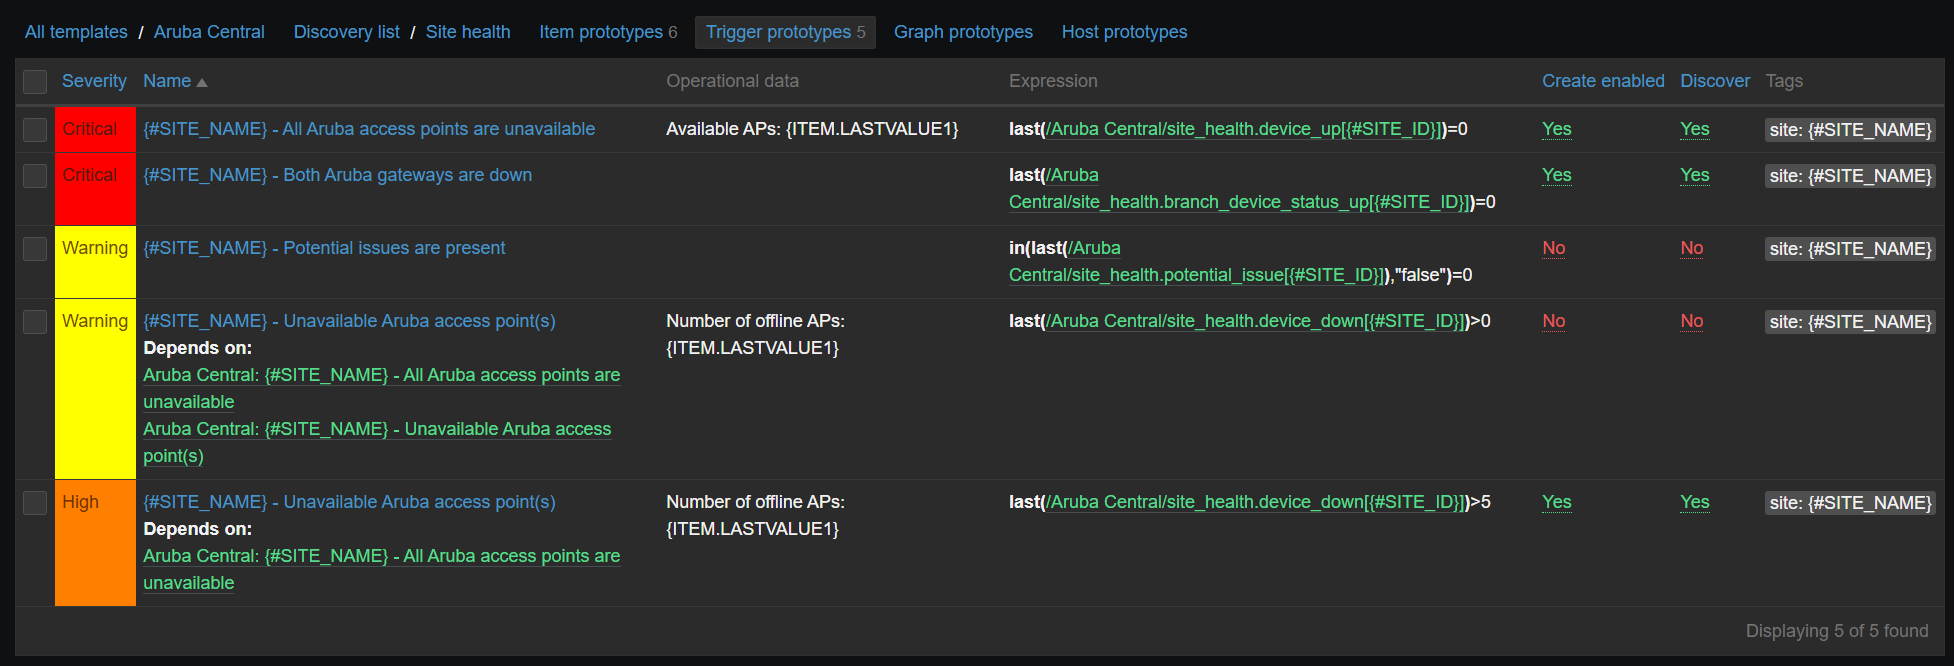
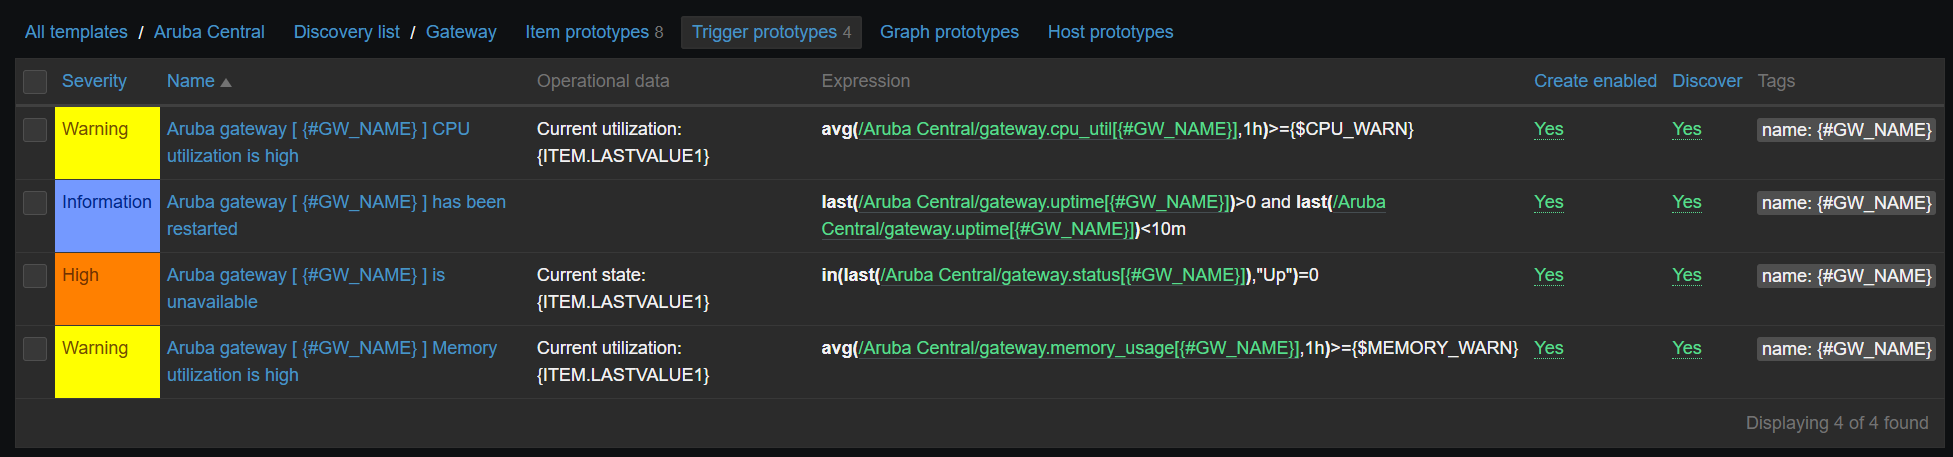
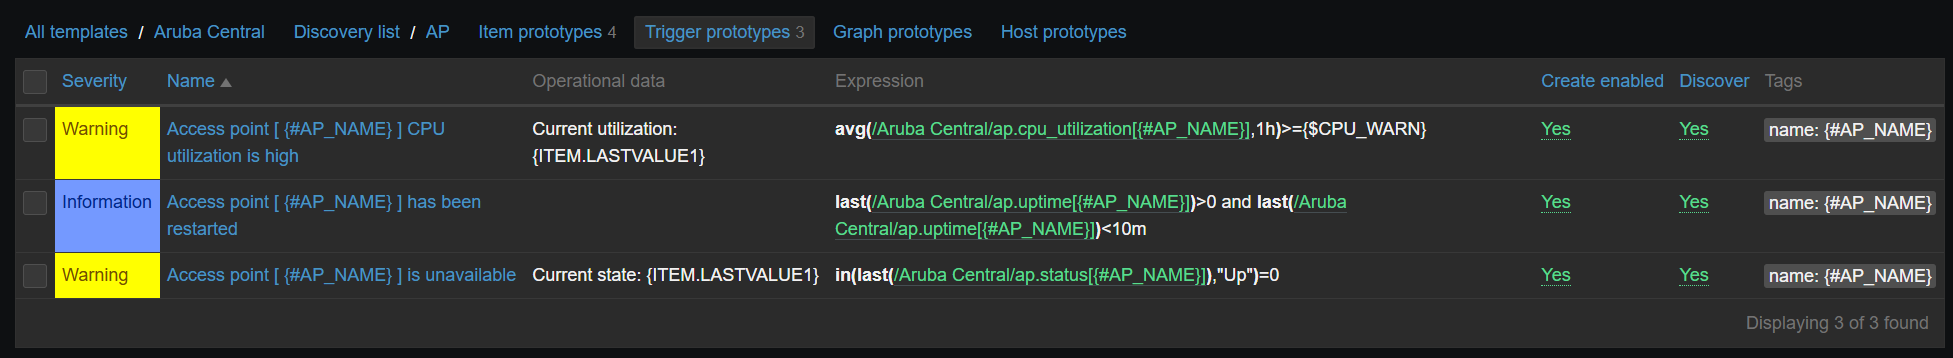
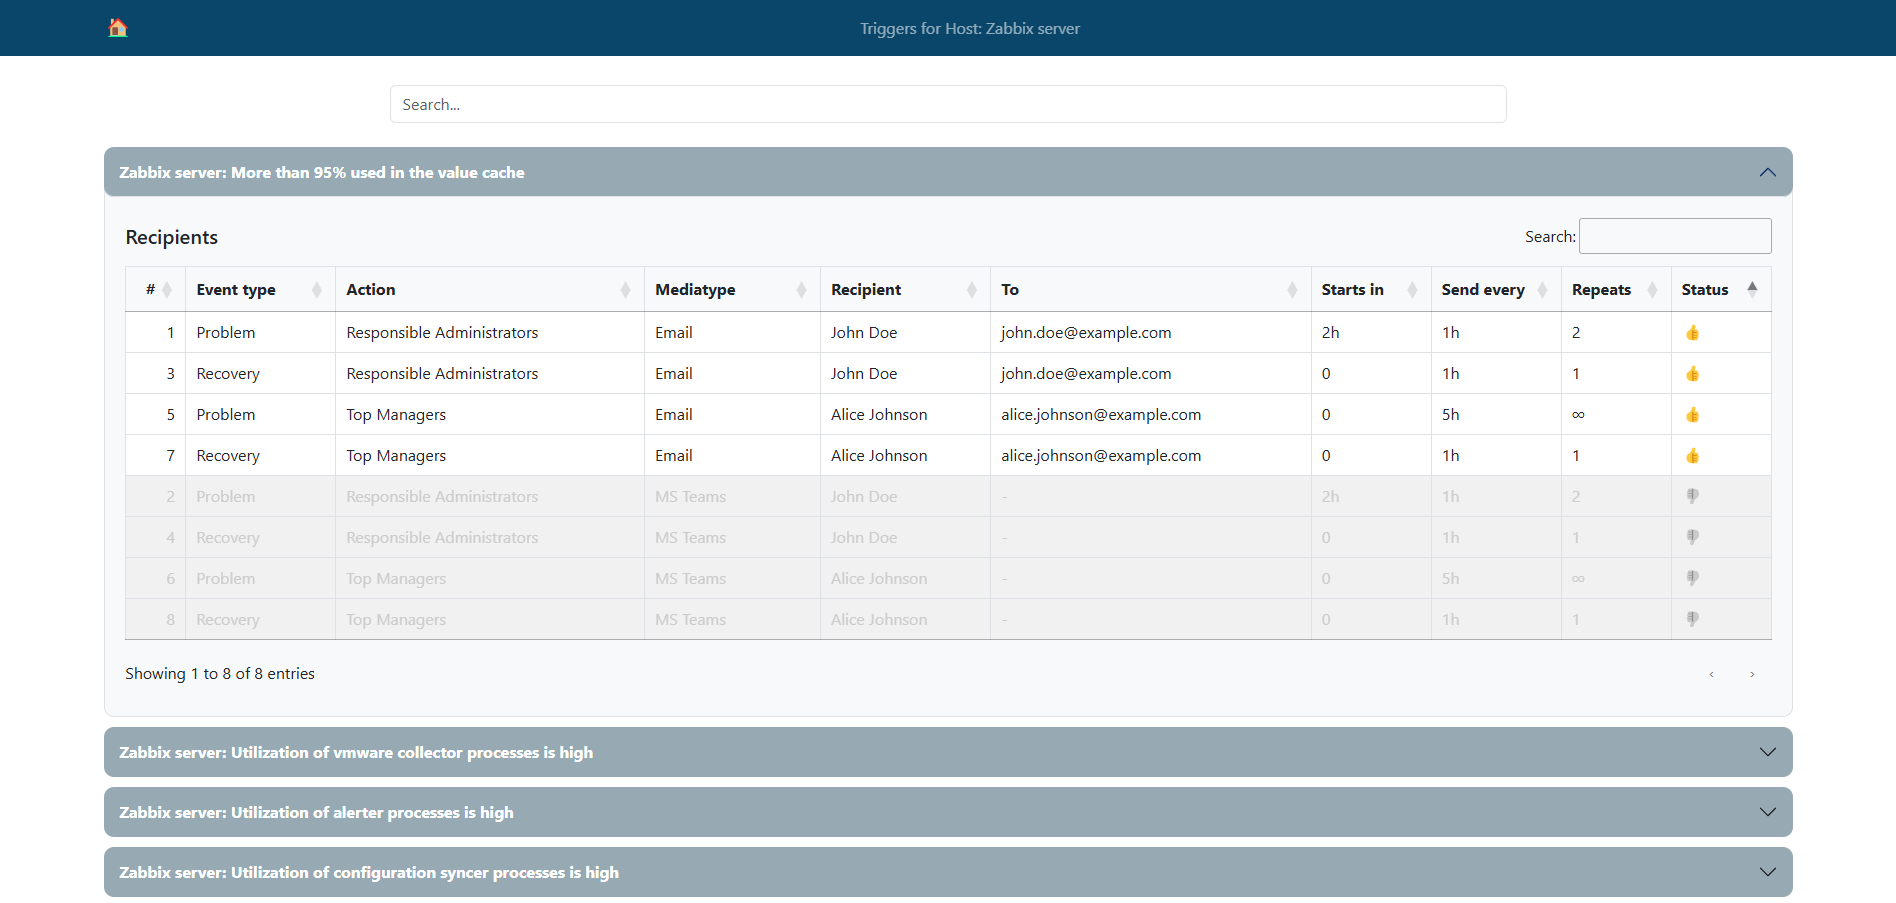
Triggers:
Some triggers are intentionally disabled, because they are a bit redundant. However, I wanted to cover all options. Sometimes less alerting is better if you have a ticketing system integration, otherwise your monitoring system will turn into a ticket factory.
Known issues and limitations
Since we are not querying the devices directly, some delay can be expected. Based on my recent testing, the delay compared to real time is between 3-10 minutes. In my test I disconnected my test environment and then started to do manual updates frequently. Some items got the real state earlier, some only later.
If your refresh script will malfunction for whatever reason (normally it should not), then you may have to run the other script once to generate a new token, or you can go to the GUI and check the last refresh token, with which you can override the content of the “token_refresh.latest” file.
Aruba is limiting the number of API queries to 5,000 per day. This could seem annoying, but it is way more than what you need (you should expect less than 1,000 in normal conditions, depending on your update frequency).
Zabbix API will not authorize your call unless you insert a line into your apache vhost configuration. This is a more generic Zabbix API issue that is not related to Aruba Central.
If Aruba Central has a maintenance activity, then the token refreshing way could break. Running the token request script once should address the issue.
Summary
Aruba Central’s API is pretty decent, but if you start from zero it could take a while to get to the end of it. With this guide, my intention was to speed you up, but please do not consider my scripts and the shown example as the only or best possible way – I’m just hoping it can give you a good base for your own solution. Have fun!
When a customer wants to bring IP address space to Cloudflare, they’ve always had to reach out to their account team to put in a request. This request would then be sent to various Cloudflare engineering teams such as addressing and network engineering — and then the team responsible for the particular service they wanted to use the prefix with (e.g., CDN, Magic Transit, Spectrum, Egress). In addition, they had to work with their own legal teams and potentially another organization if they did not have primary ownership of an IP prefix in order to get a Letter of Agency (LOA) issued through hoops of approvals. This process is complex, manual, and time-consuming for all parties involved — sometimes taking up to 4–6 weeks depending on various approvals.
Well, no longer! Today, we are pleased to announce the launch of our self-serve BYOIP API, which enables our customers to onboard and set up their BYOIP prefixes themselves.
With self-serve, we handle the bureaucracy for you. We have automated this process using the gold standard for routing security — the Resource Public Key Infrastructure, RPKI. All the while, we continue to ensure the best quality of service by generating LOAs on our customers’ behalf, based on the security guarantees of our new ownership validation process. This ensures that customer routes continue to be accepted in every corner of the Internet.
Cloudflare takes the security and stability of the whole Internet very seriously. RPKI is a cryptographically-strong authorization mechanism and is, we believe, substantially more reliable than common practice which relies upon human review of scanned documents. However, deployment and availability of some RPKI-signed artifacts like the AS Path Authorisation (ASPA) object remains limited, and for that reason we are limiting the initial scope of self-serve onboarding to BYOIP prefixes originated from Cloudflare’s autonomous system number (ASN) AS 13335. By doing this, we only need to rely on the publication of Route Origin Authorisation (ROA) objects, which are widely available. This approach has the advantage of being safe for the Internet and also meeting the needs of most of our BYOIP customers.
Today, we take a major step forward in offering customers a more comprehensive IP address management (IPAM) platform. With the recent update to enable multiple services on a single BYOIP prefix and this latest advancement to enable self-serve onboarding via our API, we hope customers feel empowered to take control of their IPs on our network.
A quick refresher: Bring-your-own-IP is named for exactly what it does – it allows customers to bring their own IP space to Cloudflare. Customers choose BYOIP for a number of reasons, but the main reasons are control and configurability. An IP prefix is a range or block of IP addresses. Routers create a table of reachable prefixes, known as a routing table, to ensure that packets are delivered correctly across the Internet. When a customer’s Cloudflare services are configured to use the customer’s own addresses, onboarded to Cloudflare as BYOIP, a packet with a corresponding destination address will be routed across the Internet to Cloudflare’s global edge network, where it will be received and processed. BYOIP can be used with our Layer 7 services, Spectrum, or Magic Transit.
A look under the hood: How it works
Today’s world of prefix validation
Let’s take a step back and take a look at the state of the BYOIP world right now. Let’s say a customer has authority over a range of IP addresses, and they’d like to bring them to Cloudflare. We require customers to provide us with a Letter of Authorization (LOA) and have an Internet Routing Registry (IRR) record matching their prefix and ASN. Once we have this, we require manual review by a Cloudflare engineer. There are a few issues with this process:
Insecure: The LOA is just a document—a piece of paper. The security of this method rests entirely on the diligence of the engineer reviewing the document. If the review is not able to detect that a document is fraudulent or inaccurate, it is possible for a prefix or ASN to be hijacked.
Time-consuming: Generating a single LOA is not always sufficient. If you are leasing IP space, we will ask you to provide documentation confirming that relationship as well, so that we can see a clear chain of authorisation from the original assignment or allocation of addresses to you. Getting all the paper documents to verify this chain of ownership, combined with having to wait for manual review can result in weeks of waiting to deploy a prefix!
Automating trust: How Cloudflare verifies your BYOIP prefix ownership in minutes
Moving to a self-serve model allowed us to rethink the manner in which we conduct prefix ownership checks. We asked ourselves: How can we quickly, securely, and automatically prove you are authorized to use your IP prefix and intend to route it through Cloudflare?
We ended up killing two birds with one stone, thanks to our two-step process involving the creation of an RPKI ROA (verification of intent) and modification of IRR or rDNS records (verification of ownership). Self-serve unlocks the ability to not only onboard prefixes more quickly and without human intervention, but also exercises more rigorous ownership checks than a simple scanned document ever could. While not 100% foolproof, it is a significant improvement in the way we verify ownership.
Tapping into the authorities
Regional Internet Registries (RIRs) are the organizations responsible for distributing and managing Internet number resources like IP addresses. They are composed of 5 different entities operating in different regions of the world (RIRs). Originally allocated address space from the Internet Assigned Numbers Authority (IANA), they in turn assign and allocate that IP space to Local Internet Registries (LIRs) like ISPs.
This process is based on RIR policies which generally look at things like legal documentation, existing database/registry records, technical contacts, and BGP information. End-users can obtain addresses from an LIR, or in some cases through an RIR directly. As IPv4 addresses have become more scarce, brokerage services have been launched to allow addresses to be leased for fixed periods from their original assignees.
The Internet Routing Registry (IRR) is a separate system that focuses on routing rather than address assignment. Many organisations operate IRR instances and allow routing information to be published, including all five RIRs. While most IRR instances impose few barriers to the publication of routing data, those that are operated by RIRs are capable of linking the ability to publish routing information with the organisations to which the corresponding addresses have been assigned. We believe that being able to modify an IRR record protected in this way provides a good signal that a user has the rights to use a prefix.
Example of a route object containing validation token (using the documentation-only address 192.0.2.0/24):
For those that don’t want to go through the process of IRR-based validation, reverse DNS (rDNS) is provided as another secure method of verification. To manage rDNS for a prefix — whether it’s creating a PTR record or a security TXT record — you must be granted permission by the entity that allocated the IP block in the first place (usually your ISP or the RIR).
This permission is demonstrated in one of two ways:
Directly through the IP owner’s authenticated customer portal (ISP/RIR).
By the IP owner delegating authority to your third-party DNS provider via an NS record for your reverse zone.
Example of a reverse domain lookup using dig command (using the documentation-only address 192.0.2.0/24):
So how exactly is one supposed to modify these records? That’s where the validation token comes into play. Once you choose either the IRR or Reverse DNS method, we provide a unique, single-use validation token. You must add this token to the content of the relevant record, either in the IRR or in the DNS. Our system then looks for the presence of the token as evidence that the request is being made by someone with authorization to make the requested modification. If the token is found, verification is complete and your ownership is confirmed!
The digital passport 🛂
Ownership is only half the battle; we also need to confirm your intention that you authorize Cloudflare to advertise your prefix. For this, we rely on the gold standard for routing security: the Resource Private Key Infrastructure (RPKI), and in particular Route Origin Authorization (ROA) objects.
A ROA is a cryptographically-signed document that specifies which Autonomous System Number (ASN) is authorized to originate your IP prefix. You can think of a ROA as the digital equivalent of a certified, signed, and notarised contract from the owner of the prefix.
Relying parties can validate the signatures in a ROA using the RPKI.You simply create a ROA that specifies Cloudflare’s ASN (AS13335) as an authorized originator and arrange for it to be signed. Many of our customers used hosted RPKI systems available through RIR portals for this. When our systems detect this signed authorization, your routing intention is instantly confirmed.
Many other companies that support BYOIP require a complex workflow involving creating self-signed certificates and manually modifying RDAP (Registration Data Access Protocol) records—a heavy administrative lift. By embracing a choice of IRR object modification and Reverse DNS TXT records, combined with RPKI, we offer a verification process that is much more familiar and straightforward for existing network operators.
The global reach guarantee
While the new self-serve flow ditches the need for the “dinosaur relic” that is the LOA, many network operators around the world still rely on it as part of the process of accepting prefixes from other networks.
To help ensure your prefix is accepted by adjacent networks globally, Cloudflare automatically generates a document on your behalf to be distributed in place of a LOA. This document provides information about the checks that we have carried out to confirm that we are authorised to originate the customer prefix, and confirms the presence of valid ROAs to authorise our origination of it. In this way we are able to support the workflows of network operators we connect to who rely upon LOAs, without our customers having the burden of generating them.
Staying away from black holes
One concern in designing the Self-Serve API is the trade-off between giving customers flexibility while implementing the necessary safeguards so that an IP prefix is never advertised without a matching service binding. If this were to happen, Cloudflare would be advertising a prefix with no idea on what to do with the traffic when we receive it! We call this “blackholing” traffic. To handle this, we introduced the requirement of a default service binding — i.e. a service binding that spans the entire range of the IP prefix onboarded.
A customer can later layer different service bindings on top of their default service binding via multiple service bindings, like putting CDN on top of a default Spectrum service binding. This way, a prefix can never be advertised without a service binding and blackhole our customers’ traffic.
Getting started
Check out our developer docs on the most up-to-date documentation on how to onboard, advertise, and add services to your IP prefixes via our API. Remember that onboardings can be complex, and don’t hesitate to ask questions or reach out to our professional services team if you’d like us to do it for you.
The future of network control
The ability to script and integrate BYOIP management into existing workflows is a game-changer for modern network operations, and we’re only just getting started. In the months ahead, look for self-serve BYOIP in the dashboard, as well as self-serve BYOIP offboarding to give customers even more control.
Cloudflare’s self-serve BYOIP API onboarding empowers customers with unprecedented control and flexibility over their IP assets. This move to automate onboarding empowers a stronger security posture, moving away from manually-reviewed PDFs and driving RPKI adoption. By using these API calls, organizations can automate complex network tasks, streamline migrations, and build more resilient and agile network infrastructures.
Lab9 Pro is the B2B division of Lab9, Belgium’s leading Apple Premium Partner. With over 30 years of experience, Lab9 Pro specializes in integrating and supporting Apple systems within businesses, educational institutions, and public organizations. Beyond Apple expertise, Lab9 Pro also designs, implements, and maintains complete IT infrastructures, including networks, servers, storage, and security solutions.
The challenge
It’s impossible to manage devices at organizations without the use of a good MDM (Mobile Device Management) system such as Jamf. As the leading provider of Apple device management solutions, Jamf empowers organizations to deploy, manage, and secure Apple devices at scale.
Even in smaller organizations Jamf is the right solution, as small and medium-sized enterprises (SMEs) often lack the resources to manage their MDM systems. Offering an MSP model solves a lot of problems for these customers.
For Apple device management, the typical customer has a few certificates issued by Apple, which require approval of the user agreement by the Apple business or school manager. Without getting too technical about Apple Device management, depending on the customer the certificates need to be renewed on different dates. If the user agreement is not approved, automated device enrollment will stop working.
Lab9 Pro found themselves needing to check all certificates and user agreements for MSP customers manually, which involved an unacceptably high error rate that often caused discontinuity of the MDM system.
The solution
Lab9 Pro were already using Zabbix to monitor customer environments and their own infrastructure, including storage, firewalls, switches, and more. Because Zabbix offers a wide variety of options that make it possible to monitor almost anything, it was only logical to explore whether Zabbix could also be used to monitor the MDM certificates.
The research phase
Step one was to check the availability of certificate information. Unfortunately, Apple Business Manager’s API did not help much, as it does not provide certificate details. Instead, the team at Lab9 Pro investigated the Jamf API.
Although it doesn’t directly return certificate information either, they found something even more useful – Jamf’s API provides customer instance notifications. These include alerts when certificates (VPP, PUSH, DEP, etc.) are about to expire (typically 10 days in advance) as well as when the Device Enrollment Program (user agreement) is not approved.
Zabbix implementation
Since Lab9 Pro manages multiple MSP tenants, they created a dedicated Zabbix template. This template includes both pre-filled and empty macros:
Pre-filled macros:
• {$JAMF.AUTH.INTERVAL}: Interval for retrieving the bearer token
• {$JAMF.NOTIF.INTERVAL}: Interval for retrieving Jamf notifications
• {$JAMF.PATH.AUTH}: API path for retrieving the bearer token
• {$JAMF.PATH.NOTIFICATIONS}: API path for retrieving Jamf notifications
Empty macros:
• {$JAMF.URL}: Jamf URL
• {$JAMF.API.USER}: Jamf user account for authentication
• {$JAMF.API.PASSWORD}: Jamf password (stored as a secret value)
The team configured an item to perform an API call to retrieve the bearer token. A preprocessing rule in JavaScript stores this token in a variable. Discovery rules proved very useful for executing API calls to retrieve Jamf notifications using the bearer token. This was achieved by configuring preprocessing steps and Low-Level Discovery (LLD) macros to pass the Jamf URL and bearer token. Trigger prototypes for each certificate were also added within the same discovery rule.
The results
Whenever a certificate is nearing expiration, a problem is automatically displayed on Lab9 Pro’s Zabbix dashboard, which is visible on TV screens placed throughout their office in order to make sure the entire team is aware of upcoming certificate renewals.
Since Lab9 Pro began monitoring MDM certificates through the Jamf API, they have experienced zero expired certificates, which in turn has allowed them to avoid situations where devices become unmanaged and require a full setup again.
Zabbix makes it possible for Lab9 Pro to keep their clients’ MDM systems operational, while allowing them to either proactively inform them when certificates need to be renewed or handle the renewal process on their behalf.
The Internet is constantly changing in ways that are difficult to see. How do we measure its health, spot new threats, and track the adoption of new technologies? When we launched Cloudflare Radar in 2020, our goal was to illuminate the Internet’s patterns, helping anyone understand what was happening from a security, performance, and usage perspective, based on aggregated data from Cloudflare services. From the start, Internet measurement, transparency, and resilience has been at the core of our mission.
The launch blog post noted, “There are three key components that we’re launching today: Radar Internet Insights, Radar Domain Insights and Radar IP Insights.” These components have remained at the core of Radar, and they have been continuously expanded and complemented by other data sets and capabilities to support that mission. By shining a brighter light on Internet security, routing, traffic disruptions, protocol adoption, DNS, and now AI, Cloudflare Radar has become an increasingly comprehensive source of information and insights. And despite our expanding scope, we’ve focused on maintaining Radar’s “easy access” by evolving our information architecture, making our search capabilities more powerful, and building everything on top of a powerful, publicly-accessible API.
Now more than ever, Internet observability matters. New protocols and use cases compete with new security threats. Connectivity is threatened not only by errant construction equipment, but also by governments practicing targeted content blocking. Cloudflare Radar is uniquely positioned to provide actionable visibility into these trends, threats, and events with local, network, and global level insights, spanning multiple data sets. Below, we explore some highlights of Radar’s evolution over the five years since its launch, looking at how Cloudflare Radar is building one of the industry’s most comprehensive views of what is happening on the Internet.
Making Internet security more transparent
The Cloudflare Research team takes a practical approach to research, tackling projects that have the potential to make a big impact. A number of these projects have been in the security space, and for three of them, we’ve collaborated to bring associated data sets to Radar, highlighting the impact of these projects.
The 2025 launch of the Certificate Transparency (CT) section on Radar was the culmination of several months of collaborative work to expand visibility into key metrics for the Certificate Transparency ecosystem, enabling us to deprecate the original Merkle Town CT dashboard, which was launched in 2018. Digital certificates are the foundation of trust on the modern Internet, and Certificate Authorities (CAs) serve as trusted gatekeepers, issuing those certificates, with CT logs providing a public, auditable record of every certificate issued, making it possible to detect fraudulent or mis-issued certificates. The information available in the new CT section allows users to explore information about these certificates and CAs, as well as about the CT logs that capture information about every issued certificate.
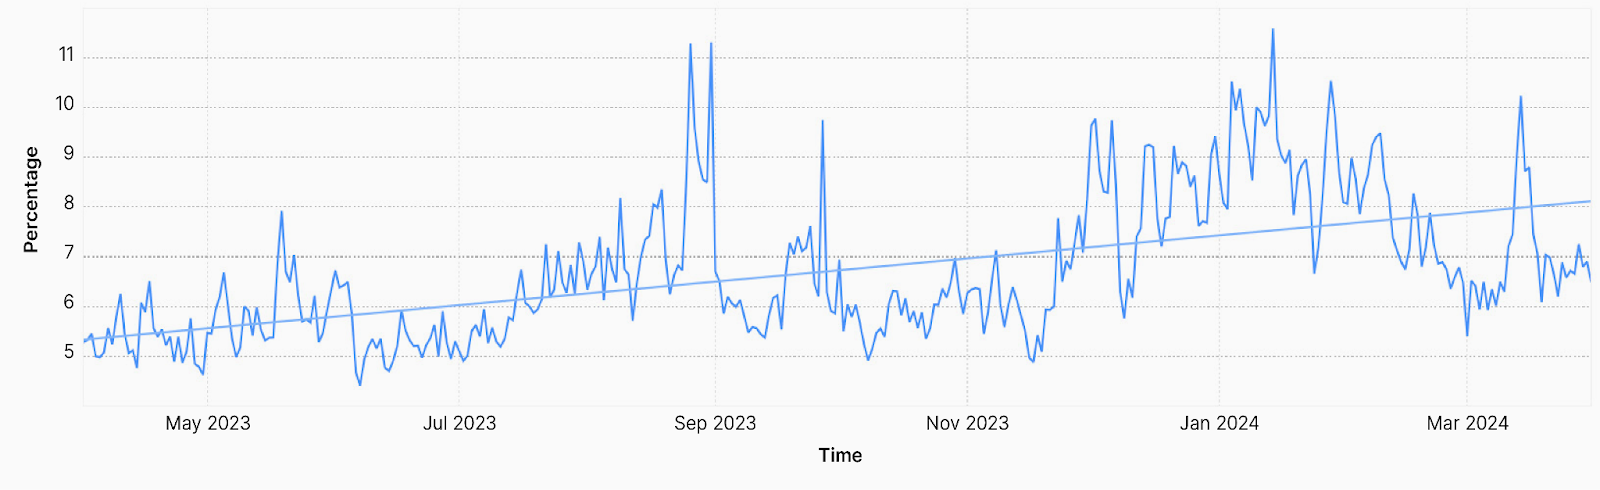
In 2024, members of Cloudflare’s Research team collaborated with outside researchers to publish a paper titled “Global, Passive Detection of Connection Tampering”. Among the findings presented in the paper, it noted that globally, about 20% of all connections to Cloudflare close unexpectedly before any useful data exchange occurs. This unexpected closure is consistent with connection tampering by a third party, which may occur, for instance, when repressive governments seek to block access to websites or applications. Working with the Research team, we added visibility into TCP resets and timeouts to the Network Layer Security page on Radar. This graph, such as the example below for Turkmenistan, provides a perspective on potential connection tampering activity globally, and at a country level. Changes and trends visible in this graph can be used to corroborate reports of content blocking and other local restrictions on Internet connectivity.
The research team has been working on post-quantum encryption since 2017, racing improvements in quantum computing to help ensure that today’s encrypted data and communications are resistant to being decrypted in the future. They have led the drive to incorporate post-quantum encryption across Cloudflare’s infrastructure and services, and in 2023 we announced that it would be included in our delivery services, available to everyone and free of charge, forever. However, to take full advantage, support is needed on the client side as well, so to track that, we worked together to add a graph to Radar’s Adoption & Usage page that tracks the post-quantum encrypted share of HTTPS request traffic. Starting 2024 at under 3%, it has grown to just over 47%, thanks to major browsers and code libraries activating post-quantum support by default.
Measuring AI bot & crawler activity
The rapid proliferation and growth of AI platforms since the launch of OpenAI’s ChatGPT in November 2022 has upended multiple industries. This is especially true for content creators. Over the last several decades, they generally allowed their sites to be crawled in exchange for the traffic that the search engines would send back to them — traffic that could be monetized in various ways. However, two developments have changed this dynamic. First, AI platforms began aggressively crawling these sites to vacuum up content to use for training their models (with no compensation to content creators). Second, search engines have evolved into answer engines, drastically reducing the amount of traffic they send back to sites. This has led content owners to demand solutions.
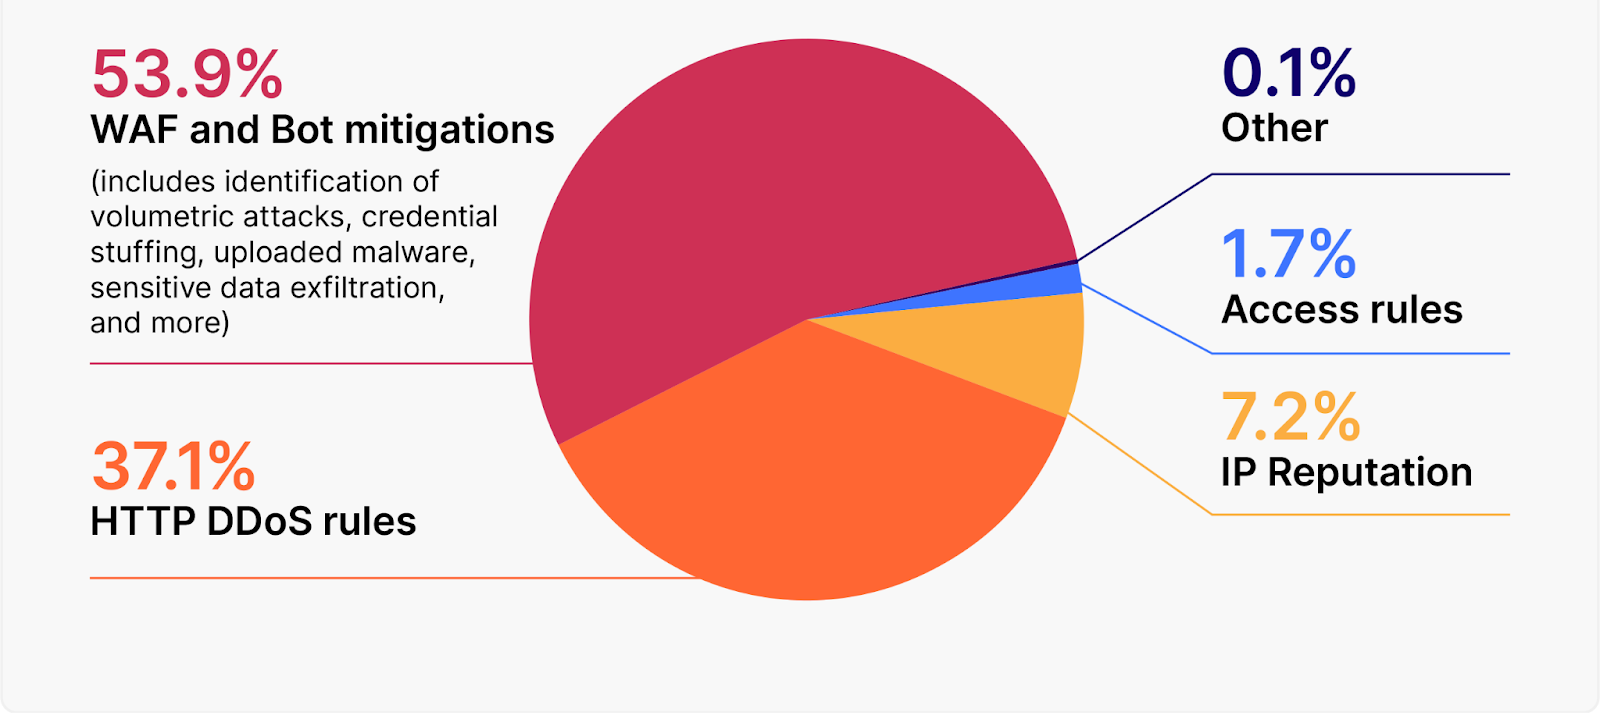
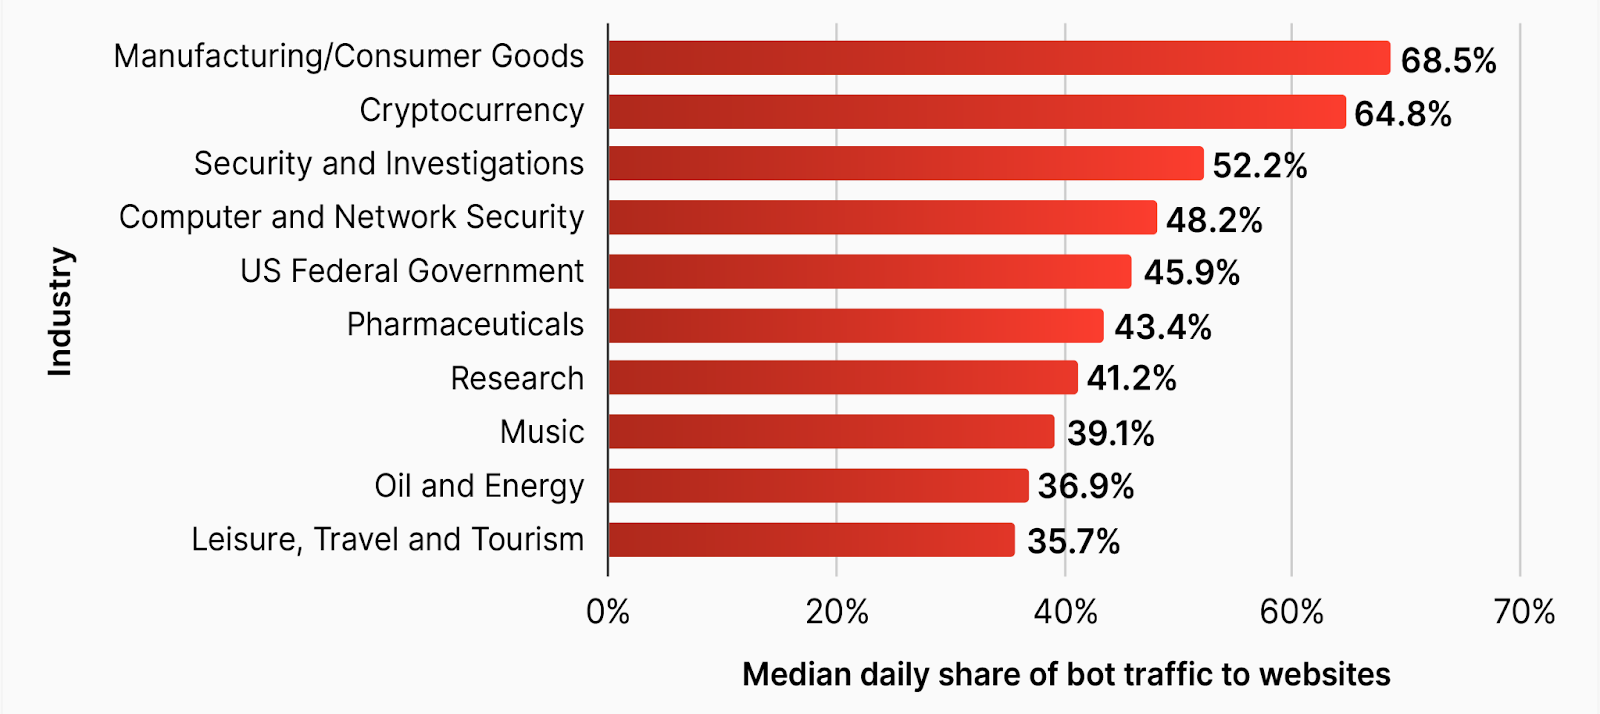
Among these solutions is providing customers with increased visibility into how frequently AI crawlers are scraping their content, and Radar has built on that to provide aggregated perspectives on this activity. Radar’s AI Insights page provides graphs based on crawling traffic, including traffic trends by bot and traffic trends by crawl purpose, both of which can be broken out by industry set as well. Customers can compare the traffic trends we show on the dashboard with trends across their industry.
One key insight is the crawl-to-refer ratio: a measure of how many HTML pages a crawler consumes in comparison to the number of page visits that they refer back to the crawled site. A view into these ratios by platform, and how they change over time, gives content creators insight into just how significant the reciprocal traffic imbalances are, and the impact of the ongoing transition of search engines into answer engines.
Over the three decades, the humble robots.txt file has served as something of a gatekeeper for websites, letting crawlers know if they are allowed to access content on the site, and if so, which content. Well-behaved crawlers read and parse the file, and adjust their crawling activity accordingly. Based on the robots.txt files found across Radar’s top 10,000 domains, Radar’s AI Insights page shows how many of these sites explicitly allow or disallow these AI crawlers to access content, and how complete that access/restriction is. With the ability to filter the data by domain category, this graph can provide site owners with visibility into how their peers may be dealing with these AI crawlers.
Improving Internet resilience with routing visibility
Routing is the process of selecting a path across one or more networks, and in the context of the Internet, routing selects the paths for Internet Protocol (IP) packets to travel from their origin to their destination. It is absolutely critical to the functioning of the Internet, but lots of things can go wrong, and when they do, they can take a whole network offline. (And depending on the network, a larger blast radius of sites, applications, and other service providers may be impacted.
Routing visibility provides insights into the health of a network, and its relationship to other networks. These insights can help identify or troubleshoot problems when they occur. Among the more significant things that can go wrong are route leaks and origin hijacks. Route leaks occur when a routing announcement propagates beyond its intended scope — that is, when the announcement reaches networks that it shouldn’t. An origin hijack occurs when an attacker creates fake announcements for a targeted prefix, falsely identifying an autonomous systems (AS) under their control as the origin of the prefix — in other words, the attacker claims that their network is responsible for a given set of IP addresses, which would cause traffic to those addresses to be routed to them.
In 2022 and 2023 respectively, we added route leak and origin hijack detection to Radar, providing network operators and other interested groups (such as researchers) with information to help identify which networks may be party to such events, whether as a leaker/hijacker, or a victim. And perhaps more importantly, in 2023 we also launched notifications for route leaks and origin hijacks, automatically notifying subscribers via email or webhook when such an event is detected, enabling them to take immediate action.
In 2025, we further improved this visibility by adding two additional capabilities. The first was real-time BGP route visibility, which illustrates how a given network prefix is connected to other networks — what is the route that packets take to get from that set of IP addresses to the large “tier 1” network providers? Network administrators can use this information when facing network outages, implementing new deployments, or investigating route leaks.
An AS-SET is a grouping of related networks, historically used for multiple purposes such as grouping together a list of downstream customers of a particular network provider. Our recently announced AS-SET monitoring enables network operators to monitor valid and invalid AS-SET memberships for their networks, which can help prevent misuse and issues like route leaks.
Not just pretty pictures
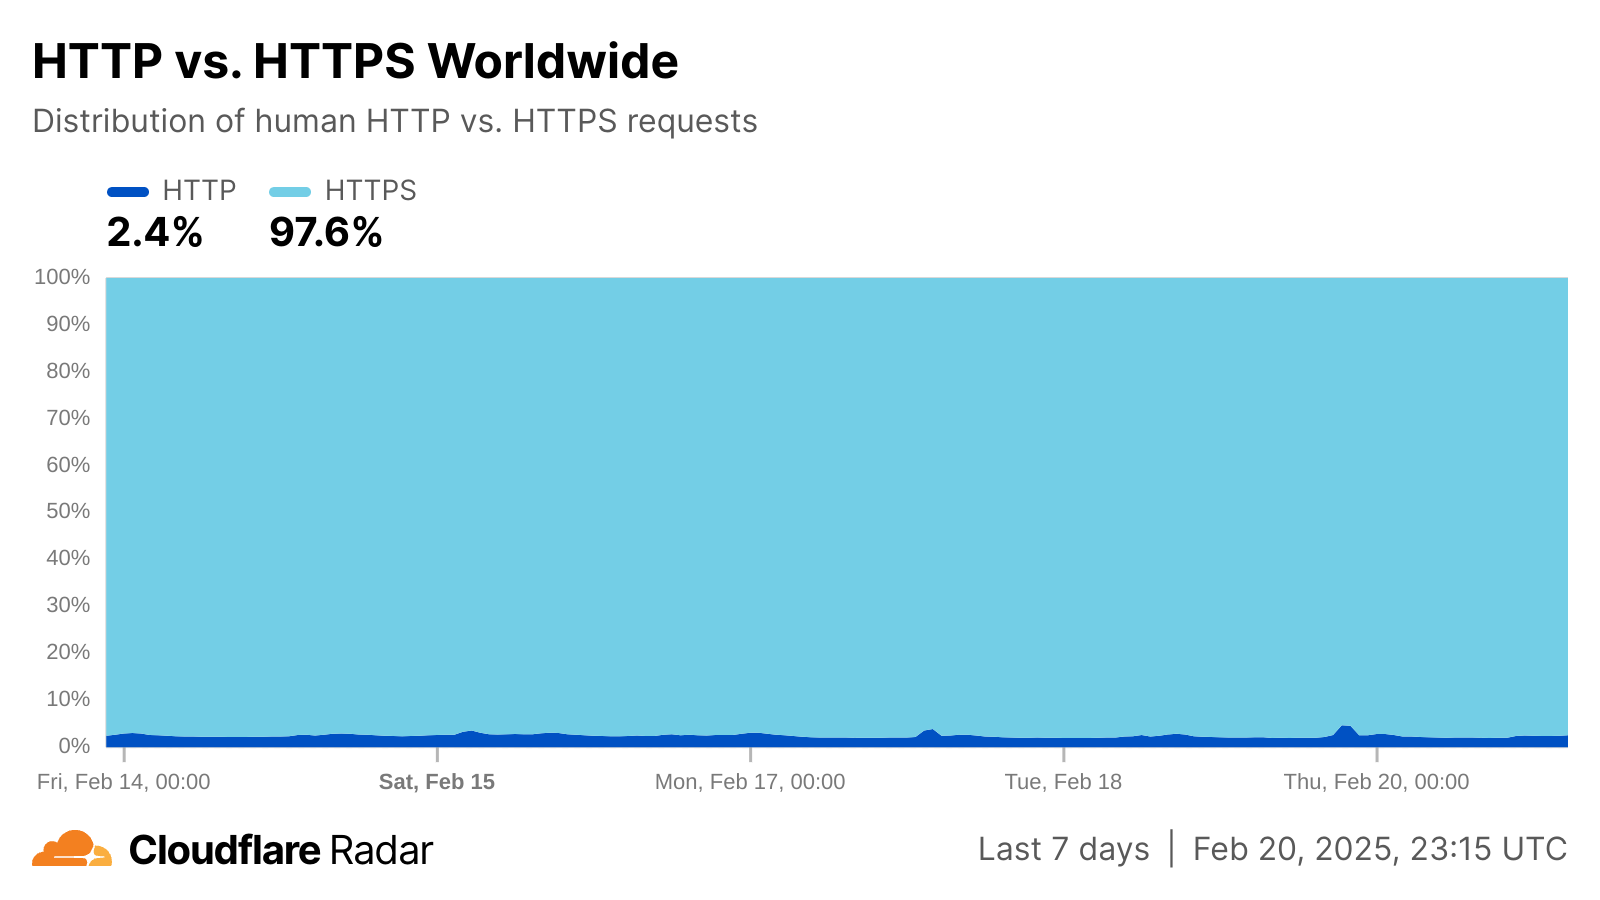
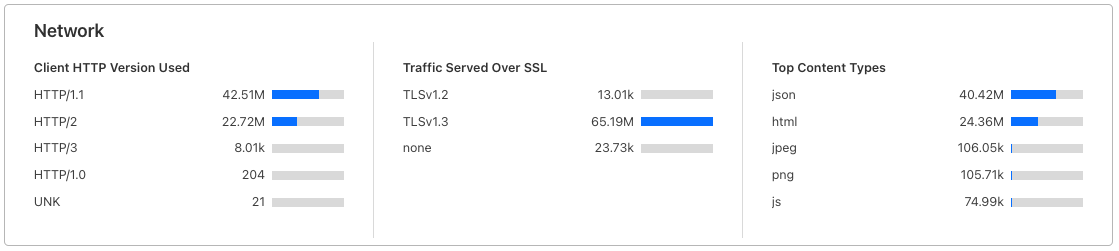
While Radar has been historically focused on providing clear, informative visualizations, we have also launched capabilities that enable users to get at the underlying data more directly, enabling them to use it in a more programmatic fashion. The most important one is the Radar API, launched in 2022. Requiring just an access token, users can get access to all the data shown on Radar, as well as some more advanced filters that provide more specific data, enabling them to incorporate Radar data into their own tools, websites, and applications. The example below shows a simple API call that returns the global distribution of human and bot traffic observed over the last seven days.
The Model Context Protocol is a standard way to make information available to large language models (LLMs). Somewhat similar to the way an application programming interface (API) works, MCP offers a documented, standardized way for a computer program to integrate services from an external source. It essentially allows AI programs to exceed their training, enabling them to incorporate new sources of information into their decision-making and content generation, and helps them connect to external tools. The Radar MCP server allows MCP clients to gain access to Radar data and tools, enabling exploration using natural language queries.
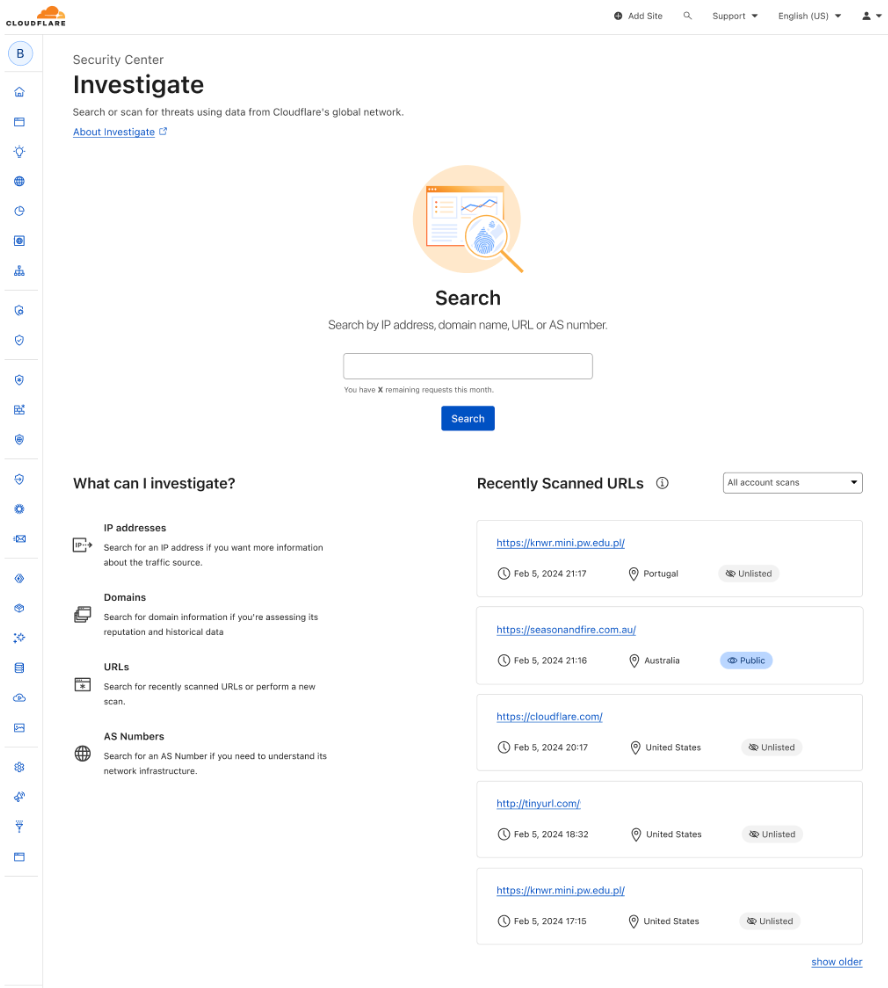
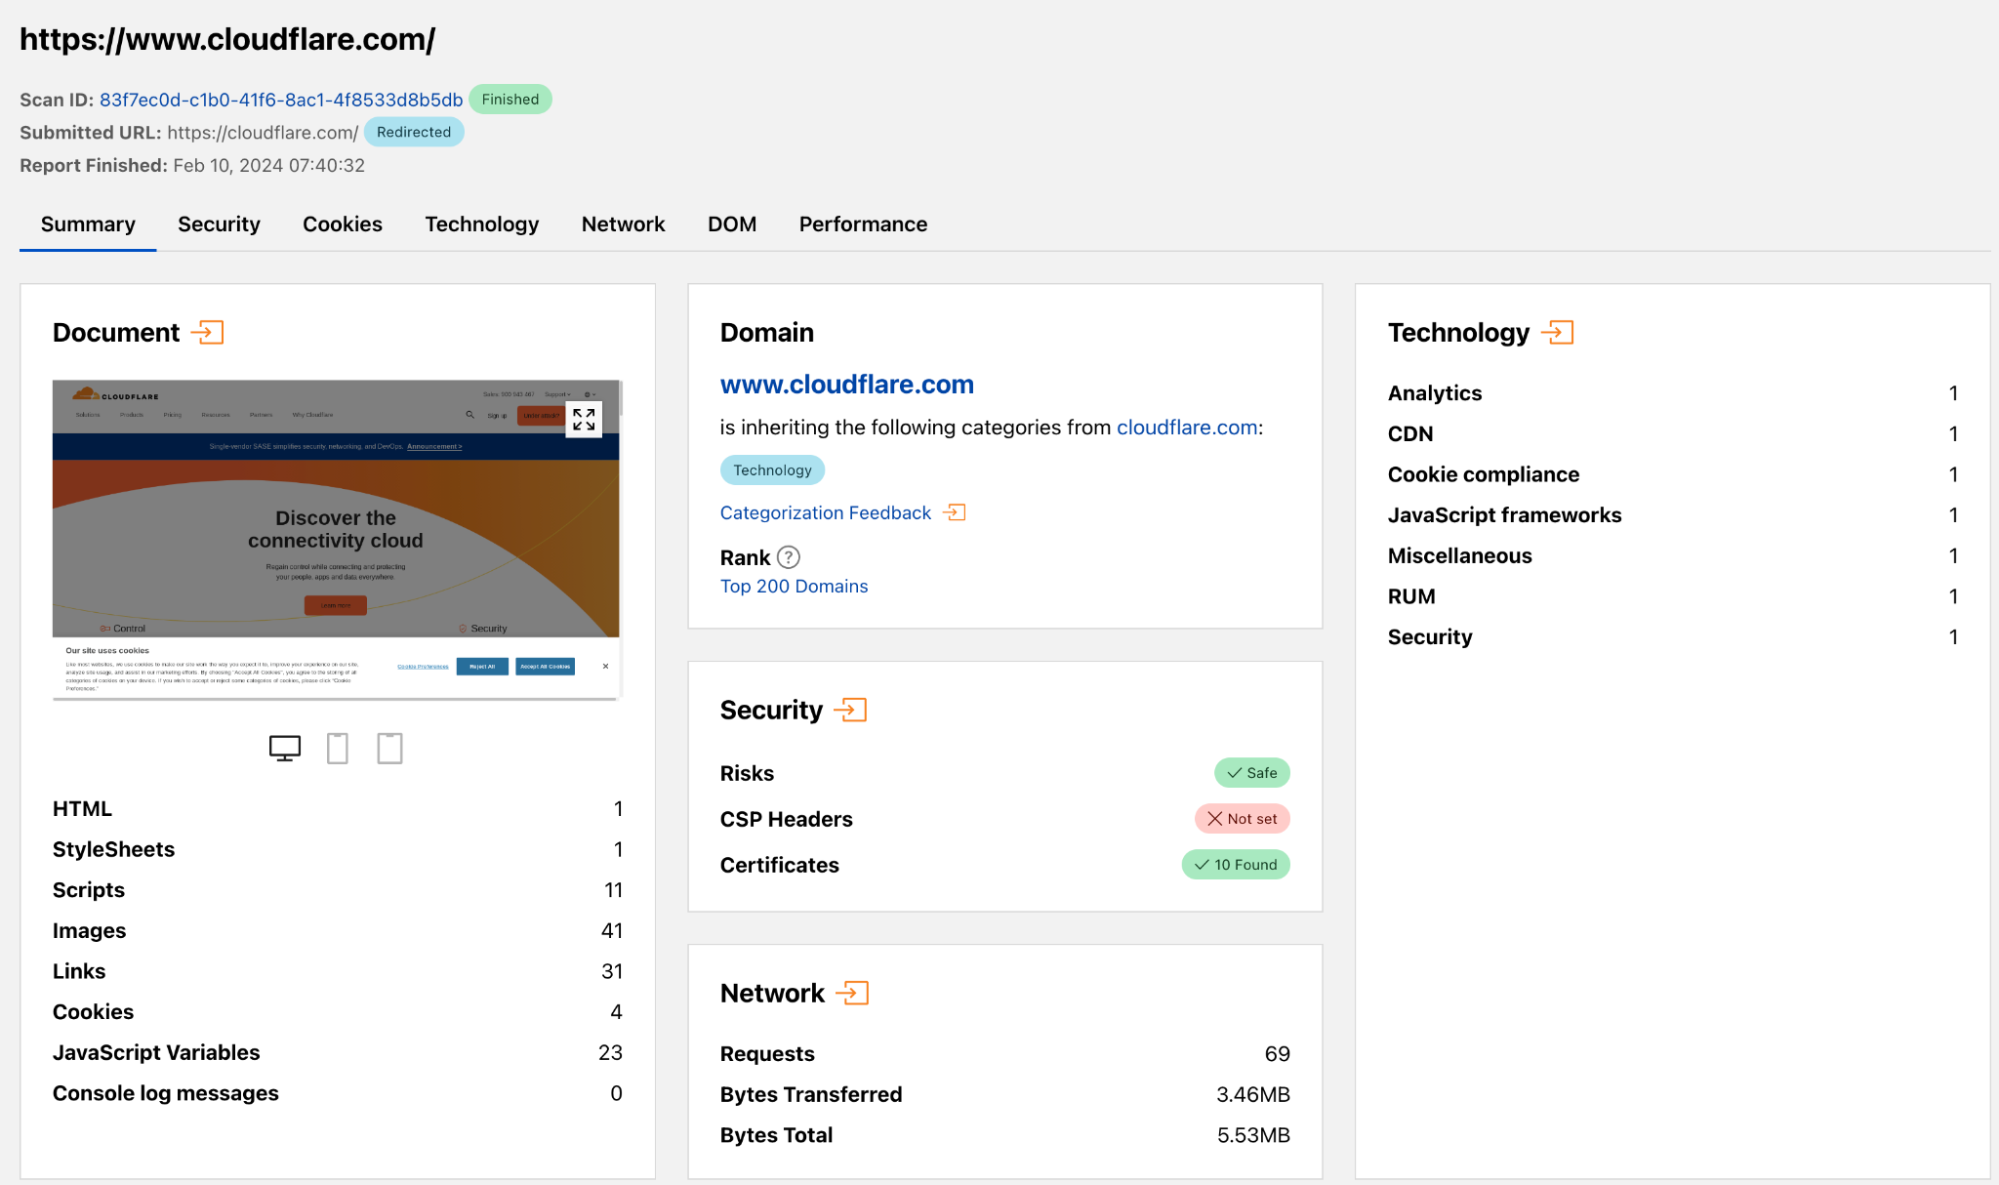
Radar’s URL Scanner has proven to be one of its most popular tools, scanning millions of sites since launching in 2023. It allows users to safely determine whether a site may contain malicious content, as well as providing information on technologies used and insights into the site’s headers, cookies, and links. In addition to being available on Radar, it is also accessible through the API and MCP server.
Finally, Radar’s user interface has seen a number of improvements over the last several years, in service of improved usability and a better user experience. As new data sets and capabilities are launched, they are added to the search bar, allowing users to search not only for countries and ASNs, but also IP address prefixes, certificate authorities, bot names, IP addresses, and more. Initially launching with just a few default date ranges (such as last 24 hours, last 7 days, etc.), we’ve expanded the number of default options, as well as enabling the user to select custom date ranges of up to one year in length. And because the Internet is global, Radar should be too. In 2024, we launched internationalized versions of Radar, marking availability of the site in 14 languages/dialects, including downloaded and embedded content.
This is a sampling of the updates and enhancements that we have made to Radar over the last five years in support of Internet measurement, transparency, and resilience. These individual data sets and tools combine to provide one of the most comprehensive views of the Internet available. And we’re not close to being done. We’ll continue to bring additional visibility to the unseen ways that the Internet is changing by adding more tools, data sets, and visualizations, to help users answer more questions in areas including AI, performance, adoption and usage, and security.
Visit radar.cloudflare.com to explore all the great data sets, capabilities, and tools for yourself, and to use the Radar API or MCP server to incorporate Radar data into your own tools, sites, and applications. Keep an eye on the Radar changelog feed, Radar release notes, and the Cloudflare blog for news about the latest changes and launches, and don’t hesitate to reach out to us with feedback, suggestions, and feature requests.
For companies looking to migrate from PRTG Network Monitor to Zabbix, one of the most critical aspects is making sure a smooth migration of monitored devices and configurations. While there is no official tool to directly migrate between the two platforms, creating a bridge using custom export/import scripts allows for an effective and large migation. This blog post outlines a practical approach to achieving that migration based on the export/import methodology we at Opensource ICT Solutions previously implemented for one of our clients.
Why migrate?
While PRTG offers an intuitive interface and is popular for its ease of use, Zabbix provides:
Greater flexibility and scalability
Full open-source licensing
More powerful automation and templating
A robust API for integrations
Lower costs, especially since Paessler was sold to an investor
These features make Zabbix an attractive choice for teams looking to scale or standardize on open-source infrastructure.
Migration overview
The migration involves two key steps:
Exporting PRTG device information
Importing data into Zabbix
Because the two systems are conceptually and structurally different, we focused our scripts on migrating what is most transferable: device names, IP addresses, and interface types. SNMP versions or PRTG-specific sensor details were excluded or simplified where not applicable to Zabbix. PRTG, for example, will only export probes that have an OID that was not built-in in PRTG but added later, making our export incomplete. This does not mean we did a partial migration, it just means we have not included it in the automated approach.
Step 1: Exporting from PRTG
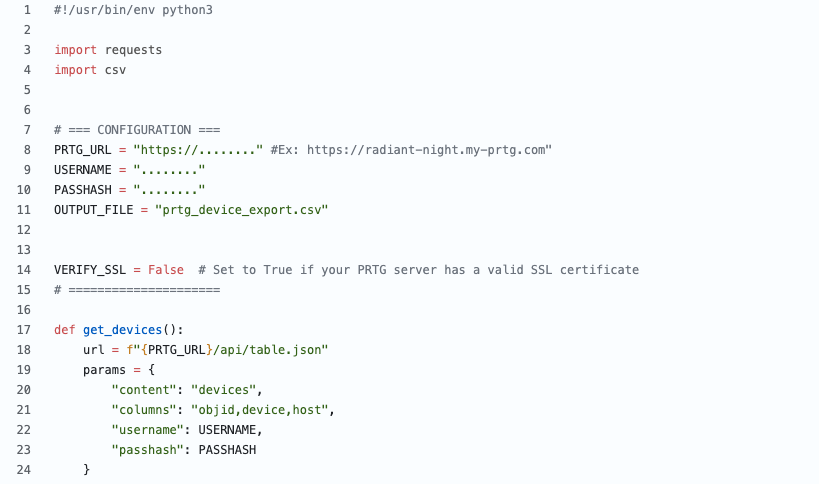
We developed a Python-based script that interacts with the PRTG API to extract monitored device data and export it to a CSV file. The script filters out irrelevant objects and organizes the output for easy Zabbix processing.
This creates a clean CSV, like this:
Device Name, IP Address, Interface Type
zabbix-server,10.0.0.10,agent
ServerA,192.168.0.2,SNMP
ServerA,192.168.0.2,agent
core-switch,192.168.0.1,SNMP
This file serves as a clean, structured inventory of monitored devices.
Note: SNMP version fields were excluded in the final export, as Zabbix does not currently display or rely on an SNMP version in the same way PRTG does.
Step 2: Importing into Zabbix
Using Zabbix’s API, we created an import script that reads the CSV and:
Creates host entries
Assigns them to the appropriate host group
Adds relevant interfaces (e.g., Agent,ILO,SNMP or a combination of …)
Each host is configured based on its detected interface type in PRTG.
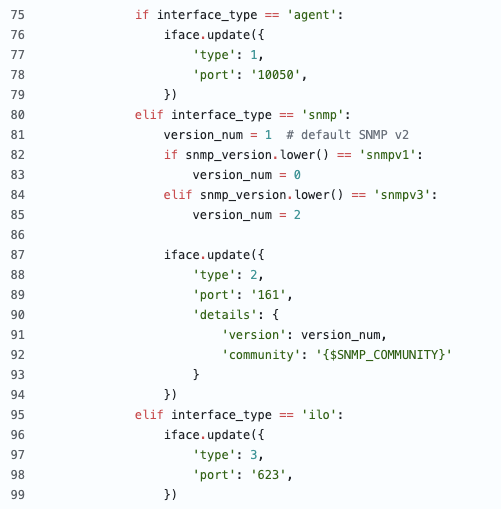
On the Zabbix side, we used the Zabbix API to automate the creation of hosts, interfaces, and template assignment. The import script reads the CSV line-by-line and takes action based on the interface type.
Considerations and “gotchas”
Templates: We didn’t add templates, as there is no 1:1 solution – PRTG has a different concept and adding a standard template would be possible but probably not the best solution.
Host Groups: For ease of use and the limited time we had, we added all hosts in a temporary host group made for the migration. Although we do have scripts that take it out from PRTG and create it in Zabbix, in this particular migration it was not needed.
Permissions: The API token used in the import script must have sufficient privileges to create hosts.
What is NOTmigrated
Because of fundamental differences between the platforms, the following are not directly migrated:
Historical data or sensor readings: Mainly because the customer had no hard requirement for it.
Custom PRTG notifications or dependencies: It was easier to manually re-create them.
Maps or dashboards: The Zabbix approach is so different that it was easier to recreate it manually (and improve).
Sensors: Zabbix is working with a different concept.
Post-migration tips
Validation: After the import, verify that each host is reachable and monitored correctly in Zabbix.
Discovery: Consider using Zabbix’s LLD (Low-Level Discovery) to dynamically find interfaces, disks, or other entities.
Housekeeping: Disable PRTG monitoring only after confirming Zabbix is fully operational.
Conclusion
Migrating from PRTG to Zabbix is not a one click operation, but with some scripting, planning, and experience from a partner like us, it can be done efficiently and with minimal disruption. The custom export/import scripts act as a reliable bridge between the two systems, allowing for a clean transfer of your monitoring inventory. From there, Zabbix’s automation and scalability features can help take your monitoring to the next level.
If you need assistance with the migration or want to ensure best practices for scaling and optimizing Zabbix, don’t hesitate to reach out to OICTS. We are a Zabbix Premium Partner operating globally, with offices in the USA, UK, Netherlands, and Belgium ready to help you every step of the way.
Zabbix has been the backbone of my infrastructure for over ten years, a journey I’ve been on from version 3.2 to 7.4. It’s a robust and reliable tool. However, in the age of intelligent assistants, I posed a question to myself: Why can’t I interact with my monitoring system as naturally as I talk with Maria, my generative AI assistant?
Table of Contents
What is MCP?
MCP (Model Context Protocol) is a universal protocol that helps generative AI systems interact with global data securely, reliably, and at scale.
Imagine this: It’s 3 AM, and you receive a critical alert on your phone. Instead of opening multiple dashboards and manually correlating data, you simply type: “What’s happening with the production server?”
You get a response like this:
“The web-prod-01 server is experiencing high memory usage (94%). This started 15 minutes ago, coinciding with a traffic spike. I recommend checking the database connection pool and considering a restart of the Apache service. Would you like me to show you the related logs?”
This is no longer science fiction!
Design principle
The main objective is to enhance Zabbix without altering its core. The solution is based on an architecture that adheres to the following principles:
Zabbix intact: The original installation remains unchanged.
API-first: All communication is done through Zabbix’s robust JSON-RPC API.
Intelligent bridge: An intermediary service is created to translate between human language and Zabbix metrics.
Scalability: The design is prepared to grow alongside the infrastructure.
AI server (MCP): Rocky Linux 9, Gemini AI, Express.js, Winston (Logging), Gemini CLI, Redis, Nginx, PM2
Webhooks
We process Zabbix alerts through a webhook that sends the data to our generative AI service.
#!/usr/bin/env python3
# -*- coding: utf-8 -*-
import json
import requests
import sys
from datetime import datetime

def send_to_mcp(args):
""" Sends alerts to MCP server"""
# SETTINGS - EDIT ACCORDING TO YOUR ENVIRONMENT
mcp_endpoint = "http://TU_IP_MCP_SERVER:3001/alerts" # Change to the MCP server IP
mcp_token = "TU_MCP_AUTH_TOKEN" # Exchange for your MCP authentication token
zabbix_server_ip = "TU_IP_ZABBIX_SERVER" # Change to the Zabbix server IP

headers = {
'Content-Type': 'application/json',
'Authorization': f'Bearer {mcp_token}'
}

# Extracting arguments from the Zabbix webhook
eventid = args[0] if len(args) > 0 else "unknown"
severity = args[1] if len(args) > 1 else "0"
message = args[2] if len(args) > 2 else "No message"
host = args[3] if len(args) > 3 else "unknown"
value = args[4] if len(args) > 4 else ""

payload = {
"timestamp": datetime.now().isoformat(),
"source": "zabbix",
"eventid": eventid,
"severity": severity,
"message": message,
"host": host,
"value": value,
"zabbix_server": zabbix_server_ip
}

try:
print(f"Sending alert to MCP: {mcp_endpoint}")
print(f"Payload: {json.dumps(payload, indent=2)}")

response = requests.post(mcp_endpoint, json=payload, headers=headers, timeout=15)
response.raise_for_status()

print(f"Alert sent successfully: HTTP {response.status_code}")
print(f"Response: {response.text}")
return True

except requests.exceptions.Timeout:
print("? Error: Timeout connecting to MCP server", file=sys.stderr)
return False
except requests.exceptions.ConnectionError:
print("? Error: Cannot connect to MCP server", file=sys.stderr)
return False
except requests.exceptions.HTTPError as e:
print(f"? HTTP Error: {e}", file=sys.stderr)
print(f"Response: {response.text}", file=sys.stderr)
return False
except Exception as e:
print(f"? Unexpected error: {e}", file=sys.stderr)
return False

if __name__ == "__main__":
# The arguments come from Zabbix
args = sys.argv[1:]
print(f"Script called with args: {args}")

success = send_to_mcp(args)
sys.exit(0 if success else 1)
Use cases
Scenario 1: Monday morning
Cesar: Good morning, how is the infrastructure looking?
Gemini CLI: Good morning! Everything is calm. 14 active hosts, 0 critical problems. There was a scheduled reboot on ‘proxmox-desarrollo’ over the weekend which completed successfully. The average CPU usage is at 23%. Do you need details on any specific system?
Scenario 2: Proactive planning
Cesar: What worrying trends are you seeing this week?
Gemini CLI: I’ve noticed three patterns that require attention:
1. storage-01: Growth of 2GB/day in /var/log.
Projection: 90% capacity in 12 days.
Recommendation: Configure a more aggressive log rotate.
2. mikrotik: Gradually increasing temperature (+3°C over the last 7 days).
Recommendation: Check ventilation.
3. base-datos-01: Slow queries increasing by 15%.
Recommendation: Review indexes and optimize frequent queries.
MCP implementation
Server (Rocky Linux 9)
bash
#create the project
mkdir /opt/mcp-zabbix
cd /opt/mcp-zabbix

#Install dependencies
sudo dnf install -y nodejs npm redis nginx
sudo npm install -g pm2

#Set up the project
npm init -y
npm install express axios @google/generative-ai winston helmet cors dotenv
Complete installation: Scripts for Rocky Linux and Debian
Zabbix configuration: Media types and actions
API reference: Endpoints and examples
Use cases
Basic monitoring: Hosts, items, triggers
Intelligent alerts: Automatic analysis
Ad-hoc queries: Quick investigation
Automated reports: Periodic summaries
Future integrations
The goal is to develop an application that allows natural interaction with an AI assistant called “Maria.” The idea is that based on what’s happening, Maria suggests actions and executes them proactively.
To achieve this, the assistant will integrate with Gemini’s command-line interface (CLI) and establish an additional secure communication channel. The recommended architecture will consist of several servers capable of understanding each other, including a Zabbix Server, the MCP (Model Context Protocol), and the personal assistant.You can follow the development of the base integration in this repository.
Conclusion
Zabbix will continue to be the reliable engine we all know. The difference is that it now becomes more intuitive and conversational. The goal is not to replace human experience, but to empower it. AI will allow us to create solutions that were previously unthinkable.
To fully leverage this potential, it is essential that we, as experts, continue to train and deepen our knowledge of the tool. This way, we will not only depend on what the AI suggests, but we will be able to validate and authorize its actions with our own judgment.
Many developers, data scientists, and researchers do much of their work in Python notebooks: they’ve been the de facto standard for data science and sharing for well over a decade. Notebooks are popular because they make it easy to code, explore data, prototype ideas, and share results. We use them heavily at Cloudflare, and we’re seeing more and more developers use notebooks to work with data – from analyzing trends in HTTP traffic, querying Workers Analytics Engine through to querying their own Iceberg tables stored in R2.
Traditional notebooks are incredibly powerful — but they were not built with collaboration, reproducibility, or deployment as data apps in mind. As usage grows across teams and workflows, these limitations face the reality of work at scale.
marimo reimagines the notebook experience with these challenges in mind. It’s an open-source reactive Python notebook that’s built to be reproducible, easy to track in Git, executable as a standalone script, and deployable. We have partnered with the marimo team to bring this streamlined, production-friendly experience to Cloudflare developers. Spend less time wrestling with tools and more time exploring your data.
Want to start exploring your Cloudflare data with marimo right now? Head over to notebooks.cloudflare.com. Or, keep reading to learn more about marimo, how we’ve made authentication easy from within notebooks, and how you can use marimo to explore and share notebooks and apps on Cloudflare.
Why marimo?
marimo is an open-source reactive Python notebook designed specifically for working with data, built from the ground up to solve many problems with traditional notebooks.
The core feature that sets marimo apart from traditional notebooks is its reactive execution model, powered by a statically inferred dataflow graph on cells. Run a cell or interact with a UI element, and marimo either runs dependent cells or marks them as stale (your choice). This keeps code and outputs consistent, prevents bugs before they happen, and dramatically increases the speed at which you can experiment with data.
Thanks to reactive execution, notebooks are also deployable as data applications, making them easy to share. While you can run marimo notebooks locally, on cloud servers, GPUs — anywhere you can traditionally run software — you can also run them entirely in the browser with WebAssembly, bringing the cost of sharing down to zero.
Because marimo notebooks are stored as Python, they enjoy all the benefits of software: version with Git, execute as a script or pipeline, test with pytest, inline package requirements with uv, and import symbols from your notebook into other Python modules. Though stored as Python, marimo also supports SQL and data sources like DuckDB, Postgres, and Iceberg-based data catalogs (which marimo’s AI assistant can access, in addition to data in RAM).
To get an idea of what a marimo notebook is like, check out the embedded example notebook below:
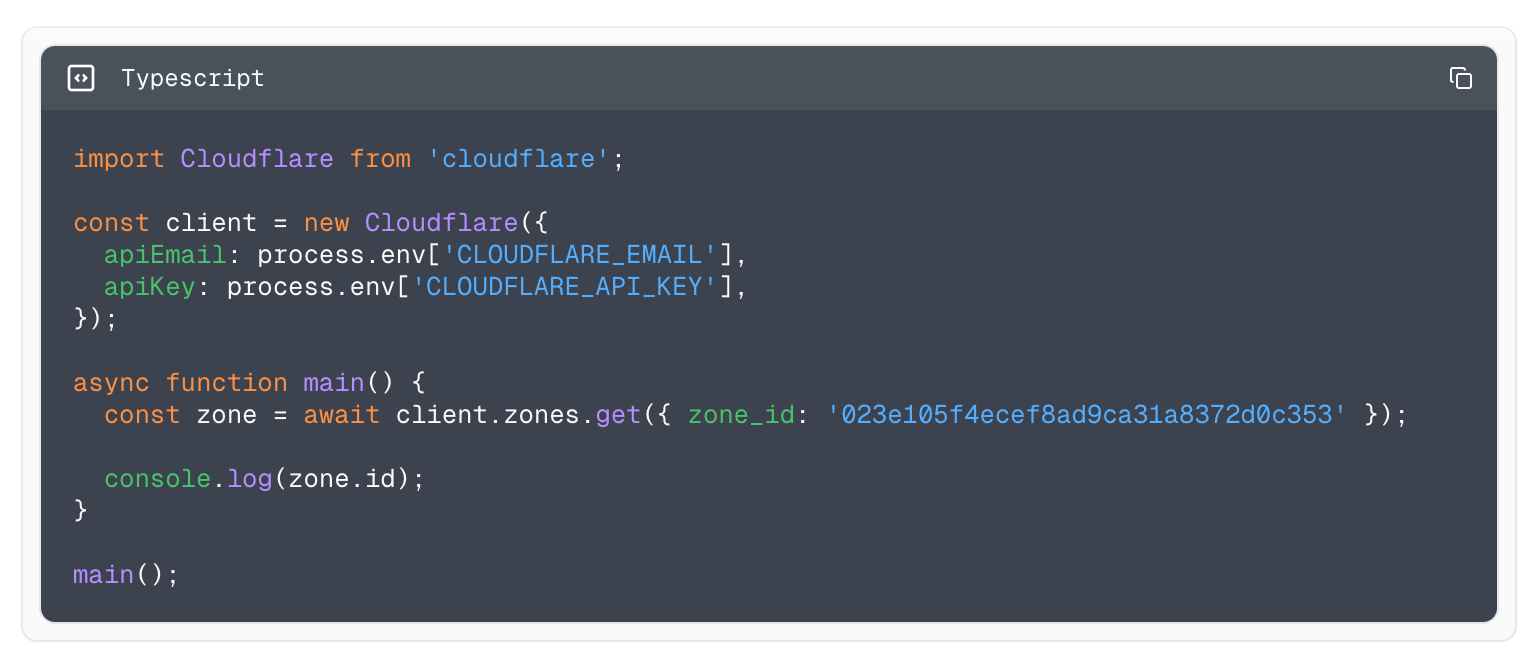
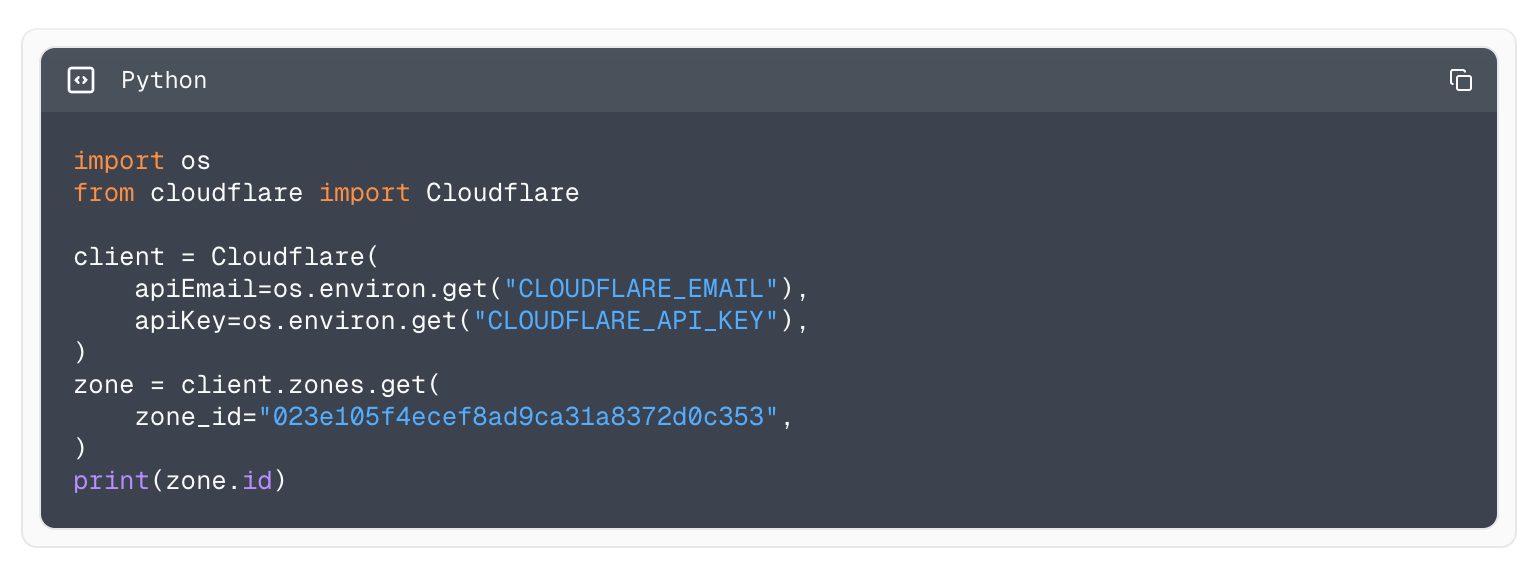
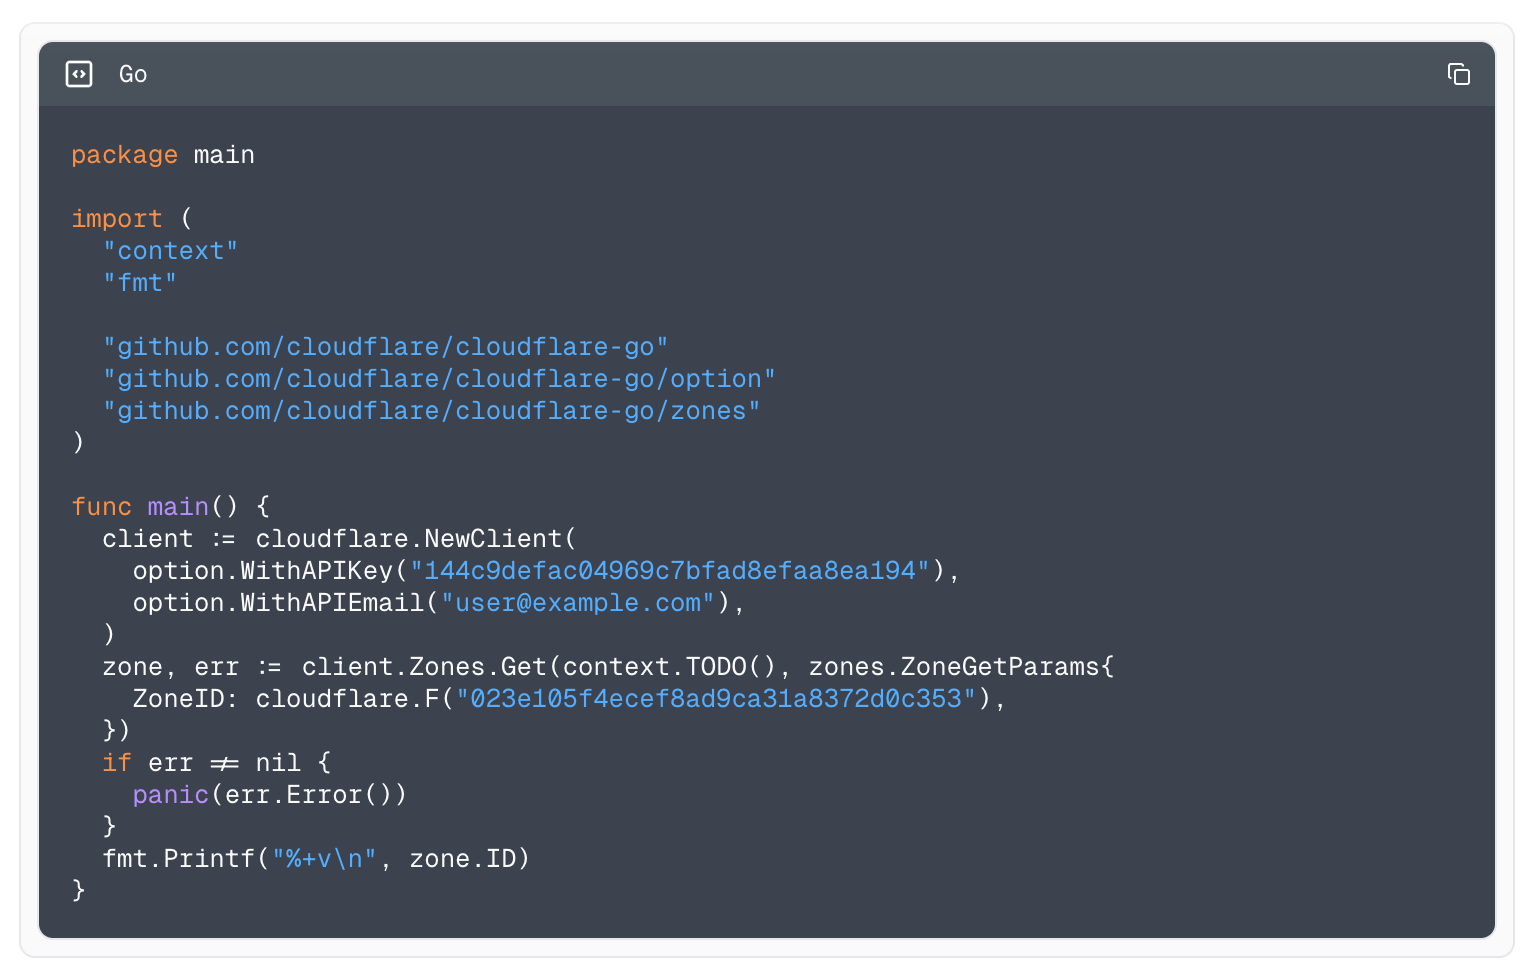
Want to create your own notebook to run locally instead? Here’s a quick example that shows you how to authenticate with your Cloudflare account and list the zones you have access to:
mkdir cloudflare-zones-notebook
cd cloudflare-zones-notebook
3. Initialize a new uv project (this creates a .venv and a pyproject.toml):
uv init
4. Add marimo and required dependencies:
uv add marimo
5. Create a file called list-zones.py and paste in the following notebook:
import marimo

__generated_with = "0.14.10"
app = marimo.App(width="full", auto_download=["ipynb", "html"])


@app.cell
def _():
    from moutils.oauth import PKCEFlow
    import requests

    # Start OAuth PKCE flow to authenticate with Cloudflare
    auth = PKCEFlow(provider="cloudflare")

    # Renders login UI in notebook
    auth
    return (auth,)


@app.cell
def _(auth):
    import marimo as mo
    from cloudflare import Cloudflare

    mo.stop(not auth.access_token, mo.md("Please **sign in** using the button above."))
    client = Cloudflare(api_token=auth.access_token)

    zones = client.zones.list()
    [zone.name for zone in zones.result]
    return


if __name__ == "__main__":
    app.run()
6. Open the notebook editor:
uv run marimo edit list-zones.py --sandbox
7. Log in via the OAuth prompt in the notebook. Once authenticated, you’ll see a list of your Cloudflare zones in the final cell.
That’s it! From here, you can expand the notebook to call Workers AI models, query Iceberg tables in R2 Data Catalog, or interact with any Cloudflare API.
How OAuth works in notebooks
Think of OAuth like a secure handshake between your notebook and Cloudflare. Instead of copying and pasting API tokens, you just click “Sign in with Cloudflare” and the notebook handles the rest.
We built this experience using PKCE (Proof Key for Code Exchange), a secure OAuth 2.0 flow that avoids client secrets and protects against code interception attacks. PKCE works by generating a one-time code that’s exchanged for a token after login, without ever sharing a client secret. Learn more about how PKCE works.
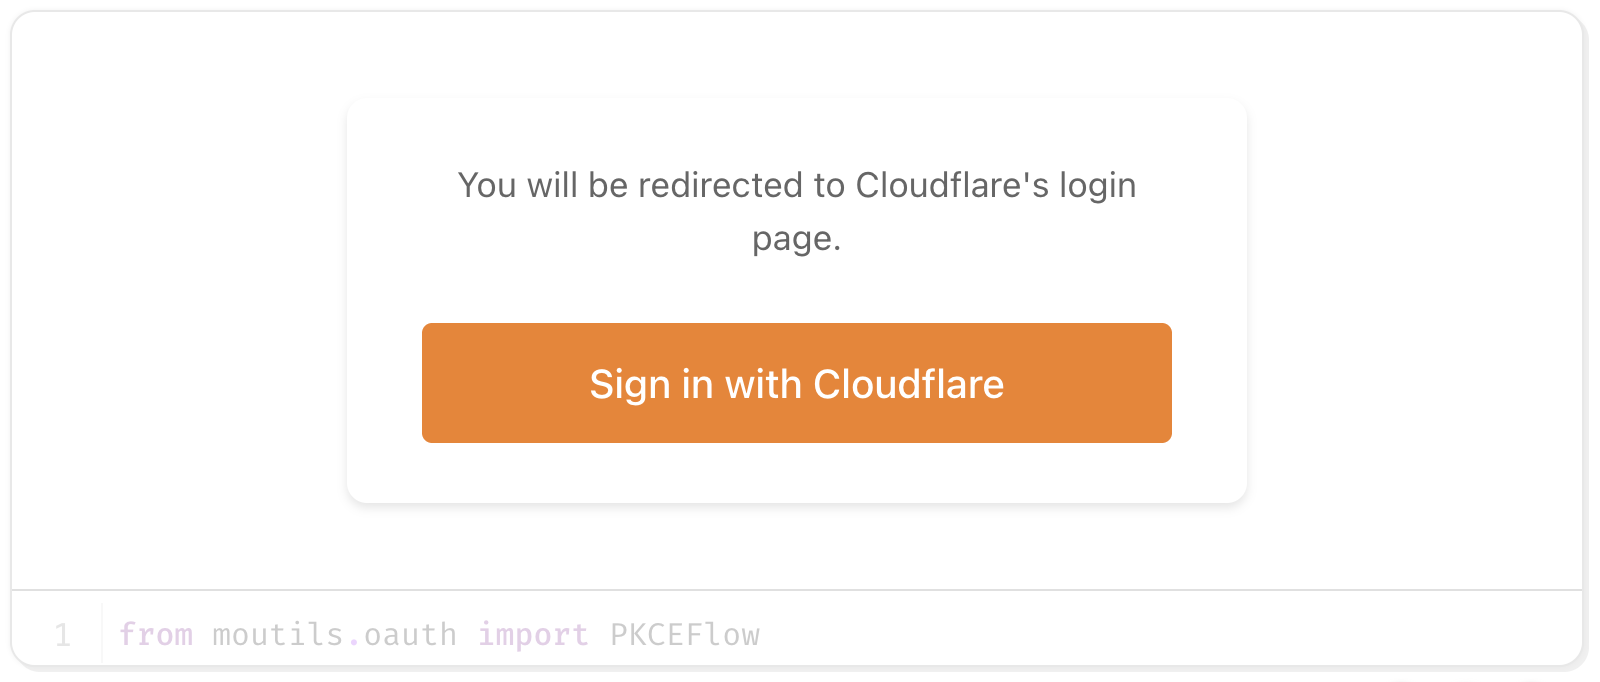
The login widget lives in moutils.oauth, a collaboration between Cloudflare and marimo to make OAuth authentication simple and secure in notebooks. To use it, just create a cell like this:
auth = PKCEFlow(provider="cloudflare")

# Renders login UI in notebook
auth
When you run the cell, you’ll see a Sign in with Cloudflare button:
Once logged in, you’ll have a read-only access token you can pass when using the Cloudflare API.
Running marimo on Cloudflare: Workers and Containers
If you have a local notebook you want to share, you can publish it to Workers. This works because marimo can export notebooks to WebAssembly, allowing them to run entirely in the browser. You can get started with just two commands:
If your notebook needs authentication, you can layer in Cloudflare Access for secure, authenticated access.
For notebooks that require more compute, persistent sessions, or long-running tasks, you can deploy marimo on our new container platform. To get started, check out our marimo container example on GitHub.
What’s next for Cloudflare + marimo
This blog post marks just the beginning of Cloudflare’s partnership with marimo. While we’re excited to see how you use our joint WebAssembly-based notebook platform to explore your Cloudflare data, we also want to help you bring serious compute to bear on your data — to empower you to run large scale analyses and batch jobs straight from marimo notebooks. Stay tuned!
IPv4 addresses have become a costly commodity, driven by their growing scarcity. With the original pool of 4.3 billion addresses long exhausted, organizations must now rely on the secondary market to acquire them. Over the years, prices have surged, often exceeding $30–$50 USD per address, with costs varying based on block size and demand. Given the scarcity, these prices are only going to rise, particularly for businesses that haven’t transitioned to IPv6. This rising cost and limited availability have made efficient IP address management more critical than ever. In response, we’ve evolved how we handle BYOIP (Bring Your Own IP) prefixes to give customers greater flexibility.
Historically, when customers onboarded a BYOIP prefix, they were required to assign it to a single service, binding all IP addresses within that prefix to one service before it was advertised. Once set, the prefix’s destination was fixed — to direct traffic exclusively to that service. If a customer wanted to use a different service, they had to onboard a new prefix or go through the cumbersome process of offboarding and re-onboarding the existing one.
As a step towards addressing this limitation, we’ve introduced a new level of flexibility: customers can now use parts of any prefix — whether it’s bound to Cloudflare CDN, Spectrum, or Magic Transit — for additional use with CDN or Spectrum. This enhancement provides much-needed flexibility, enabling businesses to optimize their IP address usage while keeping costs under control.
The challenges of moving onboarded BYOIP prefixes between services
Migrating BYOIP prefixes dynamically between Cloudflare services is no trivial task, especially with thousands of servers capable of accepting and processing connections. The problem required overcoming several technical challenges related to IP address management, kernel-level bindings, and orchestration.
Dynamic reallocation of prefixes across services
When configuring an IP prefix for a service, we need to update IP address lists and firewall rules on each of our servers to allow only the traffic we expect for that service, such as opening ports 80 and 443 to allow HTTP and HTTPS traffic for the Cloudflare CDN. We use Linux iptables and IP sets for this.
Migrating IP prefixes to a different service involves dynamically reassigning them to different IP sets and iptable rules. This requires automated updates across a large-scale distributed environment.
As prefixes shift between services, it is critical that servers update their IP sets and iptable rules dynamically to ensure traffic is correctly routed. Failure to do so could lead to routing loops or dropped connections.
Updating Tubular – an eBPF-based IP and port binding service
Most web applications bind to a list of IP addresses at startup, and listen on only those IPs until shutdown. To allow customers to change the IPs bound to each service dynamically, we needed a way to add and remove IPs from a running service, without restarting it. Tubular is a BPF program we wrote that runs on Cloudflare servers that allows services to listen on a single socket, dynamically updating the list of addresses that are routed to that socket over the lifetime of the service, without requiring it to restart when those addresses change.
A significant engineering challenge was extending Tubular to support traffic destined for Cloudflare’s CDN. Without this enhancement, customers would be unable to leverage dynamic reassignment to bind prefixes onboarded through Spectrum to the Cloudflare CDN, limiting flexibility across services.
Cloudflare’s CDN depends on each server running an NGINX ingress proxy to terminate incoming connections. Due to the scale and performance limitations of NGINX, we are actively working to replace it by 2026. In the interim, however, we still depend on the current ingress proxy to reliably handle incoming connections.
One limitation is that this ingress proxy does not support systemd socket activation, a mechanism Tubular relies on to integrate with other Cloudflare services on each server. For services that do support systemd socket activation, systemd independently starts the sockets for the owning service and passes them to Tubular, allowing Tubular to easily detect and route traffic to the correct terminating service.
Since this integration model is not feasible, an alternative solution was required. This was addressed by introducing a shared Unix domain socket between Tubular and the ingress proxy service on each server. Through this channel, the ingress proxy service explicitly transmits socket information to Tubular, enabling it to correctly register the sockets in its datapath.
The final challenge was deploying the Tubular-ingress proxy integration across the fleet of servers without disrupting active connections. As of April 2025, Cloudflare handles an average of 71 million HTTP requests per second, peaking at 100 million. To safely deploy at this scale, the necessary Tubular and ingress proxy configuration changes were staged across all Cloudflare servers without disrupting existing connections. The final step involved adding bindings — IP addresses and ports corresponding to Cloudflare CDN prefixes — to the Tubular configuration. These bindings direct connections through Tubular via the Unix sockets registered during the previous integration step. To minimize risk, bindings were gradually enabled in a controlled rollout across the global fleet.
Tubular data plane in action
This high-level representation of the Tubular data plane binds together the Layer 4 protocol (TCP), prefix (192.0.2.0/24 – which is 254 usable IP addresses), and port number 0 (any port). When incoming packets match this combination, they are directed to the correct socket of the service — in this case, Spectrum.
In the following example, TCP 192.0.2.200/32 has been upgraded to the Cloudflare CDN via the edge Service Bindings API. Tubular dynamically consumes this information, adding a new entry to its data plane bindings and socket table. Using Longest Prefix Match, all packets within the 192.0.2.0/24 range port 0 will be routed to Spectrum, except for 192.0.2.200/32 port 443, which will be directed to the Cloudflare CDN.
Coordination and orchestration at scale
Our goal is to achieve a quick transition of IP address prefixes between services when initiated by customers, which requires a high level of coordination. We need to ensure that changes propagate correctly across all servers to maintain stability. Currently, when a customer migrates a prefix between services, there is a 4-6 hour window of uncertainty where incoming packets may be dropped due to a lack of guaranteed routing. To address this, we are actively implementing systems that will reduce this transition time from hours to just a matter of minutes, significantly improving reliability and minimizing disruptions.
Smarter IP address management
Service Bindings are mappings that control whether traffic destined for a given IP address is routed to Magic Transit, the CDN pipeline, or the Spectrum pipeline.
Consider the example in the diagram below. One of our customers, a global finance infrastructure platform, is using BYOIP and has a /24 range bound to Spectrum for DDoS protection of their TCP and UDP traffic. However, they are only using a few addresses in that range for their Spectrum applications, while the rest go unused. In addition, the customer is using Cloudflare’s CDN for their Layer 7 traffic and wants to set up Static IPs, so that their customers can allowlist a consistent set of IP addresses owned and controlled by their own network infrastructure team. Instead of using up another block of address space, they asked us whether they could carve out those unused sub-ranges of the /24 prefix.
From there, we set out to determine how to selectively map sub-ranges of the onboarded prefix to different services using service bindings:
192.0.2.0/24 is already bound to Spectrum
192.0.2.0/25 is updated and bound to CDN
192.0.2.200/32 is also updated bound to CDN
Both the /25 and /32 are sub-ranges within the /24 prefix and will receive traffic directed to the CDN. All remaining IP addresses within the /24 prefix, unless explicitly bound, will continue to use the default Spectrum service binding.
As you can see in this example, this approach provides customers with greater control and agility over how their IP address space is allocated. Instead of rigidly assigning an entire prefix to a single service, users can now tailor their IP address usage to match specific workloads or deployment needs. Setting this up is straightforward — all it takes is a few HTTP requests to the Cloudflare API. You can define service bindings by specifying which IP addresses or subnets should be routed to CDN, Spectrum, or Magic Transit. This allows you to tailor traffic routing to match your architecture without needing to restructure your entire IP address allocation. The process remains consistent whether you’re configuring a single IP address or splitting up larger subnets, making it easy to apply across different parts of your network. The foundational technical work addressing the underlying architectural challenges outlined above made it possible to streamline what could have been a complex setup into a straightforward series of API interactions.
Conclusion
We envision a future where customers have granular control over how their traffic moves through Cloudflare’s global network, not just by service, but down to the port level. A single prefix could simultaneously power web applications on CDN, protect infrastructure through Magic Transit, and much more. This isn’t just flexible routing, but programmable traffic orchestration across different services. What was once rigid and static becomes dynamic and fully programmable to meet each customer’s unique needs.
If you are an existing BYOIP customer using Magic Transit, CDN, or Spectrum, check out our configuration guide here. If you are interested in bringing your own IP address space and using multiple Cloudflare services on it, please reach out to your account team to enable setting up this configuration via API or reach out to [email protected] if you’re new to Cloudflare.
Няма българин, който да не е разбрал, че когато държавата е пропита от корупция, това е не само проблем на морала, на репутацията на страната, нито на незаконното забогатяване на държавни чиновници и магистрати, а представлява пряк риск за живота на хората. Смъртта на 12-годишната Сияна на пътя Телиш–Радомирци освети публично най-бруталната машина за убийства – самата държавна система. В състоянието на пътищата – некачествено построени и неподдържани, се оглежда българската корупция. А в органите на реда и правораздавателните институции – нейната безнаказаност.
Когато бащата на Сияна Николай Попов казва, че българската държава е опасна за гражданите си, че убива децата си, това е истината, не просто реакция в състояние на шок. Ако не беше така настойчив, смъртта на единственото му дете щеше да е част от статистиката – тези близо 30 български деца, които губят живота си в катастрофи всяка година.
Според доклад на УНИЦЕФ средно на ден в света загиват около 500 деца на възраст от 0 до 19 години в резултат на пътнотранспортни произшествия, като над 90% от случаите са в държави с ниски и средни доходи.
Медиите и човешкият образ на трагедията
Но този път медиите поставиха трагедията в центъра на новинарските си потоци не само за да попитат как се чувстват опечалените и да отделят по две минути на репортаж от мястото на катастрофата и реакциите. За съжаление, обществото често реагира по-силно и масово само когато една трагедия придобие медийна видимост.
Смъртта на дете (на пътя) никога не е маловажна, но когато бащата на Сияна се появи по новините – със силни думи, емоция и лице, което хората могат да видят, за да му съчувстват, трагедията получи човешки образ. Наред с това Николай Попов посочи с пръст виновните – лошите пътища, отговорна за които е държавата, и липсата на контрол, за което вина носи отново държавната машина.
Гражданският натиск чрез протести, които ще продължат и на 12–13 април под наслов „България няма повече деца за убиване“, доведе до разкритията, че с действията и бездействията си държавните органи изчерпват най-малко един текст от Наказателния кодекс, например чл. 122 за „причиняване на смърт понепредпазливост“. Тоест не са целили смъртта на когото и да е на пътя, но са я причинили в резултат на небрежност, небрежно поведение или неспазване на законови задължения (поддържане на пътищата, контрол и др.). Със сигурност ще се открият и още нарушения, ако следствието и прокуратурата си свършат работата.
Фактите
На пътя Телиш–Радомирци, част от първокласния път I-3, свързващ Ботевград и Плевен, не е правен основен ремонт от 2002 г. За изминалите 23 години само е изкърпван тук-там. От месеци по него е пренасочен и целият транзитен трафик от двата моста на Дунав, тъй като пътят Мездра–Ботевград е затворен за реконструкция.
Политиците започнаха с взаимните обвинения. Настоящият регионален министър Иван Иванов (БСП) хвърля вината върху други преди него, например служебния министър Иван Шишков (2022–2023), който в качеството на експерт обвини огромния поток от тирове. Друг министър на строителството, понастоящем депутат в 51-вото НС – Андрей Цеков (ПП), част от кабинета „Денков“, даде някакво обяснение. Още през 2022 г. Агенция „Пътна инфраструктура“ (АПИ) установява, че участъкът е в „изключително лошо експлоатационно състояние, което не може да бъде поправено чрез превантивно или текущо поддържане, а изисква основен ремонт“.
Обявена е обществена поръчка за технически проект за основния ремонт за 1,063 млн. лв., разплатена е до пролетта на 2024 г., но въпреки това АПИ не е възложила този ремонт. Но пък възлага 35 000 кв.м кръпки. През лятото на 2024 г. Държавната агенция за безопасност на движението по пътищата изпраща доклад на АПИ, че участъкът е с повишена аварийност и висок риск за пътнотранспортни произшествия. Въпреки това първото съобщение на АПИ на 1 април, след като тирът удря насрещно движещия се автомобил, в който пътуват бабата, дядото и Сияна, е, че пътят е в добро експлоатационно състояние, защото се разпространяват „манипулативни твърдения за пътния инцидент“.
Регионалният министър Иван Иванов не иска оставката на председателя на Управителния съвет на АПИ Йордан Вълчев, която пък поискаха от ПП–ДБ (вероятно в опит да се разграничат от Вълчев). Вълчев бе назначен в управата на АПИ със заповед на министър Андрей Цеков, чиято трудова биография е тясно свързана с „Главболгарстрой“. А при служебния кабинет на Димитър Главчев Вълчев оглави АПИ. И сега нагло заявява, че в предходните години не е извършвана нормална пътна поддръжка в участъка, вместо да даде обяснения защо не е разпореден ремонт, а кръпки.
И тъй като няма как да се размине без наказани служители, от АПИ е уволнен шефът на „Поддръжка на пътната инфраструктура“ Даниел Иваничков с прозвище Касичката според бащата на Сияна.
А лидерът на ГЕРБ и Велик-строител-на-пътища Борисов жалее за асфалта.
За 1300 години България никога не се е славила с добри пътища. Само толсистемата може да дисциплинира водачите – и скорост, и товари.
Обещанията
Основният ремонт на пътя Луковит–Плевен ще започне веднага след като се направи проходимост между Ботевград и Мездра и се пусне лот 1 на АМ „Хемус“, обеща регионалният министър. Според него участъкът Ботевград–Мездра ще бъде пуснат за движение в края на юни и трафикът, който сега минава покрай Телиш, ще се върне в „естественото си трасе“. Очаква се цялото трасе Ботевград–Видин да бъде готово до 2029 г.
Първоначално завършването на скоростния път между Мездра и Ботевград бе планирано за 2025 г., но срокът беше удължен до юни 2026 г. Причините за забавянето включват появата на седем свлачища по трасето, за които се изготвят технически решения и укрепителни проекти.
Правителството обяви 37 мерки в опит да намали с 20% жертвите на пътя и срещу всяка една от тях са посочени срок и министър, отговорен за изпълнението ѝ. Кабинетът би могъл да спечели значителен ресурс обществено доверие, ако изпълни и част от тях, например да се ремонтират набелязаните 36 високорискови участъци и камерите на толсистемата да се ползват за установяване на шофьори нарушители. Ако нещо би гарантирало по-дълъг живот на правителството на Росен Желязков, това е успехът във войната по пътищата, не еврозоната.
Сега оборудваме 6 денонощни поста, в които ДАИ, МВР, НАП и горски служители ще дежурят по маршрутите на международните тирове и ще проверяват,
съобщи вицепремиерът и министър на транспорта и съобщенията Гроздан Караджов.
За трикратния премиер Бойко Борисов проблемът е във високата скорост, тоест в неспазването на законите за движение по пътищата. Борисов не споменава некачествената пътна настилка, която не отговаря на стандартите за сцепление, нито пък защо по високорисковите пътища не дежурят повече полицаи, което не би позволило на нарушителите да остават безнаказани, докато не убият някого. Изтритата маркировка и липсващата сигнализация на пътя Телиш–Радомирци бяха сложени след смъртта на Сияна.
Има един въпрос, чийто отговор никога няма да научим:
колко от милиардите, отпуснати за пътища в последните 15 години, още от времето на Бойко Борисов, действително са вложени в пътища, а не в чували.
Ако на чувалите с кеш не се сложи край, чувалите с трупове ще стават все повече.
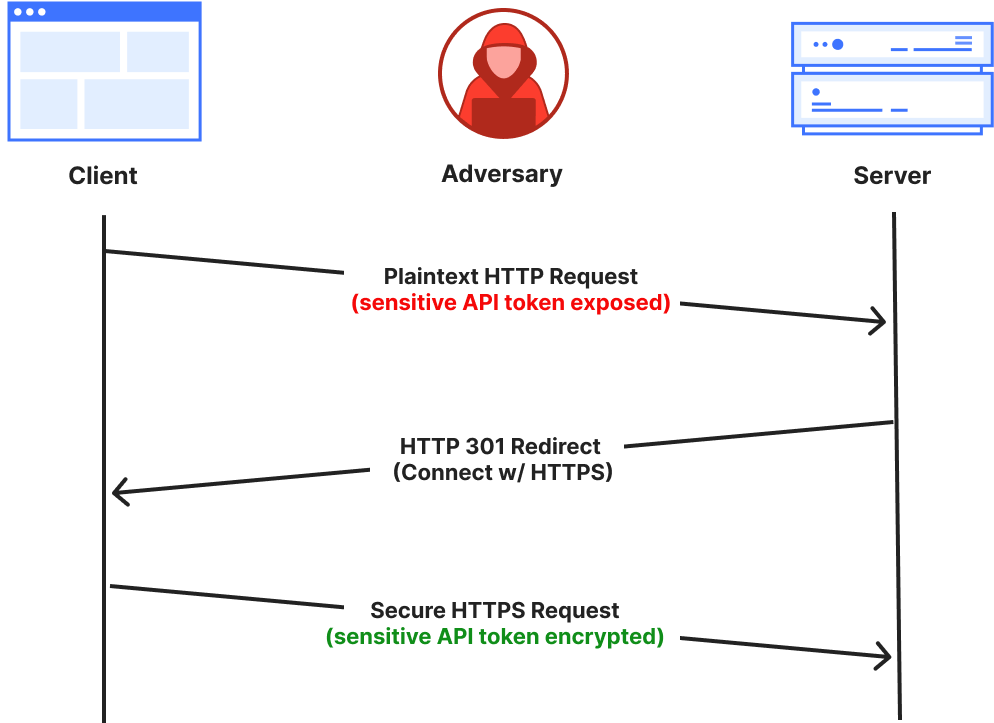
Connections made over cleartext HTTP ports risk exposing sensitive information because the data is transmitted unencrypted and can be intercepted by network intermediaries, such as ISPs, Wi-Fi hotspot providers, or malicious actors on the same network. It’s common for servers to either redirect or return a 403 (Forbidden) response to close the HTTP connection and enforce the use of HTTPS by clients. However, by the time this occurs, it may be too late, because sensitive information, such as an API token, may have already been transmitted in cleartext in the initial client request. This data is exposed before the server has a chance to redirect the client or reject the connection.
A better approach is to refuse the underlying cleartext connection by closing the network ports used for plaintext HTTP, and that’s exactly what we’re going to do for our customers.
Today we’re announcing that we’re closing all of the HTTP ports on api.cloudflare.com. We’re also making changes so that api.cloudflare.com can change IP addresses dynamically, in line with on-going efforts to decouple names from IP addresses, and reliably managing addresses in our authoritative DNS. This will enhance the agility and flexibility of our API endpoint management. Customers relying on static IP addresses for our API endpoints will be notified in advance to prevent any potential availability issues.
In addition to taking this first step to secure Cloudflare API traffic, we’ll release the ability for customers to opt-in to safely disabling all HTTP port traffic for their websites on Cloudflare. We expect to make this free security feature available in the last quarter of 2025.
We have consistentlyadvocated for strong encryption standards to safeguard users’ data and privacy online. As part of our ongoing commitment to enhancing Internet security, this blog post details our efforts to enforce HTTPS-only connections across our global network.
Understanding the problem
We already provide an “Always Use HTTPS” setting that can be used to redirect all visitor traffic on our customers’ domains (and subdomains) from HTTP (plaintext) to HTTPS (encrypted). For instance, when a user clicks on an HTTP version of the URL on the site (http://www.example.com), we issue an HTTP 3XX redirection status code to immediately redirect the request to the corresponding HTTPS version (https://www.example.com) of the page. While this works well for most scenarios, there’s a subtle but important risk factor: What happens if the initial plaintext HTTP request (before the redirection) contains sensitive user information?
Initial plaintext HTTP request is exposed to the network before the server can redirect to the secure HTTPS connection.
Third parties or intermediaries on shared networks could intercept sensitive data from the first plaintext HTTP request, or even carry out a Monster-in-the-Middle (MITM) attack by impersonating the web server.
One may ask if HTTP Strict Transport Security (HSTS) would partially alleviate this concern by ensuring that, after the first request, visitors can only access the website over HTTPS without needing a redirect. While this does reduce the window of opportunity for an adversary, the first request still remains exposed. Additionally, HSTS is not applicable by default for most non-user-facing use cases, such as API traffic from stateless clients. Many API clients don’t retain browser-like state or remember HSTS headers they’ve encountered. It is quite common practice for API calls to be redirected from HTTP to HTTPS, and hence have their initial request exposed to the network.
Therefore, in line with our culture of dogfooding, we evaluated the accessibility of the Cloudflare API (api.cloudflare.com) over HTTP ports (80, and others). In that regard, imagine a client making an initial request to our API endpoint that includes their secret API key. While we outright reject all plaintext connections with a 403 Forbidden response instead of redirecting for API traffic — clearly indicating that “Cloudflare API is only accessible over TLS” — this rejection still happens at the application layer. By that point, the API key may have already been exposed over the network before we can even reject the request. We do have a notification mechanism in place to alert customers and rotate their API keys accordingly, but a stronger approach would be to eliminate the exposure entirely. We have an opportunity to improve!
A better approach to API security
Any API key or token exposed in plaintext on the public Internet should be considered compromised. We can either address exposure after it occurs or prevent it entirely. The reactive approach involves continuously tracking and revoking compromised credentials, requiring active management to rotate each one. For example, when a plaintext HTTP request is made to our API endpoints, we detect exposed tokens by scanning for ‘Authorization’ header values.
In contrast, a preventive approach is stronger and more effective, stopping exposure before it happens. Instead of relying on the API service application to react after receiving potentially sensitive cleartext data, we can preemptively refuse the underlying connection at the transport layer, before any HTTP or application-layer data is exchanged. The preventative approach can be achieved by closing all plaintext HTTP ports for API traffic on our global network. The added benefit is that this is operationally much simpler: by eliminating cleartext traffic, there’s no need for key rotation.
The transport layer carries the application layer data on top.
To explain why this works: an application-layer request requires an underlying transport connection, like TCP or QUIC, to be established first. The combination of a port number and an IP address serves as a transport layer identifier for creating the underlying transport channel. Ports direct network traffic to the correct application-layer process — for example, port 80 is designated for plaintext HTTP, while port 443 is used for encrypted HTTPS. By disabling the HTTP cleartext server-side port, we prevent that transport channel from being established during the initial “handshake” phase of the connection — before any application data, such as a secret API key, leaves the client’s machine.
Both TCP and QUIC transport layer handshakes are a pre-requisite for HTTPS application data exchange on the web.
Therefore, closing the HTTP interface entirely for API traffic gives a strong and visible fast-failure signal to developers that might be mistakenly accessing http://… instead of https://… with their secret API keys in the first request — a simple one-letter omission, but one with serious implications.
In theory, this is a simple change, but at Cloudflare’s global scale, implementing it required careful planning and execution. We’d like to share the steps we took to make this transition.
Understanding the scope
In an ideal scenario, we could simply close all cleartext HTTP ports on our network. However, two key challenges prevent this. First, as shown in the Cloudflare Radar figure below, about 2-3% of requests from “likely human” clients to our global network are over plaintext HTTP. While modern browsers prominently warn users about insecure HTTP connections and offer features to silently upgrade to HTTPS, this protection doesn’t extend to the broader ecosystem of connected devices. IoT devices with limited processing power, automated API clients, or legacy software stacks often lack such safeguards entirely. In fact, when filtering on plaintext HTTP traffic that is “likely automated”, the share rises to over 16%! We continue to see a wide variety of legacy clients accessing resources over plaintext connections. This trend is not confined to specific networks, but is observable globally.
Closing HTTP ports, like port 80, across our entire IP address space would block such clients entirely, causing a major disruption in services. While we plan to cautiously start by implementing the change on Cloudflare’s API IP addresses, it’s not enough. Therefore, our goal is to ensure all of our customers’ API traffic benefits from this change as well.
Breakdown of HTTP and HTTPS for ‘human’ connections
The second challenge relates to limitations posed by the longstanding BSD Sockets API at the server-side, which we have addressed using Tubular, a tool that inspects every connection terminated by a server and decides which application should receive it. Operators historically have faced a challenging dilemma: either listen to the same ports across many IP addresses using a single socket (scalable but inflexible), or maintain individual sockets for each IP address (flexible but unscalable). Luckily, Tubular has allowed us to resolve this using ‘bindings’, which decouples sockets from specific IP:port pairs. This creates efficient pathways for managing endpoints throughout our systems at scale, enabling us to handle both HTTP and HTTPS traffic intelligently without the traditional limitations of socket architecture.
Step 0, then, is about provisioning both IPv4 and IPv6 address space on our network that by default has all HTTP ports closed. Tubular enables us to configure and manage these IP addresses differently than others for our endpoints. Additionally, Addressing Agility and Topaz enable us to assign these addresses dynamically, and safely, for opted-in domains.
Moving from strategy to execution
In the past, our legacy stack would have made this transition challenging, but today’s Cloudflare possesses the appropriate tools to deliver a scalable solution, rather than addressing it on a domain-by-domain basis.
Using Tubular, we were able to bind our new set of anycast IP prefixes to our TLS-terminating proxies across the globe. To ensure that no plaintext HTTP traffic is served on these IP addresses, we extended our global iptables firewall configuration to reject any inbound packets on HTTP ports.
As a result, any connections to these IP addresses on HTTP ports are filtered and rejected at the transport layer, eliminating the need for state management at the application layer by our web proxies.
The next logical step is to update the DNS assignments so that API traffic is routed over the correct IP addresses. In our case, we encoded a new DNS policy for API traffic for the HTTPS-only interface as a declarative Topaz program in our authoritative DNS server:
The above policy encodes that for any DNS query targeting the ‘API traffic’ class, we return the respective HTTPS-only interface IP addresses. Topaz’s safety guarantees ensure exclusivity, preventing other DNS policies from inadvertently matching the same queries and misrouting plaintext HTTP expected domains to HTTPS-only IPs
api.cloudflare.com is the first domain to be added to our HTTPS-only API traffic class, with other applicable endpoints to follow.
Opting-in your API endpoints
As we said above, we’ve started with api.cloudflare.com and our internal API endpoints to thoroughly monitor any side effects on our own systems before extending this feature to customer domains. We have deployed these changes gradually across all data centers, leveraging Topaz’s flexibility to target subsets of traffic, minimizing disruptions, and ensuring a smooth transition.
To monitor unencrypted connections for your domains, before blocking access using the feature, you can review the relevant analytics on the Cloudflare dashboard. Log in, select your account and domain, and navigate to the “Analytics & Logs” section. There, under the “Traffic Served Over SSL” subsection, you will find a breakdown of encrypted and unencrypted traffic for your site. That data can help provide a baseline for assessing the volume of plaintext HTTP connections for your site that will be blocked when you opt in. After opting in, you would expect no traffic for your site will be served over plaintext HTTP, and therefore that number should go down to zero.
Snapshot of ‘Traffic Served Over SSL’ section on Cloudflare dashboard
Towards the last quarter of 2025, we will provide customers the ability to opt in their domains using the dashboard or API (similar to enabling the Always Use HTTPS feature). Stay tuned!
Wrapping up
Starting today, any unencrypted connection to api.cloudflare.com will be completely rejected. Developers should not expect a 403 Forbidden response any longer for HTTP connections, as we will prevent the underlying connection to be established by closing the HTTP interface entirely. Only secure HTTPS connections will be allowed to be established.
We are also making updates to transition api.cloudflare.com away from its static IP addresses in the future. As part of that change, we will be discontinuing support for non-SNI legacy clients for Cloudflare API specifically — currently, an average of just 0.55% of TLS connections to the Cloudflare API do not include an SNI value. These non-SNI connections are initiated by a small number of accounts. We are committed to coordinating this transition and will work closely with the affected customers before implementing the change. This initiative aligns with our goal of enhancing the agility and reliability of our API endpoints.
Beyond the Cloudflare API use case, we’re also exploring other areas where it’s safe to close plaintext traffic ports. While the long tail of unencrypted traffic may persist for a while, it shouldn’t be forced on every site.
In the meantime, a small step like this can allow us to have a big impact in helping make a better Internet, and we are working hard to reliably bring this feature to your domains. We believe security should be free for all!
Amazon Simple Email Service (SES) is a cloud-based email sending service provided by Amazon Web Services (AWS), handling both inbound and outbound email traffic for your applications. It allows users to send and receive email using SES’s reliable and cost-effective infrastructure without having to provision email servers yourself. Customers use Amazon SES to send emails like one time passwords (OTPs), transactional emails such as order confirmation, and promotional/marketing emails.
For this post, you should be familiar with the following:
Amazon SES continues to evolve, offering new features that help you simplify and optimize your email campaigns. We’re excited to announce the addition of inline template support for both the SendEmail and SendBulkEmail APIs. This new capability allows you to include template content directly in your API requests, reducing complexity and eliminating the need to manage separate template resources in your SES account.
What are inline templates?
Inline templates allow you to provide the subject, HTML body, and text body of an email directly in the API request, along with dynamic placeholders for personalized content. Instead of creating and storing a separate email template in SES, you can define the template as part of your API call. This feature is especially useful for organizations that need flexibility in managing numerous templates or want to make quick adjustments to email content.
How inline templates simplify your workflow
Previously, Amazon SES required you to create and store email templates in your SES account, which you would then reference by name or Amazon Resource Name (ARN) when sending an email. This process adds some management overhead, particularly for organizations that frequently create new templates or exceed the limit of templates per AWS Region. With inline templates, you can reduce complexity by defining your email content directly in the API payload, avoiding the need to create and manage stored templates. This approach can improve flexibility, allowing you to quickly make changes to your email content without updating stored templates. Additionally, it can simplify your integration by providing template content directly within your application logic, making the process more seamless and efficient. When using the and SendBulkEmail API, you can include personalized content for up to 50 destinations in a single call, making large-scale communication more efficient.
How to use inline templates
To use inline templates, you simply provide the email content (subject, text, HTML) and the replacement data directly in the SendBulkEmail API request payload within TemplateContent parameter.
Here’s an example for using the SendBulkEmail API with inline templates:
If you’re currently using stored templates, don’t worry – Amazon SES still supports the use of stored templates, and you can continue to use them without any changes. Inline templates are simply an additional option for customers who need more flexibility or wish to avoid managing stored templates altogether. Since inline templates only support the use of simple substitution, stored templates remain the solution for advanced personalization options such as conditional logic or complex formatting. More details in our doc link: How to use Bulk email template.
Get started today
The inline template feature is now available in all AWS Regions where Amazon SES is offered. To start using inline templates, refer to the Amazon SES Developer Guide and what’s new announcement. There are no additional charges applicable for using inline template feature.
Conclusion
The inline templating feature in SendBulkEmail allows you to avoid worrying about template management by updating / creating new email templates whenever a minor modification or alteration is required in the existing templates, as well as cleaning up unused templates on a regular basis. Therefore, if your business has a high number of email template requirements, there are no predefined rules or patterns for creating email templates, and you need to generate many templates simultaneously within Amazon SES, you must use inline templating feature of SendBulkEmail API . If you do not want to use the Inline templating capability, you can continue to use the templated SendBulkEmail API from Amazon SES.
In this article, we will explore a practical example of using the zabbix_utils library to solve a non-trivial task – obtaining a list of alert recipients for triggers associated with a specific Zabbix host. You will learn how to easily automate the process of collecting this information, and see examples of real code that can be adapted to your needs.
Table of Contents
Over the last year, the zabbix_utils library has become one of the most popular tools for working with the Zabbix API. It is a convenient tool that simplifies interacting with the Zabbix server, proxy, or agent, especially for those who automate monitoring and management tasks.
Due to its ease of use and extensive functionality, zabbix_utils has found a following among system administrators, monitoring, and DevOps engineers. According to data from PyPI, the library has already been downloaded over 140,000 times since its release, confirming its demand within the community. It’s all thanks to you and your attention to zabbix_utils!
Task Description
Administrators often need to check which Zabbix users receive alerts for specific triggers in the Zabbix monitoring system. This can be useful for auditing, configuring new notifications, or simply for a quick diagnosis of issues. The task becomes especially relevant when you have plenty of hosts containing numerous triggers, and manually checking the recipients for each trigger through the Zabbix interface becomes very time-consuming.
In such cases, it is advisable to use a custom solution based on the Zabbix API. You can directly access all the required data using the API, and then use additional logic to determine the final alert recipients. The zabbix_utils library makes working with the Zabbix API more convenient and allows you to automate this process. In this project, we use the zabbix_utils library to write a Python script that collects a list of alert recipients for the triggers of the selected Zabbix host. This will allow you to obtain the necessary information faster and with minimal effort.
Environment Setup and Installation
To get started with zabbix_utils, you need to install the library and configure the connection to the Zabbix API. This article provides more details and examples on getting started with the library. However, it would be better if I describe the basic steps to prepare the environment here.
The library supports several installation methods described in the official README, making it convenient for use in different environments.
1. Installation via pip
The simplest and most common installation method is using the pip package manager. To do this, execute the command:
~$ pip install zabbix_utils
To install all necessary dependencies for asynchronous work, you can use the command:
~$ pip install zabbix_utils[async]
This method is suitable for most users, as pip automatically installs all required dependencies.
2. Installation from Zabbix Repository
Since writing the previous articles, we have added one more installation method – from the official Zabbix repository. First and foremost, you need to add the repository to your system if it has not been installed yet. Official Zabbix packages for Red Hat Enterprise Linux and Debian-based distributions are available on the Zabbix website.
For Red Hat Enterprise Linux and derivatives:
~# dnf install python3-zabbix-utils
For Debian / Ubuntu and derivatives:
~# apt install python3-zabbix-utils
3. Installation from Source Code
If you require the latest version of the library that has not yet been published on PyPI, or you want to customize the code, you can install the library directly from GitHub:
After installing zabbix_utils, it is a good idea to check the connection to your Zabbix server via the API. To do this, use the URL to the Zabbix server, the token, or the username and password of the user who has permission to access the Zabbix API.
Now that the environment is set up, let’s look at the main steps for solving the task of retrieving the list of alert recipients for triggers associated with a specific Zabbix host in Zabbix.
In zabbix_utils, asynchronous API interaction support is built in through the AsyncZabbixAPI class. This allows multiple requests to be sent simultaneously and their results to be handled as they become ready, significantly reducing latencies when making multiple API calls. Therefore, we will use the AsyncZabbixAPI class and the asynchronous approach in this project.
Below are the main steps for solving the task, and code examples for each step. Please note that the code in this project is for demonstration purposes, may not be optimal, or could contain errors. Use it as an example or a base for your project, but not as a complete tool.
Step 1. Obtain Host ID
The first step is to identify the host for which we will retrieve information about triggers and alerts. We need to find the hostid using its name/host to do this. The Zabbix API provides a method to obtain this information, and using zabbix_utils makes this process much simpler.
This method returns a unique identifier for the host, which can be used further. However, for our test project, we will use a manually specified host identifier.
Step 2. Retrieve Host Triggers
With the hostid in hand, the next step is to retrieve all triggers associated with this host. Triggers contain the conditions that trigger the alerts. We need to collect information about all triggers so that we can then use it to select actions that match all the conditions.
This request returns complete information about the triggers for the host. We get not only the triggers but also their tags, associated host and host groups, and discovery rule information. All this information will be necessary to check the conditions of the actions.
Step 3. Initialize Trigger Metadata
At this stage, objects for each trigger are created to store their metadata. This is done using the Trigger class, which includes information about the trigger such as its name, ID, associated host groups, hosts, tags, templates, and operations.
Here’s the code defining the Trigger class:
classTrigger:def__init__(self, trigger):self.name=trigger["description"]self.triggerid=trigger["triggerid"]self.hostgroups= [g["groupid"] forgintrigger["hostgroups"]]self.hosts= [h["hostid"] forhintrigger["hosts"]]self.tags= {t["tag"]: t["value"] fortintrigger["tags"]}self.tmpl_triggerid=self.triggeridself.lld_rule=trigger["discoveryRule"] or {}iftrigger["templateid"] !="0":self.tmpl_triggerid=trigger["templateid"]self.templates= []self.messages= []self._conditions= {"0": self.hostgroups,"1": self.hosts,"2": [self.triggerid],"3": trigger["event_name"] ortrigger["description"],"4": trigger["priority"],"13": self.templates,"25": self.tags.keys(),"26": self.tags, }defeval_condition(self, operator, value, trigger_data):# equals or does not equalifoperatorin ["0", "1"]:equals=operator=="0"ifisinstance(value, dict) andisinstance(trigger_data, dict):ifvalue["tag"] intrigger_data:ifvalue["value"] ==trigger_data[value["tag"]]:returnequalselifvalueintrigger_dataandisinstance(trigger_data, list):returnequalselifvalue==trigger_data:returnequalsreturnnotequals# contains or does not containifoperatorin ["2", "3"]:contains=operator=="2"ifisinstance(value, dict) andisinstance(trigger_data, dict):ifvalue["tag"] intrigger_data:ifvalue["value"] intrigger_data[value["tag"]]:returncontainselifvalueintrigger_data:returncontainsreturnnotcontains# is greater/less than or equalsifoperatorin ["5", "6"]:greater=operator!="5"try:ifint(value) <int(trigger_data):returnnotgreaterifint(value) ==int(trigger_data):returnTrueifint(value) >int(trigger_data):returngreaterexcept:raiseValueError("Values must be numbers to compare them" )defselect_templates(self, templates):fortemplateintemplates:ifself.tmpl_triggeridin [t["triggerid"] fortintemplate["triggers"]]:self.templates.append(template["templateid"])ifself.lld_rule.get("templateid") in [d["itemid"] fordintemplate["discoveries"] ]:self.templates.append(template["templateid"])defselect_actions(self, actions):selected_actions= []foractioninactions:conditions= []if"filter"inaction:conditions=action["filter"]["conditions"]eval_formula=action["filter"]["eval_formula"]# Add actions without conditions directlyifnotconditions:selected_actions.append(action)continuecondition_check= {}forconditioninconditions:if (condition["conditiontype"] !="6"andcondition["conditiontype"] !="16" ):if (condition["conditiontype"] =="26"andisinstance(condition["value"], str) ):condition["value"] = {"tag": condition["value2"],"value": condition["value"], }ifcondition["conditiontype"] inself._conditions:condition_check[condition["formulaid"] ] =self.eval_condition(condition["operator"],condition["value"],self._conditions[condition["conditiontype"] ], )else:condition_check[condition["formulaid"] ] =Trueforformulaid, bool_resultincondition_check.items():eval_formula=eval_formula.replace(formulaid, str(bool_result))
# Evaluate the final condition formulaifeval(eval_formula):selected_actions.append(action)returnselected_actionsdefselect_operations(self, actions, mediatypes):messages_metadata= []foractioninself.select_actions(actions):messages_metadata+=self.check_operations("operations", action, mediatypes )messages_metadata+=self.check_operations("update_operations", action, mediatypes )messages_metadata+=self.check_operations("recovery_operations", action, mediatypes )returnmessages_metadata
defcheck_operations(self, optype, action, mediatypes):messages_metadata= []optype_mapping= {"operations": "0", # Problem event"recovery_operations": "1", # Recovery event"update_operations": "2", # Update event }operations=copy.deepcopy(action[optype])# Processing "notify all involved" scenariosforidx, _inenumerate(operations):ifoperations[idx]["operationtype"] notin ["11", "12"]:continue# Copy operation as a template for reuseop_template=copy.deepcopy(operations[idx])deloperations[idx]# Checking for message sending operationsforkeyin [kforkin ["operations", "update_operations"] ifk!=optype ]:ifnotaction[key]:continue# Checking for message sending type operationsforopin [oforoinaction[key] ifo["operationtype"] =="0" ]:# Copy template for the current operationoperation=copy.deepcopy(op_template)operation.update( {"operationtype": "0","opmessage_usr": op["opmessage_usr"],"opmessage_grp": op["opmessage_grp"], } )operation["opmessage"]["mediatypeid"] =op["opmessage" ]["mediatypeid"]operations.append(operation)foroperationinoperations:ifoperation["operationtype"] !="0":continue# Processing "all mediatypes" scenarioifoperation["opmessage"]["mediatypeid"] =="0":formediatypeinmediatypes:operation["opmessage"]["mediatypeid"] =mediatype["mediatypeid" ]messages_metadata.append(self.create_messages(optype_mapping[optype], action, operation, [mediatype ] ) )else:messages_metadata.append(self.create_messages(optype_mapping[optype],action,operation,mediatypes ) )returnmessages_metadatadefcreate_messages(self, optype, action, operation, mediatypes):message=Message(optype, action, operation)message.select_mediatypes(mediatypes)self.messages.append(message)returnmessage
The code for creating Trigger class objects for each of the retrieved triggers:
This loop iterates through all triggers and saves them in a dictionary called triggers_metadata, where the key is the triggerid and the value is the trigger object.
Step 4. Retrieve Template Information
The next step is to obtain data about the templates associated with all the triggers:
This request returns information about all templates linked to the host’s triggers being examined. Executing a single query for all triggers is a more optimal solution than making individual requests for each trigger. This information will be needed for evaluating the “Template” condition in actions.
Step 5. Get Actions and Media Types
Next, we obtain the list of actions and media types configured in the system:
Here we retrieve actions that define how and to whom alerts are sent, and mediatypes through which users can receive notifications (for example, email or SMS).
Step 6. Match Triggers with Templates and Actions
At this stage, each trigger is associated with the corresponding templates and actions:
Here, for each trigger, we update information about its templates and configured actions for sending notifications. The list of associated actions is determined by checking the conditions specified in them against the accumulated data for each trigger.
For each operation of the corresponding trigger action, a Message class object is created:
classMessage:def__init__(self, optype, action, operation):self.optype=optypeself.mediatypename=""self.actionid=action["actionid"]self.actionname=action["name"]self.operationid=operation["operationid"]self.mediatypeid=operation["opmessage"]["mediatypeid"]self.subject=operation["opmessage"]["subject"]self.message=operation["opmessage"]["message"]self.default_msg=operation["opmessage"]["default_msg"]self.users= [u["userid"] foruinoperation["opmessage_usr"]]self.groups= [g["usrgrpid"] forginoperation["opmessage_grp"]]self.recipients= []# Escalation period set to action's period if not specifiedself.esc_period=operation.get("esc_period", "0")ifself.esc_period=="0":self.esc_period=action["esc_period"]# Use action's escalation period if unsetself.esc_step_from=self.multiply_time(self.esc_period, int(operation.get("esc_step_from", "1")) -1 )ifoperation.get("esc_step_to", "0") !="0":self.repeat_count=str(int(operation["esc_step_to"]) -int(operation["esc_step_from"]) +1 )# If not a problem event, set repeat count to 1elifself.optype!="0":self.repeat_count="1"# Infinite repeat count if esc_step_to is 0else:self.repeat_count=“∞”defmultiply_time(self, time_str, multiplier):# Multiply numbers within the time stringresult=re.sub(r"(\d+)",lambdam: str(int(m.group(1)) *multiplier),time_str )ifresult[0] =="0":return"0"returnresultdefselect_mediatypes(self, mediatypes):formediatypeinmediatypes:ifmediatype["mediatypeid"] ==self.mediatypeid:self.mediatypename=mediatype["name"]# Select message templates related to operation typemsg_template= [mforminmediatype["message_templates"]if (m["recovery"] ==self.optypeandm["eventsource"] =="0" ) ]# Use default message if applicableifmsg_templateandself.default_msg=="1":self.subject=msg_template[0]["subject"]self.message=msg_template[0]["message"]defselect_recipients(self, user_groups, recipients):forgroupidinself.groups:ifgroupidinuser_groups:self.users+=user_groups[groupid]foruseridinself.users:ifuseridinrecipients:recipient=copy.deepcopy(recipients[userid])ifself.mediatypeidinrecipient.sendto:recipient.mediatype =Trueself.recipients.append(recipient)
Each such object represents a separate message sent to users (recipients) and will contain all message information – its subject, text, recipients, and escalation parameters.
Step 7. Collect User and Group Identifiers
After matching the triggers with actions, the process of collecting unique identifiers for users and groups starts:
This code snippet collects the IDs of all users and groups involved in the operations for each trigger. This is necessary to perform only one request to the Zabbix API for all involved users and their groups, rather than making separate requests for each trigger.
Step 8. Obtain User and Group Information
The next step is to collect detailed information about users and user groups:
Here we gather data about users, including their role and media types through which they receive notifications, as well as data about user groups, including access rights to host groups and the list of users in each group. All this information will be needed to check access to the host with the triggers we are working with.
Step 9. Match Users and Groups with Triggers
After obtaining user information, we match users and groups with their respective rights to receive notifications. Here we also link users with groups, updating the information regarding rights and groups for each user.
foruseridin userids:ifuseridin users:user= users[userid] recipients[userid] =Recipient(user)forgroupinuser["usrgrps"]:ifgroup["usrgrpid"] in usergroups: recipients[userid].permissions.update([h["id"]forhin usergroups[group["usrgrpid"]]["hostgroup_rights"]ifint(h["permission"]) >1 ])forgroupidin groupids:ifgroupidin usergroups:group= usergroups[groupid] user_groups[group["usrgrpid"]] = []foruseringroup["users"]: user_groups[group["usrgrpid"]].append(user["userid"])ifuser["userid"] in recipients: recipients[user["userid"]].groups.update(group["usrgrpid"])elifuser["userid"] in users: recipients[user["userid"]] =Recipient(users[user["userid"]]) recipients[user["userid"]].permissions.update([h["id"]forhingroup["hostgroup_rights"]ifint(h["permission"]) >1 ])
This code fragment connects each user with their groups and vice versa, creating a complete list of users with their access rights to the host, and thus their eligibility to receive notifications about events for this host.
For each recipient, a Recipient class object is created containing data about the recipient, such as the notification address, access rights to hosts, configured mediatypes, etc.
Here’s the code that describes the Recipient class:
classRecipient:def__init__(self, user):self.userid=user["userid"]self.username=user["username"]self.fullname="{name}{surname}".format(**user).strip()self.type=user["role"]["type"]self.groups=set([g["usrgrpid"] forginuser["usrgrps"]])self.has_right=Falseself.permissions=set()self.sendto= {m["mediatypeid"]: m["sendto"] forminuser["medias"] ifm["active"] =="0" }# Check if the user is a super admin (type 3)ifself.type=="3":self.has_right=True
Step 10. Match Messages with Recipients
Finally, we match recipients with specific messages from Step 6:
This step completes the main process – each message is assigned to the relevant recipients.
Step 11. Check Recipient Access Rights and Output the Result
Before the actual output of the result with the list of recipients, we can perform a check of the recipients’ message rights and filter only those who have the corresponding rights to receive notifications for the events related to the trigger, or those who have all configured media types specified and active. After these actions, the information can be output in any convenient way – whether it be exporting to a file or displaying it on the screen:
All the examples and code snippets described above have been compiled to create a solution demonstrating the algorithm for obtaining notification recipients for triggers associated with the selected host. We have implemented this algorithm as a simple web interface to make the result more illustrative and convenient for familiarization.
This interface allows users to enter the host’s ID. The script then processes the data and provides a list of notification recipients associated with the triggers on that host. The web interface uses asynchronous requests to the Zabbix API and the zabbix_utils library to ensure fast data processing and ease of use with many triggers and users.
This lets you familiarize yourself with the theoretical steps and code examples and also try to put this solution into action.
Please note once again that the code in this project is for demonstration purposes, may not be optimal, or could contain errors. Use it as an example or a base for your project, but not as a complete tool.
The web interface’s complete source code and installation instructions can be found on GitHub.
Conclusion
In this article, we explored a practical example of using the zabbix_utils library to solve the task of obtaining alert recipients for triggers associated with a selected Zabbix host using the Zabbix API. We detailed the key steps, from setting up the environment and initializing trigger metadata to working with notification recipients and optimizing performance with asynchronous requests.
Using zabbix_utils allowed us to optimize and accelerate interaction with the Zabbix API, expanding the capabilities of the Zabbix web interface and increasing efficiency when working with large volumes of data. Thanks to support for asynchronous processing and selective API requests, it is possible to significantly reduce the load on the server and improve system performance when working with Zabbix, which is especially important in large infrastructures.
We hope this example will assist you in implementing your own solutions based on the Zabbix API and zabbix_utils, and demonstrate the possibilities for optimizing your interaction with the Zabbix API.
According to a survey done by W3Techs, as of October 2024, Cloudflare is used as an authoritative DNS provider by 14.5% of all websites. As an authoritative DNS provider, we are responsible for managing and serving all the DNS records for our clients’ domains. This means we have an enormous responsibility to provide the best service possible, starting at the data plane. As such, we are constantly investing in our infrastructure to ensure the reliability and performance of our systems.
DNS is often referred to as the phone book of the Internet, and is a key component of the Internet. If you have ever used a phone book, you know that they can become extremely large depending on the size of the physical area it covers. A zone file in DNS is no different from a phone book. It has a list of records that provide details about a domain, usually including critical information like what IP address(es) each hostname is associated with. For example:
example.com      59 IN A 198.51.100.0
blog.example.com 59 IN A 198.51.100.1
ask.example.com  59 IN A 198.51.100.2
It is not unusual for these zone files to reach millions of records in size, just for a single domain. The biggest single zone on Cloudflare holds roughly 4 million DNS records, but the vast majority of zones hold fewer than 100 DNS records. Given our scale according to W3Techs, you can imagine how much DNS data alone Cloudflare is responsible for. Given this volume of data, and all the complexities that come at that scale, there needs to be a very good reason to move it from one database cluster to another.
Why migrate
When initially measured in 2022, DNS data took up approximately 40% of the storage capacity in Cloudflare’s main database cluster (cfdb). This database cluster, consisting of a primary system and multiple replicas, is responsible for storing DNS zones, propagated to our data centers in over 330 cities via our distributed KV store Quicksilver. cfdb is accessed by most of Cloudflare’s APIs, including the DNS Records API. Today, the DNS Records API is the API most used by our customers, with each request resulting in a query to the database. As such, it’s always been important to optimize the DNS Records API and its surrounding infrastructure to ensure we can successfully serve every request that comes in.
As Cloudflare scaled, cfdb was becoming increasingly strained under the pressures of several services, many unrelated to DNS. During spikes of requests to our DNS systems, other Cloudflare services experienced degradation in the database performance. It was understood that in order to properly scale, we needed to optimize our database access and improve the systems that interact with it. However, it was evident that system level improvements could only be just so useful, and the growing pains were becoming unbearable. In late 2022, the DNS team decided, along with the help of 25 other teams, to detach itself from cfdb and move our DNS records data to another database cluster.
Pre-migration
From a DNS perspective, this migration to an improved database cluster was in the works for several years. Cloudflare initially relied on a single Postgres database cluster, cfdb. At Cloudflare’s inception, cfdb was responsible for storing information about zones and accounts and the majority of services on the Cloudflare control plane depended on it. Since around 2017, as Cloudflare grew, many services moved their data out of cfdb to be served by a microservice. Unfortunately, the difficulty of these migrations are directly proportional to the amount of services that depend on the data being migrated, and in this case, most services require knowledge of both zones and DNS records.
Although the term “zone” was born from the DNS point of view, it has since evolved into something more. Today, zones on Cloudflare store many different types of non-DNS related settings and help link several non-DNS related products to customers’ websites. Therefore, it didn’t make sense to move both zone data and DNS record data together. This separation of two historically tightly coupled DNS concepts proved to be an incredibly challenging problem, involving many engineers and systems. In addition, it was clear that if we were going to dedicate the resources to solving this problem, we should also remove some of the legacy issues that came along with the original solution.
One of the main issues with the legacy database was that the DNS team had little control over which systems accessed exactly what data and at what rate. Moving to a new database gave us the opportunity to create a more tightly controlled interface to the DNS data. This was manifested as an internal DNS Records gRPC API which allows us to make sweeping changes to our data while only requiring a single change to the API, rather than coordinating with other systems. For example, the DNS team can alter access logic and auditing procedures under the hood. In addition, it allows us to appropriately rate-limit and cache data depending on our needs. The move to this new API itself was no small feat, and with the help of several teams, we managed to migrate over 20 services, using 5 different programming languages, from direct database access to using our managed gRPC API. Many of these services touch very important areas such as DNSSEC, TLS, Email, Tunnels, Workers, Spectrum, and R2 storage. Therefore, it was important to get it right.
One of the last issues to tackle was the logical decoupling of common DNS database functions from zone data. Many of these functions expect to be able to access both DNS record data and DNS zone data at the same time. For example, at record creation time, our API needs to check that the zone is not over its maximum record allowance. Originally this check occurred at the SQL level by verifying that the record count was lower than the record limit for the zone. However, once you remove access to the zone itself, you are no longer able to confirm this. Our DNS Records API also made use of SQL functions to audit record changes, which requires access to both DNS record and zone data. Luckily, over the past several years, we have migrated this functionality out of our monolithic API and into separate microservices. This allowed us to move the auditing and zone setting logic to the application level rather than the database level. Ultimately, we are still taking advantage of SQL functions in the new database cluster, but they are fully independent of any other legacy systems, and are able to take advantage of the latest Postgres version.
Now that Cloudflare DNS was mostly decoupled from the zones database, it was time to proceed with the data migration. For this, we built what would become our Change Data Capture and Transfer Service (CDCTS).
Requirements for the Change Data Capture and Transfer Service
The Database team is responsible for all Postgres clusters within Cloudflare, and were tasked with executing the data migration of two tables that store DNS data: cf_rec and cf_archived_rec, from the original cfdb cluster to a new cluster we called dnsdb. We had several key requirements that drove our design:
Don’t lose data. This is the number one priority when handling any sort of data. Losing data means losing trust, and it is incredibly difficult to regain that trust once it’s lost. Important in this is the ability to prove no data had been lost. The migration process would, ideally, be easily auditable.
Minimize downtime. We wanted a solution with less than a minute of downtime during the migration, and ideally with just a few seconds of delay.
These two requirements meant that we had to be able to migrate data changes in near real-time, meaning we either needed to implement logical replication, or some custom method to capture changes, migrate them, and apply them in a table in a separate Postgres cluster.
We first looked at using Postgres logical replication using pgLogical, but had concerns about its performance and our ability to audit its correctness. Then some additional requirements emerged that made a pgLogical implementation of logical replication impossible:
The ability to move data must be bidirectional. We had to have the ability to switch back to cfdb without significant downtime in case of unforeseen problems with the new implementation.
Partition the cf_rec table in the new database. This was a long-desired improvement and since most access to cf_rec is by zone_id, it was decided that mod(zone_id, num_partitions) would be the partition key.
Transferred data accessible from original database. In case we had functionality that still needed access to data, a foreign table pointing to dnsdb would be available in cfdb. This could be used as emergency access to avoid needing to roll back the entire migration for a single missed process.
Only allow writes in one database. Applications should know where the primary database is, and should be blocked from writing to both databases at the same time.
Details about the tables being migrated
The primary table, cf_rec, stores DNS record information, and its rows are regularly inserted, updated, and deleted. At the time of the migration, this table had 1.7 billion records, and with several indexes took up 1.5 TB of disk. Typical daily usage would observe 3-5 million inserts, 1 million updates, and 3-5 million deletes.
The second table, cf_archived_rec, stores copies of cf_rec that are obsolete — this table generally only has records inserted and is never updated or deleted. As such, it would see roughly 3-5 million inserts per day, corresponding to the records deleted from cf_rec. At the time of the migration, this table had roughly 4.3 billion records.
Fortunately, neither table made use of database triggers or foreign keys, which meant that we could insert/update/delete records in this table without triggering changes or worrying about dependencies on other tables.
Ultimately, both of these tables are highly active and are the source of truth for many highly critical systems at Cloudflare.
Designing the Change Data Capture and Transfer Service
There were two main parts to this database migration:
Initial copy: Take all the data from cfdb and put it in dnsdb.
Change copy: Take all the changes in cfdb since the initial copy and update dnsdb to reflect them. This is the more involved part of the process.
Normally, logical replication replays every insert, update, and delete on a copy of the data in the same transaction order, making a single-threaded pipeline. We considered using a queue-based system but again, speed and auditability were both concerns as any queue would typically replay one change at a time. We wanted to be able to apply large sets of changes, so that after an initial dump and restore, we could quickly catch up with the changed data. For the rest of the blog, we will only speak about cf_rec for simplicity, but the process for cf_archived_rec is the same.
What we decided on was a simple change capture table. Rows from this capture table would be loaded in real-time by a database trigger, with a transfer service that could migrate and apply thousands of changed records to dnsdb in each batch. Lastly, we added some auditing logic on top to ensure that we could easily verify that all data was safely transferred without downtime.
Basic model of change data capture
For cf_rec to be migrated, we would create a change logging table, along with a trigger function and a table trigger to capture the new state of the record after any insert/update/delete.
The change logging table named log_cf_rec had the same columns as cf_rec, as well as four new columns:
change_id: a sequence generated unique identifier of the record
action: a single character indicating whether this record represents an [i]nsert, [u]pdate, or [d]elete
change_timestamp: the date/time when the change record was created
change_user: the database user that made the change.
A trigger was placed on the cf_rec table so that each insert/update would copy the new values of the record into the change table, and for deletes, create a ‘D’ record with the primary key value.
Here is an example of the change logging where we delete, re-insert, update, and finally select from the log_cf_rectable. Note that the actual cf_rec and log_cf_rec tables have many more columns, but have been edited for simplicity.
dns_records=# DELETE FROM  cf_rec WHERE rec_id = 13;

dns_records=# SELECT * from log_cf_rec;
Change_id | action | rec_id | zone_id | name
----------------------------------------------
1         | D      | 13     |         |

dns_records=# INSERT INTO cf_rec VALUES(13,299,'cloudflare.example.com');

dns_records=# UPDATE cf_rec SET name = 'test.example.com' WHERE rec_id = 13;

dns_records=# SELECT * from log_cf_rec;
Change_id | action | rec_id | zone_id | name
----------------------------------------------
1         | D      | 13     |         |
2         | I      | 13     | 299     | cloudflare.example.com
3         | U      | 13     | 299     | test.example.com
In addition to log_cf_rec, we also introduced 2 more tables in cfdb and 3 more tables in dnsdb:
cfdb
transferred_log_cf_rec: Responsible for auditing the batches transferred to dnsdb.
log_change_action:Responsible for summarizing the transfer size in order to compare with the log_change_action in dnsdb.
dnsdb
migrate_log_cf_rec:Responsible for collecting batch changes in dnsdb, which would later be applied to cf_rec in dnsdb.
applied_migrate_log_cf_rec:Responsible for auditing the batches that had been successfully applied to cf_rec in dnsdb.
log_change_action:Responsible for summarizing the transfer size in order to compare with the log_change_action in cfdb.
Initial copy
With change logging in place, we were now ready to do the initial copy of the tables from cfdb to dnsdb. Because we were changing the structure of the tables in the destination database and because of network timeouts, we wanted to bring the data over in small pieces and validate that it was brought over accurately, rather than doing a single multi-hour copy or pg_dump. We also wanted to ensure a long-running read could not impact production and that the process could be paused and resumed at any time. The basic model to transfer data was done with a simple psql copy statement piped into another psql copy statement. No intermediate files were used.
psql_cfdb -c "COPY (SELECT * FROM cf_rec WHERE id BETWEEN n and n+1000000 TO STDOUT)" |
psql_dnsdb -c "COPY cf_rec FROM STDIN"
Prior to a batch being moved, the count of records to be moved was recorded in cfdb, and after each batch was moved, a count was recorded in dnsdb and compared to the count in cfdb to ensure that a network interruption or other unforeseen error did not cause data to be lost. The bash script to copy data looked like this, where we included files that could be touched to pause or end the copy (if they cause load on production or there was an incident). Once again, this code below has been heavily simplified.
#!/bin/bash
for i in "$@"; do
   # Allow user to control whether this is paused or not via pause_copy file
   while [ -f pause_copy ]; do
      sleep 1
   done
   # Allow user to end migration by creating end_copy file
   if [ ! -f end_copy ]; then
      # Copy a batch of records from cfdb to dnsdb
      # Get count of records from cfdb
	# Get count of records from dnsdb
 	# Compare cfdb count with dnsdb count and alert if different
   fi
done
Bash copy script
Change copy
Once the initial copy was completed, we needed to update dnsdb with any changes that had occurred in cfdb since the start of the initial copy. To implement this change copy, we created a function fn_log_change_transfer_log_cf_rec that could be passed a batch_id and batch_size, and did 5 things, all of which were executed in a single database transaction:
Select a batch_size of records from log_cf_rec in cfdb.
Copy the batch to transferred_log_cf_rec in cfdb to mark it as transferred.
Delete the batch from log_cf_rec.
Write a summary of the action to log_change_action table. This will later be used to compare transferred records with cfdb.
Return the batch of records.
We then took the returned batch of records and copied them to migrate_log_cf_rec in dnsdb. We used the same bash script as above, except this time, the copy command looked like this:
psql_cfdb -c "COPY (SELECT * FROM fn_log_change_transfer_log_cf_rec(<batch_id>,<batch_size>) TO STDOUT" |
psql_dnsdb -c "COPY migrate_log_cf_rec FROM STDIN"
Applying changes in the destination database
Now, with a batch of data in the migrate_log_cf_rec table, we called a newly created function log_change_apply to apply and audit the changes. Once again, this was all executed within a single database transaction. The function did the following:
Move a batch from the migrate_log_cf_rec table to a new temporary table.
Write the counts for the batch_id to the log_change_action table.
Delete from the temporary table all but the latest record for a unique id (last action). For example, an insert followed by 30 updates would have a single record left, the final update. There is no need to apply all the intermediate updates.
Delete any record from cf_rec that has any corresponding changes.
Insert any [i]nsert or [u]pdate records in cf_rec.
Copy the batch to applied_migrate_log_cf_rec for a full audit trail.
Putting it all together
There were 4 distinct phases, each of which was part of a different database transaction:
Call fn_log_change_transfer_log_cf_rec in cfdb to get a batch of records.
Copy the batch of records to dnsdb.
Call log_change_apply in dnsdb to apply the batch of records.
Compare the log_change_action table in each respective database to ensure counts match.
This process was run every 3 seconds for several weeks before the migration to ensure that we could keep dnsdb in sync with cfdb.
Managing which database is live
The last major pre-migration task was the construction of the request locking system that would be used throughout the actual migration. The aim was to create a system that would allow the database to communicate with the DNS Records API, to allow the DNS Records API to handle HTTP connections more gracefully. If done correctly, this could reduce downtime for DNS Record API users to nearly zero.
In order to facilitate this, a new table called cf_migration_manager was created. The table would be periodically polled by the DNS Records API, communicating two critical pieces of information:
Which database was active. Here we just used a simple A or B naming convention.
If the database was locked for writing. In the event the database was locked for writing, the DNS Records API would hold HTTP requests until the lock was released by the database.
Both pieces of information would be controlled within a migration manager script.
The benefit of migrating the 20+ internal services from direct database access to using our internal DNS Records gRPC API is that we were able to control access to the database to ensure that no one else would be writing without going through the cf_migration_manager.
During the migration
Although we aimed to complete this migration in a matter of seconds, we announced a DNS maintenance window that could last a couple of hours just to be safe. Now that everything was set up, and both cfdb and dnsdb were roughly in sync, it was time to proceed with the migration. The steps were as follows:
Lower the time between copies from 3s to 0.5s.
Lock cfdb for writes via cf_migration_manager. This would tell the DNS Records API to hold write connections.
Make cfdb read-only and migrate the last logged changes to dnsdb.
Enable writes to dnsdb.
Tell DNS Records API that dnsdb is the new primary database and that write connections can proceed via the cf_migration_manager.
Since we needed to ensure that the last changes were copied to dnsdb before enabling writing, this entire process took no more than 2 seconds. During the migration we saw a spike of API latency as a result of the migration manager locking writes, and then dealing with a backlog of queries. However, we recovered back to normal latencies after several minutes.
DNS Records API Latency and Requests during migration
Unfortunately, due to the far-reaching impact that DNS has at Cloudflare, this was not the end of the migration. There were 3 lesser-used services that had slipped by in our scan of services accessing DNS records via cfdb. Fortunately, the setup of the foreign table meant that we could very quickly fix any residual issues by simply changing the table name.
Post-migration
Almost immediately, as expected, we saw a steep drop in usage across cfdb. This freed up a lot of resources for other services to take advantage of.
cfdb usage dropped significantly after the migration period.
Since the migration, the average requests per second to the DNS Records API has more than doubled. At the same time, our CPU usage across both cfdb and dnsdb has settled at below 10% as seen below, giving us room for spikes and future growth.
cfdb and dnsdb CPU usage now
As a result of this improved capacity, our database-related incident rate dropped dramatically.
As for query latencies, our latency post-migration is slightly lower on average, with fewer sustained spikes above 500ms. However, the performance improvement is largely noticed during high load periods, when our database handles spikes without significant issues. Many of these spikes come as a result of clients making calls to collect a large amount of DNS records or making several changes to their zone in short bursts. Both of these actions are common use cases for large customers onboarding zones.
In addition to these improvements, the DNS team also has more granular control over dnsdb cluster-specific settings that can be tweaked for our needs rather than catering to all the other services. For example, we were able to make custom changes to replication lag limits to ensure that services using replicas were able to read with some amount of certainty that the data would exist in a consistent form. Measures like this reduce overall load on the primary because almost all read queries can now go to the replicas.
Although this migration was a resounding success, we are always working to improve our systems. As we grow, so do our customers, which means the need to scale never really ends. We have more exciting improvements on the roadmap, and we are looking forward to sharing more details in the future.
The DNS team at Cloudflare isn’t the only team solving challenging problems like the one above. If this sounds interesting to you, we have many more tech deep dives on our blog, and we are always looking for curious engineers to join our team — see open opportunities here.
In November 2022, we announced the transition to OpenAPI Schemas for the Cloudflare API. Back then, we had an audacious goal to make the OpenAPI schemas the source of truth for our SDK ecosystem and reference documentation. During 2024’s Developer Week, we backed this up by announcing that our SDK libraries are now automatically generated from these OpenAPI schemas. Today, we’re excited to announce the latest pieces of the ecosystem to now be automatically generated — the Terraform provider and API reference documentation.
This means that the moment a new feature or attribute is added to our products and the team documents it, you’ll be able to see how it’s meant to be used across our SDK ecosystem and make use of it immediately. No more delays. No more lacking coverage of API endpoints.
For anyone who is unfamiliar with Terraform, it is a tool for managing your infrastructure as code, much like you would with your application code. Many of our customers (big and small) rely on Terraform to orchestrate their infrastructure in a technology-agnostic way. Under the hood, it is essentially an HTTP client with lifecycle management built in, which means it makes use of our publicly documented APIs in a way that understands how to create, read, update and delete for the life of the resource.
Keeping Terraform updated — the old way
Historically, Cloudflare has manually maintained a Terraform provider, but since the provider internals require their own unique way of doing things, responsibility for maintenance and support has landed on the shoulders of a handful of individuals. The service teams always had difficulties keeping up with the number of changes, due to the amount of cognitive overhead required to ship a single change in the provider. In order for a team to get a change to the provider, it took a minimum of 3 pull requests (4 if you were adding support to cf-terraforming).
Even with the 4 pull requests completed, it didn’t offer guarantees on coverage of all available attributes, which meant small yet important details could be forgotten and not exposed to customers, causing frustration when trying to configure a resource.
To address this, our Terraform provider needed to be relying on the same OpenAPI schemas that the rest of our SDK ecosystem was already benefiting from.
Updating Terraform automatically
The thing that differentiates Terraform from our SDKs is that it manages the lifecycle of resources. With that comes a new range of problems related to known values and managing differences in the request and response payloads. Let’s compare the two different approaches of creating a new DNS record and fetching it back.
With our Go SDK:
// Create the new record
record, _ := client.DNS.Records.New(context.TODO(), dns.RecordNewParams{
	ZoneID: cloudflare.F("023e105f4ecef8ad9ca31a8372d0c353"),
	Record: dns.RecordParam{
		Name:    cloudflare.String("@"),
		Type:    cloudflare.String("CNAME"),
        Content: cloudflare.String("example.com"),
	},
})


// Wasteful fetch, but shows the point
client.DNS.Records.Get(
	context.Background(),
	record.ID,
	dns.RecordGetParams{
		ZoneID: cloudflare.String("023e105f4ecef8ad9ca31a8372d0c353"),
	},
)
And with Terraform:
resource "cloudflare_dns_record" "example" {
  zone_id = "023e105f4ecef8ad9ca31a8372d0c353"
  name    = "@"
  content = "example.com"
  type    = "CNAME"
}
On the surface, it looks like the Terraform approach is simpler, and you would be correct. The complexity of knowing how to create a new resource and maintain changes are handled for you. However, the problem is that for Terraform to offer this abstraction and data guarantee, all values must be known at apply time. That means that even if you’re not using the proxied value, Terraform needs to know what the value needs to be in order to save it in the state file and manage that attribute going forward. The error below is what Terraform operators commonly see from providers when the value isn’t known at apply time.
Error: Provider produced inconsistent result after apply

When applying changes to example_thing.foo, provider "provider[\"registry.terraform.io/example/example\"]"
produced an unexpected new value: .foo: was null, but now cty.StringVal("").
Whereas when using the SDKs, if you don’t need a field, you just omit it and never need to worry about maintaining known values.
Tackling this for our OpenAPI schemas was no small feat. Since introducing Terraform generation support, the quality of our schemas has improved by an order of magnitude. Now we are explicitly calling out all default values that are present, variable response properties based on the request payload, and any server-side computed attributes. All of this means a better experience for anyone that interacts with our APIs.
Making the jump from terraform-plugin-sdk to terraform-plugin-framework
To build a Terraform provider and expose resources or data sources to operators, you need two main things: a provider server and a provider.
The provider server takes care of exposing a gRPC server that Terraform core (via the CLI) uses to communicate when managing resources or reading data sources from the operator provided configuration.
The provider is responsible for wrapping the resources and data sources, communicating with the remote services, and managing the state file. To do this, you either rely on the terraform-plugin-sdk (commonly referred to as SDKv2) or terraform-plugin-framework, which includes all the interfaces and methods provided by Terraform in order to manage the internals correctly. The decision as to which plugin you use depends on the age of your provider. SDKv2 has been around longer and is what most Terraform providers use, but due to the age and complexity, it has many core unresolved issues that must remain in order to facilitate backwards compatibility for those who rely on it. terraform-plugin-framework is the new version that, while lacking the breadth of features SDKv2 has, provides a more Go-like approach to building providers and addresses many of the underlying bugs in SDKv2.
The majority of the Cloudflare Terraform provider is built using SDKv2, but at the beginning of 2023, we took the plunge to multiplex and offer both in our provider. To understand why this was needed, we have to understand a little about SDKv2. The way SDKv2 is structured isn’t really conducive to representing null or “unset” values consistently and reliably. You can use the experimental ResourceData.GetRawConfig to check whether the value is set, null, or unknown in the config, but writing it back as null isn’t really supported.
This caveat first popped up for us when the Edge Rules Engine (Rulesets) started onboarding new services and those services needed to support API responses that contained booleans in an unset (or missing), true, or false state each with their own reasoning and purpose. While this isn’t a conventional API design at Cloudflare, it is a valid way to do things that we should be able to work with. However, as mentioned above, the SDKv2 provider couldn’t. This is because when a value isn’t present in the response or read into state, it gets a Go-compatible zero value for the default. This showed up as the inability to unset values after they had been written to state as false values (and vice versa).
Once we started adding more functionality using terraform-plugin-framework in the old provider, it was clear that it was a better developer experience, so we added a ratchet to prevent SDKv2 usage going forward to get ahead of anyone unknowingly setting themselves up to hit this issue.
When we decided that we would be automatically generating the Terraform provider, it was only fitting that we also brought all the resources over to be based on the terraform-plugin-framework and leave the issues from SDKv2 behind for good. This did complicate the migration as with the improved internals came changes to major components like the schema and CRUD operations that we needed to familiarize ourselves with. However, it has been a worthwhile investment because by doing so, we’ve future-proofed the foundations of the provider and are now making fewer compromises on a great Terraform experience due to buggy, legacy internals.
Iteratively finding bugs
One of the common struggles with code generation pipelines is that unless you have existing tools that implement your new thing, it’s hard to know if it works or is reasonable to use. Sure, you can also generate your tests to exercise the new thing, but if there is a bug in the pipeline, you are very likely to not see it as a bug as you will be generating test assertions that show the bug is expected behavior.
One of the essential feedback loops we have had is the existing acceptance test suite. All resources within the existing provider had a mix of regression and functionality tests. Best of all, as the test suite is creating and managing real resources, it was very easy to know whether the outcome was a working implementation or not by looking at the HTTP traffic to see whether the API calls were accepted by the remote endpoints. Getting the test suite ported over was only a matter of copying over all the existing tests and checking for any type assertion differences (such as list to single nested list) before kicking off a test run to determine whether the resource was working correctly.
While the centralized schema pipeline was a huge quality of life improvement for having schema fixes propagate to the whole ecosystem almost instantly, it couldn’t help us solve the largest hurdle, which was surfacing bugs that hide other bugs. This was time-consuming because when fixing a problem in Terraform, you have three places where you can hit an error:
Before any API calls are made, Terraform implements logical schema validation and when it encounters validation errors, it will immediately halt.
If any API call fails, it will stop at the CRUD operation and return the diagnostics, immediately halting.
After the CRUD operation has run, Terraform then has checks in place to ensure all values are known.
That means that if we hit the bug at step 1 and then fixed the bug, there was no guarantee or way to tell that we didn’t have two more waiting for us. Not to mention that if we found a bug in step 2 and shipped a fix, that it wouldn’t then identify a bug in the first step on the next round of testing.
There is no silver bullet here and our workaround was instead to notice patterns of problems in the schema behaviors and apply CI lint rules within the OpenAPI schemas before it got into the code generation pipeline. Taking this approach incrementally cut down the number of bugs in step 1 and 2 until we were largely only dealing with the type in step 3.
A more reusable approach to model and struct conversion
Within Terraform provider CRUD operations, it is fairly common to see boilerplate like the following:
var plan ThingModel
diags := req.Plan.Get(ctx, &plan)
resp.Diagnostics.Append(diags...)
if resp.Diagnostics.HasError() {
	return
}

out, err := r.client.UpdateThingModel(ctx, client.ThingModelRequest{
	AttrA: plan.AttrA.ValueString(),
	AttrB: plan.AttrB.ValueString(),
	AttrC: plan.AttrC.ValueString(),
})
if err != nil {
	resp.Diagnostics.AddError(
		"Error updating project Thing",
		"Could not update Thing, unexpected error: "+err.Error(),
	)
	return
}

result := convertResponseToThingModel(out)
tflog.Info(ctx, "created thing", map[string]interface{}{
	"attr_a": result.AttrA.ValueString(),
	"attr_b": result.AttrB.ValueString(),
	"attr_c": result.AttrC.ValueString(),
})

diags = resp.State.Set(ctx, result)
resp.Diagnostics.Append(diags...)
if resp.Diagnostics.HasError() {
	return
}
At a high level:
We fetch the proposed updates (known as a plan) using req.Plan.Get()
Perform the update API call with the new values
Manipulate the data from a Go type into a Terraform model (convertResponseToThingModel)
Set the state by calling resp.State.Set()
Initially, this doesn’t seem too problematic. However, the third step where we manipulate the Go type into the Terraform model quickly becomes cumbersome, error-prone, and complex because all of your resources need to do this in order to swap between the type and associated Terraform models.
To avoid generating more complex code than needed, one of the improvements featured in our provider is that all CRUD methods use unified apijson.Marshal, apijson.Unmarshal, and apijson.UnmarshalComputed methods that solve this problem by centralizing the conversion and handling logic based on the struct tags.
var data *ThingModel

resp.Diagnostics.Append(req.Plan.Get(ctx, &data)...)
if resp.Diagnostics.HasError() {
	return
}

dataBytes, err := apijson.Marshal(data)
if err != nil {
	resp.Diagnostics.AddError("failed to serialize http request", err.Error())
	return
}
res := new(http.Response)
env := ThingResultEnvelope{*data}
_, err = r.client.Thing.Update(
	// ...
)
if err != nil {
	resp.Diagnostics.AddError("failed to make http request", err.Error())
	return
}

bytes, _ := io.ReadAll(res.Body)
err = apijson.UnmarshalComputed(bytes, &env)
if err != nil {
	resp.Diagnostics.AddError("failed to deserialize http request", err.Error())
	return
}
data = &env.Result

resp.Diagnostics.Append(resp.State.Set(ctx, &data)...)
Instead of needing to generate hundreds of instances of type-to-model converter methods, we can instead decorate the Terraform model with the correct tags and handle marshaling and unmarshaling of the data consistently. It’s a minor change to the code that in the long run makes the generation more reusable and readable. As an added benefit, this approach is great for bug fixing as once you identify a bug with a particular type of field, fixing that in the unified interface fixes it for other occurrences you may not yet have found.
But wait, there’s more (docs)!
To top off our OpenAPI schema usage, we’re tightening the SDK integration with our new API documentation site. It’s using the same pipeline we’ve invested in for the last two years while addressing some of the common usage issues.
SDK aware
If you’ve used our API documentation site, you know we give you examples of interacting with the API using command line tools like curl. This is a great starting point, but if you’re using one of the SDK libraries, you need to do the mental gymnastics to convert it to the method or type definition you want to use. Now that we’re using the same pipeline to generate the SDKs and the documentation, we’re solving that by providing examples in all the libraries you could use — not just curl.
Example using cURL to fetch all zones.
Example using the Typescript library to fetch all zones.
Example using the Python library to fetch all zones.
Example using the Go library to fetch all zones.
With this improvement, we also remember the language selection so if you’ve selected to view the documentation using our Typescript library and keep clicking around, we keep showing you examples using Typescript until it is swapped out.
Best of all, when we introduce new attributes to existing endpoints or add SDK languages, this documentation site is automatically kept in sync with the pipeline. It is no longer a huge effort to keep it all up to date.
Faster and more efficient rendering
A problem we’ve always struggled with is the sheer number of API endpoints and how to represent them. As of this post, we have 1,330 endpoints, and for each of those endpoints, we have a request payload, a response payload, and multiple types associated with it. When it comes to rendering this much information, the solutions we’ve used in the past have had to make tradeoffs in order to make parts of the representation work.
This next iteration of the API documentation site addresses this is a couple of ways:
It’s implemented as a modern React application that pairs an interactive client-side experience with static pre-rendered content, resulting in a quick initial load and fast navigation. (Yes, it even works without JavaScript enabled!).
It fetches the underlying data incrementally as you navigate.
By solving this foundational issue, we’ve unlocked other planned improvements to the documentation site and SDK ecosystem to improve the user experience without making tradeoffs like we’ve needed to in the past.
Permissions
One of the most requested features to be re-implemented into the documentation site has been minimum required permissions for API endpoints. One of the previous iterations of the documentation site had this available. However, unknown to most who used it, the values were manually maintained and were regularly incorrect, causing support tickets to be raised and frustration for users.
Inside Cloudflare’s identity and access management system, answering the question “what do I need to access this endpoint” isn’t a simple one. The reason for this is that in the normal flow of a request to the control plane, we need two different systems to provide parts of the question, which can then be combined to give you the full answer. As we couldn’t initially automate this as part of the OpenAPI pipeline, we opted to leave it out instead of having it be incorrect with no way of verifying it.
Fast-forward to today, and we’re excited to say endpoint permissions are back! We built some new tooling that abstracts answering this question in a way that we can integrate into our code generation pipeline and have all endpoints automatically get this information. Much like the rest of the code generation platform, it is focused on having service teams own and maintain high quality schemas that can be reused with value adds introduced without any work on their behalf.
Stop waiting for updates
With these announcements, we’re putting an end to waiting for updates to land in the SDK ecosystem. These new improvements allow us to streamline the ability of new attributes and endpoints the moment teams document them. So what are you waiting for? Check out the Terraform provider and API documentation site today.
Customers that use Cloudflare to manage their DNS often need to create a whole batch of records, enable proxying on many records, update many records to point to a new target at the same time, or even delete all of their records. Historically, customers had to resort to bespoke scripts to make these changes, which came with their own set of issues. In response to customer demand, we are excited to announce support for batched API calls to the DNS records API starting today. This lets customers make large changes to their zones much more efficiently than before. Whether sending a POST, PUT, PATCH or DELETE, users can now execute these four different HTTP methods, and multiple HTTP requests all at the same time.
Efficient zone management matters
DNS records are an essential part of most web applications and websites, and they serve many different purposes. The most common use case for a DNS record is to have a hostname point to an IPv4 address, this is called an A record:
example.com 59 IN A 198.51.100.0
blog.example.com 59 IN A 198.51.100.1
ask.example.com 59 IN A 198.51.100.2
In its most simple form, this enables Internet users to connect to websites without needing to memorize their IP address.
Often, our customers need to be able to do things like create a whole batch of records, or enable proxying on many records, or update many records to point to a new target at the same time, or even delete all of their records. Unfortunately, for most of these cases, we were asking customers to write their own custom scripts or programs to do these tasks for them, a number of which are open sourced and whose content has not been checked by us. These scripts are often used to avoid needing to repeatedly make the same API calls manually. This takes time, not only for the development of the scripts, but also to simply execute all the API calls, not to mention it can leave the zone in a bad state if some changes fail while others succeed.
Introducing /batch
Starting today, everyone with a Cloudflare zone will have access to this endpoint, with free tier customers getting access to 200 changes in one batch, and paid plans getting access to 3,500 changes in one batch. We have successfully tested up to 100,000 changes in one call. The API is simple, expecting a POST request to be made to the new API endpoint /dns_records/batch, which passes in a JSON object in the body in the format:
Each list of records []Record will follow the same requirements as the regular API, except that the record ID on deletes, patches, and puts will be required within the Record object itself. Here is a simple example:
Our API will then parse this and execute these calls in the following order:
deletes
patches
puts
posts
Each of these respective lists will be executed in the order given. This ordering system is important because it removes the need for our clients to worry about conflicts, such as if they need to create a CNAME on the same hostname as a to-be-deleted A record, which is not allowed in RFC 1912. In the event that any of these individual actions fail, the entire API call will fail and return the first error it sees. The batch request will also be executed inside a single database transaction, which will roll back in the event of failure.
After the batch request has been successfully executed in our database, we then propagate the changes to our edge via Quicksilver, our distributed KV store. Each of the individual record changes inside the batch request is treated as a single key-value pair, and database transactions are not supported. As such, we cannot guarantee that the propagation to our edge servers will be atomic. For example, if replacing a delegation with an A record, some resolvers may see the NS record removed before the A record is added.
The response will follow the same format as the request. Patches and puts that result in no changes will be placed at the end of their respective lists.
We are also introducing some new changes to the Cloudflare dashboard, allowing users to select multiple records and subsequently:
Delete all selected records
Change the proxy status of all selected records
We plan to continue improving the dashboard to support more batch actions based on your feedback.
The journey
Although at the surface, this batch endpoint may seem like a fairly simple change, behind the scenes it is the culmination of a multi-year, multi-team effort. Over the past several years, we have been working hard to improve the DNS pipeline that takes our customers’ records and pushes them to Quicksilver, our distributed database. As part of this effort, we have been improving our DNS Records API to reduce the overall latency. The DNS Records API is Cloudflare’s most used API externally, serving twice as many requests as any other API at peak. In addition, the DNS Records API supports over 20 internal services, many of which touch very important areas such as DNSSEC, TLS, Email, Tunnels, Workers, Spectrum, and R2 storage. Therefore, it was important to build something that scales.
To improve API performance, we first needed to understand the complexities of the entire stack. At Cloudflare, we use Jaeger tracing to debug our systems. It gives us granular insights into a sample of requests that are coming into our APIs. When looking at API request latency, the span that stood out was the time spent on each individual database lookup. The latency here can vary anywhere from ~1ms to ~5ms.
Jaeger trace showing variable database latency
Given this variability in database query latency, we wanted to understand exactly what was going on within each DNS Records API request. When we first started on this journey, the breakdown of database lookups for each action was as follows:
Action
Database Queries
Reason
POST
2
One to write and one to read the new record.
PUT
3
One to collect, one to write, and one to read back the new record.
PATCH
3
One to collect, one to write, and one to read back the new record.
DELETE
2
One to read and one to delete.
The reason we needed to read the newly created records on POST, PUT, and PATCH was because the record contains information filled in by the database which we cannot infer in the API.
Let’s imagine that a customer needed to edit 1,000 records. If each database lookup took 3ms to complete, that was 3ms * 3 lookups * 1,000 records = 9 seconds spent on database queries alone, not taking into account the round trip time to and from our API or any other processing latency. It’s clear that we needed to reduce the number of overall queries and ideally minimize per query latency variation. Let’s tackle the variation in latency first.
Each of these calls is not a simple INSERT, UPDATE, or DELETE, because we have functions wrapping these database calls for sanitization purposes. In order to understand the variable latency, we enlisted the help of PostgreSQL’s “auto_explain”. This module gives a breakdown of execution times for each statement without needing to EXPLAIN each one by hand. We used the following settings:
A handful of queries showed durations like the one below, which took an order of magnitude longer than other queries.
We noticed that in several locations we were doing queries like:
IF (EXISTS (SELECT id FROM table WHERE row_hash = __new_row_hash))
If you are trying to insert into very large zones, such queries could mean even longer database query times, potentially explaining the discrepancy between 1ms and 5ms in our tracing images above. Upon further investigation, we already had a unique index on that exact hash. Unique indexes in PostgreSQL enforce the uniqueness of one or more column values, which means we can safely remove those existence checks without risk of inserting duplicate rows.
The next task was to introduce database batching into our DNS Records API. In any API, external calls such as SQL queries are going to add substantial latency to the request. Database batching allows the DNS Records API to execute multiple SQL queries within one single network call, subsequently lowering the number of database round trips our system needs to make.
According to the table above, each database write also corresponded to a read after it had completed the query. This was needed to collect information like creation/modification timestamps and new IDs. To improve this, we tweaked our database functions to now return the newly created DNS record itself, removing a full round trip to the database. Here is the updated table:
Action
Database Queries
Reason
POST
1
One to write
PUT
2
One to read, one to write.
PATCH
2
One to read, one to write.
DELETE
2
One to read, one to delete.
We have room for improvement here, however we cannot easily reduce this further due to some restrictions around auditing and other sanitization logic.
Results:
Action
Average database time before
Average database time after
Percentage Decrease
POST
3.38ms
0.967ms
71.4%
PUT
4.47ms
2.31ms
48.4%
PATCH
4.41ms
2.24ms
49.3%
DELETE
1.21ms
1.21ms
0%
These are some pretty good improvements! Not only did we reduce the API latency, we also reduced the database query load, benefiting other systems as well.
Weren’t we talking about batching?
I previously mentioned that the /batch endpoint is fully atomic, making use of a single database transaction. However, a single transaction may still require multiple database network calls, and from the table above, that can add up to a significant amount of time when dealing with large batches. To optimize this, we are making use of pgx/batch, a Golang object that allows us to write and subsequently read multiple queries in a single network call. Here is a high level of how the batch endpoint works:
Collect all the records for the PUTs, PATCHes and DELETEs.
Apply any per record differences as requested by the PATCHes and PUTs.
Format the batch SQL query to include each of the actions.
Execute the batch SQL query in the database.
Parse each database response and return any errors if needed.
Audit each change.
This takes at most only two database calls per batch. One to fetch, and one to write/delete. If the batch contains only POSTs, this will be further reduced to a single database call. Given all of this, we should expect to see a significant improvement in latency when making multiple changes, which we do when observing how these various endpoints perform:
Note: Each of these queries was run from multiple locations around the world and the median of the response times are shown here. The server responding to queries is located in Portland, Oregon, United States. Latencies are subject to change depending on geographical location.
Create only:
10 Records
100 Records
1,000 Records
10,000 Records
Regular API
7.55s
74.23s
757.32s
7,877.14s
Batch API – Without database batching
0.85s
1.47s
4.32s
16.58s
Batch API – with database batching
0.67s
1.21s
3.09s
10.33s
Delete only:
10 Records
100 Records
1,000 Records
10,000 Records
Regular API
7.28s
67.35s
658.11s
7,471.30s
Batch API – without database batching
0.79s
1.32s
3.18s
17.49s
Batch API – with database batching
0.66s
0.78s
1.68s
7.73s
Create/Update/Delete:
10 Records
100 Records
1,000 Records
10,000 Records
Regular API
7.11s
72.41s
715.36s
7,298.17s
Batch API – without database batching
0.79s
1.36s
3.05s
18.27s
Batch API – with database batching
0.74s
1.06s
2.17s
8.48s
Overall Average:
10 Records
100 Records
1,000 Records
10,000 Records
Regular API
7.31s
71.33s
710.26s
7,548.87s
Batch API – without database batching
0.81s
1.38s
3.51s
17.44s
Batch API – with database batching
0.69s
1.02s
2.31s
8.85s
We can see that on average, the new batching API is significantly faster than the regular API trying to do the same actions, and it’s also nearly twice as fast as the batching API without batched database calls. We can see that at 10,000 records, the batching API is a staggering 850x faster than the regular API. As mentioned above, these numbers are likely to change for a number of different reasons, but it’s clear that making several round trips to and from the API adds substantial latency, regardless of the region.
Batch overload
Making our API faster is awesome, but we don’t operate in an isolated environment. Each of these records needs to be processed and pushed to Quicksilver, our distributed database. If we have customers creating tens of thousands of records every 10 seconds, we need to be able to handle this downstream so that we don’t overwhelm our system. In a May 2022 blog post titled How we improved DNS record build speed by more than 4,000x, I notedthat:
We plan to introduce a batching system that will collect record changes into groups to minimize the number of queries we make to our database and Quicksilver.
This task has since been completed, and our propagation pipeline is now able to batch thousands of record changes into a single database query which can then be published to Quicksilver in order to be propagated to our global network.
Next steps
We have a couple more improvements we may want to bring into the API. We also intend to improve the UI to bring more usability improvements to the dashboard to more easily manage zones. We would love to hear your feedback, so please let us know what you think and if you have any suggestions for improvements.
Over the last twelve months, the Internet security landscape has changed dramatically. Geopolitical uncertainty, coupled with an active 2024 voting season in many countries across the world, has led to a substantial increase in malicious traffic activity across the Internet. In this report, we take a look at Cloudflare’s perspective on Internet application security.
This report is the fourth edition of our Application Security Report and is an official update to our Q2 2023 report. New in this report is a section focused on client-side security within the context of web applications.
Throughout the report we discuss various insights. From a global standpoint, mitigated traffic across the whole network now averages 7%, and WAF and Bot mitigations are the source of over half of that. While DDoS attacks remain the number one attack vector used against web applications, targeted CVE attacks are also worth keeping an eye on, as we have seen exploits as fast as 22 minutes after a proof of concept was released.
Focusing on bots, about a third of all traffic we observe is automated, and of that, the vast majority (93%) is not generated by bots in Cloudflare’s verified list and is potentially malicious.
API traffic is also still growing, now accounting for 60% of all traffic, and maybe more concerning, is that organizations have up to a quarter of their API endpoints not accounted for.
We also touch on client side security and the proliferation of third-party integrations in web applications. On average, enterprise sites integrate 47 third-party endpoints according to Page Shield data.
It is also worth mentioning that since the last report, our network, from which we gather the data and insights, is bigger and faster: we are now processing an average of 57 million HTTP requests/second (+23.9% YoY) and 77 million at peak (+22.2% YoY). From a DNS perspective, we are handling 35 million DNS queries per second (+40% YoY). This is the sum of authoritative and resolver requests served by our infrastructure.
Maybe even more noteworthy, is that, focusing on HTTP requests only, in Q1 2024 Cloudflare blocked an average of 209 billion cyber threats each day (+86.6% YoY). That is a substantial increase in relative terms compared to the same time last year.
As usual, before we dive in, we need to define our terms.
Definitions
Throughout this report, we will refer to the following terms:
Mitigated traffic: any eyeball HTTP* request that had a “terminating” action applied to it by the Cloudflare platform. These include the following actions: BLOCK, CHALLENGE, JS_CHALLENGE and MANAGED_CHALLENGE. This does not include requests that had the following actions applied: LOG, SKIP, ALLOW. They also accounted for a relatively small percentage of requests. Additionally, we improved our calculation regarding the CHALLENGE type actions to ensure that only unsolved challenges are counted as mitigated. A detailed description of actions can be found in our developer documentation. This has not changed from last year’s report.
Bot traffic/automated traffic: any HTTP* request identified by Cloudflare’s Bot Management system as being generated by a bot. This includes requests with a bot score between 1 and 29 inclusive. This has not changed from last year’s report.
API traffic: any HTTP* request with a response content type of XML or JSON. Where the response content type is not available, such as for mitigated requests, the equivalent Accept content type (specified by the user agent) is used instead. In this latter case, API traffic won’t be fully accounted for, but it still provides a good representation for the purposes of gaining insights. This has not changed from last year’s report.
Unless otherwise stated, the time frame evaluated in this post is the period from April 1, 2023, through March 31, 2024, inclusive.
Finally, please note that the data is calculated based only on traffic observed across the Cloudflare network and does not necessarily represent overall HTTP traffic patterns across the Internet.
*When referring to HTTP traffic we mean both HTTP and HTTPS.
Global traffic insights
Average mitigated daily traffic increases to nearly 7%
Compared to the prior 12-month period, Cloudflare mitigated a higher percentage of application layer traffic and layer 7 (L7) DDoS attacks between Q2 2023 and Q1 2024, growing from 6% to 6.8%.
Figure 1: Percent of mitigated HTTP traffic increasing over the last 12 months
During large global attack events, we can observe spikes of mitigated traffic approaching 12% of all HTTP traffic. These are much larger spikes than we have ever observed across our entire network.
WAF and Bot mitigations accounted for 53.9% of all mitigated traffic
As the Cloudflare platform continues to expose additional signals to identify potentially malicious traffic, customers have been actively using these signals in WAF Custom Rules to improve their security posture. Example signals include our WAF Attack Score, which identifies malicious payloads, and our Bot Score, which identifies automated traffic.
After WAF and Bot mitigations, HTTP DDoS rules are the second-largest contributor to mitigated traffic. IP reputation, that uses our IP threat score to block traffic, and access rules, which are simply IP and country blocks, follow in third and fourth place.
Figure 2: Mitigated traffic by Cloudflare product group
CVEs exploited as fast as 22 minutes after proof-of-concept published
Zero-day exploits (also called zero-day threats) are increasing, as is the speed of weaponization of disclosed CVEs. In 2023, 97 zero-days were exploited in the wild, and that’s along with a 15% increase of disclosed CVEs between 2022 and 2023.
Looking at CVE exploitation attempts against customers, Cloudflare mostly observed scanning activity, followed by command injections, and some exploitation attempts of vulnerabilities that had PoCs available online, including Apache CVE-2023-50164 and CVE-2022-33891, Coldfusion CVE-2023-29298CVE-2023-38203 and CVE-2023-26360, and MobileIron CVE-2023-35082.
This trend in CVE exploitation attempt activity indicates that attackers are going for the easiest targets first, and likely having success in some instances given the continued activity around old vulnerabilities.
As just one example, Cloudflare observed exploitation attempts of CVE-2024-27198 (JetBrains TeamCity authentication bypass) at 19:45 UTC on March 4, just 22 minutes after proof-of-concept code was published.
The speed of exploitation of disclosed CVEs is often quicker than the speed at which humans can create WAF rules or create and deploy patches to mitigate attacks. This also applies to our own internal security analyst team that maintains the WAF Managed Ruleset, which has led us to combine the human written signatures with an ML-based approach to achieve the best balance between low false positives and speed of response.
CVE exploitation campaigns from specific threat actors are clearly visible when we focus on a subset of CVE categories. For example, if we filter on CVEs that result in remote code execution (RCE), we see clear attempts to exploit Apache and Adobe installations towards the end of 2023 and start of 2024 along with a notable campaign targeting Citrix in May of this year.
Figure 4: Worldwide daily number of requests for Code Execution CVEs
Similar views become clearly visible when focusing on other CVEs or specific attack categories.
DDoS attacks remain the most common attack against web applications
DDoS attacks remain the most common attack type against web applications, with DDoS comprising 37.1% of all mitigated application traffic over the time period considered.
Figure 5: Volume of HTTP DDoS attacks over time
We saw a large increase in volumetric attacks in February and March 2024. This was partly the result of improved detections deployed by our teams, in addition to increased attack activity. In the first quarter of 2024 alone, Cloudflare’s automated defenses mitigated 4.5 million unique DDoS attacks, an amount equivalent to 32% of all the DDoS attacks Cloudflare mitigated in 2023. Specifically, application layer HTTP DDoS attacks increased by 93% YoY and 51% quarter-over-quarter (QoQ).
Cloudflare correlates DDoS attack traffic and defines unique attacks by looking at event start and end times along with target destination.
Motives for launching DDoS attacks range from targeting specific organizations for financial gains (ransom), to testing the capacity of botnets, to targeting institutions and countries for political reasons. As an example, Cloudflare observed a 466% increase in DDoS attacks on Sweden after its acceptance to the NATO alliance on March 7, 2024. This mirrored the DDoS pattern observed during Finland’s NATO acceptance in 2023. The size of DDoS attacks themselves are also increasing.
In August 2023, Cloudflare mitigated a hyper-volumetric HTTP/2 Rapid Reset DDoS attack that peaked at 201 million requests per second (rps) – three times larger than any previously observed attack. In the attack, threat actors exploited a zero-day vulnerability in the HTTP/2 protocol that had the potential to incapacitate nearly any server or application supporting HTTP/2. This underscores how menacing DDoS vulnerabilities are for unprotected organizations.
Gaming and gambling became the most targeted sector by DDoS attacks, followed by Internet technology companies and cryptomining.
Figure 6: Largest HTTP DDoS attacks as seen by Cloudflare, by year
Bot traffic insights
Cloudflare has continued to invest heavily in our bot detection systems. In early July, we declared AIndependence to help preserve a safe Internet for content creators, offering a brand new “easy button” to block all AI bots. It’s available for all customers, including those on our free tier.
Major progress has also been made in other complementary systems such as our Turnstile offering, a user-friendly, privacy-preserving alternative to CAPTCHA.
All these systems and technologies help us better identify and differentiate human traffic from automated bot traffic.
On average, bots comprise one-third of all application traffic
31.2% of all application traffic processed by Cloudflare is bot traffic. This percentage has stayed relatively consistent (hovering at about 30%) over the past three years.
The term bot traffic may carry a negative connotation, but in reality bot traffic is not necessarily good or bad; it all depends on the purpose of the bots. Some are “good” and perform a needed service, such as customer service chatbots and authorized search engine crawlers. But some bots misuse an online product or service and need to be blocked.
Different application owners may have different criteria for what they deem a “bad” bot. For example, some organizations may want to block a content scraping bot that is being deployed by a competitor to undercut on prices, whereas an organization that does not sell products or services may not be as concerned with content scraping. Known, good bots are classified by Cloudflare as “verified bots.”
93% of bots we identified were unverified bots, and potentially malicious
Unverified bots are often created for disruptive and harmful purposes, such as hoarding inventory, launching DDoS attacks, or attempting to take over an account via brute force or credential stuffing. Verified bots are those that are known to be safe, such as search engine crawlers, and Cloudflare aims to verify all major legitimate bot operators. A list of all verified bots can be found in our documentation.
Attackers leveraging bots focus most on industries that could bring them large financial gains. For example, consumer goods websites are often the target of inventory hoarding, price scraping run by competition or automated applications aimed at exploiting some sort of arbitrage (for example, sneaker bots). This type of abuse can have a significant financial impact on the target organization.
Figure 8: Industries with the highest median daily share of bot traffic
API traffic insights
Consumers and end users expect dynamic web and mobile experiences powered by APIs. For businesses, APIs fuel competitive advantages, greater business intelligence, faster cloud deployments, integration of new AI capabilities, and more.
However, APIs introduce new risks by providing outside parties additional attack surfaces with which to access applications and databases which also need to be secured. As a consequence, numerous attacks we observe are not targeting API endpoints first rather than the traditional web interfaces.
The additional security concerns are of course not slowing down adoption of API first applications.
60% of dynamic (non cacheable) traffic is API-related
This is a two percentage point increase compared to last year’s report. Of this 60%, about 4% on average is mitigated by our security systems.
Figure 9: Share of mitigated API traffic
A substantial spike is visible around January 11-17 that accounts for almost a 10% increase in traffic share alone for that period. This was due to a specific customer zone receiving attack traffic that was mitigated by a WAF Custom Rule.
Digging into mitigation sources for API traffic, we see the WAF being the largest contributor, as standard malicious payloads are commonly applicable to both API endpoints and standard web applications.
Figure 10: API mitigated traffic broken down by product group
A quarter of APIs are “shadow APIs”
You cannot protect what you cannot see. And, many organizations lack accurate API inventories, even when they believe they can correctly identify API traffic.
Using our proprietary machine learning model that scans not just known API calls, but all HTTP requests (identifying API traffic that may be going unaccounted for), we found that organizations had 33% more public-facing API endpoints than they knew about. This number was the median, and it was calculated by comparing the number of API endpoints detected through machine learning based discovery vs. customer-provided session identifiers.
This suggests that nearly a quarter of APIs are “shadow APIs” and may not be properly inventoried and secured.
Client-side risks
Most organizations’ web apps rely on separate programs or pieces of code from third-party providers (usually coded in JavaScript). The use of third-party scripts accelerates modern web app development and allows organizations to ship features to market faster, without having to build all new app features in-house.
Using Cloudflare’s client side security product, Page Shield, we can get a view on the popularity of third party libraries used on the Internet and the risk they pose to organizations. This has become very relevant recently due to the Polyfill.io incident that affected more than one hundred thousand sites.
Enterprise applications use 47 third-party scripts on average
Cloudflare’s typical enterprise customer uses an average of 47 third-party scripts, and a median of 20 third-party scripts. The average is much higher than the median due to SaaS providers, who often have thousands of subdomains which may all use third-party scripts. Here are some of the top third-party script providers Cloudflare customers commonly use:
Google (Tag Manager, Analytics, Ads, Translate, reCAPTCHA, YouTube)
Meta (Facebook Pixel, Instagram)
Cloudflare (Web Analytics)
jsDelivr
New Relic
Appcues
Microsoft (Clarity, Bing, LinkedIn)
jQuery
WordPress (Web Analytics, hosted plugins)
Pinterest
UNPKG
TikTok
Hotjar
While useful, third-party software dependencies are often loaded directly by the end-user’s browser (i.e. they are loaded client-side) placing organizations and their customers at risk given that organizations have no direct control over third-party security measures. For example, in the retail sector, 18% of all data breaches originate from Magecart style attacks, according to Verizon’s 2024 Data Breach Investigations Report.
Enterprise applications connect to nearly 50 third-parties on average
Loading a third-party script into your website poses risks, even more so when that script “calls home” to submit data to perform the intended function. A typical example here is Google Analytics: whenever a user performs an action, the Google Analytics script will submit data back to the Google servers. We identify these as connections.
On average, each enterprise website connects to 50 separate third-party destinations, with a median of 15. Each of these connections also poses a potential client-side security risk as attackers will often use them to exfiltrate additional data going unnoticed.
Here are some of the top third-party connections Cloudflare customers commonly use:
Google (Analytics, Ads)
Microsoft (Clarity, Bing, LinkedIn)
Meta (Facebook Pixel)
Hotjar
Kaspersky
Sentry
Criteo
tawk.to
OneTrust
New Relic
PayPal
Looking forward
This application security report is also available in PDF format with additional recommendations on how to address many of the concerns raised, along with additional insights.
We also publish many of our reports with dynamic charts on Cloudflare Radar, making it an excellent resource to keep up to date with the state of the Internet.
Developer Week 2024 has officially come to a close. Each day last week, we shipped new products and functionality geared towards giving developers the components they need to build full-stack applications on Cloudflare.
Even though Developer Week is now over, we are continuing to innovate with the over two million developers who build on our platform. Building a platform is only as exciting as seeing what developers build on it. Before we dive into a recap of the announcements, to send off the week, we wanted to share how a couple of companies are using Cloudflare to power their applications:
We have been using Workers for image delivery using R2 and have been able to maintain stable operations for a year after implementation. The speed of deployment and the flexibility of detailed configurations have greatly reduced the time and effort required for traditional server management. In particular, we have seen a noticeable cost savings and are deeply appreciative of the support we have received from Cloudflare Workers. – FAN Communications
Milkshake helps creators, influencers, and business owners create engaging web pages directly from their phone, to simply and creatively promote their projects and passions. Cloudflare has helped us migrate data quickly and affordably with R2. We use Workers as a routing layer between our users’ websites and their images and assets, and to build a personalized analytics offering affordably. Cloudflare’s innovations have consistently allowed us to run infrastructure at a fraction of the cost of other developer platforms and we have been eagerly awaiting updates to D1 and Queues to sustainably scale Milkshake as the product continues to grow. – Milkshake
In case you missed anything, here’s a quick recap of the announcements and in-depth technical explorations that went out last week:
A core part of any full-stack application is storing and persisting data! We kicked off the week with announcements that help developers build stateful applications on top of Cloudflare, including making D1, Cloudflare’s SQL database and Hyperdrive, our database accelerating service, generally available.
D1, Cloudflare’s SQL database, is now generally available. With new support for 10GB databases, data export, and enhanced query debugging, we empower developers to build production-ready applications with D1 to meet all their relational SQL needs. To support Workers in global applications, we’re sharing a sneak peek of our design and API for D1 global read replication to demonstrate how developers scale their workloads with D1.
Bindings don’t just reduce boilerplate. They are a core design feature of the Workers platform which simultaneously improve developer experience and application security in several ways. Usually these two goals are in opposition to each other, but bindings elegantly solve for both at the same time.
We made a series of AI-related announcements, including Workers AI, Cloudflare’s inference platform becoming GA, support for fine-tuned models with LoRAs, one-click deploys from HuggingFace, Python support for Cloudflare Workers, and more.
Workers AI now supports fine-tuned models using LoRAs. But what is a LoRA and how does it work? In this post, we dive into fine-tuning, LoRAs and even some math to share the details of how it all works under the hood.
We introduced Python support for Cloudflare Workers, now in open beta. We’ve revamped our systems to support Python, from the Workers runtime itself to the way Workers are deployed to Cloudflare’s network. Learn about a Python Worker’s lifecycle, Pyodide, dynamic linking, and memory snapshots in this post.
We announced three new features for Cloudflare R2: event notifications, support for migrations from Google Cloud Storage, and an infrequent access storage tier.
We’re making it easier to build scalable, reliable, data-driven applications on top of our global network, and so we announced a new Event Notifications framework; our take on durable execution, Workflows; and an upcoming streaming ingestion service, Pipelines.
Together, Cloudflare and Prisma make it easier than ever to deploy globally available apps with a focus on developer experience. To further that goal, Prisma ORM now natively supports Cloudflare Workers and D1 in Preview. With version 5.12.0 of Prisma ORM you can now interact with your data stored in D1 from your Cloudflare Workers with the convenience of the Prisma Client API. Learn more and try it out now.
Picsart, one of the world’s largest digital creation platforms, encountered performance challenges in catering to its global audience. Adopting Cloudflare’s global-by-default Developer Platform emerged as the optimal solution, empowering Picsart to enhance performance and scalability substantially.
We launched four improvements to Pages that bring functionality previously restricted to Workers, with the goal of unifying the development experience between the two. Support for monorepos, wrangler.toml, new additions to Next.js support and database integrations!
Production readiness isn’t just about scale and reliability of the services you build with. We announced five updates that put more power in your hands – Gradual Deployments, Source mapped stack traces in Tail Workers, a new Rate Limiting API, brand-new API SDKs, and updates to Durable Objects – each built with mission-critical production services in mind.
With Cloudflare Calls in open beta, you can build real-time, serverless video and audio applications. Cloudflare Stream lets your viewers instantly clip from ongoing streams. Finally, Cloudflare Images now supports automatic face cropping and has an upload widget that lets you easily integrate into your application.
Cloudflare Calls is a serverless SFU and TURN service running at Cloudflare’s edge. It’s now in open beta and costs $0.05/ real-time GB. It’s 100% anycast WebRTC.
We announced that PartyKit, a trailblazer in enabling developers to craft ambitious real-time, collaborative, multiplayer applications, is now a part of Cloudflare. This acquisition marks a significant milestone in our journey to redefine the boundaries of serverless computing, making it more dynamic, interactive, and, importantly, stateful.
Full-stack web development with Cloudflare is now faster and easier! You can now use your framework’s development server while accessing D1 databases, R2 object stores, AI models, and more. Iterate locally in milliseconds to build sophisticated web apps that run on Cloudflare. Let’s dev together!
Cloudflare Workers now features a built-in RPC (Remote Procedure Call) system for use in Worker-to-Worker and Worker-to-Durable Object communication, with absolutely minimal boilerplate. We’ve designed an RPC system so expressive that calling a remote service can feel like using a library.
We closed out Developer Week by sharing updates on our Workers Launchpad program, our latest Developer Challenge, and the work we’re doing to ensure our community spaces – like our Discord and Community forums – are safe and inclusive for all developers.
Continue the conversation
Thank you for being a part of Developer Week! Want to continue the conversation and share what you’re building? Join us on Discord. To get started building on Workers, check out our developer documentation.
Today, we’re excited to talk about URL Scanner, a tool that helps everyone from security teams to everyday users to detect and safeguard against malicious websites by scanning and analyzing them. URL Scanner has executed almost a million scans since its launch last March on Cloudflare Radar, driving us to continuously innovate and enhance its capabilities. Since that time, we have introduced unlisted scans, detailed malicious verdicts, enriched search functionality, and now, integration with Security Center and an official API, all built upon the robust foundation of Cloudflare Workers, Durable Objects, and the Browser Rendering API.
Integration with the Security Center in the Cloudflare Dashboard
Security Center is the single place in the Cloudflare Dashboard to map your attack surface, identify potential security risks, and mitigate risks with a few clicks. Its users can now access the URL scanner directly from the Investigate Portal, enhancing their cybersecurity workflow. These scans will be unlisted by default, ensuring privacy while facilitating a deep dive into website security. Users will be able to see their historic scans and access the related reports when they need to, and they will benefit from automatic screenshots for multiple screen sizes, enriching the context of each scan.
Customers with Cloudflare dashboard access will enjoy higher API limits and faster response times, crucial for agile security operations. Integration with internal workflows becomes seamless, allowing for sophisticated network and user protection strategies.
Security Center in the Cloudflare Dashboard
Unlocking the potential of the URL Scanner API
The URL Scanner API is a powerful asset for developers, enabling custom scans to detect phishing or malware risks, analyze website technologies, and much more. With new features like custom HTTP headers and multi-device screenshots, developers gain a comprehensive toolkit for thorough website assessment.
Submitting a scan request
Using the API, here’s the simplest way to submit a scan request:
New features include the option to set custom HTTP headers, like User-Agent and Authorization, request multiple target device screenshots, like mobile and desktop, as well as set the visibility level to “unlisted”. This essentially marks the scan as private and was often requested by developers who wanted to keep their investigations confidential. Public scans, on the other hand, can be found by anyone through search and are useful to share results with the wider community. You can find more details in our developer documentation.
Once a scan concludes, fetch the final report and the full network log. Recently added features include the `verdict` property, indicating the site’s malicious status, and the `securityViolations` section detailing CSP or SRI policy breaches — as a developer, you can also scan your own website and see our recommendations. Expect improvements on verdict accuracy over time, as this is an area we’re focusing on.
Enhanced search functionality
Developers can now search scans by hostname, a specific URL or even any URL the page connected to during the scan. This allows, for example, to search for websites that use a JavaScript library named jquery.min.js (‘?path=jquery.min.js’). Future plans include additional features like searching by IP address, ASN, and malicious website categorisation.
The URL Scanner can be used for a diverse range of applications. These include capturing a website’s evolving state over time (such as tracking changes to the front page of an online newspaper), analyzing technologies employed by a website, preemptively assessing potential risks (as when scrutinizing shortened URLs), and supporting the investigation of persistent cybersecurity threats (such as identifying affected websites hosting a malicious JavaScript file).
How we built the URL Scanner API
In recounting the process of developing the URL Scanner, we aim to showcase the potential and versatility of Cloudflare Workers as a platform. This story is more than a technical journey, but a testament to the capabilities inherent in our platform’s suite of APIs. By dogfooding our own technology, we not only demonstrate confidence in its robustness but also encourage developers to harness the same capabilities for building sophisticated applications. The URL Scanner exemplifies how Cloudflare Workers, Durable Objects, and the Browser Rendering API seamlessly integrate.
High level overview of theCloudflare URL Scanner technology stack
As seen above, Cloudflare’s runtime infrastructure is the foundation the system runs on. Cloudflare Workers serves the public API, Durable Objects handles orchestration, R2 acts as the primary storage solution, and Queues efficiently handles batch operations, all at the edge. However, what truly enables the URL Scanner’s capabilities is the Browser Rendering API. It’s what initially allowed us to release in such a short time frame, since we didn’t have to build and manage an entire fleet of Chrome browsers from scratch. We simply request a browser, and then using the well known Puppeteer library, instruct it to fetch the webpage and process it in the way we want. This API is at the heart of the entire system.
Scanning a website
The entire process of scanning a website, can be split into 4 phases:
Queue a scan
Browse to the website and compile initial report
Post-process: compile additional information and build final report
Store final report, ready for serving and searching
In short, we create a Durable Object, the Scanner, unique to each scan, which is responsible for orchestrating the scan from start to finish. Since we want to respond immediately to the user, we save the scan to the Durable Object’s transactional Key-Value storage, and schedule an alarm so we can perform the scan asynchronously a second later. We then respond to the user, informing them that the scan request was accepted.
When the Scanner’s alarm triggers, we enter the second phase:
There are 3 components at work in this phase, the Scanner, the Browser Pool and the Browser Controller, all Durable Objects.
In the initial release, for each new scan we would launch a brand-new browser. However, This operation would take time and was inefficient, so after review, we decided to reuse browsers across multiple scans. This is why we introduced both the Browser Pool and the Browser Controller components. The Browser Pool keeps track of what browsers we have open, when they last pinged the browser pool (so it knows they’re alive), and whether they’re free to accept a new scan. The Browser Controller is responsible for keeping the browser instance alive, once it’s launched, and orchestrating (ahem, puppeteering) the entire browsing session. Here’s a simplified version of our Browser Controller code:
export class BrowserController implements DurableObject {
	//[..]
	private async handleNewScan(url: string) {
		if (!this.browser) {
			// Launch browser: 1st request to durable object
			this.browser = await puppeteer.launch(this.env.BROWSER)
			await this.state.storage.setAlarm(Date.now() + 5 * 1000)
		}
		// Open new page and navigate to url
		const page = await this.browser.newPage()
		await page.goto(url, { waitUntil: 'networkidle2', timeout: 5000, })

		// Capture DOM
		const dom = await page.content()

		// Clean up
		await page.close()

		return {
			dom: dom,
		}
	}

	async alarm() {
		if (!this.browser) {
			return
		}
		await this.browser.version() // stop websocket connection to Chrome from going idle

		// ping browser pool, let it know we're alive

		// Keep durable object alive
		await this.state.storage.setAlarm(Date.now() + 5 * 1000)
	}
}
Launching a browser (Step 6) and maintaining a connection to it is abstracted away from us thanks to the Browser Rendering API. This API is responsible for all the infrastructure required to maintain a fleet of Chrome browsers, and led to a much quicker development and release of the URL Scanner. It also allowed us to use a well-known library, Puppeteer, to communicate with Google Chrome via the DevTools protocol.
The initial report is made up of the network log of all requests, captured in HAR (HTTP Archive) format. HAR files, essentially JSON files, provide a detailed record of all interactions between a web browser and a website. As an established standard in the industry, HAR files can be easily shared and analyzed using specialized tools. In addition to this network log, we augment our dataset with an array of other metadata, including base64-encoded screenshots which provide a snapshot of the website at the moment of the scan.
Having this data, we transition to phase 3, where the Scanner Durable Object initiates a series of interactions with a few other Cloudflare APIs in order to collect additional information, like running a phishing scanner over the web page’s Document Object Model (DOM), fetching DNS records, and extracting information about categories and Radar rank associated with the main hostname.
This process ensures that the final report is enriched with insights coming from different sources, making the URL Scanner more efficient in assessing websites. Once all the necessary information is collected, we compile the final report and store it as a JSON file within R2, Cloudflare’s object storage solution. To empower users with efficient scan searches, we use Postgres.
While the initial approach involved sending each completed scan promptly to the core API for immediate storage in Postgres, we realized that, as the rate of scans grew, a more efficient strategy would be to batch those operations, and for that, we use Worker Queues:
This allows us to better manage the write load on Postgres. We wanted scans available as soon as possible to those who requested them, but it’s ok if they’re only available in search results at a slightly later point in time (seconds to minutes, depending on load).
In short, Durable Objects together with the Browser Rendering API power the entire scanning process. Once that’s finished, the Cloudflare Worker serving the API will simply fetch it from R2 by ID. All together, Workers, Durable Objects, and R2 scale seamlessly and will allow us to grow as demand evolves.
Last but not least
While we’ve extensively covered the URL scanning workflow, we’ve yet to delve into the construction of the API worker itself. Developed with Typescript, it uses itty-router-openapi, a Javascript router with Open API 3 schema generation and validation, originally built for Radar, but that’s been improving ever since with contributions from the community. Here’s a quick example of how to set up an endpoint, with input validation built in:
In the example above, the ScanMetadataCreate endpoint will make sure to validate the incoming POST data to match the defined schema before calling the ‘async handle(request,env,context,data)’ function. This way you can be sure that if your code is called, the data argument will always be validated and formatted.
You can learn more about the project on its GitHub page.
Future plans and new features
Looking ahead, we’re committed to further elevating the URL Scanner’s capabilities. Key upcoming features include geographic scans, where users can customize the location that the scan is done from, providing critical insights into regional security threats and content compliance; expanded scan details, including more comprehensive headers and security details; and continuous performance improvements and optimisations, so we can deliver faster scan results.
The evolution of the URL Scanner is a reflection of our commitment to Internet safety and innovation. Whether you’re a developer, a security professional, or simply invested in the safety of the digital landscape, the URL Scanner API offers a comprehensive suite of tools to enhance your efforts. Explore the new features today, and join us in shaping a safer Internet for everyone.
Remember, while Security Center’s new capabilities offer advanced tools for URL Scanning for Cloudflare’s existing customers, the URL Scanner remains accessible for basic scans to the public on Cloudflare Radar, ensuring our technology benefits a broad audience.
If you’re considering a new career direction, check out our open positions. We’re looking for individuals who want to help make the Internet better; learn more about our mission here.
Ако ви предстои да пътувате по автомагистрала, какви мерки за сигурност ще предприемете и на какво ще разчитате, за да пристигнете живи и здрави там, накъдето сте се запътили? Ако шофирате вие, много важно е да сте бодри и с трезв ум, който не е под въздействието на алкохол или други субстанции. Гумите ви трябва да са подходящи за сезона, да карате с указаната скорост и изобщо – да спазвате правилата. Надявате се и другите да ги спазват, както и пътят и маркировката му да са в изправност. Ако минавате през тунел, разчитате той да е построен и поддържан по начин, гарантиращ вашата сигурност. И си мислите, че трябва да има институции, които да се грижат за всички аспекти, свързани с безопасността ви. Институциите обаче може да имат особена визия по въпроса.
Една институционална визия за сигурността на тунелите
Държавната институция, отговаряща за строежа на пътища, тунели и мостове, е Агенция „Пътна инфраструктура“ (АПИ) към Министерството на регионалното развитие и благоустройството. За сигурността на тунелите тя се осланя на… икони. В прессъобщението на АПИ по повод пускането в експлоатация на тунел „Железница“, част от автомагистрала „Струма“, пише (оригиналният правопис е запазен):
При строителството му са вградени и четири икони на Св. „Иван Рилски“, каквито са традициите в тунелното строителство. […] В момента светите изображения не са видими, тъй като са покрити при изграждането на вторичната облицовка на съоръжението. Поверието при вграждането на иконите е, че те пазят работниците при строителството на обекта, а след това и всички пътуващи.
Иконите в тунел „Железница“ впрочем не са нови – чудодейните им свойства вече са популяризирани лично от Бойко Борисов. През 2020 г. част от строежа се срутва и затрупва трима работници, но те оцеляват. Според председателя на ГЕРБ и тогавашен премиер именно иконите на св. Иван Рилски са ги спасили, припомня „Капитал“. От изданието добавят, че пастир, загинал до тунела скоро след това, не е имал същия късмет.
Традициите в тунелното строителство, споменати в прессъобщението, впрочем изглеждат по-хуманни от тези при изграждането на мостове – според преданията в тях се вграждат сенки на невести – с летални последствия за въпросните млади жени. Засега няма яснота дали АПИ разчита на тази древна традиция при изграждането на мостови съоръжения.
Икони и дупки, светци и врачки
Самият св. Иван Рилски впрочем се смята за закрилник не на пътуващите, какъвто е св. Христофор, а на българския народ. А по магистралата, чиято цел е да свързва България и Гърция, пътуват не само българи.
Вграждането на икони в тунели, официално споменато от държавна агенция, може да се разглежда в контекста на все по-малко светската държава, за чието конституционно разделение от религията вече почти никой не се сеща. Но има и нещо друго: подобни актове не са канонична част от православната религия, а проява на суеверие. По-точно – на една специфична сплав от (квази)религия, суеверие, традиционализъм и патриотизъм.
Тази сплав датира още от времето на социализма. Въпреки че тогавашният режим официално е атеистичен и изповядва „научния комунизъм“, в който уж няма място за суеверия, той си има комай официална врачка – Ванга. Способностите ѝ са обект на проучване от Държавния научноизследователски институт по сугестология с благословията лично на диктатора Тодор Живков. СССР също има официална врачка – Джуна.
В началото на 90-те години на ХХ в. с модерните тогава екстрасенси и с Ванга (къде без нея) се забърква Генералният щаб на Българската армия. Става въпрос за известната дупка в село Царичина, в която от Щаба търсят или съкровището на цар Самуил, или първото разумно същество, живяло на Земята, или извънземни. Екстрасенсите, по чийто съвет е изкопана тя, се консултират с Ванга, за да се уверят, че са на прав път. След като от Генералния щаб не намират нищо, дупката е зарита и бетонирана.
Магическо мислене и модерни институции
През 1940 г. Иван Хаджийски публикува студията си „Възстановяване душевността на първобитния български човек“, която по-късно включва в книгата си „Оптимистична теория за нашия народ“. В началото ѝ той уточнява, че под „първобитни“ или „древни“ българи разбира населението по българските земи преди Възраждането. Ако го кажем със съвременни думи, Хаджийски има предвид предмодерните българи, които живеят изцяло в света на традициите, без наука и образование, индустриални технологии или медии.
Единственият метод на познание на тези предмодерни хора е простото наблюдение, а това, което виждат, те уподобяват на човека – придават му човешки качества. Затова се опитват да въздействат на природните стихии с уподобяване, молби, плашене, убеждаване и магии. Примерно, искат да вземат по-голяма част от питката, за да дойде при тях плодородието, карат се на дървото, че не ражда плод, и се заканват да го отсекат, молят се на облаците да пуснат дъжд и плашат болестите.
Вграждането на сенки на невести в мостове е по същество предмодерен вид жертвоприношение – опит да се умилостиви съдбата, като се пожертва „най-скъпото“. Вграждането на икони в мостове пък прилича на някаква смесица между това жертвоприношение и чудотворната изцелителна сила, която се придава на някои икони.
Починалият две десетилетия преди издаването на „Възстановяване душевността на първобитния български човек“ германски социолог Макс Вебер смята, че модерният тип рационалност се отличава от традиционния по „разомагьосването на света“. „Разомагьосаният“ свят е този, в който суеверията и магиите нямат място, а всичко може да бъде пресметнато и да се обясни научно. Всъщност модерният човек знае много по-малко за света си от традиционния човек, защото в света на модерния има много повече неща, отбелязва Вебер. Той може да не знае как точно се движи влакът, но знае, че не е магия, и ако реши, може да схване механизма на локомотива.
Повече от век след смъртта на Макс Вебер пътната агенция на страна членка на Европейския съюз твърди, че иконите могат да пазят строители и пътуващи.
Предложение за реформа на българските институции
Остава само седмица до планираната ротация на правителството „Денков–Габриел“, а една от големите ябълки на раздора е как ще се избират новите ръководства на т.нар. регулатори. Това са държавните институции, които трябва да решават дали правилата във всевъзможни сфери се нарушават. Например дали пътищата, тунелите и мостовете са построени качествено, дали потребителите са защитени от неправомерно повишаване на сметките за телефон, дали ядем здравословна храна, какъв въздух дишаме, дали телевизиите и радиостанциите спазват елементарни стандарти и т.н., и т.н.
Вместо ГЕРБ, подкрепян от ДПС, да се кара с ПП–ДБ кой да овладее регулаторите, с риска да се стигне до предсрочни избори, може тези институции направо да се отменят. А на тяхно място да се сложат икони, които да пазят населението.
Така св. Иван Рилски ще пази пътуващите през тунели, а св. Христофор – пътуващите извън тунелите. Св. Екатерина ще закриля родилките от лекарски грешки, а светиите Лука и Пантелеймон ще помагат на лекарите да не допускат такива. Св. Трифон ще подкрепя лозарския и винарския бизнес, а като покровител на кожарите св. Илия ще бетонира бизнеса с норки на „Градус“. За качеството на образованието ще се грижат светите братя Кирил и Методий, а св. Тодор ще закриля конната езда и ще подобрява нечовешките условия в домовете за психичноболни. За повишените телефонни сметки ще можем да се оплачем на иконата на св. Димитър. И т.н.
По-сложно е положението с правосъдната реформа. За да разчитаме на независимо и некорумпирано правосъдие, май само с икони няма да се мине. За преборването на тайните мрежи на влияние, част от които бяха Петьо Еврото и Мартин Нотариуса, си трябват по-сериозни средства. Например вграждане на сенки на невести. Или за по-сигурно – най-добре би било да се вградят самите невести.
Търсят се родолюбиви български мъже, готови да жертват най-милото си (своите невести, да не помислите друго) в името на едно работещо, справедливо и европейско правосъдие.
As AdGuard Home has an API, monitoring it with Zabbix is trivial.
Communicate with the API
Communicating with AdGuard Home API is easy: pass it Authorisation: Basic XXXXXXXXXXXX header, where XXXXXXXXXX is just a Base64 hash of your AdGuard username and password. You can generate that Base64 snippet with for example
echo -n "myuser:mypassword" | base64
Next, in Zabbix, create a new HTTP Agent type item, and point it to your AdGuard Home instance.
Create some items
You’ll get the info back as JSON, so next you can create some dependent items and start monitoring. I only added
Total number of DNS requests
Blocked # of DNS requests
Redirects to safe search
Parental advisory stuff
Average request processing time
For the dependent items, you’ll then just do some JSONPath processing.
Add triggers
Next, I added a few triggers to alert me if AdGuard starts to run slower than usual.
Add service
Finally, I added AdGuard as a new business service, so I’ll get an SLA for it.
And that’s it! From now on I’ll know more about how well my home router ad-blocker is working. (Well, it also has a Skynet firewall which probably filters stuff before AdGuard Home, but that’s another story….)
This post was originally published on the author’s page.
To provide the best experiences, we use technologies like cookies to store and/or access device information. Consenting to these technologies will allow us to process data such as browsing behavior or unique IDs on this site. Not consenting or withdrawing consent, may adversely affect certain features and functions.
Functional
Always active
The technical storage or access is strictly necessary for the legitimate purpose of enabling the use of a specific service explicitly requested by the subscriber or user, or for the sole purpose of carrying out the transmission of a communication over an electronic communications network.
Preferences
The technical storage or access is necessary for the legitimate purpose of storing preferences that are not requested by the subscriber or user.
Statistics
The technical storage or access that is used exclusively for statistical purposes.The technical storage or access that is used exclusively for anonymous statistical purposes. Without a subpoena, voluntary compliance on the part of your Internet Service Provider, or additional records from a third party, information stored or retrieved for this purpose alone cannot usually be used to identify you.
Marketing
The technical storage or access is required to create user profiles to send advertising, or to track the user on a website or across several websites for similar marketing purposes.