Tag Archives: Architecture & optimization

GitHub Issues search now supports nested queries and boolean operators: Here’s how we (re)built it

Post Syndicated from Deborah Digges original https://github.blog/developer-skills/application-development/github-issues-search-now-supports-nested-queries-and-boolean-operators-heres-how-we-rebuilt-it/


Originally, Issues search was limited by a simple, flat structure of queries. But with advanced search syntax, you can now construct searches using logical AND/OR operators and nested parentheses, pinpointing the exact set of issues you care about.

Building this feature presented significant challenges: ensuring backward compatibility with existing searches, maintaining performance under high query volume, and crafting a user-friendly experience for nested searches. We’re excited to take you behind the scenes to share how we took this long-requested feature from idea to production.

Here’s what you can do with the new syntax and how it works behind the scenes

Issues search now supports building queries with logical AND/OR operators across all fields, with the ability to nest query terms. For example is:issue state:open author:rileybroughten (type:Bug OR type:Epic) finds all issues that are open AND were authored by rileybroughten AND are either of type bug or epic.

Screenshot of an Issues search query involving the logical OR operator.

How did we get here?

Previously, as mentioned, Issues search only supported a flat list of query fields and terms, which were implicitly joined by a logical AND. For example, the query assignee:@me label:support new-project translated to “give me all issues that are assigned to me AND have the label support AND contain the text new-project.

But the developer community has been asking for more flexibility in issue search, repeatedly, for nearly a decade now. They wanted to be able to find all issues that had either the label support or the label question, using the query label:support OR label:question. So, we shipped an enhancement towards this request in 2021, when we enabled an OR style search using a comma-separated list of values.

However, they still wanted the flexibility to search this way across all issue fields, and not just the labels field. So we got to work. 

Technical architecture and implementation

The architecture of the Issues search system (and the changes needed to build this feature).

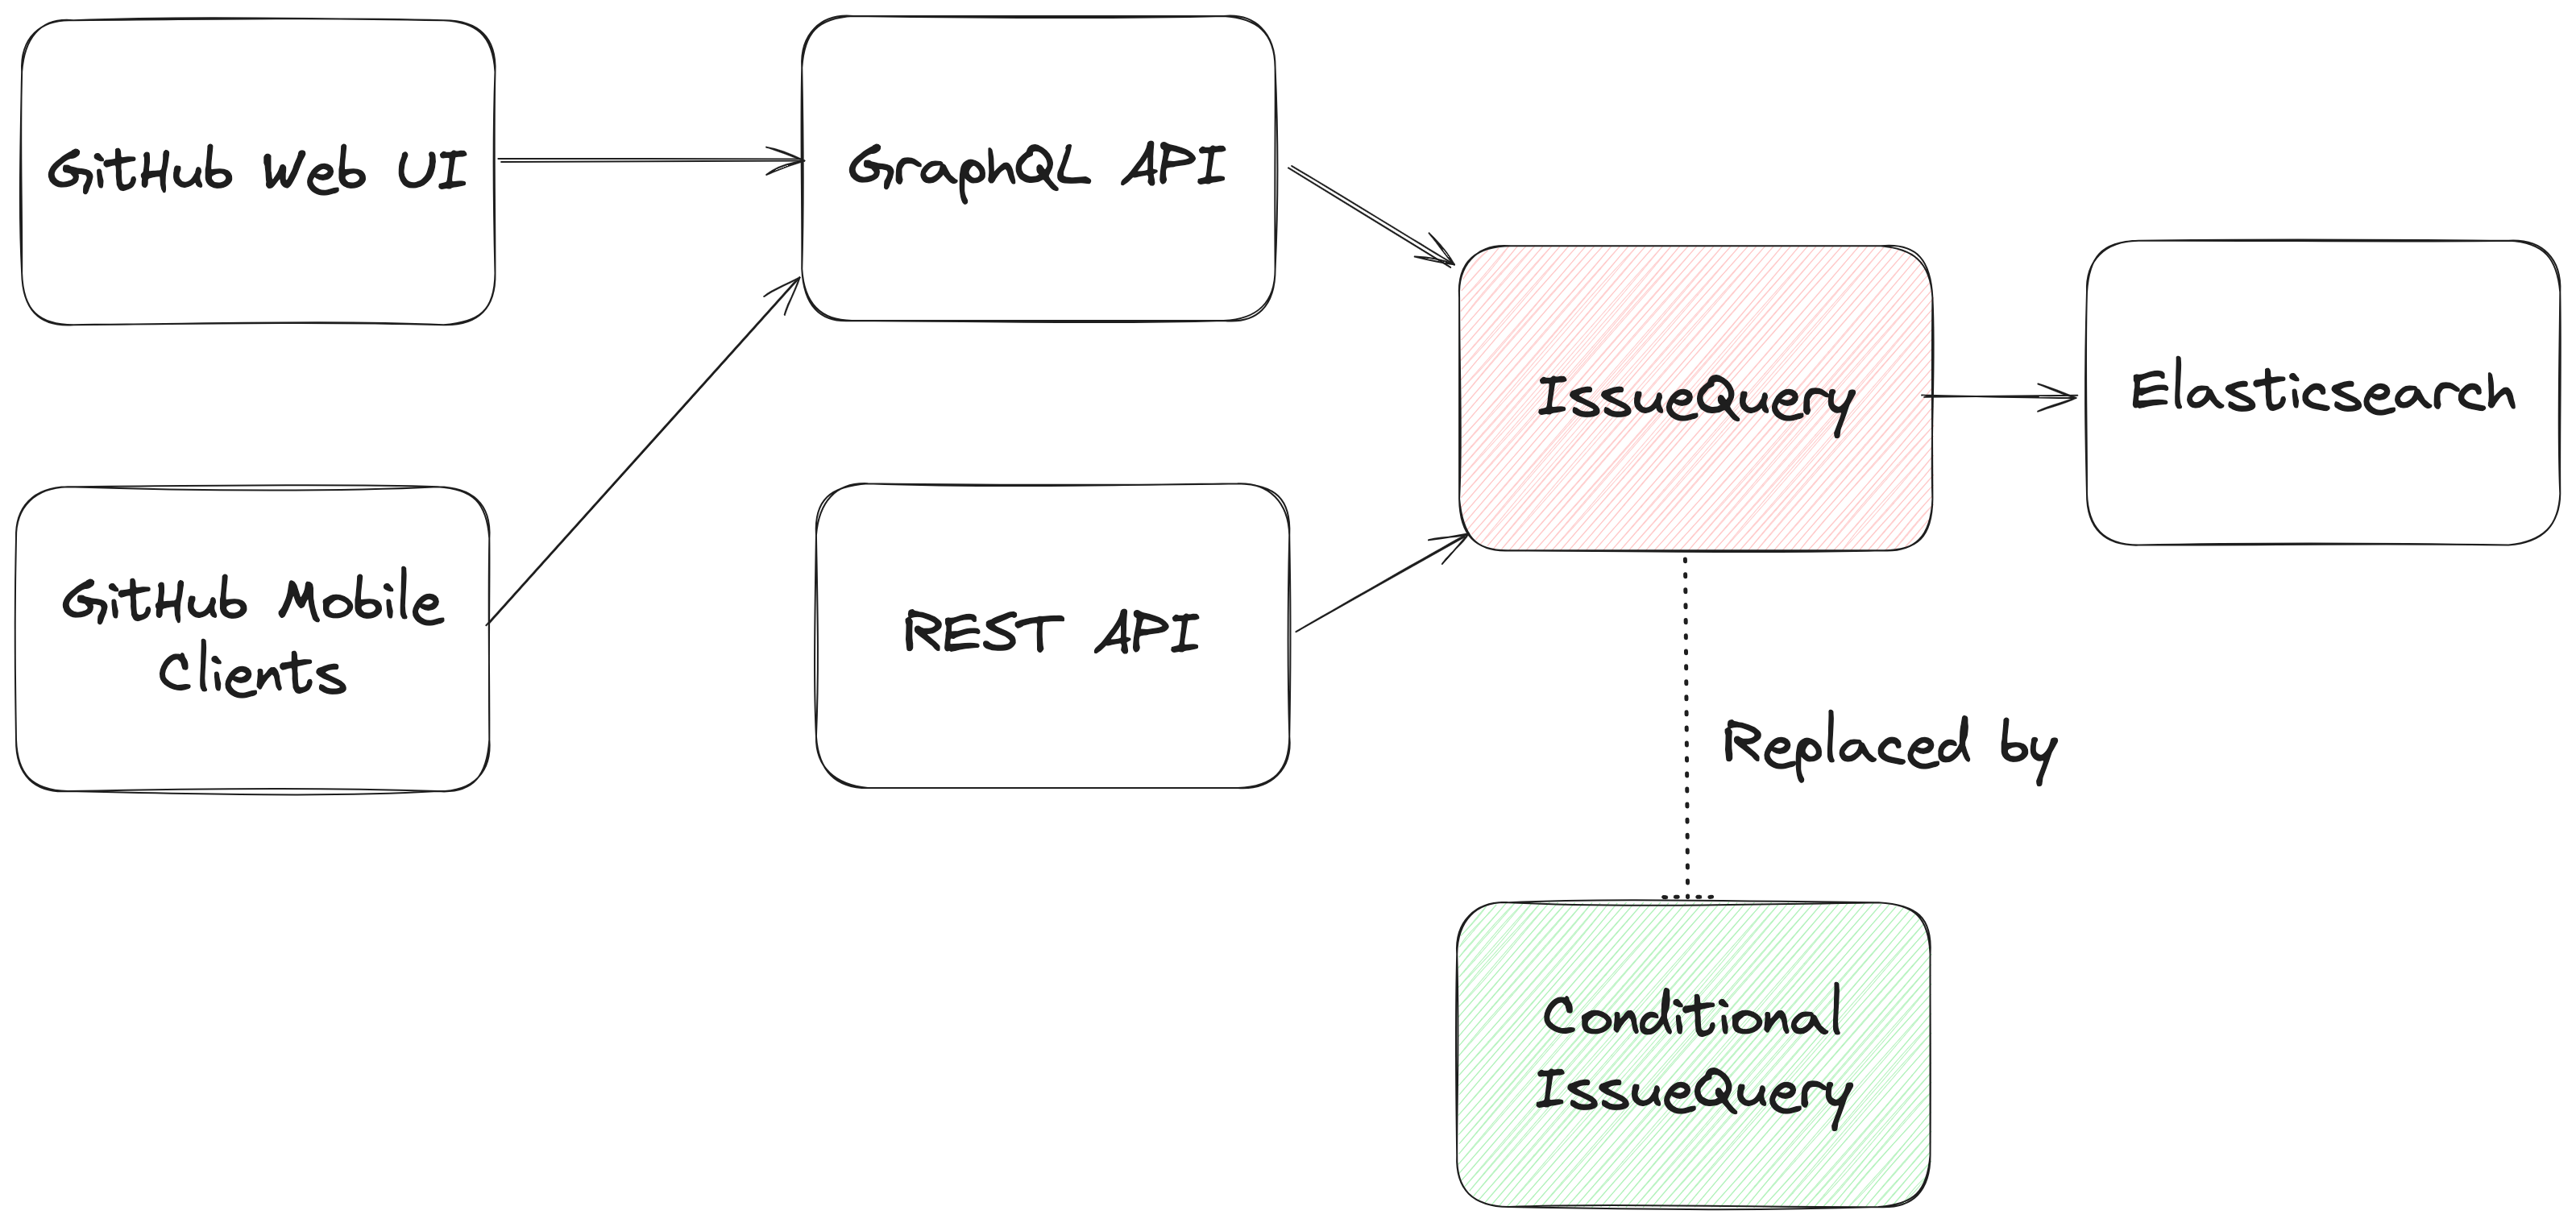
From an architectural perspective, we swapped out the existing search module for Issues (IssuesQuery), with a new search module (ConditionalIssuesQuery), that was capable of handling nested queries while continuing to support existing query formats.

This involved rewriting IssueQuery, the search module that parsed query strings and mapped them into Elasticsearch queries.

Search Architecture

To build a new search module, we first needed to understand the existing search module, and how a single search query flowed through the system. At a high level, when a user performs a search, there are three stages in its execution:

  1. Parse: Breaking the user input string into a structure that is easier to process (like a list or a tree)
  2. Query: Transforming the parsed structure into an Elasticsearch query document, and making a query against Elasticsearch.
  3. Normalize: Mapping the results obtained from Elasticsearch (JSON) into Ruby objects for easy access and pruning the results to remove records that had since been removed from the database.

Each stage presented its own challenges, which we’ll explore in more detail below. The Normalize step remained unchanged during the re-write, so we won’t dive into that one.

Parse stage

The user input string (the search phrase) is first parsed into an intermediate structure. The search phrase could include:

  • Query terms: The relevant words the user is trying to find more information about (ex: “models”)
  • Search filters: These restrict the set of returned search documents based on some criteria (ex: “assignee:Deborah-Digges”)

 Example search phrase: 

  • Find all issues assigned to me that contain the word “codespaces”:
    • is:issue assignee:@me codespaces
  • Find all issues with the label documentation that are assigned to me:
    • assignee:@me label:documentation

The old parsing method: flat list

When only flat, simple queries were supported, it was sufficient to parse the user’s search string into a list of search terms and filters, which would then be passed along to the next stage of the search process.

The new parsing method: abstract syntax tree

As nested queries may be recursive, parsing the search string into a list was no longer sufficient. We changed this component to parse the user’s search string into an Abstract Syntax Tree (AST) using the parsing library parslet.

We defined a grammar (a PEG or Parsing Expression Grammar) to represent the structure of a search string. The grammar supports both the existing query syntax and the new nested query syntax, to allow for backward compatibility.

A simplified grammar for a boolean expression described by a PEG grammar for the parslet parser is shown below:

class Parser < Parslet::Parser
  rule(:space)  { match[" "].repeat(1) }
  rule(:space?) { space.maybe }

  rule(:lparen) { str("(") >> space? }
  rule(:rparen) { str(")") >> space? }

  rule(:and_operator) { str("and") >> space? }
  rule(:or_operator)  { str("or")  >> space? }

  rule(:var) { str("var") >> match["0-9"].repeat(1).as(:var) >> space? }

  # The primary rule deals with parentheses.
  rule(:primary) { lparen >> or_operation >> rparen | var }

  # Note that following rules are both right-recursive.
  rule(:and_operation) { 
    (primary.as(:left) >> and_operator >> 
      and_operation.as(:right)).as(:and) | 
    primary }
    
  rule(:or_operation)  { 
    (and_operation.as(:left) >> or_operator >> 
      or_operation.as(:right)).as(:or) | 
    and_operation }

  # We start at the lowest precedence rule.
  root(:or_operation)
end

For example, this user search string:
is:issue AND (author:deborah-digges OR author:monalisa ) 
would be parsed into the following AST:

{
  "root": {
    "and": {
      "left": {
        "filter_term": {
          "attribute": "is",
          "value": [
            {
              "filter_value": "issue"
            }
          ]
        }
      },
      "right": {
        "or": {
          "left": {
            "filter_term": {
              "attribute": "author",
              "value": [
                {
                  "filter_value": "deborah-digges"
                }
              ]
            }
          },
          "right": {
            "filter_term": {
              "attribute": "author",
              "value": [
                {
                  "filter_value": "monalisa"
                }
              ]
            }
          }
        }
      }
    }
  }
}

Query

Once the query is parsed into an intermediate structure, the next steps are to:

  1. Transform this intermediate structure into a query document that Elasticsearch understands
  2. Execute the query against Elasticsearch to obtain results

Executing the query in step 2 remained the same between the old and new systems, so let’s only go over the differences in building the query document below.

The old query generation: linear mapping of filter terms using filter classes

Each filter term (Ex: label:documentation) has a class that knows how to convert it into a snippet of an Elasticsearch query document. During query document generation, the correct class for each filter term is invoked to construct the overall query document.

The new query generation: recursive AST traversal to generate Elasticsearch bool query

We recursively traversed the AST generated during parsing to build an equivalent Elasticsearch query document. The nested structure and boolean operators map nicely to Elasticsearch’s boolean query with the AND, OR, and NOT operators mapping to the must, should, and should_not clauses.

We re-used the building blocks for the smaller pieces of query generation to recursively construct a nested query document during the tree traversal.

Continuing from the example in the parsing stage, the AST would be transformed into a query document that looked like this:

{
  "query": {
    "bool": {
      "must": [
        {
          "bool": {
            "must": [
              {
                "bool": {
                  "must": {
                    "prefix": {
                      "_index": "issues"
                    }
                  }
                }
              },
              {
                "bool": {
                  "should": {
                    "terms": {
                      "author_id": [
                        "<DEBORAH_DIGGES_AUTHOR_ID>",
                        "<MONALISA_AUTHOR_ID>"
                      ]
                    }
                  }
                }
              }
            ]
          }
        }
      ]
    }
    // SOME TERMS OMITTED FOR BREVITY
  }
}

With this new query document, we execute a search against Elasticsearch. This search now supports logical AND/OR operators and parentheses to search for issues in a more fine-grained manner.

Considerations

Issues is one of the oldest and most heavily -used features on GitHub. Changing core functionality like Issues search, a feature with an average of  nearly 2000 queries per second (QPS)—that’s almost 160M queries a day!—presented a number of challenges to overcome.

Ensuring backward compatibility

Issue searches are often bookmarked, shared among users, and linked in documents, making them important artifacts for developers and teams. Therefore, we wanted to introduce this new capability for nested search queries without breaking existing queries for users. 

We validated the new search system before it even reached users by:

  • Testing extensively: We ran our new search module against all unit and integration tests for the existing search module. To ensure that the GraphQL and REST API contracts remained unchanged, we ran the tests for the search endpoint both with the feature flag for the new search system enabled and disabled.
  • Validating correctness in production with dark-shipping: For 1% of issue searches, we ran the user’s search against both the existing and new search systems in a background job, and logged differences in responses. By analyzing these differences we were able to fix bugs and missed edge cases before they reached our users.
    • We weren’t sure at the outset how to define “differences,” but we settled on “number of results” for the first iteration. In general, it seemed that we could determine whether a user would be surprised by the results of their search against the new search capability if a search returned a different number of results when they were run within a second or less of each other.

Preventing performance degradation

We expected more complex nested queries to use more resources on the backend than simpler queries, so we needed to establish a realistic baseline for nested queries, while ensuring no regression in the performance of existing, simpler ones.

For 1% of Issue searches, we ran equivalent queries against both the existing and the new search systems. We used scientist, GitHub’s open source Ruby library, for carefully refactoring critical paths, to compare the performance of equivalent queries to ensure that there was no regression.

Preserving user experience

We didn’t want users to have a worse experience than before just because more complex searches were possible

We collaborated closely with product and design teams to ensure usability didn’t decrease as we added this feature by:

  • Limiting the number of nested levels in a query to five. From customer interviews, we found this to be a sweet spot for both utility and usability.
  • Providing helpful UI/UX cues: We highlight the AND/OR keywords in search queries, and provide users with the same auto-complete feature for filter terms in the UI that they were accustomed to for simple flat queries.

Minimizing risk to existing users

For a feature that is used by millions of users a day, we needed to be intentional about rolling it out in a way that minimized risk to users.

We built confidence in our system by:

  • Limiting blast radius: To gradually build confidence, we only integrated the new system in the GraphQL API and the Issues tab for a repository in the UI to start. This gave us time to collect, respond to, and incorporate feedback without risking a degraded experience for all consumers. Once we were happy with its performance, we rolled it out to the Issues dashboard and the REST API.
  • Testing internally and with trusted partners: As with every feature we build at GitHub, we tested this feature internally for the entire period of its development by shipping it to our own team during the early days, and then gradually rolling it out to all GitHub employees. We then shipped it to trusted partners to gather initial user feedback.

And there you have it, that’s how we built, validated, and shipped the new and improved Issues search!

Feedback

Want to try out this exciting new functionality? Head to our docs to learn about how to use boolean operators and parentheses to search for the issues you care about!

If you have any feedback for this feature, please drop us a note on our community discussions.

Acknowledgements

Special thanks to AJ Schuster, Riley Broughten, Stephanie Goldstein, Eric Jorgensen Mike Melanson and Laura Lindeman for the feedback on several iterations of this blog post!

The post GitHub Issues search now supports nested queries and boolean operators: Here’s how we (re)built it appeared first on The GitHub Blog.

Introducing sub-issues: Enhancing issue management on GitHub

Post Syndicated from Shaun Wong original https://github.blog/engineering/architecture-optimization/introducing-sub-issues-enhancing-issue-management-on-github/


Recently we launched sub-issues, a feature designed to tackle complex issue management scenarios. This blog post delves into the journey of building sub-issues, what we learned along the way, how we implemented sub-issues, and the benefits of being able to use sub-issues to build itself.

What are sub-issues?

Sub-issues are a way to break a larger issue into smaller, more manageable tasks. With this feature, you can now create hierarchical lists within a single issue, making it easier to track progress and dependencies. By providing a clear structure, sub-issues help teams stay organized and focused on their goals.

For example, I often realize that a batch of work requires multiple steps, like implementing code in different repositories. Breaking this task into discrete sub-issues makes it easier to track progress and more clearly define the work I need to do. In practice we’ve noticed this helps keep linked PRs more concise and easier to review.

A screenshot showing a list of sub-issues on GitHub.

A brief history

Issues have long been at the heart of project management on GitHub. From tracking bugs to planning feature development, issues provide a flexible and collaborative way for teams to organize their work. Over time, we’ve enriched this foundation with tools like labels, milestones, and task lists, all to make project management even more intuitive and powerful.

One of the key challenges we set out to solve was how to better represent and manage hierarchical tasks within issues. As projects grow in complexity, breaking down work into smaller, actionable steps becomes essential. We want to empower users to seamlessly manage these nested relationships while maintaining the simplicity and clarity GitHub is known for.

Our journey toward sub-issues began with a fundamental goal: to create a system that integrates deeply into the GitHub Issues experience, enabling users to visually and functionally organize their work without adding unnecessary complexity. Achieving this required careful design and technical innovation.

Building sub-issues

To build sub-issues, we began by designing a new hierarchical structure for tasks rather than modifying the existing task list functionality. We introduced the ability to nest tasks within tasks, creating a hierarchical structure. This required updates to our data models and rendering logic to support nested sub-issues.

From a data modeling perspective, the sub-issues table stores the relationships between parent and child issues. For example, if Issue X is a parent of Issue Y, the sub-issues table would store this link, ensuring the hierarchical relationship is maintained.

In addition, we roll up sub-issue completion information into a sub-issue list table. This allows us to performantly get progress without having to traverse through a list of sub-issues. For instance, when Issue Y is completed, the system automatically updates the progress of Issue X, eliminating the need to manually check the status of all sub-issues.

We wanted a straightforward representation of sub-issues as relationships in MySQL. This approach provided several benefits, including easier support for sub-issues in environments like GitHub Enterprise Server and GitHub Enterprise Cloud with data residency.

We exposed sub-issues through GraphQL endpoints, which let us build upon the new Issues experience and leverage newly crafted list-view components. This approach provided some benefits, including more efficient data fetching and enhanced flexibility in how issue data is queried and displayed. Overall, we could move faster because we reused existing components and leveraged new components that would be used in multiple features. This was all made possible by building sub-issues in the React ecosystem.

We also focused on providing intuitive controls for creating, editing, and managing sub-issues. To this end, we worked closely with accessibility designers and GitHub’s shared components team that built the list view that powers sub-issues.

Our goal was to make it as easy as possible for users to break down their tasks without disrupting their workflow.

Using sub-issues in practice

Dogfooding is a best practice at GitHub and it’s how we build GitHub! We used sub-issues extensively within our own teams throughout the company to manage complex projects and track progress. Having a discrete area to manage our issue hierarchy resulted in a simpler, more performant experience. Through this hands-on experience, we identified areas for improvement and ensured that the feature met our high standards.

Our teams found that sub-Issues significantly improved their ability to manage large projects. By breaking down tasks into smaller, actionable items, they maintained better visibility and control over their work. The hierarchical structure also made it easier to identify dependencies and ensure nothing fell through the cracks.

Gathering early feedback

Building sub-issues was a team effort. Feedback from our beta testers was instrumental in shaping the final product and ensuring it met the needs of our community. For example, understanding how much metadata to display in the sub-issue list was crucial. We initially started with only issue titles, but eventually added the issue number and repository name, if the issue was from another repository.

Building features at GitHub makes it really easy to improve our own features as we go. It was really cool to start breaking down the sub-issues work using sub-issues. This allowed us to experience the feature firsthand and identify any pain points or areas for improvement. For example, the has:sub-issues-progress and has:parent-issue filters evolved from early discussions around filtering syntax. This hands-on approach ensured that we delivered a polished and user-friendly product.

These lessons have been invaluable in not only improving sub-issues, but also in shaping our approach to future feature development. By involving users early and actively using our own features, we can continue to build products that truly meet the needs of our community. These practices will be important to our development process going forward, ensuring that we deliver high-quality, user-centric solutions.

Call to action

Sub-issues are designed to help you break down complex tasks into manageable pieces, providing clarity and structure to your workflows. Whether you’re tracking dependencies, managing progress, or organizing cross-repository work, sub-issues offer a powerful way to stay on top of your projects.

We’d love for you to try sub-issues and see how they can improve your workflow. Your feedback is invaluable in helping us refine and enhance this feature. Join the conversation in our community discussion to share your thoughts, experiences, and suggestions.

Thank you for being an integral part of the GitHub community. Together, we’re shaping the future of collaborative development!

The post Introducing sub-issues: Enhancing issue management on GitHub appeared first on The GitHub Blog.

Breaking down CPU speed: How utilization impacts performance

Post Syndicated from Andreas Strikos original https://github.blog/engineering/architecture-optimization/breaking-down-cpu-speed-how-utilization-impacts-performance/


Introduction ⛵

The GitHub Performance Engineering team regularly conducts experiments to observe how our systems perform under varying load conditions. A consistent pattern in these experiments is the significant impact of CPU utilization on system performance. We’ve observed that as CPU utilization rises, it can lead to increased latency, which provides an opportunity to optimize system efficiency. Addressing this challenge allows us to maintain performance levels while reducing the need for additional machines, ultimately preventing inefficiencies.

Although we recognized the correlation between higher CPU utilization and increased latency, we saw an opportunity to explore the specific thresholds and impacts at various stages in greater detail. With a diverse set of instance types powered by different CPU families, we focused on understanding the unique performance characteristics of each CPU model. This deeper insight empowered us to make smarter, data-driven decisions, enabling us to provision our infrastructure with greater efficiency and confidence.

With these goals in mind, we embarked on a new journey of exploration and experimentation to uncover these insights.

Experiment setup 🧰

Collecting accurate data for this type of experiment was no easy feat. We needed to gather data from workloads that were as close to our production as possible, while also capturing how the system behaves under different phases of load. Since CPU usage patterns vary across workloads, we focused primarily on our flagship workloads. However, increasing the load could introduce small performance discrepancies, so our goal was to minimize disruption for our users.

Fortunately, a year ago, the Performance Engineering team developed an environment designed to meet these requirements, codenamed Large Unicorn Collider (LUC). This environment operates within a small portion of our Kubernetes clusters, mirroring the same architecture and configuration as our flagship workloads. It also has the flexibility to be hosted on dedicated machines, preventing interference from or with other workloads. Typically, the LUC environment remains idle, but when needed, we can direct a small, adjustable amount of traffic towards it. Activating or deactivating this traffic takes only seconds, allowing us to react quickly if performance concerns arise.

To accurately assess the impact of CPU utilization, we first established a baseline by sending moderate production traffic to a LUC Kubernetes pod hosted on one of its dedicated machines. This provided us with a benchmark for comparison. Importantly, the number of requests handled by the LUC pods remained constant throughout the experiment, ensuring consistent CPU load over time.

Once the baseline was set, we gradually increased CPU utilization using a tool called “stress,” which artificially occupies a specified number of CPU cores by running random processing tasks. Each instance type has a different number of CPU cores, so we adjusted the steps accordingly. However, the common factor across all instances was the total CPU utilization.

Note: It’s important to recognize that this is not a direct 1:1 comparison to the load generated by actual production workloads. The stress tool continuously runs mathematical operations, while our production workloads involve I/O operations and interrupts, which place different demands on system resources. Nevertheless, this approach still offers valuable insights into how our CPUs perform under load.

With the environment set up and our plan in place, we proceeded to collect as much data as possible to analyze the impact.

Results 📃

With our experiment setup finalized, let’s examine the data we gathered. As previously mentioned, we repeated the process across different instance types. Each instance type showed unique behavior and varying thresholds where performance started to decline.

As anticipated, CPU time increased for all instance types as CPU utilization rose. The graph below illustrates the CPU time per request as CPU utilization increases.

CPU time per request vs CPU utilization

The latency differences between instance types are expected due to the variations in CPU models. Focusing on the percentage increase in latency may provide more meaningful insights.

Latency percentage increase vs CPU utilization

In both graphs, one line stands out by deviating more than the others. We’ll examine this case in detail shortly.

Turbo Boost effect

An interesting observation is how CPU frequency changes as utilization increases, which can be attributed to Intel’s Turbo Boost Technology. Since all the instances we used are equipped with Intel CPUs, the impact of Turbo Boost is noticeable across all of them. In the graph below, you can see how the CPU frequency decreases as the CPU utilization increases. The red arrows are showing the CPU utilization level.

CPU Cores Frequency
CPU Cores Frequency

When CPU utilization remains at lower levels (around 30% or below), we benefit from increased core frequencies, leading to faster CPU times and, consequently, lower overall latency. However, as the demand for more CPU cores rises and utilization increases, we are likely to reach the CPU’s thermal and power limits, causing frequencies to decrease. In essence, lower CPU utilization results in better performance, while higher utilization leads to a decline in performance. For instance, a workload running on a specific node with approximately 30% CPU utilization will report faster response times compared to the same workload on the same VM when CPU utilization exceeds 50%.

Hyper-Threading

Variations in CPU frequency are not the only factors influencing performance changes. All our nodes have Hyper-Threading enabled, an Intel technology that allows a single physical CPU core to operate as two virtual cores. Although there is only one physical core, the Linux kernel recognizes it as two virtual CPU cores. The kernel attempts to distribute the CPU load across these cores, aiming to keep only one hardware thread (virtual core) busy per physical core. This approach is effective until we reach a certain level of CPU utilization. Beyond this threshold, we cannot fully utilize both virtual CPU cores, resulting in reduced performance compared to normal operation.

Finding the “Golden Ratio” of CPU utilization

Underutilized nodes lead to wasted resources, power, and space in our data centers, while nodes that are excessively utilized also create inefficiencies. As noted, higher CPU utilization results in decreased performance, which can give a misleading impression that additional resources are necessary, resulting in a cycle of over-provisioning. This issue is particularly pronounced with blocking workloads that do not follow an asynchronous model. As CPU performance deteriorates, each process can manage fewer tasks per second, making existing capacity inadequate. To achieve the optimal balance—the “Golden Ratio” of CPU utilization—we must identify a threshold where CPU utilization is sufficiently high to ensure efficiency without significantly impairing performance. Striving to keep our nodes near this threshold will enable us to utilize our current hardware more effectively alongside our existing software.

Since we already have experimental data demonstrating how CPU time increases with rising utilization, we can develop a mathematical model to identify this threshold. First, we need to determine what percentage of CPU time degradation is acceptable for our specific use case. This may depend on user expectations or performance Service Level Agreements (SLAs). Once we establish this threshold, it will help us select a level of CPU utilization that remains within acceptable limits.

We can plot the CPU utilization vs. CPU time (latency) and find the point where:

  • CPU utilization is high enough to avoid resource underutilization.
  • CPU time degradation does not exceed your acceptable limit.

A specific example derived from the data above can be illustrated in the following graph.

Percentage Increase in P50 Latency vs CPU Utilization

In this example, we aim to achieve less than 40% CPU time degradation, which would correspond to a CPU utilization of 61% on the specific instance.

Outlier case

As previously mentioned, there was a specific instance that displayed some outlying data points. Our experiment confirmed an already recognized issue where certain instances were not achieving their advertised maximum Turbo Boost CPU frequency. Instead, we observed steady CPU frequencies that fell below the maximum advertised value under low CPU utilization. In the example below, you can see an instance from a CPU family that advertises Turbo Boost frequencies above 3 GHz, but it is only reporting a maximum CPU frequency of 2.8 GHz.

CPU cores frequency
CPU cores frequency

This issue turned out to be caused by a disabled CPU C-state, which prevented the CPU cores from halting even when they were not in use. As a result, these cores were perceived as “busy” by the turbo driver, limiting our ability to take advantage of Turbo Boost benefits with higher CPU frequencies. By enabling the C-state and allowing for optimization and power reduction during idle mode, we observed the expected Turbo Boost behavior. This change had an immediate impact on the CPU time spent by our test workloads. The images below illustrate the prompt changes in CPU frequencies and latency reported following the C-state adjustment.

CPU cores frequency
CPU cores frequency
P50 CPU time on a request

Upon re-evaluating the percentage change in CPU time, we now observe similar behavior across all instances.

Percentage Increase in P50 Latency vs CPU Utilization

Wrap-up

As we anticipated many of these insights, our objective was to validate our theories using data from our complex system. While we confirmed that performance lowers as CPU utilization increases across different CPU families, by identifying optimal CPU utilization thresholds, we can achieve a better balance between performance and efficiency, ensuring that our infrastructure remains both cost-effective and high performing. Going forward, these insights will inform us of our resource provisioning strategies and help us maximize the effectiveness of our hardware investments.


Thank you for sticking with us until the end!! A special shout-out to @adrmike, @schlubbi, @terrorobe, the @github/compute-platform and finally the @github/performance-engineering team for their invaluable assistance throughout these experiments, data analysis, and for reviewing the content for accuracy and consistency. ❤️

The post Breaking down CPU speed: How utilization impacts performance appeared first on The GitHub Blog.

How we improved push processing on GitHub

Post Syndicated from Will Haltom original https://github.blog/engineering/architecture-optimization/how-we-improved-push-processing-on-github/


What happens when you push to GitHub? The answer, “My repository gets my changes” or maybe, “The refs on my remote get updated” is pretty much right—and that is a really important thing that happens, but there’s a whole lot more that goes on after that. To name a few examples:

  • Pull requests are synchronized, meaning the diff and commits in your pull request reflect your newly pushed changes.
  • Push webhooks are dispatched.
  • Workflows are triggered.
  • If you push an app configuration file (like for Dependabot or GitHub Actions), the app is automatically installed on your repository.
  • GitHub Pages are published.
  • Codespaces configuration is updated.
  • And much, much more.

Those are some pretty important things, and this is just a sample of what goes on for every push. In fact, in the GitHub monolith, there are over 60 different pieces of logic owned by 20 different services that run in direct response to a push. That’s actually really cool—we should be doing a bunch of interesting things when code gets pushed to GitHub. In some sense, that’s a big part of what GitHub is, the place you push code1 and then cool stuff happens.

The problem

What’s not so cool is that, up until recently, all of these things were the responsibility of a single, enormous background job. Whenever GitHub’s Ruby on Rails monolith was notified of a push, it enqueued a massive job called the RepositoryPushJob. This job was the home for all push processing logic, and its size and complexity led to many problems. The job triggered one thing after another in a long, sequential series of steps, kind of like this:

A flow chart from left to right. The first step is "Push". Then second step is "GitHub Rails monolith". The third step is a large block labeled "RepositoryPushJob" which contains a sequence of steps inside it. These steps are: "Apps callback", "Codespaces callback", "PRs callback", followed by a callout that there are 50+ tasks after this one. The final step is "processing task n".

There are a few things wrong with this picture. Let’s highlight some of them:

  • This job was huge, and hard to retry. The size of the RepositoryPushJob made it very difficult for different push processing tasks to be retried correctly. On a retry, all the logic of the job is repeated from the beginning, which is not always appropriate for individual tasks. For example:
    • Writing Push records to the database can be retried liberally on errors and reattempted any amount of time after the push, and will gracefully handle duplicate data.
    • Sending push webhooks, on the other hand, is much more time-sensitive and should not be reattempted too long after the push has occurred. It is also not desirable to dispatch multiples of the same webhook.
  • Most of these steps were never retried at all. The above difficulties with conflicting retry concerns ultimately led to retries of RepositoryPushJob being avoided in most cases. To prevent one step from killing the entire job, however, much of the push handling logic was wrapped in code catching any and all errors. This lack of retries led to issues where crucial pieces of push processing never occurred.
  • Tight coupling of many concerns created a huge blast radius for problems. While most of the dozens of tasks in this job rescued all errors, for historical reasons, a few pieces of work in the beginning of the job did not. This meant that all of the later steps had an implicit dependency on the initial parts of the job. As more concerns are combined within the same job, the likelihood of errors impacting the entire job increases.
    • For example, writing data to our Pushes MySQL cluster occurred in the beginning of the RepositoryPushJob. This meant that everything occurring after that had an implicit dependency on this cluster. This structure led to incidents where errors from this database cluster meant that user pull requests were not synchronized, even though pull requests have no explicit need to connect to this cluster.
  • A super long sequential process is bad for latency. It’s fine for the first few steps, but what about the things that happen last? They have to wait for every other piece of logic to run before they get a chance. In some cases, this structure led to a second or more of unnecessary latency for user-facing push tasks, including pull request synchronization.

What did we do about this?

At a high level, we took this very long sequential process and decoupled it into many isolated, parallel processes. We used the following approach:

  • We added a new Kafka topic that we publish an event to for each push.
  • We examined each of the many push processing tasks and grouped them by owning service and/or logical relationships (for example, order dependency, retry-ability).
  • For each coherent group of tasks, we placed them into a new background job with a clear owner and appropriate retry configuration.
  • Finally, we configured these jobs to be enqueued for each publish of the new Kafka event.
    • To do this, we used an internal system at GitHub that facilitates enqueueing background jobs in response to Kafka events via independent consumers.

We had to make investments in several areas to support this architecture, including:

  • Creating a reliable publisher for our Kafka event–one that would retry until broker acknowledgement.
  • Setting up a dedicated pool of job workers to handle the new job queues we’d need for this level of fan out.
  • Improving observability to ensure we could carefully monitor the flow of push events throughout this pipeline and detect any bottlenecks or problems.
  • Devising a system for consistent per-event feature flagging, to ensure that we could gradually roll out (and roll back if needed) the new system without risk of data loss or double processing of events between the old and new pipelines.

Now, things look like this:

A flow chart from left to right. The first step is "Push". The second step is "GitHub Rails monolith". The connection between the second and third step is labeled "Push event". The third step is "Kafka". The fourth step is "Kafka to job queue bridge". Then, there are 16 parallel connectors branching out from the fourth step to the next steps. These are: "AppsOnPushJob", "CodespacesOnPushJob", "PullRequestsOnPushJob", "MarketPlaceOnPushJob", "ProjectStackOnPushJob", "SecurityCenterPushJob", "IssuesOnPushJob", "PagesOnPushJob", "MaintenanceOnPushJob", "NotificationsOnPushJob", "RepositoriesOnPushJob", "ReleasesOnPushJob", "ActionsOnPushJob", "WikisOnPushJob", "SearchOnPushJob", and "Push job n".

A push triggers a Kafka event, which is fanned out via independent consumers to many isolated jobs that can process the event without worrying about any other consumers.

Results

  • A smaller blast radius for problems.
    • This can be clearly seen from the diagram. Previously, an issue with a single step in the very long push handling process could impact everything downstream. Now, issues with one piece of push handling logic don’t have the ability to take down much else.
    • Structurally, this decreases the risk of dependencies. For example, there are around 300 million push processing operations executed per day in the new pipeline that previously implicitly depended on the Pushes MySQL cluster and now have no such dependency, simply as a product of being moved into isolated processes.
    • Decoupling also means better ownership. In splitting up these jobs, we distributed ownership of the push processing code from one owning team to 15+ more appropriate service owners. New push functionality in our monolith can be added and iterated on by the owning team without unintentional impact to other teams.
  • Pushes are processed with lower latency.
    • By running these jobs in parallel, no push processing task has to wait for others to complete. This means better latency for just about everything that happens on push.
    • For example, we can see a notable decrease in pull request sync time:

    A line chart depicting the p50 pull request sync time since head ref update over several previous months. The line hovers around 3 seconds from September 2023 through November 2023. In December 2023, it drops to around 2 seconds.

  • Improved observability.

    • By breaking things up into smaller jobs, we get a much clearer picture of what’s going on with each job. This lets us set up observability and monitoring that is much more finely scoped than anything we had before, and helps us to quickly pinpoint any problems with pushes.
  • Pushes are more reliably processed.
    • By reducing the size and complexity of the jobs that process pushes, we are able to retry more things than in the previous system. Each job can have retry configuration that’s appropriate for its own small set of concerns, without having to worry about re-executing other, unrelated logic on retry.
    • If we define a “fully processed” push as a push event for which all the desired operations are completed with no failures, the old RepositoryPushJob system fully processed about 99.897% of pushes.
    • In the worst-case estimate, the new pipeline fully processes 99.999% of pushes.

Conclusion

Pushing code to GitHub is one of the most fundamental interactions that developers have with GitHub every day. It’s important that our system handles everyone’s pushes reliably and efficiently, and over the past several months we have significantly improved the ability of our monolith to correctly and fully process pushes from our users. Through platform level investments like this one, we strive to make GitHub the home for all developers (and their many pushes!) far into the future.

Notes


  1. People push to GitHub a whole lot, as you can imagine. In the last 30 days, we’ve received around 500 million pushes from 8.5 million users. 

The post How we improved push processing on GitHub appeared first on The GitHub Blog.