Tag Archives: How GitHub builds GitHub

Introducing sub-issues: Enhancing issue management on GitHub

Post Syndicated from Shaun Wong original https://github.blog/engineering/architecture-optimization/introducing-sub-issues-enhancing-issue-management-on-github/


Recently we launched sub-issues, a feature designed to tackle complex issue management scenarios. This blog post delves into the journey of building sub-issues, what we learned along the way, how we implemented sub-issues, and the benefits of being able to use sub-issues to build itself.

What are sub-issues?

Sub-issues are a way to break a larger issue into smaller, more manageable tasks. With this feature, you can now create hierarchical lists within a single issue, making it easier to track progress and dependencies. By providing a clear structure, sub-issues help teams stay organized and focused on their goals.

For example, I often realize that a batch of work requires multiple steps, like implementing code in different repositories. Breaking this task into discrete sub-issues makes it easier to track progress and more clearly define the work I need to do. In practice we’ve noticed this helps keep linked PRs more concise and easier to review.

A screenshot showing a list of sub-issues on GitHub.

A brief history

Issues have long been at the heart of project management on GitHub. From tracking bugs to planning feature development, issues provide a flexible and collaborative way for teams to organize their work. Over time, we’ve enriched this foundation with tools like labels, milestones, and task lists, all to make project management even more intuitive and powerful.

One of the key challenges we set out to solve was how to better represent and manage hierarchical tasks within issues. As projects grow in complexity, breaking down work into smaller, actionable steps becomes essential. We want to empower users to seamlessly manage these nested relationships while maintaining the simplicity and clarity GitHub is known for.

Our journey toward sub-issues began with a fundamental goal: to create a system that integrates deeply into the GitHub Issues experience, enabling users to visually and functionally organize their work without adding unnecessary complexity. Achieving this required careful design and technical innovation.

Building sub-issues

To build sub-issues, we began by designing a new hierarchical structure for tasks rather than modifying the existing task list functionality. We introduced the ability to nest tasks within tasks, creating a hierarchical structure. This required updates to our data models and rendering logic to support nested sub-issues.

From a data modeling perspective, the sub-issues table stores the relationships between parent and child issues. For example, if Issue X is a parent of Issue Y, the sub-issues table would store this link, ensuring the hierarchical relationship is maintained.

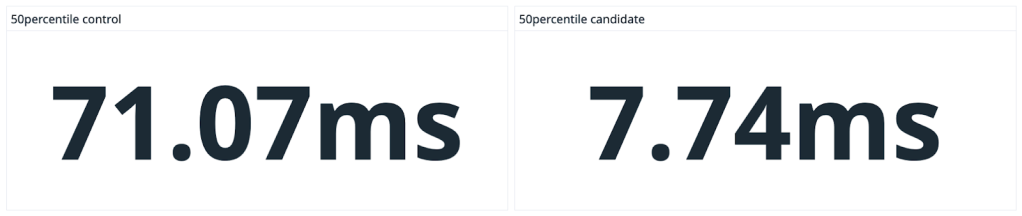
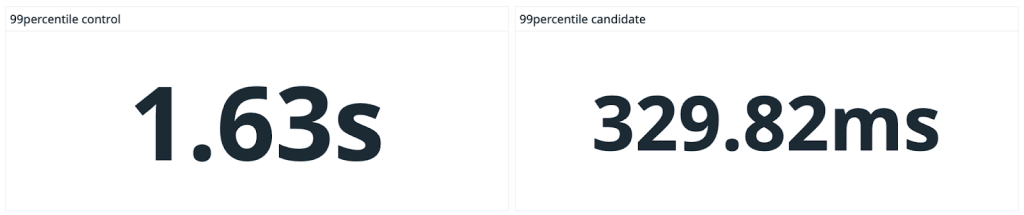
In addition, we roll up sub-issue completion information into a sub-issue list table. This allows us to performantly get progress without having to traverse through a list of sub-issues. For instance, when Issue Y is completed, the system automatically updates the progress of Issue X, eliminating the need to manually check the status of all sub-issues.

We wanted a straightforward representation of sub-issues as relationships in MySQL. This approach provided several benefits, including easier support for sub-issues in environments like GitHub Enterprise Server and GitHub Enterprise Cloud with data residency.

We exposed sub-issues through GraphQL endpoints, which let us build upon the new Issues experience and leverage newly crafted list-view components. This approach provided some benefits, including more efficient data fetching and enhanced flexibility in how issue data is queried and displayed. Overall, we could move faster because we reused existing components and leveraged new components that would be used in multiple features. This was all made possible by building sub-issues in the React ecosystem.

We also focused on providing intuitive controls for creating, editing, and managing sub-issues. To this end, we worked closely with accessibility designers and GitHub’s shared components team that built the list view that powers sub-issues.

Our goal was to make it as easy as possible for users to break down their tasks without disrupting their workflow.

Using sub-issues in practice

Dogfooding is a best practice at GitHub and it’s how we build GitHub! We used sub-issues extensively within our own teams throughout the company to manage complex projects and track progress. Having a discrete area to manage our issue hierarchy resulted in a simpler, more performant experience. Through this hands-on experience, we identified areas for improvement and ensured that the feature met our high standards.

Our teams found that sub-Issues significantly improved their ability to manage large projects. By breaking down tasks into smaller, actionable items, they maintained better visibility and control over their work. The hierarchical structure also made it easier to identify dependencies and ensure nothing fell through the cracks.

Gathering early feedback

Building sub-issues was a team effort. Feedback from our beta testers was instrumental in shaping the final product and ensuring it met the needs of our community. For example, understanding how much metadata to display in the sub-issue list was crucial. We initially started with only issue titles, but eventually added the issue number and repository name, if the issue was from another repository.

Building features at GitHub makes it really easy to improve our own features as we go. It was really cool to start breaking down the sub-issues work using sub-issues. This allowed us to experience the feature firsthand and identify any pain points or areas for improvement. For example, the has:sub-issues-progress and has:parent-issue filters evolved from early discussions around filtering syntax. This hands-on approach ensured that we delivered a polished and user-friendly product.

These lessons have been invaluable in not only improving sub-issues, but also in shaping our approach to future feature development. By involving users early and actively using our own features, we can continue to build products that truly meet the needs of our community. These practices will be important to our development process going forward, ensuring that we deliver high-quality, user-centric solutions.

Call to action

Sub-issues are designed to help you break down complex tasks into manageable pieces, providing clarity and structure to your workflows. Whether you’re tracking dependencies, managing progress, or organizing cross-repository work, sub-issues offer a powerful way to stay on top of your projects.

We’d love for you to try sub-issues and see how they can improve your workflow. Your feedback is invaluable in helping us refine and enhance this feature. Join the conversation in our community discussion to share your thoughts, experiences, and suggestions.

Thank you for being an integral part of the GitHub community. Together, we’re shaping the future of collaborative development!

The post Introducing sub-issues: Enhancing issue management on GitHub appeared first on The GitHub Blog.

How we improved availability through iterative simplification

Post Syndicated from Nick Hengeveld original https://github.blog/engineering/engineering-principles/how-we-improved-availability-through-iterative-simplification/

Solving and staying ahead of problems when scaling up a system of GitHub’s size is a delicate process. The stack is complex, and even small changes can have a big ripple effect. Here’s a look at some of the tools in GitHub’s toolbox, and how we’ve used them to solve problems. We’ll also share some of our wins and lessons we learned along the way.

Methods and tools

There are several tools that we use to keep pace with our growing system. While we can’t list them all, here are some that have been instrumental for our growth.

  • As we serve requests, there is a constant stream of related numbers that we care about. For example, we might want to know how often events are happening or how traffic levels compare to expected use. We can record metrics for each event in Datadog to see patterns over time and break them down across different dimensions, identifying areas that need focus.
  • Events also contain context that can help identify details for issues we’re troubleshooting. We send all this context to Splunk for further analysis.
  • Much of our application data is stored in MySQL, and query performance can degrade over time due to factors like database size and query frequency. We have written custom monitors that detect and report slow and timed-out queries for further investigation and remediation.
  • When we introduce changes, we often need to know how those changes affect performance. We use Scientist to test proposed changes. With this tool, we measure and report results before making the changes permanent.
  • When we’re ready to release a change, we roll it out incrementally to ensure it works as expected for all use cases. We also need to be able to roll back in the event of unexpected behavior. We use Flipper to limit the rollout to early access users, then to an increasing percentage of users as we build the confidence.

Achieving faster database queries

We recently observed a SQL query causing a high number of timeouts. Our investigation in Splunk tracked it down to GitHub’s Command Palette feature, which was loading a list of repositories. The code to generate that list looked something like this:

org_repo_ids = Repository.where(owner: org).pluck(:id)
suggested_repo_ids = Contribution.where(user: viewer, repository_id: org_repo_ids).pluck(:repository_id)

If an org has many active repositories, the second line could generate a SQL query with a large IN (...) clause with an increased risk of timing out. While we’d seen this type of problem before, there was something unique about this particular use case. We might be able to improve performance by querying the user first since a given user contributes to a relatively small number of repositories.

contributor_repo_ids = Contribution.where(user: viewer).pluck(:repository_id)
suggested_repo_ids = Repository.where(owner: org, id: contributor_repo_ids)

We created a Scientist experiment with a new candidate code block to evaluate performance. The Datadog dashboard for the experiment confirmed two things: the candidate code block returned the same results and improved performance by 80-90%.

We also did a deeper dive into the queries this feature was generating and found a couple of possible additional improvements.

The first involved eliminating a SQL query and sorting results in the application rather than asking the SQL server to sort. We followed the same process with a new experiment and found that the candidate code block performed 40-80% worse than the control. We removed the candidate code block and ended the experiment.

The second was a query filtering results based on the viewer’s level of access and did so by iterating through the list of results. The access check we needed can be batched. So, we started another experiment to do the filtering with a single batched query and confirmed that the candidate code block improved performance by another 20-80%.

While we were wrapping up these experiments, we checked for similar patterns in related code and found a similar filter we could batch. We confirmed a 30-40% performance improvement with a final experiment, and left the feature in a better place that made our developers, database administrators, and users happier.

Removing unused code

While our tooling does surface problem areas to focus on, it’s preferable to get ahead of performance issues and fix problematic areas before they cause a degraded experience. We recently analyzed the busiest request endpoints for one of our teams and found room to improve one of them before it escalated to an urgent problem.

Data for each request to the GitHub Rails application is logged in Splunk and tagged with the associated controller and action. We started by querying Splunk for the top 10 controller/action pairs in the endpoints owned by the team. We used that list to create a Datadog dashboard with a set of graphs for each controller/action that showed the total request volume, average and P99 request latency, and max request latency. We found that the busiest endpoint on the dashboard was an action responsible for a simple redirect, and that performance regularly degraded to the timeout threshold.

We needed to know what was slowing these requests down, so we dug into Datadog’s APM feature to show requests for the problematic controller/endpoint. We sorted those requests by elapsed request time to see the slowest requests first. We identified a pattern where slow requests spent a long time performing an access check that wasn’t required to send the redirect response.

Most requests to the GitHub Rails application generate HTML responses where we need to be careful to ensure that all data in the response is accessible to the viewer. We’re able to simplify the code involved by using shared Rails controller filters to verify that the viewer is allowed to see the resources they’re requesting that run before the server renders a response. These checks aren’t required for the redirect, so we wanted to confirm we could serve those requests using a different set of filters and that this approach would improve performance.

Since Rails controller filters are configured when the application boots rather than when each request is processed, we weren’t able to use a Scientist experiment to test a candidate code block. However, filters can be configured to run conditionally, which enabled us to use a Flipper feature flag to change behavior. We identified the set of filters that weren’t required for the redirect, and configured the controller to skip those filters when the feature flag was enabled. The feature flag controls let us ramp up this behavior while monitoring both performance and request status via Datadog and keeping watch for unexpected problems via Splunk.

After confirming that performance improved for P75/P99 request latency—and more importantly, reduced max latency to be more consistent and much less likely to time out—we graduated the feature and generalized the behavior so other similar controllers can use it.

What did we learn?

There are several lessons we learned throughout this process. Here are some of the main points we keep in mind.

  • The investment in observability is totally worth it! We identified and solved problems quickly because of the metric and log information we track.
  • Even when you’re troubleshooting a problem that’s been traditionally difficult to solve, the use case may be subtly different in a way that presents a new solution.
  • When you’re working on a fix, look around at adjacent code. There may be related issues you can tackle while you’re there.
  • Performance problems are a moving target. Keeping an eye open for the next one helps you fix it when it’s gotten slow rather than when it starts causing timeouts and breaking things.
  • Make small changes in ways that you can control with a gradual rollout and measure results.

The post How we improved availability through iterative simplification appeared first on The GitHub Blog.

How we improved push processing on GitHub

Post Syndicated from Will Haltom original https://github.blog/engineering/architecture-optimization/how-we-improved-push-processing-on-github/


What happens when you push to GitHub? The answer, “My repository gets my changes” or maybe, “The refs on my remote get updated” is pretty much right—and that is a really important thing that happens, but there’s a whole lot more that goes on after that. To name a few examples:

  • Pull requests are synchronized, meaning the diff and commits in your pull request reflect your newly pushed changes.
  • Push webhooks are dispatched.
  • Workflows are triggered.
  • If you push an app configuration file (like for Dependabot or GitHub Actions), the app is automatically installed on your repository.
  • GitHub Pages are published.
  • Codespaces configuration is updated.
  • And much, much more.

Those are some pretty important things, and this is just a sample of what goes on for every push. In fact, in the GitHub monolith, there are over 60 different pieces of logic owned by 20 different services that run in direct response to a push. That’s actually really cool—we should be doing a bunch of interesting things when code gets pushed to GitHub. In some sense, that’s a big part of what GitHub is, the place you push code1 and then cool stuff happens.

The problem

What’s not so cool is that, up until recently, all of these things were the responsibility of a single, enormous background job. Whenever GitHub’s Ruby on Rails monolith was notified of a push, it enqueued a massive job called the RepositoryPushJob. This job was the home for all push processing logic, and its size and complexity led to many problems. The job triggered one thing after another in a long, sequential series of steps, kind of like this:

A flow chart from left to right. The first step is "Push". Then second step is "GitHub Rails monolith". The third step is a large block labeled "RepositoryPushJob" which contains a sequence of steps inside it. These steps are: "Apps callback", "Codespaces callback", "PRs callback", followed by a callout that there are 50+ tasks after this one. The final step is "processing task n".

There are a few things wrong with this picture. Let’s highlight some of them:

  • This job was huge, and hard to retry. The size of the RepositoryPushJob made it very difficult for different push processing tasks to be retried correctly. On a retry, all the logic of the job is repeated from the beginning, which is not always appropriate for individual tasks. For example:
    • Writing Push records to the database can be retried liberally on errors and reattempted any amount of time after the push, and will gracefully handle duplicate data.
    • Sending push webhooks, on the other hand, is much more time-sensitive and should not be reattempted too long after the push has occurred. It is also not desirable to dispatch multiples of the same webhook.
  • Most of these steps were never retried at all. The above difficulties with conflicting retry concerns ultimately led to retries of RepositoryPushJob being avoided in most cases. To prevent one step from killing the entire job, however, much of the push handling logic was wrapped in code catching any and all errors. This lack of retries led to issues where crucial pieces of push processing never occurred.
  • Tight coupling of many concerns created a huge blast radius for problems. While most of the dozens of tasks in this job rescued all errors, for historical reasons, a few pieces of work in the beginning of the job did not. This meant that all of the later steps had an implicit dependency on the initial parts of the job. As more concerns are combined within the same job, the likelihood of errors impacting the entire job increases.
    • For example, writing data to our Pushes MySQL cluster occurred in the beginning of the RepositoryPushJob. This meant that everything occurring after that had an implicit dependency on this cluster. This structure led to incidents where errors from this database cluster meant that user pull requests were not synchronized, even though pull requests have no explicit need to connect to this cluster.
  • A super long sequential process is bad for latency. It’s fine for the first few steps, but what about the things that happen last? They have to wait for every other piece of logic to run before they get a chance. In some cases, this structure led to a second or more of unnecessary latency for user-facing push tasks, including pull request synchronization.

What did we do about this?

At a high level, we took this very long sequential process and decoupled it into many isolated, parallel processes. We used the following approach:

  • We added a new Kafka topic that we publish an event to for each push.
  • We examined each of the many push processing tasks and grouped them by owning service and/or logical relationships (for example, order dependency, retry-ability).
  • For each coherent group of tasks, we placed them into a new background job with a clear owner and appropriate retry configuration.
  • Finally, we configured these jobs to be enqueued for each publish of the new Kafka event.
    • To do this, we used an internal system at GitHub that facilitates enqueueing background jobs in response to Kafka events via independent consumers.

We had to make investments in several areas to support this architecture, including:

  • Creating a reliable publisher for our Kafka event–one that would retry until broker acknowledgement.
  • Setting up a dedicated pool of job workers to handle the new job queues we’d need for this level of fan out.
  • Improving observability to ensure we could carefully monitor the flow of push events throughout this pipeline and detect any bottlenecks or problems.
  • Devising a system for consistent per-event feature flagging, to ensure that we could gradually roll out (and roll back if needed) the new system without risk of data loss or double processing of events between the old and new pipelines.

Now, things look like this:

A flow chart from left to right. The first step is "Push". The second step is "GitHub Rails monolith". The connection between the second and third step is labeled "Push event". The third step is "Kafka". The fourth step is "Kafka to job queue bridge". Then, there are 16 parallel connectors branching out from the fourth step to the next steps. These are: "AppsOnPushJob", "CodespacesOnPushJob", "PullRequestsOnPushJob", "MarketPlaceOnPushJob", "ProjectStackOnPushJob", "SecurityCenterPushJob", "IssuesOnPushJob", "PagesOnPushJob", "MaintenanceOnPushJob", "NotificationsOnPushJob", "RepositoriesOnPushJob", "ReleasesOnPushJob", "ActionsOnPushJob", "WikisOnPushJob", "SearchOnPushJob", and "Push job n".

A push triggers a Kafka event, which is fanned out via independent consumers to many isolated jobs that can process the event without worrying about any other consumers.

Results

  • A smaller blast radius for problems.
    • This can be clearly seen from the diagram. Previously, an issue with a single step in the very long push handling process could impact everything downstream. Now, issues with one piece of push handling logic don’t have the ability to take down much else.
    • Structurally, this decreases the risk of dependencies. For example, there are around 300 million push processing operations executed per day in the new pipeline that previously implicitly depended on the Pushes MySQL cluster and now have no such dependency, simply as a product of being moved into isolated processes.
    • Decoupling also means better ownership. In splitting up these jobs, we distributed ownership of the push processing code from one owning team to 15+ more appropriate service owners. New push functionality in our monolith can be added and iterated on by the owning team without unintentional impact to other teams.
  • Pushes are processed with lower latency.
    • By running these jobs in parallel, no push processing task has to wait for others to complete. This means better latency for just about everything that happens on push.
    • For example, we can see a notable decrease in pull request sync time:

    A line chart depicting the p50 pull request sync time since head ref update over several previous months. The line hovers around 3 seconds from September 2023 through November 2023. In December 2023, it drops to around 2 seconds.

  • Improved observability.

    • By breaking things up into smaller jobs, we get a much clearer picture of what’s going on with each job. This lets us set up observability and monitoring that is much more finely scoped than anything we had before, and helps us to quickly pinpoint any problems with pushes.
  • Pushes are more reliably processed.
    • By reducing the size and complexity of the jobs that process pushes, we are able to retry more things than in the previous system. Each job can have retry configuration that’s appropriate for its own small set of concerns, without having to worry about re-executing other, unrelated logic on retry.
    • If we define a “fully processed” push as a push event for which all the desired operations are completed with no failures, the old RepositoryPushJob system fully processed about 99.897% of pushes.
    • In the worst-case estimate, the new pipeline fully processes 99.999% of pushes.

Conclusion

Pushing code to GitHub is one of the most fundamental interactions that developers have with GitHub every day. It’s important that our system handles everyone’s pushes reliably and efficiently, and over the past several months we have significantly improved the ability of our monolith to correctly and fully process pushes from our users. Through platform level investments like this one, we strive to make GitHub the home for all developers (and their many pushes!) far into the future.

Notes


  1. People push to GitHub a whole lot, as you can imagine. In the last 30 days, we’ve received around 500 million pushes from 8.5 million users. 

The post How we improved push processing on GitHub appeared first on The GitHub Blog.

How GitHub reduced testing time for iOS apps with new runner features

Post Syndicated from Stephen Glass original https://github.blog/engineering/infrastructure/how-github-reduced-testing-time-for-ios-apps-with-new-runner-features/


GitHub Actions 🤝 GitHub for iOS

The GitHub iOS and GitHub Actions macOS runner teams are integral parts of each other’s development inner loop. Each team partners on testing new runner images and hardware long before the features land in the hands of developers. GitHub Actions has been working hard at bringing the latest Mac hardware to the community. Apple silicon (M1) macOS runners are available for free in public repositories, along with larger options available for those jobs that need more performance.

The GitHub iOS team has been busy improving the user experience in the app, recently shipping such as GitHub Copilot Chat, code search, localization for German and Korean, and making it easier to work with issues and projects. In this blog, we will discuss how the GitHub iOS team brings the app to developers around the world, the benefits of Apple silicon, and building on GitHub Actions using macOS runners.

How GitHub reduced testing time for iOS apps with new runner features

The GitHub iOS team previously used a single workflow with one job to build and test the entire codebase on GitHub Actions that took 38 minutes to complete with the prior generation runners. The GitHub iOS app consists of about 60 first-party modules, consisting of various targets, such as dynamic frameworks, static libraries, app extensions, or the GitHub app itself. These modules range from networking layers to design system components to entire features or products, helping us maintain the app.

Breaking down the monolith

We decided to leverage the power of Apple silicon to speed up their testing process. We switched to M1 macOS runners (macos-14-xlarge YAML label) on GitHub Actions and split their test suite into separate jobs for each module. This way, they could build and test each module independently and get faster feedback. Some of the smallest modules completed their tests in as little as 2-3 minutes on M1 macOS runners, getting feedback to developers on their pull requests faster than ever before. This also made it easier to identify and fix failures on specific modules without waiting for a monolithic build to finish.

By using Apple silicon, we reduced their testing time by 60%, from 38 minutes to 15 minutes, and improved our productivity and efficiency. The figure below demonstrates how we broke down the monolith into small modules in order to improve our build times.

Image demonstrates the monolith build on tip with the total CI time. The Image below it demonstrates how per-module builds are crafted and the reduction in CI time with the new approach.

As each build is kicked off, GitHub Actions is behind the scenes preparing the required number of machines to execute the workflow. Each request is sent to the GitHub Actions service where it picks up a freshly reimaged virtual machine to execute the required number of jobs. The figure below shows how a request travels from our repository to the Actions Mac servers in Azure.

Image displays the relationship between the request for workflow to run and how a machine is assigned to a job. From left to right, the flow starts at GitHub.com, then the request is sent to Actions. Actions then finds the available macOS VM to execute the workflow.

With shorter build times and a scaling CI fleet, Apple silicon hosts allowed the GitHub iOS team to scale their jobs out across many shorter, faster steps, with GitHub Actions abstracting over the complexity of distributing CI jobs.

Analyzing CI performance

We further investigated the CI performance and divided each module’s CI into two separate steps, build and test, using xcodebuild’s build-without-testing and test-without-building. This helped us identify unit tests that ran for a long time or highlighted fast unit tests that finished in seconds.

Native development and test environments

With Apple silicon powering GitHub Actions runners and the developers’ laptops, our CI now had the same architecture as local development machines. Engineers could identify patterns that took a long time to compile or tests that failed due to the architecture from CI and fix them locally with confidence.

Benefits of Apple silicon

Apple silicon improves build performance, increases reliability, and lets iOS teams test natively for all Apple platforms throughout the software development lifecycle. They can avoid problems from cross-compilation or emulation and use the latest simulators on our GitHub Actions runner image. This ensures that their apps work well with the newest versions of iOS, iPadOS, watchOS, and tvOS. Our GitHub Actions M1 macOS runners help iOS teams leverage these benefits and deliver high-quality apps to their users faster and more efficiently. Additionally, GitHub Actions offers 50 concurrent runners for enterprise accounts and five for GitHub Free and Team plans. The GitHub for iOS team takes full advantage of these concurrent runners and initiates 50 jobs for every pull request to perform modular testing on the app in parallel.

Get started building on GitHub Actions using macOS runners

GitHub-hosted macOS runners are YAML-driven, meaning they are accessed by updating the runs on: key in your workflow file.

The post How GitHub reduced testing time for iOS apps with new runner features appeared first on The GitHub Blog.

Empowering accessibility: GitHub’s journey building an in-house Champions program

Post Syndicated from Carie Fisher original https://github.blog/engineering/engineering-principles/empowering-accessibility-githubs-journey-building-an-in-house-champions-program/

For more on this topic, check out Alexis Lucio, Catherine McNally, and Lindsey Wild‘s axe-con 2024 talk, “Establishing a Scalable A11y Education Ecosystem,” which laid the foundation for this blog post. Free registration required.

Laying the foundation

In today’s digital world, accessibility isn’t merely a checkbox—it’s the cornerstone of creating an inclusive experience for all users. At GitHub, we recognize this fundamental truth. That’s why we’ve embarked on a journey to empower developers, including those with disabilities, to participate fully and thrive on our platform. Our commitment to accessibility isn’t a one-time endeavor; it’s an ongoing effort fueled by the desire to remove barriers and make technology accessible to everyone.

As part of GitHub’s dedication to accessibility, we’ve been expanding our internal accessibility program and have scaled up our assessment process to help remove or lower barriers for users with disabilities. Naturally, as the number of assessments increased, so did the issues requiring attention, which strained our centralized accessibility team. Understanding the importance of decentralizing ownership of accessibility across the organization, we took decisive action by launching GitHub’s Accessibility Champions program. This strategic initiative empowers employees from various disciplines to drive accessibility efforts within their teams, fostering a culture where accessibility is deeply ingrained and valued.

The journey to establish GitHub’s Accessibility Champions program began with a comprehensive examination of our existing challenges and opportunities. We understood that for the program to thrive, we needed to consider various factors, including different time zones and work schedules, the expertise levels of our employees, and their ability to dedicate time to accessibility efforts due to competing priorities. By thoroughly assessing these considerations, we aimed to ensure that the program would be effective and adaptable to our team’s evolving needs.

To lay a solid foundation for the program’s success, we established clear goals and defined responsibilities for our champions upon completing their training. By setting measurable objectives and metrics to track the program’s impact on accessibility efforts both within the company and beyond, we provided our champions with a clear roadmap to follow. This proactive approach ensured we were all aligned in our efforts to make GitHub a more inclusive platform.

Starting small

At the heart of the GitHub Accessibility Champions program’s success is the development of a comprehensive and dynamic curriculum. Understanding that people have different learning preferences, GitHub took a tailored approach by assembling different types of educational resources. These resources were carefully curated to cater to various learning styles and delivered asynchronously through videos, articles, and interactive exercises.

Participants in the program received training on digital accessibility fundamentals, including WCAG guidelines, inclusive design principles, testing techniques, and content/interface accessibility best practices. They learned to identify and address accessibility barriers, advocate for accessibility within their teams, and utilize assistive technologies. Participants gained practical experience creating inclusive digital experiences through hands-on exercises and interactive discussions.

The program began with a modest group of 17 engineering champions serving as pioneers in the initiative. This small-scale pilot allowed GitHub to fine-tune the curriculum, gather valuable feedback, and iterate on the program’s structure and content. As the program evolved and gained momentum, it gradually expanded to include 52 champions from a variety of backgrounds, spanning engineering, design, and content teams. Our plan for this year is to reach over 100 internal champions to help support our accessibility goals.

This phased approach to scaling the GitHub Accessibility Champions program has proved invaluable. By starting small and gradually growing the community of champions, we were able to refine the program iteratively, ensuring it met the evolving needs of participants. Moreover, this approach fostered a strong sense of camaraderie among champions, creating a network of advocates dedicated to advancing accessibility across the organization.

Embracing feedback and iteration

Feedback was instrumental in shaping the trajectory of the GitHub Accessibility Champions program, serving as a guiding force in its evolution. As participants engaged with the program, their voices were invaluable in driving improvements and enhancements to meet their needs.

One recurring theme in the feedback was the desire for more interactive experiences and community engagement. Participants expressed a hunger for opportunities to connect with fellow champions, share insights, and collaborate on addressing accessibility challenges. In response, we introduced monthly Champions Connect meetings, providing a platform for champions to come together, exchange ideas, and foster a sense of camaraderie. These gatherings facilitated knowledge sharing and motivated and inspired champions as they navigated their accessibility journeys.

“Being able to ask questions and get answers quickly on simple matters is important to my team’s success. Or, if the questions are too complex to get immediate answers, having a forum to take the time and unpack them to get the answers.”

Participants also emphasized the importance of hands-on experiences in honing their skills and understanding of accessibility principles. Recognizing this need, we organized bug bashes and collaborative events where teams worked together to identify and address accessibility issues in real-time. These sessions provided practical learning opportunities and fostered a culture of teamwork and collective problem-solving.

In addition to enhancing engagement within the champions community, we responded to the demand for more synchronous training sessions. We hosted live sessions tailored to the specific needs of engineers and product managers, providing a platform for interactive discussions, Q&A sessions, and technical deep dives. These sessions offered a valuable opportunity for participants to engage directly with experts, seek clarification on complex topics, and deepen their understanding of accessibility best practices.

“Getting a codespace to identify issues and identify remediations is an excellent way to move from using and understanding assistive technology to taking on the role of an auditor or engineer who is verifying fixes.”

Finally, we initiated roundtable discussions with customers with disabilities, recognizing the importance of incorporating diverse perspectives into the design and development process. These interactions provided invaluable insights into the experiences and needs of users with disabilities, highlighting the critical role of inclusive design practices. By engaging directly with end-users, every champion at GitHub gained a deeper understanding of accessibility challenges and priorities, informing the development of more user-centric and inclusive digital experiences.

“Communicating the value of why we should design and create accessible documentation is key to success on my team. Everyone wants to do the right thing and is willing to do more complex tasks if they understand how it helps people better use our product.”

Overall, feedback catalyzed continuous improvement and innovation within the GitHub Accessibility Champions program. By actively listening to participant input and responding with targeted initiatives, we demonstrate our commitment to fostering a culture of accessibility and inclusion. Through ongoing engagement, collaboration, and user-centered design, GitHub continues to advance accessibility efforts, empowering all users to access and interact with its platform seamlessly.

“I loved that the training was super detailed, to a point where someone with zero information on accessibility can get started with basic concepts all the way to acknowledging problems they didn’t know existed.”

Expanding reach and impact

While we are proud of our progress so far, the GitHub Accessibility Champions program isn’t just about addressing internal challenges and setting an example for the broader tech community. By sharing our experiences and best practices, we hope to inspire other organizations to prioritize accessibility and inclusion in their own initiatives.

As we reflect on the journey of GitHub’s Accessibility Champions program, there are several key takeaways and future directions that can provide valuable insights for other teams and organizations embarking on similar initiatives:

  1. Start where you are. Take stock of your current situation and identify areas where accessibility education can be improved. Understanding your organization’s unique needs and challenges is the first step toward meaningful progress.
  2. Go where you’re wanted. Invest your resources with a clear advocacy for accessibility and a willingness to engage in educational programs. By aligning your efforts with enthusiastic stakeholders, you can maximize the impact of your initiatives.
  3. Pilot with a small group. Begin with a small group to test your programs and gather feedback before scaling up. This phased approach allows for experimentation and refinement, ensuring that your initiatives are effective and sustainable in the long run.
  4. Lean into organic partnerships. Collaborate across teams and titles to create a cohesive ecosystem of accessibility education. By leveraging the expertise and resources available within your organization, you can amplify the impact of your efforts and foster a culture of inclusivity.
  5. Seek out, review, and take action on feedback. Actively solicit feedback from participants and stakeholders and use it to inform program improvements. By listening to the needs and experiences of your audience, you can continuously iterate and enhance the effectiveness of your initiatives.
  6. Collect and re-evaluate metrics. Continuously monitor and evaluate the impact of your educational initiatives to track progress and effectiveness over time. By collecting meaningful metrics and analyzing trends, you can identify areas for improvement and demonstrate the value of your efforts to key stakeholders.

Conclusion

The GitHub Accessibility Champions program demonstrates our dedication to fostering a culture of accessibility and inclusion. By prioritizing feedback, collaboration, and responsiveness, we have created a supportive ecosystem where individuals can learn, grow, and acquire the tools to build more inclusive digital experiences. Our champions are truly a community of passionate accessibility advocates.

Looking ahead, we’re committed to enhancing the GitHub Accessibility Champions program, advancing accessibility efforts across the organization, and sharing our journey with the broader tech community—paving the way for a more inclusive digital future for all.

Please visit accessibility.github.com to learn more and to share feedback on our accessibility community discussion page.

The post Empowering accessibility: GitHub’s journey building an in-house Champions program appeared first on The GitHub Blog.

How GitHub uses merge queue to ship hundreds of changes every day

Post Syndicated from Will Smythe original https://github.blog/2024-03-06-how-github-uses-merge-queue-to-ship-hundreds-of-changes-every-day/


At GitHub, we use merge queue to merge hundreds of pull requests every day. Developing this feature and rolling it out internally did not happen overnight, but the journey was worth it—both because of how it has transformed the way we deploy changes to production at scale, but also how it has helped improve the velocity of customers too. Let’s take a look at how this feature was developed and how you can use it, too.

Merge queue is generally available and is also now available on GitHub Enterprise Server! Find out more.

Why we needed merge queue

In 2020, engineers from across GitHub came together with a goal: improve the process for deploying and merging pull requests across the GitHub service, and specifically within our largest monorepo. This process was becoming overly complex to manage, required special GitHub-only logic in the codebase, and required developers to learn external tools, which meant the engineers developing for GitHub weren’t actually using GitHub in the same way as our customers.

To understand how we got to this point in 2020, it’s important to look even further back.

By 2016, nearly 1,000 pull requests were merging into our large monorepo every month. GitHub was growing both in the number of services deployed and in the number of changes shipping to those services. And because we deploy changes prior to merging them, we needed a more efficient way to group and deploy multiple pull requests at the same time. Our solution at this time was trains. A train was a special pull request that grouped together multiple pull requests (passengers) that would be tested, deployed, and eventually merged at the same time. A user (called a conductor) was responsible for handling most aspects of the process, such as starting a deployment of the train and handling conflicts that arose. Pipelines were added to help manage the rollout path. Both these systems (trains and pipelines) were only used on our largest monorepo and were implemented in our internal deployment system.

Trains helped improve velocity at first, but over time started to negatively impact developer satisfaction and increase the time to land a pull request. Our internal Developer Experience (DX) team regularly polls our developers to learn about pain points to help inform where to invest in improvements. These surveys consistently rated deployment as the most painful part of the developer’s daily experience, highlighting the complexity and friction involved with building and shepherding trains in particular. This qualitative data was backed by our quantitative metrics. These showed a steady increase in the time it took from pull request to shipped code.

Trains could also grow large, containing the changes of 15 pull requests. Large trains frequently “derailed” due to a deployment issue, conflicts, or the need for an engineer to remove their change. On painful occasions, developers could wait 8+ hours after joining a train for it to ship, only for it to be removed due to a conflict between two pull requests in the train.

Trains were also not used on every repository, meaning the developer experience varied significantly between different services. This led to confusion when engineers moved between services or contributed to services they didn’t own, which is fairly frequent due to our inner source model.

In short, our process was significantly impacting the productivity of our engineering teams—both in our large monorepo and service repositories.

Building a better solution for us and eventually for customers

By 2020, it was clear that our internal tools and processes for deploying and merging across our repositories were limiting our ability to land pull requests as often as we needed. Beyond just improving velocity, it became clear that our new solution needed to:

  1. Improve the developer experience of shipping. Engineers wanted to express two simple intents: “I want to ship this change” and “I want to shift to other work;” the system should handle the rest.
  2. Avoid having problematic pull requests impact everyone. Those causing conflicts or build failures should not impact all other pull requests waiting to merge. The throughput of the overall system should be favored over fairness to an individual pull request.
  3. Be consistent and as automated as possible across our services and repositories. Manual toil by engineers should be removed wherever possible.

The merge queue project began as part of an overall effort within GitHub to improve availability and remove friction that was preventing developers from shipping at the frequency and level of quality that was needed. Initially, it was only focused on providing a solution for us, but was built with the expectation that it would eventually be made available to customers.

By mid-2021, a few small, internal repositories started testing merge queue, but moving our large monorepo would not happen until the next year for a few reasons.

For one, we could not stop deploying for days or weeks in order to swap systems. At every stage of the project we had to have a working system to ship changes. At a maximum, we could block deployments for an hour or so to run a test or transition. GitHub is remote-first and we have engineers throughout the world, so there are quieter times but never a free pass to take the system offline.

Changing the way thousands of developers deploy and merge changes also requires lots of communication to ensure teams are able to maintain velocity throughout the transition. Training 1,000 engineers on a new system overnight is difficult, to say the least.

By rolling out changes to the process in phases (and sometimes testing and rolling back changes early in the morning before most developers started working) we were able to slowly transition our large monorepo and all of our repositories responsible for production services onto merge queue by 2023.

How we use merge queue today

Merge queue has become the single entry point for shipping code changes at GitHub. It was designed and tested at scale, shipping 30,000+ pull requests with their associated 4.5 million CI runs, for GitHub.com before merge queue was made generally available.

For GitHub and our “deploy the merge process,” merge queue dynamically forms groups of pull requests that are candidates for deployment, kicks off builds and tests via GitHub Actions, and ensures our main branch is never updated to a failing commit by enforcing branch protection rules. Pull requests in the queue that conflict with one another are automatically detected and removed, with the queue automatically re-forming groups as needed.

Because merge queue is integrated into the pull request workflow (and does not require knowledge of special ChatOps commands, or use of labels or special syntax in comments to manage state), our developer experience is also greatly improved. Developers can add their pull request to the queue and, if they spot an issue with their change, leave the queue with a single click.

We can now ship larger groups without the pitfalls and frictions of trains. Trains (our old system) previously limited our ability to deploy more than 15 changes at once, but now we can now safely deploy 30 or more if needed.

Every month, over 500 engineers merge 2,500 pull requests into our large monorepo with merge queue, more than double the volume from a few years ago. The average wait time to ship a change has also been reduced by 33%. And it’s not just numbers that have improved. On one of our periodic developer satisfaction surveys, an engineer called merge queue “one of the best quality-of-life improvements to shipping changes that I’ve seen a GitHub!” It’s not a stretch to say that merge queue has transformed the way GitHub deploys changes to production at scale.

How to get started

Merge queue is available to public repositories on GitHub.com owned by organizations and to all repositories on GitHub Enterprise (Cloud or Server).

To learn more about merge queue and how it can help velocity and developer satisfaction on your busiest repositories, see our blog post, GitHub merge queue is generally available.

Interested in joining GitHub? Check out our open positions or learn more about our platform.

The post How GitHub uses merge queue to ship hundreds of changes every day appeared first on The GitHub Blog.

GitHub’s Engineering Fundamentals program: How we deliver on availability, security, and accessibility

Post Syndicated from Deepthi Rao Coppisetty original https://github.blog/2024-02-08-githubs-engineering-fundamentals-program-how-we-deliver-on-availability-security-and-accessibility/


How do we ensure over 100 million users across the world have uninterrupted access to GitHub’s products and services on a platform that is always available, secure, and accessible? From our beginnings as a platform for open source to now also supporting 90% of the Fortune 100, that is the ongoing challenge we face and hold ourselves accountable for delivering across our engineering organization.

Establishing engineering governance

To meet the needs of our increased number of enterprise customers and our continuing innovation across the GitHub platform, we needed to address tech debt, improve reliability, and enhance observability of our engineering systems. This led to the birth of GitHub’s engineering governance program called the Fundamentals program. Our goal was to work cross-functionally to define, measure, and sustain engineering excellence with a vision to ensure our products and services are built right for all users.

What is the Fundamentals program?

In order for such a large-scale program to be successful, we needed to tackle not only the processes but also influence GitHub’s engineering culture. The Fundamentals program helps the company continue to build trust and lead the industry in engineering excellence, by ensuring that there is clear prioritization of the work needed in order for us to guarantee the success of our platform and the products that you love.

We do this via the lens of three program pillars, which help our organization understand the focus areas that we emphasize today:

  1. Accessibility (A11Y): Truly be the home for all developers
  2. Security: Serve as the most trustworthy platform for developers
  3. Availability: Always be available and on for developers

In order for this to be successful, we’ve relied on both grass-roots support from individual teams and strong and consistent sponsorship from our engineering leadership. In addition, it requires meaningful investment in the tools and processes to make it easy for engineers to measure progress against their goals. No one in this industry loves manual processes and here at GitHub we understand anything that is done more than once must be automated to the best of our ability.

How do we measure progress?

We use Fundamental Scorecards to measure progress against our Availability, Security, and Accessibility goals across the engineering organization. The scorecards are designed to let us know that a particular service or feature in GitHub has reached some expected level of performance against our standards. Scorecards align to the fundamentals pillars. For example, the secret scanning scorecard aligns to the Security pillar, Durable Ownership aligns to Availability, etc. These are iteratively evolved by enhancing or adding requirements to ensure our services are meeting our customer’s changing needs. We expect that some scorecards will eventually become concrete technical controls such that any deviation is treated as an incident and other automated safety and security measures may be taken, such as freezing deployments for a particular service until the issue is resolved.

Each service has a set of attributes that are captured and strictly maintained in a YAML file, such as a service tier (tier 0 to 3 based on criticality to business), quality of service (QoS values include critical, best effort, maintenance and so on based on the service tier), and service type that lives right in the service’s repo. In addition, this file also has the ownership information of the service, such as the sponsor, team name, and contact information. The Fundamental scorecards read the service’s YAML file and start monitoring the applicable services based on their attributes. If the service does not meet the requirements of the applicable Fundamental scorecard, an action item is generated with an SLA for effective resolution. A corresponding issue is automatically generated in the service’s repository to seamlessly tie into the developer’s workflow and meet them where they are to make it easy to find and resolve the unmet fundamental action items.

Through the successful implementation of the Fundamentals program, we have effectively managed several scorecards that align with our Availability, Security, and Accessibility goals, including:

  • Durable ownership: maintains ownership of software assets and ensures communication channels are defined. Adherence to this fundamental supports GitHub’s Availability and Security.
  • Code scanning: tracks security vulnerabilities in GitHub software and uses CodeQL to detect vulnerabilities during development. Adherence to this fundamental supports GitHub’s Security.
  • Secret scanning: tracks secrets in GitHub’s repositories to mitigate risks. Adherence to this fundamental supports GitHub’s Security.
  • Incident readiness: ensures services are configured to alert owners, determine incident cause, and guide on-call engineers. Adherence to this fundamental supports GitHub’s Availability.
  • Accessibility: ensures products and services follow our accessibility standards. Adherence to this fundamental enables developers with disabilities to build on GitHub.
An example secret scanning scorecard showing 100% compliance for having no secrets in the repository, push protection enabled, and secret scanning turned on.
Example secret scanning scorecard

A culture of accountability

As much emphasis as we put on Fundamentals, it’s not the only thing we do: we ship products, too!

We call it the Fundamentals program because we also make sure that:

  1. We include Fundamentals in our strategic plans. This means our organization prioritizes this work and allocates resources to accomplish the fundamental goals we each quarter. We track the goals on a weekly basis and address the roadblocks.
  2. We surface and manage risks across all services to the leaders so they can actively address them before they materialize into actual problems.
  3. We provide support to teams as they work to mitigate fundamental action items.
  4. It’s clearly understood that all services, regardless of team, have a consistent set of requirements from Fundamentals.

Planning, managing, and executing fundamentals is a team affair, with a program management umbrella.

Designated Fundamentals champions and delegates help maintain scorecard compliance, and our regular check-ins with engineering leaders help us identify high-risk services and commit to actions that will bring them back into compliance. This includes:

  1. Executive sponsor. The executive sponsor is a senior leader who supports the program by providing resources, guidance, and strategic direction.
  2. Pillar sponsor. The pillar sponsor is an engineering leader who oversees the overarching focus of a given pillar across the organization as in Availability, Security, and Accessibility.
  3. Directly responsible individual (DRI). The DRI is an individual responsible for driving the program by collaborating across the organization to make the right decisions, determine the focus, and set the tempo of the program.
  4. Scorecard champion. The scorecard champion is an individual responsible for the maintenance of the scorecard. They add, update, and deprecate the scorecard requirements to keep the scorecard relevant.
  5. Service sponsors. The sponsor oversees the teams that maintain services and is accountable for the health of the service(s).
  6. Fundamentals delegate. The delegate is responsible for coordinating Fundamentals work with the service owners within their org, supporting the Sponsor to ensure the work is prioritized, and resources committed so that it gets completed.

Results-driven execution

Making the data readily available is a critical part of the puzzle. We created a Fundamentals dashboard that shows all the services with unmet scorecards sorted by service tier and type and filtered by service owners and teams. This makes it easier for our engineering leaders and delegates to monitor and take action towards Fundamental scorecards’ adherence within their orgs.

As a result:

  • Our services comply with durable ownership requirements. For example, the service must have an executive sponsor, a team, and a communication channel on Slack as part of the requirements.
  • We resolved active secret scanning alerts in repositories affiliated with the services in the GitHub organization. Some of the repositories were 15 years old and as a part of this effort we ensured that these repos are durably owned.
  • Business critical services are held to greater incident readiness standards that are constantly evolving to support our customers.
  • Service tiers are audited and accurately updated so that critical services are held to the highest standards.

Example layout and contents of Fundamentals dashboard

Tier 1 Services Out of Compliance [Count: 2]
Service Name Service Tier Unmet Scorecard Exec Sponsor Team
service_a 1 incident-readiness john_doe github/team_a
service_x 1 code-scanning jane_doe github/team_x

Continuous monitoring and iterative enhancement for long-term success

By setting standards for engineering excellence and providing pathways to meet through standards through culture and process, GitHub’s Fundamentals program has delivered business critical improvements within the engineering organization and, as a by-product, to the GitHub platform. This success was possible by setting the right organizational priorities and committing to them. We keep all levels of the organization engaged and involved. Most importantly, we celebrate the wins publicly, however small they may seem. Building the culture of collaboration, support, and true partnership has been key to sustaining the ongoing momentum of an organization-wide engineering governance program, and the scorecards that monitor the availability, security, and accessibility of our platform so you can consistently rely on us to achieve your goals.

Want to learn more about how we do engineering GitHub? Check out how we build containerized services, how we’ve scaled our CI to 15,000 jobs every hour using GitHub Actions larger runners, and how we communicate effectively across time zones, teams, and tools.

Interested in joining GitHub? Check out our open positions or learn more about our platform.

The post GitHub’s Engineering Fundamentals program: How we deliver on availability, security, and accessibility appeared first on The GitHub Blog.

How GitHub’s Developer Experience team improved innerloop development

Post Syndicated from belaltaher8 original https://github.blog/2024-01-24-how-githubs-developer-experience-team-improved-innerloop-development/


Building confidence in new code before deploying is a crucial part of any good development loop. This is especially challenging when working in a distributed or microservice system with multiple teams operating on different services. This modular team structure gives rise to an important question: how can we provide teams with fast and reliable development cycles when testing and shipping requires them to test inside an ecosystem of other services? Optimizing the solution to this problem greatly improves engineering efficiency and can contribute to more successful outcomes for the organization as a whole.

This problem is one the Developer Experience (DX) team at GitHub grappled with again and again, ultimately delivering a solution we call “Hubber Codespace” (HCS). HCS is a tool that Hubbers (people who work at GitHub) can use to locally stand up the entire distributed GitHub ecosystem in any environment by simply querying an endpoint or adding a couple lines of configuration to their development containers.

In this post, we’ll tell you how we landed on the HCS solution to this common problem over some possible alternatives, and you’ll get a first-hand look at how GitHub’s developer-first mindset helped us deliver the best tool for Hubbers to ship code quickly and safely in our own distributed environment.

One big (un)-happy environment

To understand the problem we were trying to solve, we have to go back in time. There was a point at which GitHub was just a couple teams and a much simpler product. Back then, having a monorepo in which everyone iterated and built confidence in their changes made sense. Splitting responsibilities up across repositories would have added overhead that bogged down early Hubbers. Fast forward to today, and GitHub has grown into a big organization with hundreds of different teams. Now, the balancing act of evaluating between velocity vs. complexity can look very different.

Let’s consider these complexities a bit further. Different services can have entirely different sets of dependencies and even have dependencies on different versions of the same software (for example, one service requires Ruby 2.2 while another requires Ruby 2.4). In smaller collaborative settings, the engineers can easily reconcile these needs. But this complexity grows exponentially as more teams are introduced. Trying to provide a single environment in which these kinds of disparate services can run and interact in development becomes difficult to do. It can result in ad-hoc “hacks” in development loops like deleting a .ruby-version file depending on which service’s development loop you’re working through. These are the kinds of problems that you encounter when trying to work with a monorepo that contains the codebases for a set of disparate services.

So, we decided to design a new solution. Instead of bringing the developers to the ecosystem, what if we brought the ecosystem to the developers?

Enter HCS

This line of thinking led us to build HCS, a Docker-Compose project that does exactly that. In the post “How we build containerized services at GitHub using GitHub,” we detailed how we build containerized services that power microservices on the GitHub.com platform and many internal tools. Our task now was to take these containers and wire them up such that partner teams could spin up a full GitHub ecosystem on demand. This would allow them to test their changes in an integrated environment. Developers could see how their code behaves when introduced to GitHub’s distributed system, rather than only observing it in the isolated environment of the application being developed before deploying within the full system. In this way, developers could gain confidence that the services they were changing behaved correctly when interacting with their up and downstream dependencies.

When considering how to orchestrate all the required containers, a few solutions came to mind: Docker-Compose, an internal tool called Codespace-Compose that allows us to SSH tunnel between multiple codespaces, and Minikube. Any of these three solutions could solve the ecosystem problem and would have unique tradeoffs. Let’s look at some of those tradeoffs now.

Minikube offers a robust Kubernetes architecture, but we had concerns about the overall user experience. We ultimately decided against it as the issues we identified, such as networking complexity and long cycle times, could bog down development speed.

Codespace-Compose allows us to easily connect teams’ everyday development environments, but we reasoned that, since Codespace-Compose is an internal experiment without any SLA, we’d incur a maintenance cost on our own team by adopting this.

Docker-Compose seemed to fit our needs the best. It didn’t incur any additional maintenance burden since it’s publicly available and actively managed. It offers all the same benefits of Minikube without the long cycle time. Most importantly, using Docker in Docker in a codespace, which allows us to create docker containers on a host which is a docker container itself, is a well-paved path that has lots of prior art. Given all these considerations, we decided on orchestrating our containers using Docker-Compose.

After deciding on Docker-Compose as our orchestrator, the next steps were to figure out the interface. Docker-Compose already supplies end users with commands, but we wanted to optimize the UX around HCS. To do this, we built a user-friendly CLI in Golang with parallel versioning to HCS. This abstracted away all the complexity of using the two together. Simply download a specific release version for HCS, get the same version of the CLI binary, and you’re good to go!

CLI and release automation

Ensuring HCS is useful means ensuring a couple of things. One important goal is ease of use. Docker-Compose already offers an interface for end users, but considering some of the built in commands are long and use predictable options, we decided to wrap it in a custom Golang CLI. This abstracted many of the underlying details away, such as static file locations, formatting options, entrypoint commands, etc. to improve end-user experience. The code below shows this by juxtaposing the Docker-Compose commands with their equivalent HCS CLI command.

The following example compares the commands to start up the integrated environment provided by HCS.

# Start using Docker-Compose

docker compose --project-name hcs \
--file /workspaces/hubber-codespace-dist/docker-compose-hcs-actions.yml \
--file /workspaces/hubber-codespace-dist/docker-compose-hcs-base.yml \
--file /workspaces/hubber-codespace-dist/docker-compose-hcs-bg.yml \
--file /workspaces/hubber-codespace-dist/docker-compose-hcs-core.yml \
--file /workspaces/hubber-codespace-dist/docker-compose-hcs-volume.yml \
--file /workspaces/hubber-codespace-dist/docker-compose-hcs-test.yml \
--file /workspaces/hubber-codespace-dist/docker-compose-hcs-vendor.yml \
--profile full up -d --remove-orphans

# Start using CLI

hcs start

This next example compares how to get a shell to run commands from inside the various containers in GitHub’s distributed ecosystem. This allows developers to modularly interact with and make ephemeral changes to the system.

# Run command from inside a container in the system using Docker-Compose

docker compose --project-name hcs exec bash

# Run from inside a container using CLI

hcs shell

This example compares how to check the status of the containers in the project so end-users can easily see the health of the entire system.

# Status using Docker-Compose

docker compose --project-name hcs ps --format json

# Status using CLI

hcs status

In addition to this easy-to-use and ergonomic CLI, we had to ensure that HCS runs an up-to-date version of the GitHub ecosystem. GitHub is made up of so many different moving pieces that testing new changes on code that’s even a couple days old would not be sufficient to build confidence. When iterating directly on the monorepo, this was a non-issue since folks just fetched the main branch. For HCS, this required us to build automation that cuts releases on a frequent cron schedule. A release of HCS is a software artifact containing the compiled Golang binary for HCS and its CLI that can be pulled using the gh CLI.

The diagram below illustrates how this process works.

This diagram shows the nightly release cycle of HCS. HCS's repository gets SHAs from the monorepo and other service repositories. Then it publishes a release with all the SHAs, the Docker-Compose configs, and the CLI binary.

End-user experience

Using HCS directly in your codespace

We’ve recently made efforts to push all development at GitHub onto GitHub Codespaces. A codespace is a custom development container, or devcontainer, based on a configuration file in a repository. A repository can have multiple codespaces associated with it as long as each has a unique configuration file. On top of the obvious benefits of having a reproducible environment on demand to develop and iterate in, devcontainers offer features. This abstraction allows developers to easily add software to their environments. HCS is also consumable this way. The code block below shows the couple lines needed to bring this entire ecosystem to a partner team’s preferred environment (that is, their codespace).

{
…
  "features": {
    …
    "ghcr.io/devcontainers/features/github-cli:1": {
      "version": "latest"
    },
    //docker-in-docker required for hcs
    "ghcr.io/devcontainers/features/docker-in-docker:2": {},
    // Include the hubber-codespace feature
    "ghcr.io/github/hubber-codespace/hcs:1": {},
    "ghcr.io/devcontainers/features/go:1": {}
    …
  }
}

Now, teams can perform integration testing against the many other services in GitHub’s ecosystem from directly in the codespace where they were doing local development.

Release binary

Even with the push towards codespaces, not every context that requires an ecosystem will be a devcontainer. In light of this, we also gave end users the option to download the release directly from the GitHub API. The commands to do so can be seen below. With a couple simple commands, Hubbers now have everything they need to bring the entire GitHub ecosystem to whatever environment they want.

gh release download --repo github/hubber-codespace  -p hcs -D /tmp/

chmod +x /tmp/hcs

sudo mv /tmp/hcs /usr/local/bin

hcs init

hcs pull

hcs start

Testimonials

But don’t just take my word for it. Check out what our partner teams have had to say about HCS improving their development loop:

“HCS has improved our dev loop for [our service] by making it simple to test [it] against [the rest of GitHub’s ecosystem]. It’s turned what used to be a number of manual steps to clone our repository into the [monorepo environment] into two simple commands in our own codespace. This has made it much easier to validate our changes without having to deploy to a staging environment.”

“Given that we are a service operating outside GitHub but with a heavy reliance on the services running within GitHub, we’ve had to go through a lot of bells and whistles to ensure we can have a smooth development experience. In my four years working on [our service], HCS has been the most seamless experience in going from a blank devbox to breakpointing live running code for our service.”

Conclusion

Solving the ecosystem problem is always a balancing act. Luckily, thanks to GitHub’s push towards containerization, and tooling such as repository automation and publishing/consuming releases through the GitHub CLI, we were adequately equipped to develop a solution with HCS. Hubbers can now leverage a development loop that allows them to deploy with confidence, having tested their changes within GitHub’s complex multi-service system.

The post How GitHub’s Developer Experience team improved innerloop development appeared first on The GitHub Blog.

How we organize and get things done with SERVICEOWNERS

Post Syndicated from Max Beizer original https://github.blog/2023-12-19-how-we-organize-and-get-things-done-with-serviceowners/


GitHub’s primary codebase is a large Ruby on Rails monolith with over 4.2 million lines of code across roughly 30,000 files. As the platform has grown over the years, we have come to realize that we need a new way to organize and think about the systems we run. Our traditional approach to organizing Hubbers and code has been through CODEOWNERS in combination with GitHub teams, organizations, issues, and repositories. However, as GitHub’s user base continues to grow, we have discovered we need a new layer of abstraction. This is where SERVICEOWNERS comes in.

Service-oriented architecture is not new, but we do not talk often about how large engineering teams organize around services–especially in a hybrid monolith/services architecture. GitHub engineering determined that we were missing a layer in between CODEOWNERS, how we group humans, and work to be done. Injecting a “service” layer between groups of functionality and the people maintaining them opens up a number of interesting possibilities.

One side-effect of adopting SERVICEOWNERS was realizing that the “ownership” model does not quite express how we work. Given our place in the open source ecosystem and what we value as a company, we thought the “maintainer” model more accurately describes the relationships between services and teams. So, no team “owns” anything, but instead they “maintain” various services.

Consistent, company-wide grouping

Achieving consistency in how we map running code–both within and without our monolith–to humans has had a number of positive outcomes. It promotes a shared lexicon, and, therefore, a shared understanding. The durability of services reduces the disruption of team reorganization. As priorities shift, services stay the same and require only minimal updates to yaml metadata to be accurate. Consistency in our service definitions also allows us to centralize information about the services we run into a service catalog. Our service catalog is the one-stop shop for up-to-date information on the services that power GitHub. Within the catalog, Hubbers of all stripes can find information on, for example, how a service is performing vis-a-vis an SLO. Each service in the service catalog also has a number of scorecards as part of our fundamentals program.

With clearly defined services collected in a service catalog, we can easily visualize the relationships between services. We can identify dependencies and map how information flows through the platform. All this information improves the onboarding experience for new engineers, too, as the relationships between services define the platform architecture—without having to rely on out-of-date docs or hand-waving to explain our architecture.

The service catalog also has the huge benefit of centralizing information about which teams maintain which services, how to reach an on-call engineer, and what expectations the service has set in terms of support SLAs. Clean lines of communication to maintainers of running services has been a huge help in reducing our incident remediation time. Incident commanders know how to contact on-call engineers because they can find it in the service catalog. All of this is only possible thanks to SERVICEOWNERS.

How it works

a diagram depicting the connections between the GitHub monolith, the service catalog, repositories, and teams.

The SERVICEOWNERS file

A SERVICEOWNERS file lives next to the CODEOWNERS file within our monolith. Like a traditional CODEOWNERS file, SERVICEOWNERS consists of a series of glob patterns (for example, app/api/integration*), directory names (for example, config/access_control/) and filenames (for example, app/api/grants.rb) followed by a service name (for example :apps maps to the team github/apps). Our CI enforces rules like:

  • There can be no duplicate patterns/directories/files in SERVICEOWNERS.
  • All new files added to the github/github repository must have a service owner.
  • All patterns/directories/files must match at least one existing file.
  • Files matched by multiple glob patterns must be disambiguated by a file or directory definition.

The service-mappings.yaml file

A service-mappings file defines how services referenced in the SERVICEOWNERS file relate to services in the service catalog and GitHub teams. This configuration can define a service’s product manager, engineering manager, repository, and chat information. Service mappings can also define information about a service’s various classifications, such as its “tier” rating, with zero being critical to the GitHub platform and three being experimental/non-critical.

The serviceowners gem

We have developed a Ruby gem we integrate with our Rails app that combines data from the SERVICEOWNERS and service-mappings files to produce several types of output. The serviceowners gem generates our CODEOWNERS file. So, instead of manually updating CODEOWNERS, changing which team or teams maintain a service is a one-line YAML change. The serviceowners gem also has an executable which allows engineers to query information about the maintainer of a file or which files a service maintains.

Because it’s GitHub, there’s of course also a chat-op for that:

me: hubot serviceowners for test/jobs/do_the_thing_with_the_stuff_test.rb

hubot: The file test/jobs/do_the_thing_with_the_stuff_test.rb is part of the github/some_service service and is maintained by the cool-fun-team team who can be reached in #hijinx.

The ownership.yaml file

The above examples mostly focus on breaking up the monolith into services, but our service catalog can slurp up service information from any repository within the GitHub org that has an ownership.yaml file. Like the service-mappings file, ownership expresses version controlled values for various service metadata. This allows us to have the boundaries of a service span across multiple repositories; for example, the GitHub Desktop app can have a component service within the monolith while also having its own standalone artifact from a different repository. Another benefit of the ownership file is that it allows us to focus code changes to the monolith codebase primarily around functionality and not maintainership.

Conclusion

The combination of CODEOWNERS and SERVICEOWNERS has provided serious value for us at GitHub. The tooling we continue to build atop these primitives will serve to make maintaining services clearer and easier. That’s good news for the future of GitHub. It also pairs quite nicely with our open source identity and access management project, entitlements, too. If SERVICEOWNERS sounds like something your organization, open source or corporate alike, would benefit from, let us know on X at @github.

The post How we organize and get things done with SERVICEOWNERS appeared first on The GitHub Blog.

How to communicate like a GitHub engineer: our principles, practices, and tools

Post Syndicated from Ben Balter original https://github.blog/engineering/engineering-principles/how-to-communicate-like-a-github-engineer-our-principles-practices-and-tools/

As a company that’s been remote-first since day one, GitHub Engineering has learned a lot about how to communicate effectively across time zones, teams, and tools. We’ve distilled our experience into a set of guidelines that we call “How we communicate,” and we’re sharing them with you today. We hope that by sharing our communication practices publicly, we can help other organizations that are embracing remote work or want to improve their collaboration culture.

Read on to learn more about how we use GitHub to build GitHub, how we turned our guiding communications principles into prescriptive practices to manage our internal communications signal-to-noise ratio, and how you can contribute to the ongoing conversation.

Using GitHub to build GitHub

Unlike many companies that made the transition to remote work during the pandemic, GitHub has been majority remote since its founding 15 years ago. GitHub’s remote-first communication style originally drew inspiration from the open source community. Open source development rarely requires the global community of collaborators and contributors to be in a certain place, at a certain time, in order to participate in the ongoing conversation. This is the same approach GitHub Engineering takes to our own internal communication. We believe that asynchronous communication is the best way to work globally and at scale, and as a result, we’ve built our culture around it.

We’ve always used GitHub to build GitHub. GitHub is not only the place where we host and review code, but also where we plan, discuss, and document our work. We use issues, pull requests, projects, and discussions to track work, collaborate on features, and share information across teams. Many of these communications patterns grew organically, as developers adopted practices from the open source community for our own internal collaboration needs. We believe open practices are the best way to work with a global and diverse team, and to make decisions that are informed, inclusive, and scalable.

While asynchronous collaboration is deeply embedded in GitHub’s DNA, we have also long had a culture of each team enjoying a great deal of autonomy in deciding how they communicate day to day. This freedom has allowed teams to experiment and uncover novel practices, but it has also meant that working across teams previously required first negotiating a meta-conversation around how to communicate before any substantive work could occur–much like a new open source project negotiating with its newfound community. Having an open set of shared expectations within the engineering organization allows us to be more effective, mindful, and inclusive about how and where we communicate, leading us to make more well-informed decisions in a way that takes into account different needs, preferences, and time zones.

“How we communicate”

To define this set of shared expectations, the GitHub Engineering Operations and Culture team collaborated with more than 100 people across the engineering organization in the first half of 2023 to create guidance on “How we communicate.” This document was intended to encourage consistency over preference by outlining a common core of shared internal communication practices for all of GitHub Engineering in the form of opinionated guidance. Teams are still encouraged to adapt the practices for their unique circumstances, while maintaining a common “API” to interface with other teams.

Today, we are publishing our “How we communicate” guidance under a CC-BY-4.0 license, in the hopes that you’ll find it useful, especially if you’re evolving your own remote-first or remote-friendly culture; we welcome you to fork, modify, and use the documentation with attribution. We expect our guidance (lightly edited for the community, primarily to remove internal URLs and references) will evolve over time along with our organization, and, of course, pull requests are always welcome.

From guiding principles to prescriptive practices

To begin with our “How we communicate” guidance, we established eight guiding principles:

  • Be asynchronous first.
  • Write things down.
  • Make work visible and overcommunicate.
  • Prefer GitHub tools and workflows.
  • Embrace collaboration.
  • Foster a culture that values documentation maintenance.
  • Communicate openly, honestly, and authentically.
  • Remember, practicality beats purity.

From there, we began to define the specific practices that would help us live up to these principles. We started with the most common forms of communication, such as chat, discussions, issues, project boards, and pull requests, and went on to collaboratively author suggestions on how to manage notifications, run effective meetings, and schedule more inclusively.

Managing the signal-to-noise ratio

With well over 1,500 engineers across a number of functions, we faced a challenge not unique to any organization: how to keep everyone informed and engaged without overwhelming them with notifications. We wanted to create a system that allowed everyone to opt-in, rather than opt-out, and to get the information they needed in a digestible and skimmable way. As it was, either you got everything (which we jokingly referred to as the “fire hose” of notifications), or you opted out entirely (and ignored everything). Either way, Hubbers were likely to miss important information. We set out to create a system that minimized notification fatigue, while allowing people to subscribe to the topics they cared about.

We rely on GitHub Discussions heavily to share information within and across teams. It’s a natural choice, since engineers are already working on GitHub.com, and with things like comments, upvotes, and emoji reactions, discussions are a great way to start an asynchronous conversation on just about any topic.

Opt-in

To start, we encouraged teams to begin posting their discussions to the most logical repository, instead of directly to the main github/engineering repository. (For example, if a post was about GitHub Copilot, it should go in the github/copilot repository; if it was about GitHub Actions, it should go in the github/actions repository.) That way, those interested could subscribe to the repositories they cared about, and get email or web notifications when new discussions were posted. And the volume of notifications coming through github/engineering to the whole organization would be reduced.

Amplify widely

But some posts are rightfully intended for all of GitHub Engineering. Things like staff ships (early access to new features for staff), required actions, promotions, and updates to Engineering priorities are written with a broad audience in mind. To ensure we were still surfacing the most important information to the organization, we established a small set of “magic labels” that if applied to a post, would add it to a daily content roundup, automatically amplify the message in various places for all of GitHub Engineering to see.

For a peek at our taxonomy, here’s an excerpt from our GitHub Actions workflow that makes it easy for everyone to add the set of “magic labels” to their repositories:

label:
          - name: eng-action-required
            description: Upcoming process/workflow changes/activities requiring Engineering Hubbers to take action
          - name: eng-availability
            description: Discussions about availability, incident response, et al
          - name: eng-celebrations
            description: Celebrating Hubber promotions and other amazingness
          - name: eng-feedback-request
            description: Posts requesting feedback from the Engineering organization
          - name: eng-org-change
            description: Announcements related to organizational changes
          - name: eng-priorities
            description: Discussions related to Engineering priorities
          - name: eng-roundup
            description: Newsletters, weekly digests, and other content and team roundups
          - name: eng-show-and-tell
            description: Share what you've learned or show off something you've made
          - name: eng-staff-ship
            description: Announcements for features made available to Hubbers for feedback and early access
          - name: eng-strategy
            description: Discussions related to strategy and vision

Automate all the things!

We used GitHub Actions to schedule a workflow to automatically create daily and weekly roundups of activity across the organization based on those “magic labels,” posting the digests as discussion posts in the github/engineering repository.

Screenshot of the GitHub Actions workflow in the eng-ops-automations repository that creates roundups of activity based on labels and posts them as discussions in the github/engineering repository.

Like any other discussion post, these content roundups trigger web and email notifications from GitHub.com, and they’re also amplified in Slack channels. However, rather than receiving multiple notifications a day, these roundups reduce the daily notification to one (and also make it much easier to catch up on everything that happens while you’re out of the office!). To support the needs of those who prefer receiving notifications for every discussion post individually, rather than waiting for a daily roundup (aka to instead “drink from the fire hose”), we created an #engineering-discussions-firehose Slack channel, which streams every labeled post as it is posted.

Experiment with AI

With notifications reduced in our main github/engineering repository and discussions being posted in more logical repositories, enabling people to subscribe to more frequent notifications for specific topics, the last remaining step was to increase quick skimmability to allow for greater situational awareness without anyone having to spend all day reading teams’ discussion posts.

As part of our writing style, most of us include TL;DRs at the top of posts (internet slang for “too long, didn’t read,” a short summary of longer writing), but not every post author includes one. For posts that don’t have a human-authored TL;DR, we use Azure’s OpenAI service to draft a brief summary for us. That way, readers can quickly skim the daily digest (or fire hose) and decide if they want to click through to read more.

Here’s an excerpt of the prompt we use to summarize discussion posts:

// OpenAI
export const encodingModel = "gpt-3.5-turbo";
export const openaiModel = "gpt-35-turbo";
export const openaiPrompt = `
  The following is an internal discussion post from the engineering department at GitHub formatted in GitHub flavored Markdown. Please write a short summary appropriate for inclusion in a digest of internal discussion posts with the following requirements:

  - The summary should be no more than 3 sentences
  - The summary should focus on the most important and impactful information from the post, including key points and any calls to action
  - The summary should be detailed, thorough, to-the-point, and written for a technical audience, while maintaining clarity and conciseness
  - The communications style should be professional, but informal
  - The summary should use emoji where appropriate, but use emoji sparingly
  - The summary should be formatted in GitHub Flavored Markdown with no line breaks
  - DO NOT use the phrases "the engineering department" or "at GitHub"; instead, whenever possible, name the specific team in reference, or else use "we" to refer to the team or engineering department. For example, use, "We recently shipped a feature", and NOT, "The engineering department at GitHub recently shipped a feature".
  - Employees at GitHub are referred to as "Hubbers"
  - GitHub is ALWAYS capitalized as "GitHub", never "Github"
  - Teams are referred to as "the Actions team" or "the Copilot team", never just "actions team" or "copilot team"
`;

export const estimatedPromptTokens = 300;
export const completionTokens = 300;

Ironically, we relied heavily on GitHub Copilot to build the GitHub Actions workflow (it’s been a while since these Hubbers have written “production-worthy” code), meaning robots helped humans to teach robots how to summarize the work of humans, which other robots then published out to other humans. 🤖 Summarization is a core workflow for AI, and so far, while it’s not always perfect, it’s been working well. If you’re interested in the prompt we’re using (or want to help us improve it!), you can find it here.

Let’s build from here

We’re excited to share our “How we communicate” guidance with you, and we hope that it will inspire you to adopt or improve some of the practices we’ve found useful. Here are some suggestions to get you started:

  • Principles: Establish a set of guiding principles for your organization’s internal communications (fork and clone our guidelines for a head start!). What core values do you want to promote, and how can you ensure everyone is aligned around those values so there’s a common “API” across teams?
  • Practices: Use those principles to develop practices. What specific practices can you adopt to help you live up to your principles, and how can you ensure those practices are adopted across the organization?
  • Experimentations: Experiment with automation and emerging technologies to improve your practices. How can you use AI and other tools (like GitHub Actions) to automate your workflows and improve the signal-to-noise ratio?

We recognize communication is an ongoing and evolving process, and different teams and cultures may have different needs and preferences. We welcome your feedback, suggestions, and contributions to our public repository: https://github.com/github/how-engineering-communicates

Happy communicating! 🎉

The post How to communicate like a GitHub engineer: our principles, practices, and tools appeared first on The GitHub Blog.

How GitHub uses GitHub Actions and Actions larger runners to build and test GitHub.com

Post Syndicated from Max Wagner original https://github.blog/2023-09-26-how-github-uses-github-actions-and-actions-larger-runners-to-build-and-test-github-com/

The Developer Experience (DX) team at GitHub collaborated with a number of other teams to work on moving our continuous integration (CI) system to GitHub Actions to support the development and scaling demands of our engineering team. Our goal as a team is to enable our engineers to confidently and quickly ship software. To that end, we’ve worked on providing paved paths, a suite of automated tools and applications to streamline our development, runtime platforms, and deployments. Recently, we’ve been working to make our CI experience better by leveraging the newly released GitHub feature, Actions larger runners, to run our CI.

Read on to see how we run 15,000 CI jobs within an hour across 150,000 cores of compute!

Brief history of CI at GitHub

GitHub has invested in a variety of different CI systems throughout its history. With each system, our aim has been to enhance the development experience for both GitHub engineers writing and deploying code and for engineers maintaining the systems.

However, with past CI systems we faced challenges with scaling the system to meet the needs of our engineering team to provide both stable and ephemeral build environments. Neither of these challenges allowed us to provide the optimal developer experience.

Then, GitHub released GitHub Actions larger runners. This gave us an opportunity not only to transition to a fully featured CI system, but also to develop, experience, and utilize the systems we are creating for our customers and to drive feedback to help build the product. For the GitHub DX team, this transition was a great opportunity to move away from maintaining our past CI systems while delivering a superior developer experience.

What are larger runners?

Larger runners are GitHub Actions runners that are hosted by GitHub. They are managed virtual machines (VMs) with more RAM, CPU, and disk space than standard GitHub-hosted runners. There are a variety of different machine sizes offered for the runners as well as some additional features compared to the standard GitHub-hosted runners.

Larger runners are available to GitHub Team and GitHub Enterprise Cloud customers. Check out these docs to learn more about larger runners.

Why did we pick larger runners?

Autoscaling and managed

Coming from previous iterations of GitHub’s CI systems, we needed the ability to create CI machines on demand to meet the fast feedback cycles needed by GitHub engineers and to scale with the rate of change of the site.

With larger runners, we maintain the ability to autoscale our CI system because GitHub will automatically create multiple instances of a runner that scale up and down to match the job demands of our engineers. An added benefit is that the GitHub DX team no longer has to worry about the scaling of the runners since all of those complexities are handled by GitHub itself!

We wanted to share some raw numbers on our current peak utilization of larger runners:

  • Uses 4,500 concurrent 32-core runners
  • Runs 125,000 build minutes per hour
  • Queues and runs approximately 15,000 jobs within an hour
  • Allocates around 150,000 cores of compute

(Beta) Custom VM image support

GitHub Actions provides runners with a lot of tools already baked in, which is sufficient and convenient for a variety of projects across the company. However, for some complex production GitHub services, the prebuilt runners did not satisfy all our requirements.

To maintain an efficient and fast CI system, the DX team needed the ability to provide machines with all the tools needed to build those production services. We didn’t want to spend extra time installing tools or compiling projects during CI jobs.

We are currently building features into larger runners so they have the ability to be launched from a custom VM image, called custom images. While this feature is still in beta, using custom images is a huge benefit to GitHub’s CI lifecycle for a couple of reasons.

First, custom images allows GitHub to bundle all the required software and tools needed to build and test complex production bearing services. Anything that is unique to GitHub or one of our projects can be pre-installed on the image before a GitHub Actions workflow even starts.

Second, custom images enable GitHub to dramatically speed up our GitHub Actions workflows by acting as a bootstrapping cache for some projects. During custom image creation, we bundle a pre-built version of a project’s source code into the image. Subsequently, when the project starts a GitHub Actions workflow, it can utilize a cached version of its source code, and any other build artifacts, to speed up its build process.

The cached project source code on the custom VM image can quickly become out of date due to the rapid rate of development within GitHub. This, in turn, causes workflow durations to increase. The DX team worked with the GitHub Actions engineering team to create an API on GitHub to regularly update the custom image multiple times a day to keep the project source up to date.

In practice, this has reduced the bootstrapping time of our projects significantly. Without custom images, our workflows would take around 50 minutes from start to finish, versus the 12 minutes they take today. This is a game changer for our engineers.

We’re working on a way to offer this functionality at scale. If you are interested in custom images for your CI/CD workflows, please reach out to your account manager to learn more!

Important GitHub Actions features

There are thousands of projects at GitHub — from services that run production workloads to small tools that need to run CI to perform their daily operations. To make this a reality, GitHub leverages several important features in GitHub Actions that enable us to use the platform efficiently and securely across the company at scale.

Reusable workflows

One of the DX team’s driving goals is to pave paths for all repositories to run CI without introducing unnecessary repetition across repositories. Prior to GitHub Actions, we created single job configurations that could be used across multiple projects. In GitHub Actions, this was not as easy because any repository can define its own workflows. Reusable workflows to the rescue!

The reusable workflows feature in GitHub Actions provides a way to centrally manage a workflow in a repository that can be utilized by many other repositories in an organization. This was critical in our transition from our previous CI system to GitHub Actions. We were able to create several prebuilt workflows in a single repository, and many repositories could then use those workflows. This makes the process of adding CI to an existing or new project very much plug and play.

In our central repository hosting our reusable workflows, we can have workflows defined like:

on:
  workflow_call:
    inputs:
      cibuild-script:
        description: 'Which cibuild script to run.'
        type: string
        required: false
        default: "script/cibuild"
    secrets:
      service-api-key:
        required: true

jobs:
  reusable_workflow_job:
    runs-on: gh-larger-runner-medium
    name: Simple Workflow Job
    timeout-minutes: 20
    steps:
      - name: Checkout Project
        uses: actions/checkout@v3
      - name: Run cibuild script
        run: |
          bash ${{ inputs.cibuild-script }}
        shell: bash

And in consuming repositories, they can simply utilize the reusable workflow, with just a few lines of code!

name: my-new-project
on:
  workflow_dispatch:
  push:

jobs:
  call-reusable-workflow:
    uses: github/internal-actions/.github/workflows/default.yml@main
    with:
      cibuild-script: "script/cibuild-my-tests"
    secrets:
      service-api-key: ${{ secrets.SERVICE_API_KEY }}

Another great benefit of the reusable workflows feature is that the runner can be defined in the Reusable Workflow, meaning that we can guarantee all users of the workflow will run on our designated larger runner pool. Now, projects don’t need to worry about which runner they need to use!

(Beta) Reusing previous workflow outcomes

To optimize our developer experience, the DX team worked with our engineering team to create a feature for GitHub Actions that allows workflows to reuse the outcome of a previous workflow run where the outcomes would be the same.

In some cases, the file contents of a repository are exactly the same between workflow runs that run on different commits. That is, the Git tree IDs for the current commit is the same as the previous commit (there are no file differences). In these cases, we can bypass CI checks by reusing the previous workflow outcomes and allow engineers to not have to wait for CI to run again.

This feature saves GitHub engineers from running anywhere from 300 to 500 workflows runs a day!

Other challenges faced

Private service access

During some internal GitHub Actions workflow runs, the workflows need the ability to access some GitHub private services, within a GitHub virtual private cloud (VPC), over the network. These could be resources such as artifact storage, application metadata services, and other services that enable invocation of our test harness.

When we moved to larger runners, this requirement to access private services became a top-of-mind concern. In previous iterations of our CI infrastructure, these private services were accessible through other cloud and network configurations. However, larger runners are isolated from other production environments, meaning they cannot access our private services.

Like all companies, we need to focus on both the security of our platform as well as the developer experience. To satisfy these two requirements, GitHub developed a remote access solution that allows clients residing outside of our VPCs (larger runners) to securely access select private services.

This remote access solution works on the principle of minting an OIDC token in GitHub Actions, passing the OIDC token to a remote access gateway that authorizes the request by validating the OIDC token, and then proxying the request to the private service residing in a private network.

Flow diagram showing an OIDC token being mined in GitHub Actions, passed to a remote access gateway that authorizes the request by validating the OIDC token, and then proxying the request to the private service residing in a private network.

With this solution we are able to securely provide remote access from larger runners running GitHubActions to our private resources within our VPC.

GitHub has open sourced the basic scaffolding of this remote access gateway in the github/actions-oidc-gateway-example repository, so be sure to check it out!

Conclusion

GitHub Actions provides a robust and smooth developer experience for GitHub engineers working on GitHub.com. We have been able to accomplish this by using the power of GitHub Actions features, such as reusable workflows and reusable workflow outcomes, and by leveraging the scalability and manageability of the GitHub Actions larger runners. We have also used this effort to enhance the GitHub Actions product. To put it simply, GitHub runs on GitHub.

The post How GitHub uses GitHub Actions and Actions larger runners to build and test GitHub.com appeared first on The GitHub Blog.

How to build an enterprise LLM application: Lessons from GitHub Copilot

Post Syndicated from Shuyin Zhao original https://github.blog/2023-09-06-how-to-build-an-enterprise-llm-application-lessons-from-github-copilot/

If you want to build and scale an application using a large language model (LLM), this article’s for you.

It took us three years to develop GitHub Copilot before we officially launched it to the general public. To go from idea to production, we followed three stages—find it, nail it, scale it—loosely based on the “Nail It, Then Scale It” framework for entrepreneurial product development.

Here’s how it breaks down:

  • Find it: Identify an impactful problem space for your LLM application
  • Nail it: Create a smooth AI product experience
  • Scale it: Get your LLM application ready and useable for general availability (GA)

Let’s get started.

Find it: Isolate the problem you want to solve

Sometimes the hardest part about creating a solution is scoping down a problem space. The problem should be focused enough to quickly deliver impact, but also big enough that the right solution will wow users. Additionally, you want to find a problem where the use of an LLM is the right solution (and isn’t integrated to just drive product engagement).

  • Get clear on who you want to help. We saw that AI could drive efficiency, so we wanted to prioritize helping developers who were consistently crunched for time, enabling them to write code faster with less context switching.

  • Focus on a single problem, first. Rather than trying to address all developer problems with AI, we focused on one part of the software development lifecycle: coding functions in the IDE. At the time, most AI coding assistants could only complete a single line of code.

  • Balance product ambition with quality. While the GitHub Copilot team initially explored generating entire commits, the state of LLMs couldn’t support that function at a high enough quality at the time. Through additional testing, the team landed on code suggestions at the “whole function” level.

  • Meet people where they are. When it comes to designing products for developers, an LLM app should amplify an existing tool or integrate into an existing workflow. A mantra of the GitHub Copilot team was, “It’s a bug if you have to change the way you code when using GitHub Copilot.” In practice, this means enabling developers to receive code suggestions without changing how they work.

Nail it: Iterate to create a smooth AI product experience

Product development with emerging tech, like generative AI, is often more of a winding path and a linear journey because so much is unknown and rapid advancements in the field can quickly open new doors. Building quick iteration cycles into the product development process allows teams to fail and learn fast. At GitHub, the main mechanism for us to quickly iterate is an A/B experimental platform.

According to Idan Gazit, Senior Director of Research for GitHub Next, “We have to design apps not only for models whose outputs need evaluation by humans, but also for humans who are learning how to interact with AI.

  • Put yourself in users’ shoes. GitHub employees have a culture of putting themselves in the shoes of their end users by “dogfooding” products before—and after—they’re released. In practice, this meant the GitHub Copilot team stood up a simple web interface where it could tinker with foundation models and explore ways to leverage those models in their own developer workflows.

    We quickly found that a web interface was not the right canvas since it meant developers had to switch back and forth between their editor and the web browser. As a result, the team decided to focus on bringing GitHub Copilot to the IDE and making the AI capability modeless—or working in the background.

    The developers on our team also noticed they often referenced multiple open tabs in the IDE while coding. This insight led them to experiment with a technique called neighboring tabs, where GitHub Copilot processes multiple files open in a developer’s IDE instead of just the single one the developer is working on. Neighboring tabs helped to increase the acceptance rates of GitHub Copilot’s suggestions by 5%.

  • Evaluate your testing tools. As our experiment continued, we had to scale our internal testing tools to be more versatile and powerful. While we initially relied on our own tools for testing, we ultimately switched to the Microsoft Experimentation Platform to optimize functionality based on the feedback and interaction at scale.

  • Avoid the sunk cost fallacy. This is when you’re reluctant to abandon a course of action because you’ve heavily invested in it—even when it’s clear switching gears would be more beneficial.

    The GitHub and OpenAI teams initially believed every coding language would require its own fine-tuned AI model. But the field of generative AI was rapidly advancing, and our assumption turned out to be incorrect. In the end, OpenAI’s LLMs significantly improved and one model could handle a wide variety of coding languages and tasks.

  • Make a habit of revisiting old ideas. In a field that’s rapidly advancing, the functions that aren’t feasible with today’s LLMs might be possible with tomorrow’s.

    In the beginning, we explored a chat interface for developers to ask coding questions. However, in early testing, users had much higher expectations for the capabilities and quality of coding suggestions than GitHub Copilot could deliver at the time. As a result, we deprioritized the feature. But as customers became familiar with AI chatbot following the emergence of ChatGPT and LLMs continued to evolve, an iterative chat experience, like GitHub Copilot Chat, became possible.

Scale it: Optimize quality, usability, and responsible use of AI to get to GA

Early feedback and technical previews are key to driving product improvements and getting your application to GA. Below you’ll find the steps we took before launching the GitHub Copilot technical preview, how we managed the technical preview and optimized user feedback, and how we prepared our internal infrastructure to handle demand at scale.

Optimize quality and usability

  • Ensure consistent results. Because LMMs are probabilistic—meaning they don’t always produce the same, predictable outcomes—experimentation with them needs to be statistically based. One solution involves setting up a quality pipeline that addresses this unique challenge of building with LLMs.

    For instance, when the GitHub Copilot team first decided to provide whole function coding suggestions, we also had to ensure output predictability and consistency, where the same prompt and context would produce the same suggestions from the AI model.

    To achieve this, the team applied two strategies: changing the parameters to reduce the randomness of outputs and caching responses. Additionally, using cached responses instead of generating new responses to the same prompt not only reduced variability in suggestions, but it also improved performance.

  • Implement a waitlist for your technical preview. A waitlist allowed the GitHub Copilot team to manage questions, feedback, and comments—and ensure we could address them effectively. This approach also helped ensure we had a diverse set of early adopters across developers of varying experience levels to provide feedback.

  • Take advantage of real user feedback. In one example, developers shared that an update had negatively affected the quality of the model’s coding suggestions. In response, the GitHub Copilot team implemented a new guardrail metric—the percentage of suggestions that are multi-line vs. single line—and tuned the model to ensure customers continued to get high-quality suggestions.

    While the GitHub team actively dogfooded GitHub Copilot to understand what the experience was like for developers, we also benefited from developers outside GitHub adding diverse feedback across real-world use cases. The GitHub Copilot team engaged and interacted with technical preview users early, often, and on the users’ preferred platforms. This allowed us to actively respond to issues and feedback in real time.

  • Commit to iterating as you scale. When GitHub Copilot became generally available, the team not only had to improve the product, but also its infrastructure. When we experimented with and quickly iterated GitHub Copilot, it worked directly with the OpenAI API. As the product grew, we scaled our use of Microsoft Azure’s infrastructure to ensure GitHub Copilot had the quality, reliability, and responsible guardrails of a large-scale, enterprise-grade product.

  • Define the product’s key performance metrics. To optimize GitHub Copilot, we used early developer feedback to identify the right performance metrics, such as code acceptance rate and, eventually, code retention rate (which measures how much of the original code suggestion is kept or edited by a developer).

  • Optimize costs. The team worked to optimize the costs of delivering GitHub Copilot suggestions while balancing developer impact. For instance, before we decided on using ghost text—the gray text that flashes one coding suggestion while you type—the tool would eagerly generate 10 suggestions and display them all at once. This incurred upfront compute costs for suggestions two through 10, when most people choose the first one. But it also created a user experience cost, because those 10 suggestions pulled developers out of their workflow and into an evaluation mindset. “It was like paying to calculate the results that appear on the second page of a search engine—and making that second page grab your attention—even though most folks end up using the top result,” Gazit says.

    Optimizing costs is an ongoing project, and we’re exploring new ideas to reduce costs while improving the user experience.

Optimize responsible use of AI

  • Prioritize security and trust. Feedback during GitHub Copilot’s technical preview reinforced the importance of suggesting code that is secure. In response, the team integrated code security capabilities to filter out suggestions that could contain security vulnerabilities (e.g., SQL injections and hard coded credentials) and used natural language filters from Azure OpenAI Service to filter out offensive content.*

  • Allow your community to help you. At GitHub, we deeply valued our extensive developer community for feedback on our products and collaborating with them to improve our offerings. With GitHub Copilot, our developer community was critical to understanding the potential around AI—and some concerns, too.

    For instance, the developer community was concerned that GitHub Copilot suggestions might match public code. In response, the GitHub Copilot team created a filter to block suggestions matching public source code in GitHub public repositories that were longer than 150 characters.

    Based on community input, the GitHub Copilot team also developed a code reference tool that includes links to public code that may match GitHub Copilot suggestions, so developers can review potential matches (and relevant licensing information), and make informed choices.

Develop a go-to-market strategy

  • Launch your product with product evangelists. Before launching the technical preview of GitHub Copilot in 2021, the team presented the prototype to influential members of the software developer community and GitHub Stars. This allowed us to launch the technical preview with an existing base of support and extend the preview’s reach to a broader range of users.

  • Get your product in front of individual users before going after businesses. The team decided to first sell licenses directly to developers, who would clearly benefit from an AI coding assistant. We paired this approach with a free trial program and monthly pricing, based on user survey findings that individuals prefer a simple and predictable subscription. Gaining traction among individual users helped to build a foundation of support and drive adoption at the enterprise level.

Key takeaways

We’re still in the early days of generative AI, so we’re keeping close tabs on the demand and need for this new technology. While each company and product will need to define its own approach to building an LLM app, here are some key learnings from our product journey with GitHub Copilot:

  • Identify a focused problem and thoughtfully discern an AI’s use cases. This will ensure your app has greater impact and a faster time-to-market.

  • Integrate experimentation and tight feedback loops into the design process. This is especially critical when working with LLMs, where outputs are probabilistic and most end users are just learning how to interact with AI models.

  • As you scale, continue to leverage user feedback and prioritize user needs. Doing so will ensure that your product is built to deliver consistent results and real value.

If you’re looking for a problem to solve with an LLM app, check out our post on how companies are boosting productivity with generative AI. You can also take lessons from how GitHub used GitHub Actions to help an AI nonprofit, Ersilia, disseminate AI models to advance pharmaceutical research in low- and middle-income countries.

The post How to build an enterprise LLM application: Lessons from GitHub Copilot appeared first on The GitHub Blog.

Optimize your GitHub Codespaces costs with upgraded virtual machines

Post Syndicated from Craig Peters original https://github.blog/2023-08-31-how-github-reduces-costs-with-upgraded-codespaces/

Since we released GitHub Codespaces in 2021, we’ve made a number of updates aimed at improving usability, controlling cost, and more (for example, free usage for all, one click into templates, and concurrency policies). Now, GitHub has improved our developer experience and reduced usage costs at the same time by taking advantage of new virtual machines that provide all of our users twice the RAM, and approximately 10-30% improved CPU performance after adopting Advanced Micro Devices (AMD)-based hosts. These changes enable you to achieve the same (or better) machine performance for half the cost of the previous machine generation.

How this change helps you

In our previous VM generation, memory intensive workloads often had to overprovision CPUs just to get enough RAM in order to run, particularly when running multiple services. For professional developers this was particularly frustrating because of the increased complexity of their development environments, and their higher expectations for performance. Now, rather than having to choose between paying a premium for larger developer machines or sacrificing developer experience and productivity, you can get the best of both worlds.

For example, at GitHub we use our own software and services to build GitHub itself. GitHub uses Codespaces to build not only Codespaces, but the entire platform. GitHub has a large Ruby monolith that requires significant CPU and RAM to test, and also sets an extremely high bar for developer experience. In order to operate these environments while maximizing developer happiness, GitHub used the largest virtual machines available in Codespaces.

Once the new machine types were available, GitHub’s internal developer experience (DX) team started by moving a few dev teams with RAM-hungry workflows to machines with half the CPU count, but the same RAM, to test whether they would be sufficient. With very little effort, and nearly zero developer impact, testing showed that developers were just as successful on the smaller machines, and GitHub incurred half the cost. As additional teams tried moving the fewer-core machines, there was only one build process that turned out to be CPU architecture dependent. The fix was simple—to specify the CPU architecture so that QEMU could emulate appropriately. No other negative impacts were identified.

Due to the success of the initial trials, we quickly rolled out the changes to more teams. The result? Approximately 50% savings!

Figure 1: Codespaces cost for GitHub during the introduction of the AMD machines

Since we’ve rolled out the AMD machines for GitHub, we’ve seen no problems and had only happy users.

You can do the same in your organization by working with your development teams using GitHub Codespaces to test smaller machines on your existing development environments. All Codespaces virtual machines have been upgraded, so testing is as simple as having some developers try working in a smaller machine than they usually do. In most cases, no other configuration changes are necessary!

Once you have found the sweet spot for performance and experience, you can set a policy within your organization to restrict machine types, ensuring cost controls while providing environments that allow your developers to do their best work.

Save costs while empowering your developers

Now that these changes are in your hands, we invite you to see how much more you can get out of GitHub Codespaces by taking advantage of the improved processing power and increased headroom the RAM provides. As ever, please reach out to your account team, or participate in the GitHub Codespaces Community Discussions to provide us your feedback.


The post Optimize your GitHub Codespaces costs with upgraded virtual machines appeared first on The GitHub Blog.

How we build containerized services at GitHub using GitHub

Post Syndicated from MV Karan original https://github.blog/2023-08-02-how-we-build-containerized-services-at-github-using-github/

The developer experience engineering team at GitHub works on creating safe, delightful, and inclusive solutions for GitHub engineers to efficiently code, ship, and operate software–setting an example for the world on how to build software with GitHub. To achieve this we provide our developers with a paved path–a comprehensive suite of automated tools and applications to streamline our runtime platforms, deployment, and hosting that helps power some of the microservices on the GitHub.com platform and many internal tools. Let’s take a deeper look at how one of our main paved paths works.

Our development ecosystem

GitHub’s main paved path covers everything that’s needed for running software–creating, deploying, scaling, debugging, and running applications. It is an ecosystem of tools like Kubernetes, Docker, load balancers, and many custom apps that work together to create a cohesive experience for our engineers. It isn’t just infrastructure and isn’t just Kubernetes. Kubernetes is our base layer, and the paved path is a mix of conventions, tools, and settings built on top of it.

The kind of services that we typically run using the paved path include web apps, computation pipelines, batch processors, and monitoring systems.

Kubernetes, which is the base layer of the paved path, runs in a multi-cluster, multi-region topology.

Benefits of the paved path

There are hundreds of services at GitHub–from a small internal tool to an external API supporting production workloads. For a variety of reasons, it would be inefficient to spin up virtual machines for each service.

  • Planning and capacity usage across all services wouldn’t be efficient. We would encounter significant overhead in managing both physical and Kubernetes infrastructure on an ongoing basis.
  • Teams would need to build deep expertise in managing their own Kubernetes clusters and would have less time to focus on their application’s unique needs.
  • We would have less central visibility of applications.
  • Security and compliance would be difficult to standardize and enforce.

With the paved path based on Kubernetes and other runtime apps, we’re instead able to:

  • Plan capacity centrally and only for the Kubernetes nodes, so we can optimally use capacity across nodes, as small workloads and large workloads coexist on the same machines.
  • Scale rapidly thanks to central capacity planning.
  • Easily manage configuration and deployments across services in one central control plane.
  • Consistently provide insights into app and deployment performance for individual services.

Onboarding a service

Onboarding a service with the code living in its own repository has been made easy with our ChatOps command service, called Hubot, and GitHub Apps. Service owners can easily generate some basic scaffolding needed to deploy the service by running a command like:

hubot gh-platform app scaffold monalisa-app

A custom GitHub App installed on the service’s GitHub repository will then automatically generate a pull request to add the necessary configurations, which includes:

  • A deployment.yaml file that defines the service’s deployment environments.
  • Kubernetes manifests that define Deployment and Service objects for deploying the service.
  • A Debian Dockerfile that runs a trivial web server to start off with, which will be used by the Kubernetes manifests.
  • Setting up CI builds as GitHub Checks that build the Docker images on every push, and store in a container registry ready for deployment.

Each service that is onboarded to the paved path has its unique Kubernetes namespace that is defined by <app-name>-<environment> and generally has a staging and production environment. This helps separate the workloads of multiple services, and also multiple environments for the same service since each environment gets its own Kubernetes namespace.

Deploying a service

At GitHub, we deploy branches and perform deployments through Hubot ChatOps commands. To deploy a branch named bug-fixes in the monalisa-app repository to the staging environment, a developer would run a ChatOps command like:

hubot deploy monalisa-app/bug-fixes to staging

This triggers a deployment that fetches the Docker image associated with the latest commit in the bug-fixes branch, updates the Kubernetes manifests, and applies those manifests to the clusters in the runtime platform relevant to that environment.

Typically, the Docker image would be deployed to multiple Kubernetes clusters across multiple geographical sites in a region that forms a part of the runtime platform.

To automate pull request merges into the busiest branches and orchestrate the rollout across environments we’re also using merge queue and deployment pipelines, which our engineers can observe and interact with during their deployment.

Securing our services

For any company, the security of the platform itself, along with services running within it, is critical. In addition to our engineering-wide practices, such as requiring two-person reviews on every pull request, we also have Security and Platform teams automating security measures, such as:

  • Pre-built Docker images to be used as base images for the Dockerfiles. These base images contain only the necessary packages/dependencies with security updates, a set of installed software that is auditable and curated according to shared needs.
  • Build-time and periodic scanning of all packages and running container images, for any vulnerabilities or dependencies needing a patch, powered by our own products for software supply chain security like Dependabot.
  • Build time and periodic scanning of GitHub repositories of services for exposed secrets and vulnerabilities, using GitHub’s native security features for advanced security like code scanning and secret scanning.
  • Multiple authentication and authorization mechanisms that allow only the relevant individuals to directly access underlying Kubernetes resources.
  • Comprehensive telemetry for threat detection.
  • Services running in the platform are by default accessible only within GitHub’s internal networks and not exposed on the public internet.
  • Branch protection policies are enforced on all production repositories. These policies prevent merging a pull request until designated automated tests pass and the change has been reviewed by a different developer from the one who proposed the change.

Another key aspect of security for an application is how secrets like keys and tokens are managed. At GitHub, we use a centralized secret store to manage secrets. Each service and each environment within the service has its own vault to store secrets. These secrets are then injected into the relevant pods in Kubernetes, which are then exposed to the containers.

The deployment flow, from merge to rollout

The whole deployment process would look something like this:

  1. A GitHub engineer merges a pull request to a branch in a repository. In the above example, it is the bug-fixes branch in the monalisa-app repository. This repository would also contain the Kubernetes manifest template files for deploying the application.
  2. The pull request merge triggers relevant CI workflows. One of them is a build of the Docker image, which builds the container image based on the Dockerfile specified in the repository, and pushes the image to an internal artifact registry.
  3. Once all the CI workflows have completed successfully, the engineer initiates a deployment by running a ChatOps command like hubot deploy monalisa-app/bug-fixes to staging. This triggers a deployment to our environments such as Staging.
  4. The build systems fetch the Kubernetes manifest files from the repository branch, replaces the latest image to be deployed from the artifact registry, injects app secrets from the secret store, and runs some custom operations. At the end of this stage, a ready-to-deploy Kubernetes manifest is available.
  5. Our deployment systems then apply the Kubernetes manifest to relevant clusters and monitor the rollout status of new changes.

Conclusion

GitHub’s internal paved path helps developers at GitHub focus on building services and delivering value to our users, with minimal focus on the infrastructure. We accomplish this by providing a streamlined path to our GitHub engineers that uses the power of containers and Kubernetes; scalable security, authentication, and authorization mechanisms; and the GitHub.com platform itself.

Want to try some of these for yourself? Learn more about all of GitHub’s features on github.com/features. If you have adopted any of our practices for your own development, give us a shout on Twitter!

Scaling merge-ort across GitHub

Post Syndicated from Matt Cooper original https://github.blog/2023-07-27-scaling-merge-ort-across-github/

At GitHub, we perform a lot of merges and rebases in the background. For example, when you’re ready to merge your pull request, we already have the resulting merge assembled. Speeding up merge and rebase performance saves both user-visible time and backend resources. Git has recently learned some new tricks which we’re using at scale across GitHub. This post walks through what’s changed and how the experience has improved.

Our requirements for a merge strategy

There are a few non-negotiable parts of any merge strategy we want to employ:

  • It has to be fast. At GitHub’s scale, even a small slowdown is multiplied by the millions of activities going on in repositories we host each day.
  • It has to be correct. For merge strategies, what’s “correct” is occasionally a matter of debate. In those cases, we try to match what users expect (which is often whatever the Git command line does).
  • It can’t check out the repository. There are both scalability and security implications to having a working directory, so we simply don’t.

Previously, we used libgit2 to tick these boxes: it was faster than Git’s default merge strategy and it didn’t require a working directory. On the correctness front, we either performed the merge or reported a merge conflict and halted. However, because of additional code related to merge base selection, sometimes a user’s local Git could easily merge what our implementation could not. This led to a steady stream of support tickets asking why the GitHub web UI couldn’t merge two files when the local command line could. We weren’t meeting those users’ expectations, so from their perspective, we weren’t correct.

A new strategy emerges

Two years ago, Git learned a new merge strategy, merge-ort. As the author details on the mailing list, merge-ort is fast, correct, and addresses many shortcomings of the older default strategy. Even better, unlike merge-recursive, it doesn’t need a working directory. merge-ort is much faster even than our optimized, libgit2-based strategy. What’s more, merge-ort has since become Git’s default. That meant our strategy would fall even further behind on correctness.

It was clear that GitHub needed to upgrade to merge-ort. We split this effort into two parts: first deploy merge-ort for merges, then deploy it for rebases.

merge-ort for merges

Last September, we announced that we’re using merge-ort for merge commits. We used Scientist to run both code paths in production so we can compare timing, correctness, etc. without risking much. The customer still gets the result of the old code path, while the GitHub feature team gets to compare and contrast the behavior of the new code path. Our process was:

  1. Create and enable a Scientist experiment with the new code path.
  2. Roll it out to a fraction of traffic. In our case, we started with some GitHub-internal repositories first before moving to a percentage-based rollout across all of production.
  3. Measure gains, check correctness, and fix bugs iteratively.

We saw dramatic speedups across the board, especially on large, heavily-trafficked repositories. For our own github/github monolith, we saw a 10x speedup in both the average and P99 case. Across the entire experiment, our P50 saw the same 10x speedup and P99 case got nearly a 5x boost.

Chart showing experimental candidate versus control at P50. The candidate implementation fairly consistently stays below 0.1 seconds.

Chart showing experimental candidate versus control at P99. The candidate implementation follows the same spiky pattern as the control, but its peaks are much lower.

Dashboard widgets showing P50 average times for experimental candidate versus control. The control averages 71.07 milliseconds while the candidate averages 7.74 milliseconds.

Dashboard widgets showing P99 average times for experimental candidate versus control. The control averages 1.63 seconds while the candidate averages 329.82 milliseconds.

merge-ort for rebases

Like merges, we also do a huge number of rebases. Customers may choose rebase workflows in their pull requests. We also perform test rebases and other “behind the scenes” operations, so we also brought merge-ort to rebases.

This time around, we powered rebases using a new Git subcommand: git-replay. git replay was written by the original author of merge-ort, Elijah Newren (a prolific Git contributor). With this tool, we could perform rebases using merge-ort and without needing a worktree. Once again, the path was pretty similar:

  1. Merge git-replay into our fork of Git. (We were running the experiment with Git 2.39, which didn’t include the git-replay feature.)
  2. Before shipping, leverage our test suite to detect discrepancies between the old and the new implementations.
  3. Write automation to flush out bugs by performing test rebases of all open pull requests in github/github and comparing the results.
  4. Set up a Scientist experiment to measure the performance delta between libgit2-powered rebases and monitor for unexpected mismatches in behavior.
  5. Measure gains, check correctness, and fix bugs iteratively.

Once again, we were amazed at the results. The following is a great anecdote from testing, as relayed by @wincent (one of the GitHub engineers on this project):

Another way to think of this is in terms of resource usage. We ran the experiment over 730k times. In that interval, our computers spent 2.56 hours performing rebases with libgit2, but under 10 minutes doing the same work with merge-ort. And this was running the experiment for 0.5% of actors. Extrapolating those numbers out to 100%, if we had done all rebases during that interval with merge-ort, it would have taken us 2,000 minutes, or about 33 hours. That same work done with libgit2 would have taken 512 hours!

What’s next

While we’ve covered the most common uses, this is not the end of the story for merge-ort at GitHub. There are still other places in which we can leverage its superpowers to bring better performance, greater accuracy, and improved availability. Squashing and reverting are on our radar for the future, as well as considering what new product features it could unlock down the road.

Appreciation

Many thanks to all the GitHub folks who worked on these two projects. Also, GitHub continues to be grateful for the hundreds of volunteer contributors to the Git open source project, including Elijah Newren for designing, implementing, and continually improving merge-ort.

Inside GitHub: Working with the LLMs behind GitHub Copilot

Post Syndicated from Sara Verdi original https://github.blog/2023-05-17-inside-github-working-with-the-llms-behind-github-copilot/

The first time that engineers at GitHub worked with one of OpenAI’s large language models (LLM), they were equal parts excited and astonished. Alireza Goudarzi, a senior researcher of machine learning at GitHub recounts, “As a theoretical AI researcher, my job has been to take apart deep learning models to make sense of them and how they learn, but this was the first time that a model truly astonished me.” Though the emergent behavior of the model was somewhat surprising, it was obviously powerful. Powerful enough, in fact, to lead to the creation of GitHub Copilot.

Due to the growing interest in LLMs and generative AI models, we decided to speak to the researchers and engineers at GitHub who helped build the early versions of GitHub Copilot and talk through what it was like to work with different LLMs from OpenAI, and how model improvements have helped evolve GitHub Copilot to where it is today—and beyond.

A brief history of GitHub Copilot

In June 2020, OpenAI released GPT-3, an LLM that sparked intrigue in developer communities and beyond. Over at GitHub, this got the wheels turning for a project our engineers had only talked about before: code generation.

“Every six months or so, someone would ask in our meetings, ‘Should we think about general purpose code generation,’ but the answer was always ‘No, it’s too difficult, the current models just can’t do it,’” says Albert Ziegler, a principal machine learning engineer and member of the GitHub Next research and development team.

But GPT-3 changed all that—suddenly the model was good enough to begin considering how a code generation tool might work.

“OpenAI gave us the API to play around with,” Ziegler says. “We assessed it by giving it coding-like tasks and evaluated it in two different forms.”

For the first form of evaluation, the GitHub Next team crowdsourced self-contained problems to help test the model. “The reason we don’t do this anymore is because the models just got too good,” Ziegler laughs.

In the beginning, the model could solve about half of the problems it was posed with, but soon enough, it was solving upwards of 90 percent of the problems.

This original testing method sparked the first ideas for how to harness the power of this model, and they began to conceptualize an AI-powered chatbot for developers to ask coding questions and receive immediate, runnable code snippets. “We built a prototype, but it turned out there was a better modality for this technology available,” Ziegler says. “We thought, ‘Let’s try to put this in the IDE.’”

“The moment we did that and saw how well it worked, the whole static question-and-answer modality was forgotten,” he says. “This new approach was interactive and it was useful in almost every situation.”

And with that, the development of GitHub Copilot began.

Exploring model improvements

To keep this project moving forward, GitHub returned to OpenAI to make sure that they could stay on track with the latest models. “The first model that OpenAI gave us was a Python-only model,” Ziegler remembers. “Next we were delivered a JavaScript model and a multilingual model, and it turned out that the Javascript model had particular problems that the multilingual model did not. It actually came as a surprise to us that the multilingual model could perform so well. But each time, the models were just getting better and better, which was really exciting for GitHub Copilot’s progress.”

In 2021, OpenAI released the multilingual Codex model, which was built in partnership with GitHub. This model was an offshoot of GPT-3, so its original capability was generating natural language in response to text prompts. But what set the Codex model apart was that it was trained on billions of lines of public code—so that, in addition to natural language outputs, it also produced code suggestions.

This model was open for use via an API that businesses could build on, and while this breakthrough was huge for GitHub Copilot, the team needed to work on internal model improvements to ensure that it was as accurate as possible for end users.

As the GitHub Copilot product was prepared for launch as a technical preview, the team split off into further functional teams, and the Model Improvements team became responsible for monitoring and improving GitHub Copilot’s quality through communicating with the underlying LLM. This team also set out to work on improving completion for users. Completion refers to when users accept and keep GitHub Copilot suggestions in their code, and there are several different levers that the Model Improvements team works on to increase completion, including prompt crafting and fine tuning.

An example of completion in action with GitHub Copilot
An example of completion in action with GitHub Copilot.

Prompt crafting

When working with LLMs, you have to be very specific and intentional with your inputs to receive your desired output, and prompt crafting explores the art behind communicating these requests to get the optimal completion from the model.

“In very simple terms, the LLM is, at its core, just a document completion model. For training it was given partial documents and it learned how to complete them one token at a time. Therefore, the art of prompt crafting is really all about creating a ‘pseudo-document’ that will lead the model to a completion that benefits the customer,” John Berryman, a senior researcher of machine learning on the Model Improvements team explains. Since LLMs are trained on partial document completion, then if the partial document is code, then this completion capability lends itself well to code completion, which is, in its base form, exactly what GitHub Copilot does.

To better understand how the model could be applied to code completion, the team would provide the model with a file and evaluate the code completions it returned.

“Sometimes the results are ok, sometimes they are quite good, and sometimes the results seem almost magical,” Berryman says. “The secret is that we don’t just have to provide the model with the original file that the GitHub Copilot user is currently editing; instead we look for additional pieces of context inside the IDE that can hint the model towards better completions.”

He continues, “There have been several changes that helped get GitHub Copilot where it is today, but one of my favorite tricks was when we pulled similar texts in from the user’s neighboring editor tabs. That was a huge lift in our acceptance rate and characters retained.”

Generative AI and LLMs are incredibly fascinating, but Berryman still seems to be most excited about the benefit that the users are seeing from the research and engineering efforts.

“The idea here is to make sure that we make developers more productive, but the way we do that is where things start to get interesting: we can make the user more productive by incorporating the way they think about code into the algorithm itself,” Berryman says. “Where the developer might flip back and forth between tabs to reference code, we just can do that for them, and the completion is exactly what it would be if the user had taken all of the time to look that information up.”

Fine-tuning

Fine-tuning is a technique used in AI to adapt and improve a pre-trained model for a specific task or domain. The process involves taking a pre-trained model that has been trained on a large dataset and training it on a smaller, more specific dataset that is relevant to a particular use case. This enables the model to learn and adapt to the nuances of the new data, thus improving its performance on the specific task.

These larger, more sophisticated LLMs can sometimes produce outputs that aren’t necessarily helpful because it’s hard to statistically define what constitutes a “good” response. It’s also incredibly difficult to train a model like Codex that contains upwards of 170 billion parameters.

“Basically, we’re training the underlying Codex model on a user’s specific codebase to provide more focused, customized completions,” Goudarzi adds.

“Our greatest challenge right now is to consider why the user rejects or accepts a suggestion,” Goudarzi adds. “We have to consider what context, or information, that we served to the model caused the model to output something that was either helpful or not helpful. There’s no way for us to really troubleshoot in the typical engineering way, but what we can do is figure out how to ask the right questions to get the output we desire.”

Read more about how GitHub Copilot is getting better at understanding your code to provide a more customized coding experience here.

GitHub Copilot—then and now

As the models from OpenAI got stronger—and as we identified more areas to build on top of those LLMs in house—GitHub Copilot has improved and gained new capabilities with chat functionality, voice-assisted development, and more via GitHub Copilot X on the horizon.

Johan Rosenkilde, a staff researcher on the GitHub Next team remembers, “When we received the latest model drops from OpenAI in the past, the improvements were good, but they couldn’t really be felt by the end user. When the third iteration of Codex dropped, you could feel it, especially when you were working with programming languages that are not one of the top five languages,” Rosenkilde says.

He continues, “I happened to be working on a programming competition with some friends on the weekend that model version was released, and we were programming with F#. In the first 24 hours, we evidently had the old model for GitHub Copilot, but then BOOM! Magic happened,” he laughs. “There was an incredibly noticeable difference.”

In the beginning, GitHub Copilot also had the tendency to suggest lines of code in a completely different programming language, which created a poor developer experience (for somewhat obvious reasons).

“You could be working in a C# project, then all of the sudden at the top of a new file, it would suggest Python code,” Rosenkilde explains. So, the team added a headline to the prompt which listed the language you were working in. “Now this had no impact when you were deep down in the file because Copilot could understand which language you were in. But at the top of the file, there could be some ambiguity, and those early models just defaulted to the top popular languages.”

About a month following that improvement, the team discovered that it was much more powerful to put the path of the file at the top of the document.

A diagram of the file path improvement
A diagram of the file path improvement.

“The end of the file name would give away the language in most cases, and in fact the file name could provide crucial, additional information,” Rosenkilde says. “For example, the file might be named ‘connectiondatabase.py.’ Well that file is most likely about databases or connections, so you might want to import an SQL library, and that file was written in Python. So, that not only solved the language problem, but it also improved the quality and user experience by a surprising margin because GitHub Copilot could now suggest boilerplate code.”

After a few more months of work, and several iterations, the team was able to create a component that lifted code from other files, which is a capability that had been talked about since the genesis of GitHub Copilot. Rosenkilde recalls, “this never really amounted to anything more than conversations or a draft pull request because it was so abstract. But then, Albert Ziegler built this component that looked at other files you have open in the IDE at that moment in time and scanned through those files for similar text to what’s in your current cursor. This was a huge boost in code acceptance because suddenly, GitHub Copilot knew about other files.”

What’s next for GitHub Copilot

After working with generative AI models and LLMs over the past three years, we’ve seen their transformative value up close. As the industry continues to find new uses for generative AI, we’re working to continue building new developer experiences. And in March 2023, GitHub announced the future of Copilot, GitHub Copilot X, our vision for an AI-powered developer experience. GitHub Copilot X aims to bring AI beyond the IDE to more components of the overall platform, such as docs and pull requests. LLMs are changing the ways that we interact with technology and how we work, and ideas like GitHub Copilot X are just an example of what these models, along with some dedicated training techniques, are capable of.

How GitHub Copilot is getting better at understanding your code

Post Syndicated from Johan Rosenkilde original https://github.blog/2023-05-17-how-github-copilot-is-getting-better-at-understanding-your-code/

To make working with GitHub Copilot feel like a meeting of the minds between developers and the pair programmer, GitHub’s machine learning experts have been busy researching, developing, and testing new capabilities—and many are focused on improving the AI pair programmer’s contextual understanding. That’s because good communication is key to pair programming, and inferring context is critical to making good communication happen.

To pull back the curtain, we asked GitHub’s researchers and engineers about the work they’re doing to help GitHub Copilot improve its contextual understanding. Here’s what we discovered.

From OpenAI’s Codex model to GitHub Copilot

When OpenAI released GPT-3 in June 2020, GitHub knew developers would benefit from a product that leveraged the model specifically for coding. So, we gave input to OpenAI as it built Codex, a descendant of GPT-3 and the LLM that would power GitHub Copilot. The pair programmer launched as a technical preview in June 2021 and became generally available in June 2022 as the world’s first at-scale generative AI coding tool.

To ensure that the model has the best information to make the best predictions with speed, GitHub’s machine learning (ML) researchers have done a lot of work called prompt engineering (which we’ll explain in more detail below) so that the model provides contextually relevant responses with low latency.

Though GitHub’s always experimenting with new models as they come out, Codex was the first really powerful generative AI model that was available, said David Slater, a ML engineer at GitHub. “The hands-on experience we gained from iterating on model and prompt improvements was invaluable.”

All that experimentation resulted in a pair programmer that, ultimately, frees up a developer’s time to focus on more fulfilling work. The tool is often a huge help even for starting new projects or files from scratch because it scaffolds a starting point that developers can adapt and tweak as desired, said Alice Li, a ML researcher at GitHub.

I still find myself impressed and even surprised by what GitHub Copilot can do, even after having worked on it for some time now.

– Alice Li, ML researcher at GitHub

Why context matters

Developers use details from pull requests, a folder in a project, open issues, and more to contextualize their code. When it comes to a generative AI coding tool, we need to teach that tool what information to use to do the same.

Transformer LLMs are good at connecting the dots and big-picture thinking. Generative AI coding tools are made possible by large language models (LLMs). These models are sets of algorithms trained on large amounts of code and human language. Today’s state-of-the-art LLMs are transformers, which makes them adept at making connections between text in a user’s input and the output that the model has already generated. This is why today’s generative AI tools are providing responses that are more contextually relevant than previous AI models.

But they need to be told what information is relevant to your code. Right now, transformers that are fast enough to power GitHub Copilot can process about 6,000 characters at a time. While that’s been enough to advance and accelerate tasks like code completion and code change summarization, the limited amount of characters means that not all of a developer’s code can be used as context.

So, our challenge is to figure out not only what data to feed the model, but also how to best order and enter it to get the best suggestions for the developer.

Learn more about LLMs, generative AI coding tools, and how they’re changing the way developers work.

How GitHub Copilot understands your code

It all comes down to prompts, which are compilations of IDE code and relevant context that’s fed to the model. Prompts are generated by algorithms in the background, at any point in your coding. That’s why GitHub Copilot will generate coding suggestions whether you’re currently writing or just finished a comment, or in the middle of some gnarly code.

  • Here’s how a prompt is created: a series of algorithms first select relevant code snippets or comments from your current file and other sources (which we’ll dive into below). These snippets and comments are then prioritized, filtered, and assembled into the final prompt.

GitHub Copilot’s contextual understanding has continuously matured over time. The first version was only able to consider the file you were working on in your IDE to be contextually relevant. But we knew context went beyond that. Now, just a year later, we’re experimenting with algorithms that will consider your entire codebase to generate customized suggestions.

Let’s look at how we got here:

  • Prompt engineering is the delicate art of creating a prompt so that the model makes the most useful prediction for the user. The prompt tells LLMs, including GitHub Copilot, what data, and in what order, to process in order to contextualize your code. Most of this work takes place in what’s called a prompt library, which is where our in-house ML experts work with algorithms to extract and prioritize a variety of sources of information about the developer’s context, creating the prompt that’ll be processed by the GitHub Copilot model.

  • Neighboring tabs is what we call the technique that allows GitHub Copilot to process all of the files open in a developer’s IDE instead of just the single one the developer is working on. By opening all files relevant to their project, developers automatically invoke GitHub Copilot to comb through all of the data and find matching pieces of code between their open files and the code around their cursor—and add those matches to the prompt.

When developing neighboring tabs, the GitHub Next team and in-house ML researchers did A/B tests to figure out the best parameters for identifying matches between code in your IDE and code in your open tabs. They found that setting a very low bar for when to include a match actually made for the best coding suggestions.

By including every little bit of context, neighboring tabs helped to relatively increase user acceptance of GitHub Copilot’s suggestions by 5%**.

Even if there was no perfect match—or even a very good one—picking the best match we found and including that as context for the model was better than including nothing at all.

– Albert Ziegler, principal ML engineer at GitHub
  • The Fill-In-the-Middle (FIM) paradigm widened the context aperture even more. Prior to FIM, only the code before your cursor would be put into the prompt—ignoring the code after your cursor. (At GitHub, we refer to code before the cursor as the prefix and after the cursor as the suffix.) With FIM, we can tell the model which part of the prompt is the prefix, and which part is the suffix.

Even if you’re creating something from scratch and have a skeleton of a file, we know that coding isn’t linear or sequential. So, while you bounce around your file, FIM helps GitHub Copilot offer better coding suggestions for the part in your file where your cursor is located, or the code that’s supposed to come between the prefix and suffix.

Based on A/B testing, FIM gave a 10% relative boost in performance, meaning developers accepted 10% more of the completions that were shown to them. And thanks to optimal use of caching, neighboring tabs and FIM work in the background without any added latency.

System diagram focused on model quality efforts. The diagram starts on the left with inputs from open tabs, data from editor, and vector database, which feed into a prompt library. (We are continuously working on improvements to provide better context from available sources in the prompt.) This then goes into the prompt, which is fed through a contextual filter model and a GPT model. (We are continuously working on new and improved model engines optimized for GitHub Copilot.) This model provides completions to fill in the middle of the prompt prefix and suffix. From the models, n completions are generated, and less than or equal to n completions are shown.

Improving semantic understanding

Today, we’re experimenting with vector databases that could create a customized coding experience for developers working in private repositories or with proprietary code. Generative AI coding tools use something called embeddings to retrieve information from a vector database.

  • What’s a vector database? It’s a database that indexes high-dimensional vectors.

  • What’s a high-dimensional vector? They’re mathematical representations of objects, and because these vectors can model objects in a number of dimensions, they can capture complexities of that object. When used properly to represent pieces of code, they may represent both the semantics and even intention of the code—not just the syntax.

  • What’s an embedding? In the context of coding and LLMs, an embedding is the representation of a piece of code as a high-dimensional vector. Because of the “knowledge” the LLM has of both programming and natural language, it’s able to capture both the syntax and semantics of the code in the vector.

Here’s how they’d all work together:

  • Algorithms would create embeddings for all snippets in the repository (potentially billions of them), and keep them stored in the vector database.
  • Then, as you’re coding, algorithms would embed the snippets in your IDE.
  • Algorithms would then make approximate matches—also, in real time—between the embeddings that are created for your IDE snippets and the embeddings already stored in the vector database. The vector database is what allows algorithms to quickly search for approximate matches (not just exact ones) on the vectors it stores, even if it’s storing billions of embedded code snippets.

Developers are familiar with retrieving data with hashcodes, which typically look for exact character by character matches, explained Alireza Goudarzi, senior ML researcher at GitHub. “But embeddings—because they arise from LLMs that were trained on a vast amount of data—develop a sense of semantic closeness between code snippets and natural language prompts.”

Read the three sentences below and identify which two are the most semantically similar.

  • Sentence A: The king moved and captured the pawn.
  • Sentence B: The king was crowned in Westminster Abbey.
  • Sentence C: Both white rooks were still in the game.

The answer is sentences A and C because both are about chess. While sentences A and B are syntactically, or structurally similar because both have a king as the subject, they’re semantically different because “king” is used in different contexts.

Here’s how each of those statements could translate to Python. Note the syntactic similarity between snippets A and B despite their semantic difference, and the semantic similarity between snippets A and C despite their syntactic difference.

Snippet A:

if king.location() == pawn.location():
    board.captures_piece(king, pawn)

Snippet B:

if king.location() == "Westminster Abbey":
    king.crown()

Snippet C:

if len([ r for r in board.pieces("white") if r.type == "rook" ]) == 2:
    return True

As mentioned above, we’re still experimenting with retrieval algorithms. We’re designing the feature with enterprise customers in mind, specifically those who are looking for a customized coding experience with private repositories and would explicitly opt in to use the feature.

Take this with you

Last year, we conducted quantitative research on GitHub Copilot and found that developers code up to 55% faster while using the pair programmer. This means developers feel more productive, complete repetitive tasks more quickly, and can focus more on satisfying work. But our work won’t stop there.

The GitHub product and R&D teams, including GitHub Next, have been collaborating with Microsoft Azure AI-Platform to continue bringing improvements to GitHub Copilot’s contextual understanding. So much of the work that helps GitHub Copilot contextualize your code happens behind the scenes. While you write and edit your code, GitHub Copilot is responding to your writing and edits in real time by generating prompts–or, in other words, prioritizing and sending relevant information to the model based on your actions in your IDE—to keep giving you the best coding suggestions.


Learn more

How we use GitHub to be more productive, collaborative, and secure

Post Syndicated from Mike Hanley original https://github.blog/2022-12-20-how-we-use-github-to-be-more-productive-collaborative-and-secure/

It’s that time of year where we’re all looking back at what we’ve accomplished and thinking ahead to goals and plans for the calendar year to come. As part of GitHub Universe, I shared some numbers that provided a window into the work our engineering and security teams drive each day on behalf of our community, customers, and Hubbers. As someone who loves data, it’s not just fun to see how we operate GitHub at scale, but it’s also rewarding to see how this work contributes to our vision to be the home for all developers–which includes our own engineering and security teams.

Over the course of the past year1, GitHub staff made millions of commits across all of our internal repositories. That’s a ton of branches, pull requests, Issues, and more. We processed billions of API requests daily. And we ran tens of thousands of production deployments across the internal apps that power GitHub’s services. If you do the math, that’s hundreds of deploys per day.

GitHub is big. But the reality is, no matter your size, your scale, or your stage, we’re all dealing with the same questions. Those questions boil down to how to optimize for productivity, collaboration, and, of course, security.

It’s a running joke internally that you have to type “GitHub” three times to get to the monolith. So, let’s take a look at how we at GitHub (1) use GitHub (2) to build the GitHub (3) you rely on.

Productivity

GitHub’s cloud-powered experiences, namely Codespaces and GitHub Copilot, have been two of the biggest game changers for us in the past few years.

Codespaces

It’s no secret that local development hasn’t evolved much in the past decade. The github/github repository, where much of what you experience on GitHub.com lives, is fairly large and took several minutes to clone even on a good network connection. Combine this with setting up dependencies and getting your environment the way you like it, spinning up a local environment used to take 45 minutes to go from checkout to a built local developer environment.

But now, with Codespaces, a few clicks and less than 60 seconds later, you’re in a working development environment that’s running on faster hardware than the MacBook I use daily.

Heating my home office in the chilly Midwest with my laptop doing a local build was nice, but it’s a thing of the past. Moving to Codespaces last year has truly impacted our day-to-day developer experience, and we’re not looking back.

GitHub Copilot

We’ve been using GitHub Copilot for more than a year internally, and it still feels like magic to me every day. We recently published a study that looked at GitHub Copilot performance across two groups of developers–one that used GitHub Copilot and one that didn’t. To no one’s surprise, the group that used GitHub Copilot was able to complete the same task 55% faster than the group that didn’t have GitHub Copilot.

Getting the job done faster is great, but the data also provided incredible insight into developer satisfaction. Almost three-quarters of the developers surveyed said that GitHub Copilot helped them stay in the flow and spend more time focusing on the fun parts of their jobs. When was the last time you adopted an experience that made you love your job more? It’s an incredible example of putting developers first that has completely changed how we build here at GitHub.

Collaboration

At GitHub, we’re remote-first and we have highly distributed teams, so we prioritize discoverability and how we keep teams up-to-date across our work. That’s where tools like Issues and projects come into play. They allow us to plan, track, and collaborate in a centralized place that’s right next to the code we’re working on.

Incorporating projects across our security team has made it easier for us to not only track our work, but also to help people understand how their work fits into the company’s broader mission and supports our customers.

Projects gives us a big picture view of our work, but what about the more tactical discovery of a file, function, or new feature another team is building? When you’re working on a massive 15-year-old codebase (looking at you, GitHub), sometimes you need to find code that was written well before you even joined the company, and that can feel like trying to find a needle in a haystack.

So, we’ve adopted the new code search and code view, which has helped our developers quickly find what they need without losing velocity. This improved discoverability, along with the enhanced organization offered by Issues and projects, has had huge implications for our teams in terms of how we’ve been able to collaborate across groups.

Shifting security left

Like we saw when we looked at local development environments, the security industry still struggles with the same issues that have plagued us for more than a decade. Exposed credentials, as an example, are still the root cause for more than half of all data breaches today2. Phishing is still the best, and cheapest, way for an adversary to get into organizations and wreak havoc. And we’re still pleading with organizations to implement multi-factor authentication to keep the most basic techniques from bad actors at bay.

It’s time to build security into everything we do across the developer lifecycle.

The software supply chain starts with the developer. Normalizing the use of strong authentication is one of the most important ways that we at GitHub, the home of open source, can help defend the entire ecosystem against supply chain attacks. We enforce multi-factor authentication with security keys for our internal developers, and we’re requiring that every developer who contributes software on GitHub.com enable 2FA by the end of next year. The closer we can bring our security and engineering teams together, the better the outcomes and security experiences we can create together.

Another way we do that is by scaling the knowledge of our security teams with tools like CodeQL to create checks that are deployed for all our developers, protecting all our users. And because the CodeQL queries are open source, the vulnerability patterns shared by security teams at GitHub or by our customers end up as CodeQL queries that are then available for everyone. This acts like a global force multiplier for security knowledge in the developer and security communities.

Security shouldn’t be gatekeeping your teams from shipping. It should be the process that enables them to ship quickly–remember our hundreds of production deployments per day?–and with confidence.

Big, small, or in-between

As you see, GitHub has the same priorities as any other development team out there.

It doesn’t matter if you’re processing billions of API requests a day, like we are, or if you’re just starting on that next idea that will be launched into the world.

These are just a few ways over the course of the last year that we’ve used GitHub to build our own platform securely and improve our own developer experiences, not only to be more productive, collaborative, and secure, but to be creative, to be happier, and to build the best work of our lives.

To learn more about how we use GitHub to build GitHub, and to see demos of the features highlighted here, take a look at this talk from GitHub Universe 2022.

Notes


  1. Data collected January-October 2022 
  2. Verizon DBIR