Tag Archives: AWS IoT Analytics

Field Notes: Tracking Overall Equipment Effectiveness with AWS IoT Analytics and Amazon QuickSight

Post Syndicated from Shailaja Suresh original https://aws.amazon.com/blogs/architecture/field-notes-tracking-overall-equipment-effectiveness-with-aws-iot-analytics-and-amazon-quicksight/

This post was co-written with Michael Brown, Senior Solutions Architect, Manufacturing at AWS.

Overall equipment effectiveness (OEE) is a measure of how well a manufacturing operation is utilized (facilities, time and material) compared to its full potential, during the periods when it is scheduled to run. Measuring OEE provides a way to obtain actionable insights into manufacturing processes to increase the overall productivity along with reduction in waste.

In order to drive process efficiencies and optimize costs, manufacturing organizations need a scalable approach to accessing data across disparate silos across their organization. In this blog post, we will demonstrate how OEE can be calculated, monitored, and scaled out using two key services: AWS IoT Analytics and Amazon QuickSight.

Overview of solution

We will use the standard OEE formulas for this example:

Table 1. OEE Calculations
Availability = Actual Time / Planned Time (in minutes)
Performance = (Total Units/Actual Time) / Ideal Run Rate
Quality = Good Units Produced / Total Units Produced
OEE = Availability * Performance * Quality

To calculate OEE, identify the following data for the calculation and its source:

Table 2. Source of supporting data
Supporting Data Method of Ingest
Total Planned Scheduled Production Time Manufacturing Execution Systems (MES)
Ideal Production Rate of Machine in Units MES
Total Production for the Scheduled time Programmable Logic Controller (PLC), MES
Total Number of Off-Quality units produced PLC, Quality DB
Total Unplanned Downtime in minutes PLC

For the purpose of this exercise, we assume that the supporting data is ingested as an MQTT message.

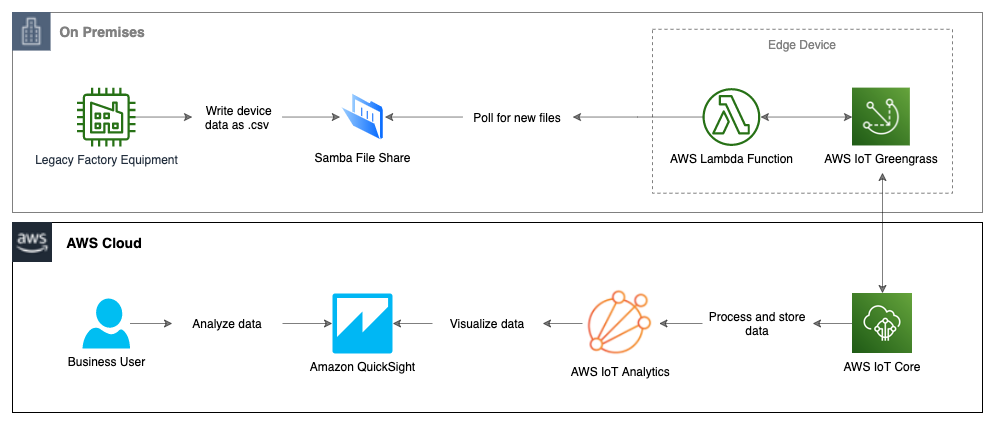
As indicated in Figure 1, the data is ingested into AWS IoT Core and then sent to AWS IoT Analytics by an IoT rule to calculate the OEE metrics. These IoT data insights can then be viewed from a QuickSight dashboard. Specific machine states, like machine idling, could be notified to the technicians through email or SMS by Amazon Simple Notification Service (Amazon SNS). All OEE metrics can then be republished to AWS IoT Core so any other processes can consume them.

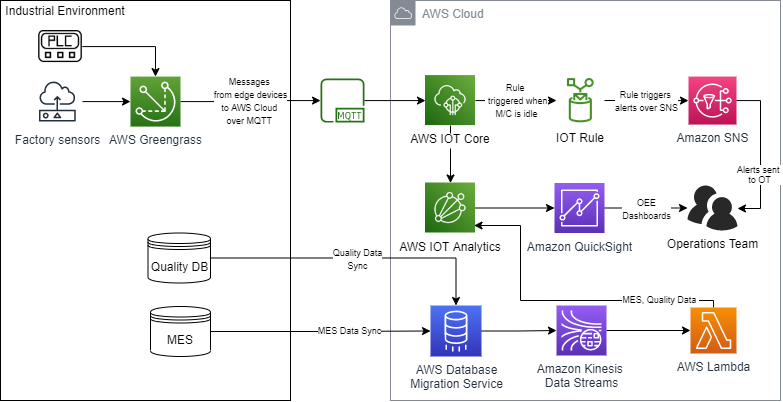
Figure 1. Tracking OEE using PLCs with AWS IoT Analytics and QuickSight

Walkthrough

The components of this solution are:

  • PLC – An industrial computer that has been ruggedized and adapted for the control of manufacturing processes, such as assembly lines, robotic devices, or any activity that requires high reliability, ease of programming, and process fault diagnosis.
  • AWS IoT Greengrass – Provides a secure way to seamlessly connect your edge devices to any AWS service and to third-party services.
  • AWS IoT Core – Subscribes to the IoT topics and ingests data into the AWS Cloud for analysis.
  • AWS IoT rule – Rules give your devices the ability to interact with AWS services. Rules are analyzed and actions are performed based on the MQTT topic stream.
  • Amazon SNS – Sends notifications to the operations team when the machine downtime is greater than the rule threshold.
  • AWS IoT Analytics – Filters, transforms, and enriches IoT data before storing it in a time-series data store for analysis. You can set up the service to collect only the data you need from your PLC and sensors and apply mathematical transforms to process the data.
  • QuickSight – Helps you to visualize the OEE data across multiple shifts from AWS IoT Analytics.
  • Amazon Kinesis Data Streams – Enables you to build custom applications that process and analyze streaming data for specialized needs.
  • AWS Lambda – Lets you run code without provisioning or managing servers. In this example, it gets the JSON data records from Kinesis Data Streams and passes it to AWS IOT Analytics.
  • AWS Database Migration Service (AWS DMS) – Helps migrate your databases to AWS with nearly no downtime. All data changes to the source database (MES, Quality Databases) that occur during the data sync are continuously replicated to the target, allowing the source database to be fully operational during the migration process.

Follow these steps to build an AWS infrastructure to track OEE:

  1. Collect data from the factory floor using PLCs and sensors.

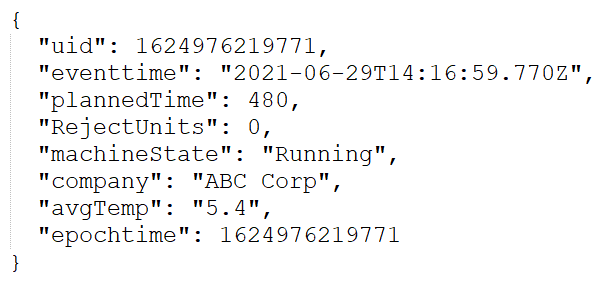
Here is a sample of the JSON data which will be ingested into AWS IoT Core.

In AWS IoT Analytics, a data store needs to be created which is needed to query and gather insights for OEE calculation. Refer to Getting started with AWS IoT Analytics to create a channel, pipeline, and data store. Note that AWS IoT Analytics receives data from the factory sensors and PLCs, as well as through Kinesis Data Streams from AWS DMS. In this blog post, we focus on how the data from AWS IoT Analytics is integrated with QuickSight to calculate OEE.

  1. Create a dataset in AWS IoT Analytics.In this example, one of our targets is to determine the total number of good units produced per shift to calculate the OEE over a one-day time period across shifts. For this purpose, only the necessary data is stored in AWS IoT Analytics as datasets and partitioned for performant analysis. Because the ingested data includes data across all machine states, we want to selectively collect data only when the machine is in a running state. AWS IoT Analytics helps to gather this specific data through SQL queries as shown in Figure 2.

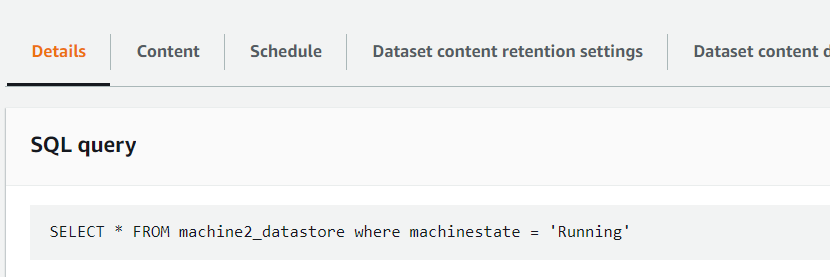
Figure 2. SQL query in IoT Analytics to create a dataset

Cron expressions are expressions that indicate a schedule such that the tasks can be run automatically based on a schedule and frequency. AWS IoT Analytics provides options to query for the datasets at a frequency based on cron expressions.

Because we want to produce daily reports in QuickSight, set the Cron expression as shown in Figure 3.

Figure 3. Cron expression to query data daily

  1. Create an Amazon QuickSight dashboard to analyze the AWS IOT Analytics data.

To connect the AWS IoT Analytics dataset in this example to QuickSight, follow the steps contained in Visualizing AWS IoT Analytics data. After you have created a dataset under QuickSight, you can add calculated fields (Figure 4) as needed. We are creating the following fields to enable the dashboard to show the sum of units produced across shifts.

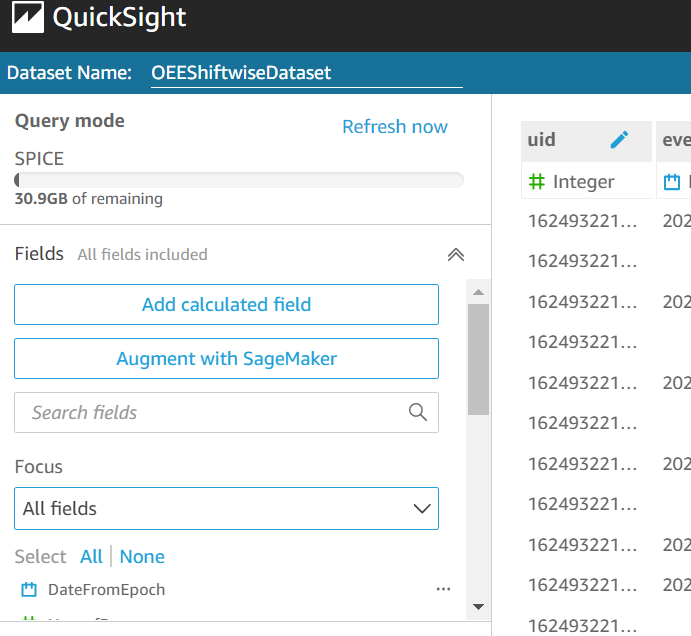
Figure 4. Adding calculated fields in Amazon QuickSight

We first add a calculated field as DateFromEpoch to produce a date from the ‘epochtime’ key of the JSON as shown in Figure 5.

Figure 5. DateFromEpoch calculated field

Similarly, you can create the following fields using the built-in functions available in QuickSight dataset as shown in Figures 6, 7, and 8.

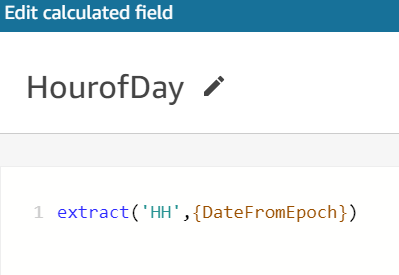
Figure 6. HourofDay calculated field

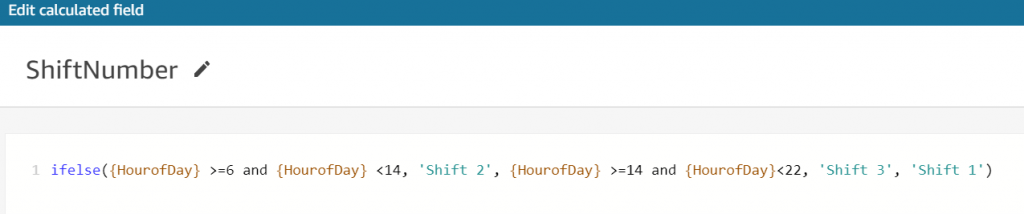
Figure 7. ShiftNumber calculated field

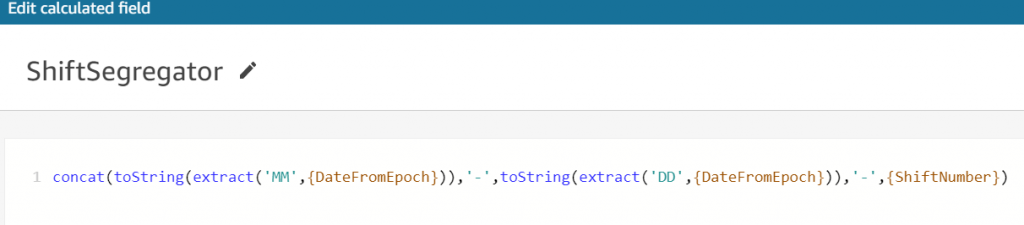
Figure 8. ShiftSegregator calculated field

To determine the total number of good units produced, use the formula shown in Figure 9.

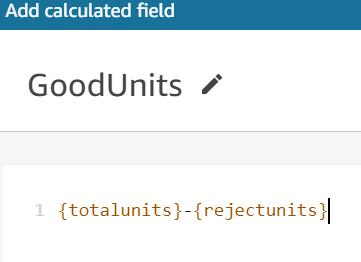
Figure 9. Formula for total number of good units produced

After the fields are calculated, save the dataset and create a new analysis with this dataset. Choose the stacked bar combo chart and add the dimensions and measures from Figure 10 to produce the visualization. This analysis shows the sum of good units produced across shifts using the calculated field GoodUnits.

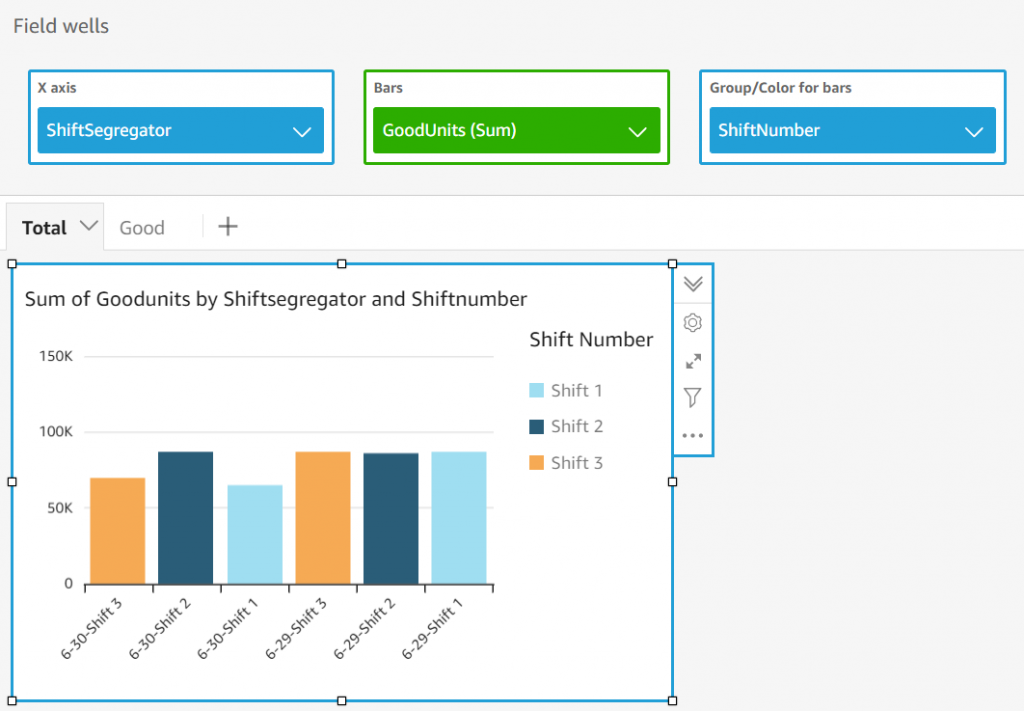
Figure 10. Good units across shifts on Amazon QuickSight dashboard

  1. Calculate OEE.To calculate OEE across shifts, we need to determine the values stated in Table 1. For the sake of simplicity, determine the OEE for Shift 1 and Shift 2 on 6/30.

Let us introduce the calculated field ShiftQuality as in Figure 11.

    1. Calculate Quality

Good Units Produced / Total Units Produced

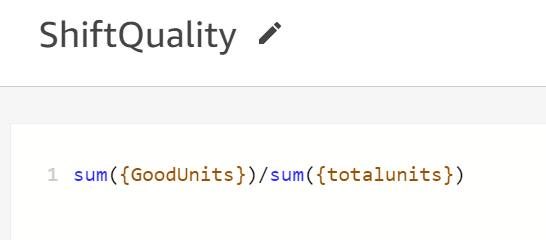
Figure 11. Quality calculation

Add a filter to include only Shift 1 and 2 on 6/30. Change the Range value for the bar to be from .90 to .95 to see the differences in Quality across shifts as in Figure 12.

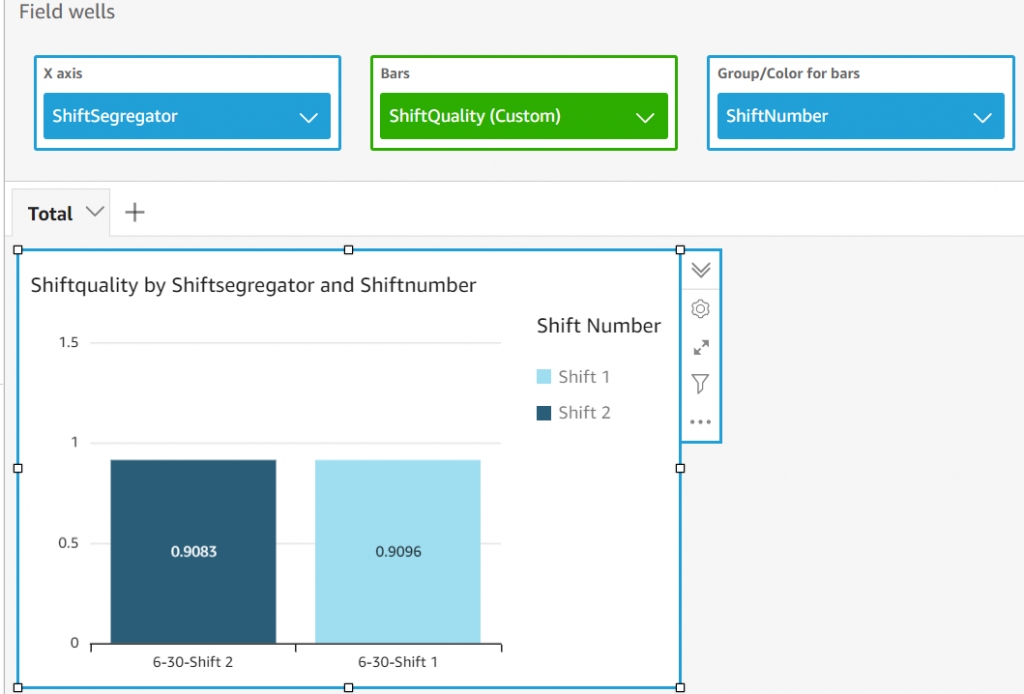
Figure 12. Quality differences across shifts

    1. Calculate Performance

(Total Units/Actual Time) / Ideal Run Rate

For this factory, we know the Ideal Production Rate is 203 units per minute per shift (100,000 units/480 minutes). We already know the actual run time for each shift by excluding the idle and stopped state times. We add a calculated field for ShiftPerformance using the previous formula. Change the range of the bar in the visual to be able to see the differences in performances across the shifts as in Figure 13.

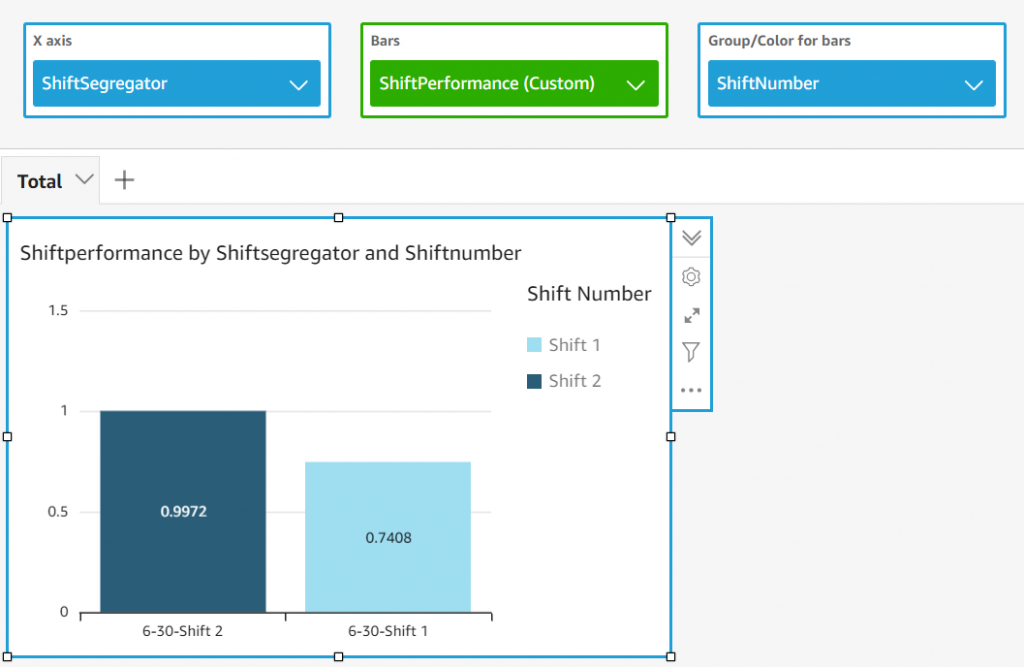
Figure 13. Performance calculation

    1. Calculate Availability

Actual Time / Planned Time (in minutes)

The planned time for a shift is 480 minutes. Add a calculated field using the previous formula.

    1. Calculate OEE

OEE = Performance * Availability * Quality

Finally, add a calculated field for ShiftOEE as in Figure 14. Include this field as the Bar to be able to see the OEE differences across shifts as in Figure 15.

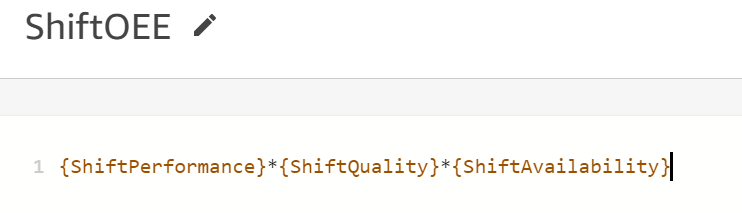
Figure 14. OEE calculation

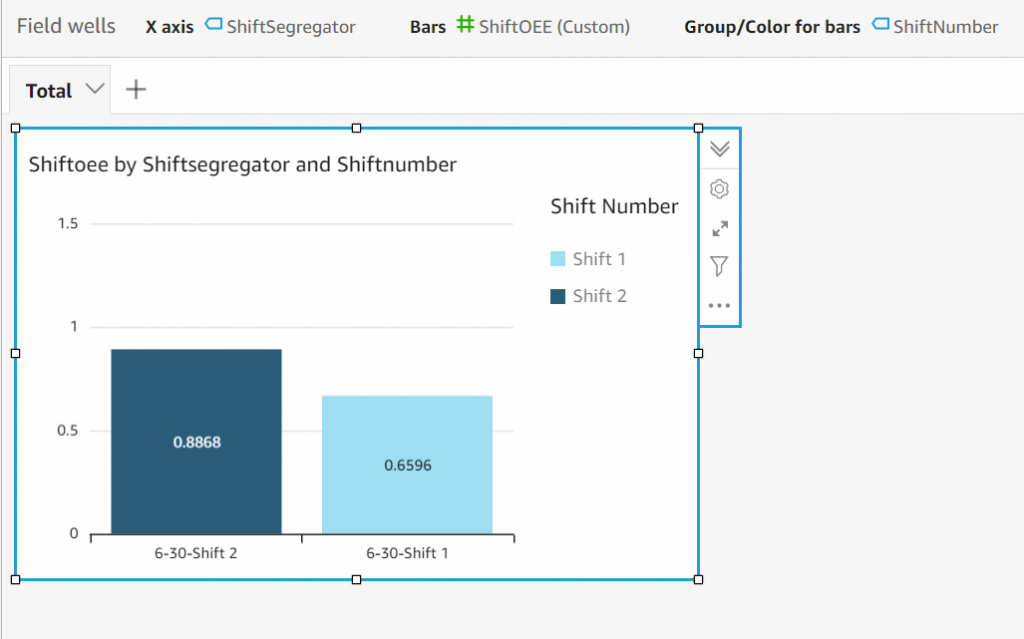
Figure 15. OEE across shifts

Shift 3 on 6/28 has the higher of the two OEEs compared in this example.

Note that you can schedule a dataset refresh in QuickSight for everyday as shown in Figure 16. This way you get to see the dataset and the visuals with the most recent data.

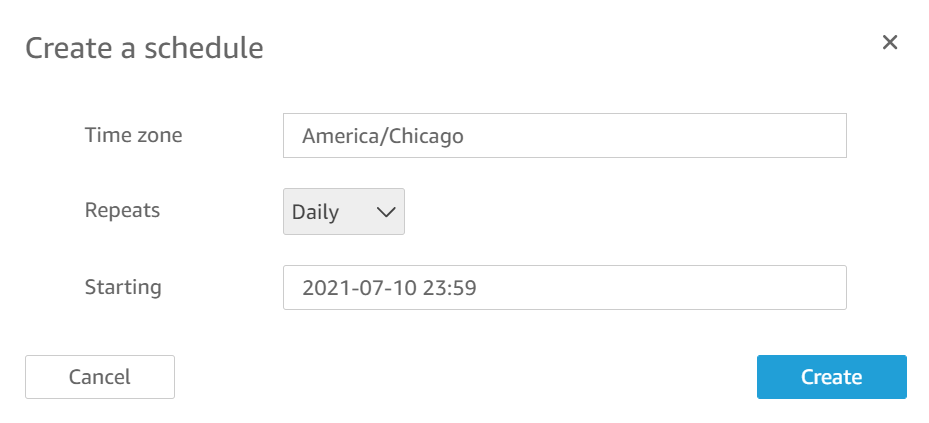
Figure 16. Dataset refresh schedule

All the above is a one-time setup to calculate OEE.

  1. Enable an AWS IoT rule to invoke Amazon SNS notifications when a machine is idle beyond the threshold time using AWS IoT rule.

You can create rules to invoke alerts over an Amazon SNS topic by adding an action under AWS IoT core as shown in Figures 17 and 18. In our example, we can invoke alerts to the factory operations team whenever a machine is in idle state. Refer to AWS IoT SQL reference for more information on creating rules through AWS IoT Core rule query statement.

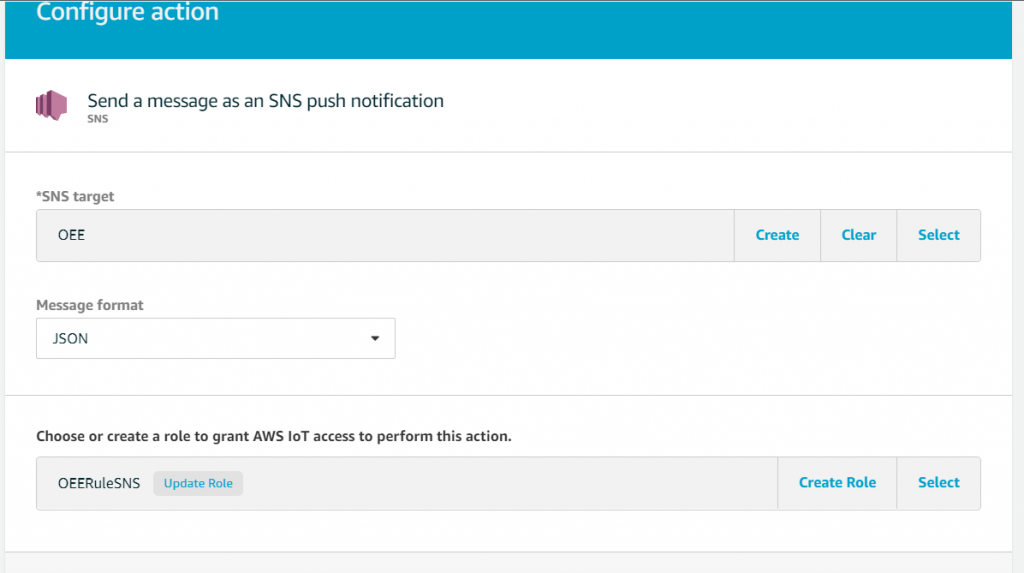
Figure 17. Send messages through SNS

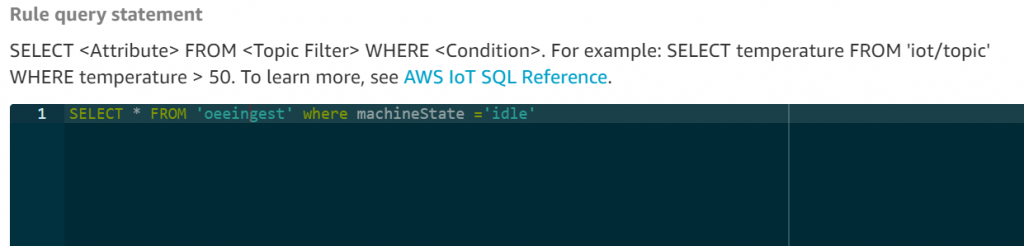
Figure 18. Set up IoT rules

Conclusion

In this blog post, we showed you how to calculate the OEE on factory IoT data by using two AWS IoT services: AWS IoT Core and AWS IoT Analytics. We used the seamless integration of QuickSight with AWS IoT Analytics and also the calculated fields feature of QuickSight to run calculations on industry data with field level formulas.

Field Notes provides hands-on technical guidance from AWS Solutions Architects, consultants, and technical account managers, based on their experiences in the field solving real-world business problems for customers.

Enhancing Existing Building Systems with AWS IoT Services

Post Syndicated from Lewis Taylor original https://aws.amazon.com/blogs/architecture/enhancing-existing-building-systems-with-aws-iot-services/

With the introduction of cloud technology and by extension the rapid emergence of Internet of Things (IoT), the barrier to entry for creating smart building solutions has never been lower. These solutions offer commercial real estate customers potential cost savings and the ability to enhance their tenants’ experience. You can differentiate your business from competitors by offering new amenities and add new sources of revenue by understanding more about your buildings’ operations.

There are several building management systems to consider in commercial buildings, such as air conditioning, fire, elevator, security, and grey/white water. Each system continues to add more features and become more automated, meaning that control mechanisms use all kinds of standards and protocols. This has led to fragmented building systems and inefficiency.

In this blog, we’ll show you how to use AWS for the Edge to bring these systems into one data path for cloud processing. You’ll learn how to use AWS IoT services to review and use this data to build smart building functions. Some common use cases include:

  • Provide building facility teams a holistic view of building status and performance, alerting them to problems sooner and helping them solve problems faster.
  • Provide a detailed record of the efficiency and usage of the building over time.
  • Use historical building data to help optimize building operations and predict maintenance needs.
  • Offer enriched tenant engagement through services like building control and personalized experiences.
  • Allow building owners to gather granular usage data from multiple buildings so they can react to changing usage patterns in a single platform.

Securely connecting building devices to AWS IoT Core

AWS IoT Core supports connections with building devices, wireless gateways, applications, and services. Devices connect to AWS IoT Core to send and receive data from AWS IoT Core services and other devices. Buildings often use different device types, and AWS IoT Core has multiple options to ingest data and enabling connectivity within your building. AWS IoT Core is made up of the following components:

  • Device Gateway is the entry point for all devices. It manages your device connections and supports HTTPS and MQTT (3.1.1) protocols.
  • Message Broker is an elastic and fully managed pub/sub message broker that securely transmits messages (for example, device telemetry data) to and from all your building devices.
  • Registry is a database of all your devices and associated attributes and metadata. It allows you to group devices and services based upon attributes such as building, software version, vendor, class, floor, etc.

The architecture in Figure 1 shows how building devices can connect into AWS IoT Core. AWS IoT Core supports multiple connectivity options:

  • Native MQTT – Multiple building management systems or device controllers have MQTT support immediately.
  • AWS IoT Device SDK – This option supports MQTT protocol and multiple programming languages.
  • AWS IoT Greengrass – The previous options assume that devices are connected to the internet, but this isn’t always possible. AWS IoT Greengrass extends the cloud to the building’s edge. Devices can connect directly to AWS IoT Greengrass and send telemetry to AWS IoT Core.
  • AWS for the Edge partner products – There are several partner solutions, such as Ignition Edge from Inductive Automation, that offer protocol translation software to normalize in-building sensor data.
Data ingestion options from on-premises devices to AWS

Figure 1. Data ingestion options from on-premises devices to AWS

Challenges when connecting buildings to the cloud

There are two common challenges when connecting building devices to the cloud:

  • You need a flexible platform to aggregate building device communication data
  • You need to transform the building data to a standard protocol, such as MQTT

Building data is made up of various protocols and formats. Many of these are system-specific or legacy protocols. To overcome this, we suggest processing building device data at the edge, extracting important data points/values before transforming to MQTT, and then sending the data to the cloud.

Transforming protocols can be complex because they can abstract naming and operation types. AWS IoT Greengrass and partner products such as Ignition Edge make it possible to read that data, normalize the naming, and extract useful information for device operation. Combined with AWS IoT Greengrass, this gives you a single way to validate the building device data and standardize its processing.

Using building data to develop smart building solutions

The architecture in Figure 2 shows an in-building lighting system. It is connected to AWS IoT Core and reports on devices’ status and gives users control over connected lights.

The architecture in Figure 2 has two data paths, which we’ll provide details on in the following sections, but here’s a summary:

  1. The “cold” path gathers all incoming data for batch data analysis and historical dashboarding.
  2. The “warm” bidirectional path is for faster, real-time data. It gathers devices’ current state data. This path is used by end-user applications for sending control messages, real-time reporting, or initiating alarms.
Figure 2. Architecture diagram of a building lighting system connected to AWS IoT Core

Figure 2. Architecture diagram of a building lighting system connected to AWS IoT Core

Cold data path

The cold data path gathers all lighting device telemetry data, such as power consumption, operating temperature, health data, etc. to help you understand how the lighting system is functioning.

Building devices can often deliver unstructured, inconsistent, and large volumes of data. AWS IoT Analytics helps clean up this data by applying filters, transformations, and enrichment from other data sources before storing it. By using Amazon Simple Storage Service (Amazon S3), you can analyze your data in different ways. Here we use Amazon Athena and Amazon QuickSight for building operational dashboard visualizations.

Let’s discuss a real-world example. For building lighting systems, understanding your energy consumption is important for evaluating energy and cost efficiency. Data ingested into AWS IoT Core can be stored long term in Amazon S3, making it available for historical reporting. Athena and QuickSight can quickly query this data and build visualizations that show lighting state (on or off) and annual energy consumption over a set period of time. You can also overlay this data with sunrise and sunset data to provide insight into whether you are using your lighting systems efficiently. For example, adjusting the lighting schedule accordingly to the darker winter months versus the brighter summer months.

Warm data path

In the warm data path, AWS IoT Device Shadow service makes the device state available. Shadow updates are forwarded by an AWS IoT rule into downstream services such an AWS IoT Event, which tracks and monitors multiple devices and data points. Then it initiates actions based on specific events. Further, you could build APIs that interact with AWS IoT Device Shadow. In this architecture, we have used AWS AppSync and AWS Lambda to enable building controls via a tenant smartphone application.

Let’s discuss a real-world example. In an office meeting room lighting system, maintaining a certain brightness level is important for health and safety. If that space is unoccupied, you can save money by turning the lighting down or off. AWS IoT Events can take inputs from lumen sensors, lighting systems, and motorized blinds and put them into a detector model. This model calculates and prompts the best action to maintain the room’s brightness throughout the day. If the lumen level drops below a specific brightness threshold in a room, AWS IoT Events could prompt an action to maintain an optimal brightness level in the room. If an occupancy sensor is added to the room, the model can know if someone is in the room and maintain the lighting state. If that person leaves, it will turn off that lighting. The ongoing calculation of state can also evaluate the time of day or weather conditions. It would then select the most economical option for the room, such as opening the window blinds rather than turning on the lighting system.

Conclusion

In this blog, we demonstrated how to collect and aggregate the data produced by on-premises building management platforms. We discussed how augmenting this data with the AWS IoT Core platform allows for development of smart building solutions such as building automation and operational dashboarding. AWS products and services can enable your buildings to be more efficient while and also provide engaging tenant experiences. For more information on how to get started please check out our getting started with AWS IoT Core developer guide.

Field Notes: Ingest and Visualize Your Flat-file IoT Data with AWS IoT Services

Post Syndicated from Paul Ramsey original https://aws.amazon.com/blogs/architecture/field-notes-ingest-and-visualize-your-flat-file-iot-data-with-aws-iot-services/

Customers who maintain manufacturing facilities often find it challenging to ingest, centralize, and visualize IoT data that is emitted in flat-file format from their factory equipment. While modern IoT-enabled industrial devices can communicate over standard protocols like MQTT, there are still some legacy devices that generate useful data but are only capable of writing it locally to a flat file. This results in siloed data that is either analyzed in a vacuum without the broader context, or it is not available to business users to be analyzed at all.

AWS provides a suite of IoT and Edge services that can be used to solve this problem. In this blog, I walk you through one method of leveraging these services to ingest hard-to-reach data into the AWS cloud and extract business value from it.

Overview of solution

This solution provides a working example of an edge device running AWS IoT Greengrass with an AWS Lambda function that watches a Samba file share for new .csv files (presumably containing device or assembly line data). When it finds a new file, it will transform it to JSON format and write it to AWS IoT Core. The data is then sent to AWS IoT Analytics for processing and storage, and Amazon QuickSight is used to visualize and gain insights from the data.

Samba file share solution diagram

Since we don’t have an actual on-premises environment to use for this walkthrough, we’ll simulate pieces of it:

  • In place of the legacy factory equipment, an EC2 instance running Windows Server 2019 will generate data in .csv format and write it to the Samba file share.
    • We’re using a Windows Server for this function to demonstrate that the solution is platform-agnostic. As long as the flat file is written to a file share, AWS IoT Greengrass can ingest it.
  • An EC2 instance running Amazon Linux will act as the edge device and will host AWS IoT Greengrass Core and the Samba share.
    • In the real world, these could be two separate devices, and the device running AWS IoT Greengrass could be as small as a Raspberry Pi.

Prerequisites

For this walkthrough, you should have the following prerequisites:

  • An AWS Account
  • Access to provision and delete AWS resources
  • Basic knowledge of Windows and Linux server administration
  • If you’re unfamiliar with AWS IoT Greengrass concepts like Subscriptions and Cores, review the AWS IoT Greengrass documentation for a detailed description.

Walkthrough

First, we’ll show you the steps to launch the AWS IoT Greengrass resources using AWS CloudFormation. The AWS CloudFormation template is derived from the template provided in this blog post. Review the post for a detailed description of the template and its various options.

  1. Create a key pair. This will be used to access the EC2 instances created by the CloudFormation template in the next step.
  2. Launch a new AWS CloudFormation stack in the N. Virginia (us-east-1) Region using iot-cfn.yml, which represents the simulated environment described in the preceding bullet.
    •  Parameters:
      • Name the stack IoTGreengrass.
      • For EC2KeyPairName, select the EC2 key pair you just created from the drop-down menu.
      • For SecurityAccessCIDR, use your public IP with a /32 CIDR (i.e. 1.1.1.1/32).
      • You can also accept the default of 0.0.0.0/0 if you can have SSH and RDP open to all sources on the EC2 instances in this demo environment.
      • Accept the defaults for the remaining parameters.
  •  View the Resources tab after stack creation completes. The stack creates the following resources:
    • A VPC with two subnets, two route tables with routes, an internet gateway, and a security group.
    • Two EC2 instances, one running Amazon Linux and the other running Windows Server 2019.
    • An IAM role, policy, and instance profile for the Amazon Linux instance.
    • A Lambda function called GGSampleFunction, which we’ll update with code to parse our flat-files with AWS IoT Greengrass in a later step.
    • An AWS IoT Greengrass Group, Subscription, and Core.
    • Other supporting objects and custom resource types.
  • View the Outputs tab and copy the IPs somewhere easy to retrieve. You’ll need them for multiple provisioning steps below.

3. Review the AWS IoT Greengrass resources created on your behalf by CloudFormation:

    • Search for IoT Greengrass in the Services drop-down menu and select it.
    • Click Manage your Groups.
    • Click file_ingestion.
    • Navigate through the SubscriptionsCores, and other tabs to review the configurations.

Leveraging a device running AWS IoT Greengrass at the edge, we can now interact with flat-file data that was previously difficult to collect, centralize, aggregate, and analyze.

Set up the Samba file share

Now, we set up the Samba file share where we will write our flat-file data. In our demo environment, we’re creating the file share on the same server that runs the Greengrass software. In the real world, this file share could be hosted elsewhere as long as the device that runs Greengrass can access it via the network.

  • Follow the instructions in setup_file_share.md to set up the Samba file share on the AWS IoT Greengrass EC2 instance.
  • Keep your terminal window open. You’ll need it again for a later step.

Configure Lambda Function for AWS IoT Greengrass

AWS IoT Greengrass provides a Lambda runtime environment for user-defined code that you author in AWS Lambda. Lambda functions that are deployed to an AWS IoT Greengrass Core run in the Core’s local Lambda runtime. In this example, we update the Lambda function created by CloudFormation with code that watches for new files on the Samba share, parses them, and writes the data to an MQTT topic.

  1. Update the Lambda function:
    • Search for Lambda in the Services drop-down menu and select it.
    • Select the file_ingestion_lambda function.
    • From the Function code pane, click Actions then Upload a .zip file.
    • Upload the provided zip file containing the Lambda code.
    • Select Actions > Publish new version > Publish.

2. Update the Lambda Alias to point to the new version.

    • Select the Version: X drop-down (“X” being the latest version number).
    • Choose the Aliases tab and select gg_file_ingestion.
    • Scroll down to Alias configuration and select Edit.
    • Choose the newest version number and click Save.
    • Do NOT use $LATEST as it is not supported by AWS IoT Greengrass.

3. Associate the Lambda function with AWS IoT Greengrass.

    • Search for IoT Greengrass in the Services drop-down menu and select it.
    • Select Groups and choose file_ingestion.
    • Select Lambdas > Add Lambda.
    • Click Use existing Lambda.
    • Select file_ingestion_lambda > Next.
    • Select Alias: gg_file_ingestion > Finish.
    • You should now see your Lambda associated with the AWS IoT Greengrass group.
    • Still on the Lambda function tab, click the ellipsis and choose Edit configuration.
    • Change the following Lambda settings then click Update:
      • Set Containerization to No container (always).
      • Set Timeout to 25 seconds (or longer if you have large files to process).
      • Set Lambda lifecycle to Make this function long-lived and keep it running indefinitely.

Deploy AWS IoT Greengrass Group

  1. Restart the AWS IoT Greengrass daemon:
    • A daemon restart is required after changing containerization settings. Run the following commands on the Greengrass instance to restart the AWS IoT Greengrass daemon:
 cd /greengrass/ggc/core/

 sudo ./greengrassd stop

 sudo ./greengrassd start

2. Deploy the AWS IoT Greengrass Group to the Core device.

    • Return to the file_ingestion AWS IoT Greengrass Group in the console.
    • Select Actions Deploy.
    • Select Automatic detection.
    • After a few minutes, you should see a Status of Successfully completed. If the deployment fails, check the logs, fix the issues, and deploy again.

Generate test data

You can now generate test data that is ingested by AWS IoT Greengrass, written to AWS IoT Core, and then sent to AWS IoT Analytics and visualized by Amazon QuickSight.

  1. Follow the instructions in generate_test_data.md to generate the test data.
  2. Verify that the data is being written to AWS IoT Core following these instructions (Use iot/data for the MQTT Subscription Topic instead of hello/world).

screenshot

Setup AWS IoT Analytics

Now that our data is in IoT Cloud, it only takes a few clicks to configure AWS IoT Analytics to process, store, and analyze our data.

  1. Search for IoT Analytics in the Services drop-down menu and select it.
  2. Set Resources prefix to file_ingestion and Topic to iot/data. Click Quick Create.
  3. Populate the data set by selecting Data sets > file_ingestion_dataset >Actions > Run now. If you don’t get data on the first run, you may need to wait a couple of minutes and run it again.

Visualize the Data from AWS IoT Analytics in Amazon QuickSight

We can now use Amazon QuickSight to visualize the IoT data in our AWS IoT Analytics data set.

  1. Search for QuickSight in the Services drop-down menu and select it.
  2. If your account is not signed up for QuickSight yet, follow these instructions to sign up (use Standard Edition for this demo)
  3. Build a new report:
    • Click New analysis > New dataset.
    • Select AWS IoT Analytics.
    • Set Data source name to iot-file-ingestion and select file_ingestion_dataset. Click Create data source.
    • Click Visualize. Wait a moment while your rows are imported into SPICE.
    • You can now drag and drop data fields onto field wells. Review the QuickSight documentation for detailed instructions on creating visuals.
    • Following is an example of a QuickSight dashboard you can build using the demo data we generated in this walkthrough.

Cleaning up

Be sure to clean up the objects you created to avoid ongoing charges to your account.

  • In Amazon QuickSight, Cancel your subscription.
  • In AWS IoT Analytics, delete the datastore, channel, pipeline, data set, role, and topic rule you created.
  • In CloudFormation, delete the IoTGreengrass stack.
  • In Amazon CloudWatch, delete the log files associated with this solution.

Conclusion

Gaining valuable insights from device data that was once out of reach is now possible thanks to AWS’s suite of IoT services. In this walkthrough, we collected and transformed flat-file data at the edge and sent it to IoT Cloud using AWS IoT Greengrass. We then used AWS IoT Analytics to process, store, and analyze that data, and we built an intelligent dashboard to visualize and gain insights from the data using Amazon QuickSight. You can use this data to discover operational anomalies, enable better compliance reporting, monitor product quality, and many other use cases.

For more information on AWS IoT services, check out the overviews, use cases, and case studies on our product page. If you’re new to IoT concepts, I’d highly encourage you to take our free Internet of Things Foundation Series training.

Field Notes provides hands-on technical guidance from AWS Solutions Architects, consultants, and technical account managers, based on their experiences in the field solving real-world business problems for customers.