In today’s digital era, information is an asset and most of it is obtained from websites. The ability to automatically monitor website content changes has become a crucial competitive advantage, as even small changes on a website can affect business strategies, security postures, and data-driven decision-making. Accordingly, Zabbix 7.0 saw the introduction of a new feature called Browser Item, which allowed users to perform advanced website monitoring using a browser.
The Browser Item feature includes the ability to:
● Capture screenshots of the current website state
● Measure website performance and availability metrics
● Extract and analyze data from web pages
● Generate automatic alerts based on detected changes or errors
This means Zabbix is no longer limited to traditional IT infrastructure monitoring. It can now also serve as a tool for monitoring strategic external information.
Key use cases for website change monitoring with Zabbix
The Zabbix Browser Item opens up many valuable use cases for organizations that want to proactively track website changes. Below are some key examples:
Monitoring release notes
Tracking vendor release notes is essential for IT teams. With Zabbix, we can automatically detect new releases, extract relevant information, and notify the appropriate team members so they can respond faster.
Tracking security advisories
Security advisories are critical for maintaining a strong security posture. By monitoring websites that publish vulnerability information using Zabbix, security teams can be promptly alerted about new threats and take timely actions to reduce risks.
Monitoring competitor websites
In a competitive market, staying informed about competitor activities is vital. Zabbix allows users to monitor competitor websites for pricing updates, new product offerings, marketing campaigns, or news announcements, while providing valuable business intelligence to support strategic decisions.
Monitoring tender announcements
Zabbix can also monitor websites for new tender announcements from government portals or business partners, ensuring our organization stays aware of the latest business opportunities.
Ensuring internal website integrity
Beyond external sites, we can also use the Browser Item to ensure the integrity and availability of our own websites. It helps detect unexpected content changes, broken links, or performance degradation that may affect the user experience or signal potential issues. Proactive monitoring helps maintain a high-quality user experience and protect our brand reputation.
Getting started with website change monitoring in Zabbix
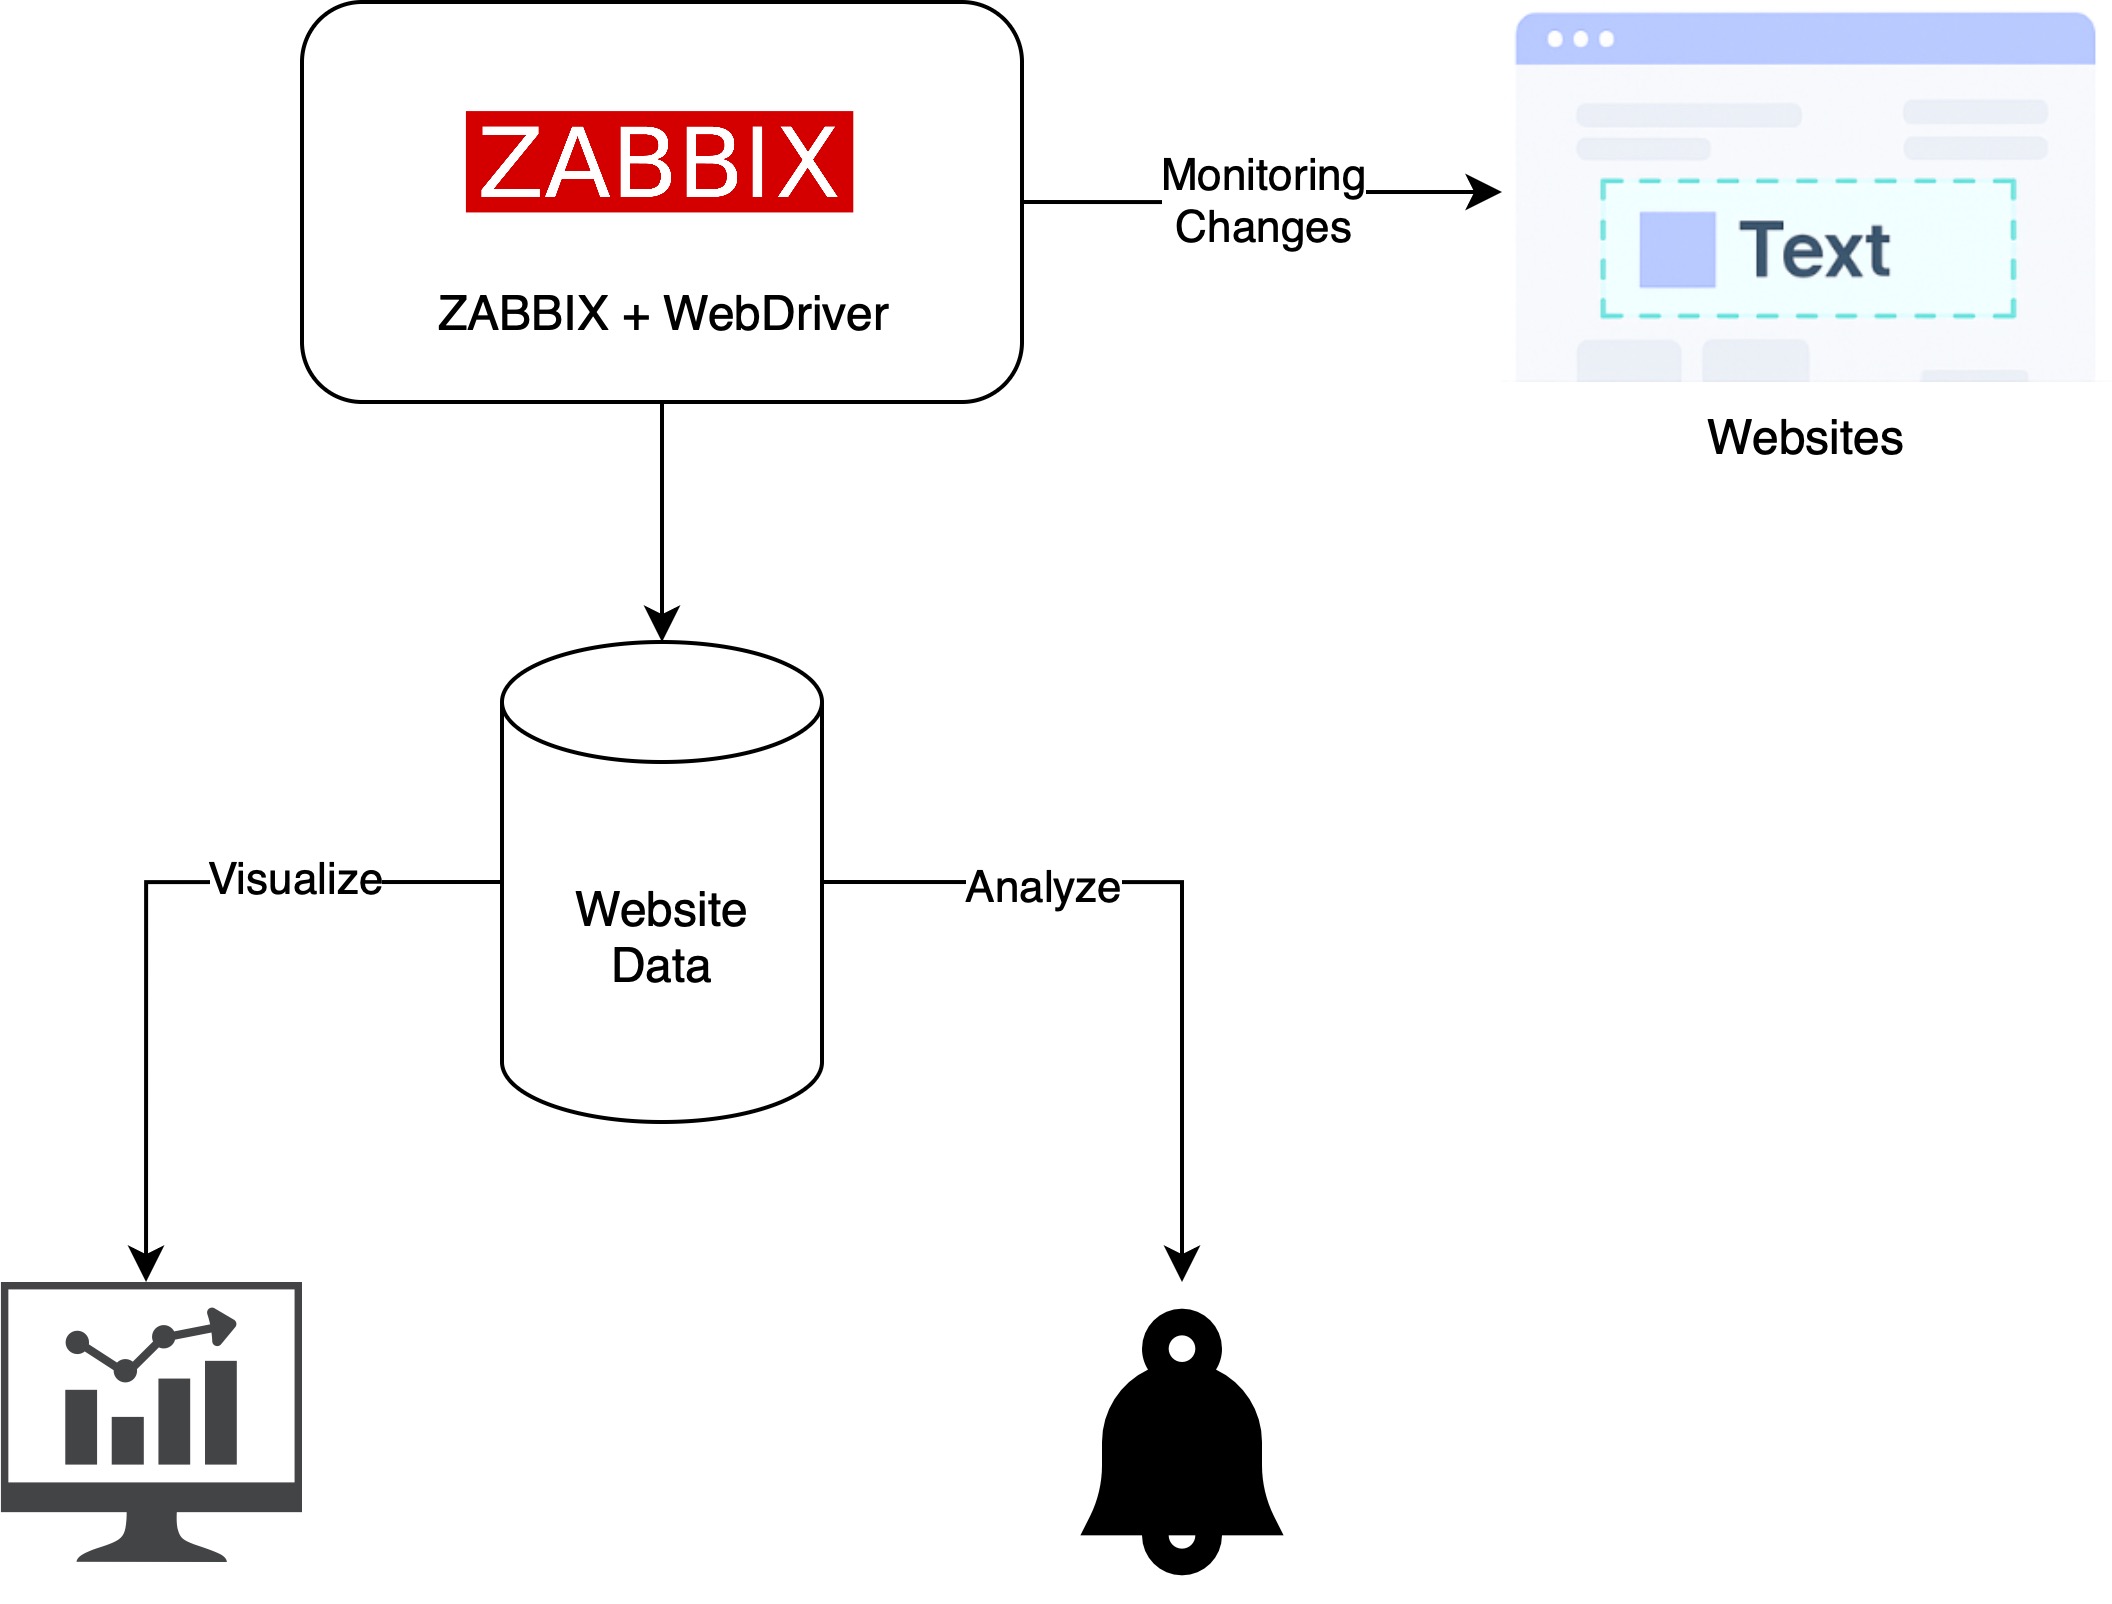
Solution overview architecture
This diagram shows how Zabbix uses a WebDriver to capture and analyze website content.
The collected data is stored in Zabbix for visualization and alerts when changes are
detected.
Step-by-step configuration
In this example, we’ll monitor changes on the Nginx Security Advisories webpage.
Step 1: Prepare the Web Driver
Zabbix requires a Web Driver to perform browser-based monitoring. One commonly used option is Selenium, which can be deployed using the following Docker image:
Step 2: Configure WebDriverURL on Zabbix server or proxy
Update the WebDriverURL parameter in your Zabbix Server or Zabbix Proxy configuration to point to the Selenium service you deployed.
Step 3: Create a Browser Item in Zabbix
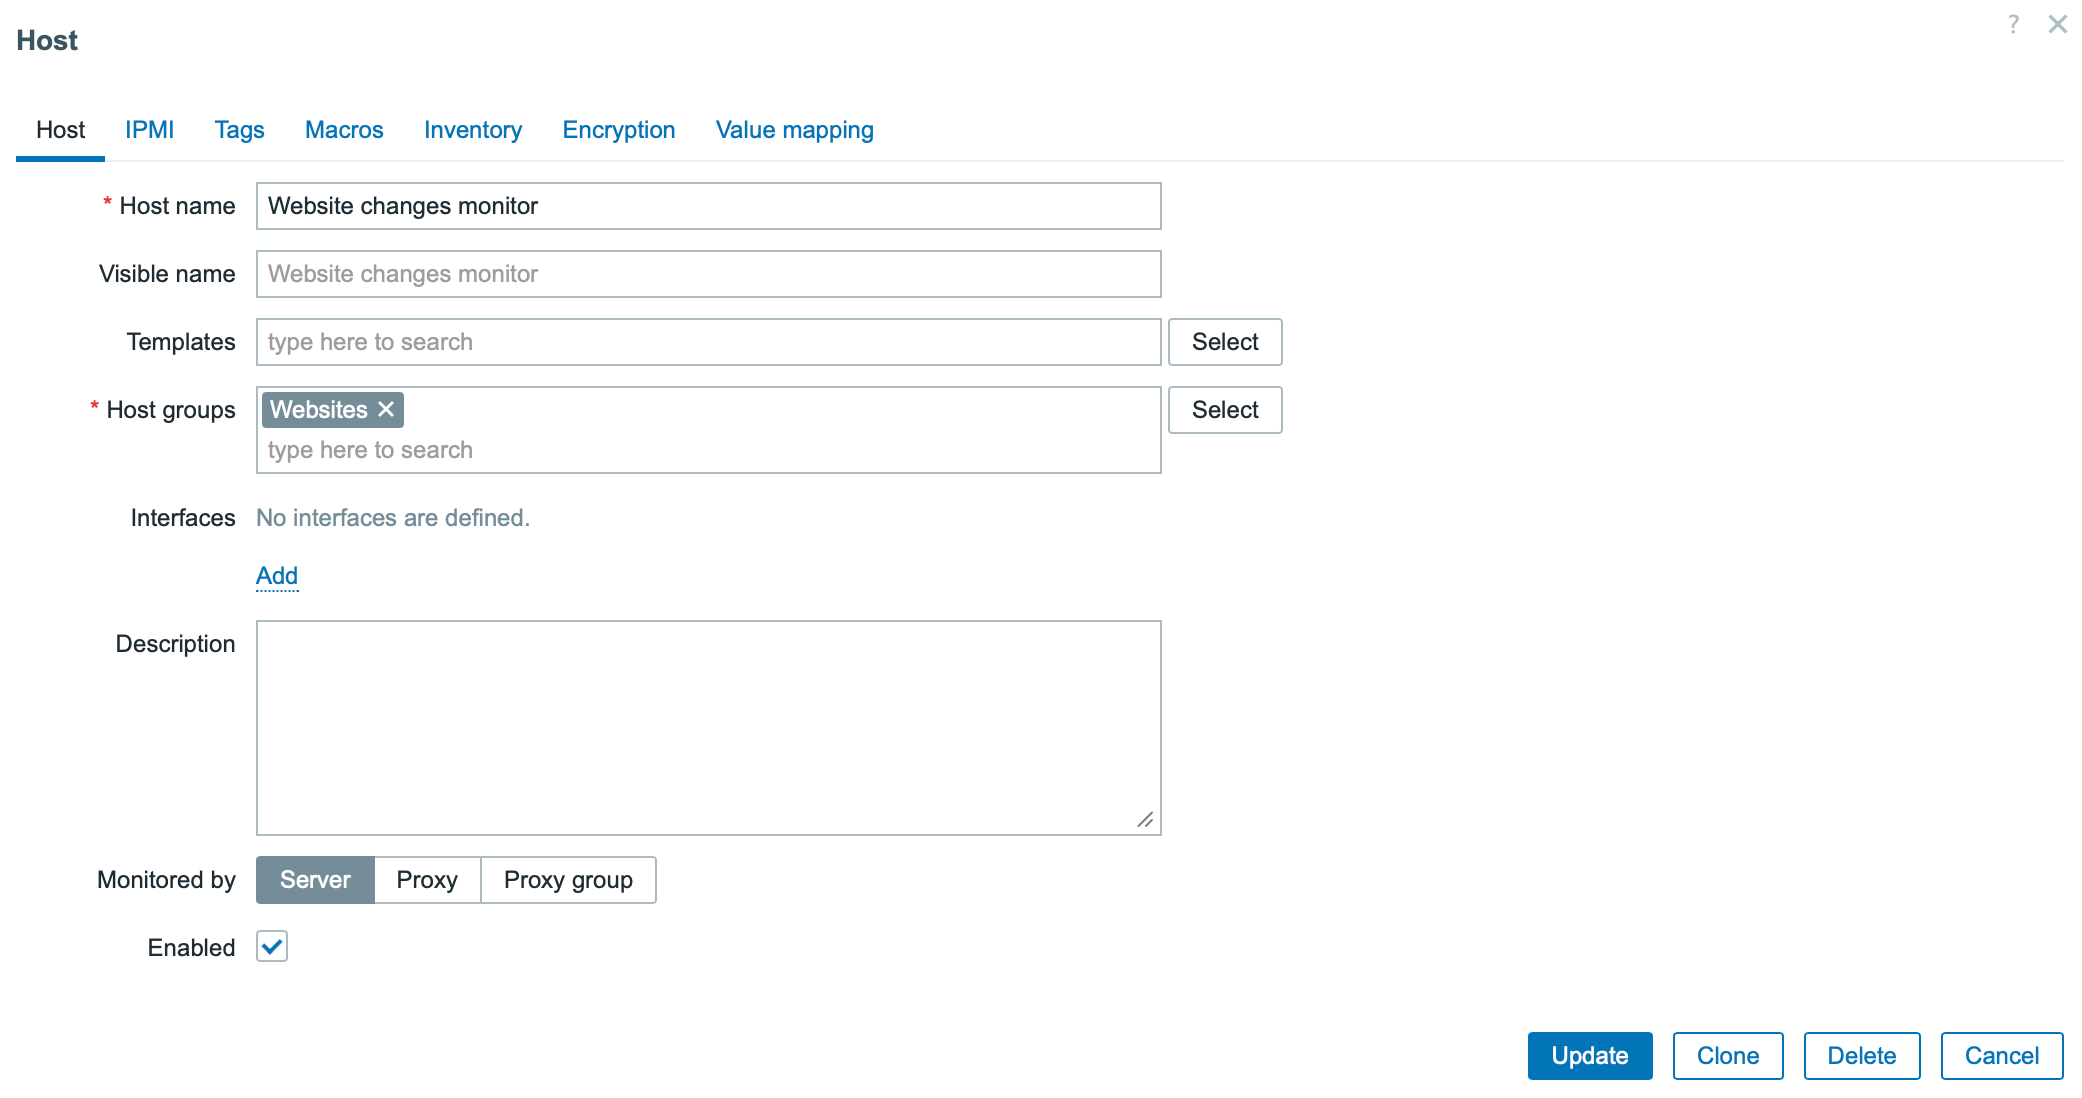
1. Create a host if it doesn’t already exist.
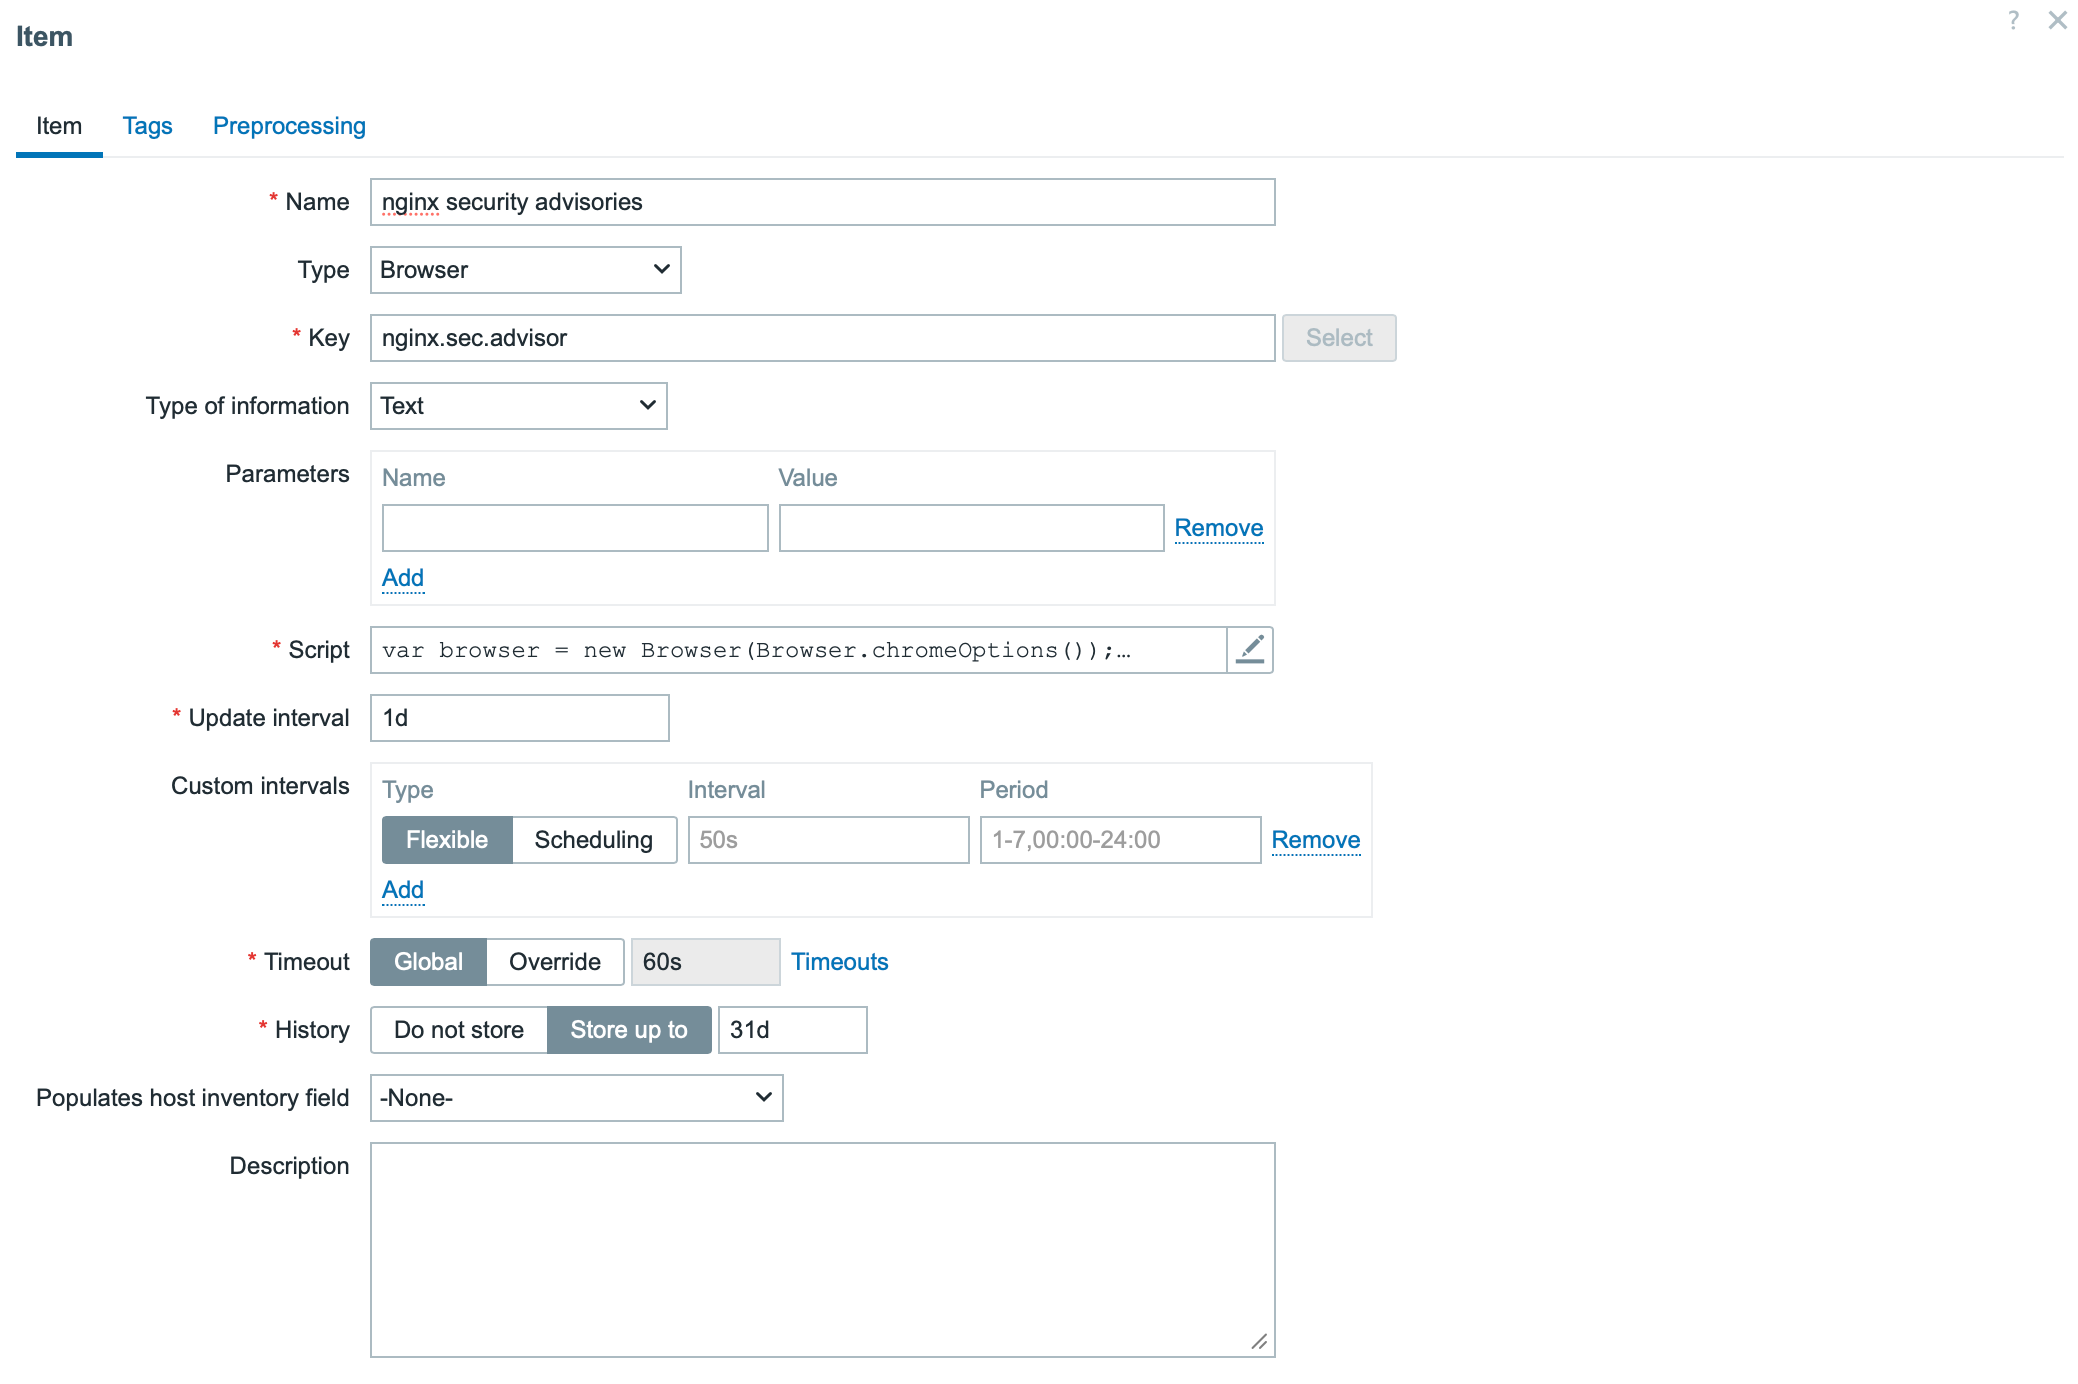
2. Add a new item with the following settings:
Type: Browser
Type of information: Text
The key part is the script section. Below is the example script.
The script uses two methods:
browser.navigate method defines the URL to be monitored
browser.findElements method specifies the page section where changes should be detected
Note: The StartBrowserPollers parameter must be enabled on the Zabbix server or proxy configuration for browser items to work. It is enabled by default with the value StartBrowserPollers=1.
Step 4: Create dependent items
The Browser Item produces a JSON result containing website data. This item serves as the master item for dependent items such as:
Extracting the latest security advisories
Capturing a website screenshot
Step 5: Create a trigger for change alerts
Create a trigger that compares the current and previous values of the “latest security advisories” item. If any change is detected, Zabbix will automatically send an alert notifying your team of the update.
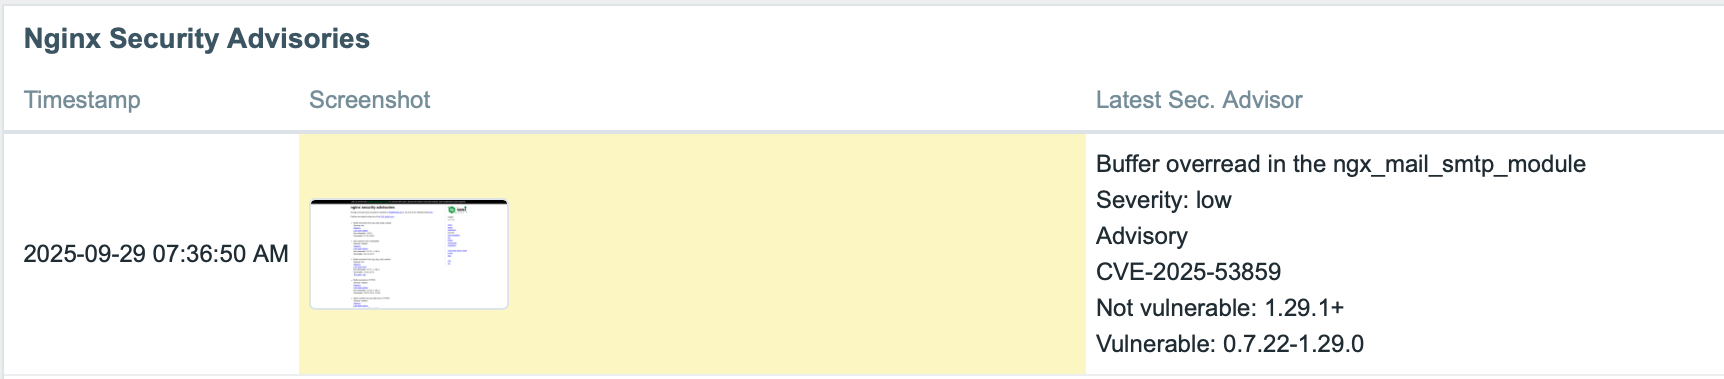
Step 6: Display data on the dashboard
To visualize the monitored data, we can use the Item History widget on a Zabbix dashboard to show both the latest security advisories and the corresponding screenshot, for example.
Conclusion
The Browser Item feature in Zabbix 7.0 elevates website monitoring beyond simple availability checks. It enables comprehensive monitoring of website changes, unlocking a variety of use cases such as tracking release notes, security advisories, competitor activity, and more.
If you’re interested in implementing this capability, feel free to contact us. Bangunindo is a Zabbix Premium Partner in Indonesia, ready to help you design, implement, and optimize your Zabbix monitoring solution to fit your specific needs.
Website and web application monitoring can vary from simple use cases to complex multi-step scenarios. To fully cover the scope of modern website monitoring requirements, Zabbix has introduced Browser item, a new item type that brings with it multiple accompanying improvements for simulating browser behavior and collecting website metrics.
Table of Contents
What is browser monitoring?
Browser monitoring allows users to monitor complex websites and web applications using an actual browser. It involves the constant tracking and analysis of the performance, reliability, and functionality of a website or web application from a real user perspective. This process ensures that key pages, features, and user navigation work as expected. By monitoring critical pages and flows specific to different businesses, companies can ensure optimal user experience, resolve potential or ongoing issues, and proactively address any potential problems.
Browser monitoring can be split into two main approaches:
Browser real user monitoring – Monitors how your web page or web application is performing, using real user data to analyze overall performance and user experience.
Browser synthetic monitoring – Analyzes application availability and performance, using scheduled testing to analyze website availability and emulate real user experience.
Since Zabbix is not a real person (yet) but is fully capable of emulating real user behavior on a website very precisely, we will focus on browser synthetic monitoring.
What business goals can we achieve with browser monitoring?
There are a multitude of goals that can be achieved, depending on what business we are running or expect to monitor, but some examples include:
Improving user experience
Browser monitoring helps ensure that users have a fast, smooth, and reliable experience on a website or web application. A positive user experience leads to higher user satisfaction and a greater likelihood of repeated visits or purchases.
Ensuring cross-browser and cross-device compatibility
Users access websites from a host of browsers and devices. Browser monitoring helps to detect compatibility issues that could affect certain users (e.g., JavaScript errors on specific browsers or layout shifts on mobile). By monitoring these scenarios, we can deliver a consistent experience across platforms, which is essential as multi-device usage continues to grow.
E-commerce checkout monitoring
Retailers can ensure a smooth checkout process by monitoring page load times, form interactions, and payment processing to confirm that users can easily complete purchases.
Form performance
Browser monitoring makes it easy to detect any issues preventing form completion, such as slow response times or broken validation. It also ensures a smooth, error-free experience to improve lead capture and gain more conversions.
Subscription renewal page monitoring
Subscription-based businesses rely on customers regularly renewing or upgrading their plans. Monitoring the subscription renewal page for load speed, usability, and any payment processing issues is essential, as issues on this page can directly the amount of renewals and lead to customer loss.
Supporting portal uptime
Many businesses provide a customer support portal where users can submit requests or use a knowledge database. Downtime or slow response times can lead to frustrated customers and an increased number of complaints.
How to set up browser monitoring
There are a lot of goals we can reach, but the question remains – how can we reach them with Zabbix? The answer is that we can use the already mentioned and newly introduced browser item.
Browser item configuration window
Browser items gather information by running custom JavaScript code and fetching data via HTTP or HTTPS protocols. These items can mimic browser activities like clicking buttons, typing text, navigating across webpages, and performing other user interactions within websites or web applications.
Along with the script, users can specify optional parameters (name-value pairs) and set a timeout limit for the actions. But before we can actually use the item, we will need to configure Zabbix server or Zabbix proxy with a WebDriver, so that Zabbix can actually control browser trough scripts.
What is a WebDriver? A WebDriver controls a browser directly, mimicking user interactions through a local machine or on a remote server, enabling full browser automation. The term WebDriver includes both the language-specific bindings and the individual browser control implementations, often simply called WebDriver. WebDriver is designed to offer a straightforward and streamlined programming interface trough an object-oriented API which efficiently manages and drives browser actions.
In this guide, for instance, we’ll use a WebDriver with Chrome within a Docker container and make a script that includes actions like button clicks and text entry.
WebDriver installation
One of the simplest ways to install a WebDriver is to use containers. To install a chrome WebDriver on a local or remote machine, you can use Docker or any other preferred container engines:
Port 4444 will be the port on which the WebDriver will be listening and port 7900 will be used by NoVNC, which allows us to observe browser behavior in case a browser with a GUI is used.
Zabbix server/proxy configuration
After WebDriver is installed, we need to set up the communication between Zabbix and the driver. This can be done by editing the Zabbix server/proxy configuration file and updating the following parameters:
### Option: WebDriverURL
#       WebDriver interface HTTP[S] URL. For example http://localhost:4444 used with
#       Selenium WebDriver standalone server.
#
# WebDriverURL=
WebDriverURL=http://localhost:4444

### Option: StartBrowserPollers
#       Number of pre-forked instances of browser item pollers.
#
# Range: 0-1000
# StartBrowserPollers=1
StartBrowserPollers=5
With the configuration parameters in place, we will now configure our Browser item to collect and monitor the list of upcoming Zabbix trainings from the training schedule page.
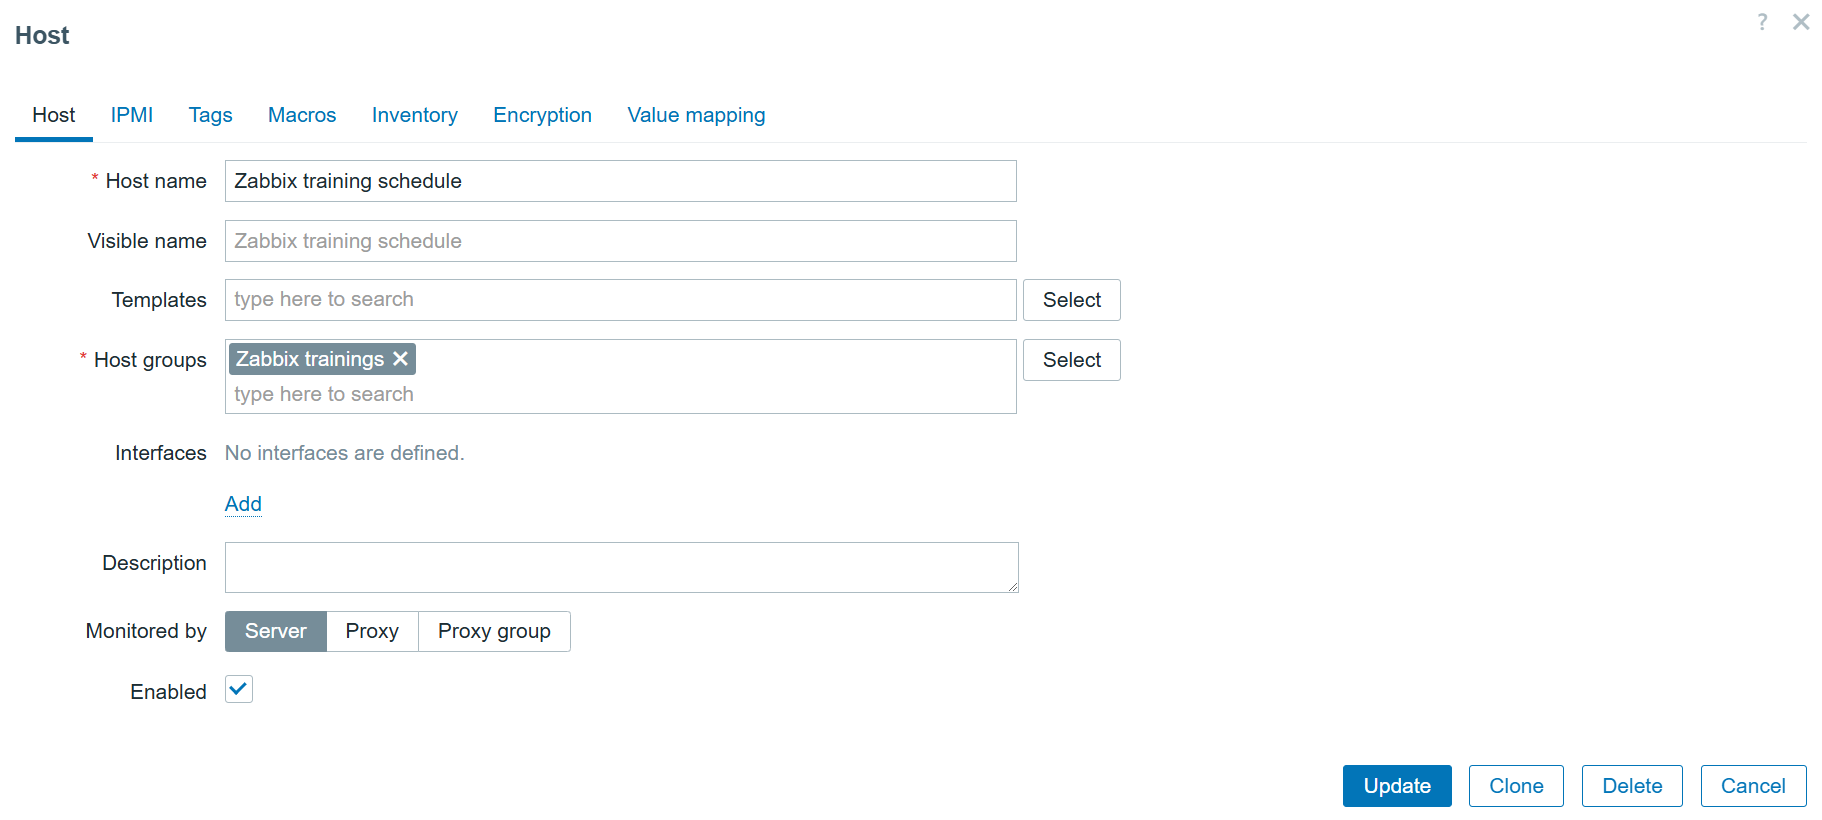
Creating a host
First, we need to navigate to the “Data collection” > “Hosts” section and create a host that represents our web page. This is more than anything – a logical representation. This means we don’t need any specific interfaces or additional configuration. The host in our example will look like this:
Training page monitoring host
Creating a browser item
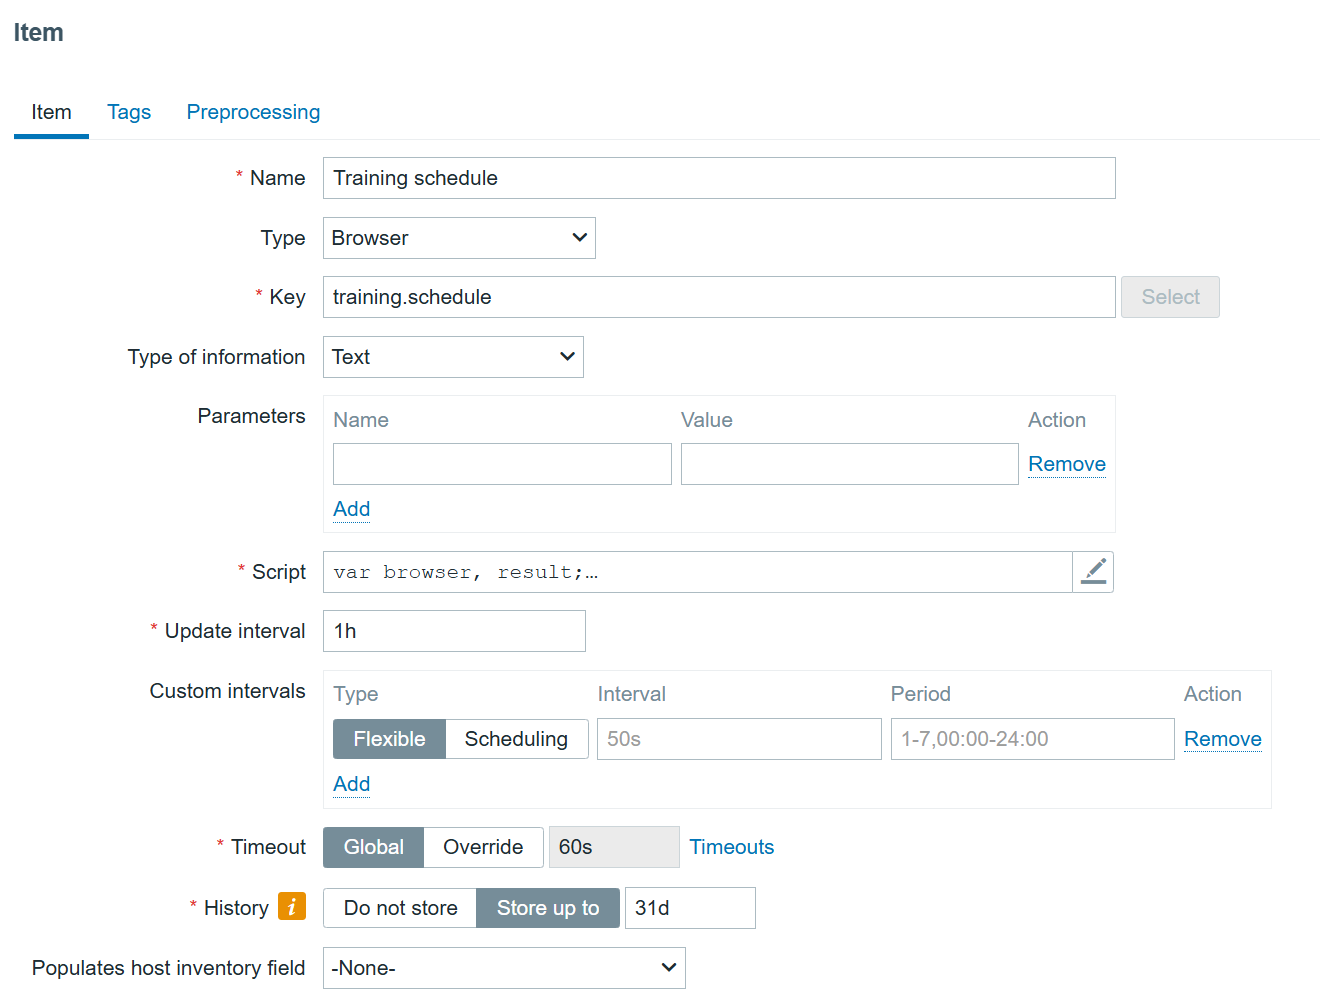
Since the data collection is done by items, we need to navigate to the “Items” section on the “Zabbix training schedule” host and create an item with the type “Browser.” It should look something like this:
Training schedule browser item
Now comes the most important part – creating the script to monitor the schedule. Click on the “Script” field.
First, we will need to define what browser we will use, and any extra options we might want to specify, like screen resolution or whether the browser should run in headless mode or not. This can be done using the Browser object. The Browser object manages WebDriver sessions and initializes a session upon creation, then terminates it upon destruction. A single script can support up to four Browser objects.
var browser, result;
var  opts = Browser.chromeOptions();
opts.capabilities.alwaysMatch['goog:chromeOptions'].args = []
browser = new Browser(opts);
browser.setScreenSize(Number(1980), Number(1020));
In this snippet, we defined that we will use the Chrome browser with a GUI. As you can see, the screen size is set to the pretty common 1980x1020p.
Now we will need to define what the browser will be doing. This can be done by using such Browser object methods as navigate – to point to the correct URL of the web page or application and (for example) findElement/findElements to return some element of the web page.
findElement/findElements methods allow us to define strategies to locate an element and selectors to provide what to look for. Strategies and selectors can be of multiple kinds: strategy – (string, CSS selector/link text/partial link text/tag name/Xpath) selector – (string) Element selector using the specified location strategy
Let’s take a look at the next snippet:
try {
    browser.navigate("https://www.zabbix.com/");
    browser.collectPerfEntries("open page");

    el = browser.findElement("xpath", "//span[text()='Training']");
    if (el === null) {
     throw Error("cannot find training");
    }
    el.click();

    el = browser.findElement("link text", "Schedule");
    if (el === null) {
        throw Error("cannot find application form");
    }
    el.click();
In this snippet,
I am using a browser to navigate to the Zabbix page.
I collect a range of performance entries related to opening the page (download speed, response time, etc.).
I look for an element with the text “Training” using the XPath strategy, and the selector “Training.”
I click on it, which is a method to interact with elements.
In the next part, I use the strategy “link text” to find a link with the text selector “Schedule.”
I click on it
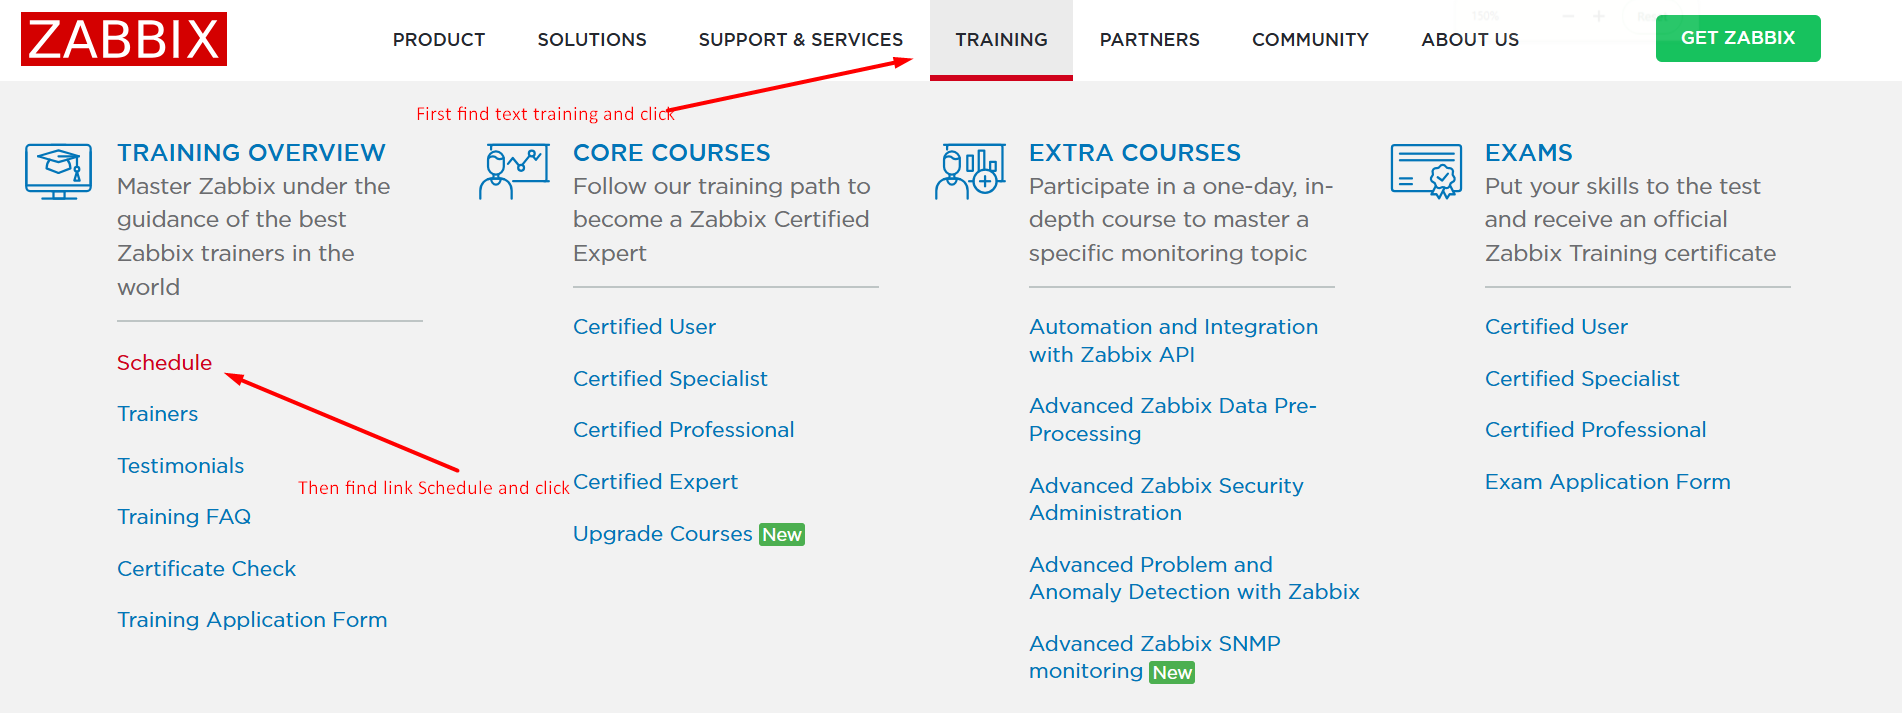
A visual description would look like this:
Browser interaction with the zabbix.com website
Now, let’s do some more clicking to filter out all other trainings and leave only trainings in Korean and Dutch:
    el = browser.findElement("link text", "English");
    if (el === null) {
        throw Error("cannot find application form");
    }
    el.click();

    el = browser.findElement("xpath", "//span[text()='English']");
    if (el === null) {
        throw Error("cannot find application form");
    }
    el.click();

    el = browser.findElement("xpath", "//span[text()='Korean']");
    if (el === null) {
        throw Error("cannot find application form");
    }
    el.click();

    el = browser.findElement("xpath", "//span[text()='Dutch']");
    if (el === null) {
        throw Error("cannot find password input field");
    }
    el.click();

    Zabbix.sleep(2000);
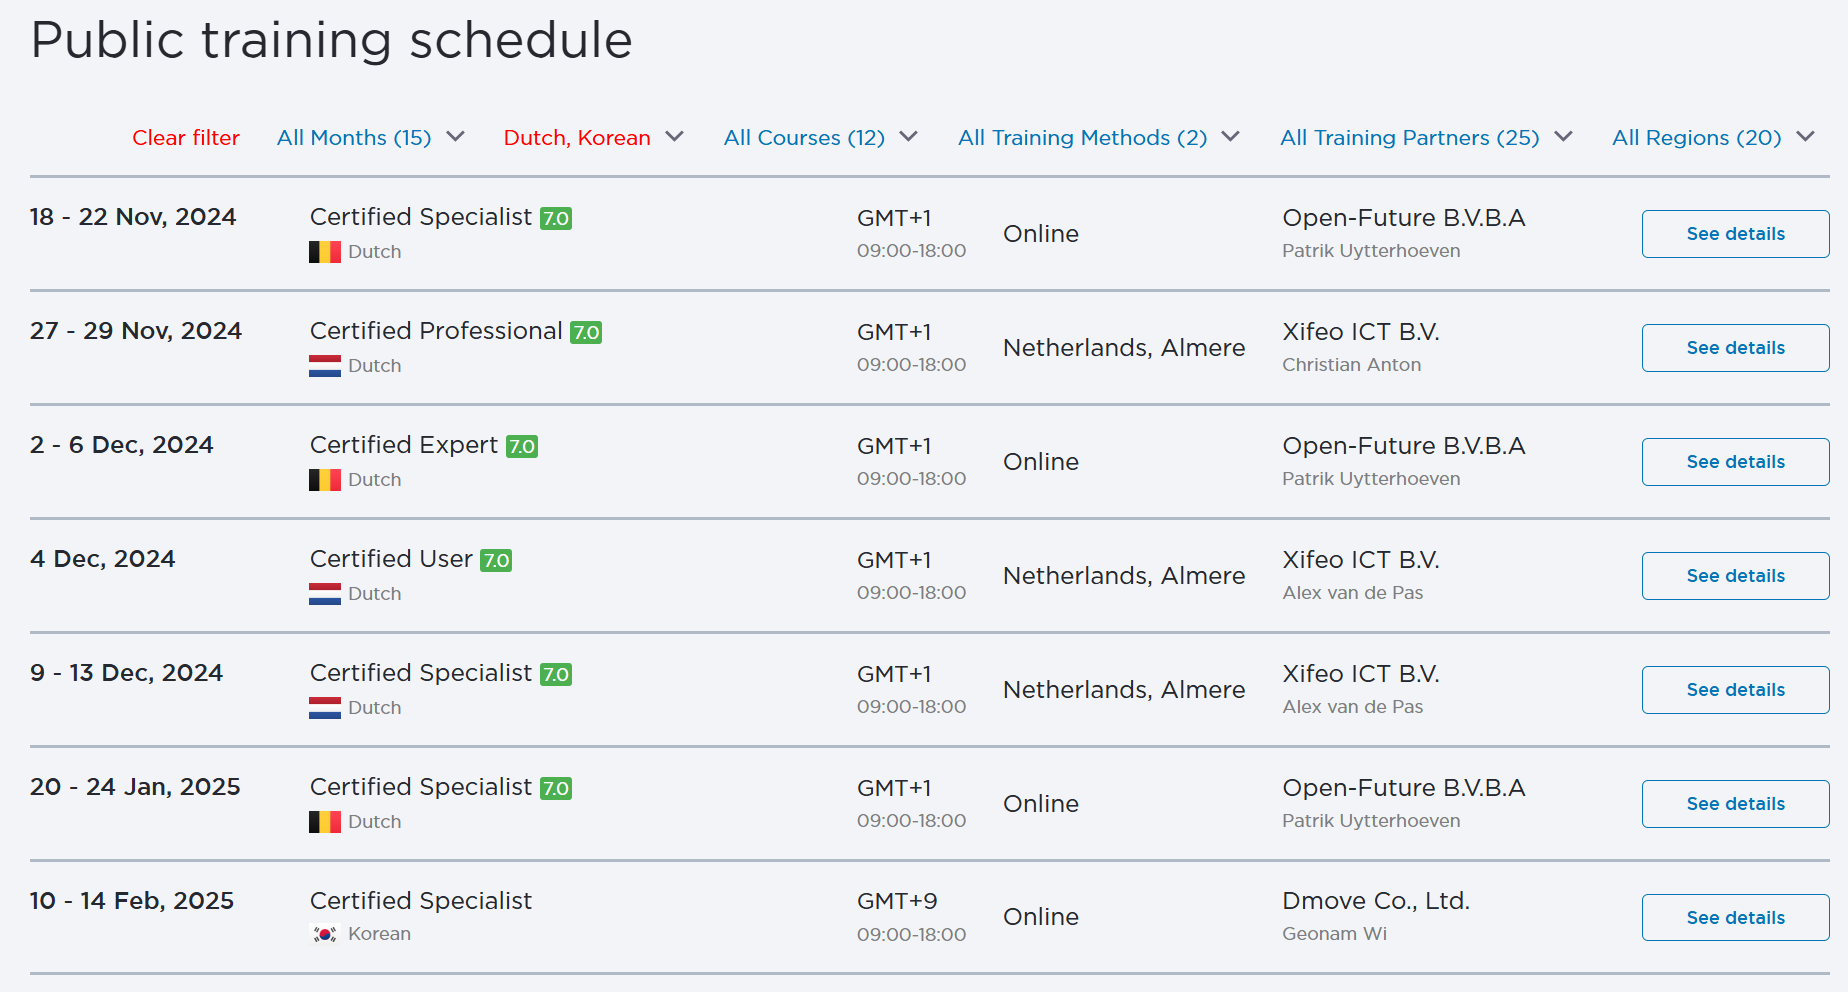
English is selected by default, so the script “unclicks” it. Then it selects Korean and Dutch and uses the sleep function to have some extra time for the page to load and make a screenshot of the currently opened page:
List of trainings with language filters applied on it
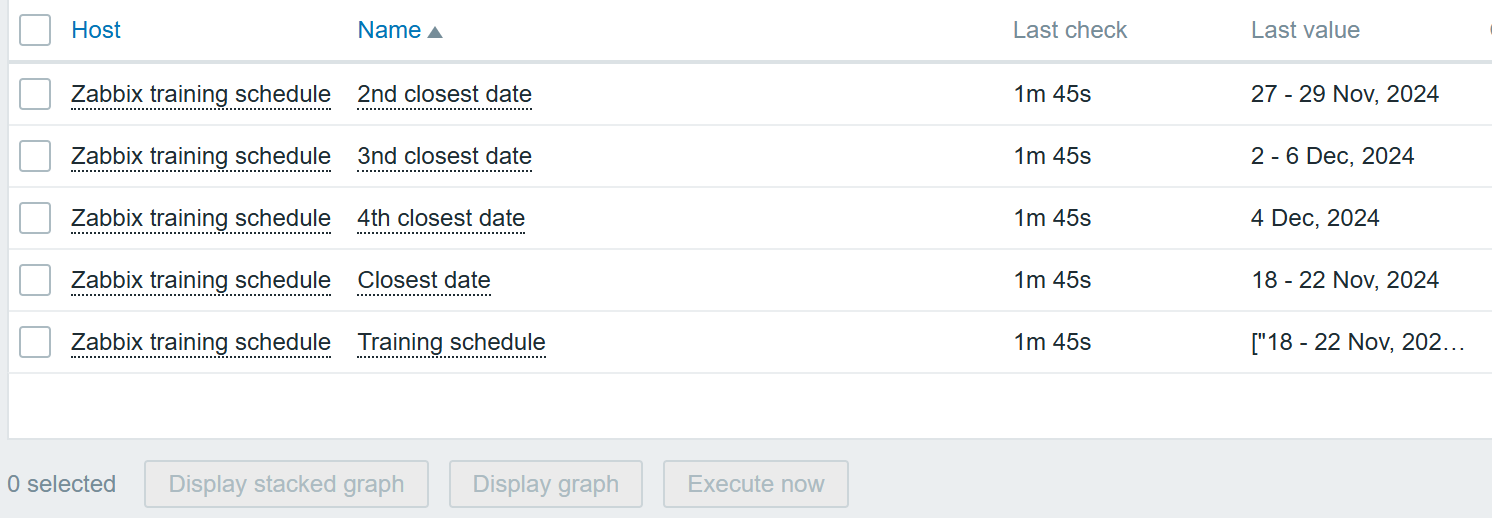
Now let’s get the list of dates so we can monitor which trainings we have left in 2024:
el = browser.findElements("xpath", "//*[contains(text(), ' 20')]");
var dates = [];
for (var n = 0; n < el.length; n++) {
    dates.push(el[n].getText('2024'));
}

// Remove entries that do not contain "2024"
dates = dates.filter(function(date) {
    return date.includes('2024');
});

dates = uniq(dates);
In this case we do a bit of a jump, and now search for all elements that contain text 20 (to include all years), but filter them out by year 2024 specifically, which later can be easily replaced with 2025. The end result contains all the upcoming training dates:
Items containing the upcoming training dates
The full host export with the script snippet can be found by following this link.
An additional example
But what if I want to fill in a form? Maybe to make a purchase, create an order, or just test a contact form? Good news – that’s an even simpler operation! Let’s take a look at this snippet:
// enter name
var el = browser.findElement("xpath", "//label[text()='First Name']/following::input");
if (el === null) {throw Error("cannot find name input field");}
el.sendKeys("Aleksandrs");
// enter last name
var el = browser.findElement("xpath", "//label[text()='Last name']/following::input");
if (el === null) {throw Error("cannot find name input field");}
el.sendKeys("Petrovs-Gavrilovs");
// enter cert number
var el = browser.findElement("xpath", "//label[text()='Certificate number']/following::input");
if (el === null) {throw Error("cannot find name input field");}
el.sendKeys("CT-2404-003");
// select version
var el = browser.findElement("css selector", "form#certificate_validation>fieldset>div:nth-of-type(5)>select");
if (el === null) {throw Error("cannot find name input field");}
el.sendKeys("7.0");
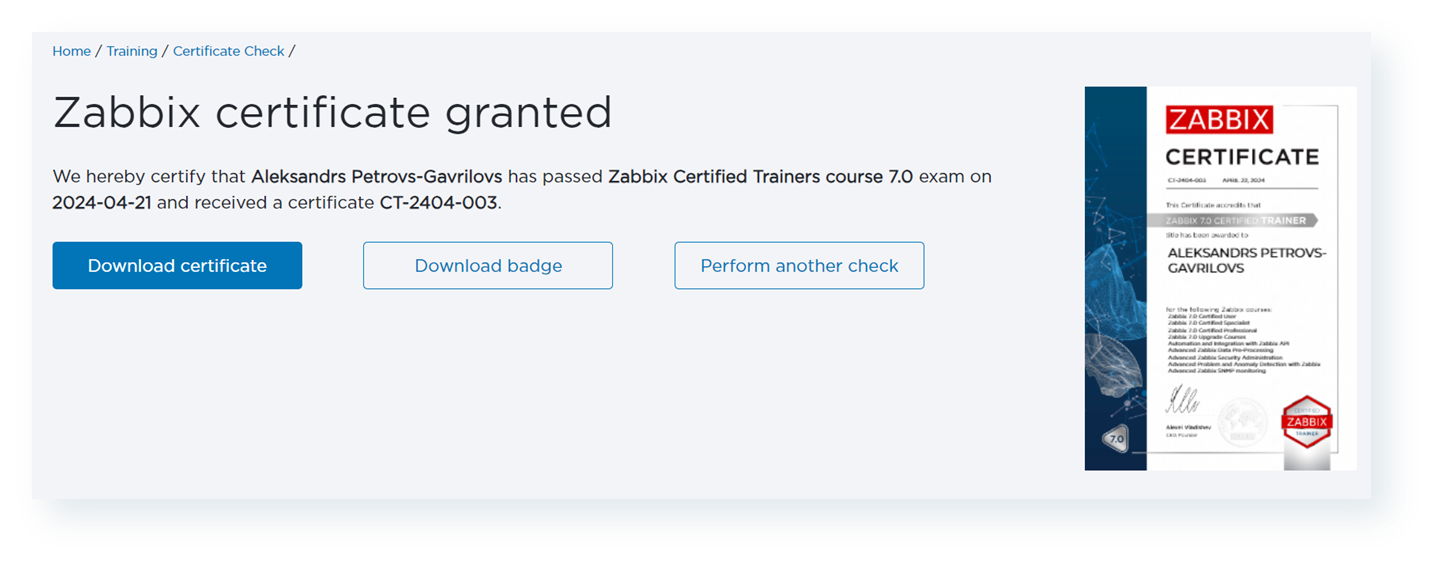
// check certificate
var el = browser.findElement("xpath", "//button[text()='Check Certificate']");
if (el === null) {throw Error("cannot find name input field");}
el.click();
This way, I can validate that my certificate is still valid!
As you can see, there are multiple ways to make a browser emulate user behavior and allow us to validate whether our pages and businesses are performing the way we expect them to! You can find even more examples in Zabbix documentation and Zabbix Certified Training, which I welcome you to attend!
To provide the best experiences, we use technologies like cookies to store and/or access device information. Consenting to these technologies will allow us to process data such as browsing behavior or unique IDs on this site. Not consenting or withdrawing consent, may adversely affect certain features and functions.
Functional
Always active
The technical storage or access is strictly necessary for the legitimate purpose of enabling the use of a specific service explicitly requested by the subscriber or user, or for the sole purpose of carrying out the transmission of a communication over an electronic communications network.
Preferences
The technical storage or access is necessary for the legitimate purpose of storing preferences that are not requested by the subscriber or user.
Statistics
The technical storage or access that is used exclusively for statistical purposes.The technical storage or access that is used exclusively for anonymous statistical purposes. Without a subpoena, voluntary compliance on the part of your Internet Service Provider, or additional records from a third party, information stored or retrieved for this purpose alone cannot usually be used to identify you.
Marketing
The technical storage or access is required to create user profiles to send advertising, or to track the user on a website or across several websites for similar marketing purposes.