Post Syndicated from Alexander Petrov-Gavrilov original https://blog.zabbix.com/monitoring-a-starlink-dish-with-zabbix/31543/

Did you realize that you can monitor a Starlink dish using just Zabbix? The idea (or rather the need) to use Starlink came to me almost as soon as I moved to a fairly rural area. Local internet providers have not yet “provided” fiberoptic or stable mobile connectivity to places like this, and while searching for a solution I accidentally discovered that Starlink was already providing service to some local companies. As I later found out, they also offered service in my area for residential customers.
To make a long story short, since internet access is crucial in the IT field, I decided to acquire and then monitor my very own Starlink dish. At first, this proved challenging because regular user data access is quite limited. However, thanks to Zabbix browser monitoring, I managed to solve it fairly easily. In this post I will share my solution with you, including the template.
Table of Contents
Monitoring configuration
First, you need to make sure you have Zabbix installed (either a Zabbix proxy or server) on the same network that the Starlink dish and router are on. The next step is to configure Zabbix for browser monitoring.
WebDriver installation
# podman run --name webdriver -d \
-p 4444:4444 \
-p 7900:7900 \
--shm-size="2g" \
--restart=always -d docker.io/selenium/standalone-chrome:latest
Port 4444 will be the port on which the WebDriver will be listening, and port 7900 will be used by NoVNC, which allows us to observe browser behavior in case a browser with a GUI is used.
Zabbix server/proxy configuration
After WebDriver is installed, we need to set up the communication between Zabbix and the driver. This can be done by editing the Zabbix server/proxy configuration file and updating the following parameters:
### Option: WebDriverURL
# WebDriver interface HTTP[S] URL. For example http://localhost:4444 used with
# Selenium WebDriver standalone server.
#
# WebDriverURL=
WebDriverURL=http://localhost:4444
### Option: StartBrowserPollers
# Number of pre-forked instances of browser item pollers.
#
# Range: 0-1000
# StartBrowserPollers=1
StartBrowserPollers=5
With the configuration parameters in place, restart the Zabbix server/proxy to apply the changes:
systemctl restart zabbix-server
Creating a host
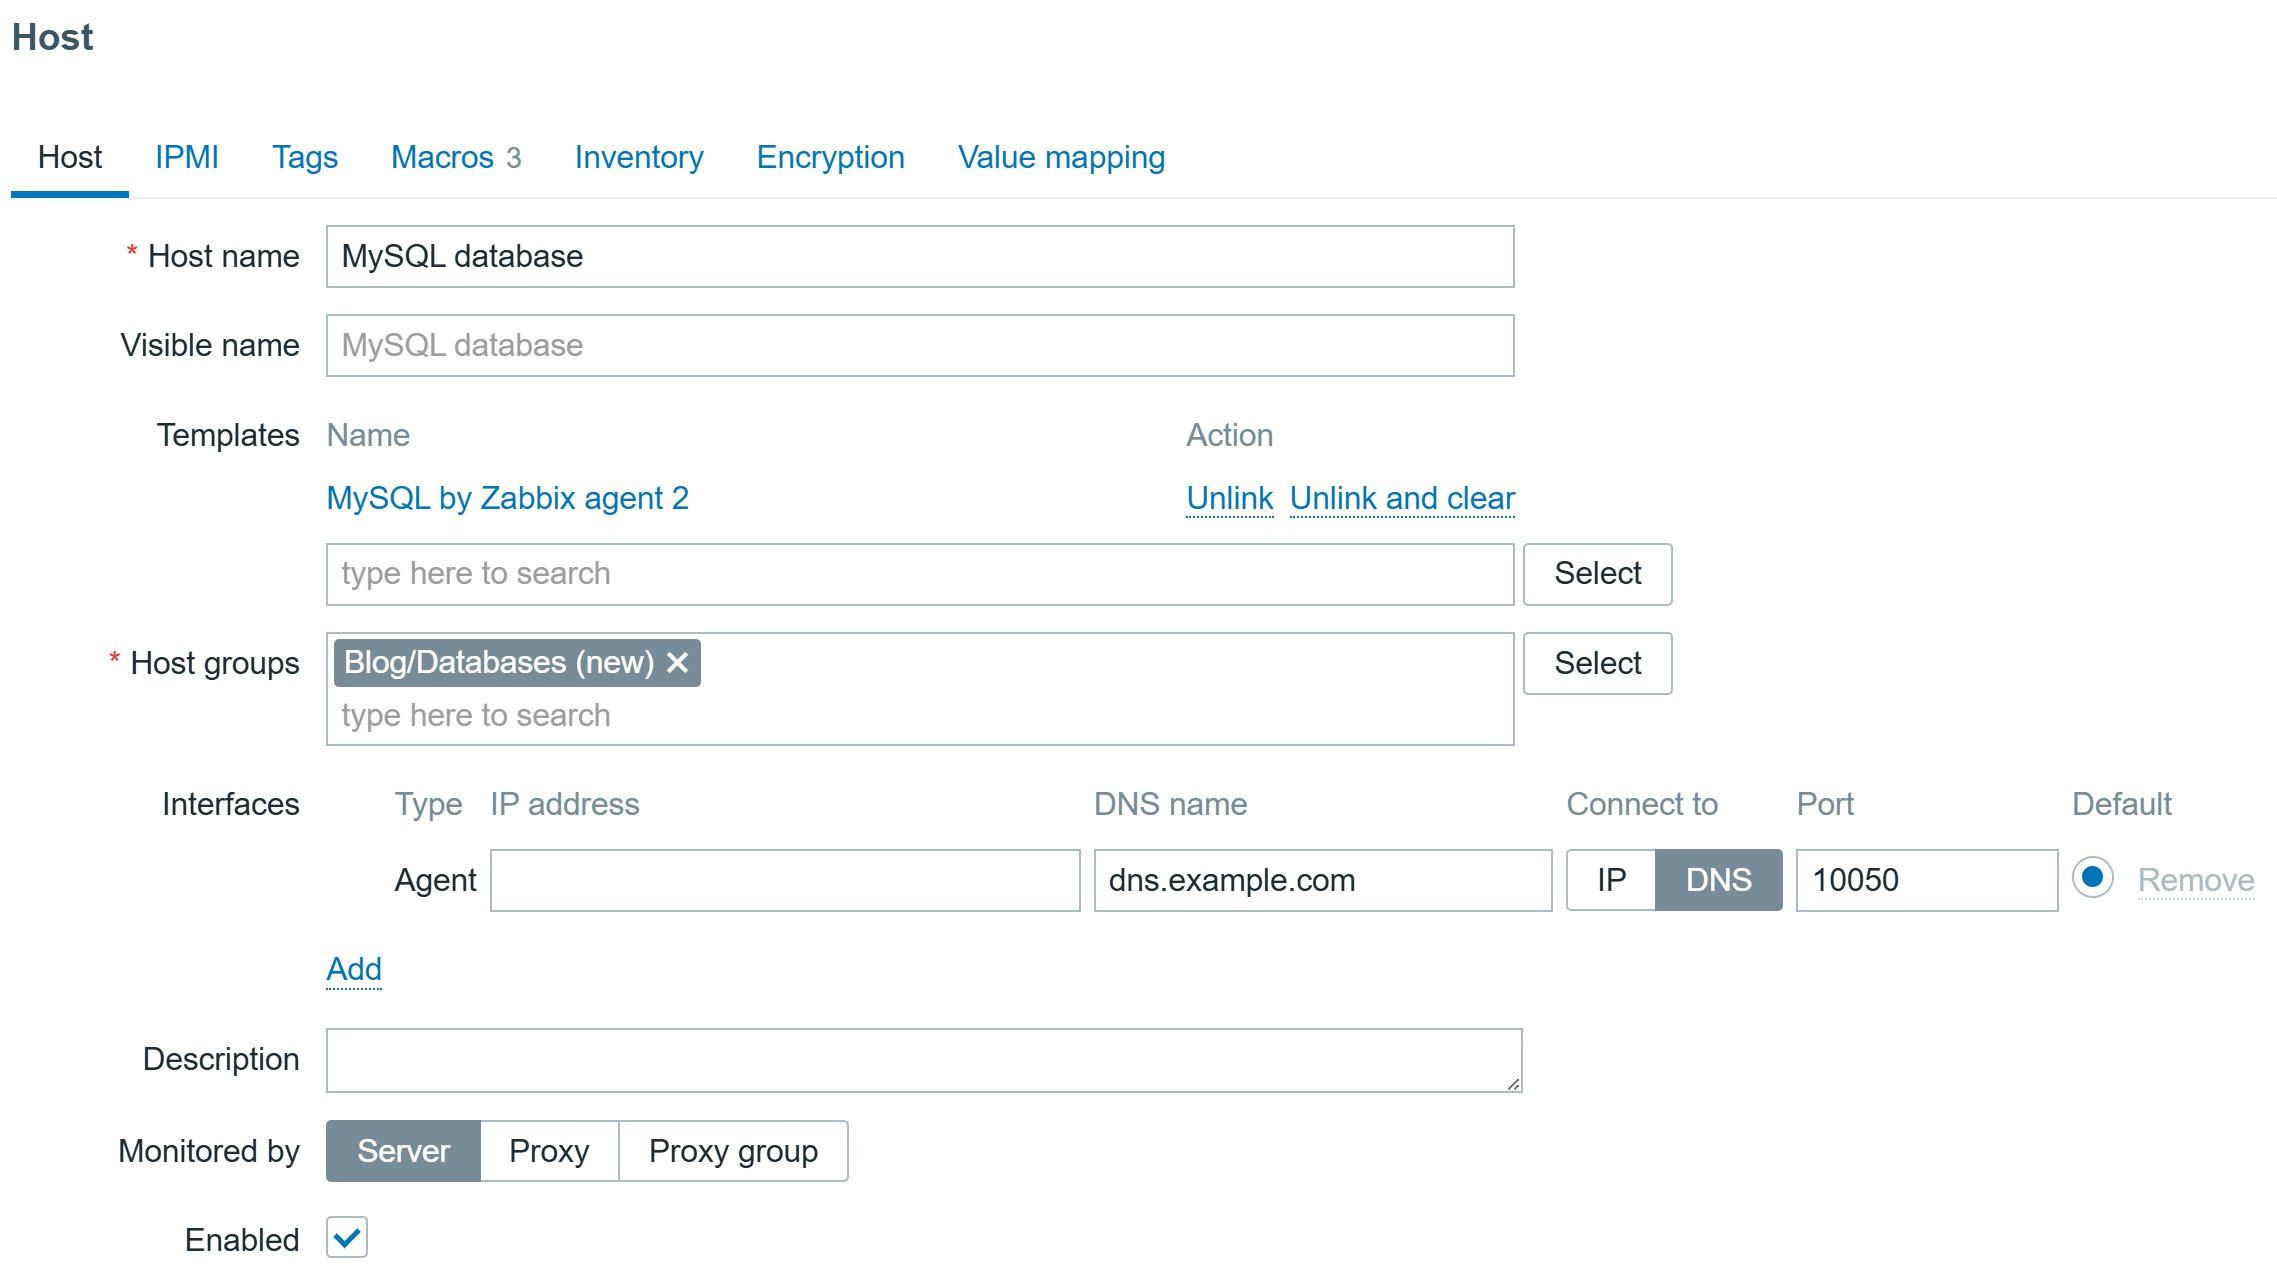
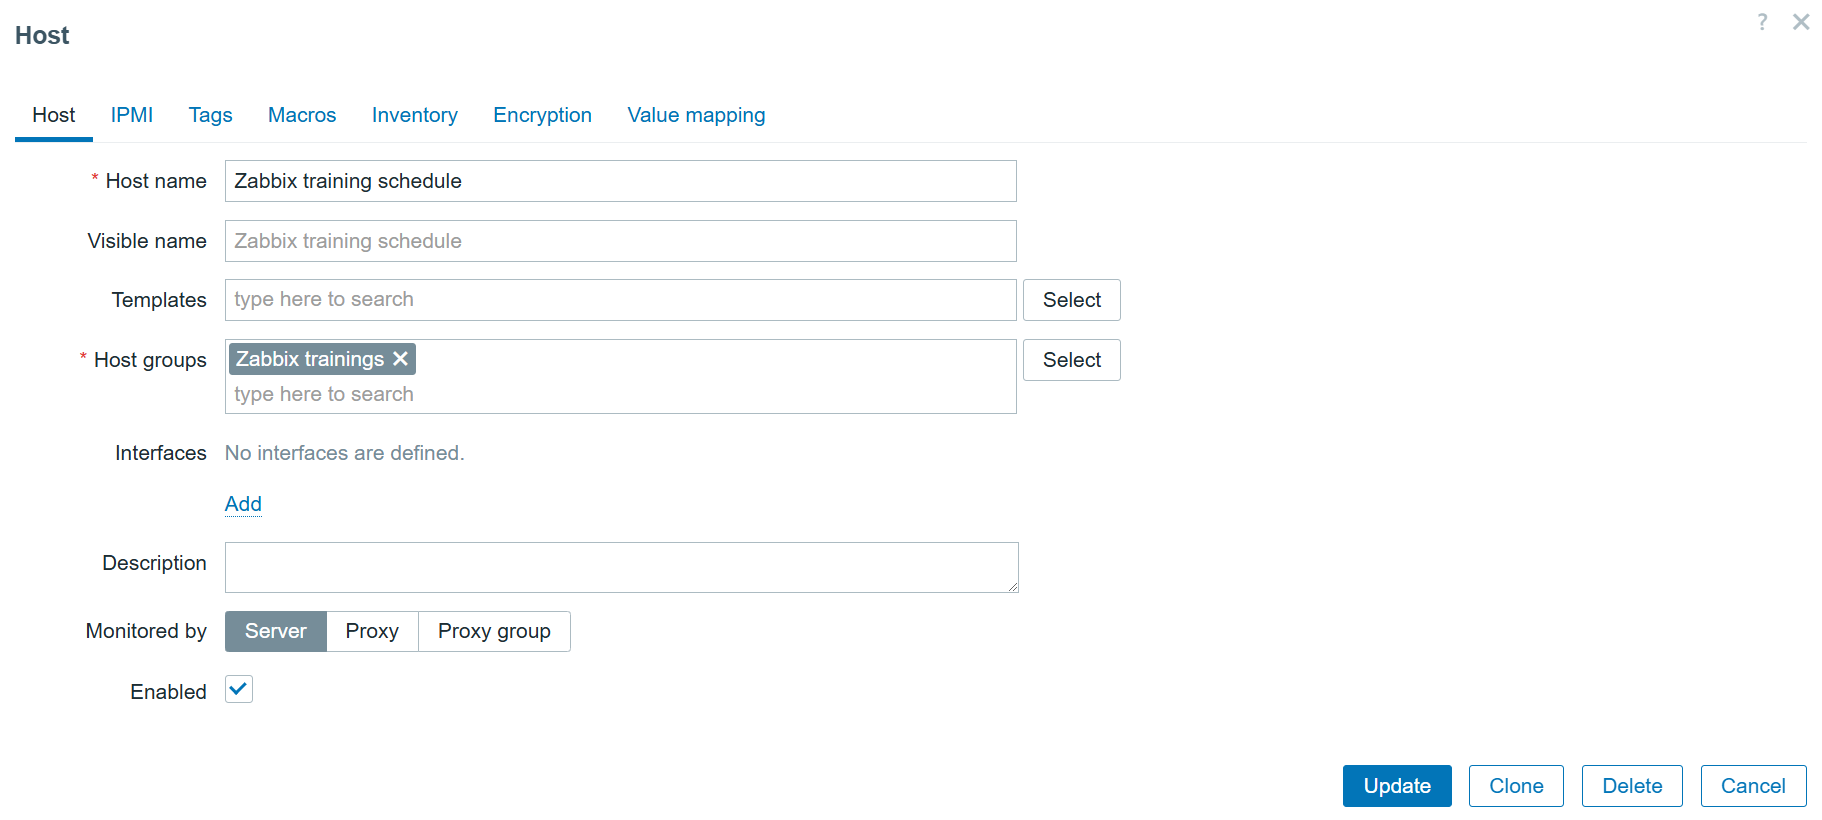
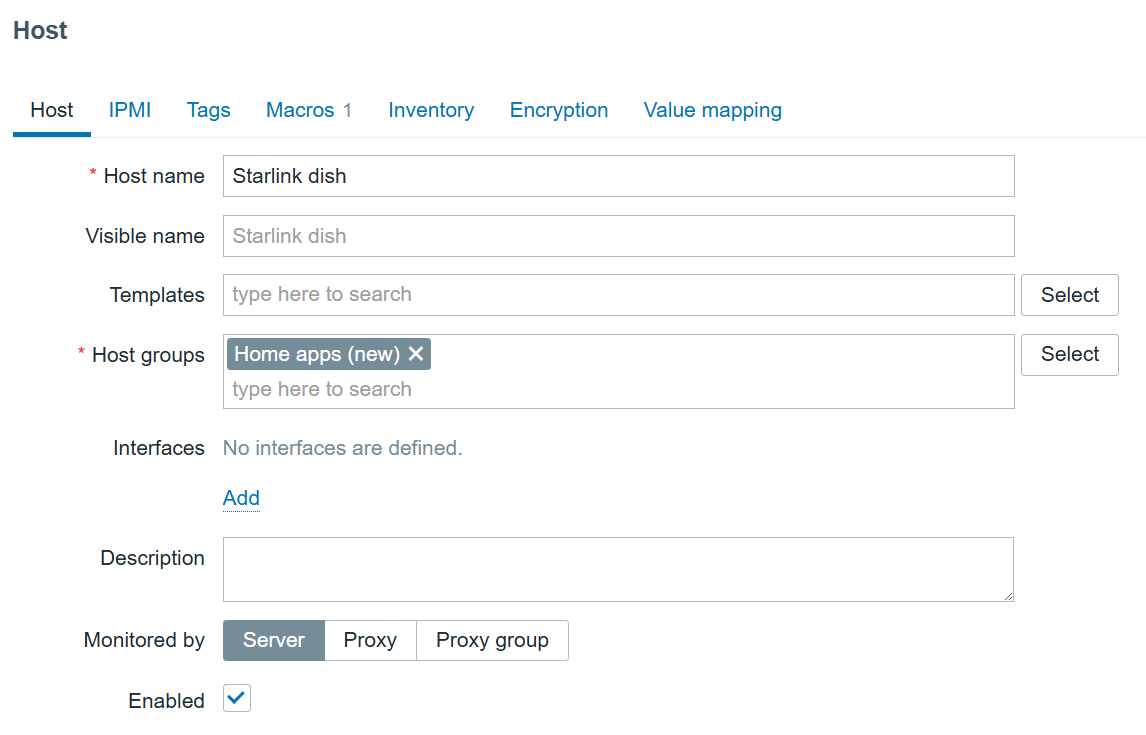
First, we need to navigate to the “Data collection” > “Hosts” section and create a host that represents our Starlink dish. The host in my example will look like this:
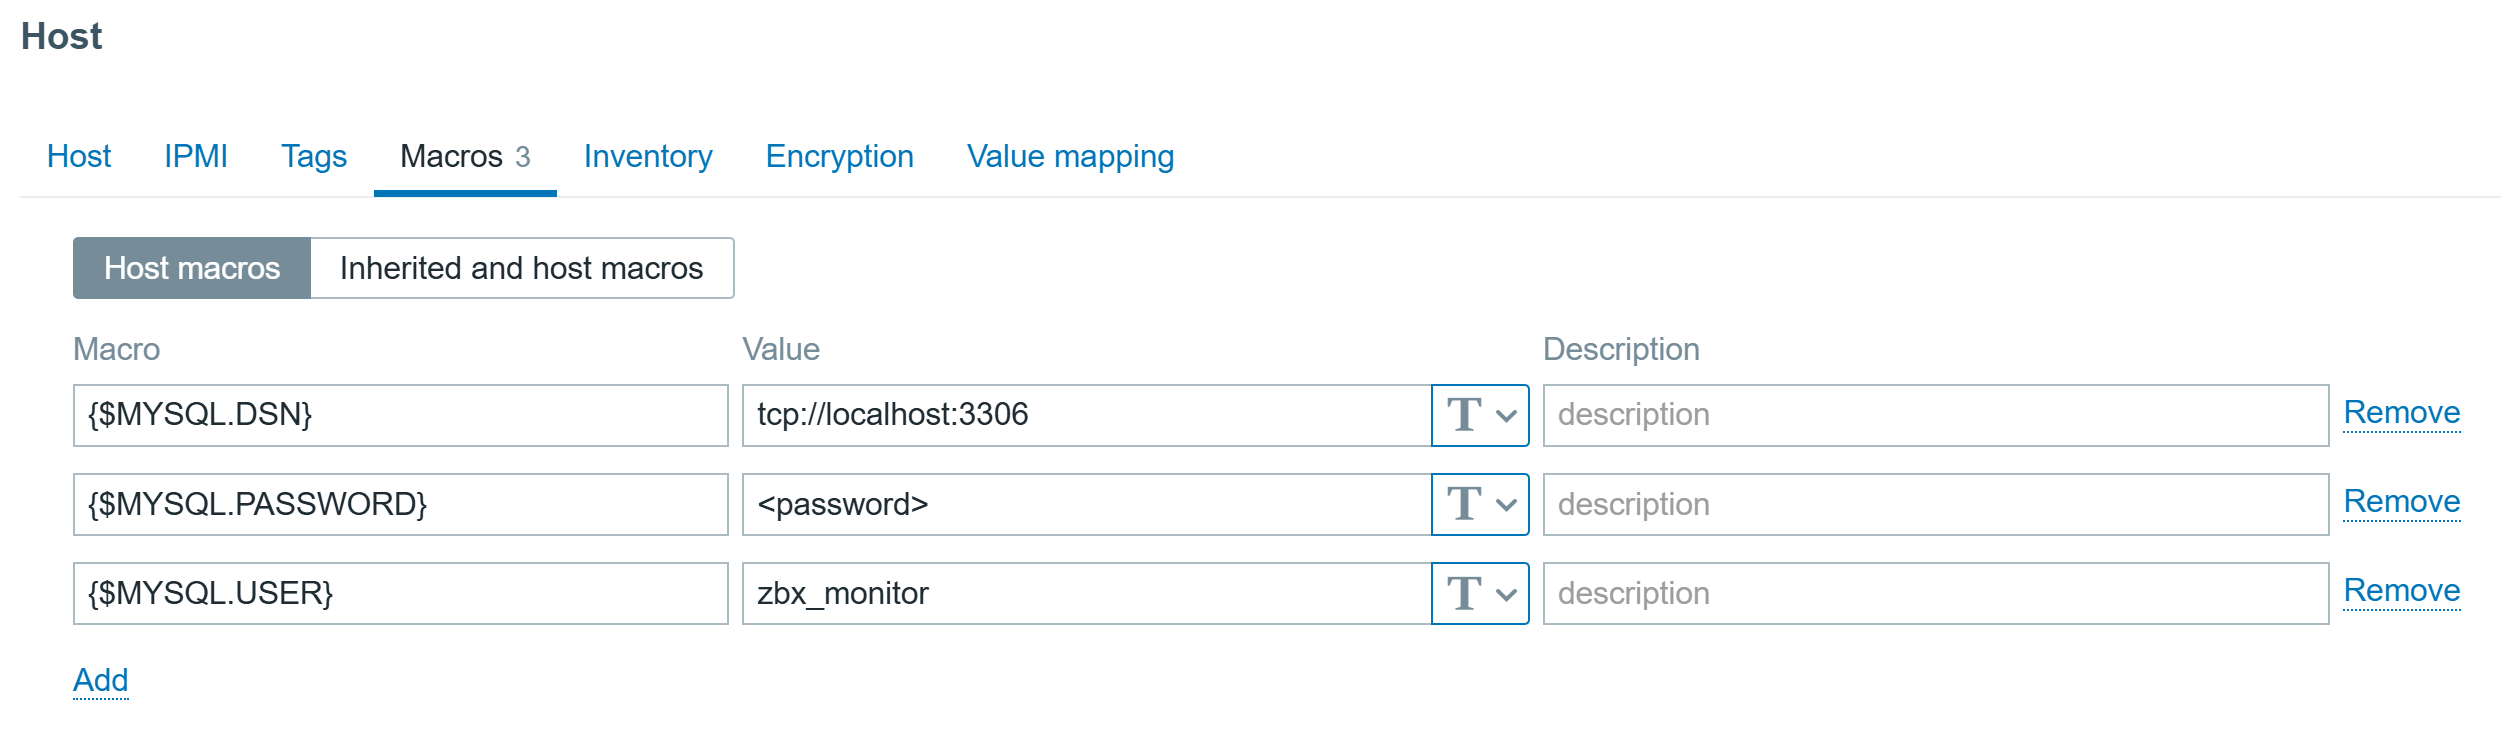
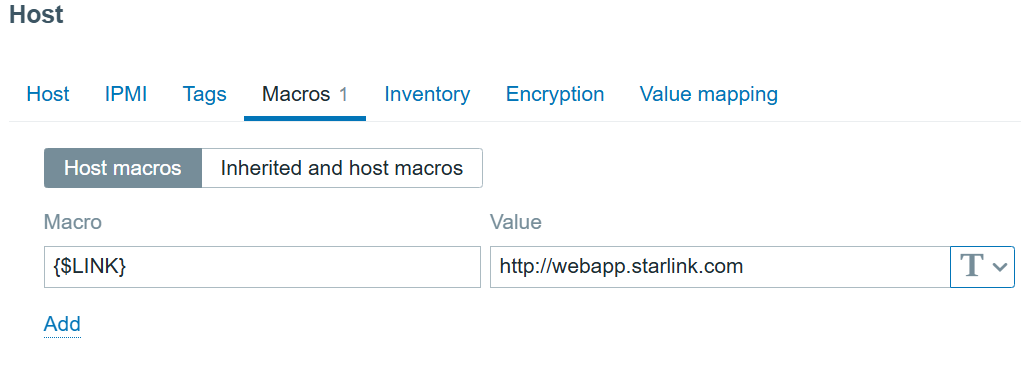
The host also has a user macro:
{$LINK} with value: http://webapp.starlink.com to point to the correct Starlink dish web app:
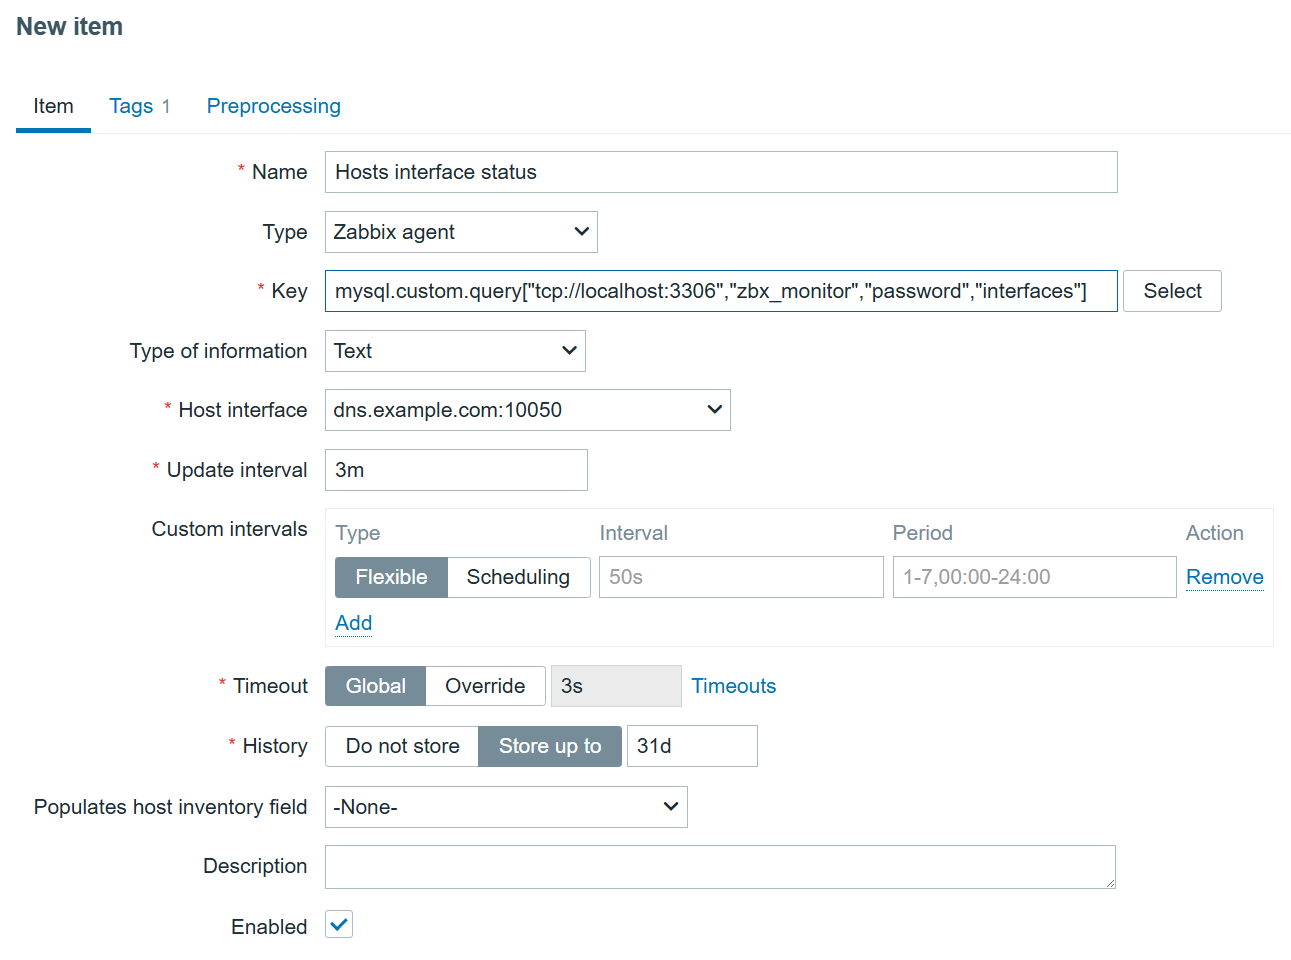
Creating a browser item
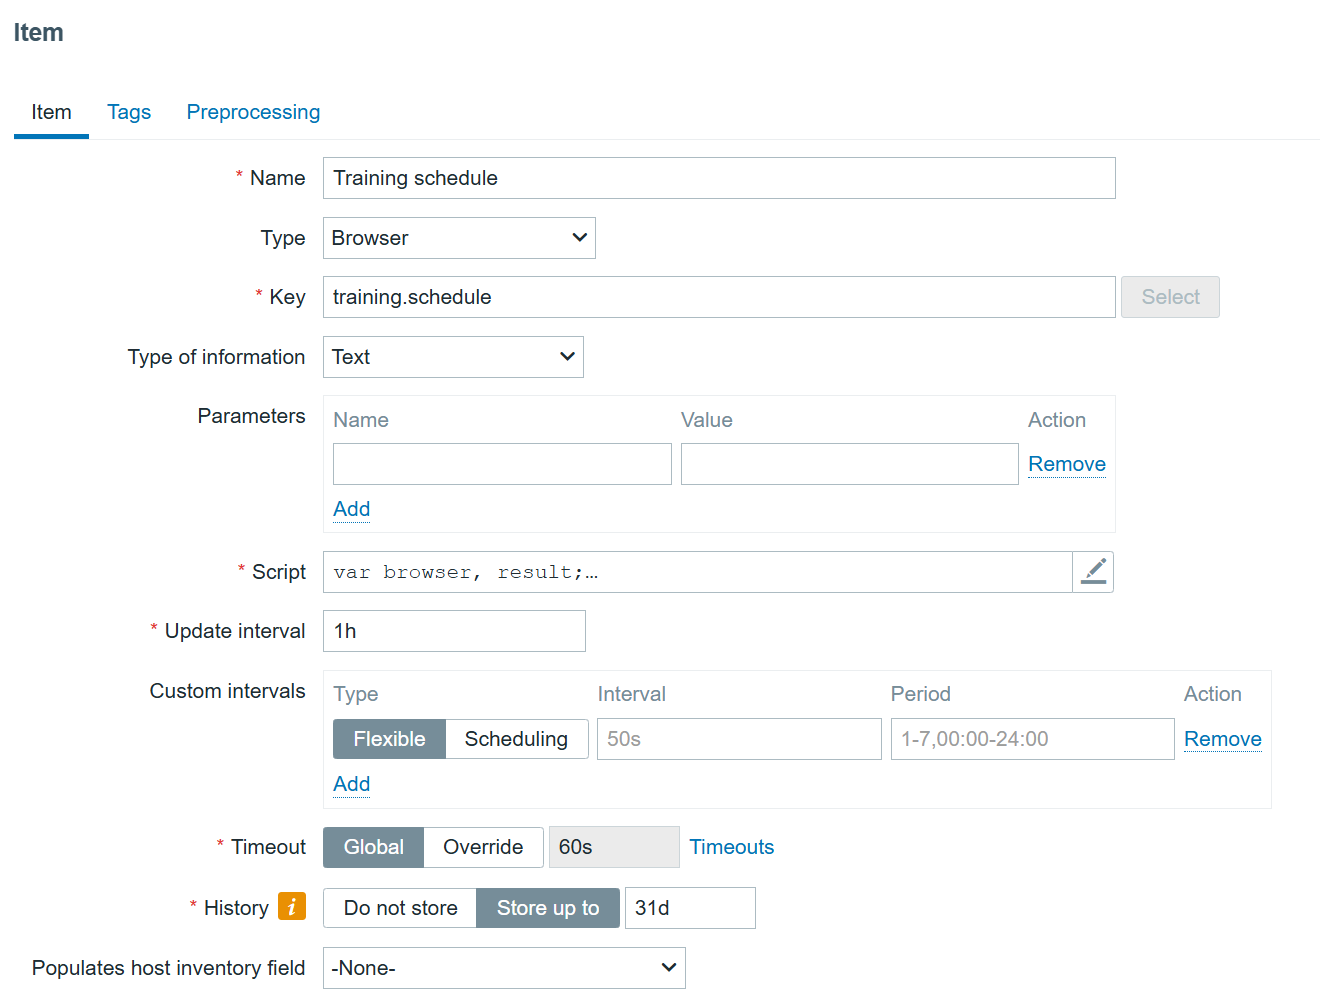
We will now configure our browser item to collect and monitor the list of metrics exposed in the Starlink browser app:
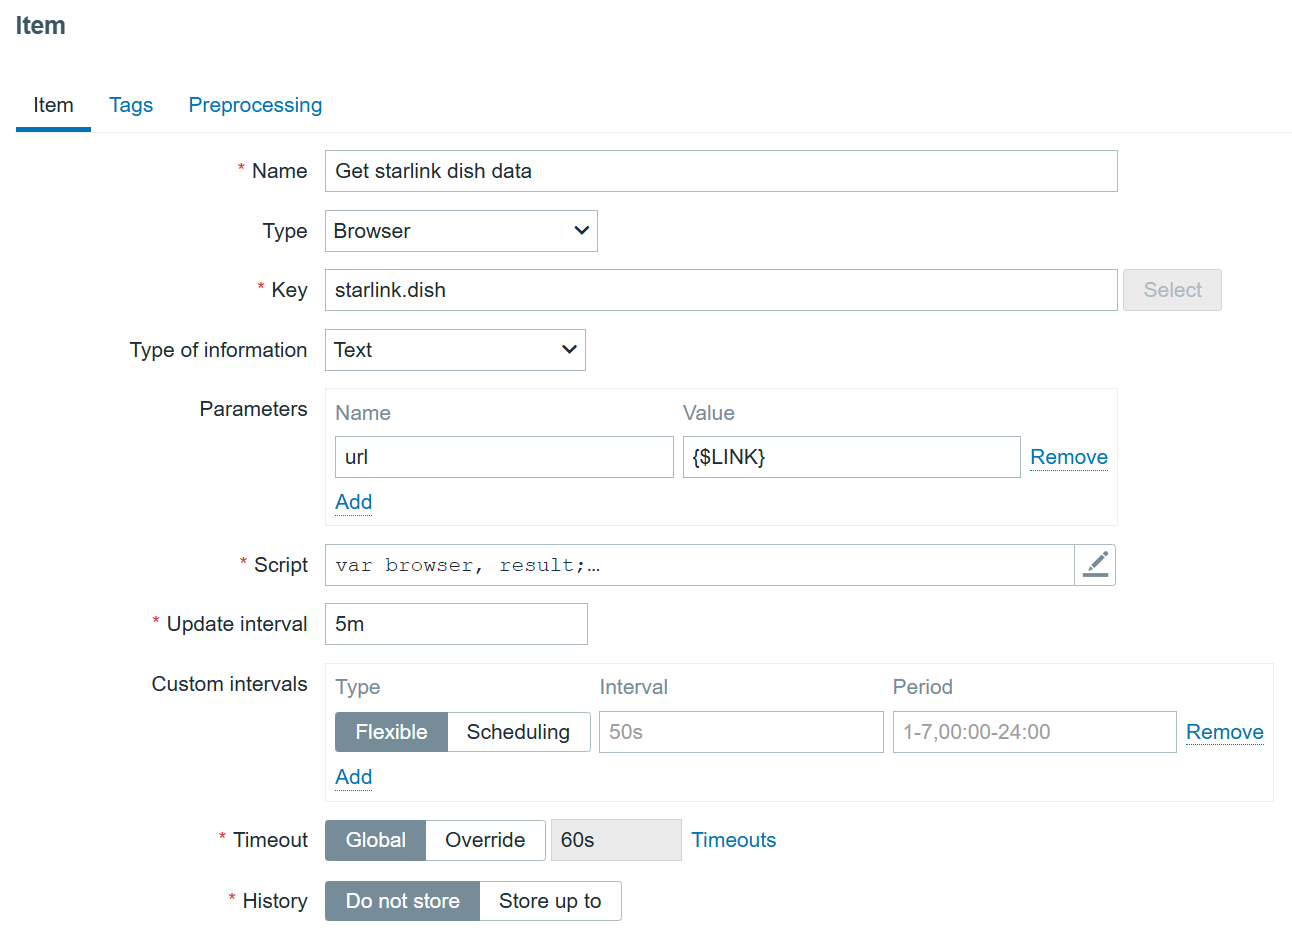
We are using the bare minimum here, so make sure the update intervals are as frequent as you need. However, I would not recommend updating it more frequently than every 5 minutes. It’s also not a good idea to store the history, since it is already stored trough dependent items.
The most important part of the item is the script itself:
var browser, result;
var opts = Browser.chromeOptions();

opts.capabilities.alwaysMatch['goog:chromeOptions'].args = [];
browser = new Browser(opts);
browser.setScreenSize(Number(1980), Number(1020));

try {
    var params = JSON.parse(value);
    browser.navigate(params.url);

 // Wait for the dish to report status
    Zabbix.sleep(2000);

    // Find the JSON text element(s)
    var jsonElements = browser.findElements("xpath", "//div[@id='root']/div[@class='App']/div[@class='Main']/div[2]/div[@class='Section'][2]/pre[@class='Json-Format']/div[@class='Json-Text']");
    var extractedData = [];

    for (var i = 0; i < jsonElements.length; i++) {
        var text = jsonElements[i].getText();

        // Try parsing JSON
        try {
            extractedData.push(JSON.parse(text));
        } catch (e) {
            // If not valid JSON, include raw text instead
            extractedData.push({ raw: text, error: "Invalid JSON format" });
        }
    }

    // Collect result
    result = browser.getResult();

    // Replace with parsed JSON data
    result.extractedJsonData = extractedData.length === 1 ? extractedData[0] : extractedData;

}
catch (err) {
    if (!(err instanceof BrowserError)) {
        browser.setError(err.message);
    }
    result = browser.getResult();
}
finally {
    // Return a clean JSON object
    return JSON.stringify(result.extractedJsonData);
}
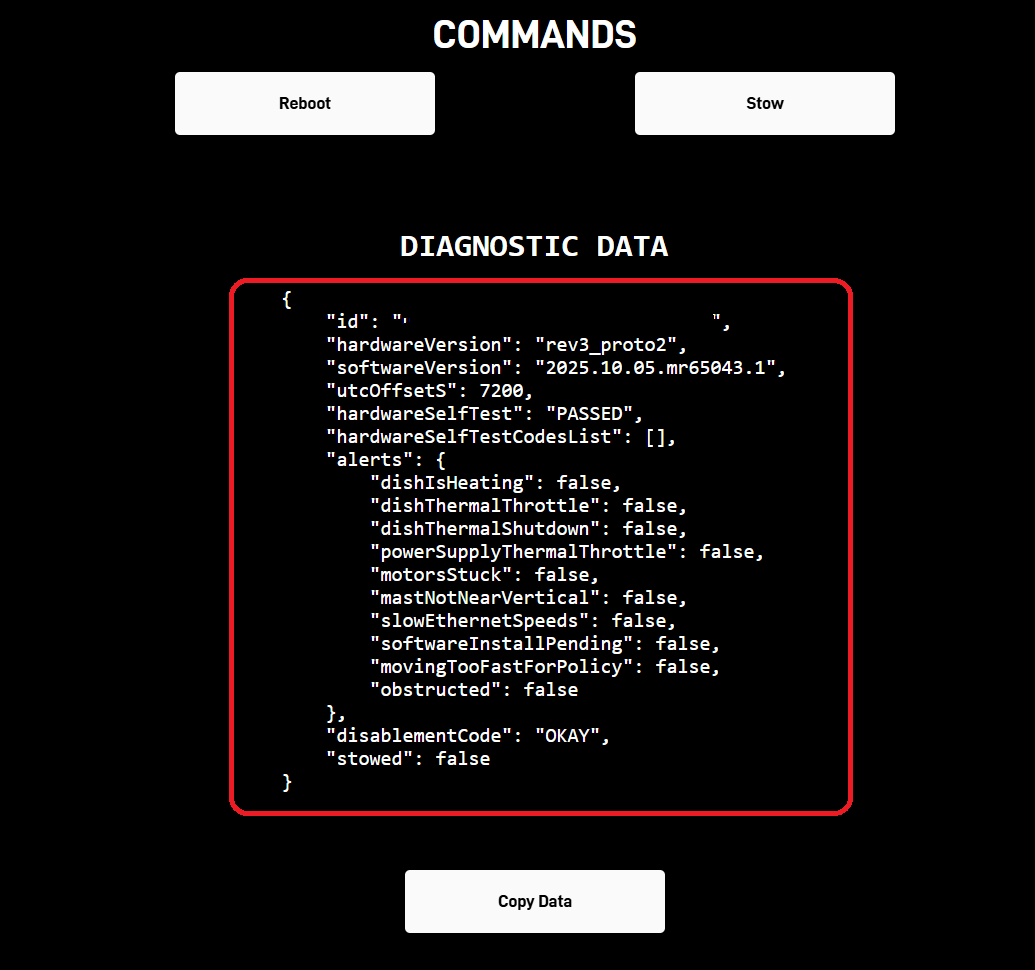
So what does this script do? It opens the Starlink web app, waits for the Starlink dish to output all the status data, and, after a bit of parsing, returns the data highlighted in the screenshot:
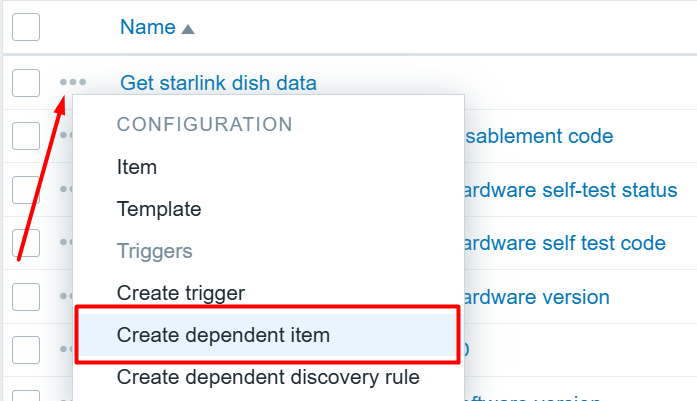
Now we can click on the three dots on the left of our newly created item in the items page and proceed to create dependent items for each value we are interested in!
Creating dependent items
Now we just click here:
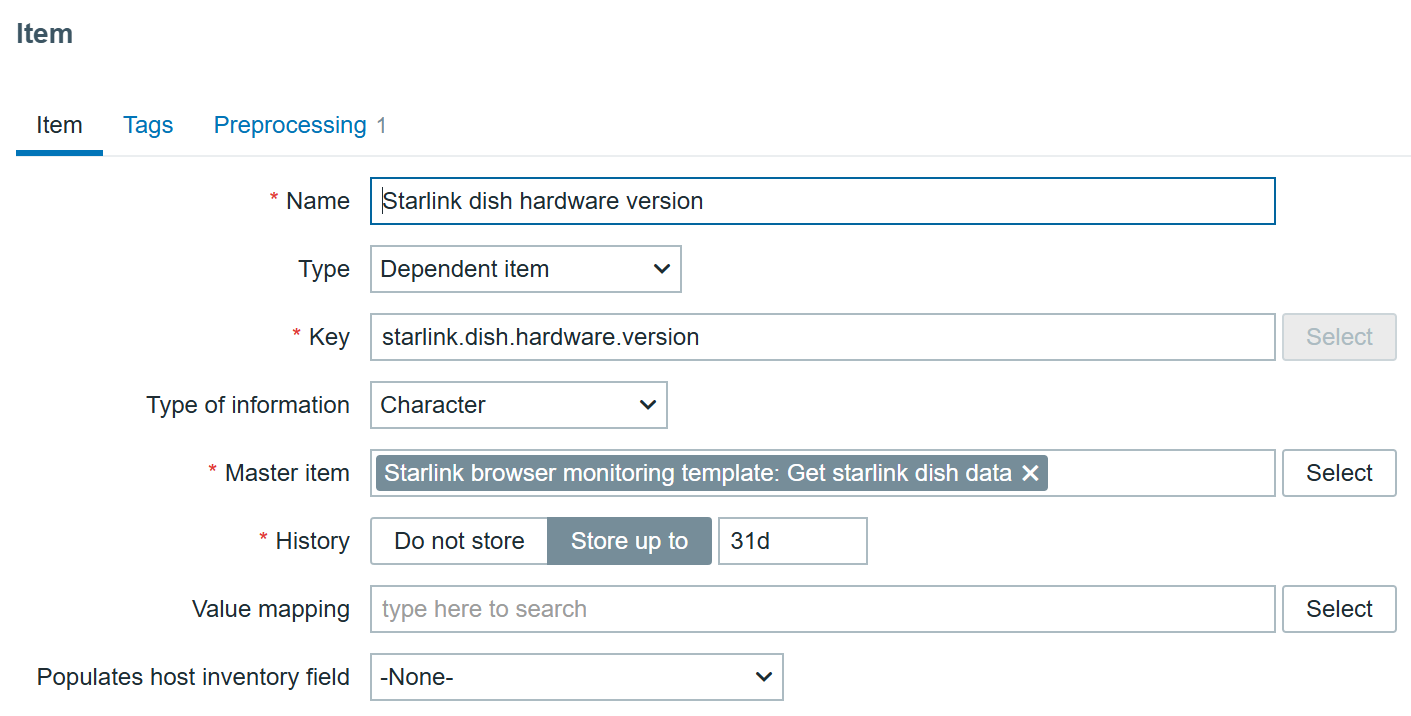
As an example, to create an item that monitors the hardware version we can create an item like this:
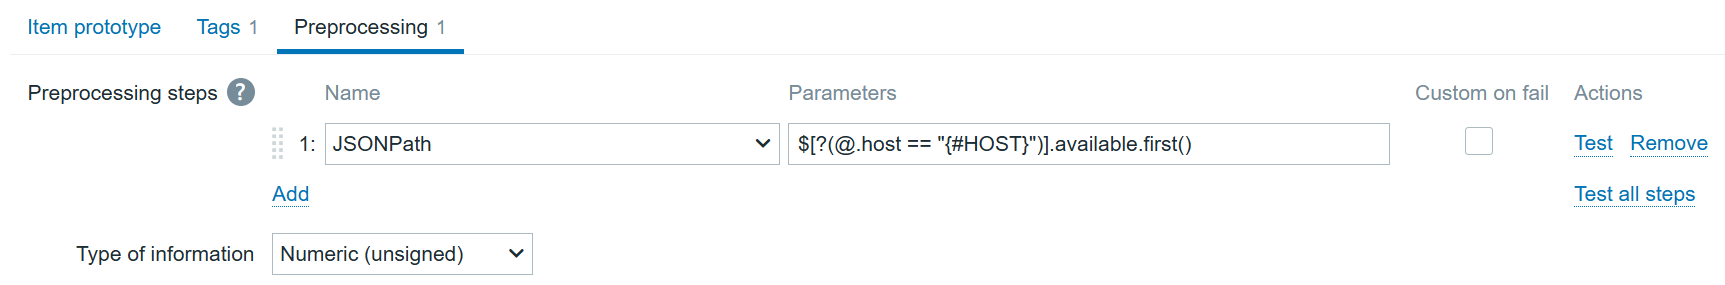
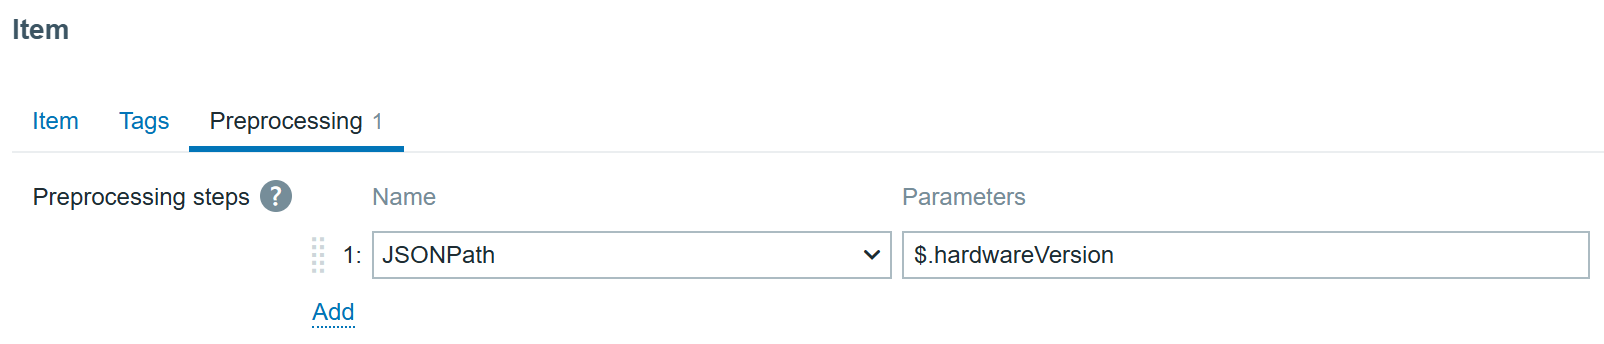
With JSONPath preprocessing:
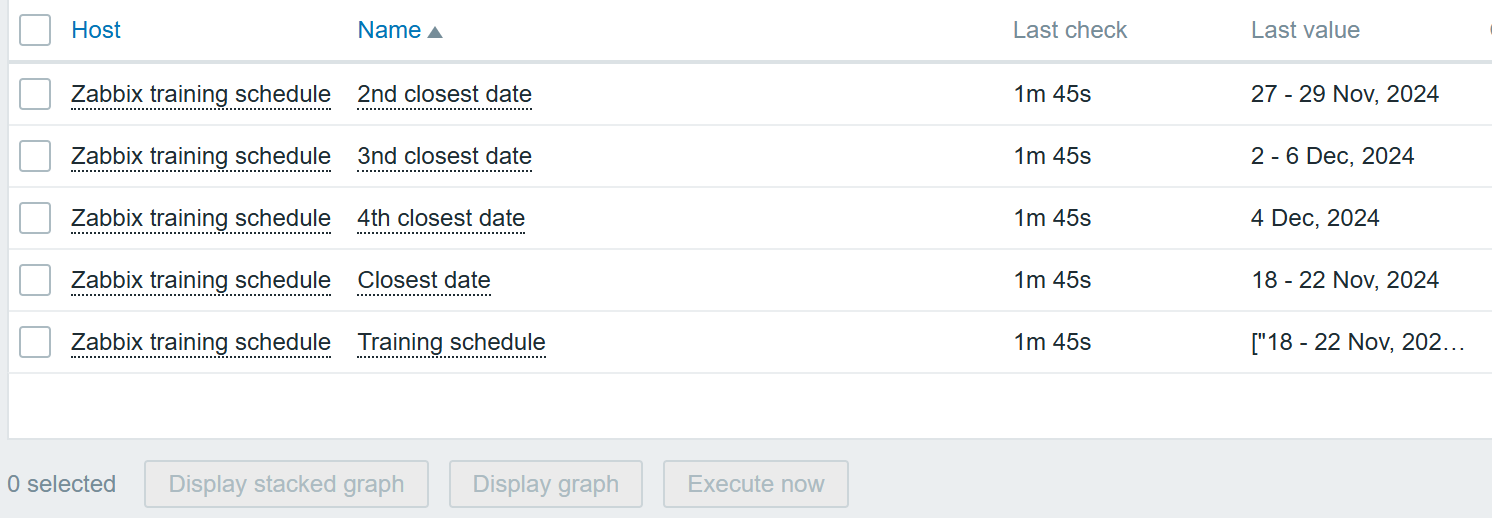
In the end we get the data in Zabbix:

All other items (except alerts) will follow the same logic – just update the item name, key, and JSONPath in preprocessing to extract the required values.
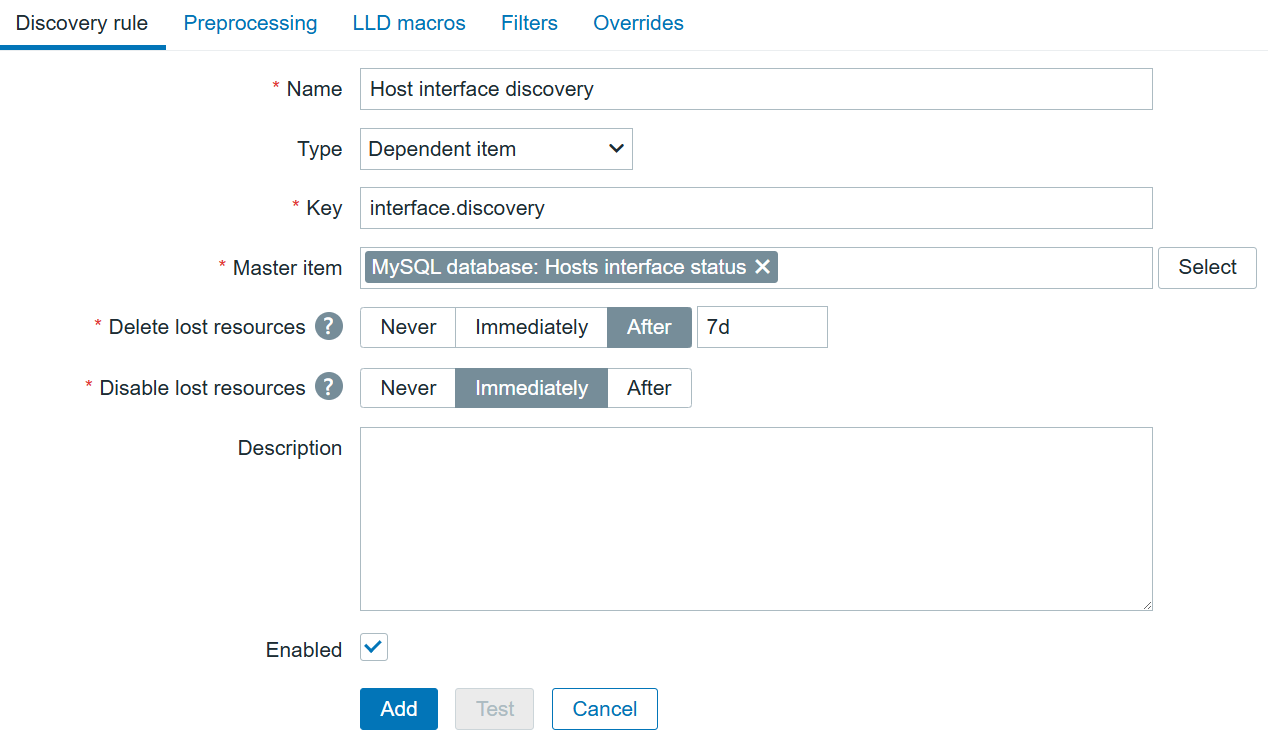
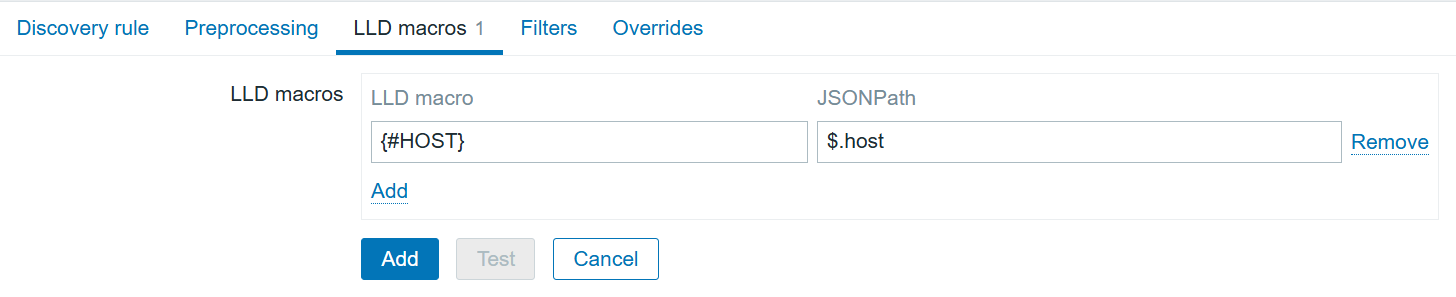
Creating dependent LLD item prototypes
To automate the alerts items creation, we can create a dependent discovery rule. In the “Discovery” section, create a new discovery rule:
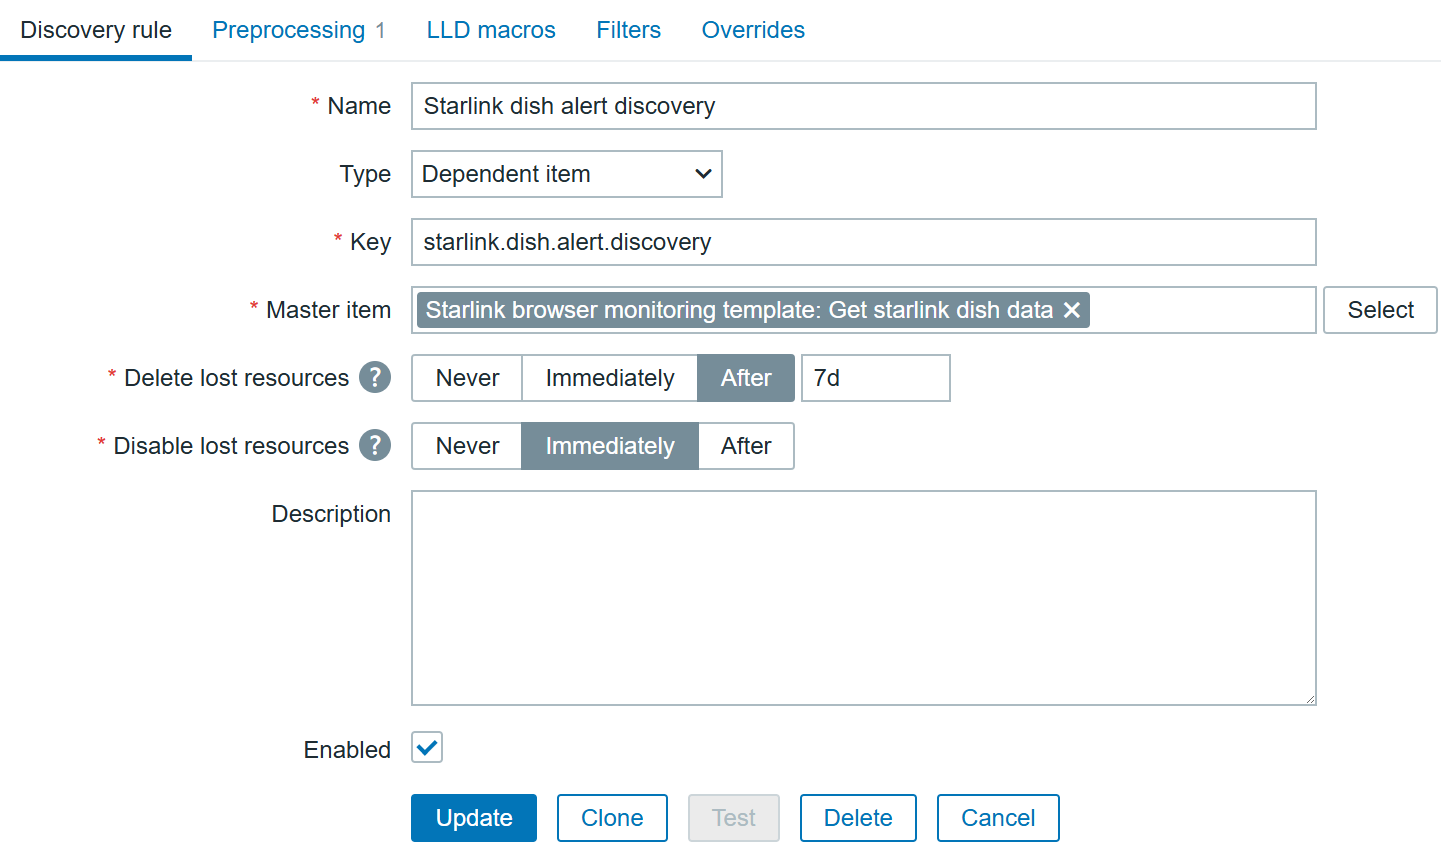
With preprocessing using Java Script:
var data = JSON.parse(value);
var alerts = data.alerts;
var lld = [];

for (var key in alerts) {
    if (alerts.hasOwnProperty(key)) {
        lld.push({
            "{#ALERT}": key
        });
    }
}

return JSON.stringify({ data: lld });
This will provide us with following JSON data:
{
  "data": [
    {
      "{#ALERT}": "dishIsHeating"
    },
    {
      "{#ALERT}": "dishThermalThrottle"
    },
    {
      "{#ALERT}": "dishThermalShutdown"
    },
    {
      "{#ALERT}": "powerSupplyThermalThrottle"
    },
    {
      "{#ALERT}": "motorsStuck"
    },
    {
      "{#ALERT}": "mastNotNearVertical"
    },
    {
      "{#ALERT}": "slowEthernetSpeeds"
    },
    {
      "{#ALERT}": "softwareInstallPending"
    },
    {
      "{#ALERT}": "movingTooFastForPolicy"
    },
    {
      "{#ALERT}": "obstructed"
    }
  ]
}
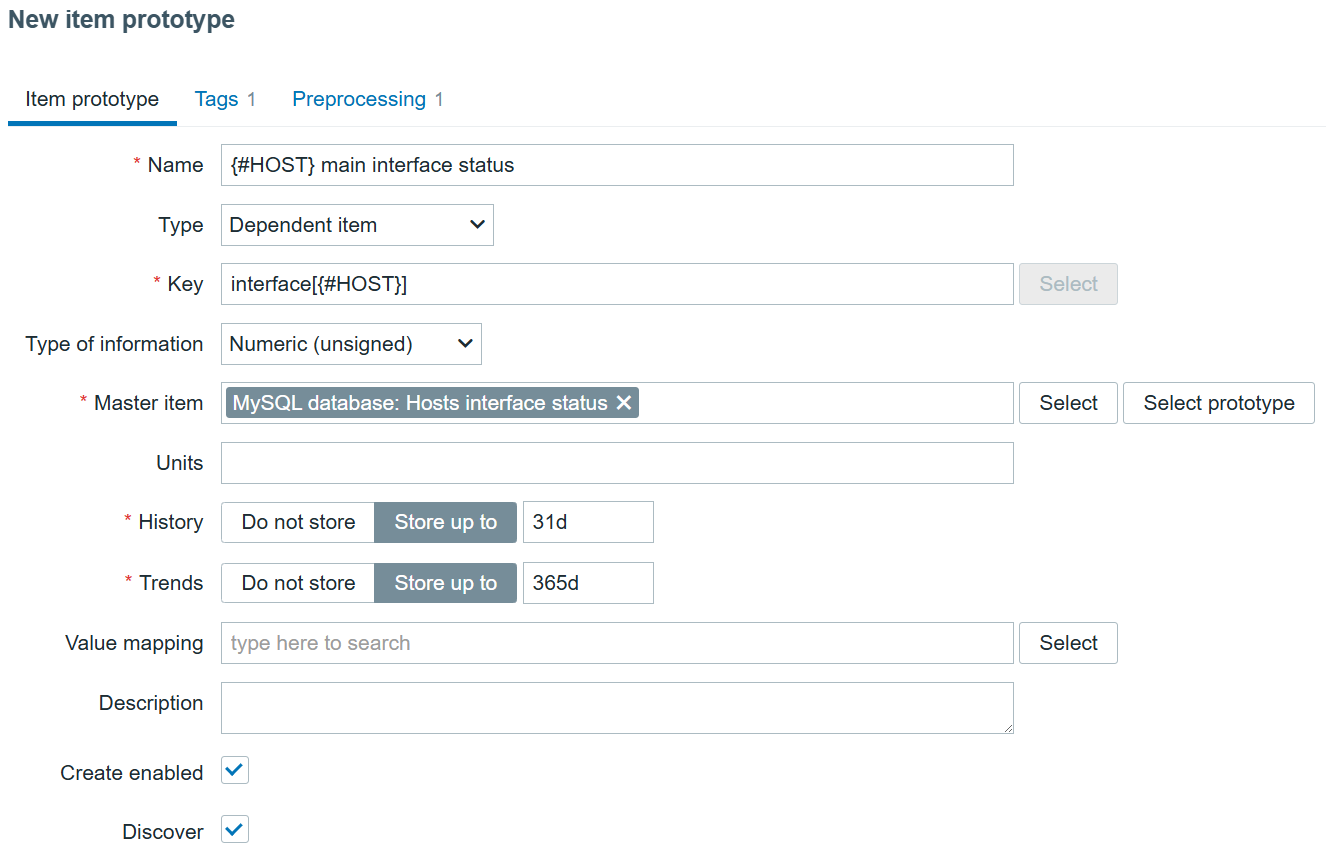
All that’s left ‘to do is to create a dependent item prototype:
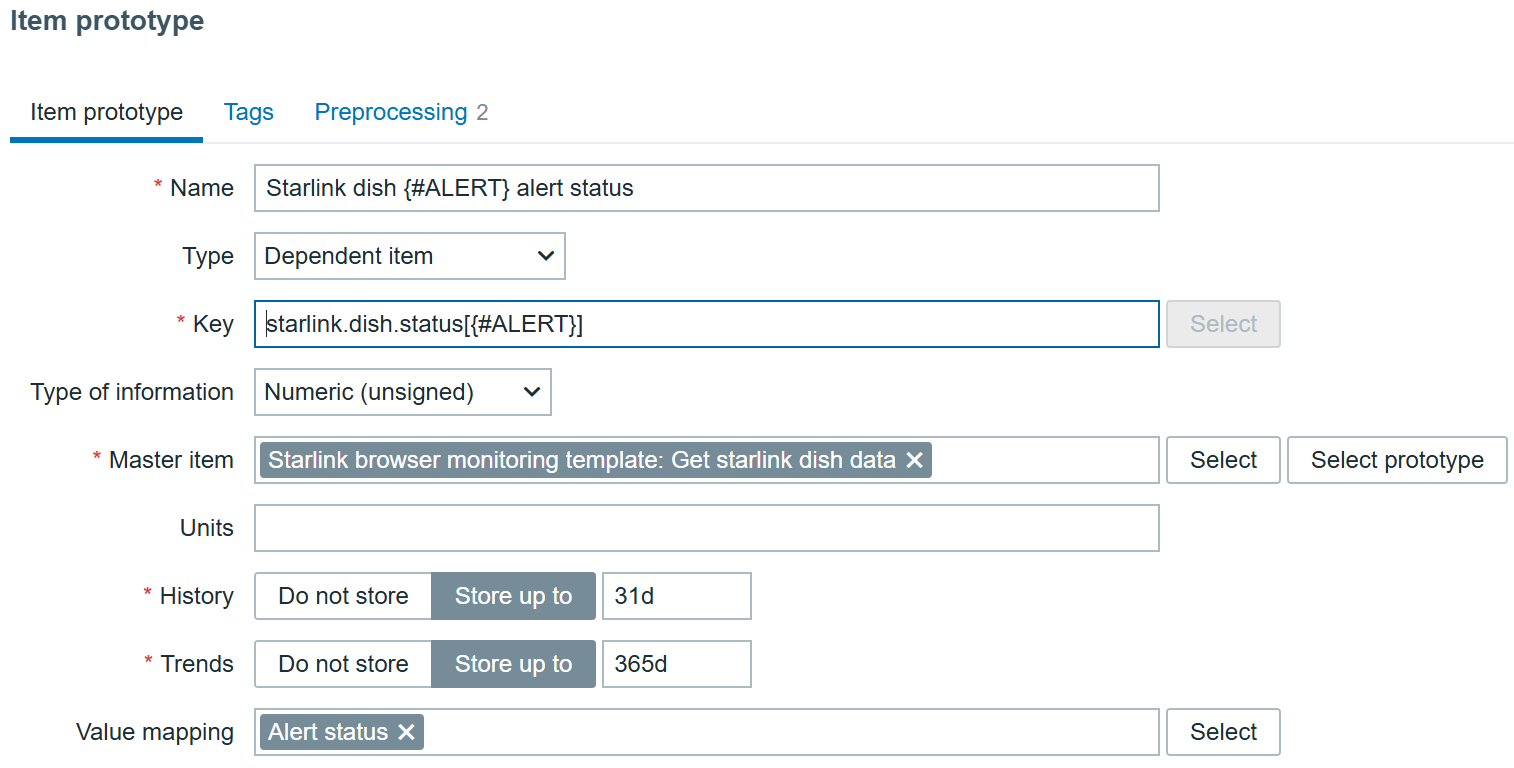
With preprocessing, of course:
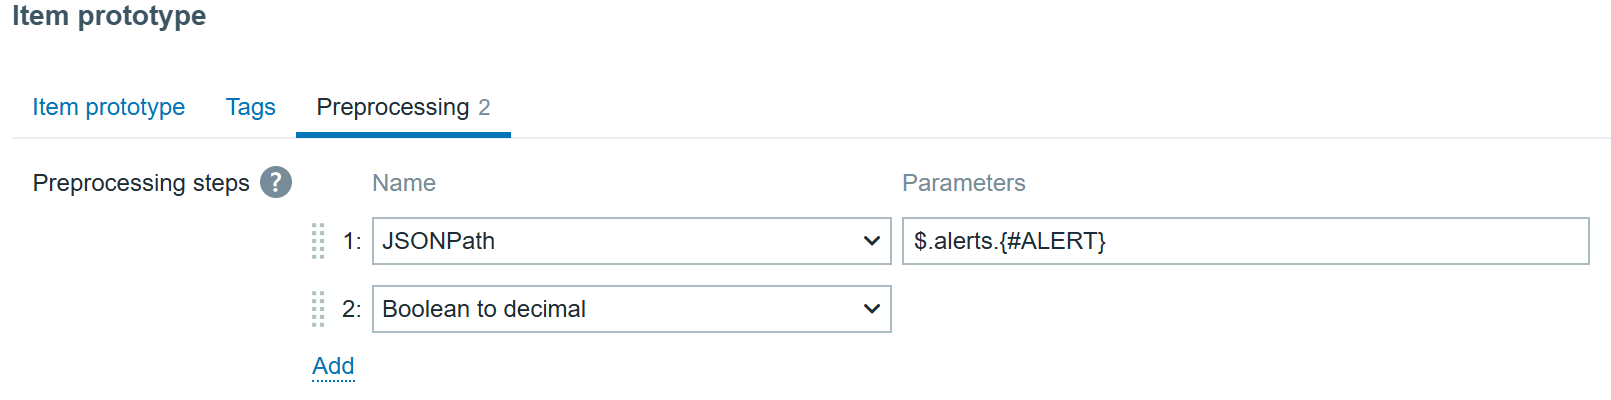
JSONPath will transform to extract each specific alert and “Boolean to Decimal” will save us some space in the database by tranforming true/false booleans to digits.
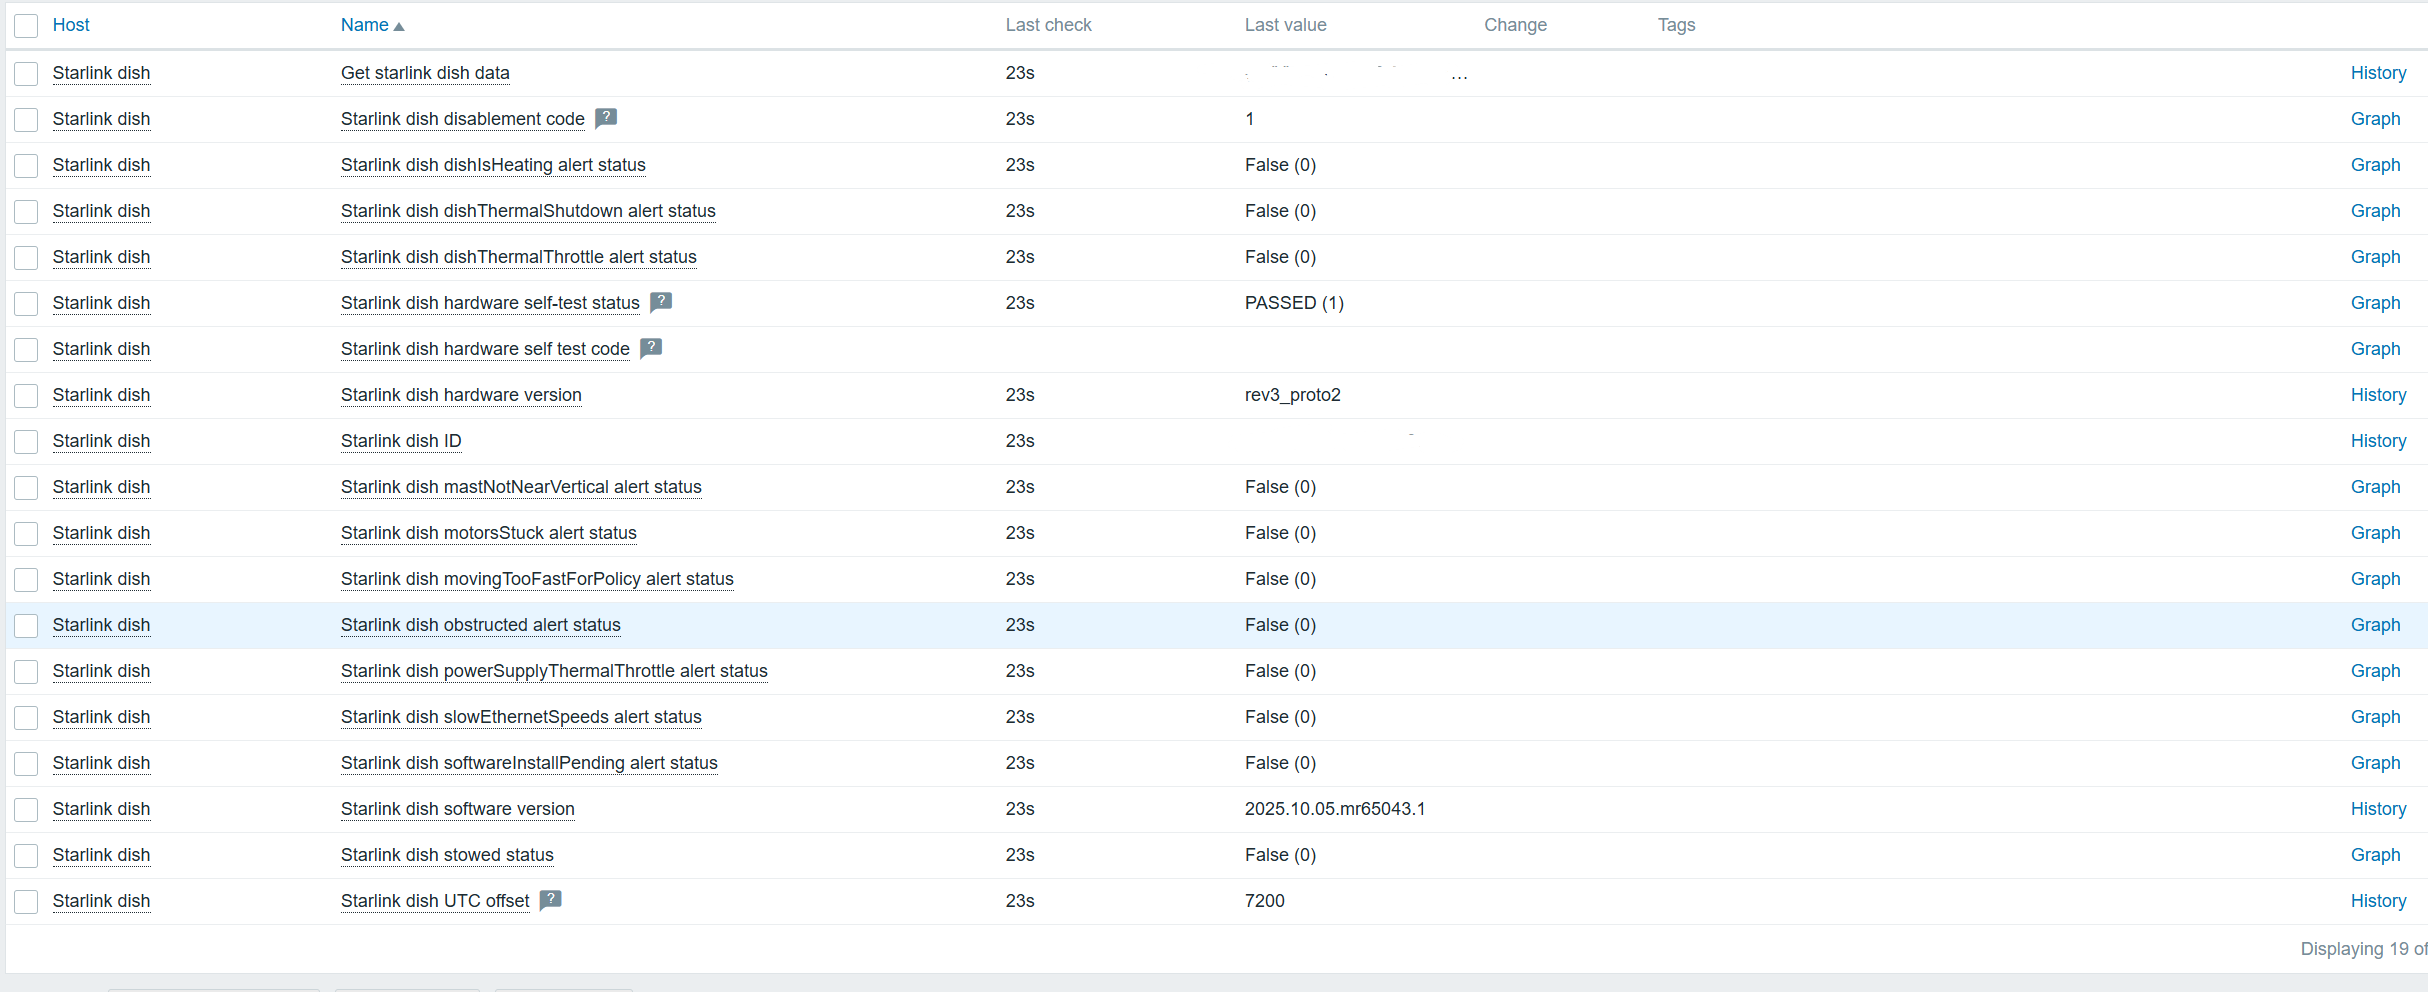
Result
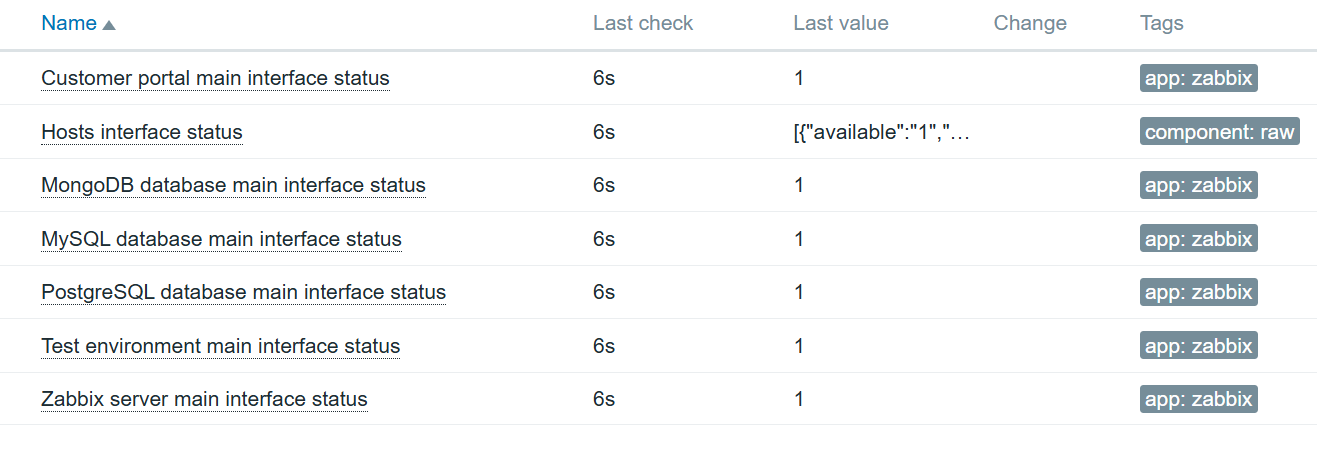
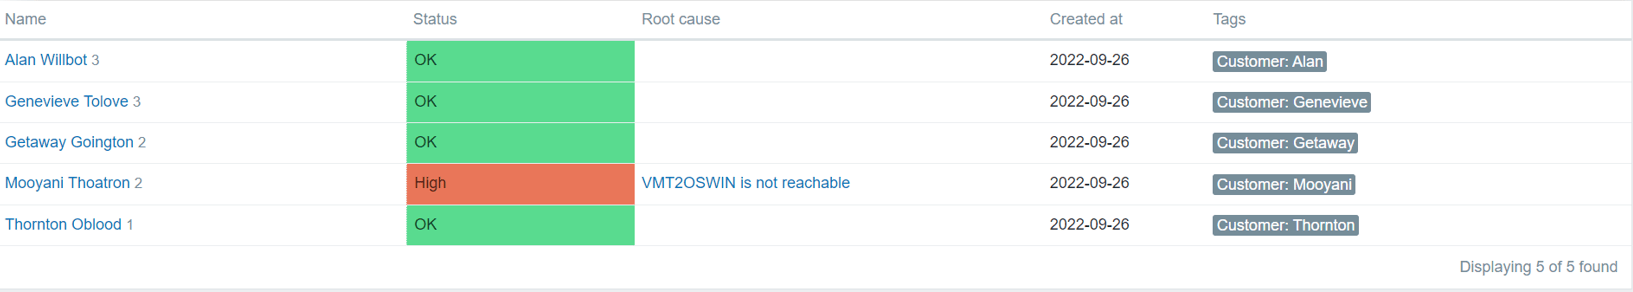
In the end, we can monitor all the data:
Even more data can be collected using exporters – if you are willing to do a bit of extra configuration, of course! Let me know if you are interested, and I will show you a completely different approach with a template.
Before I forget, the template used in this tutorial can be found here.
The post Monitoring a Starlink Dish with Zabbix appeared first on Zabbix Blog.