Tag Archives: Graph Networks

Graph modelling guidelines

Post Syndicated from Grab Tech original https://engineering.grab.com/graph-modelling-guidelines

Introduction

Graph modelling is a highly effective technique for representing and analysing complex and interconnected data across various domains. By deciphering relationships between entities, graph modelling can reveal insights that might be otherwise difficult to identify using traditional data modelling approaches. In this article, we will explore what graph modelling is and guide you through a step-by-step process of implementing graph modelling to create a social network graph.

What is graph modelling?

Graph modelling is a method for representing real-world entities and their relationships using nodes, edges, and properties. It employs graph theory, a branch of mathematics that studies graphs, to visualise and analyse the structure and patterns within complex datasets. Common applications of graph modelling include social network analysis, recommendation systems, and biological networks.

Graph modelling process

Step 1: Define your domain

Before diving into graph modelling, it’s crucial to have a clear understanding of the domain you’re working with. This involves getting acquainted with the relevant terms, concepts, and relationships that exist in your specific field. To create a social network graph, familiarise yourself with terms like users, friendships, posts, likes, and comments.

Step 2: Identify entities and relationships

After defining your domain, you need to determine the entities (nodes) and relationships (edges) that exist within it. Entities are the primary objects in your domain, while relationships represent how these entities interact with each other. In a social network graph, users are entities, and friendships are relationships.

Step 3: Establish properties

Each entity and relationship may have a set of properties that provide additional information. In this step, identify relevant properties based on their significance to the domain. A user entity might have properties like name, age, and location. A friendship relationship could have a ‘since’ property to denote the establishment of the friendship.

Step 4: Choose a graph model

Once you’ve identified the entities, relationships, and properties, it’s time to choose a suitable graph model. Two common models are:

  • Property graph: A versatile model that easily accommodates properties on both nodes and edges. It’s well-suited for most applications.
  • Resource Description Framework (RDF): A World Wide Web Consortium (W3C) standard model, using triples of subject-predicate-object to represent data. It is commonly used in semantic web applications.

For a social network graph, a property graph model is typically suitable. This is because user entities have many attributes and features. Property graphs provide a clear representation of the relationships between people and their attribute profiles.

Figure 1 – Social network graph

Step 5: Develop a schema

Although not required, developing a schema can be helpful for large-scale projects and team collaborations. A schema defines the structure of your graph, including entity types, relationships, and properties. In a social network graph, you might have a schema that specifies the types of nodes (users, posts) and the relationships between them (friendships, likes, comments).

Step 6: Import or generate data

Next, acquire the data needed to populate your graph. This can come in the form of existing datasets or generated data from your application. For a social network graph, you can import user information from a CSV file and generate simulated friendships, posts, likes, and comments.

Step 7: Implement the graph using a graph database or other storage options

Finally, you need to store your graph data using a suitable graph database. Neo4j, Amazon Neptune, or Microsoft Azure Cosmos DB are examples of graph databases. Alternatively, depending on your specific requirements, you can use a non-graph database or an in-memory data structure to store the graph.

Step 8: Analyse and visualise the graph

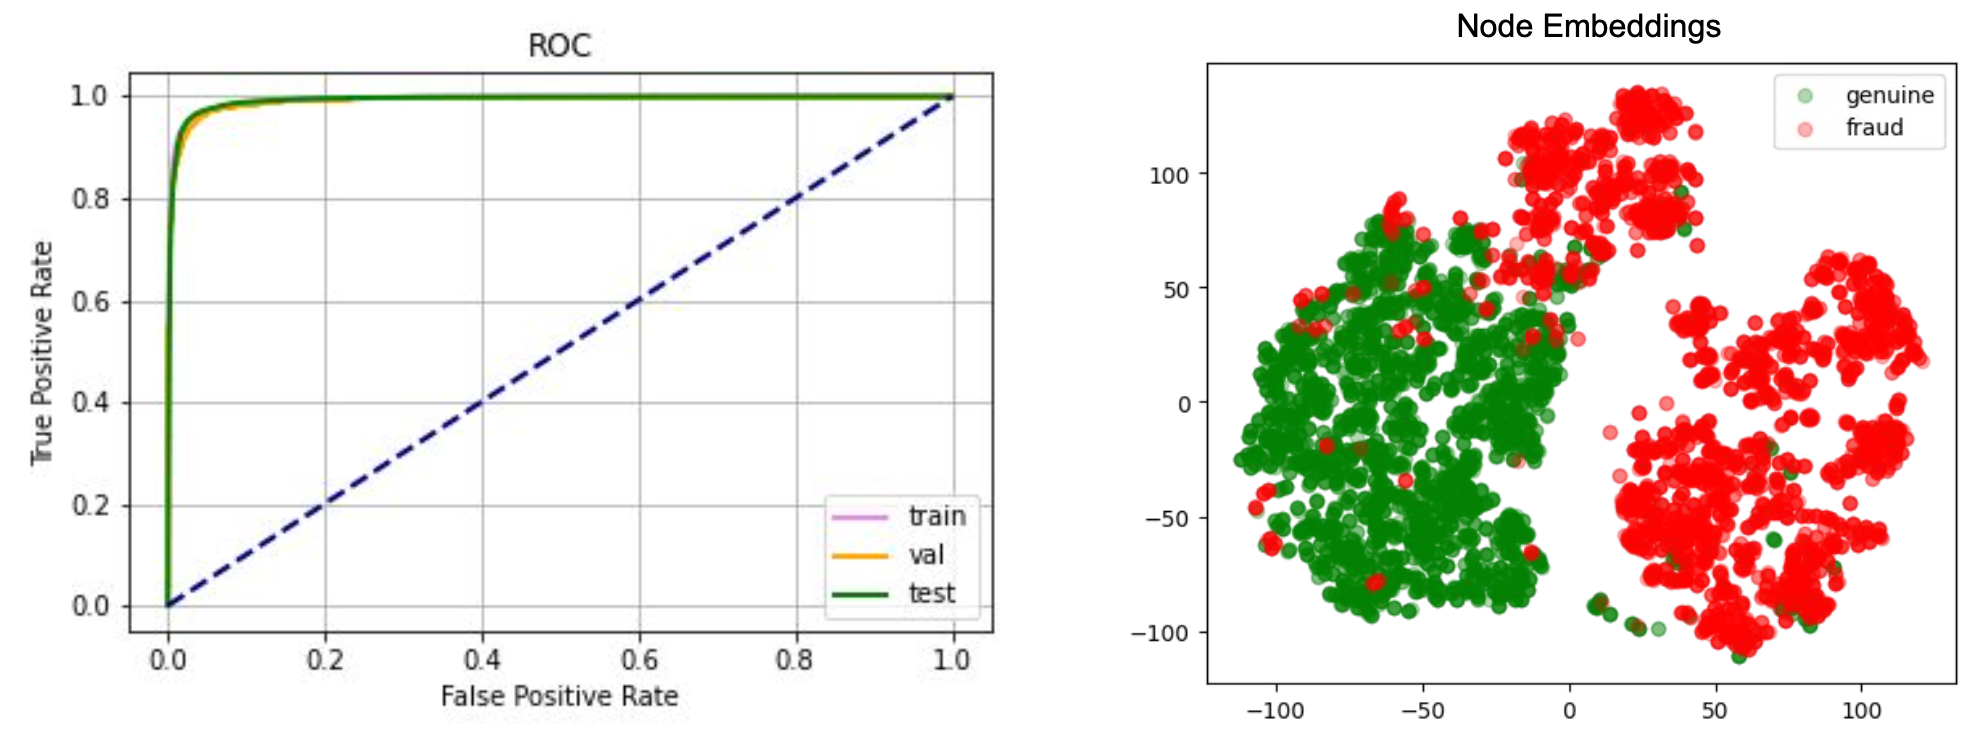
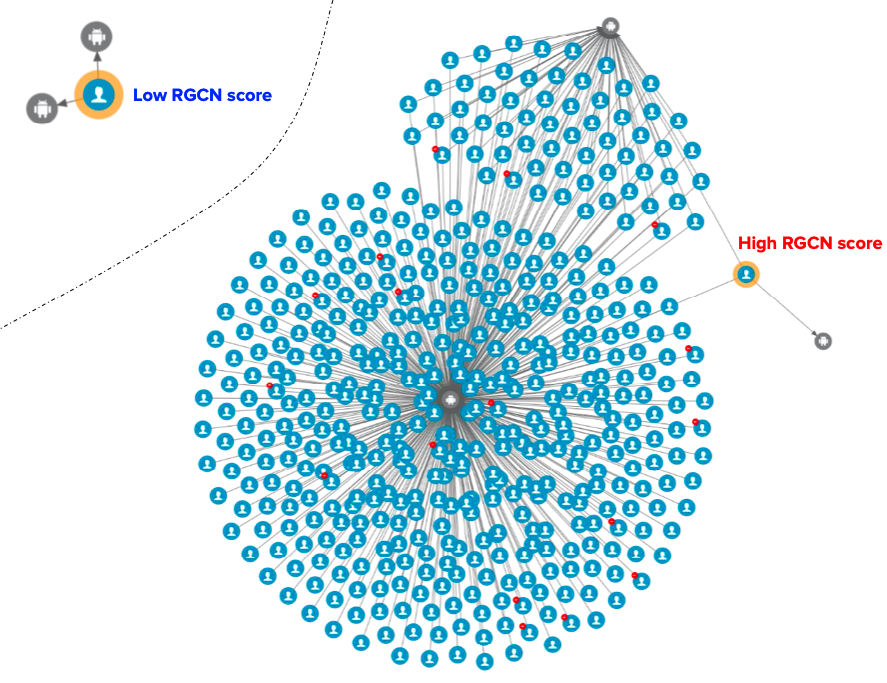
After implementing the graph, you can perform various analyses using graph algorithms, such as shortest path, centrality, or community detection. In addition, visualising your graph can help you gain insights and facilitate communication with others.

Conclusion

By following these steps, you can effectively create and analyse graph models for your specific domain. Remember to adjust the steps according to your unique domain and requirements, and always ensure that confidential and sensitive data is properly protected.

References

[1] What is a Graph Database?

Join us

Grab is the leading superapp platform in Southeast Asia, providing everyday services that matter to consumers. More than just a ride-hailing and food delivery app, Grab offers a wide range of on-demand services in the region, including mobility, food, package and grocery delivery services, mobile payments, and financial services across 428 cities in eight countries.

Powered by technology and driven by heart, our mission is to drive Southeast Asia forward by creating economic empowerment for everyone. If this mission speaks to you, join our team today!

Unsupervised graph anomaly detection – Catching new fraudulent behaviours

Post Syndicated from Grab Tech original https://engineering.grab.com/graph-anomaly-model

Earlier in this series, we covered the importance of graph networks, graph concepts, graph visualisation, and graph-based fraud detection methods. In this article, we will discuss how to automatically detect new types of fraudulent behaviour and swiftly take action on them.

One of the challenges in fraud detection is that fraudsters are incentivised to always adversarially innovate their way of conducting frauds, i.e., their modus operandi (MO in short). Machine learning models trained using historical data may not be able to pick up new MOs, as they are new patterns that are not available in existing training data. To enhance Grab’s existing security defences and protect our users from these new MOs, we needed a machine learning model that is able to detect them quickly without the need for any label supervision, i.e., an unsupervised learning model rather than the regular supervised learning model.

To address this, we developed an in-house machine learning model for detecting anomalous patterns in graphs, which has led to the discovery of new fraud MOs. Our focus was initially on GrabFood and GrabMart verticals, where we monitored the interactions between consumers and merchants. We modelled these interactions as a bipartite graph (a type of graph for modelling interactions between two groups) and then performed anomaly detection on the graph. Our in-house anomaly detection model was also presented at the International Joint Conference on Neural Networks (IJCNN) 2023, a premier academic conference in the area of neural networks, machine learning, and artificial intelligence.

In this blog, we discuss the model and its application within Grab. For avid audiences that want to read the details of our model, you can access it here. Note that even though we implemented our model for anomaly detection in GrabFood and GrabMart, the model is designed for general purposes and is applicable to interaction graphs between any two groups.

Interaction-Focused Anomaly Detection on Bipartite Node-and-Edge-Attributed Graphs
By Rizal Fathony, Jenn Ng, Jia Chen
Presented at International Joint Conference on Neural Networks (IJCNN) 2023

Before we dive into how our model works, it is important to understand the process of graph construction in our application as the model assumes the availability of the graphs in a standardised format.

Graph construction 

We modelled the interactions between consumers and merchants in GrabFood and GrabMart platforms as bipartite graphs (G), where the first group of nodes (U) represents the consumers, the second group of nodes (V) represents the merchants, and the edges (E) connecting them means that the consumers have placed some food/mart orders to the merchants. The graph is also supplied with rich transactional information about the consumers and the merchants in the form of node features (Xu and Xv), as well as order information in the form of edge features (Xe).

Fig 1. Graph construction process

The goal of our anomaly model is to detect anomalous and suspicious behaviours from the consumers or merchants (node-level anomaly detection), as well as anomalous order interactions (edge-level anomaly detection). As mentioned, this detection needs to be done without any label supervision.

Model architecture

We designed our graph anomaly model as a type of autoencoder, with an encoder and two decoders – a feature decoder and a structure decoder. The key feature of our model is that it accepts a bipartite graph with both node and edge attributes as the input. This is important as both node and edge attributes encode essential information for determining if certain behaviours are suspicious. Many previous works on graph anomaly detection only support node attributes. In addition, our model can produce both node and edge level anomaly scores, unlike most of the previous works that produce node-level scores only. We named our model GraphBEAN, which is short for Bipartite Node-and-Edge-Attributed Networks.

From the input, the encoder then processes the attributed bipartite graph into a series of graph convolution layers to produce latent representations for both node groups. Our graph convolution layers produce new representations for each node in both node groups (U and V), as well as for each edge in the graph. Note that the last convolution layer in the encoder only produces the latent representations for nodes, without producing edge representations. The reason for this design is that we only put the latent representations for the active actors, the nodes representing consumers and merchants, but not their interactions.

Fig 2. GraphBEAN architecture

From the nodes’ latent representations, the feature decoder is tasked to reconstruct the original graph with both node and edge attributes via a series of graph convolution layers. As the graph structure is provided by the feature decoder, we task the structure decoder to learn the graph structure by predicting if there exists an edge connecting two nodes. This edge prediction, as well as the graph reconstructed by the feature decoder, are then compared to the original input graph via a reconstruction loss function.

The model is then trained using the bipartite graph constructed from GrabFood and GrabMart transactions. We use a reconstruction-based loss function as the training objective of the model. After the training is completed, we compute the anomaly score of each node and edge in the graph using the trained model.

Anomaly score computation

Our anomaly scores are reconstruction-based. The score design assumes that normal behaviours are common in the dataset and thus, can be easily reconstructed by the model. On the other hand, anomalous behaviours are rare. Therefore the model will have a hard time reconstructing them, hence producing high errors.

Fig 3. Edge-level and node-level anomaly scores computation

The model produces two types of anomaly scores. First, the edge-level anomaly scores, which are calculated from the edge reconstruction error. Second, the node-level anomaly scores, which are calculated from node reconstruction error plus an aggregate over the edge scores from the edges connected to the node. This aggregate could be a mean or max aggregate.

Actioning system

In our implementation of GraphBEAN within Grab, we designed a full pipeline of anomaly detection and actioning systems. It is a fully-automated system for constructing a bipartite graph from GrabFood and GrabMart transactions, training a GraphBEAN model using the graph, and computing anomaly scores. After computing anomaly scores for all consumers and merchants (node-level), as well as all of their interactions (edge-level), it automatically passes the scores to our actioning system. But before that, it also passes them through a system we call fraud type tagger. This is also a fully-automated heuristic-based system that tags some of the detected anomalies with some fraud tags. The purpose of this tagging is to provide some context in general, like the types of detected anomalies. Some examples of these tags are promo abuse or possible collusion.

Fig 4. Pipeline in our actioning system

Both the anomaly scores and the fraud type tags are then forwarded to our actioning system. The system consists of two subsystems:

  • Human expert actioning system: Our fraud experts analyse the detected anomalies and perform certain actioning on them, like suspending certain transaction features from suspicious merchants.
  • Automatic actioning system: Combines the anomaly scores and fraud type tags with other external signals to automatically do actioning on the detected anomalies, like preventing promos from being used by fraudsters or preventing fraudulent transactions from occurring. These actions vary depending on the type of fraud and the scores.

What’s next?

The GraphBEAN model enables the detection of suspicious behaviour on graph data without the need for label supervision. By implementing the model on GrabFood and GrabMart platforms, we learnt that having such a system enables us to quickly identify new types of fraudulent behaviours and then swiftly perform action on them. This also allows us to enhance Grab’s defence against fraudulent activity and actively protect our users.

We are currently working on extending the model into more generic heterogeneous (multi-entity) graphs. In addition, we are also working on implementing it to more use cases within Grab.

Join us

Grab is the leading superapp platform in Southeast Asia, providing everyday services that matter to consumers. More than just a ride-hailing and food delivery app, Grab offers a wide range of on-demand services in the region, including mobility, food, package and grocery delivery services, mobile payments, and financial services across 428 cities in eight countries.

Powered by technology and driven by heart, our mission is to drive Southeast Asia forward by creating economic empowerment for everyone. If this mission speaks to you, join our team today!

Graph service platform

Post Syndicated from Grab Tech original https://engineering.grab.com/graph-service-platform

Introduction

In earlier articles of this series, we covered the importance of graph networks, graph concepts, how graph visualisation makes fraud investigations easier and more effective, and how graphs for fraud detection work. In this article, we elaborate on the need for a graph service platform and how it works.

In the present age, data linkages can generate significant business value. Whether we want to learn about the relationships between users in online social networks, between users and products in e-commerce, or understand credit relationships in financial networks, the capability to understand and analyse large amounts of highly interrelated data is becoming more important to businesses.

As the amount of consumer data grows, the GrabDefence team must continuously enhance fraud detection on mobile devices to proactively identify the presence of fraudulent or malicious users. Even simple financial transactions between users must be monitored for transaction loops and money laundering. To preemptively detect such scenarios, we need a graph service platform to help discover data linkages. 

Background

As mentioned in an earlier article, a graph is a model representation of the association of entities and holds knowledge in a structured way by marginalising entities and relationships. In other words, graphs hold a natural interpretability of linked data and graph technology plays an important role. Since the early days, large tech companies started to create their own graph technology infrastructure, which is used for things like social relationship mining, web search, and sorting and recommendation systems with great commercial success.

As graph technology was developed, the amount of data gathered from graphs started to grow as well, leading to a need for graph databases. Graph databases1 are used to store, manipulate, and access graph data on the basis of graph models. It is similar to the relational database with the feature of Online Transactional Processing (OLTP), which supports transactions, persistence, and other features.

A key concept of graphs is the edge or relationship between entities. The graph relates the data items in the store to a collection of nodes and edges, the edges representing the relationships between the nodes. These relationships allow data in the store to be linked directly and retrieved with one operation.

With graph databases, relationships between data can be queried fast as they are perpetually stored in the database. Additionally, relationships can be intuitively visualised using graph databases, making them useful for heavily interconnected data. To have real-time graph search capabilities, we must leverage the graph service platform and graph databases.

Architecture details

Graph services with graph databases are Platforms as a Service (PaaS) that encapsulate the underlying implementation of graph technology and support easier discovery of data association relationships with graph technologies.

They also provide universal graph operation APIs and service management for users. This means that users do not need to build graph runtime environments independently and can explore the value of data with graph service directly.

Fig. 1 Graph service platform system architecture

As shown in Fig. 1, the system can be divided into four layers:

  1. Storage backend – Different forms of data (for example, CSV files) are stored in Amazon S3, graph data stores in Neptune and meta configuration stores in DynamoDB.
  2. Driver – Contains drivers such as Gremlin, Neptune, S3, and DynamoDB.
  3. Service – Manages clusters, instances, databases etc, provides management API, includes schema and data load management, graph operation logic, and other graph algorithms.
  4. RESTful APIs – Currently supports the standard and uniform formats provided by the system, the Management API, Search API for OLTP, and Analysis API for online analytical processing (OLAP).

How it works

Graph flow

Fig. 2 Graph flow

CSV files stored in Amazon S3 are processed by extract, transform, and load (ETL) tools to generate graph data. This data is then managed by an Amazon Neptune DB cluster, which can only be accessed by users through graph service. Graph service converts user requests into asynchronous interactions with Neptune Cluster, which returns the results to users.

When users launch data load tasks, graph service synchronises the entity and attribute information with the CSV file in S3, and the schema stored in DynamoDB. The data is only imported into Neptune if there are no inconsistencies.

The most important component in the system is the graph service, which provides RESTful APIs for two scenarios: graph search for real-time streams and graph analysis for batch processing. At the same time, the graph service manages clusters, databases, instances, users, tasks, and meta configurations stored in DynamoDB, which implements features of service monitor and data loading offline or stream ingress online.

Use case in fraud detection

In Grab’s mobility business, we have come across situations where multiple accounts use shared physical devices to maximise their earning potential. With the graph capabilities provided by the graph service platform, we can clearly see the connections between multiple accounts and shared devices.

Historical device and account data are stored in the graph service platform via offline data loading or online stream injection. If the device and account data exists in the graph service platform, we can find the adjacent account IDs or the shared device IDs by using the device ID or account ID respectively specified in the user request.

In our experience, fraudsters tend to share physical resources to maximise their revenue. The following image shows a device that is shared by many users. With our Graph Visualisation platform based on graph service, you can see exactly what this pattern looks like.

Fig 3. Example of a device being shared with many users

Data injection

Fig. 4 Data injection

Graph service also supports data injection features, including data load by request (task with a type of data load) and real-time stream write by Kafka.  

When connected to GrabDefence’s infrastructure, Confluent with Kafka is used as the streaming engine.  The purpose of using Kafka as a streaming write engine is two-fold: to provide primary user authentication and to relieve the pressure on Neptune.

Impact

Graph service supports data management of Labelled Property Graphs and provides the capability to add, delete, update, and get vertices, edges, and properties for some graph models. Graph traversal and searching relationships with RESTful APIs are also more convenient with graph service.

Businesses usually do not need to focus on the underlying data storage, just designing graph schemas for model definition according to their needs. With the graph service platform, platforms or systems can be built for personalised search, intelligent Q&A, financial fraud, etc.

For big organisations, extensive graph algorithms provide the power to mine various entity connectivity relationships in massive amounts of data. The growth and expansion of new businesses is driven by discovering the value of data.

What’s next?

Fig. 5 Graph-centric ecosystems

We are building an integrated graph ecosystem inside and outside Grab. The infrastructure and service, or APIs are key components in graph-centric ecosystems; they provide graph arithmetic and basic capabilities of graphs in relation to search, computing, analysis etc. Besides that, we will also consider incorporating applications such as risk prediction and fraud detection in order to serve our current business needs.

Join us

Grab is the leading superapp platform in Southeast Asia, providing everyday services that matter to consumers. More than just a ride-hailing and food delivery app, Grab offers a wide range of on-demand services in the region, including mobility, food, package and grocery delivery services, mobile payments, and financial services across 428 cities in eight countries.

Powered by technology and driven by heart, our mission is to drive Southeast Asia forward by creating economic empowerment for everyone. If this mission speaks to you, join our team today!

References

Graph for fraud detection

Post Syndicated from Grab Tech original https://engineering.grab.com/graph-for-fraud-detection

Grab has grown rapidly in the past few years. It has expanded its business from ride hailing to food and grocery delivery, financial services, and more. Fraud detection is challenging in Grab, because new fraud patterns always arise whenever we introduce a new business product. We cannot afford to develop a new model whenever a new fraud pattern appears as it is time consuming and introduces a cold start problem, that is no protection at the early stage. We need a general fraud detection framework to better protect Grab from various unknown fraud risks.

Our key observation is that although Grab has many different business verticals, the entities within those businesses are connected to each other (Figure 1. Left), for example, two passengers may be connected by a Wi-Fi router or phone device, a merchant may be connected to a passenger by a food order, and so on. A graph provides an elegant way to capture the spatial correlation among different entities in the Grab ecosystem. A common fraud shows clear patterns on a graph, for example, a fraud syndicate tends to share physical devices, and collusion happens between a merchant and an isolated set of passengers (Figure 1. Right).

Figure 1. Left: The graph captures different correlations in the Grab ecosystem.
Right: The graph shows that common fraud has clear patterns.

We believe graphs can help us discover subtle traces and complicated fraud patterns more effectively. Graph-based solutions will be a sustainable foundation for us to fight against known and unknown fraud risks.

Why graph?

The most common fraud detection methods include the rule engine and the decision tree-based models, for example, boosted tree, random forest, and so on. Rules are a set of simple logical expressions designed by human experts to target a particular fraud problem. They are good for simple fraud detection, but they usually do not work well in complicated fraud or unknown fraud cases.

Fraud detection methods

Utilises correlations
(Higher is better)
Detects unknown fraud
(Higher is better)
Requires feature engineering
(Lower is better)
Depends on labels
(Lower is better)
Rule engine Low N/A N/A Low
Decision tree Low Low High High
Graph model High High Low Low

Table 1. Graph vs. common fraud detection methods.

Decision tree-based models have been dominating fraud detection and Kaggle competitions for structured or tabular data in the past few years. With that said, the performance of a tree-based model is highly dependent on the quality of labels and feature engineering, which is often hard to obtain in real life. In addition, it usually does not work well in unknown fraud which has not been seen in the labels.

On the other hand, a graph-based model requires little amount of feature engineering and it is applicable to unknown fraud detection with less dependence on labels, because it utilises the structural correlations on the graph.

In particular, fraudsters tend to show strong correlations on a graph, because they have to share physical properties such as personal identities, phone devices, Wi-Fi routers, delivery addresses, and so on, to reduce cost and maximise revenue as shown in Figure 2 (left). An example of such strong correlations is shown in Figure 2 (right), where the entities on the graph are densely connected, and the known fraudsters are highlighted in red. Those strong correlations on the graph are the key reasons that make the graph based approach a sustainable foundation for various fraud detection tasks.

Figure 2. Fraudsters tend to share physical properties to reduce cost (left), and they are densely connected as shown on a graph (right).

Semi-supervised graph learning

Unlike traditional decision tree-based models, the graph-based machine learning model can utilise the graph’s correlations and achieve great performance even with few labels. The semi-supervised Graph Convolutional Network model has been extremely popular in recent years 1. It has proven its success in many fraud detection tasks across industries, for example, e-commerce fraud, financial fraud, internet traffic fraud, etc.
We apply the Relational Graph Convolutional Network (RGCN) 2 for fraud detection in Grab’s ecosystem. Figure 3 shows the overall architecture of RGCN. It takes a graph as input, and the graph passes through several graph convolutional layers to get node embeddings. The final layer outputs a fraud probability for each node. At each graph convolutional layer, the information is propagated along the neighbourhood nodes within the graph, that is nodes that are close on the graph are similar to each other.

Fig 3. A semi-supervised Relational Graph Convolutional Network model.

We train the RGCN model on a graph with millions of nodes and edges, where only a few percentages of the nodes on the graph have labels. The semi-supervised graph model has little dependency on the labels, which makes it a robust model for tackling various types of unknown fraud.

Figure 4 shows the overall performance of the RGCN model. On the left is the Receiver Operating Characteristic (ROC) curve on the label dataset, in particular, the Area Under the Receiver Operating Characteristic (AUROC) value is close to 1, which means the RGCN model can fit the label data quite well. The right column shows the low dimensional projections of the node embeddings on the label dataset. It is clear that the embeddings of the genuine passenger are well separated from the embeddings of the fraud passenger. The model can distinguish between a fraud and a genuine passenger quite well.

Fig 4. Left: ROC curve of the RGCN model on the label dataset.
Right: Low dimensional projections of the graph node embeddings.

Finally, we would like to share a few tips that will make the RGCN model work well in practice.

  • Use less than three convolutional layers: The node feature will be over-smoothed if there are many convolutional layers, that is all the nodes on the graph look similar.
  • Node features are important: Domain knowledge of the node can be formulated as node features for the graph model, and rich node features are likely to boost the model performance.

Graph explainability

Unlike other deep network models, graph neural network models usually come with great explainability, that is why a user is classified as fraudulent. For example, fraudulent accounts are likely to share hardware devices and form dense clusters on the graph, and those fraud clusters can be easily spotted on a graph visualiser 3.

Figure 5 shows an example where graph visualisation helps to explain the model prediction scores. The genuine passenger with a low RGCN score does not share devices with other passengers, while the fraudulent passenger with a high RGCN score shares devices with many other passengers, that is, dense clusters.

Figure 5. Upper left: A genuine passenger with a low RGCN score has no device sharing with other passengers. Bottom right: A fraudulent user with a high RGCN score shares devices with many other passengers.

Closing thoughts

Graphs provide a sustainable foundation for combating many different types of fraud risks. Fraudsters are evolving very fast these days, and the best traditional rules or models can do is to chase after those fraudsters given that a fraud pattern has already been discovered. This is suboptimal as the damage has already been done on the platform. With the help of graph models, we can potentially detect those fraudsters before any fraudulent activity has been conducted, thus reducing the fraud cost.

The graph structural information can significantly boost the model performance without much dependence on labels, which is often hard to get and might have a large bias in fraud detection tasks. We have shown that with only a small percentage of labelled nodes on the graph, our model can already achieve great performance.

With that said, there are also many challenges to making a graph model work well in practice. We are working towards solving the following challenges we are facing.

  • Feature initialisation: Sometimes, it is hard to initialise the node feature, for example, a device node does not carry many semantic meanings. We have explored self-supervised pre-training 4 to help the feature initialisation, and the preliminary results are promising.
  • Real-time model prediction: Realtime graph model prediction is challenging because real-time graph updating is a heavy operation in most cases. One possible solution is to do batch real-time prediction to reduce the overhead.
  • Noisy connections: Some connections on the graph are inherently noisy on the graph, for example, two users sharing the same IP address does not necessarily mean they are physically connected. The IP might come from a mobile network. One possible solution is to use the attention mechanism in the graph convolutional kernel and control the message passing based on the type of connection and node profiles.

Join us

Grab is the leading superapp platform in Southeast Asia, providing everyday services that matter to consumers. More than just a ride-hailing and food delivery app, Grab offers a wide range of on-demand services in the region, including mobility, food, package and grocery delivery services, mobile payments, and financial services across 428 cities in eight countries.

Powered by technology and driven by heart, our mission is to drive Southeast Asia forward by creating economic empowerment for everyone. If this mission speaks to you, join our team today!

References

  1. T. Kipf and M. Welling, “Semi-supervised classification with graph convolutional networks,” in ICLR, 2017 

  2. Schlichtkrull, Michael, et al. “Modeling relational data with graph convolutional networks.” European semantic web conference. Springer, Cham, 2018. 

  3. Fujiao Liu, Shuqi Wang, et al.. “Graph Networks – 10X investigation with Graph Visualisations”. Grab Tech Blog. 

  4. Wang, Chen, et al.. “Deep Fraud Detection on Non-attributed Graph.” IEEE Big Data conference, PSBD, 2021. 

Graph Networks – Striking fraud syndicates in the dark

Post Syndicated from Grab Tech original https://engineering.grab.com/graph-networks


As a leading superapp in Southeast Asia, Grab serves millions of consumers daily. This naturally makes us a target for fraudsters and to enhance our defences, the Integrity team at Grab has launched several hyper-scaled services, such as the Griffin real-time rule engine and Advanced Feature Engineering. These systems enable data scientists and risk analysts to develop real-time scoring, and take fraudsters out of our ecosystems.

Apart from individual fraudsters, we have also observed the fast evolution of the dark side over time. We have had to evolve our defences to deal with professional syndicates that use advanced equipment such as device farms and GPS spoofing apps to perform fraud at scale. These professional fraudsters are able to camouflage themselves as normal users, making it significantly harder to identify them with rule-based detection.

Since 2020, Grab’s Integrity team has been advancing fraud detection with more sophisticated techniques and experimenting with a range of graph network technologies such as graph visualisations, graph neural networks and graph analytics. We’ve seen a lot of progress in this journey and will be sharing some key learnings that might help other teams who are facing similar issues.

What are Graph-based Prediction Platforms?

“You can fool some of the people all of the time, and all of the people some of the time, but you cannot fool all of the people all of the time.” – Abraham Lincoln

A Graph-based Prediction Platform connects multiple entities through one or more common features. When such entities are viewed as a macro graph network, we uncover new patterns that are otherwise unseen to the naked eye. For example, when investigating if two users are sharing IP addresses or devices, we might not be able to tell if they are fraudulent or just family members sharing a device.

However, if we use a graph system and look at all users sharing this device or IP address, it could show us if these two users are part of a much larger syndicate network in a device farming operation. In operations like these, we may see up to hundreds of other fake accounts that were specifically created for promo and payment fraud. With graphs, we can identify fraudulent activity more easily.

Grab’s Graph-based Prediction Platform

Leveraging the power of graphs, the team has primarily built two types of systems:

  • Graph Database Platform: An ultra-scalable storage system with over one billion nodes that powers:
    1. Graph Visualisation: Risk specialists and data analysts can review user connections real-time and are able to quickly capture new fraud patterns with over 10 dimensions of features (see Fig 1).

      Change Data Capture flow
      Fig 1: Graph visualisation
    2. Network-based feature system: A configurable system for engineers to adjust machine learning features based on network connectivity, e.g. number of hops between two users, numbers of shared devices between two IP addresses.

  • Graph-based Machine Learning: Unlike traditional fraud detection models, Graph Neural Networks (GNN) are able to utilise the structural correlations on the graph and act as a sustainable foundation to combat many different kinds of fraud. The data science team has built large-scale GNN models for scenarios like anti-money laundering and fraud detection.

    Fig 2 shows a Money Laundering Network where hundreds of accounts coordinate the placement of funds, layering the illicit monies through a complex web of transactions making funds hard to trace, and consolidate funds into spending accounts.

Change Data Capture flow
Fig 2: Money Laundering Network

What’s next?

In the next article of our Graph Network blog series, we will dive deeper into how we develop the graph infrastructure and database using AWS Neptune. Stay tuned for the next part.

Join us

Grab is the leading superapp platform in Southeast Asia, providing everyday services that matter to consumers. More than just a ride-hailing and food delivery app, Grab offers a wide range of on-demand services in the region, including mobility, food, package and grocery delivery services, mobile payments, and financial services across 428 cities in eight countries.

Powered by technology and driven by heart, our mission is to drive Southeast Asia forward by creating economic empowerment for everyone. If this mission speaks to you, join our team today!