Post Syndicated from Omer Yoachimik original https://blog.cloudflare.com/ddos-attack-trends-for-2021-q4/

This post is also available in 日本語, Deutsch, Français, Español.
The first half of 2021 witnessed massive ransomware and ransom DDoS attack campaigns that interrupted aspects of critical infrastructure around the world (including one of the largest petroleum pipeline system operators in the US) and a vulnerability in IT management software that targeted schools, public sector, travel organizations, and credit unions, to name a few.
The second half of the year recorded a growing swarm of one of the most powerful botnets deployed (Meris) and record-breaking HTTP DDoS attacks and network-layer attacks observed over the Cloudflare network. This besides the Log4j2 vulnerability (CVE-2021-44228) discovered in December that allows an attacker to execute code on a remote server — arguably one of the most severe vulnerabilities on the Internet since both Heartbleed and Shellshock.
Prominent attacks such as the ones listed above are but a few examples that demonstrate a trend of intensifying cyber-insecurity that affected everyone, from tech firms and government organizations to wineries and meat processing plants.
Here are some DDoS attack trends and highlights from 2021 and Q4 ‘21 specifically:
Ransom DDoS attacks
- In Q4, ransom DDoS attacks increased by 29% YoY and 175% QoQ.
- In December alone, one out of every three survey respondents reported being targeted by a ransom DDoS attack or threatened by the attacker.
Application-layer DDoS attacks
- The Manufacturing industry was the most attacked in Q4 ’21, recording a whopping 641% increase QoQ in the number of attacks. The Business Services and Gaming/Gambling industries were the second and third most targeted industries by application-layer DDoS attacks.
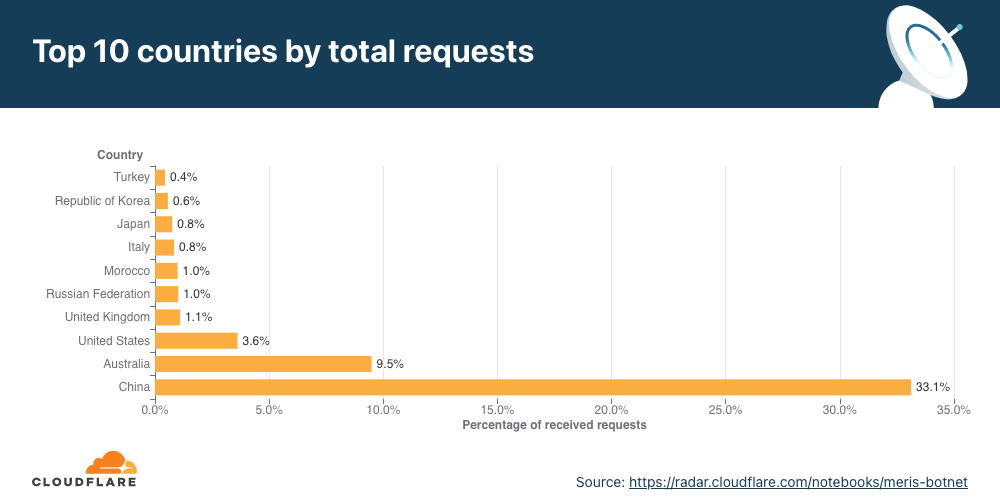
- For the fourth time in a row this year, China topped the charts with the highest percentage of attack traffic originating from its networks.
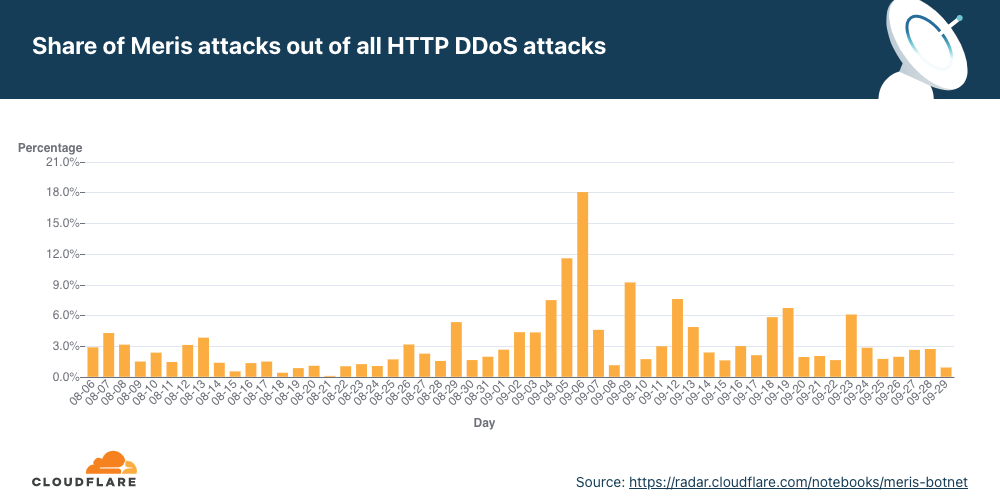
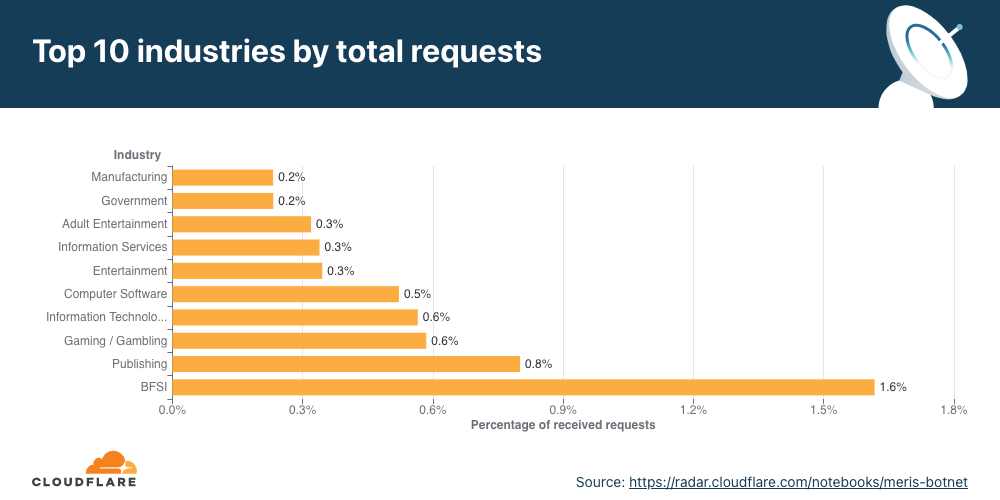
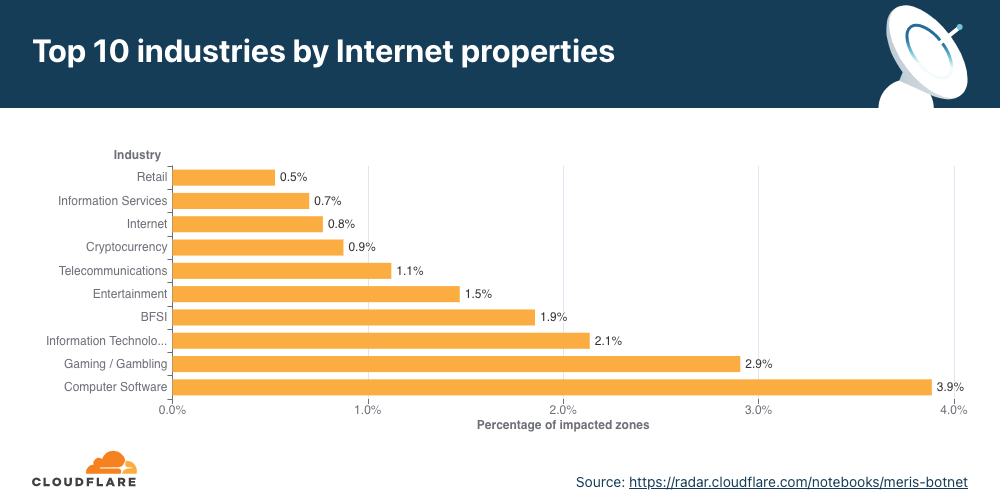
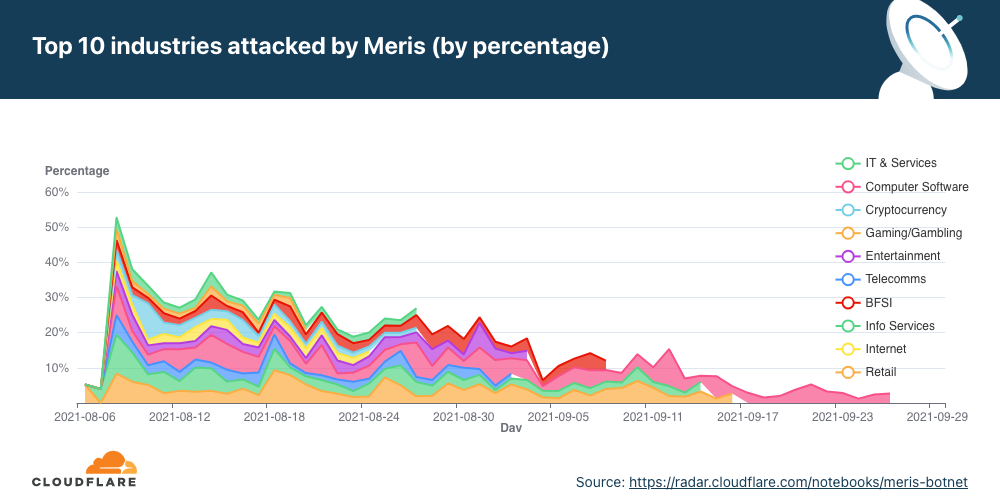
- A new botnet called the Meris botnet emerged in mid-2021 and continued to bombard organizations around the world, launching some of the largest HTTP attacks on record — including a 17.2M rps attack that Cloudflare automatically mitigated.
Network-layer DDoS attacks
- Q4 ’21 was the busiest quarter for attackers in 2021. In December 2021 alone, there were more than all the attacks observed in Q1 and Q2 ’21 separately.
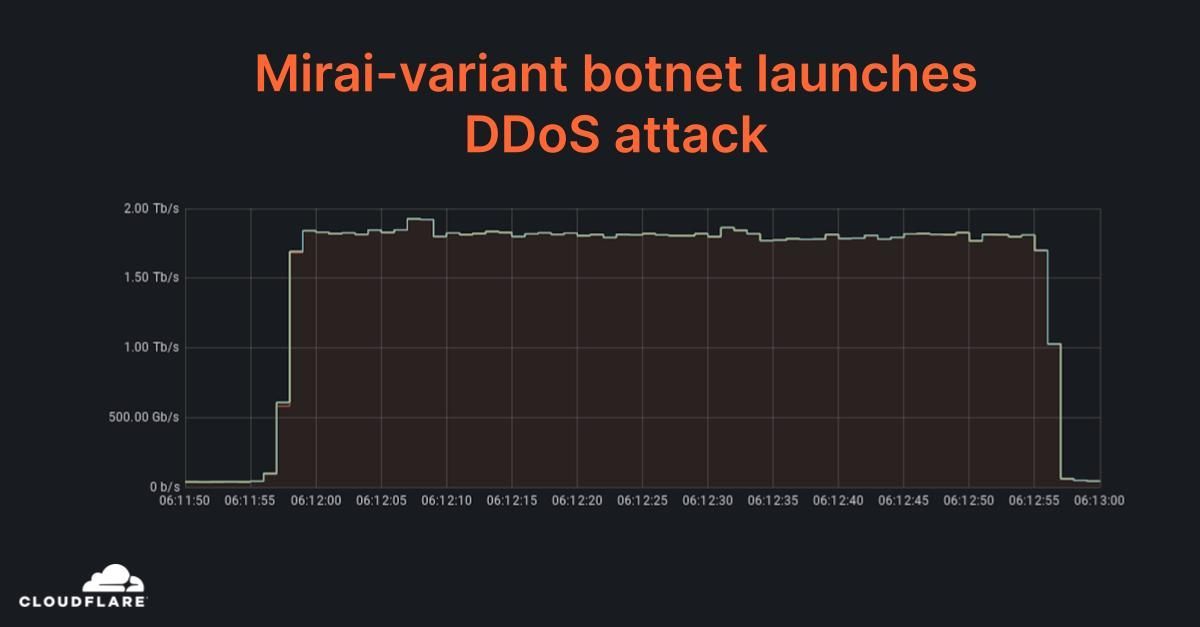
- While the majority of attacks were small, terabit-strong attacks became the new norm in the second half of 2021. Cloudflare automatically mitigated dozens of attacks peaking over 1 Tbps, with the largest one peaking just under 2 Tbps — the largest we’ve ever seen.
- Q4 ’21, and November specifically, recorded a persistent ransom DDoS campaign against VoIP providers around the world.
- Attacks originating from Moldova quadrupled in Q4 ’21 QoQ, making it the country with the highest percentage of network-layer DDoS activity.
- SYN floods and UDP floods were the most frequent attack vectors while emerging threats such as SNMP attacks increased by nearly 5,800% QoQ.
This report is based on DDoS attacks that were automatically detected and mitigated by Cloudflare’s DDoS Protection systems. To learn more about how it works, check out this deep-dive blog post.
A note on how we measure DDoS attacks observed over our network
To analyze attack trends, we calculate the “DDoS activity” rate, which is the percentage of attack traffic out of the total traffic (attack + clean) observed over our global network. Measuring attack numbers as a percentage of the total traffic observed allows us to normalize data points and avoid biases reflected in absolute numbers towards, for example, a Cloudflare data center that receives more total traffic and likely, also more attacks.
An interactive version of this report is available on Cloudflare Radar.
Ransom Attacks
Our systems constantly analyze traffic and automatically apply mitigation when DDoS attacks are detected. Each DDoS’d customer is prompted with an automated survey to help us better understand the nature of the attack and the success of the mitigation.
For over two years now, Cloudflare has been surveying attacked customers — one question on the survey being if they received a ransom note demanding payment in exchange to stop the DDoS attack. Q4 ’21 recorded the highest survey responses ever that indicated ransom threats — ransom attacks increased by 29% YoY and 175% QoQ. More specifically, one out of every 4.5 respondents (22%) reported receiving a ransom letter demanding payment by the attacker.
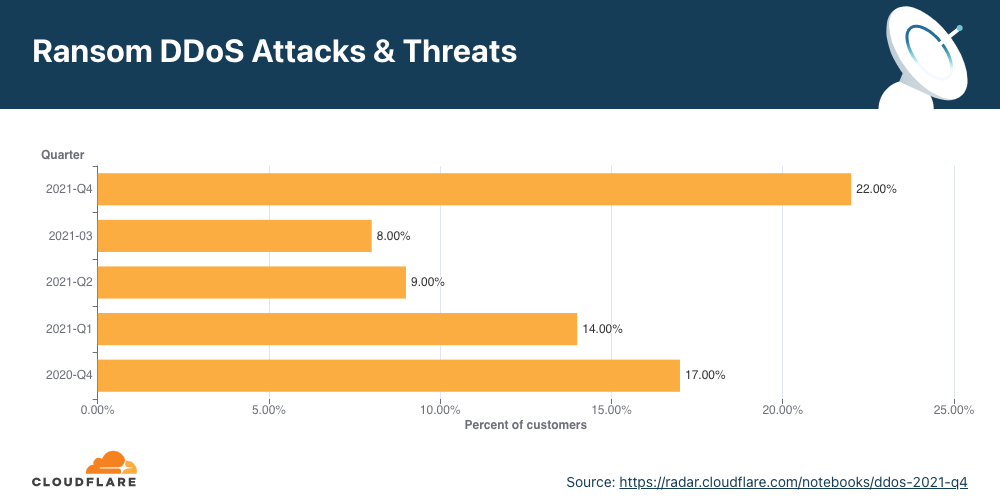
When we break it down by month, we can see that December 2021 topped the charts with 32% of respondents reporting receiving a ransom letter — that’s nearly one out of every three surveyed respondents.

Application-layer DDoS attacks
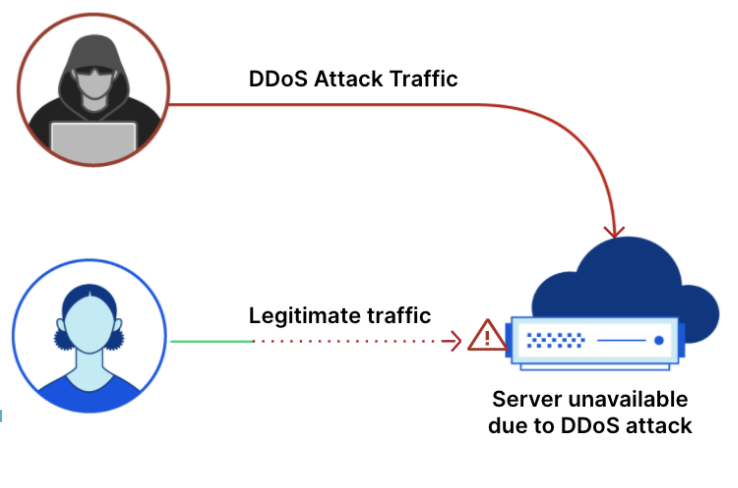
Application-layer DDoS attacks, specifically HTTP DDoS attacks, are attacks that usually aim to disrupt a web server by making it unable to process legitimate user requests. If a server is bombarded with more requests than it can process, the server will drop legitimate requests and — in some cases — crash, resulting in degraded performance or an outage for legitimate users.
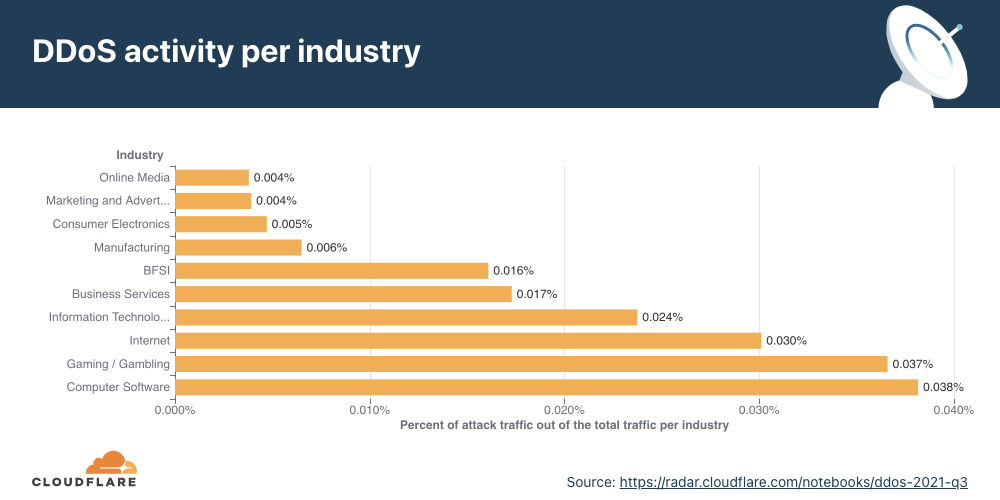
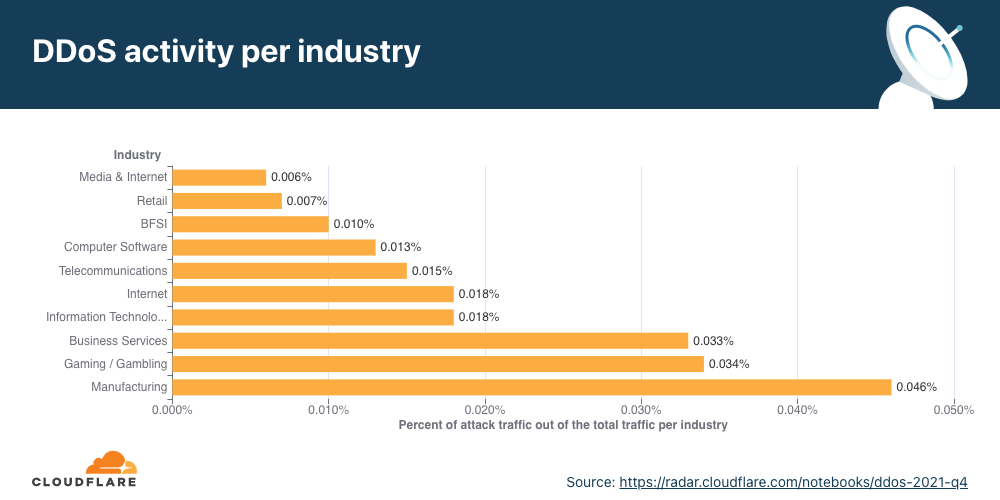
Application-layer DDoS attacks by industry
In Q4, DDoS attacks on Manufacturing companies increased by 641% QoQ, and DDoS attacks on the Business Services industry increased by 97%.
When we break down the application-layer attacks targeted by industry, the Manufacturing, Business Services, and Gaming/Gambling industries were the most targeted industries in Q4 ’21.
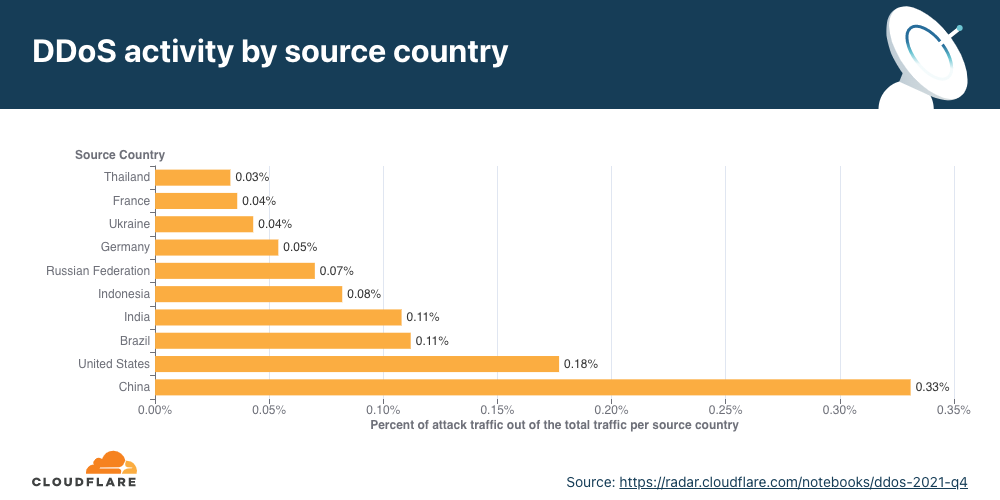
Application-layer DDoS attacks by source country
To understand the origin of the HTTP attacks, we look at the geolocation of the source IP address belonging to the client that generated the attack HTTP requests. Unlike network-layer attacks, source IP addresses cannot be spoofed in HTTP attacks. A high percentage of DDoS activity in a given country usually indicates the presence of botnets operating from within the country’s borders.
For the fourth quarter in a row, China remains the country with the highest percentage of DDoS attacks originating from within its borders. More than three out of every thousand HTTP requests that originated from Chinese IP addresses were part of an HTTP DDoS attack. The US remained in second place, followed by Brazil and India.
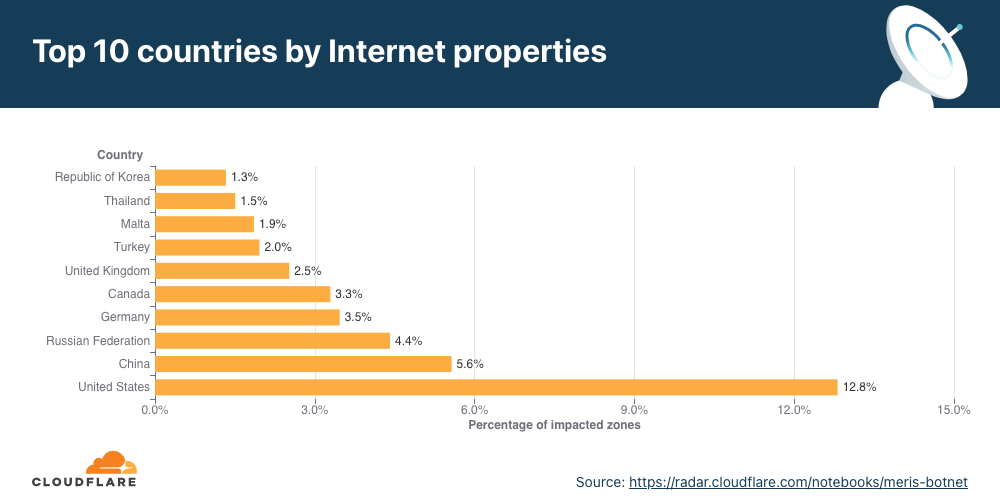
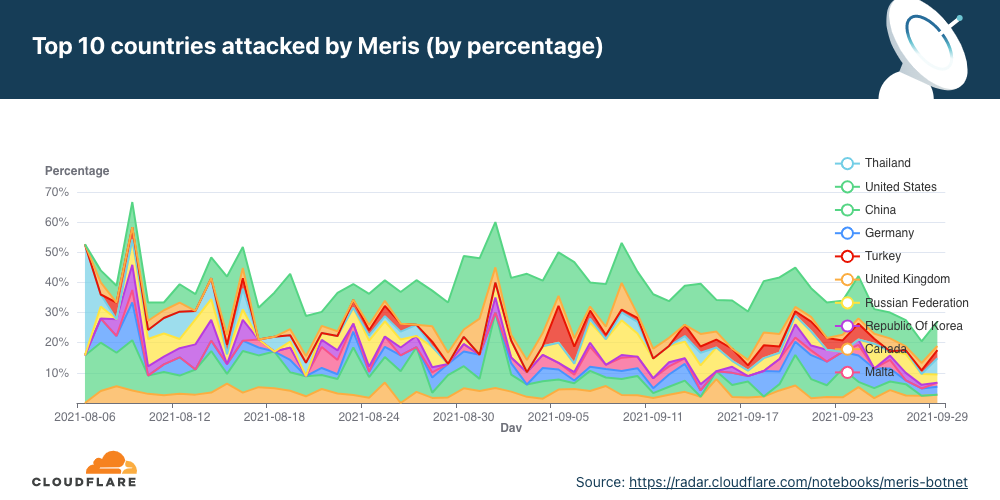
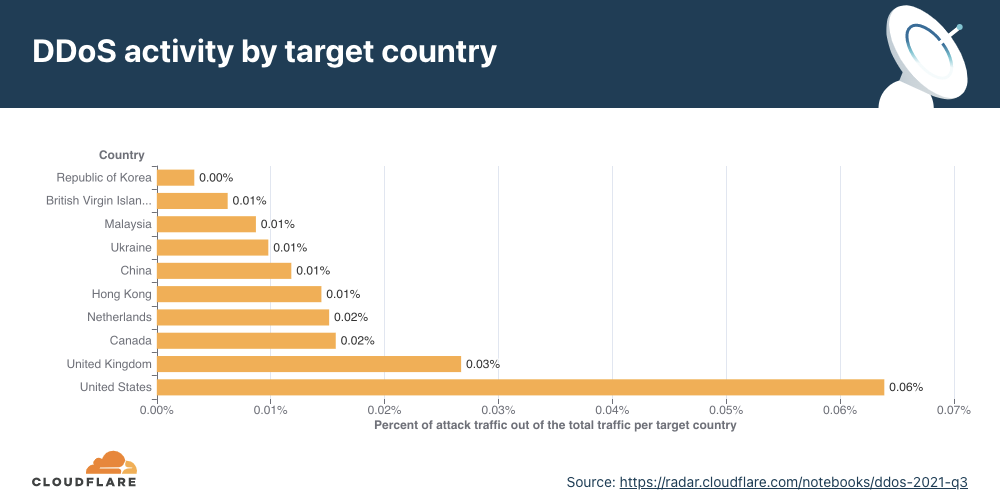
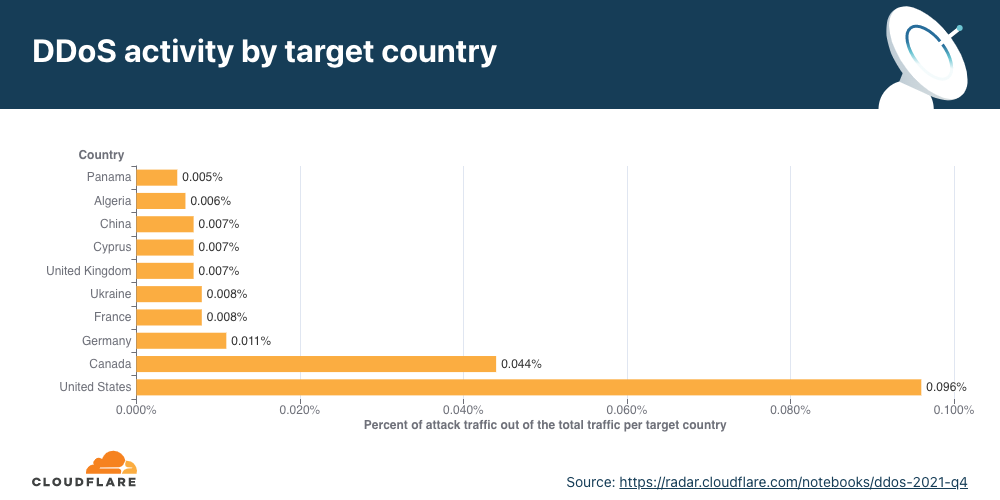
Application-layer DDoS attacks by target country
In order to identify which countries are targeted by the most HTTP DDoS attacks, we bucket the DDoS attacks by our customers’ billing countries and represent it as a percentage out of all DDoS attacks.
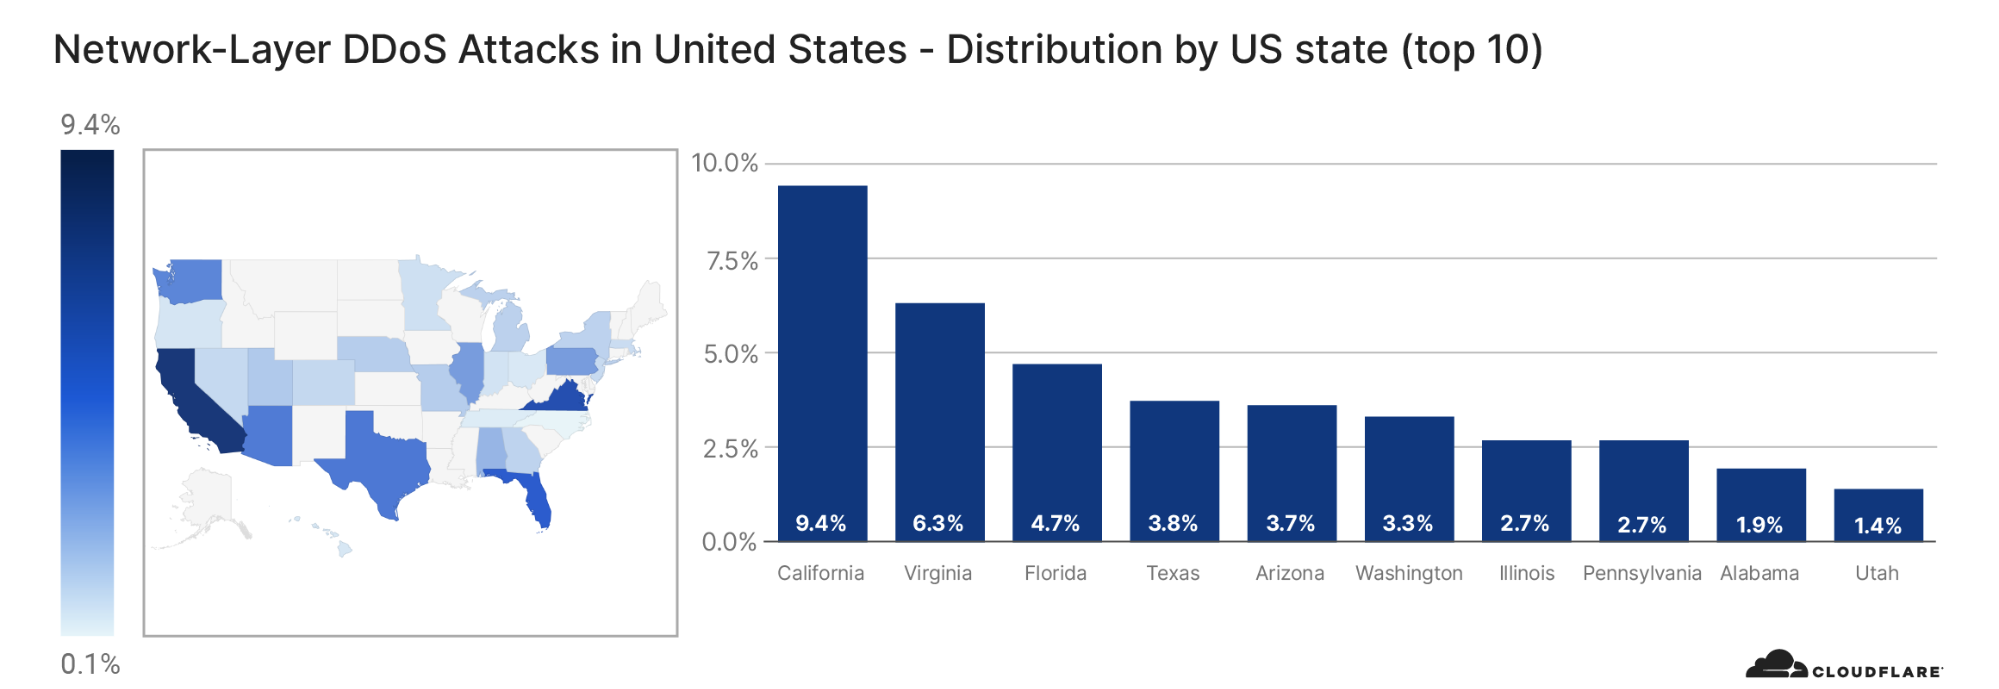
For the third consecutive time this year, organizations in the United States were targeted by the most HTTP DDoS attacks, followed by Canada and Germany.
Network-layer DDoS attacks
While application-layer attacks target the application (Layer 7 of the OSI model) running the service that end users are trying to access, network-layer attacks aim to overwhelm network infrastructure (such as in-line routers and servers) and the Internet link itself.
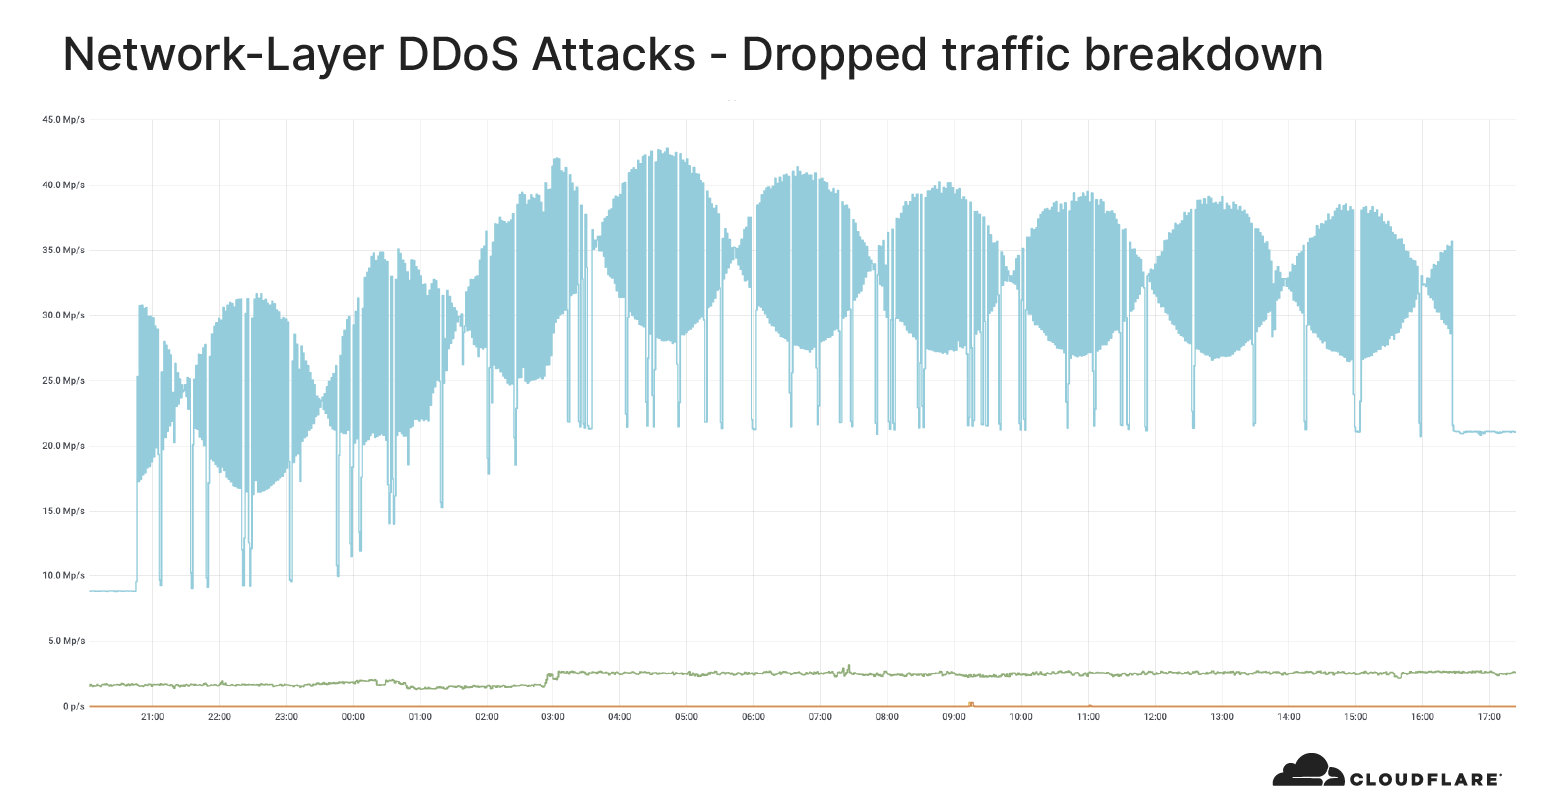
Cloudflare thwarts an almost 2 Tbps attack
In November, our systems automatically detected and mitigated an almost 2 Tbps DDoS attack. This was a multi-vector attack combining DNS amplification attacks and UDP floods. The entire attack lasted just one minute. The attack was launched from approximately 15,000 bots running a variant of the original Mirai code on IoT devices and unpatched GitLab instances.
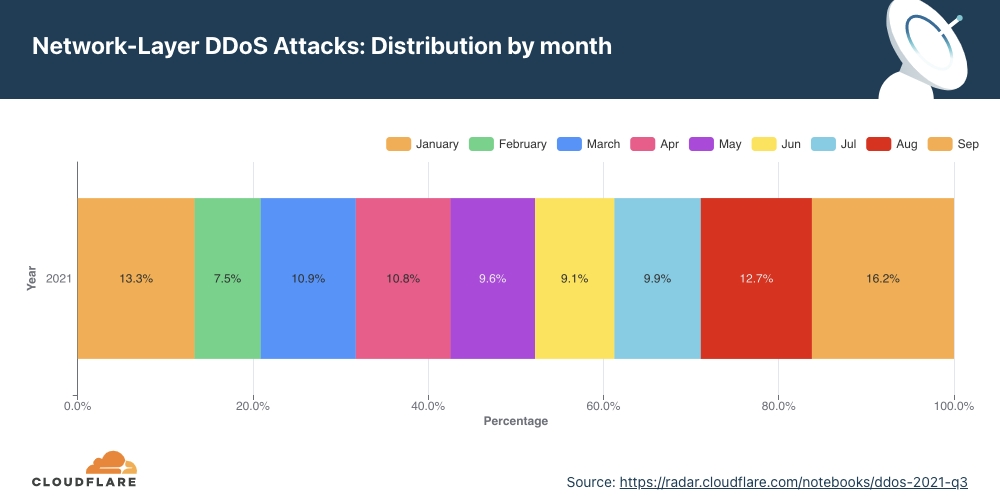
Network-layer DDoS attacks by month
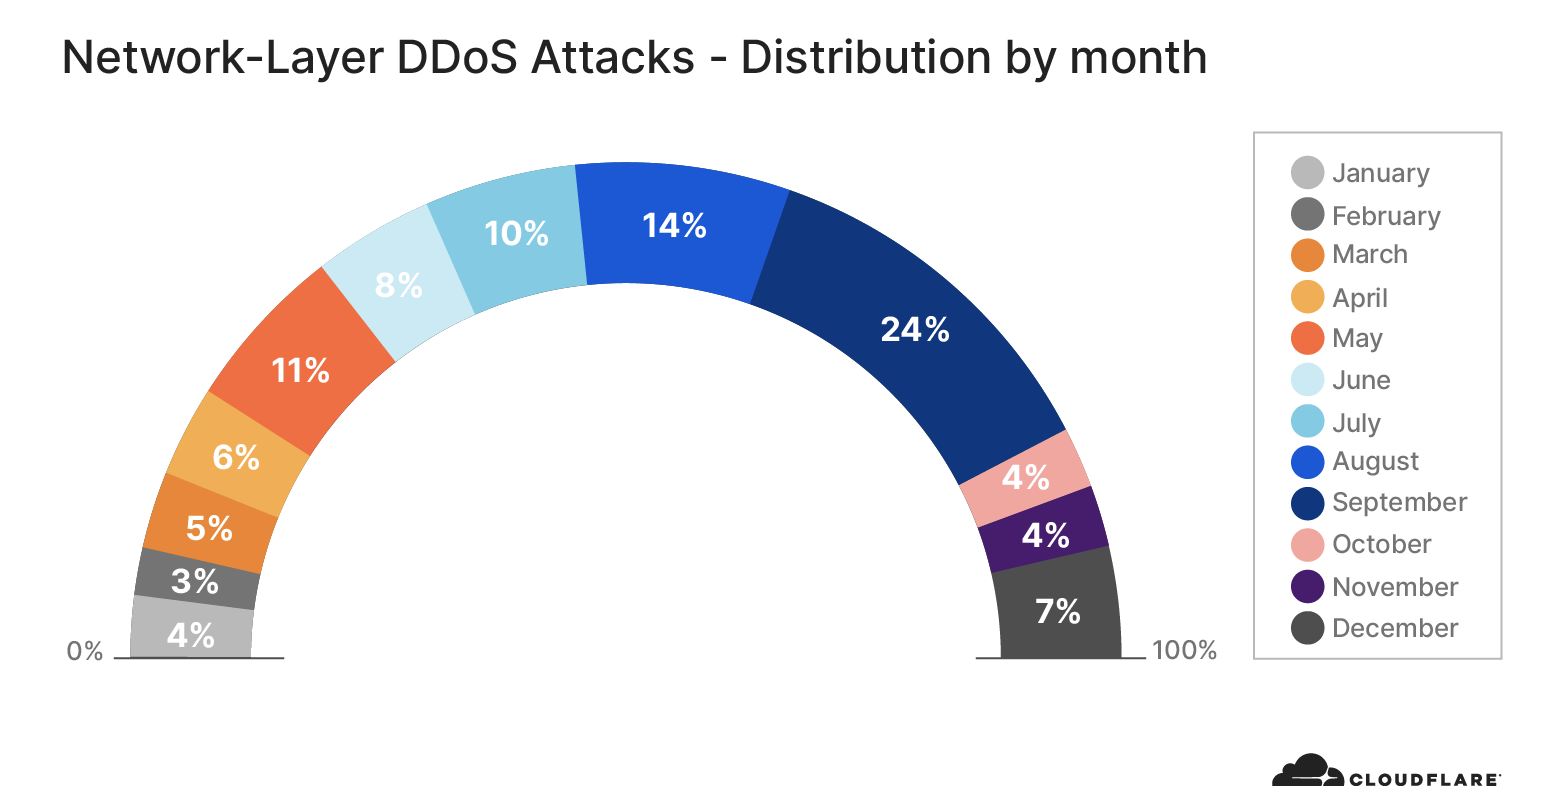
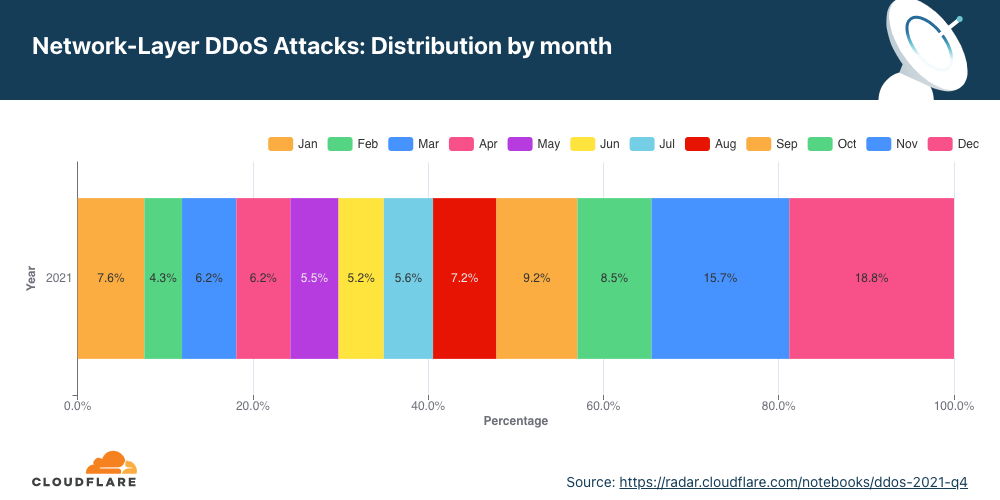
December was the busiest month for attackers in 2021.
Q4 ‘21 was the busiest quarter in 2021 for attackers. Over 43% of all network-layer DDoS attacks took place in the fourth quarter of 2021. While October was a relatively calmer month, in November, the month of the Chinese Singles’ Day, the American Thanksgiving holiday, Black Friday, and Cyber Monday, the number of network-layer DDoS attacks nearly doubled. The number of observed attacks increased towards the final days of December ’21 as the world prepared to close out the year. In fact, the total number of attacks in December alone was higher than all the attacks in Q2 ’21 and almost equivalent to all attacks in Q1 ’21.
Network-layer DDoS attacks by attack rate
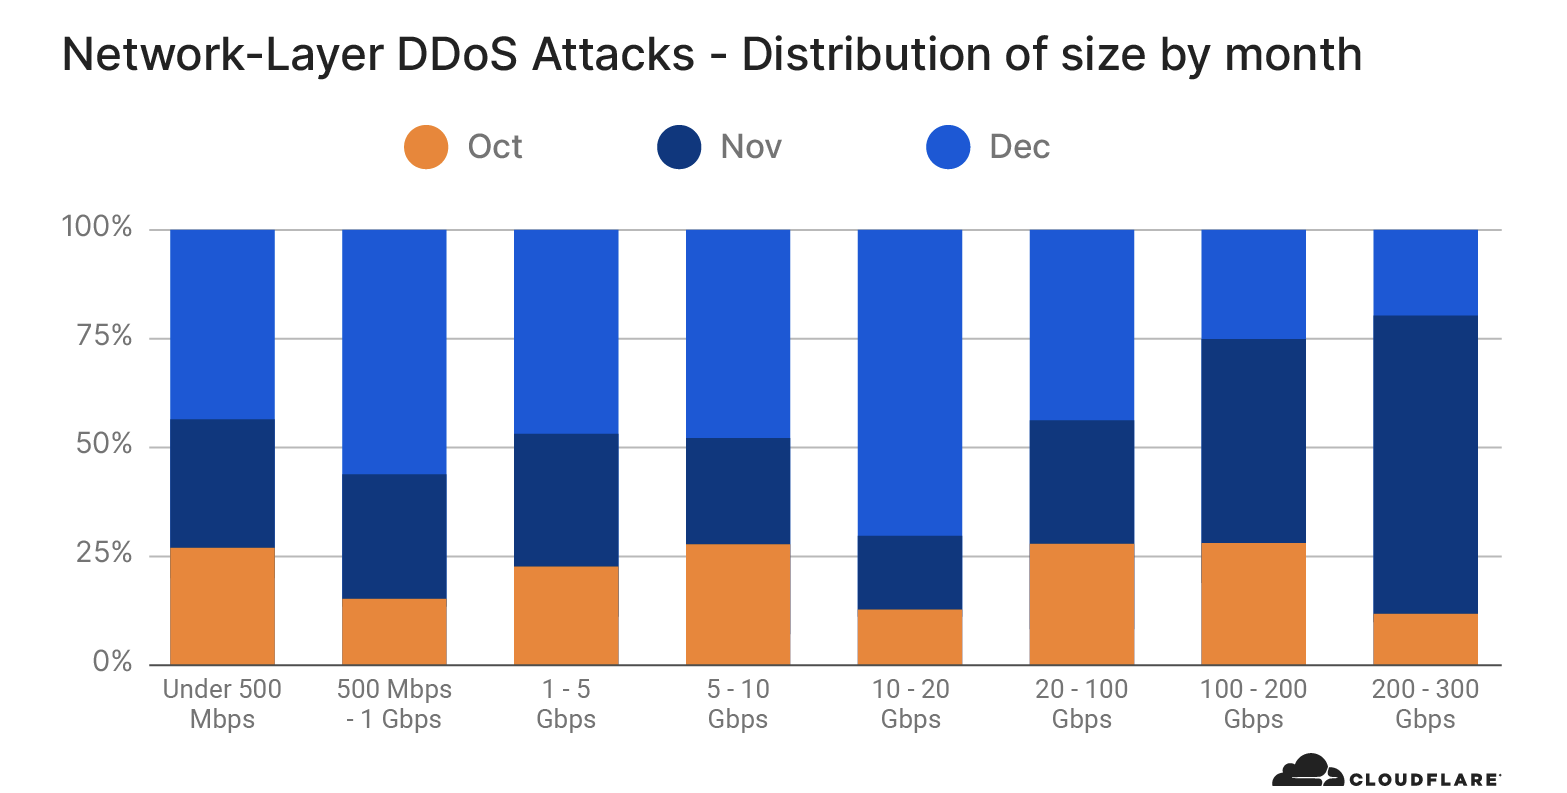
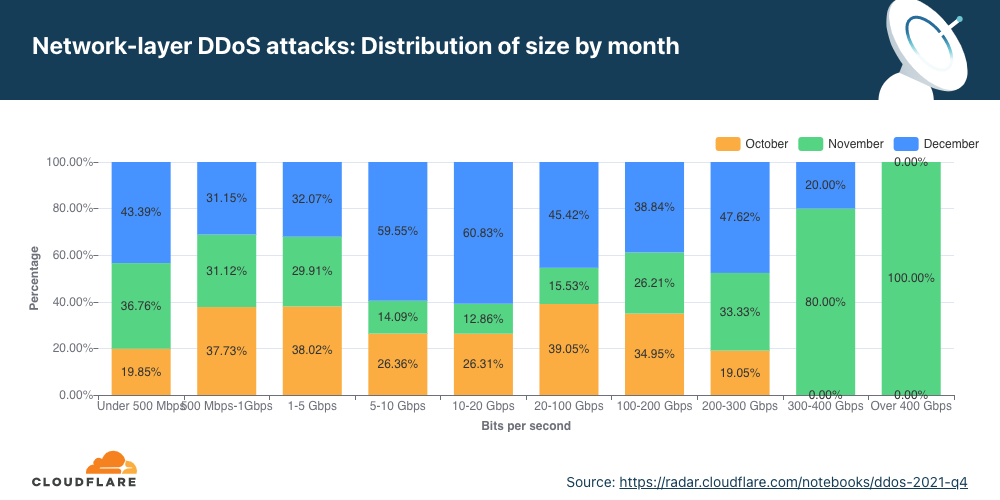
While most attacks are still relatively ‘small’ in size, terabit-strong attacks are becoming the norm.
There are different ways of measuring the size of an L3/4 DDoS attack. One is the volume of traffic it delivers, measured as the bit rate (specifically, terabits per second or gigabits per second). Another is the number of packets it delivers, measured as the packet rate (specifically, millions of packets per second).
Attacks with high bit rates attempt to cause a denial-of-service event by clogging the Internet link, while attacks with high packet rates attempt to overwhelm the servers, routers, or other in-line hardware appliances. These devices dedicate a certain amount of memory and computation power to process each packet. Therefore, by bombarding it with many packets, the appliance can be left with no further processing resources. In such a case, packets are “dropped,” i.e., the appliance is unable to process them. For users, this results in service disruptions and denial of service.
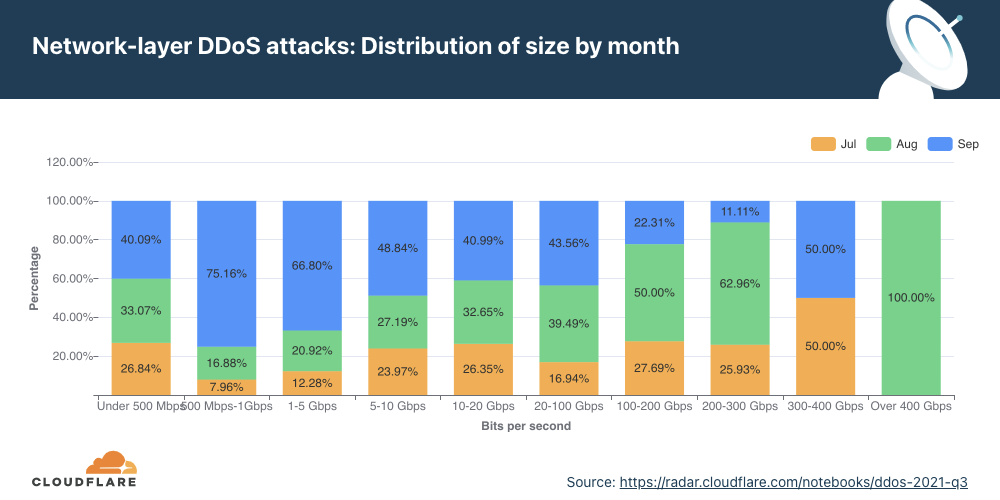
The distribution of attacks by their size (in bit rate) and month is shown below. As seen in the graph above, the majority of attacks took place in December. However, the graph below illustrates that larger attacks, over 300 Gbps in size, took place in November. Most of the attacks between 5-20 Gbps took place in December.
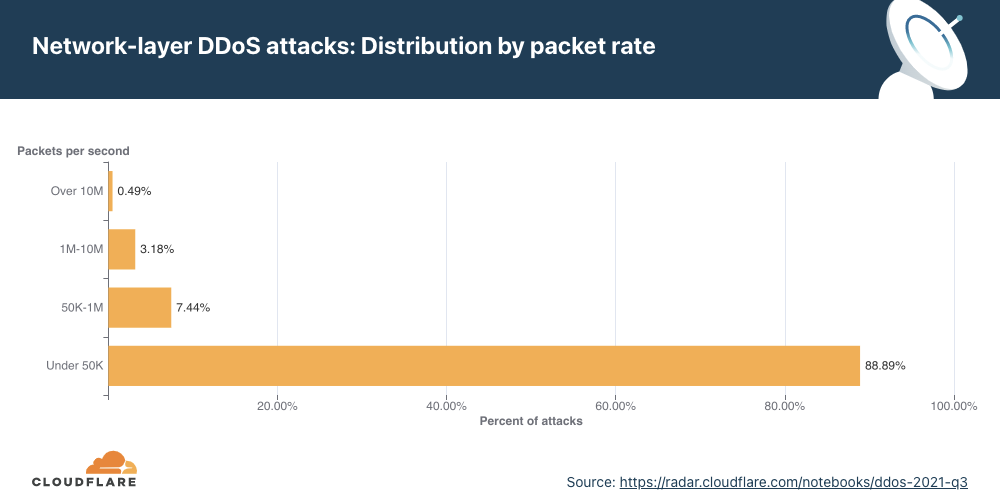
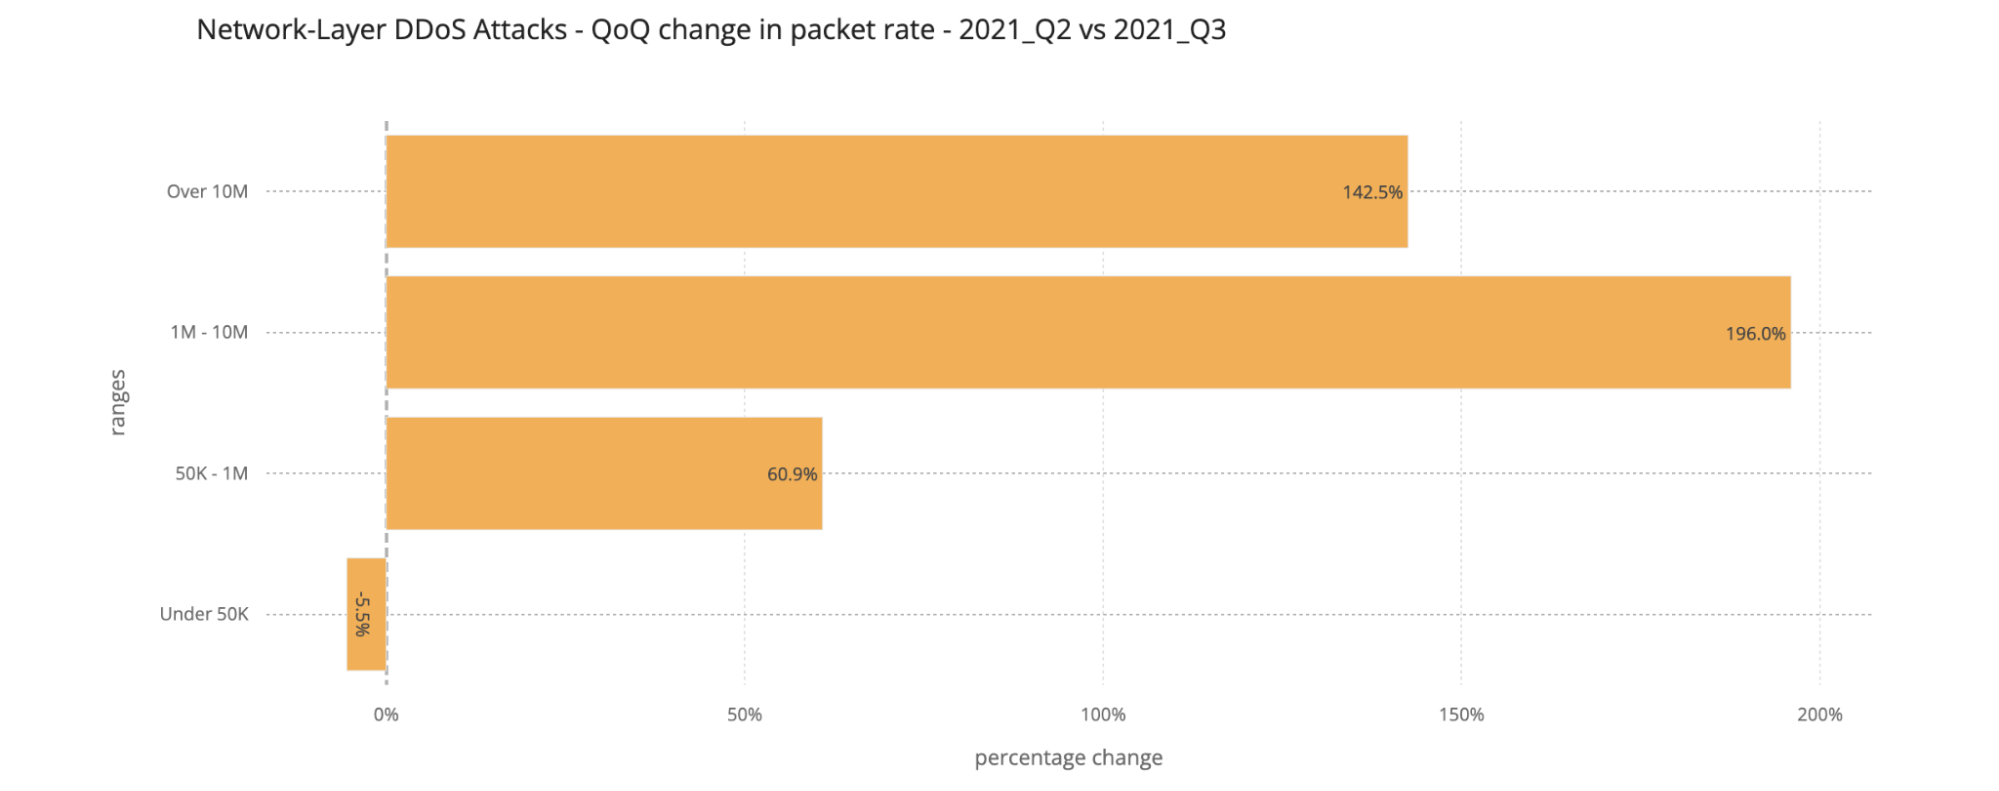
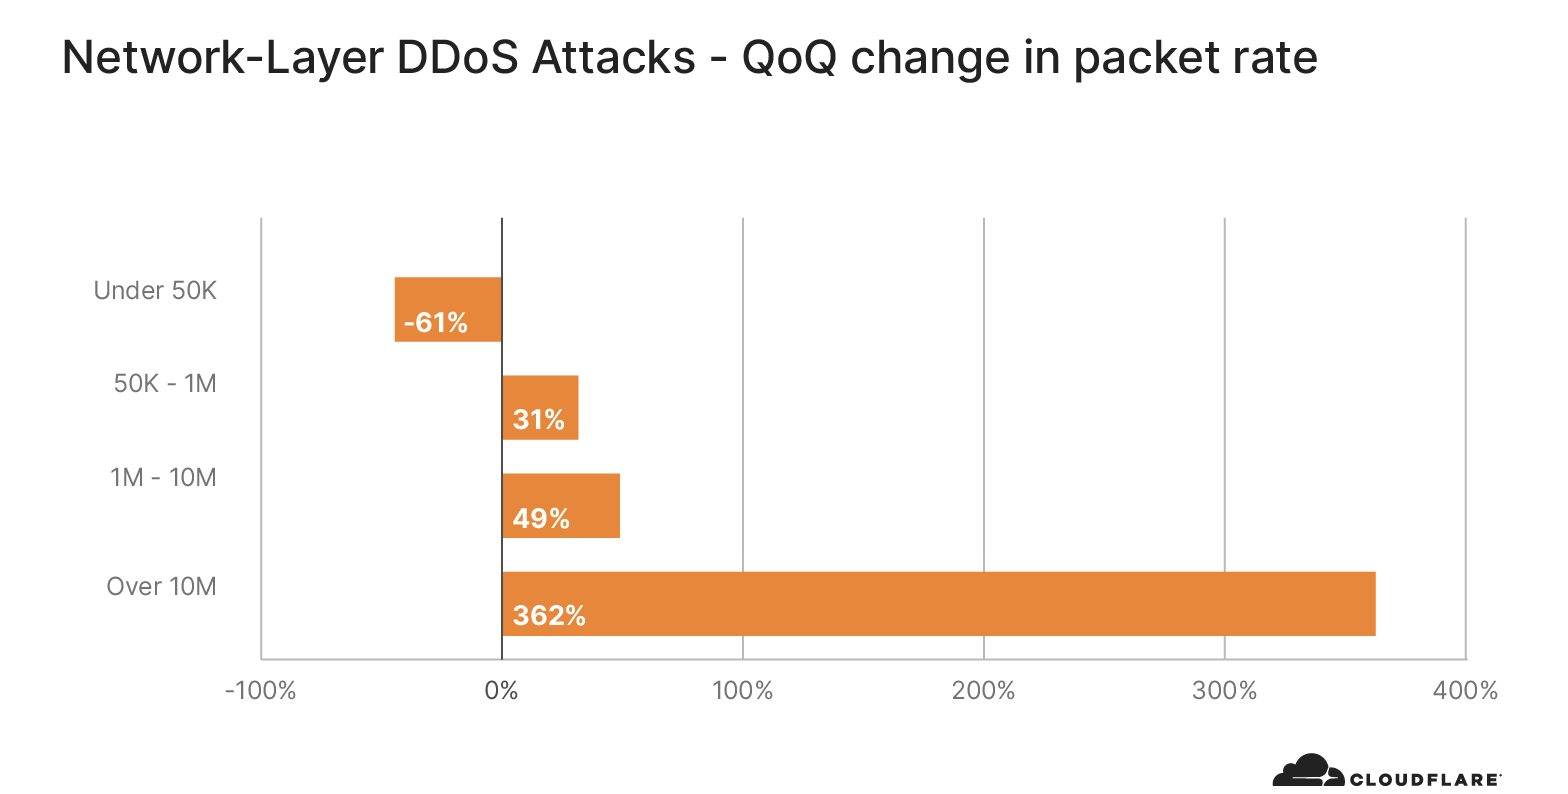
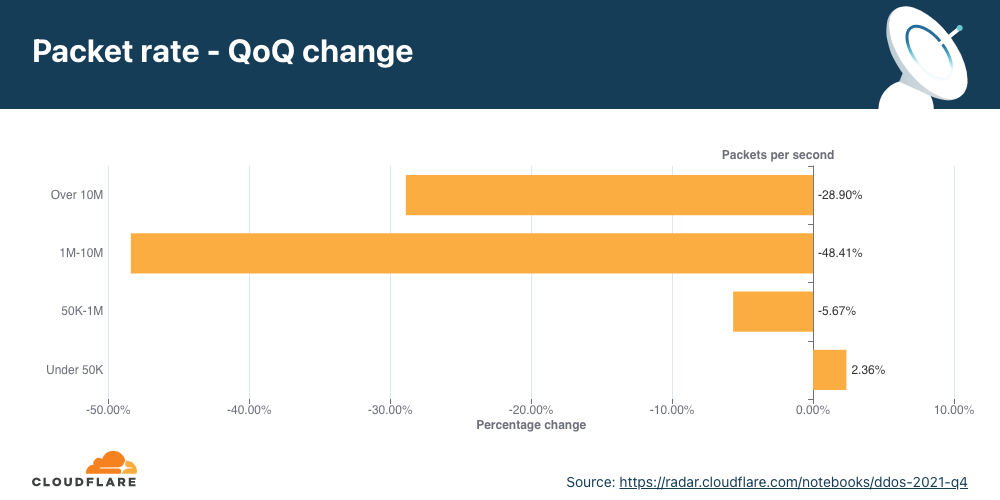
Distribution by packet rate
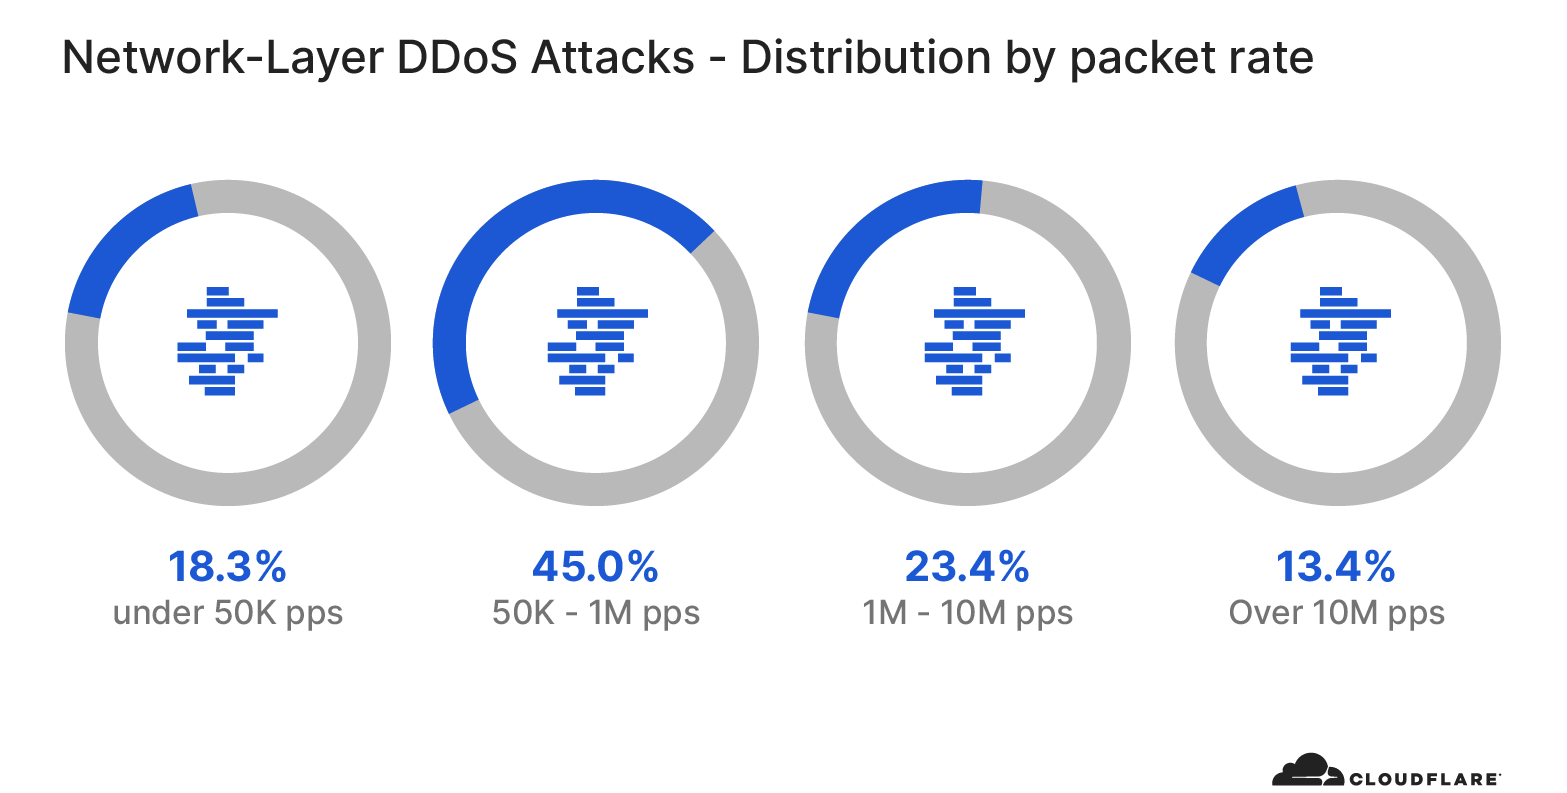
An interesting correlation Cloudflare has observed is that when the number of attacks increases, their size and duration decrease. In the first two-thirds of 2021, the number of attacks was relatively small, and correspondingly, their rates increased, e.g., in Q3 ’21, attacks ranging from 1-10 million packets per second (mpps) increased by 196%. In Q4 ’21, the number of attacks increased and Cloudflare observed a decrease in the size of attacks. 91% of all attacks peaked below 50,000 packets per second (pps) — easily sufficient to take down unprotected Internet properties.
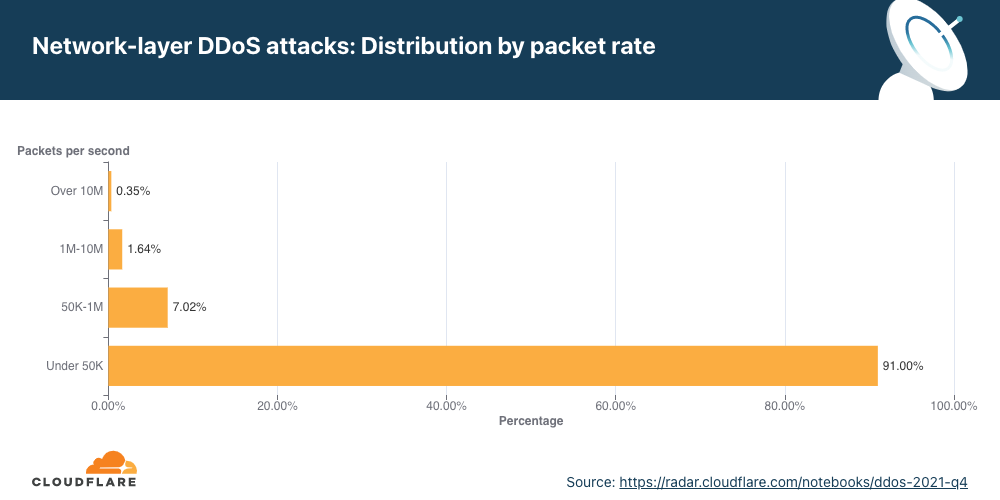
Larger attacks of over 1 mpps decreased by 48% to 28% QoQ, while attacks peaking below 50K pps increased by 2.36% QoQ.
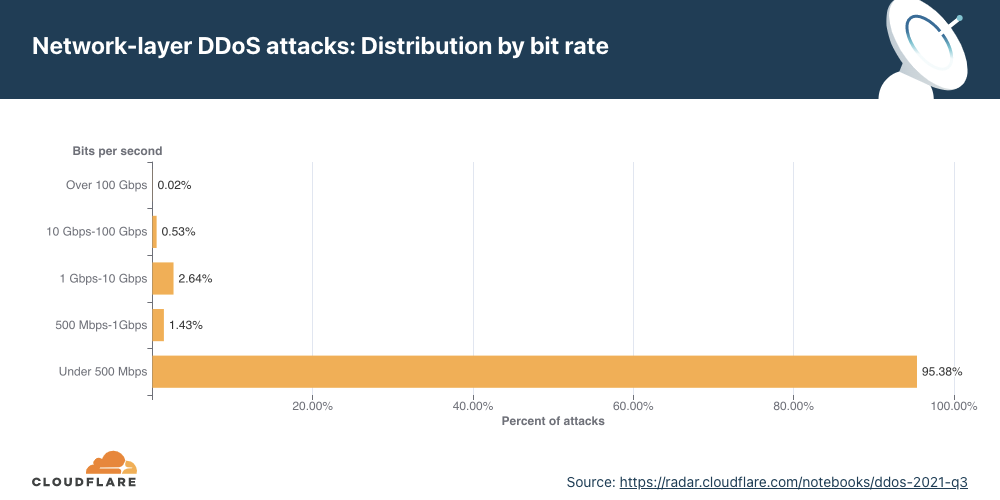
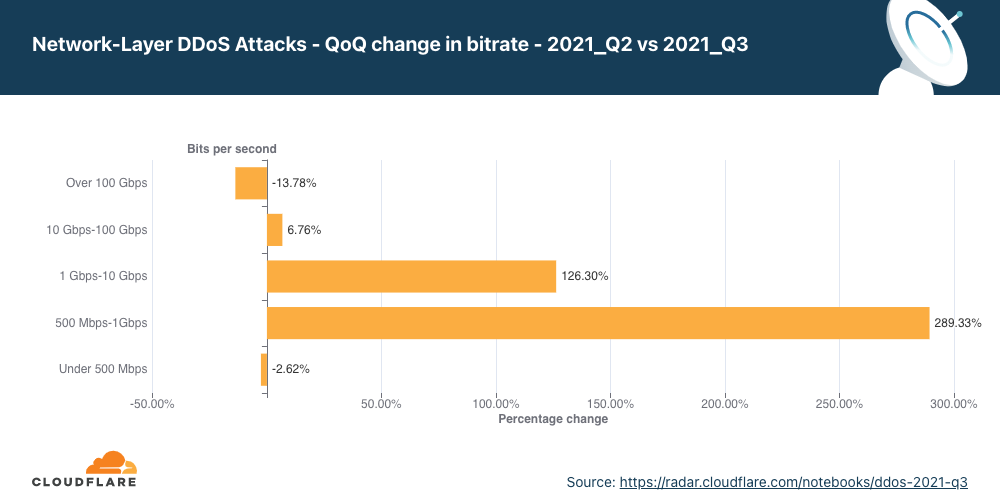
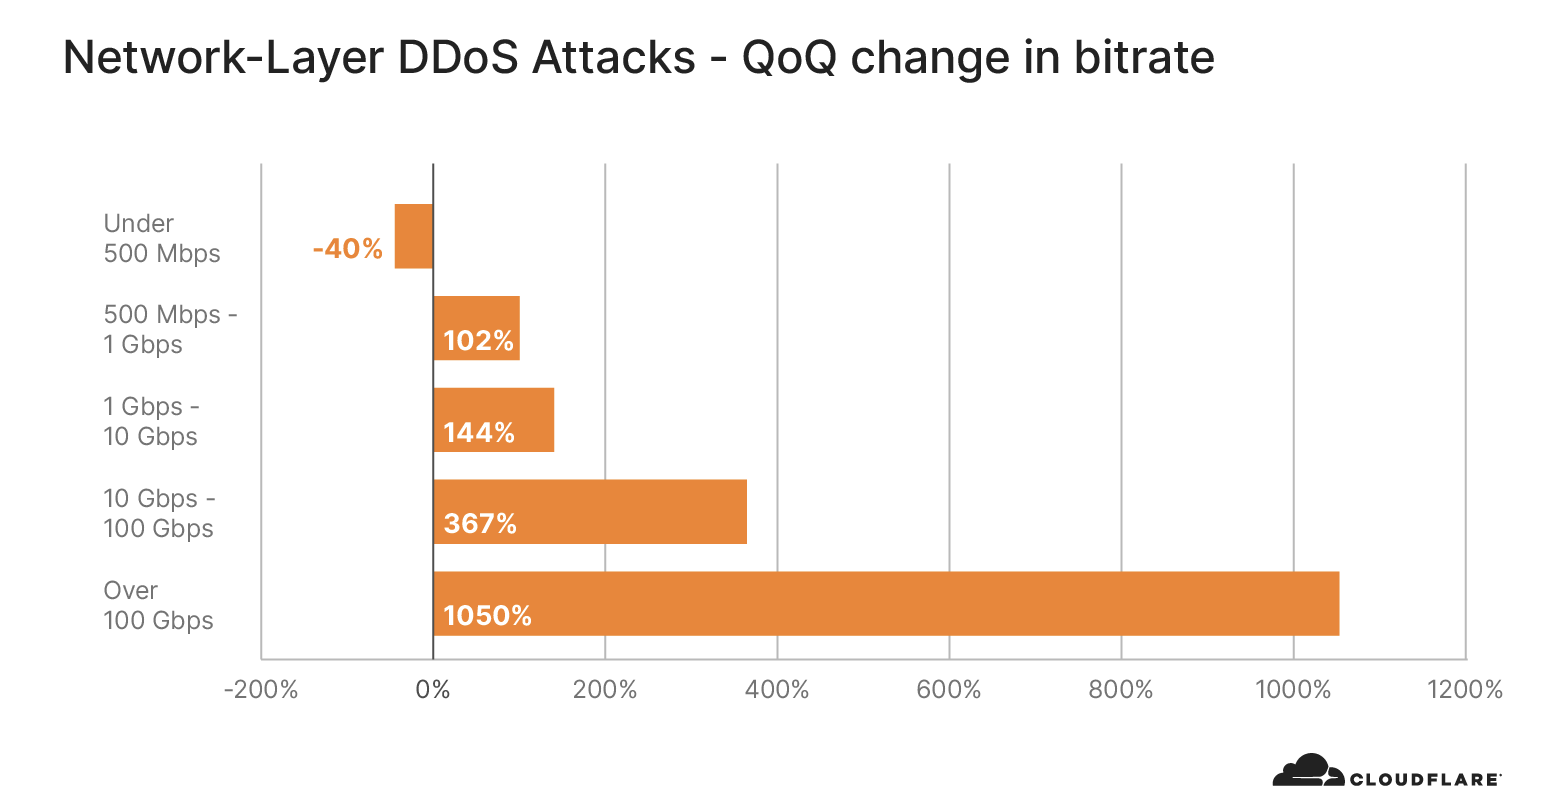
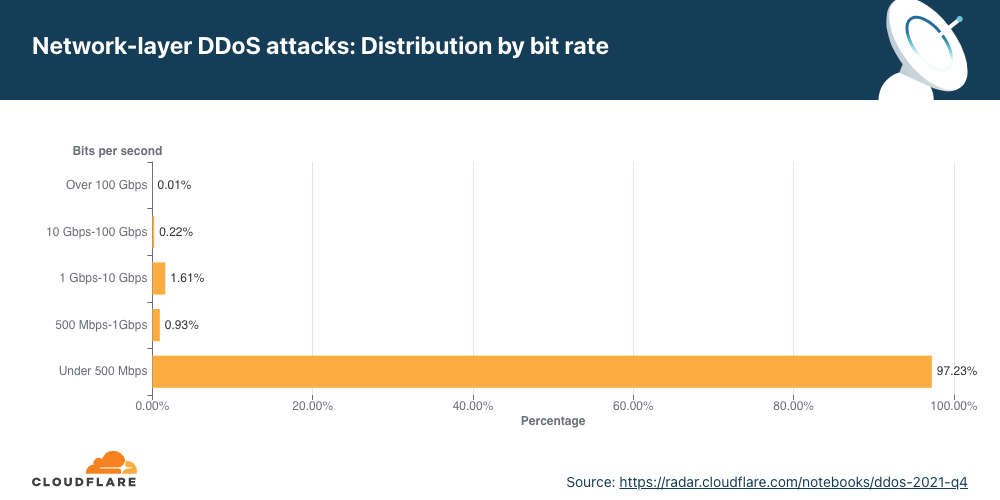
Distribution by bit rate
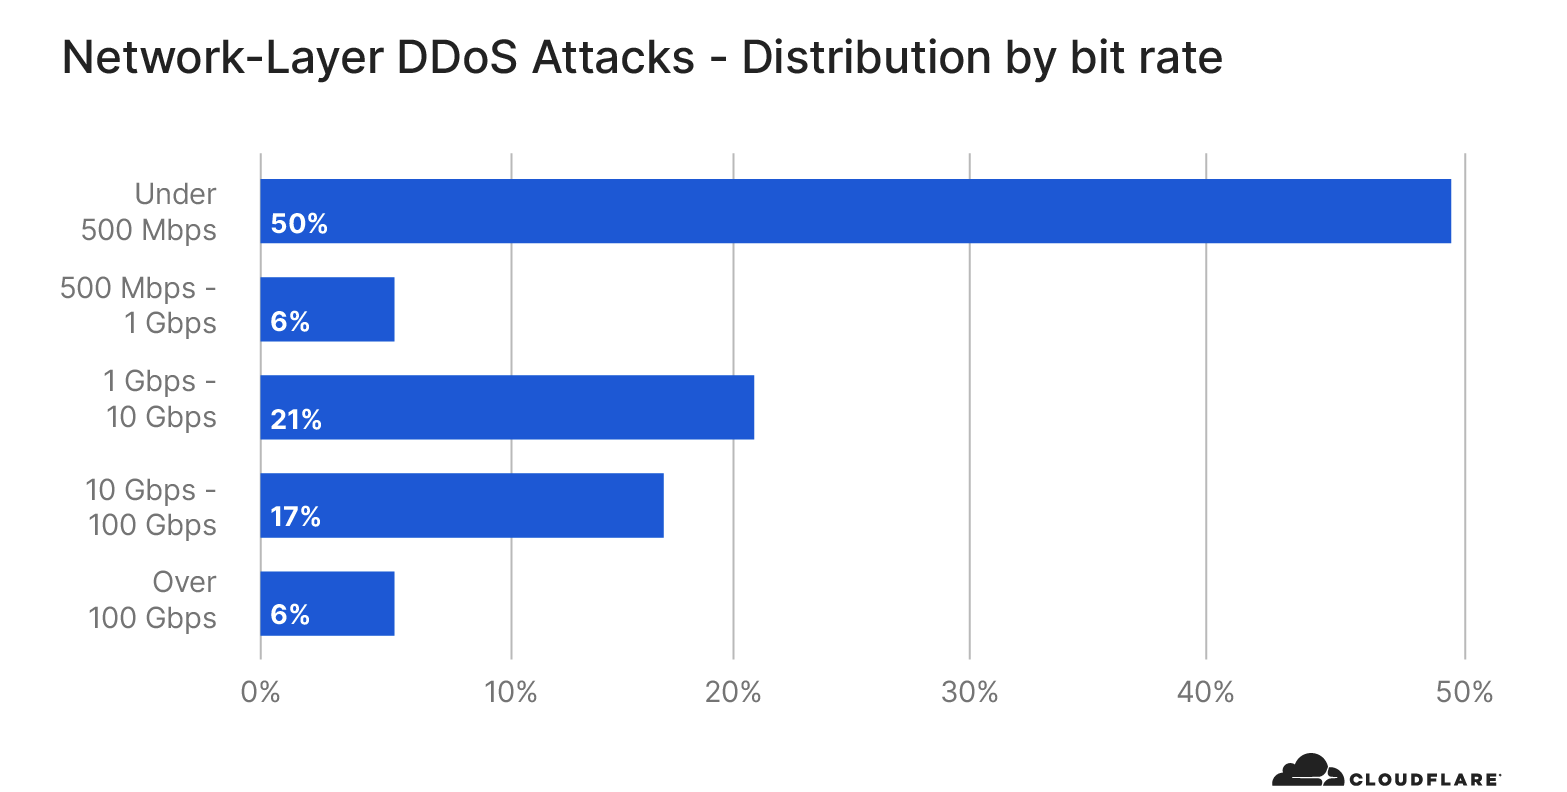
Similar to the trend observed in packet-intensive attacks, the amount of bit-intensive attacks shrunk as well. While attacks over 1 Tbps are becoming the norm, with the largest one we’ve ever seen peak just below 2 Tbps, the majority of attacks are still small and peaked below 500 Mbps (97.2%).
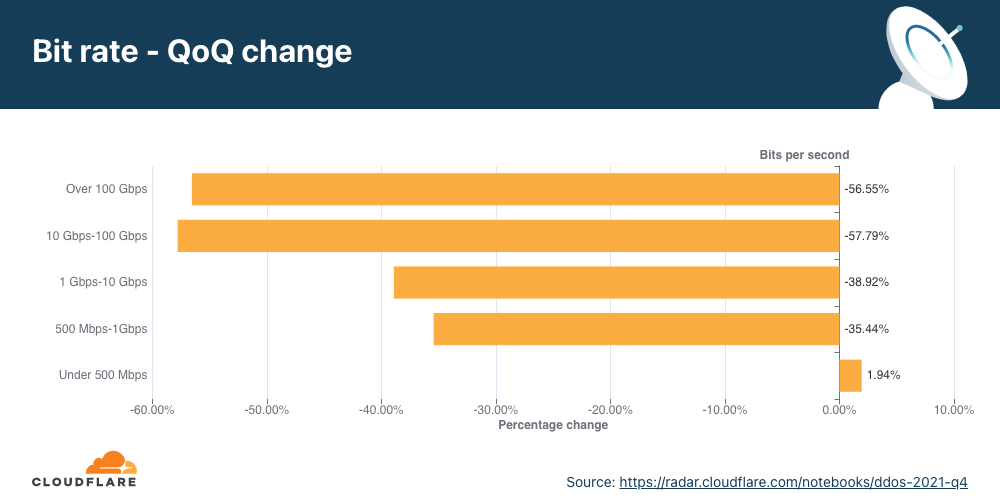
In Q4 ’21, larger attacks of all ranges above 500 Mbps saw massive decreases ranging from 35% to 57% for the larger 100+ Gbps attacks.
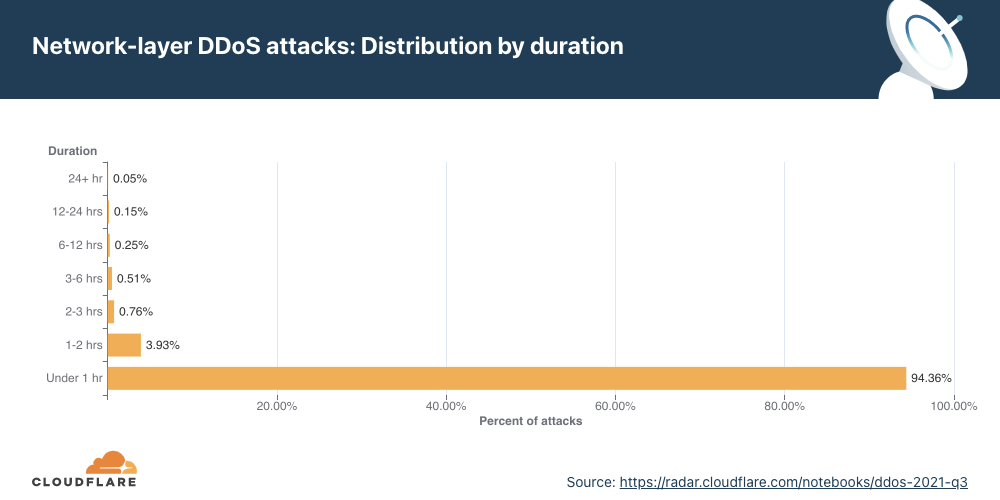
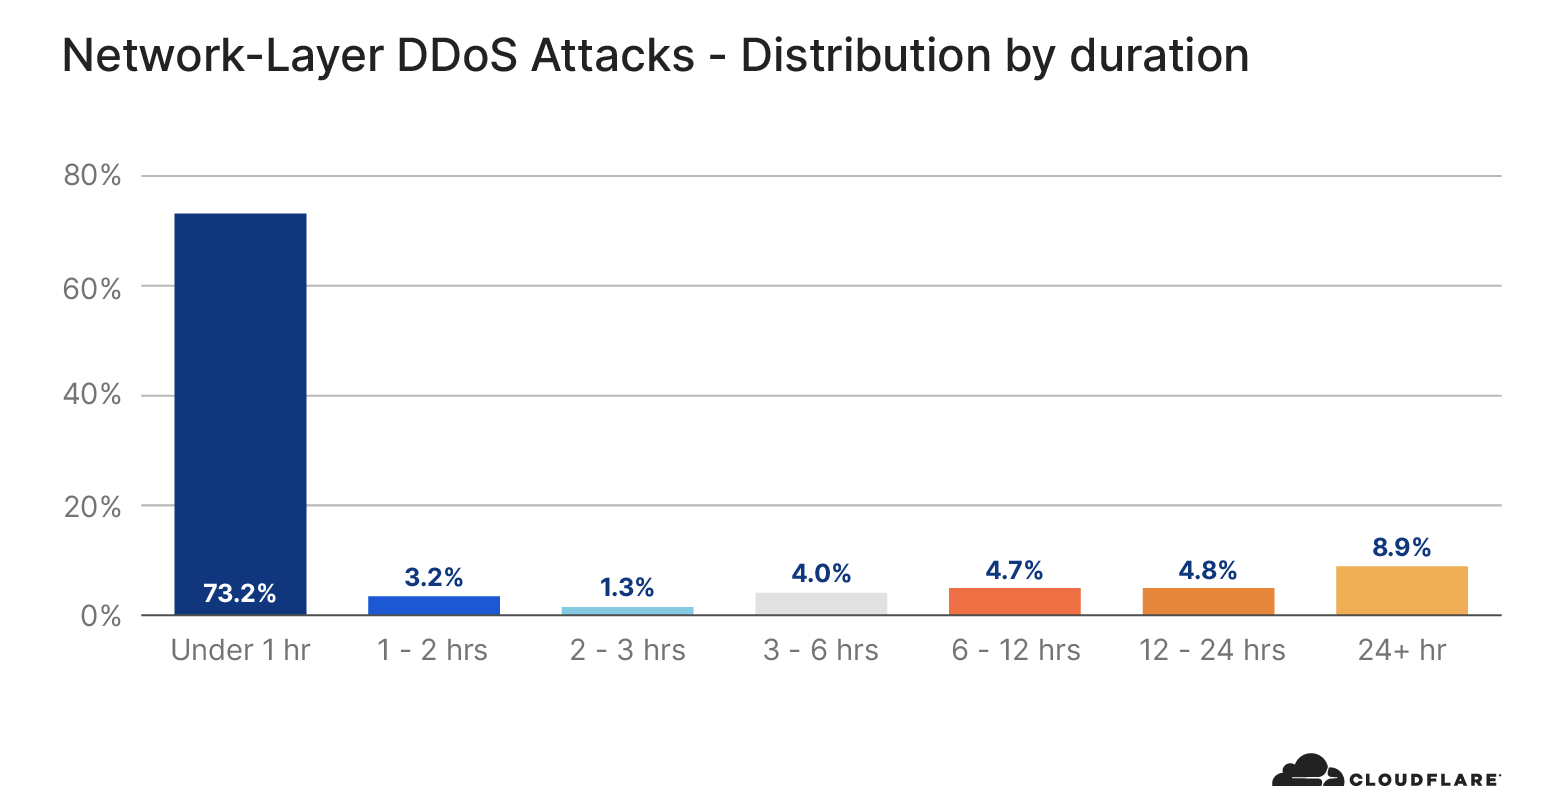
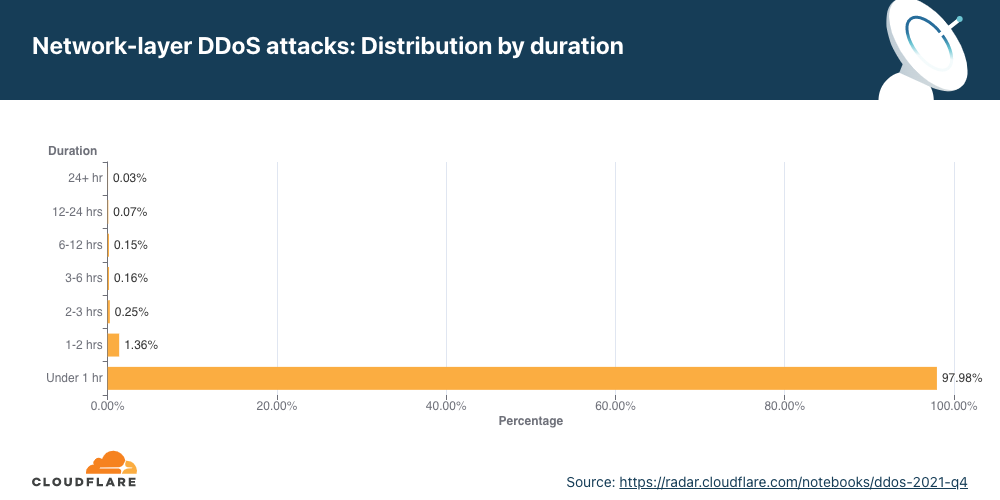
Network-layer DDoS attacks by duration
Most attacks remain under one hour in duration, reiterating the need for automated always-on DDoS mitigation solutions.
We measure the duration of an attack by recording the difference between when it is first detected by our systems as an attack and the last packet we see with that attack signature towards that specific target. In the last quarter of 2021, 98% of all network-layer attacks lasted less than one hour. This is very common as most of the attacks are short-lived. Even more so, a trend we’ve seen is that when the number of attacks increases, as in this quarter, their rate and duration decreases.
Short attacks can easily go undetected, especially burst attacks that, within seconds, bombard a target with a significant number of packets, bytes, or requests. In this case, DDoS protection services that rely on manual mitigation by security analysis have no chance in mitigating the attack in time. They can only learn from it in their post-attack analysis, then deploy a new rule that filters the attack fingerprint and hope to catch it next time. Similarly, using an “on-demand” service, where the security team will redirect traffic to a DDoS provider during the attack, is also inefficient because the attack will already be over before the traffic routes to the on-demand DDoS provider.
It’s recommended that companies use automated, always-on DDoS protection services that analyze traffic and apply real-time fingerprinting fast enough to block short-lived attacks.
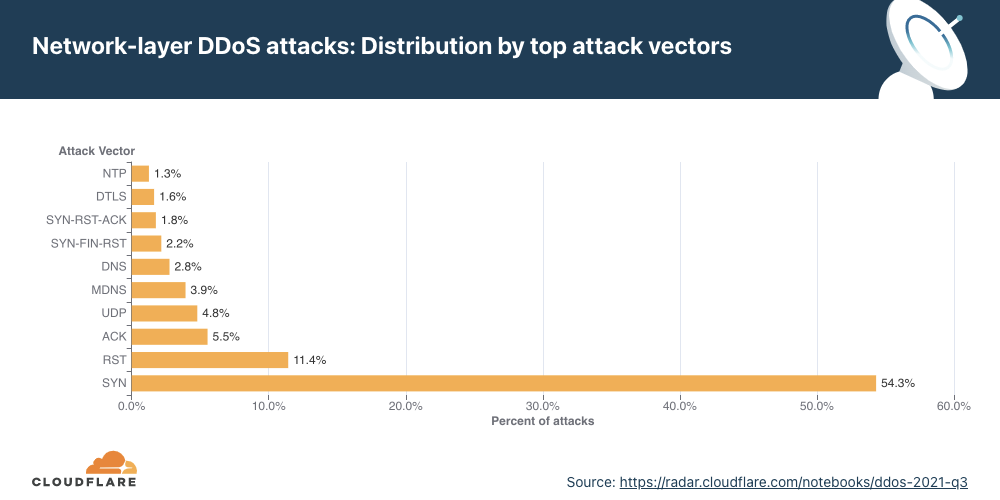
Attack vectors
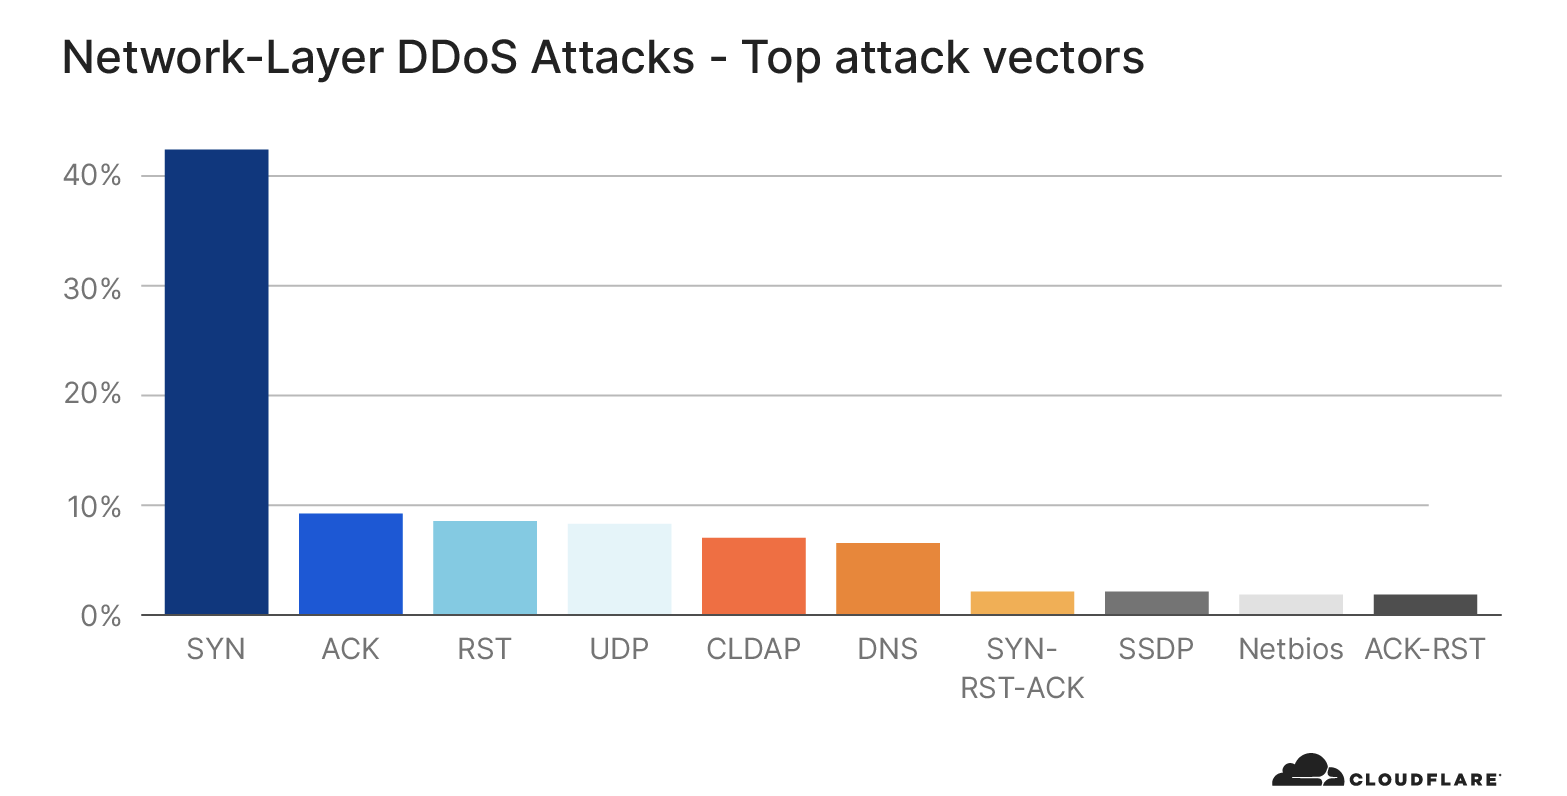
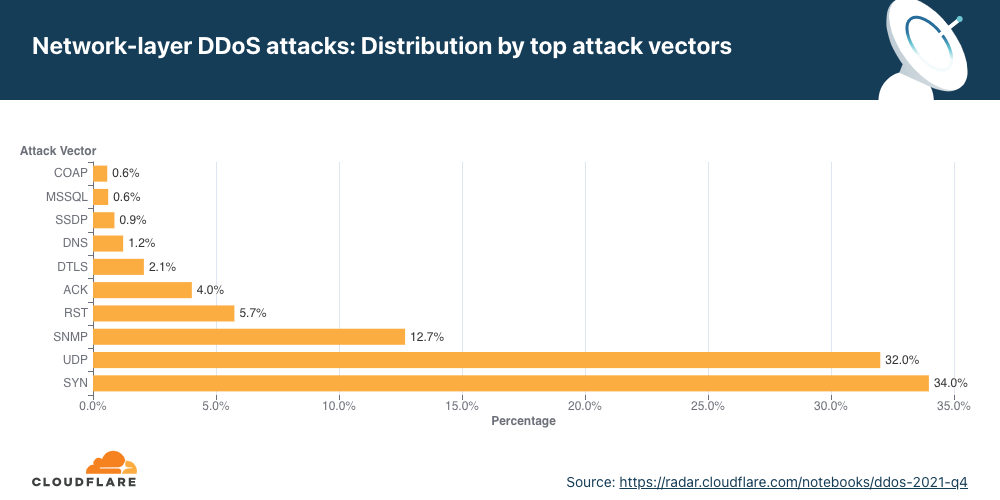
SYN floods remain attackers’ favorite method of attack, while attacks over SNMP saw a massive surge of almost 5,800% QoQ.
An attack vector is a term used to describe the method that the attacker uses to launch their DDoS attack, i.e., the IP protocol, packet attributes such as TCP flags, flooding method, and other criteria.
For the first time in 2021, the percentage of SYN flood attacks significantly decreased. Throughout 2021, SYN floods accounted for 54% of all network-layer attacks on average. While still grabbing first place as the most frequent vector, its share dropped by 38% QoQ to 34%.
However, it was a close-run for SYN attacks and UDP attacks. A UDP flood is a type of denial-of-service attack in which a large number of User Datagram Protocol (UDP) packets are sent to a targeted server with the aim of overwhelming that device’s ability to process and respond. Oftentimes, the firewall protecting the targeted server can also become exhausted as a result of UDP flooding, resulting in a denial-of-service to legitimate traffic. Attacks over UDP jumped from fourth place in Q3 ’21 to second place in Q4 ’21, with a share of 32% of all network-layer attacks — a 1,198% increase in QoQ.
In third place came the SNMP underdog that made a massive leap with its first time 2021 appearance in the top attack vectors.
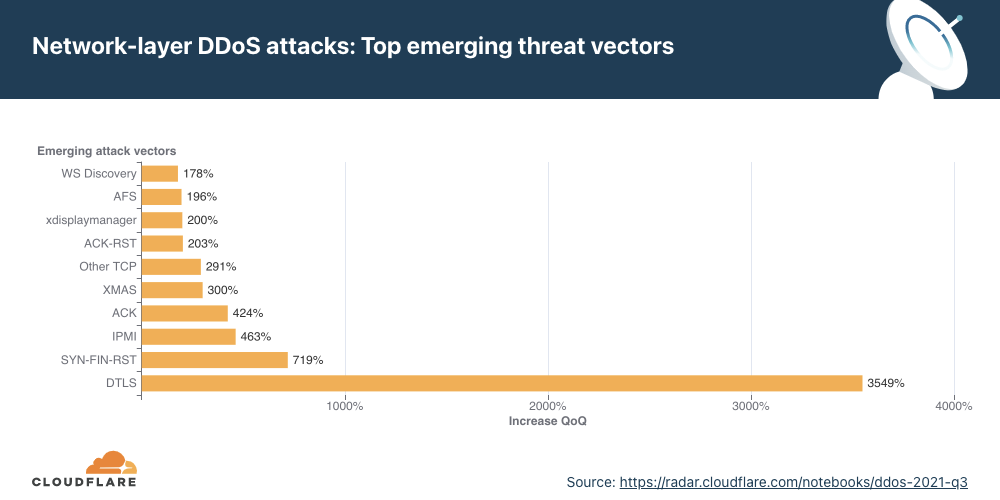
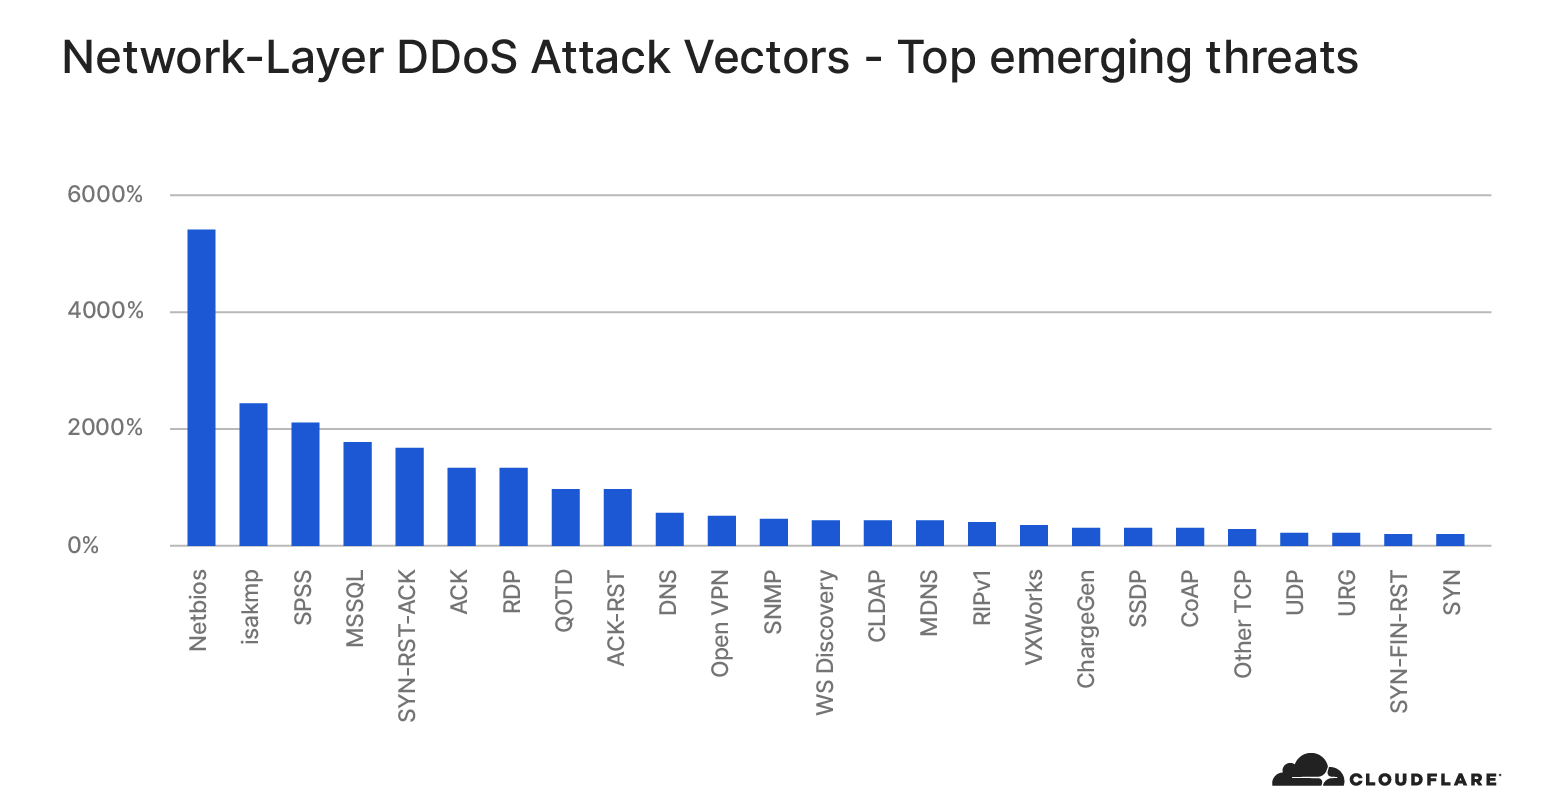
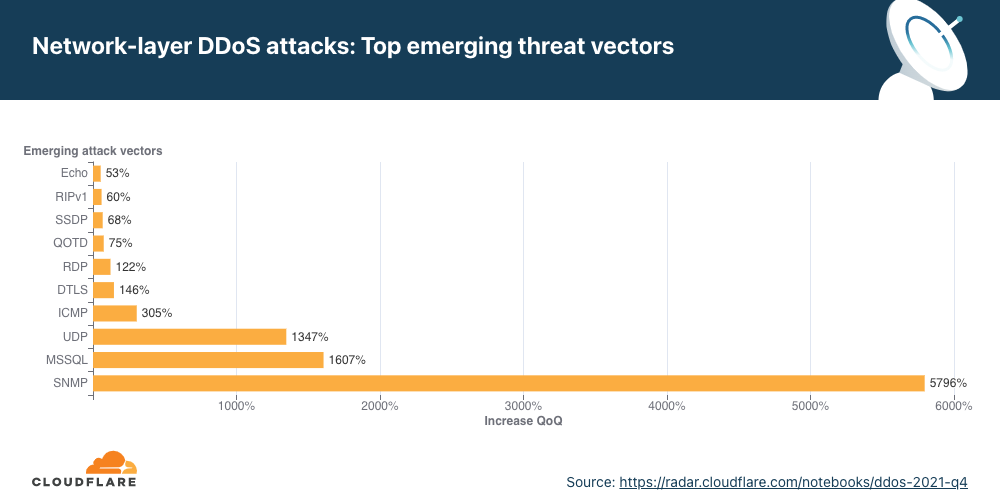
Emerging threats
When we look at emerging attack vectors — which helps us understand what new vectors attackers are deploying to launch attacks — we observe a massive spike in SNMP, MSSQL, and generic UDP-based DDoS attacks.
Both SNMP and MSSQL attacks are used to reflect and amplify traffic on the target by spoofing the target’s IP address as the source IP in the packets used to trigger the attack.
Simple Network Management Protocol (SNMP) is a UDP-based protocol that is often used to discover and manage network devices such as printers, switches, routers, and firewalls of a home or enterprise network on UDP well-known port 161. In an SNMP reflection attack, the attacker sends out a large number of SNMP queries while spoofing the source IP address in the packet as the targets to devices on the network that, in turn, reply to that target’s address. Numerous responses from the devices on the network results in the target network being DDoSed.
Similar to the SNMP amplification attack, the Microsoft SQL (MSSQL) attack is based on a technique that abuses the Microsoft SQL Server Resolution Protocol for the purpose of launching a reflection-based DDoS attack. The attack occurs when a Microsoft SQL Server responds to a client query or request, attempting to exploit the Microsoft SQL Server Resolution Protocol (MC-SQLR), listening on UDP port 1434.
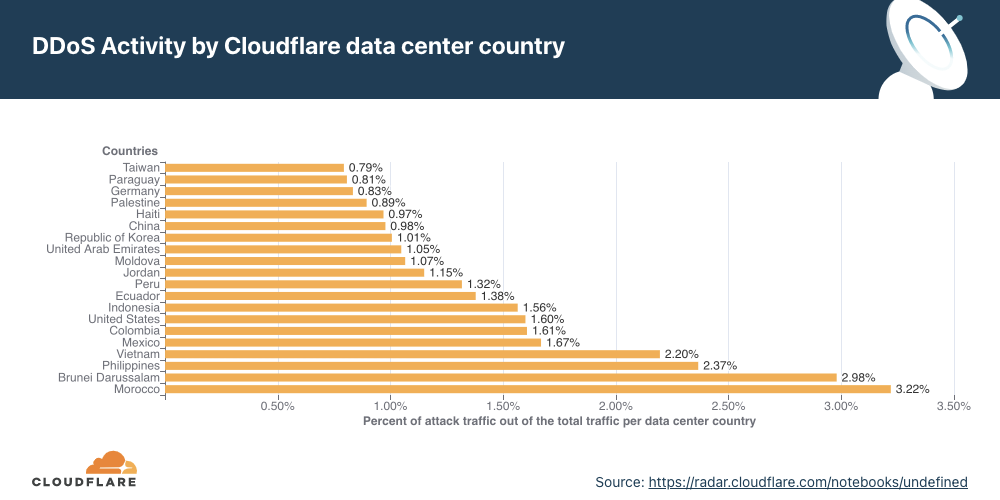
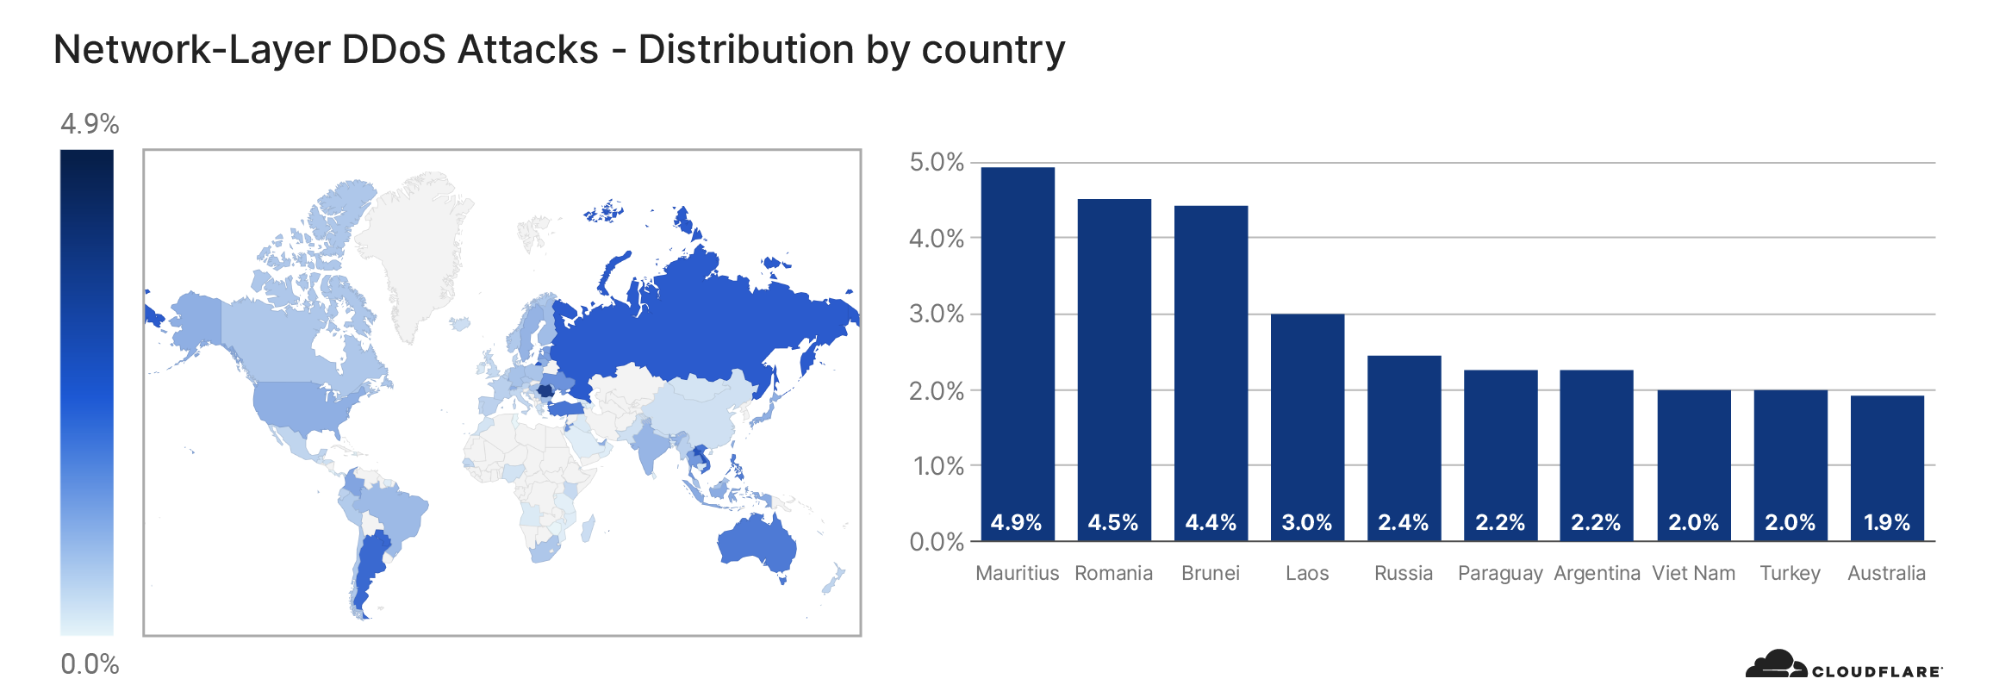
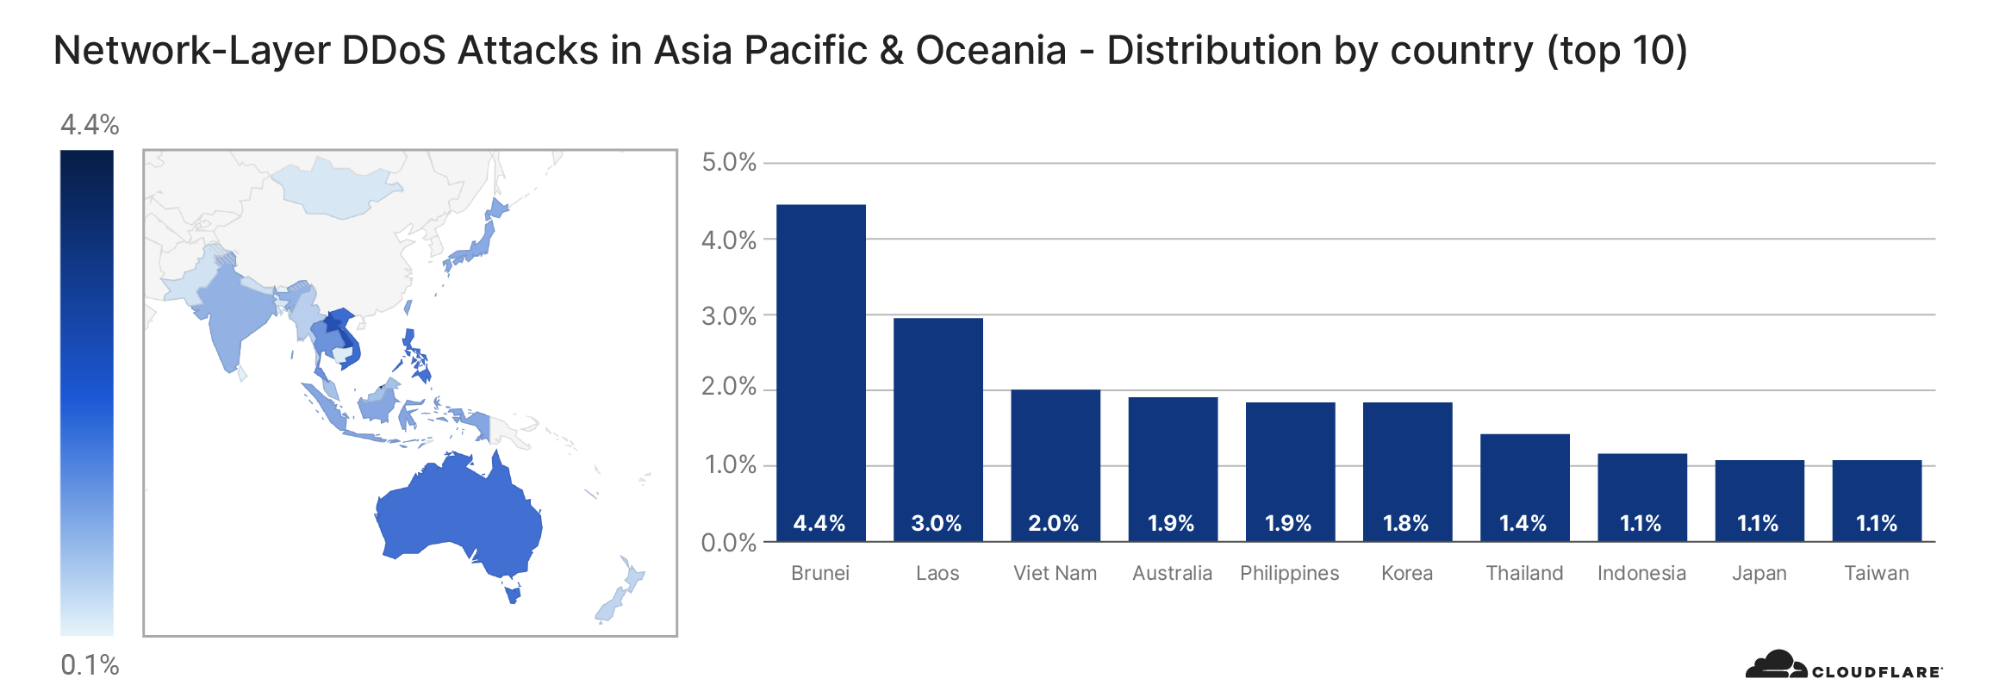
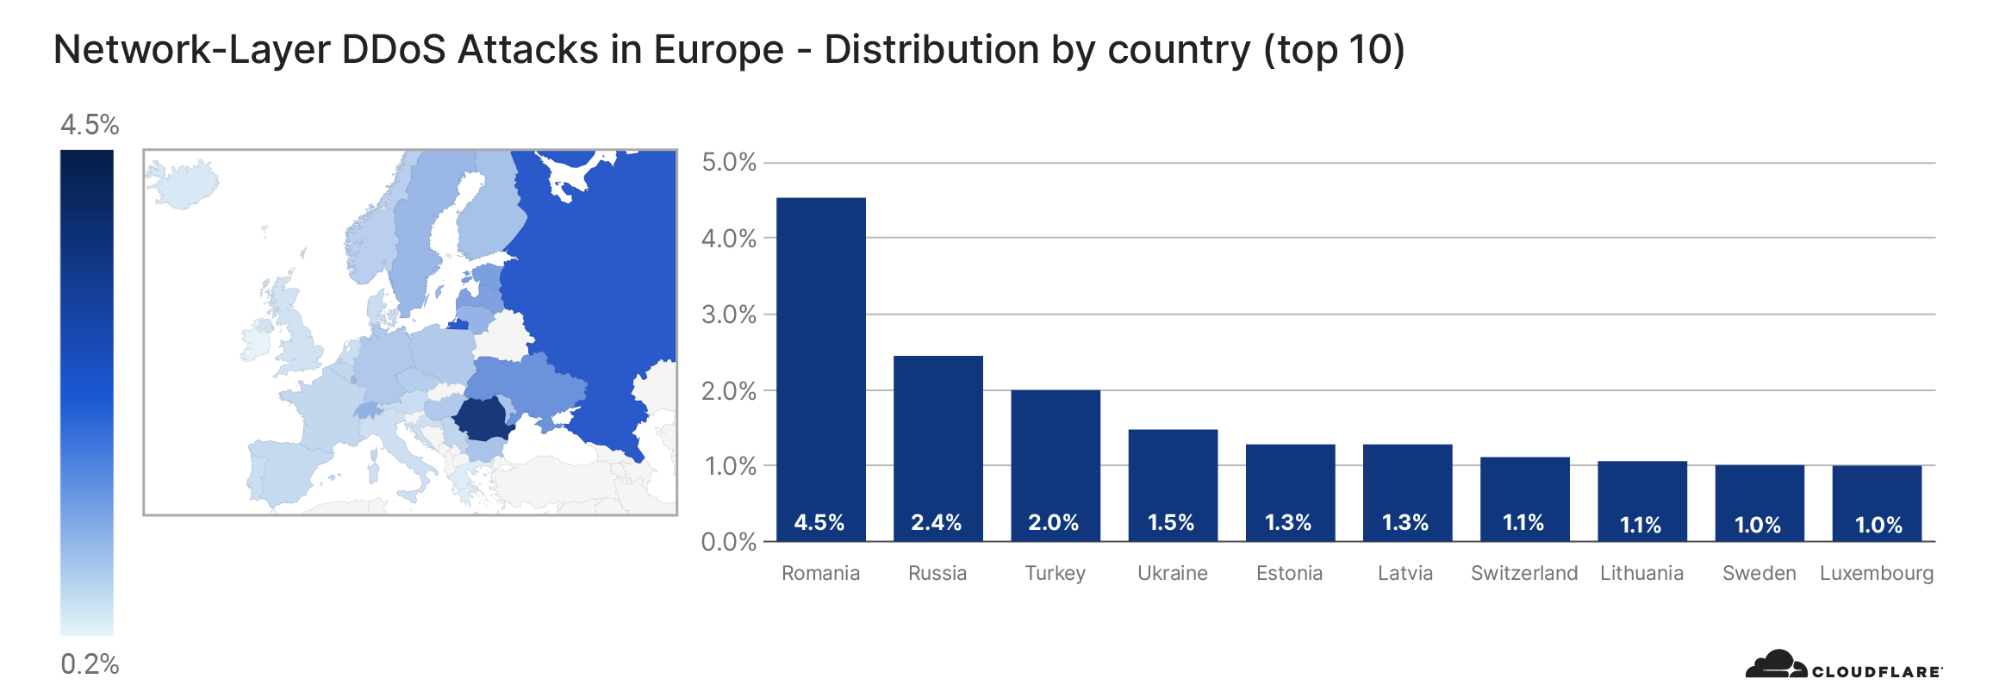
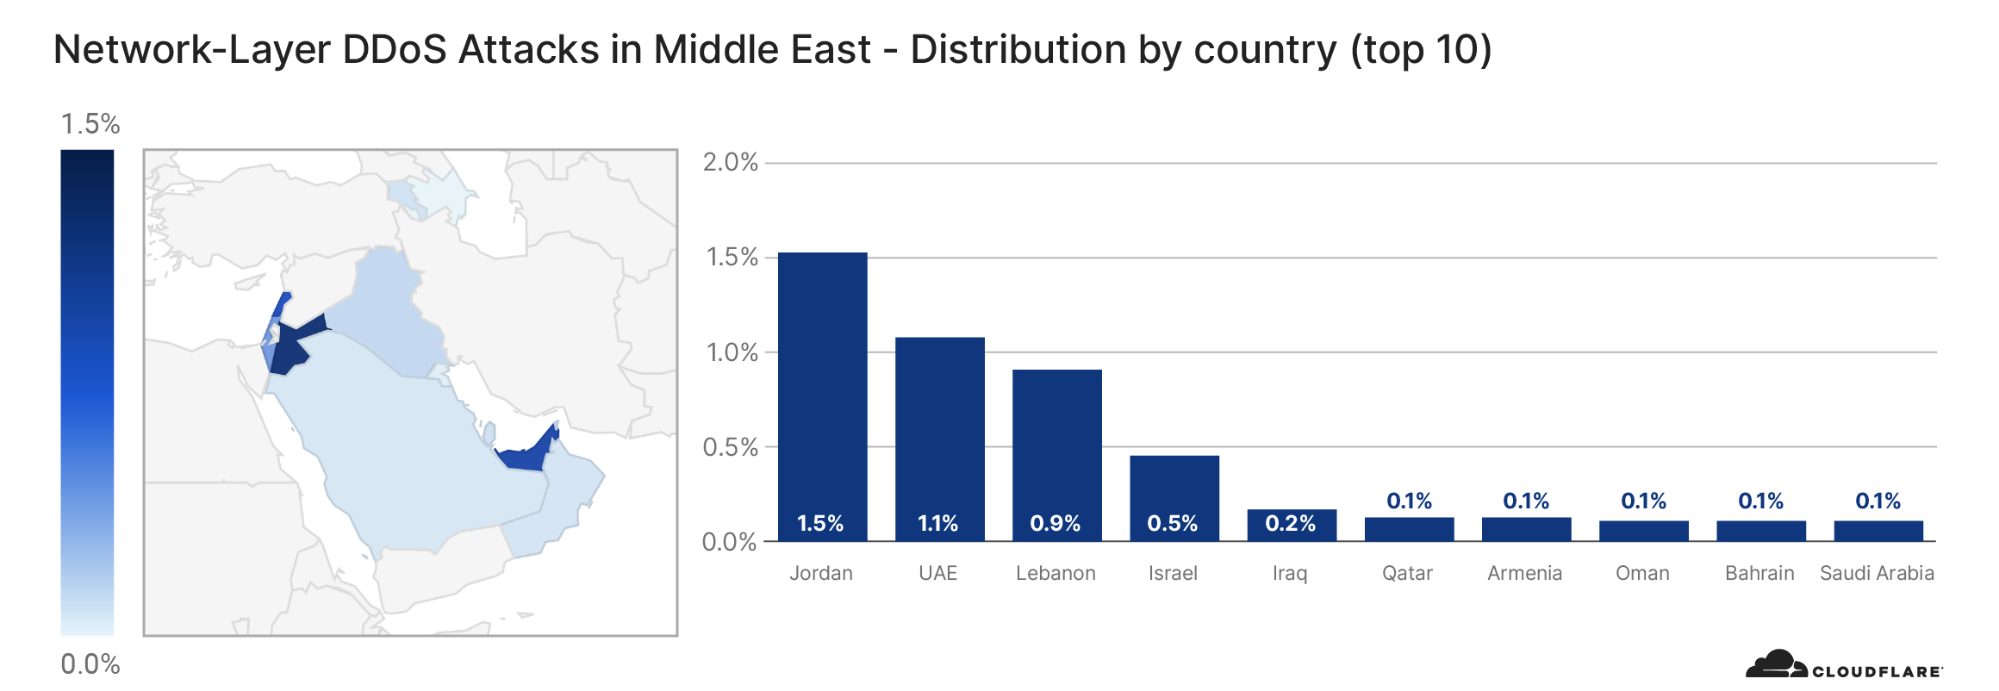
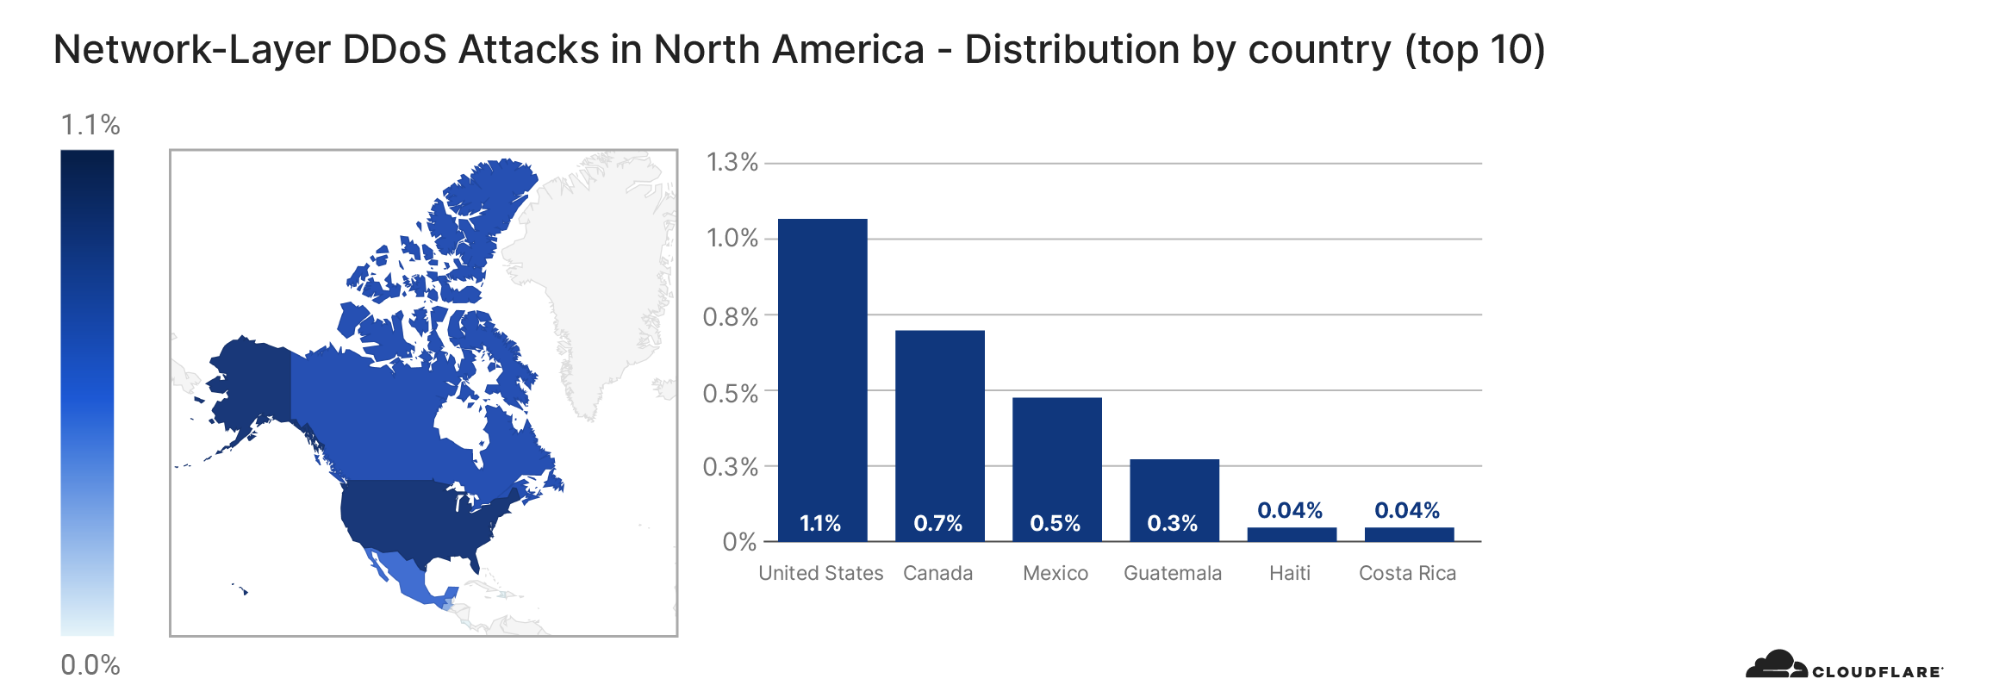
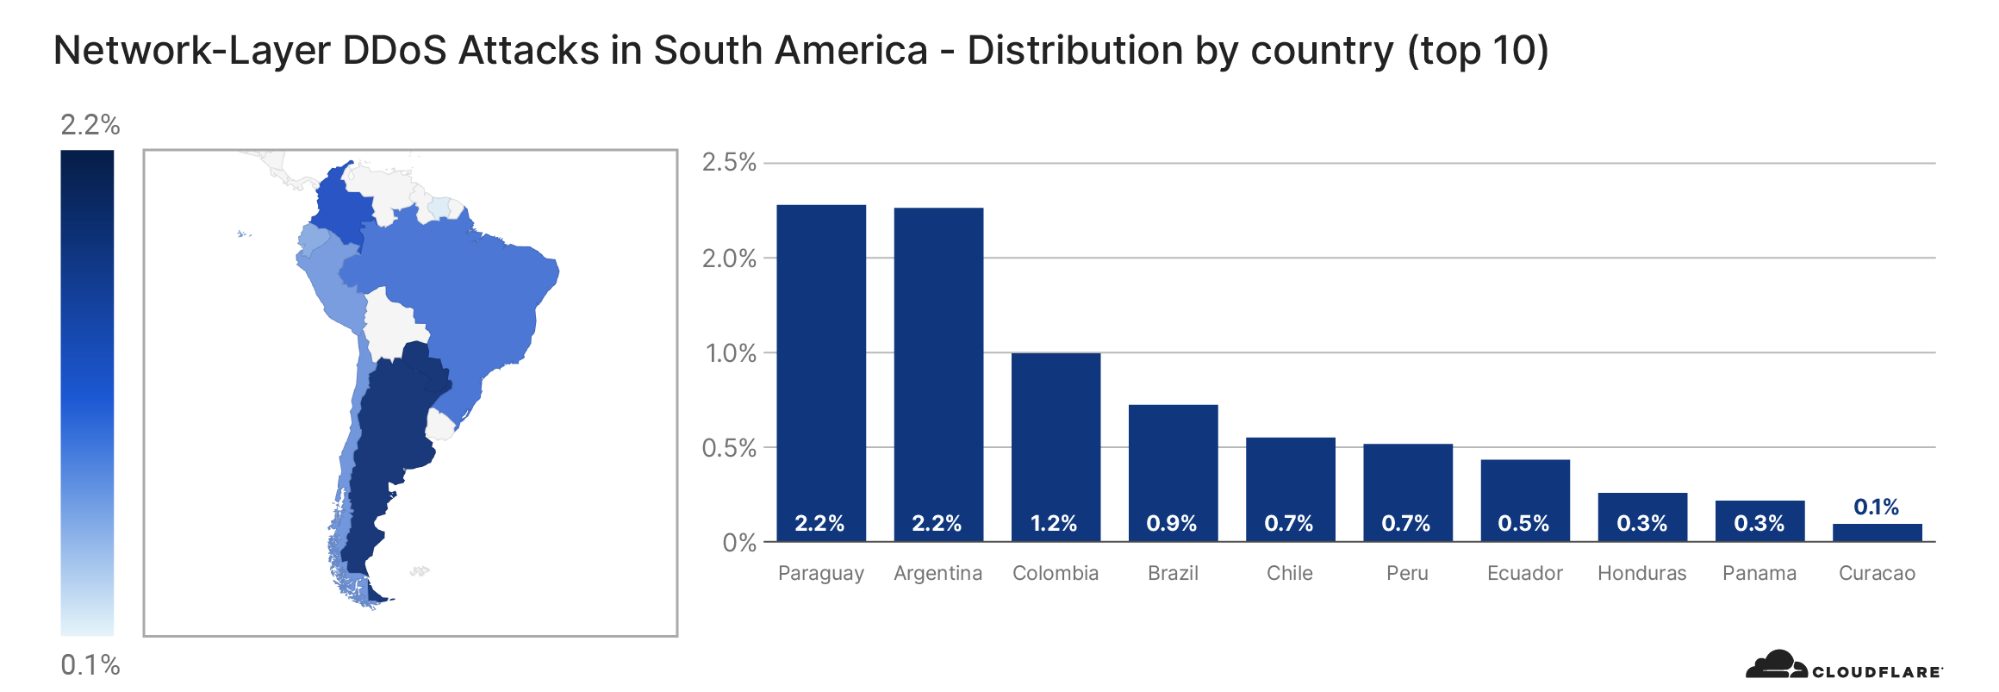
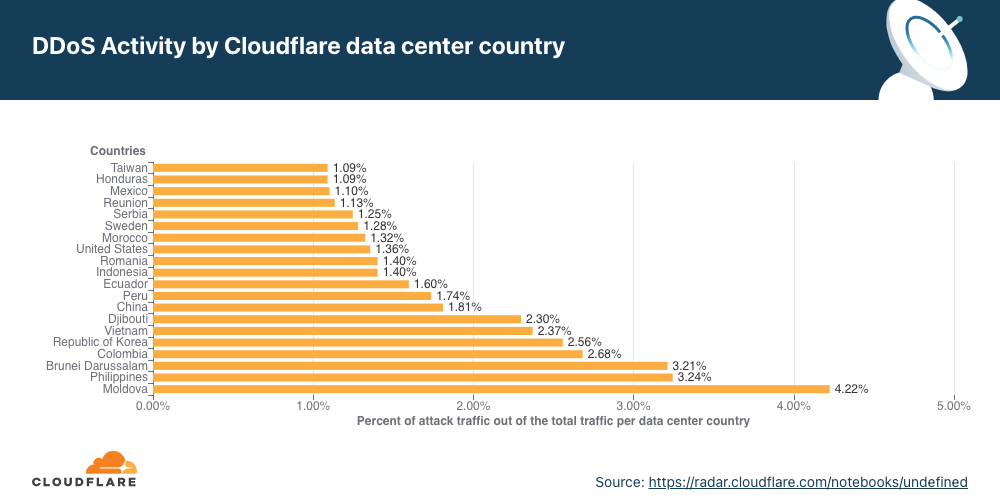
Network-layer DDoS attacks by country
Attacks originating from Moldova quadrupled, making it the country with the highest percentage of network-layer DDoS activity.
When analyzing network-layer DDoS attacks, we bucket the traffic by the Cloudflare edge data center locations where the traffic was ingested, and not by the source IP. The reason for this is that, when attackers launch network-layer attacks, they can spoof the source IP address in order to obfuscate the attack source and introduce randomness into the attack properties, which can make it harder for simple DDoS protection systems to block the attack. Hence, if we were to derive the source country based on a spoofed source IP, we would get a spoofed country.
Cloudflare is able to overcome the challenges of spoofed IPs by displaying the attack data by the location of the Cloudflare data center in which the attack was observed. We are able to achieve geographical accuracy in our report because we have data centers in over 250 cities around the world.
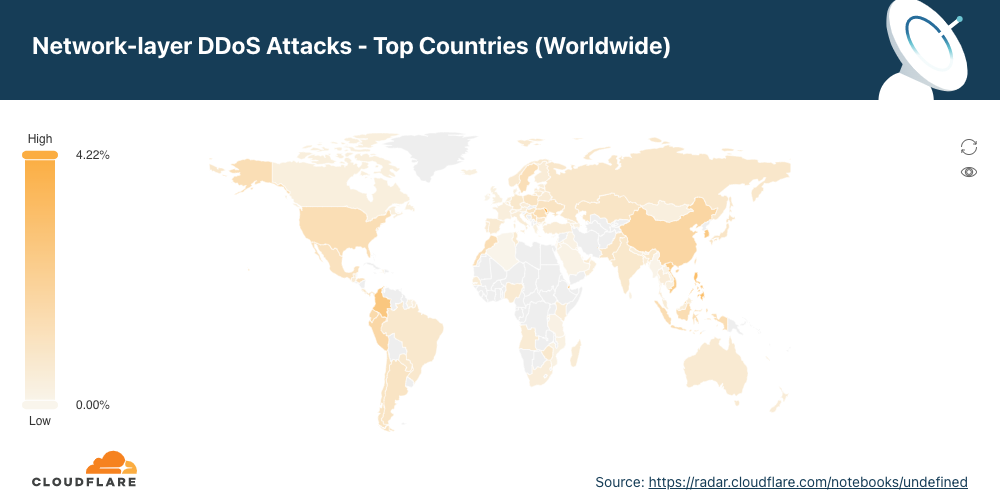
To view all regions and countries, check out the interactive map.
Summary
Cloudflare’s mission is to help build a better Internet. A better Internet is one that is more secure, faster, and reliable for everyone — even in the face of DDoS attacks. As part of our mission, since 2017, we’ve been providing unmetered and unlimited DDoS protection for free to all of our customers. Over the years, it has become increasingly easier for attackers to launch DDoS attacks. To counter the attacker’s advantage, we want to make sure that it is also easy and free for organizations of all sizes to protect themselves against DDoS attacks of all types.
Not using Cloudflare yet? Start now.