Tag Archives: Attacks

Safe in the sandbox: security hardening for Cloudflare Workers

Post Syndicated from Erik Corry original https://blog.cloudflare.com/safe-in-the-sandbox-security-hardening-for-cloudflare-workers/

As a serverless cloud provider, we run your code on our globally distributed infrastructure. Being able to run customer code on our network means that anyone can take advantage of our global presence and low latency. Workers isn’t just efficient though, we also make it simple for our users. In short: You write code. We handle the rest.

Part of ‘handling the rest’ is making Workers as secure as possible. We have previously written about our security architecture. Making Workers secure is an interesting problem because the whole point of Workers is that we are running third party code on our hardware. This is one of the hardest security problems there is: any attacker has the full power available of a programming language running on the victim’s system when they are crafting their attacks.

This is why we are constantly updating and improving the Workers Runtime to take advantage of the latest improvements in both hardware and software. This post shares some of the latest work we have been doing to keep Workers secure.

Some background first: Workers is built around the V8 JavaScript runtime, originally developed for Chromium-based browsers like Chrome. This gives us a head start, because V8 was forged in an adversarial environment, where it has always been under intense attack and scrutiny. Like Workers, Chromium is built to run adversarial code safely. That’s why V8 is constantly being tested against the best fuzzers and sanitizers, and over the years, it has been hardened with new technologies like Oilpan/cppgc and improved static analysis.

We use V8 in a slightly different way, though, so we will be describing in this post how we have been making some changes to V8 to improve security in our use case.

Hardware-assisted security improvements from Memory Protection Keys

Modern CPUs from Intel, AMD, and ARM have support for memory protection keys, sometimes called PKU, Protection Keys for Userspace. This is a great security feature which increases the power of virtual memory and memory protection.

Traditionally, the memory protection features of the CPU in your PC or phone were mainly used to protect the kernel and to protect different processes from each other. Within each process, all threads had access to the same memory. Memory protection keys allow us to prevent specific threads from accessing memory regions they shouldn’t have access to.

V8 already uses memory protection keys for the JIT compilers. The JIT compilers for a language like JavaScript generate optimized, specialized versions of your code as it runs. Typically, the compiler is running on its own thread, and needs to be able to write data to the code area in order to install its optimized code. However, the compiler thread doesn’t need to be able to run this code. The regular execution thread, on the other hand, needs to be able to run, but not modify, the optimized code. Memory protection keys offer a way to give each thread the permissions it needs, but no more. And the V8 team in the Chromium project certainly aren’t standing still. They describe some of their future plans for memory protection keys here.

In Workers, we have some different requirements than Chromium. The security architecture for Workers uses V8 isolates to separate different scripts that are running on our servers. (In addition, we have extra mitigations to harden the system against Spectre attacks). If V8 is working as intended, this should be enough, but we believe in defense in depth: multiple, overlapping layers of security controls.

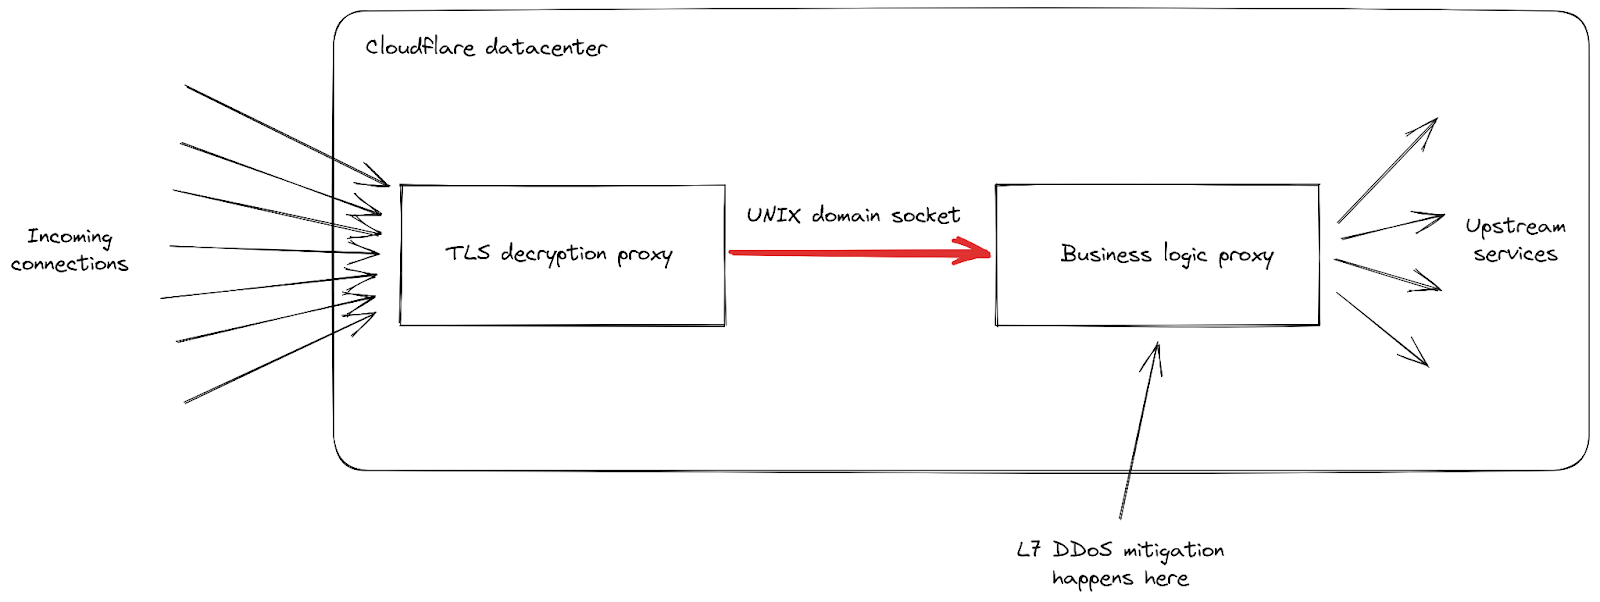
That’s why we have deployed internal modifications to V8 to use memory protection keys to isolate the isolates from each other. There are up to 15 different keys available on a modern x64 CPU and a few are used for other purposes in V8, so we have about 12 to work with. We give each isolate a random key which is used to protect its V8 heap data, the memory area containing the JavaScript objects a script creates as it runs. This means security bugs that might previously have allowed an attacker to read data from a different isolate would now hit a hardware trap in 92% of cases. (Assuming 12 keys, 92% is about 11/12.)


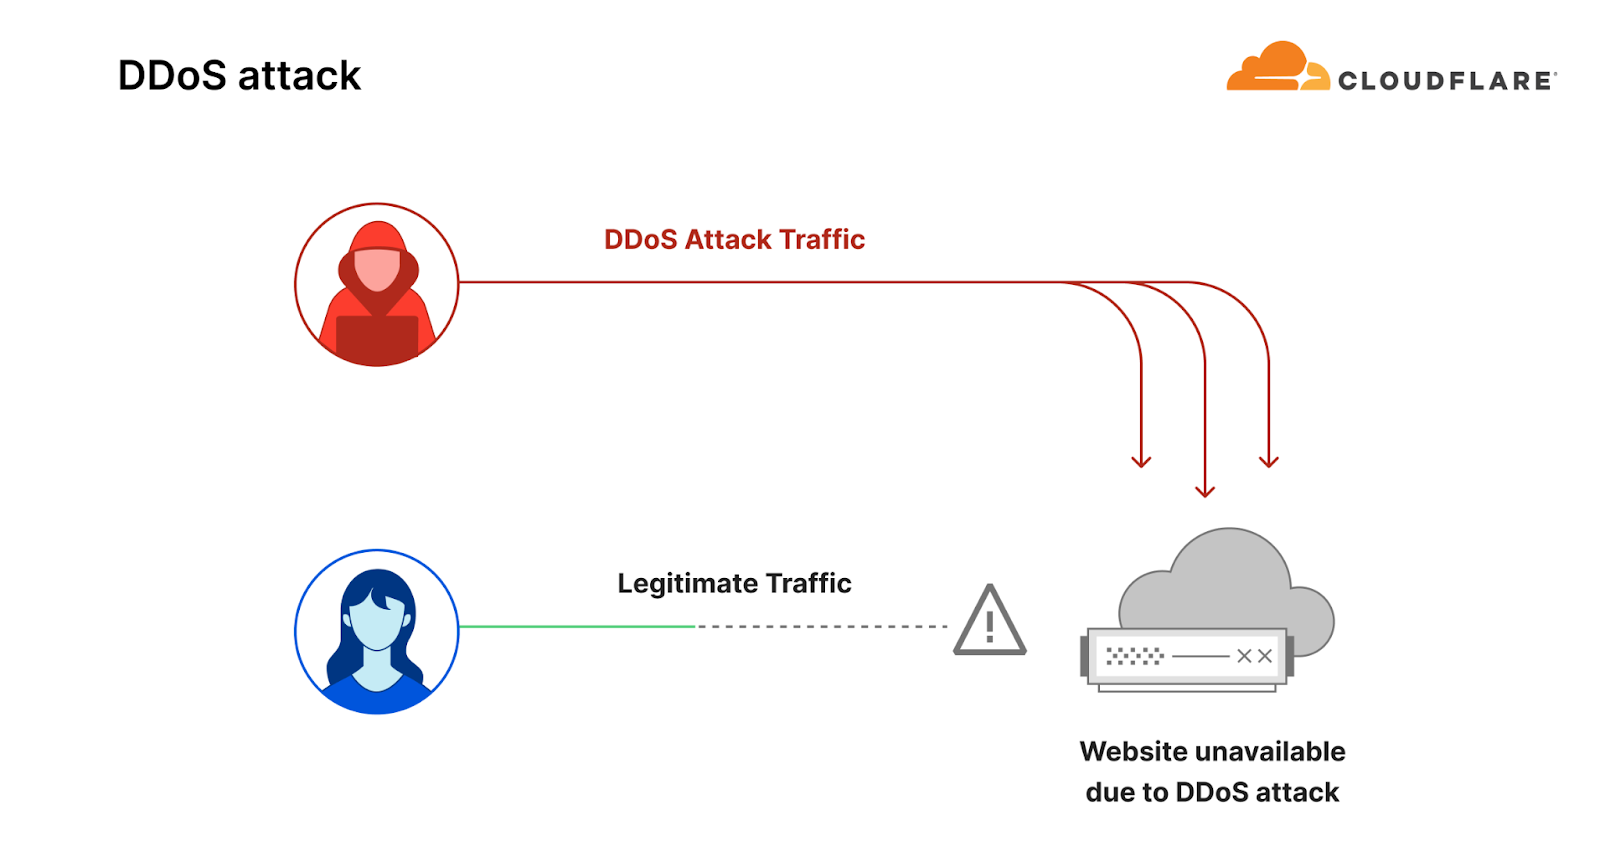
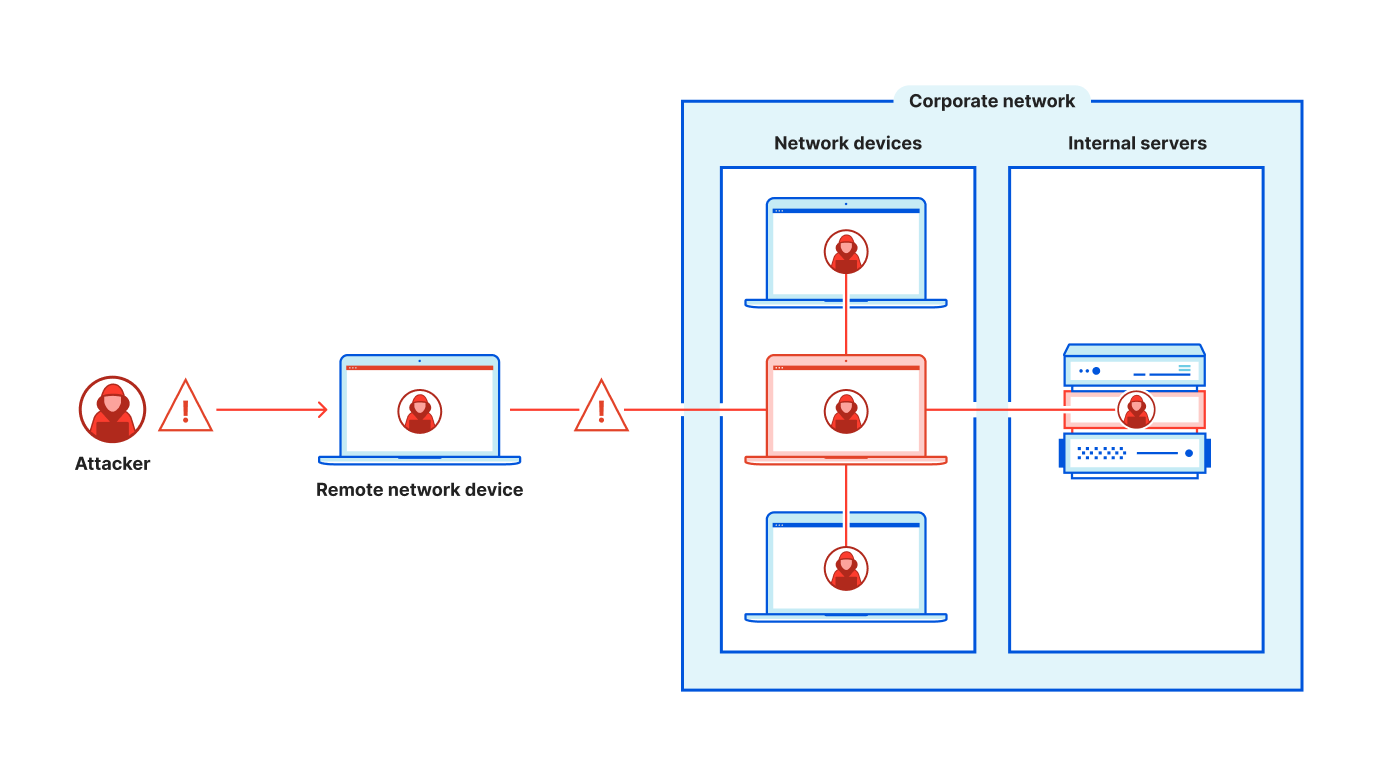
The illustration shows an attacker attempting to read from a different isolate. Most of the time this is detected by the mismatched memory protection key, which kills their script and notifies us, so we can investigate and remediate. The red arrow represents the case where the attacker got lucky by hitting an isolate with the same memory protection key, represented by the isolates having the same colors.

However, we can further improve on a 92% protection rate. In the last part of this blog post we’ll explain how we can lift that to 100% for a particular common scenario. But first, let’s look at a software hardening feature in V8 that we are taking advantage of.

The V8 sandbox, a software-based security boundary

Over the past few years, V8 has been gaining another defense in depth feature: the V8 sandbox. (Not to be confused with the layer 2 sandbox which Workers have been using since the beginning.) The V8 sandbox has been a multi-year project that has been gaining maturity for a while. The sandbox project stems from the observation that many V8 security vulnerabilities start by corrupting objects in the V8 heap memory. Attackers then leverage this corruption to reach other parts of the process, giving them the opportunity to escalate and gain more access to the victim’s browser, or even the entire system.

V8’s sandbox project is an ambitious software security mitigation that aims to thwart that escalation: to make it impossible for the attacker to progress from a corruption on the V8 heap to a compromise of the rest of the process. This means, among other things, removing all pointers from the heap. But first, let’s explain in as simple terms as possible, what a memory corruption attack is.

Memory corruption attacks

A memory corruption attack tricks a program into misusing its own memory. Computer memory is just a store of integers, where each integer is stored in a location. The locations each have an address, which is also just a number. Programs interpret the data in these locations in different ways, such as text, pixels, or pointers. Pointers are addresses that identify a different memory location, so they act as a sort of arrow that points to some other piece of data.

Here’s a concrete example, which uses a buffer overflow. This is a form of attack that was historically common and relatively simple to understand: Imagine a program has a small buffer (like a 16-character text field) followed immediately by an 8-byte pointer to some ordinary data. An attacker might send the program a 24-character string, causing a “buffer overflow.” Because of a vulnerability in the program, the first 16 characters fill the intended buffer, but the remaining 8 characters spill over and overwrite the adjacent pointer.


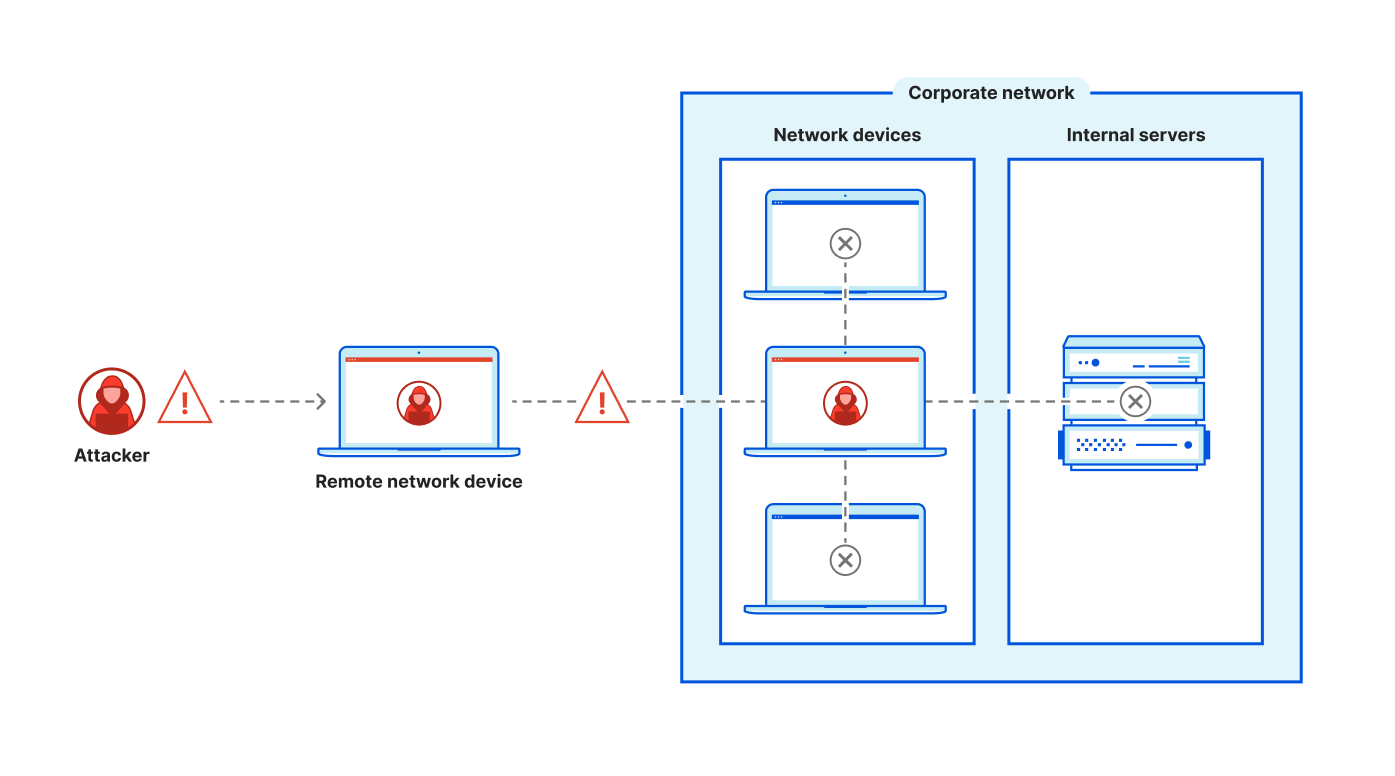
See below for how such an attack would now be thwarted.

Now the pointer has been redirected to point at sensitive data of the attacker’s choosing, rather than the normal data it was originally meant to access. When the program tries to use what it believes is its normal pointer, it’s actually accessing sensitive data chosen by the attacker.

This type of attack works in steps: first create a small confusion (like the buffer overflow), then use that confusion to create bigger problems, eventually gaining access to data or capabilities the attacker shouldn’t have.  The attacker can eventually use the misdirection to either steal information or plant malicious data that the program will treat as legitimate.

This was a somewhat abstract description of memory corruption attacks using a buffer overflow, one of the simpler techniques. For some much more detailed and recent examples, see this description from Google, or this breakdown of a V8 vulnerability.

Compressed pointers in V8

Many attacks are based on corrupting pointers, so ideally we would remove all pointers from the memory of the program.  Since an object-oriented language’s heap is absolutely full of pointers, that would seem, on its face, to be a hopeless task, but it is enabled by an earlier development. Starting in 2020, V8 has offered the option of saving memory by using compressed pointers. This means that, on a 64-bit system, the heap uses only 32 bit offsets, relative to a base address. This limits the total heap to maximally 4 GiB, a limitation that is acceptable for a browser, and also fine for individual scripts running in a V8 isolate on Cloudflare Workers.


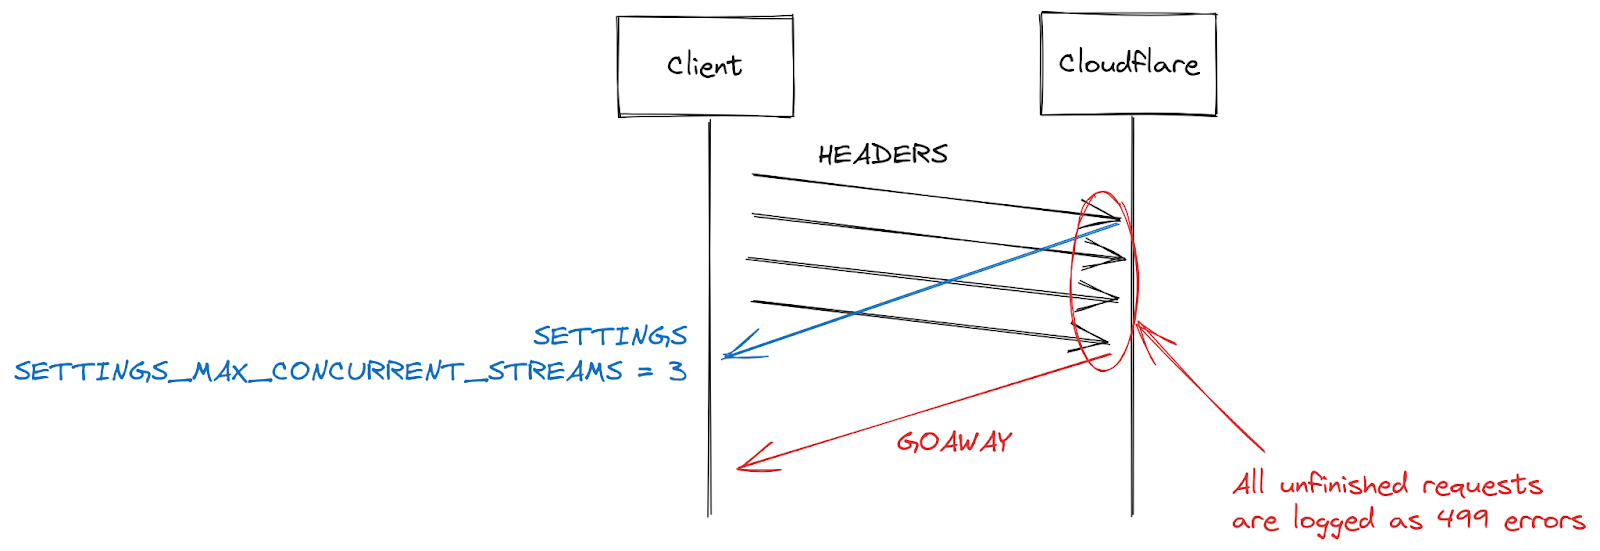
An artificial object with various fields, showing how the layout differs in a compressed vs. an uncompressed heap. The boxes are 64 bits wide.

If the whole of the heap is in a single 4 GiB area then the first 32 bits of all pointers will be the same, and we don’t need to store them in every pointer field in every object. In the diagram we can see that the object pointers all start with 0x12345678, which is therefore redundant and doesn’t need to be stored. This means that object pointer fields and integer fields can be reduced from 64 to 32 bits.

We still need 64 bit fields for some fields like double precision floats and for the sandbox offsets of buffers, which are typically used by the script for input and output data. See below for details.

Integers in an uncompressed heap are stored in the high 32 bits of a 64 bit field. In the compressed heap, the top 31 bits of a 32 bit field are used. In both cases the lowest bit is set to 0 to indicate integers (as opposed to pointers or offsets).

Conceptually, we have two methods for compressing and decompressing, using a base address that is divisible by 4 GiB:

// Decompress a 32 bit offset to a 64 bit pointer by adding a base address.
void* Decompress(uint32_t offset) { return base + offset; }
// Compress a 64 bit pointer to a 32 bit offset by discarding the high bits.
uint32_t Compress(void* pointer) { return (intptr_t)pointer & 0xffffffff; }

This pointer compression feature, originally primarily designed to save memory, can be used as the basis of a sandbox.

From compressed pointers to the sandbox

The biggest 32-bit unsigned integer is about 4 billion, so the Decompress() function cannot generate any pointer that is outside the range [base, base + 4 GiB]. You could say the pointers are trapped in this area, so it is sometimes called the pointer cage. V8 can reserve 4 GiB of virtual address space for the pointer cage so that only V8 objects appear in this range. By eliminating all pointers from this range, and following some other strict rules, V8 can contain any memory corruption by an attacker to this cage. Even if an attacker corrupts a 32 bit offset within the cage, it is still only a 32 bit offset and can only be used to create new pointers that are still trapped within the pointer cage.


The buffer overflow attack from earlier no longer works because only the attacker’s own data is available in the pointer cage.

To construct the sandbox, we take the 4 GiB pointer cage and add another 4 GiB for buffers and other data structures to make the 8 GiB sandbox. This is why the buffer offsets above are 33 bits, so they can reach buffers in the second half of the sandbox (40 bits in Chromium with larger sandboxes). V8 stores these buffer offsets in the high 33 bits and shifts down by 31 bits before use, in case an attacker corrupted the low bits.

Cloudflare Workers have made use of compressed pointers in V8 for a while, but for us to get the full power of the sandbox we had to make some changes. Until recently, all isolates in a process had to be one single sandbox if you were using the sandboxed configuration of V8. This would have limited the total size of all V8 heaps to be less than 4 GiB, far too little for our architecture, which relies on serving 1000s of scripts at once.

That’s why we commissioned Igalia to add isolate groups to V8. Each isolate group has its own sandbox and can have 1 or more isolates within it. Building on this change we have been able to start using the sandbox, eliminating a whole class of potential security issues in one stroke. Although we can place multiple isolates in the same sandbox, we are currently only putting a single isolate in each sandbox.


The layout of the sandbox. In the sandbox there can be more than one isolate, but all their heap pages must be in the pointer cage: the first 4 GiB of the sandbox. Instead of pointers between the objects, we use 32 bit offsets. The offsets for the buffers are 33 bits, so they can reach the whole sandbox, but not outside it.

Virtual memory isn’t infinite, there’s a lot going on in a Linux process

At this point, we were not quite done, though. Each sandbox reserves 8 GiB of space in the virtual memory map of the process, and it must be 4 GiB aligned for efficiency. It uses much less physical memory, but the sandbox mechanism requires this much virtual space for its security properties. This presents us with a problem, since a Linux process ‘only’ has 128 TiB of virtual address space in a 4-level page table (another 128 TiB are reserved for the kernel, not available to user space).

At Cloudflare, we want to run Workers as efficiently as possible to keep costs and prices down, and to offer a generous free tier. That means that on each machine we have so many isolates running (one per sandbox) that it becomes hard to place them all in a 128 TiB space.

Knowing this, we have to place the sandboxes carefully in memory. Unfortunately, the Linux syscall, mmap, does not allow us to specify the alignment of an allocation unless you can guess a free location to request. To get an 8 GiB area that is 4 GiB aligned, we have to ask for 12 GiB, then find the aligned 8 GiB area that must exist within that, and return the unused (hatched) edges to the OS:


If we allow the Linux kernel to place sandboxes randomly, we end up with a layout like this with gaps. Especially after running for a while, there can be both 8 GiB and 4 GiB gaps between sandboxes:


Sadly, because of our 12 GiB alignment trick, we can’t even make use of the 8 GiB gaps. If we ask the OS for 12 GiB, it will never give us a gap like the 8 GiB gap between the green and blue sandboxes above. In addition, there are a host of other things going on in the virtual address space of a Linux process: the malloc implementation may want to grab pages at particular addresses, the executable and libraries are mapped at a random location by ASLR, and V8 has allocations outside the sandbox.

The latest generation of x64 CPUs supports a much bigger address space, which solves both problems, and Linux kernels are able to make use of the extra bits with five level page tables. A process has to opt into this, which is done by a single mmap call suggesting an address outside the 47 bit area. The reason this needs an opt-in is that some programs can’t cope with such high addresses. Curiously, V8 is one of them.

This isn’t hard to fix in V8, but not all of our fleet has been upgraded yet to have the necessary hardware. So for now, we need a solution that works with the existing hardware. We have modified V8 to be able to grab huge memory areas and then use mprotect syscalls to create tightly packed 8 GiB spaces for sandboxes, bypassing the inflexible mmap API.


Putting it all together

Taking control of the sandbox placement like this actually gives us a security benefit, but first we need to describe a particular threat model.

We assume for the purposes of this threat model that an attacker has an arbitrary way to corrupt data within the sandbox. This is historically the first step in many V8 exploits. So much so that there is a special tier in Google’s V8 bug bounty program where you may assume you have this ability to corrupt memory, and they will pay out if you can leverage that to a more serious exploit.

However, we assume that the attacker does not have the ability to execute arbitrary machine code. If they did, they could disable memory protection keys. Having access to the in-sandbox memory only gives the attacker access to their own data. So the attacker must attempt to escalate, by corrupting data inside the sandbox to access data outside the sandbox.

You will recall that the compressed, sandboxed V8 heap only contains 32 bit offsets. Therefore, no corruption there can reach outside the pointer cage. But there are also arrays in the sandbox — vectors of data with a given size that can be accessed with an index. In our threat model, the attacker can modify the sizes recorded for those arrays and the indexes used to access elements in the arrays. That means an attacker could potentially turn an array in the sandbox into a tool for accessing memory incorrectly. For this reason, the V8 sandbox normally has guard regions around it: These are 32 GiB virtual address ranges that have no virtual-to-physical address mappings. This helps guard against the worst case scenario: Indexing an array where the elements are 8 bytes in size (e.g. an array of double precision floats) using a maximal 32 bit index. Such an access could reach a distance of up to 32 GiB outside the sandbox: 8 times the maximal 32 bit index of four billion.

We want such accesses to trigger an alarm, rather than letting an attacker access nearby memory.  This happens automatically with guard regions, but we don’t have space for conventional 32 GiB guard regions around every sandbox.

Instead of using conventional guard regions, we can make use of memory protection keys. By carefully controlling which isolate group uses which key, we can ensure that no sandbox within 32 GiB has the same protection key. Essentially, the sandboxes are acting as each other’s guard regions, protected by memory protection keys. Now we only need a wasted 32 GiB guard region at the start and end of the huge packed sandbox areas.


With the new sandbox layout, we use strictly rotating memory protection keys. Because we are not using randomly chosen memory protection keys, for this threat model the 92% problem described above disappears. Any in-sandbox security issue is unable to reach a sandbox with the same memory protection key. In the diagram, we show that there is no memory within 32 GiB of a given sandbox that has the same memory protection key. Any attempt to access memory within 32 GiB of a sandbox will trigger an alarm, just like it would with unmapped guard regions.

The future

In a way, this whole blog post is about things our customers don’t need to do. They don’t need to upgrade their server software to get the latest patches, we do that for them. They don’t need to worry whether they are using the most secure or efficient configuration. So there’s no call to action here, except perhaps to sleep easy.

However, if you find work like this interesting, and especially if you have experience with the implementation of V8 or similar language runtimes, then you should consider coming to work for us. We are recruiting both in the US and in Europe. It’s a great place to work, and Cloudflare is going from strength to strength.

MadeYouReset: An HTTP/2 vulnerability thwarted by Rapid Reset mitigations

Post Syndicated from Alex Forster original https://blog.cloudflare.com/madeyoureset-an-http-2-vulnerability-thwarted-by-rapid-reset-mitigations/

On August 13, security researchers at Tel Aviv University disclosed a new HTTP/2 denial-of-service (DoS) vulnerability that they are calling MadeYouReset (CVE-2025-8671). This vulnerability exists in a limited number of unpatched HTTP/2 server implementations that do not sufficiently enforce restrictions on the number of times a client may send malformed frames. If you’re using Cloudflare for HTTP DDoS mitigation, you’re already protected from MadeYouReset.

Cloudflare was informed of this vulnerability in May through a coordinated disclosure process, and we were able to confirm that our systems were not susceptible, due in large part to the mitigations we put in place during Rapid Reset (CVE-2023-44487). MadeYouReset and Rapid Reset are two conceptually similar HTTP/2 protocol attacks that exploit a fundamental feature within the HTTP/2 specification: stream resets. In the HTTP/2 protocol, a “stream” represents an independent series of HTTP request/response pairs exchanged between the client and server within an HTTP/2 connection. The stream reset feature is intended to allow a client to initiate an HTTP request and subsequently cancel it before the server has delivered its response.

The vulnerability exploited by both MadeYouReset and Rapid Reset lies in the potential for malicious actors to abuse this stream reset mechanism. By repeatedly causing stream resets, attackers can overwhelm a server’s resources. While the server is attempting to process and respond to a multitude of requests, the rapid succession of resets forces it to expend computational effort on starting and then immediately discarding these operations. This can lead to resource exhaustion and impact the availability of the targeted server for legitimate users. The difference between MadeYouReset and Rapid Reset is that, instead of clients issuing stream resets directly, they instead trick servers into resetting streams by sending specially crafted malformed frames.

Fortunately, the MadeYouReset vulnerability only impacts a relatively small number of HTTP/2 implementations. In most major HTTP/2 implementations already in widespread use today, the proactive measures taken to counter Rapid Reset in 2023 have also provided substantial protection against MadeYouReset, limiting its potential impact and preventing a similarly disruptive event.

A note about Cloudflare’s Pingora and its users:
Our open-sourced Pingora framework uses the popular Rust-language h2 library for its HTTP/2 support. Versions of h2 prior to 0.4.11 were potentially susceptible to MadeYouReset. Users of Pingora can patch their applications by updating their h2 crate version using the cargo update command. Pingora does not itself terminate inbound HTTP connections to Cloudflare’s network, meaning this vulnerability could not be exploited against Cloudflare’s infrastructure.

We would like to credit researchers Gal Bar Nahum, Anat Bremler-Barr, and Yaniv Harel of Tel Aviv University for discovering this vulnerability and thank them for their leadership in the coordinated disclosure process. Cloudflare always encourages security researchers to submit vulnerabilities like this to our HackerOne Bug Bounty program.

Targeted by 20.5 million DDoS attacks, up 358% year-over-year: Cloudflare’s 2025 Q1 DDoS Threat Report

Post Syndicated from Omer Yoachimik original https://blog.cloudflare.com/ddos-threat-report-for-2025-q1/

Welcome to the 21st edition of the Cloudflare DDoS Threat Report. Published quarterly, this report offers a comprehensive analysis of the evolving threat landscape of Distributed Denial of Service (DDoS) attacks based on data from the Cloudflare network. In this edition, we focus on the first quarter of 2025. To view previous reports, visit www.ddosreport.com.

While this report primarily focuses on 2025 Q1, it also includes late-breaking data from a hyper-volumetric DDoS campaign observed in April 2025, featuring some of the largest attacks ever publicly disclosed. In a historic surge of activity, we blocked the most intense packet rate attack on record, peaking at 4.8 billion packets per second (Bpps), 52% higher than the previous benchmark, and separately defended against a massive 6.5 terabits-per-second (Tbps) flood, matching the highest bandwidth attacks ever reported.

Key DDoS insights

  • In the first quarter of 2025, Cloudflare blocked 20.5 million DDoS attacks. That represents a 358% year-over-year (YoY) increase and a 198% quarter-over-quarter (QoQ) increase. 

  • Around one third of those, 6.6 million, targeted the Cloudflare network infrastructure directly, as part of an 18-day multi-vector attack campaign.

  • Furthermore, in the first quarter of 2025, Cloudflare blocked approximately 700 hyper-volumetric DDoS attacks that exceeded 1 Tbps or 1 Bpps — an average of around 8 attacks per day.

All the attacks were blocked by our autonomous defenses.

To learn more about DDoS attacks and other types of cyber threats, refer to our Learning Center. Visit Cloudflare Radar to view this report in its interactive version where you can drill down further. There’s a free API for those interested in investigating Internet trends. You can also learn more about the methodologies used in preparing these reports.

DDoS attacks in numbers

In the first quarter of 2025, we blocked 20.5 million DDoS attacks. For comparison, during the calendar year 2024, we blocked 21.3 million DDoS attacks. In just this past quarter, we blocked 96% of what we blocked in 2024.

The most significant increase was in network-layer DDoS attacks. In 2025 Q1, we blocked 16.8M network-layer DDoS attacks. That’s a 397% QoQ increase and a 509% YoY increase. HTTP DDoS attacks also increased — a 7% QoQ increase and a 118% YoY increase.


We count DDoS attacks based on unique real-time fingerprints generated by our systems. In some instances, a single attack or campaign may generate multiple fingerprints, particularly when different mitigation strategies are applied. While this can occasionally lead to higher counts, the metric offers a strong overall indicator of attack activity during a given period.

Attacks target the Cloudflare network and Internet infrastructure

Of the 20.5 million DDoS attacks blocked in Q1, 16.8 million were network-layer DDoS attacks, and of those, 6.6M targeted Cloudflare’s network infrastructure directly. Another 6.9 million targeted hosting providers and service providers protected by Cloudflare.

These attacks were part of an 18-day multi-vector DDoS campaign comprising SYN flood attacks, Mirai-generated DDoS attacks, and SSDP amplification attacks to name a few. These attacks, as with all of the 20.5 million, were autonomously detected and blocked by our DDoS defenses.


In the graph below, daily aggregates of attacks against Cloudflare are represented by the blue line, and the other colors represent the various hosting providers and Internet service providers using Cloudflare’s Magic Transit service that were attacked simultaneously.


Hyper-volumetric DDoS attacks

Hyper-volumetric DDoS attacks are attacks that exceed 1-2 Tbps or 1 Bpps. In 2025 Q1, we blocked over 700 of these attacks. Approximately 4 out of every 100,000 network-layer DDoS attacks were hyper-volumetric. Hyper-volumetric DDoS attacks tend to take place over UDP.


Hyper-volumetric attacks continue spill into Q2

While this report primarily focuses on 2025 Q1, we believe it is important to also highlight the significant hyper-volumetric record-breaking DDoS attacks that continued into Q2. As such, we have included initial insights from that campaign.

In the second half of April 2025, Cloudflare’s systems automatically detected and blocked dozens of hyper-volumetric DDoS attacks as part of an intense campaign. The largest attacks peaked at 4.8 Bpps and 6.5 Tbps, with these massive surges typically lasting between 35 and 45 seconds. At 6.5 Tbps, this attack matches the largest publicly disclosed DDoS attack to date. The 4.8 Bpps attack is the largest ever to be disclosed from the packet intensity perspective, approximately 52% larger than the previous 3.15 Bpps record.


The attacks originated from 147 countries and targeted multiple IP addresses and ports of a hosting provider that is protected by Cloudflare Magic Transit. All the attacks were successfully blocked by Cloudflare’s network.


Threat actors

When surveying Cloudflare customers that were targeted by DDoS attacks, the majority said they didn’t know who attacked them. The ones that did know reported their competitors as the number one threat actor behind the attacks (39%), which is similar to last quarter. This is quite common in the gaming and gambling industry.

Another 17% reported that a state-level or state-sponsored threat actor was behind the attack, and a similar percentage reported that a disgruntled user or customer was behind the attack. 

Another 11% reported that they mistakenly inflicted the DDoS attack on themselves (self-DDoS) and a similar percentage said an extortionist was behind the attacks. 6% reported that the attacks were launched by disgruntled or former employees.


Anatomy of a DDoS attack

On the network-layer, SYN flood remains the most common Layer 3/4 DDoS attack vector, followed by DNS flood attacks. Mirai-launched DDoS attacks take the third place, replacing UDP flood attacks.


In the HTTP realm, over 60% of the attacks were identified and blocked as known botnets, 21% were attacks with suspicious HTTP attributes, another 10% were launched by botnets impersonating browsers, and the remaining 8% were generic floods, attacks of unusual request patterns, and cache busting attacks.


Emerging threats

In 2025 Q1, we saw a 3,488% QoQ increase in CLDAP reflection/amplification attacks. CLDAP (Connectionless Lightweight Directory Access Protocol) is a variant of LDAP (Lightweight Directory Access Protocol), used for querying and modifying directory services running over IP networks. CLDAP is connectionless, using UDP instead of TCP, making it faster but less reliable. Because it uses UDP, there’s no handshake requirement, which allows attackers to spoof the source IP address, thus allowing attackers to exploit it as a reflection vector. In these attacks, small queries are sent with a spoofed source IP address (the victim’s IP), causing servers to send large responses to the victim, overwhelming it. Mitigation involves filtering and monitoring unusual CLDAP traffic.


We also saw a 2,301% QoQ increase in ESP reflection/amplification attacks. The ESP (Encapsulating Security Payload) protocol is part of IPsec and provides confidentiality, authentication, and integrity to network communications. However, it can be abused in DDoS attacks if malicious actors exploit misconfigured or vulnerable systems to reflect or amplify traffic towards a target, leading to service disruption. Like with other protocols, securing and properly configuring the systems using ESP is crucial to block the risks of DDoS attacks.

Attack size & duration

Despite the increase in hyper-volumetric attacks, most DDoS attacks are small. In 2025 Q1, 99% of Layer 3/4 DDoS attacks were under 1 Gbps and 1 Mpps. Similarly, 94% of HTTP DDoS attacks were 1 million requests per second (rps). However, ‘small’ is a relative term and most Internet properties wouldn’t be able to withstand even those small attacks. They can easily saturate unprotected Internet links and crash unprotected servers.

Furthermore, most attacks are very short-lived. 89% of Layer 3/4 DDoS attacks and 75% of HTTP DDoS attacks end within 10 minutes. Even the largest, record-breaking, hyper-volumetric DDoS attacks can be very short, such as the 35-second attack seen in the examples above. 35 seconds, or even 10 minutes, is not a sufficient time for manual mitigation or activating an on-demand solution: by the time a security analyst receives the alert, and analyzes the attack, it’s already over. And while the attacks may be very short, the trickle effect of attack leads to network and applications failures that can take days to recover from — all whilst services are down or degraded. The current threat landscape leaves no time for human intervention. Detection and mitigation should be always-on, in-line and automated — with sufficient capacity and global coverage to handle the attack traffic along with legitimate peak time traffic.


On the other hand, hyper-volumetric HTTP DDoS attacks that exceed 1 Mrps doubled their share. In 2025 Q1, 6 out of every 100 HTTP DDoS attacks exceeded 1 Mrps. On the network-layer, 1 out of every 100,000 attacks exceeded 1 Tbps or 1 Bpps.

Attack example

One example of such an attack targeted a Cloudflare Magic Transit customer. The customer itself is a US-based hosting provider that offers web servers, Voice over IP (VoIP) servers, and game servers amongst its solutions. This specific attack targeted port 27015. This port is most commonly associated with multiplayer gaming servers, especially Valve’s Source engine games, such as Counter-Strike: Global Offensive (CS:GO), Team Fortress 2, Garry’s Mod, Left 4 Dead, and Half-Life 2: Deathmatch.

It’s used for the game server connection, letting clients connect to the server to play online. In many cases, this port is open for both UDP and TCP, depending on the game and what kind of communication it’s doing. This customer was targeted with multiple hyper-volumetric attacks that were autonomously blocked by Cloudflare.


Top attacked locations

The first quarter of 2025 saw a significant shift in the top 10 most attacked locations globally. Germany made a notable jump, climbing four spots — making it the most attacked country. In second place, Turkey also experienced a surge of 11 spots. In third, China, on the other hand, slipped two spots compared to the previous quarter, while Hong Kong remained unchanged. India rose four spots, and Brazil stayed the same. Taiwan dropped four positions. The Philippines experienced the largest decline, falling 6 spots. South Korea and Indonesia, however, both jumped up by two spots each.


Top attacked industries

The top 10 most attacked industries in 2025 Q1 saw some notable changes. The Gambling & Casinos industry jumped up four spots as the most attacked industry, while the Telecommunications, Service Providers and Carriers industry slid down one spot. The Information Technology & Services and Internet industries both saw minor fluctuations, moving up one and down two spots, respectively. The Gaming and Banking & Financial Services industries both saw a one-spot increase, while the Cyber Security industry made a massive leap of 37 spots compared to the previous quarter. Retail saw a slight decline of one spot, while the Manufacturing, Machinery, Technology & Engineering industry surged 28 spots. The Airlines, Aviation & Aerospace industry had the biggest jump of all, moving up 40 spots making it the tenth most attacked industry.


Top attack sources

The ranking of the top 10 largest sources of DDoS attacks in 2025 Q1 also shifted notably. Hong Kong soared to the number one position, climbing three spots from the previous quarter. Indonesia edged down to second place, while Argentina rose two spots to third. Singapore slipped two spots to fourth, and Ukraine dropped one to fifth. Brazil made a striking leap, climbing seven places to land in sixth place, closely followed by Thailand, which also rose seven spots to seventh. Germany also increased, moving up two positions to eighth. Vietnam made the most dramatic climb, jumping 15 spots to claim ninth place, while Bulgaria rounded out the list, dipping two spots to tenth.


Top source ASNs

An ASN (Autonomous System Number) is a unique identifier assigned to a network or group of IP networks that operate under a single routing policy on the Internet. It’s used to exchange routing information between systems using protocols like BGP (Border Gateway Protocol).

When looking at where the DDoS attacks originate from, specifically HTTP DDoS attacks, there are a few autonomous systems that stand out. In 2025 Q1, the German-based Hetzner (AS24940) retained its position as the largest source of HTTP DDoS attacks. It was followed by the French-based OVH (AS16276) in second, the US-based DigitalOcean (AS14061) in third, and another German-based provider, Contabo (AS51167), in fourth. 

Other major sources included the China-based ChinaNet Backbone (AS4134) and Tencent (AS132203), the Austrian-based Drei (AS200373), and three US-based providers to wrap up the top 10 — Microsoft (AS8075), Oracle (AS31898), and Google Cloud Platform (AS396982). Most of the networks in this ranking are well-known cloud computing or hosting providers, highlighting how cloud infrastructure is frequently leveraged — either intentionally or through exploitation — for launching DDoS attacks.

To help hosting providers, cloud computing providers and any Internet service providers identify and take down the abusive accounts that launch these attacks, we leverage Cloudflare’s unique vantage point to provide a free DDoS Botnet Threat Feed for Service Providers. Over 600 organizations worldwide have already signed up for this feed. It gives service providers a list of offending IP addresses from within their ASN that we see launching HTTP DDoS attacks. It’s completely free and all it takes is opening a free Cloudflare account, authenticating the ASN via PeeringDB, and then fetching the threat intelligence via API.


Helping build a better Internet

At Cloudflare, our mission is to help build a better Internet. A key part of that commitment is offering free protection against DDoS attacks, as well as supporting the broader Internet community by providing free tools to help other networks detect and dismantle botnets operating within their infrastructure.

As the threat landscape continues to evolve, we see that many organizations still adopt DDoS protection only after experiencing an attack or rely on outdated, on-demand solutions. In contrast, our data shows that those with proactive security strategies are far more resilient. That’s why we focus on automation and a comprehensive, always-on, in-line security approach to stay ahead of both existing and emerging threats.

Backed by our global network with 348 Tbps of capacity spanning 335 cities, we remain dedicated to delivering unmetered, unlimited DDoS protection, regardless of the size, duration, or frequency of attacks.

Cloudflare thwarts over 47 million cyberthreats against Jewish and Holocaust educational websites

Post Syndicated from Omer Yoachimik original https://blog.cloudflare.com/cloudflare-thwarts-over-47-million-cyberthreats-against-jewish-and-holocaust/

January 27 marks the International Holocaust Remembrance Day — a solemn occasion to honor the memory of the six million Jews who perished in the Holocaust, along with countless others who fell victim to the Nazi regime’s campaign of hatred and intolerance. This tragic chapter in human history serves as a stark reminder of the catastrophic consequences of prejudice and extremism. 

The United Nations General Assembly designated January 27 — the anniversary of the liberation of Auschwitz-Birkenau —  as International Holocaust Remembrance Day. This year, we commemorate the 80th anniversary of the liberation of this infamous extermination camp.

As the world reflects on this dark period, a troubling resurgence of antisemitism underscores the importance of vigilance. This growing hatred has spilled into the digital realm, with cyberattacks increasingly targeting Jewish and Holocaust remembrance and educational websites — spaces dedicated to preserving historical truth and fostering awareness.

For this reason, here at Cloudflare, we began to publish annual reports covering cyberattacks that target these organizations. These cyberattacks include DDoS attacks as well as bot and application attacks. The insights and trends are based on websites protected by Cloudflare. This is our fourth report, and you can view our previous Holocaust Remembrance Day blogs here.

Project Galileo

At Cloudflare, we are proud to support these vital organizations through Project Galileo, an initiative providing free security protections to vulnerable groups worldwide. If you or your organization could benefit from this program, consider applying today to help protect these essential platforms and the invaluable work they do.


Project Galileo overview. Source: Cloudflare 2024 Impact Report

One of the organizations that we protect through Project Galileo is Muzeon, a museum dedicated to preserving Jewish history in Cluj-Napoca, Romania. Muzeon faced significant cyberattacks that impacted their website’s performance and hindered operations before using Cloudflare.

As part of Project Galileo, Muzeon implemented Cloudflare’s DDoS mitigation, Web Application Firewall (WAF), Managed DNS, and other services. These measures drastically reduced the attacks and allowed Muzeon to focus on its important mission of storytelling and preserving cultural heritage. 

Cloudflare’s solutions not only protected their digital infrastructure but also freed up time for Muzeon to expand its interactive exhibits, ensuring they could continue sharing their essential work globally. You can read more about this case study here

Significant rise in antisemitism around the world

Following the October 7, 2023, Hamas-led attack on Israel, there has been a surge in global antisemitic incidents. In the U.S. alone there have been more than 10,000 antisemitic incidents from October 7, 2023 to September 24, 2024, representing an over 200-percent increase compared to the incidents reported during the same period a year before. As we’ve seen, the digital world is often a mirror to the real world. As a result, it is not surprising that websites dedicated to sharing information about the Holocaust, as well as Jewish memorial and education platforms, are now increasingly being targeted online. 

Cyberattacks against Jewish and Holocaust educational websites 

For the years 2020, 2021, and 2022, the number of cyberthreats targeting Holocaust and Jewish educational and memorial websites protected by Cloudflare was, on average, 736,339 malicious HTTP requests annually.

After the October 7 Hamas-led attack, cyberattacks skyrocketed. In 2023, the amount of blocked HTTP requests surged by 872% to 35.7 million compared to 2022. Most of these cyberattacks occurred after October 7, 2023. 

In 2024, the number of blocked HTTP requests exceeded 47 million — representing a 30% increase compared to 2023. Over 3 out of every 100 HTTP requests towards Holocaust and Jewish memorial and education websites protected by Cloudflare were malicious and blocked. 


Cyber threats against Holocaust and Jewish memorial and educational websites by year

Cyberattacks by quarter

In the fourth quarter of 2023, the volume of malicious requests exceeded 27 million. Throughout the first three quarters of 2024, we saw a gradual decrease in the quantity of malicious requests. But in the fourth quarter of 2024, cyberattacks spiked by 33%, to 36 million requests, following the one-year anniversary of the October 7 assault.


Cyber threats against Holocaust and Jewish memorial and educational websites by quarter

Cyberattacks by month

Breaking down the quarters into months, we can see an initial peak in October 2023 after the October 7 Hamas-led attack. The volume of cyberattacks remained elevated during November and December 2023.

Afterward, as we entered 2024, the quantity and percentage of cyberattacks against these websites significantly decreased. In November, over a third (34%) of all requests towards these websites were blocked, with over 36 million requests blocked that month alone.


Cyber threats against Holocaust and Jewish memorial and educational websites by month

Helping build a safer Internet and a better world

On the International Holocaust Remembrance Day, we reflect on the importance of standing against both antisemitism and cyber threats — issues that have escalated since the October 7, 2023, Hamas-led attack. 

At Cloudflare, we are unwavering in our commitment to create a safer, more inclusive Internet. The rise in antisemitism has made it even more critical to protect educational websites and communities from harmful cyber attacks. We invite everyone to join us in this fight. Even with our free plan, we offer strong security and performance, ensuring that vital resources and websites remain safe and accessible. By working together, we can protect the lessons of history and foster a more secure digital world for all.

Record-breaking 5.6 Tbps DDoS attack and global DDoS trends for 2024 Q4

Post Syndicated from Omer Yoachimik original https://blog.cloudflare.com/ddos-threat-report-for-2024-q4/

Welcome to the 20th edition of the Cloudflare DDoS Threat Report, marking five years since our first report in 2020.

Published quarterly, this report offers a comprehensive analysis of the evolving threat landscape of Distributed Denial of Service (DDoS) attacks based on data from the Cloudflare network. In this edition, we focus on the fourth quarter of 2024 and look back at the year as a whole.

Cloudflare’s unique vantage point

When we published our first report, Cloudflare’s global network capacity was 35 Terabits per second (Tbps). Since then, our network’s capacity has grown by 817% to 321 Tbps. We also significantly expanded our global presence by 65% from 200 cities in the beginning of 2020 to 330 cities by the end of 2024.

Using this massive network, we now serve and protect nearly 20% of all websites and close to 18,000 unique Cloudflare customer IP networks. This extensive infrastructure and customer base uniquely positions us to provide key insights and trends that benefit the wider Internet community.

Key DDoS insights

  • In 2024, Cloudflare’s autonomous DDoS defense systems blocked around 21.3 million DDoS attacks, representing a 53% increase compared to 2023. On average, in 2024, Cloudflare blocked 4,870 DDoS attacks every hour.

  • In the fourth quarter, over 420 of those attacks were hyper-volumetric, exceeding rates of 1 billion packets per second (pps) and 1 Tbps. Moreover, the amount of attacks exceeding 1 Tbps grew by a staggering 1,885% quarter-over-quarter.

  • During the week of Halloween 2024, Cloudflare’s DDoS defense systems successfully and autonomously detected and blocked a 5.6 Terabit per second (Tbps) DDoS attack — the largest attack ever reported.

To learn more about DDoS attacks and other types of cyber threats, visit our Learning Center, access previous DDoS threat reports on the Cloudflare blog, or visit our interactive hub, Cloudflare Radar. There’s also a free API for those interested in investigating these and other Internet trends. You can also learn more about the methodologies used in preparing these reports.

Anatomy of a DDoS attack

In 2024 Q4 alone, Cloudflare mitigated 6.9 million DDoS attacks. This represents a 16% increase quarter-over-quarter (QoQ) and 83% year-over-year (YoY).

Of the 2024 Q4 DDoS attacks, 49% (3.4 million) were Layer 3/Layer 4 DDoS attacks and 51% (3.5 million) were HTTP DDoS attacks.


Distribution of 6.9 million DDoS attacks: 2024 Q4

HTTP DDoS attacks

The majority of the HTTP DDoS attacks (73%) were launched by known botnets. Rapid detection and blocking of these attacks were made possible as a result of operating a massive network and seeing many types of attacks and botnets. In turn, this allows our security engineers and researchers to craft heuristics to increase mitigation efficacy against these attacks.

An additional 11% were HTTP DDoS attacks that were caught pretending to be a legitimate browser. Another 10% were attacks which contained suspicious or unusual HTTP attributes. The remaining 8% “Other” were generic HTTP floods, volumetric cache busting attacks, and volumetric attacks targeting login endpoints.


Top HTTP DDoS attack vectors: 2024 Q4

These attack vectors, or attack groups, are not necessarily exclusive. For example, known botnets also impersonate browsers and have suspicious HTTP attributes, but this breakdown is our attempt to categorize the HTTP DDoS attacks in a meaningful way.

Top user agents

As of this report’s publication, the current stable version of Chrome for Windows, Mac, iOS, and Android is 132, according to Google’s release notes. However, it seems that threat actors are still behind, as thirteen of the top user agents that appeared most frequently in DDoS attacks were Chrome versions ranging from 118 to 129.

The HITV_ST_PLATFORM user agent had the highest share of DDoS requests out of total requests (99.9%), making it the user agent that’s used almost exclusively in DDoS attacks. In other words, if you see traffic coming from the HITV_ST_PLATFORM user agent, there is a 0.1% chance that it is legitimate traffic.

Threat actors often avoid using uncommon user agents, favoring more common ones like Chrome to blend in with regular traffic. The presence of the HITV_ST_PLATFORM user agent, which is associated with smart TVs and set-top boxes, suggests that the devices involved in certain cyberattacks are compromised smart TVs or set-top boxes. This observation highlights the importance of securing all Internet-connected devices, including smart TVs and set-top boxes, to prevent them from being exploited in cyberattacks.


Top user agents abused in DDoS attacks: 2024 Q4

The user agent hackney came in second place, with 93% of requests containing this user agent being part of a DDoS attack. If you encounter traffic coming from the hackney user agent, there is a 7% chance that it is legitimate traffic. Hackney is an HTTP client library for Erlang, used for making HTTP requests and is popular in Erlang/Elixir ecosystems.

Additional user agents that were used in DDoS attacks are uTorrent, which is associated with a popular BitTorrent client for downloading files. Go-http-client and fasthttp were also commonly used in DDoS attacks. The former is the default HTTP client in Go’s standard library and the latter is a high-performance alternative. fasthttp is used to build fast web applications, but is often exploited for DDoS attacks and web scraping too.

HTTP attributes commonly used in DDoS attacks

HTTP methods

HTTP methods (also called HTTP verbs) define the action to be performed on a resource on a server. They are part of the HTTP protocol and allow communication between clients (such as browsers) and servers.

The GET method is most commonly used. Almost 70% of legitimate HTTP requests made use of the GET method. In second place is the POST method with a share of 27%.

With DDoS attacks, we see a different picture. Almost 14% of HTTP requests using the HEAD method were part of a DDoS attack, despite it hardly being present in legitimate HTTP requests (0.75% of all requests). The DELETE method came in second place, with around 7% of its usage being for DDoS purposes.

The disproportion between methods commonly seen in DDoS attacks versus their presence in legitimate traffic definitely stands out. Security administrators can use this information to optimize their security posture based on these headers.


Distribution of HTTP methods in DDoS attacks and legitimate traffic: 2024 Q4

HTTP paths

An HTTP path describes a specific server resource. Along with the HTTP method, the server will perform the action on the resource.

For example, GET https://developers.cloudflare.com/ddos-protection/ will instruct the server to retrieve the content for the resource /ddos-protection/.

DDoS attacks often target the root of the website (“/”), but in other cases, they can target specific paths. In 2024 Q4, 98% of HTTP requests towards the /wp-admin/ path were part of DDoS attacks. The /wp-admin/ path is the default administrator dashboard for WordPress websites.

Obviously, many paths are unique to the specific website, but in the graph below, we’ve provided the top generic paths that were attacked the most. Security administrators can use this data to strengthen their protection on these endpoints, as applicable. 


 Top HTTP paths targeted by HTTP DDoS attacks: 2024 Q4

HTTP vs. HTTPS

In Q4, almost 94% of legitimate traffic was HTTPS. Only 6% was plaintext HTTP (not encrypted). Looking at DDoS attack traffic, around 92% of HTTP DDoS attack requests were over HTTPS and almost 8% were over plaintext HTTP.


HTTP vs. HTTPS in legitimate traffic and DDoS attacks: 2024 Q4

Layer 3/Layer 4 DDoS attacks

The top three most common Layer 3/Layer 4 (network layer) attack vectors were SYN flood (38%), DNS flood attacks (16%), and UDP floods (14%).


Top L3/4 DDoS attack vectors: 2024 Q4

An additional common attack vector, or rather, botnet type, is Mirai. Mirai attacks accounted for 6% of all network layer DDoS attacks — a 131% increase QoQ. In 2024 Q4, a Mirai-variant botnet was responsible for the largest DDoS attack on record, but we’ll discuss that further in the next section.

Emerging attack vectors

Before moving on to the next section, it’s worthwhile to discuss the growth in additional attack vectors that were observed this quarter. 


Top emerging threats: 2024 Q4

Memcached DDoS attacks saw the largest growth, with a 314% QoQ increase. Memcached is a database caching system for speeding up websites and networks. Memcached servers that support UDP can be abused to launch amplification or reflection DDoS attacks. In this case, the attacker would request content from the caching system and spoof the victim’s IP address as the source IP in the UDP packets. The victim will be flooded with the Memcache responses, which can be up to 51,200x larger than the initial request.

BitTorrent DDoS attacks also surged this quarter by 304%. The BitTorrent protocol is a communication protocol used for peer-to-peer file sharing. To help the BitTorrent clients find and download the files efficiently, BitTorrent clients may utilize BitTorrent Trackers or Distributed Hash Tables (DHT) to identify the peers that are seeding the desired file. This concept can be abused to launch DDoS attacks. A malicious actor can spoof the victim’s IP address as a seeder IP address within Trackers and DHT systems. Then clients would request the files from those IP addresses. Given a sufficient number of clients requesting the file, it can flood the victim with more traffic than it can handle.

The largest DDoS attack on record

On October 29, a 5.6 Tbps UDP DDoS attack launched by a Mirai-variant botnet targeted a Cloudflare Magic Transit customer, an Internet service provider (ISP) from Eastern Asia. The attack lasted only 80 seconds and originated from over 13,000 IoT devices. Detection and mitigation were fully autonomous by Cloudflare’s distributed defense systems. It required no human intervention, didn’t trigger any alerts, and didn’t cause any performance degradation. The systems worked as intended.


Cloudflare’s autonomous DDoS defenses mitigate a 5.6 Tbps Mirai DDoS attack without human intervention

While the total number of unique source IP addresses was around 13,000, the average unique source IP addresses per second was 5,500. We also saw a similar number of unique source ports per second. In the graph below, each line represents one of the 13,000 different source IP addresses, and as portrayed, each contributed less than 8 Gbps per second. The average contribution of each IP address per second was around 1 Gbps (~0.012% of 5.6 Tbps).


The 13,000 source IP addresses that launched the 5.6 Tbps DDoS attack

Hyper-volumetric DDoS attacks

In 2024 Q3, we started seeing a rise in hyper-volumetric network layer DDoS attacks. In 2024 Q4, the amount of attacks exceeding 1 Tbps increased by 1,885% QoQ and attacks exceeding 100 Million pps (packets per second) increased by 175% QoQ. 16% of the attacks that exceeded 100 Million pps also exceeded 1 Billion pps.


Distribution of hyper-volumetric L3/4 DDoS attacks: 2024 Q4

Attack size

The majority of HTTP DDoS attacks (63%) did not exceed 50,000 requests per second. On the other side of the spectrum, 3% of HTTP DDoS attacks exceeded 100 million requests per second.

Similarly, the majority of network layer DDoS attacks are also small. 93% did not exceed 500 Mbps and 87% did not exceed 50,000 packets per second. 


QoQ change in attack size by packet rate: 2024 Q4


QoQ change in attack size by bit rate: 2024 Q4

Attack duration

The majority of HTTP DDoS attacks (72%) end in under ten minutes. Approximately 22% of HTTP DDoS attacks last over one hour, and 11% last over 24 hours.

Similarly, 91% of network layer DDoS attacks also end within ten minutes. Only 2% last over an hour.

Overall, there was a significant QoQ decrease in the duration of DDoS attacks. Because the duration of most attacks is so short, it is not feasible, in most cases, for a human to respond to an alert, analyze the traffic, and apply mitigation. The short duration of attacks emphasizes the need for an in-line, always-on, automated DDoS protection service.


QoQ change in attack duration: 2024 Q4

Attack sources

In the last quarter of 2024, Indonesia remained the largest source of DDoS attacks worldwide for the second consecutive quarter. To understand where attacks are coming from, we map the source IP addresses launching HTTP DDoS attacks because they cannot be spoofed, and for Layer 3/Layer 4 DDoS attacks, we use the location of our data centers where the DDoS packets were ingested. This lets us overcome the spoofability that is possible in Layer 3/Layer 4. We’re able to achieve geographical accuracy due to our extensive network spanning over 330 cities around the world.

Hong Kong came in second, having moved up five spots from the previous quarter. Singapore advanced three spots, coming in third place.


Top 10 largest sources of DDoS attacks: 2024 Q4

Top source networks

An autonomous system (AS) is a large network or group of networks that has a unified routing policy. Every computer or device that connects to the Internet is connected to an AS. To find out what your AS is, visit https://radar.cloudflare.com/ip.

When looking at where the DDoS attacks originate from, specifically HTTP DDoS attacks, there are a few autonomous systems that stand out.

The AS that we saw the most HTTP DDoS attack traffic from in 2024 Q4 was German-based Hetzner (AS24940). Almost 5% of all HTTP DDoS requests originated from Hetzer’s network, or in other words, 5 out of every 100 HTTP DDoS requests that Cloudflare blocked originated from Hetzner.

In second place we have the US-based Digital Ocean (AS14061), followed by France-based OVH (AS16276) in third place.


Top 10 largest source networks of DDoS attacks: 2024 Q4

For many network operators such as the ones listed above, it can be hard to identify the malicious actors that abuse their infrastructure for launching attacks. To help network operators and service providers crack down on the abuse, we provide a free DDoS Botnet threat intelligence feed that provides ASN owners a list of their IP addresses that we’ve seen participating in DDoS attacks. 

Top threat actors

When surveying Cloudflare customers that were targeted by DDoS attacks, the majority said they didn’t know who attacked them. The ones that did know reported their competitors as the number one threat actor behind the attacks (40%). Another 17% reported that a state-level or state-sponsored threat actor was behind the attack, and a similar percentage reported that a disgruntled user or customer was behind the attack.

Another 14% reported that an extortionist was behind the attacks. 7% claimed it was a self-inflicted DDoS, 2% reported hacktivism as the cause of the attack, and another 2% reported that the attacks were launched by former employees.


Top threat actors: 2024 Q4

Ransom DDoS attacks

In the final quarter of 2024, as anticipated, we observed a surge in Ransom DDoS attacks. This spike was predictable, given that Q4 is a prime time for cybercriminals, with increased online shopping, travel arrangements, and holiday activities. Disrupting these services during peak times can significantly impact organizations’ revenues and cause real-world disruptions, such as flight delays and cancellations.

In Q4, 12% of Cloudflare customers that were targeted by DDoS attacks reported being threatened or extorted for a ransom payment. This represents a 78% QoQ increase and 25% YoY growth compared to 2023 Q4.


Reported Ransom DDoS attacks by quarter: 2024

Looking back at the entire year of 2024, Cloudflare received the most reports of Ransom DDoS attacks in May. In Q4, we can see the gradual increase starting from October (10%), November (13%), and December (14%) — a seven-month-high.


Reported Ransom DDoS attacks by month: 2024

Target of attacks

In 2024 Q4, China maintained its position as the most attacked country. To understand which countries are subject to more attacks, we group DDoS attacks by our customers’ billing country. 

Philippines makes its first appearance as the second most attacked country in the top 10. Taiwan jumped to third place, up seven spots compared to last quarter.

In the map below, you can see the top 10 most attacked locations and their ranking change compared to the previous quarter.


Top 10 most attacked locations by DDoS attacks: 2024 Q4

Most attacked industries

In the fourth quarter of 2024, the Telecommunications, Service Providers and Carriers industry jumped from the third place (last quarter) to the first place as the most attacked industry. To understand which industries are subject to more attacks, we group DDoS attacks by our customers’ industry. The Internet industry came in second, followed by Marketing and Advertising in third.

The Banking & Financial Services industry dropped seven places from number one in 2024 Q3 to number eight in Q4.


Top 10 most attacked industries by DDoS attacks: 2024 Q4

Our commitment to unmetered DDoS protection

The fourth quarter of 2024 saw a surge in hyper-volumetric Layer 3/Layer 4 DDoS attacks, with the largest one breaking our previous record, peaking at 5.6 Tbps. This rise in attack size renders capacity-limited cloud DDoS protection services or on-premise DDoS appliances obsolete.

The growing use of powerful botnets, driven by geopolitical factors, has broadened the range of vulnerable targets. A rise in Ransom DDoS attacks is also a growing concern.

Too many organizations only implement DDoS protection after suffering an attack. Our observations show that organizations with proactive security strategies are more resilient. At Cloudflare, we invest in automated defenses and a comprehensive security portfolio to provide proactive protection against both current and emerging threats.

With our 321 Tbps network spanning 330 cities globally, we remain committed to providing unmetered and unlimited DDoS protection no matter the size, duration and quantity of the attacks.

Bigger and badder: how DDoS attack sizes have evolved over the last decade

Post Syndicated from José Salvador original https://blog.cloudflare.com/bigger-and-badder-how-ddos-attack-sizes-have-evolved-over-the-last-decade

Distributed Denial of Service (DDoS) attacks are cyberattacks that aim to overwhelm and disrupt online services, making them inaccessible to users. By leveraging a network of distributed devices, DDoS attacks flood the target system with excessive requests, consuming its bandwidth or exhausting compute resources to the point of failure. These attacks can be highly effective against unprotected sites and relatively inexpensive for attackers to launch. Despite being one of the oldest types of attacks, DDoS attacks remain a constant threat, often targeting well-known or high traffic websites, services, or critical infrastructure. Cloudflare has mitigated over 14.5 million DDoS attacks since the start of 2024 — an average of 2,200 DDoS attacks per hour. (Our DDoS Threat Report for Q3 2024 contains additional related statistics).

If we look at the metrics associated with large attacks mitigated in the last 10 years, does the graph show a steady increase in an exponential curve that keeps getting steeper, especially over the last few years, or is it closer to linear growth? We found that the growth is not linear, but rather is exponential, with the slope dependent on the metric we are looking at.

Why is this question interesting? Simple. The answer to it provides valuable insights into the evolving strategies of attackers, the sophistication of their tools, and the readiness of defense mechanisms. 

As an example, an upward curve of the number of requests per second (rps) suggests that the attackers are changing something on their side that enables them to generate larger volumes of requests. This is an insight that prompts us to investigate more and look at other data to understand if anything new is happening.

For instance, at one of those moments, we looked at the source of the traffic and saw a shift from subscriber/enterprise IP address space (suggesting IoT) to cloud provider IP address space (suggesting VMs), and realized there was a shift in the type and capabilities of devices used by attackers. 

As another example: when the HTTP/2 Rapid Reset attack happened, the record number of requests per second seen at that time suggested that a new technique was being employed by attackers, prompting us to swiftly investigate what was being executed and adapt our defenses.

Defining individual attacks

Delimiting an individual attack in time is surprisingly blurry. First of all, an attack analysis can provide inconsistent observations at different layers of the OSI model. The footprint seen at all these different layers may tell different stories for the same attack. There are, however, some variables that together can allow us to create a fingerprint and enable us to group a set of events, establishing that they are part of the same individual attack. Examples include: 

  • Do we see the same attack vector(s) being used across this set of events?

  • Are all the attack events focused on the same target(s)?

  • Do the payloads on events share the same signature? (Specific data payloads or request types unique to certain types of attacks or botnets, like Mirai, which may use distinctive HTTP request headers or packet structures).

DDoS attack sizes 

Before we dive into a growth analysis of DDoS attacks over the last 10 years, let’s take a step back and have a look at the metrics typically used to measure them: requests per second (rps), packets per second (pps), and bits per second (bps). Each metric captures a different aspect of the attack’s scale and impact.

  • Requests per second (rps): Measures the number of HTTP or similar protocol requests made each second. This metric is particularly relevant for application-layer attacks (Layer 7), where the intent is to overwhelm a specific application or service by overloading its request handling, and is useful for measuring attacks targeting web servers, APIs, or applications because it reflects the volume of requests, not just raw data transfer.

  • Packets per second (pps): Represents the number of individual packets sent to the target per second, regardless of their size. This metric is critical for network-layer attacks (Layers 3 and 4), where the goal is to overwhelm network infrastructure by exceeding its packet-processing capacity. pps measurements are useful for volumetric attacks, identifying a quantity of packets that can impact routers, switches, or firewalls.

  • Bits per second (bps): This measures the total data transferred per second and is especially useful in evaluating network-layer attacks that aim to saturate the bandwidth of the target or its upstream provider. bps is widely used measuring Layer 3 and 4 attacks, such as UDP floods, where the attack intends to clog network bandwidth. This metric is often highlighted for DDoS attacks because high bps values (often measured in gigabits or terabits) signal bandwidth saturation, which is a common goal of large-scale DDoS campaigns.

Evolution of DDoS attack sizes over the last decade

So, how have DDoS attack sizes changed in the last decade? During this period, DDoS attacks have grown bigger and stronger, each year having the potential to be more disruptive. 

If we look at the metrics associated with large attacks seen in the last 10 years, does it look like we have a steady increase in an exponential curve that keeps steepening, especially in the last few years, or is it closer to a linear growth? We found that it is exponential, so let’s have a look at the details around why we came to that conclusion.

In this analysis, we used attacks that Google has seen from 2010 until 2022 as a baseline (Figure 1) that we extended with attacks that Cloudflare has seen in 2023 and 2024 (Figure 2). 

Going back in time, early in the 2010s, the largest attacks were measured in the Gigabits per second (Gbps) scale, but these days, it’s all about Terabits per second (Tbps). The number of requests per second (rps) and bits per second (bps) are also significantly higher these days, as we will see.

The historical data from Google shown below in Figure 1 reveals a rising trend in requests per second during DDoS attacks observed between 2010 and 2022, peaking at 6 Million requests per second (Mrps) in 2020. The increase highlights a significant escalation in attack volume across the decade.


Figure 1. Largest known DDoS attacks, 2010 – 2022. (Source: Google) 

Figure 2 (below) provides a view of trends seen across the different metrics. The escalation seen in Google’s statistics is also visible in Cloudflare’s data regarding large mitigated DDoS attacks observed in 2023 and 2024, reaching 201 Mrps (green line) in September 2024. The rate of packets per second (pps) demonstrates (blue line) a slight exponential growth over time, rising from 230 Mpps in 2015 to 2,100 Mpps in 2024, suggesting that attackers are achieving higher throughput. For bits per second (bps), the trend is also exponential and with a steeper upwards curve (red line), building from a 309 Gbps attack in 2013 to a 5.6 Tbps (5,600 Gbps) attack in 2024. 

Over roughly the last decade, attacks driving these metrics have seen significant growth rates:

  • Bits per second increased by 20x between 2013 and 2024

  • Packets per second increased by 10x between 2015 and 2024

  • Requests per second increased by 70x between 2014 and 2024


Figure 2. Data from Figure 1 extended with large attacks observed by Cloudflare in 2023 and 2024.

The blog posts listed in Table 1 highlight some of the attacks that we observed from 2021 to 2024.

Month

Attack size

Blog post

August 2021

17.2 Mrps

Cloudflare thwarts 17.2M rps DDoS attack — the largest ever reported

April 2022

15 Mrps

Cloudflare blocks 15M rps HTTPS DDoS attack

June 2022

26 Mrps

Cloudflare mitigates 26 million request per second DDoS attack

February 2023

71 Mrps

Cloudflare mitigates record-breaking 71 million request-per-second DDoS attack

September 2024

3.8 Tbps

How Cloudflare auto-mitigated world record 3.8 Tbps DDoS attack

October 2024

4.2 Tbps

4.2 Tbps of bad packets and a whole lot more: Cloudflare’s Q3 DDoS report 

October 2024

5.6 Tbps

5.6 Tbps attack

Table 1. Notable DDoS attacks observed by Cloudflare between 2021 – 2024.

An overview of other selected significant high volume DDoS attacks that have occurred over the last decade, including 2018’s Memcached abuse and 2023’s HTTP/2 “Rapid Reset” attacks, can be found on the Cloudflare Learning Center.

Attack duration as a metric

Attack duration is not an effective metric to use to qualify attack aggressiveness because establishing a duration of a single attack or campaign is challenging, due to their possible intermittent nature, the potential for a multitude of attack vectors being used at the same time, or how the different defense layers triggered over time. 

The attack patterns can differ considerably, with some consisting of a single large spike, while others featuring multiple tightly grouped spikes, or a continuous load maintained over a period of time, along with other changing characteristics.

Trend in types of devices used to create attacks

DDoS attacks are increasingly shifting from IoT-based botnets to more powerful VM-based botnets. This change is primarily due to the higher computational and throughput capabilities of cloud-hosted virtual machines, which allow attackers to launch massive attacks with far fewer devices. 

This shift is facilitated by several factors: VM botnets can be easier to establish than IoT botnets, as they don’t necessarily require widespread malware infections, since attackers can deploy them on cloud provider infrastructure anonymously using stolen payment details from data breaches or Magecart attacks.

This trend points to the evolution of DDoS tactics, as attackers exploit both the processing power of VMs and anonymized access to cloud resources, enabling smaller, more efficient botnets capable of launching large-scale attacks without the complexities involved in infecting and managing fleets of IoT devices.

How does Cloudflare help protect against DDoS attacks?

Cloudflare’s Connectivity Cloud, built on our expansive anycast global network, plays a crucial role in defending against DDoS attacks by leveraging automated detection, traffic distribution, and rapid response capabilities. Here’s how it strengthens DDoS protection:

Automated attack detection and mitigation: Cloudflare’s DDoS protection relies heavily on automation, using machine learning algorithms to identify suspicious traffic patterns in real time. By automating the detection process, Cloudflare can quickly recognize and block DDoS attacks without requiring manual intervention, which is critical in high-volume attacks that would overwhelm human responders.

Global traffic distribution with IP anycast: Cloudflare’s network spans over 330 cities worldwide, and DDoS traffic gets distributed across our multiple data centers. IP anycast allows us to distribute traffic across this global network, and this wide distribution helps absorb and mitigate large-scale attacks, as attack traffic is not directed towards a single point, reducing strain on individual servers and networks. 

Layered defense: Cloudflare’s Connectivity Cloud offers defense across multiple layers, including network (Layer 3), transport (Layer 4), and application (Layer 7). This layered approach allows for tailored defense strategies depending on the attack type, ensuring that even complex, multi-layered attacks can be mitigated effectively. Learn more about DDoS protection at layers 3, 4, and 7 in our DDoS protection documentation.

Unmetered DDoS mitigation: Pioneering this approach since 2017 to ensure Internet security, Cloudflare provides unmetered DDoS protection, meaning customers are protected without worrying about bandwidth or cost limitations during attacks. This approach helps ensure that businesses, regardless of size or budget, can benefit from robust DDoS protection.

Cloudflare’s distributed cloud infrastructure and advanced technology allows us to detect, absorb, and mitigate DDoS attacks in a way that is both scalable and responsive, avoiding downtime and maintaining service reliability, providing a robust solution to tackle the rising intensity and frequency of DDoS attacks compared to traditional options.

Protecting against DDoS attacks is essential for organizations of every size. Although humans initiate these attacks, they’re carried out by bots, so effective defense requires automated tools to counter bot-driven threats. Real-time detection and mitigation should be as automated as possible, since relying solely on human intervention puts defenders at a disadvantage as attackers adapt to new barriers and can change attack vectors, traffic behavior, payload signatures, among others, creating an unpredicted scenario and thus rendering some manual configurations useless. Cloudflare’s automated systems continuously identify and block DDoS attacks on behalf of our customers, enabling tailored protection that meets individual needs.

Our mission is to help build a better Internet, and providing resilience in the face of DDoS threats is a part of accomplishing that mission.

Read more about Cloudflare DDoS protection in our public technical documentation.

4.2 Tbps of bad packets and a whole lot more: Cloudflare’s Q3 DDoS report

Post Syndicated from Omer Yoachimik original https://blog.cloudflare.com/ddos-threat-report-for-2024-q3

Welcome to the 19th edition of the Cloudflare DDoS Threat Report. Released quarterly, these reports provide an in-depth analysis of the DDoS threat landscape as observed across the Cloudflare network. This edition focuses on the third quarter of 2024.

With a 296 Terabit per second (Tbps) network located in over 330 cities worldwide, Cloudflare is used as a reverse proxy by nearly 20% of all websites. Cloudflare holds a unique vantage point to provide valuable insights and trends to the broader Internet community.

Key insights 

  • The number of DDoS attacks spiked in the third quarter of 2024. Cloudflare mitigated nearly 6 million DDoS attacks, representing a 49% increase QoQ and 55% increase YoY.

  • Out of those 6 million, Cloudflare’s autonomous DDoS defense systems detected and mitigated over 200 hyper-volumetric DDoS attacks exceeding rates of 3 terabits per second (Tbps) and 2 billion packets per second (Bpps). The largest attack peaked at 4.2 Tbps and lasted just a minute.

  • The Banking & Financial Services industry was subjected to the most DDoS attacks. China was the country most targeted by DDoS attacks, and Indonesia was the largest source of DDoS attacks.

To learn more about DDoS attacks and other types of cyber threats, visit our Learning Center, access previous DDoS threat reports on the Cloudflare blog, or visit our interactive hub, Cloudflare Radar. There’s also a free API for those interested in investigating these and other Internet trends. You can also learn more about the methodologies used in preparing these reports.

Hyper-volumetric campaign

In the first half of 2024, Cloudflare’s autonomous DDoS defense systems automatically detected and mitigated 8.5 million DDoS attacks: 4.5 million in Q1 and 4 million in Q2. In Q3, our systems mitigated nearly 6 million DDoS attacks bringing it to a total of 14.5 million DDoS attacks year-to-date. That’s an average of around 2,200 DDoS attacks every hour.

Of those attacks, Cloudflare mitigated over 200 hyper-volumetric network-layer DDoS attacks that exceeded 1 Tbps or 1 Bpps. The largest attacks peaked at 3.8 Tbps and 2.2 Bpps. Read more about these attacks and how our DDoS defense systems mitigated them autonomously.


Distribution of hyper-volumetric DDoS attacks over time

As we were writing this blog post, our systems continued to detect and mitigate these massive attacks and a new record has just been broken again, only three weeks after our last disclosure. On October 21, 2024, Cloudflare’s systems autonomously detected and mitigated a 4.2 Tbps DDoS attack that lasted around a minute.


4.2 Tbps DDoS attack mitigated autonomously by Cloudflare

DDoS attack types and characteristics

Of the 6 million DDoS attacks, half were HTTP (application layer) DDoS attacks and half were network layer DDoS attacks. Network layer DDoS attacks increased by 51% QoQ and 45% YoY, and HTTP DDoS attacks increased by 61% QoQ and 68% YoY.

Attack duration

90% of DDoS attacks, including the largest of attacks, were very short-lived. We did see, however, a slight increase (7%) in attacks lasting more than an hour. These longer attacks accounted for 3% of all attacks.

Attack vectors

In Q3, we saw an even distribution in the number of network-layer DDoS attacks compared to HTTP DDoS attacks. Of the network-layer DDoS attacks, SYN flood was the top attack vector followed by DNS flood attacks, UDP floods, SSDP reflection attacks, and ICMP reflection attacks.

On the application layer, 72% of HTTP DDoS attacks were launched by known botnets and automatically mitigated by our proprietary heuristics. The fact that 72% of DDoS attacks were mitigated by our home-grown heuristics showcases the advantages of operating a large network. The volume of traffic and attacks that we see let us craft, test, and deploy robust defenses against botnets.

Another 13% of HTTP DDoS attacks were mitigated due to their suspicious or unusual HTTP attributes, and another 9% were HTTP DDoS attacks launched by fake browsers or browser impersonators. The remaining 6% of “Other” includes attacks that targeted login endpoints and cache busting attacks.

One thing to note is that these attack vectors, or attack groups, are not necessarily exclusive. For example, known botnets also impersonate browsers and have suspicious HTTP attributes, but this breakdown is our attempt to categorize the HTTP DDoS attacks in a meaningful way.


Distribution of DDoS attacks in 2024 Q3

In Q3, we observed a 4,000% increase in SSDP amplification attacks compared to the previous quarter. An SSDP (Simple Service Discovery Protocol) attack is a type of reflection and amplification DDoS attack that exploits the UPnP (Universal Plug and Play) protocol. Attackers send SSDP requests to vulnerable UPnP-enabled devices such as routers, printers, and IP-enabled cameras, and spoof the source IP address to be the victim’s IP address. These devices respond to the victim’s IP address with large amounts of traffic, overwhelming the victim’s infrastructure. The amplification effect allows attackers to generate massive traffic from small requests, causing the victim’s service to go offline. Disabling UPnP on unnecessary devices and using DDoS mitigation strategies can help defend against this attack.


Illustration of an SSDP amplification attack

User agents used in HTTP DDoS attacks

When launching HTTP DDoS attacks, threat actors want to blend in to avoid detection. One tactic to achieve this is to spoof the user agent. This lets them appear as a legitimate browser or client if done successfully.

In Q3, 80% of HTTP DDoS attack traffic impersonated the Google Chrome browser, which was the most common user agent observed in attacks. More specifically, Chrome 118, 119, 120, and 121 were the most common versions.

In second place, no user agent was seen for 9% of HTTP DDoS attack traffic.

In third and fourth place, we observed attacks using the Go-http-client and fasthttp user agents. The former is the default HTTP client in Go’s standard library and the latter is a high-performance alternative. fasthttp is used to build fast web applications, but is often used for DDoS attacks and web scraping too.


Top user agents used in DDoS attacks

The user agent hackney came in fifth place. It’s an HTTP client library for Erlang. It’s used for making HTTP requests and is popular in Erlang/Elixir ecosystems.

An interesting user agent shows up in the sixth place: HITV_ST_PLATFORM. This user agent appears to be associated with smart TVs or set-top boxes. Threat actors typically avoid using uncommon user agents, as evidenced by the frequent use of Chrome user agents in cyberattacks. Therefore, the presence of HITV_ST_PLATFORM likely suggests that the devices in question are indeed compromised smart TVs or set-top boxes.

In seventh place, we saw the uTorrent user agent being used in attacks. This user agent is associated with a popular BitTorrent client that’s used for downloading files.

Lastly, okhttp was the least common user agent in DDoS attacks despite its popularity as an HTTP client for Java and Android applications. 

HTTP attack attributes

While 89% of HTTP DDoS attack traffic used the GET method, it is also the most commonly used HTTP method. So when we normalize the attack traffic by dividing the number of attack requests by total request per HTTP method, we get a different picture.

Almost 12% of all requests that used the DELETE method were part of an HTTP DDoS attack. After DELETE, we see that HEAD, PATCH and GET are the methods most commonly used in DDoS attack requests.


While 80% of DDoS attack requests were over HTTP/2 and 19% were over HTTP/1.1, they represented a much smaller portion when normalized by the total traffic by version. When we normalize the attack requests by all requests by version, we see a different picture. Over half of traffic to the non-standard or mislabeled “HTTP/1.2” version was malicious and part of DDoS attacks. It’s important to note that “HTTP/1.2” is not an official version of the protocol.


The vast majority of HTTP DDoS attacks are actually encrypted — almost 94% — using HTTPS.


Targets of DDoS attacks

Top attacked locations

China was the most attacked location in the third quarter of 2024. The United Arab Emirates was ranked second, with Hong Kong in third place, followed closely by Singapore, Germany, and Brazil.


Canada was ranked seventh, followed by South Korea, the United States, and Taiwan as number ten.

Top attacked industries

In the third quarter of 2024, Banking & Financial Services was the most targeted by DDoS attacks. Information Technology & Services was ranked in second place, followed by the Telecommunications, Service Providers, and Carriers sector.


Cryptocurrency, Internet, Gambling & Casinos, and Gaming followed closely behind as the next most targeted industries. Consumer Electronics, Construction & Civil Engineering, and the Retail industries rounded out the top ten most attacked industries.

Sources of DDoS attacks

Threat actors

For a few years now, we’ve been surveying our customers that have been subjected to DDoS attacks. The survey covers various factors, such as the nature of the attack and the threat actors. In the case of threat actors, while 80% of survey respondents said that they don’t know who attacked them, 20% said they did. Of those, 32% said that the threat actors were extortionists. Another 25% said a competitor attacked them, and another 21% said that a disgruntled customer or user was behind the attack. 14% of respondents said that the attacks were carried out by a state or a state-sponsored group. Lastly, 7% said that they mistakenly attacked themselves. One example of when a self-DDoS attack occurs is a post-firmware update for IoT devices that causes all devices to phone home at the same time, resulting in a flood of traffic.


Distribution of the top threat actors

While extortionists were the most common threat actor, overall, reports of Ransom DDoS attacks decreased by 42% QoQ, but increased 17% YoY. A total of 7% of respondents reported being subjected to a Ransom DDoS attack or threatened by the attacker. In August, however, that figure increased to 10% — that’s one out of ten.


Reports of Ransom DDoS attacks by quarter

Top source locations of DDoS attacks

Indonesia was the largest source of DDoS attacks in the third quarter of 2024. The Netherlands was the second-largest source, followed by Germany, Argentina, and Colombia.


The next five largest sources included Singapore, Hong Kong, Russia, Finland, and Ukraine.

Top source networks of DDoS attacks

For service providers that operate their own networks and infrastructure, it can be difficult to identify who is using their infrastructure for malicious intent, such as generating DDoS attacks. For this reason, we provide a free threat intelligence feed to network operators. This feed provides service providers information on IP addresses from within their networks that we’ve seen participate in subsequent DDoS attacks.

On that note, Hetzner (AS24940), a German-based IT provider, was the largest source of HTTP DDoS attacks in the third quarter of 2024. Linode (AS63949), a cloud computing platform acquired by Akamai in 2022, was the second-largest source of HTTP DDoS attacks. Vultr (AS64515), a Florida-based service provider, came in third place.

Netcup (AS197540), another German-based IT provider, came in fourth place. Google Cloud Platform (AS15169) followed in fifth place. DigitalOcean (AS14061) came in sixth place, followed by French provider OVH (AS16276), Stark Industries (AS44477), Amazon Web Services (AS16509), and Microsoft (AS8075).


Networks that were that largest sources of HTTP DDoS attacks in 2024 Q3

Key takeaways

This quarter, we observed an unprecedented surge in hyper-volumetric DDoS attacks, with peaks reaching 3.8 Tbps and 2.2 Bpps. This mirrors a similar trend from the same period last year, when application layer attacks in the HTTP/2 Rapid Reset campaign exceeded 200 million requests per second (Mrps). These massive attacks are capable of overwhelming Internet properties, particularly those relying on capacity-limited cloud services or on-premise solutions.

The increasing use of powerful botnets, fueled by geopolitical tensions and global events, is expanding the range of organizations at risk — many of which were not traditionally considered prime targets for DDoS attacks. Unfortunately, too many organizations reactively deploy DDoS protections after an attack has already caused significant damage.

Our observations confirm that businesses with well-prepared, comprehensive security strategies are far more resilient against these cyberthreats. At Cloudflare, we’re committed to safeguarding your Internet presence. Through significant investment in our automated defenses and a robust portfolio of security products, we ensure proactive protection against both current and emerging threats — so you don’t have to.

How Cloudflare auto-mitigated world record 3.8 Tbps DDoS attack

Post Syndicated from Manish Arora original https://blog.cloudflare.com/how-cloudflare-auto-mitigated-world-record-3-8-tbps-ddos-attack

Since early September, Cloudflare’s DDoS protection systems have been combating a month-long campaign of hyper-volumetric L3/4 DDoS attacks. Cloudflare’s defenses mitigated over one hundred hyper-volumetric L3/4 DDoS attacks throughout the month, with many exceeding 2 billion packets per second (Bpps) and 3 terabits per second (Tbps). The largest attack peaked 3.8 Tbps — the largest ever disclosed publicly by any organization. Detection and mitigation was fully autonomous. The graphs below represent two separate attack events that targeted the same Cloudflare customer and were mitigated autonomously.


A mitigated 3.8 Terabits per second DDoS attack that lasted 65 seconds


A mitigated 2.14 billion packet per second DDoS attack that lasted 60 seconds

Cloudflare customers are protected

Cloudflare customers using Cloudflare’s HTTP reverse proxy services (e.g. Cloudflare WAF and Cloudflare CDN) are automatically protected.

Cloudflare customers using Spectrum and Magic Transit are also automatically protected. Magic Transit customers can further optimize their protection by deploying Magic Firewall rules to enforce a strict positive and negative security model at the packet layer.

Other Internet properties may not be safe

The scale and frequency of these attacks are unprecedented. Due to their sheer size and bits/packets per second rates, these attacks have the ability to take down unprotected Internet properties, as well as Internet properties that are protected by on-premise equipment or by cloud providers that just don’t have sufficient network capacity or global coverage to be able to handle these volumes alongside legitimate traffic without impacting performance. 

Cloudflare, however, does have the network capacity, global coverage, and intelligent systems needed to absorb and automatically mitigate these monstrous attacks. 

In this blog post, we will review the attack campaign and why its attacks are so severe. We will describe the anatomy of a Layer 3/4 DDoS attack, its objectives, and how attacks are generated. We will then proceed to detail how Cloudflare’s systems were able to autonomously detect and mitigate these monstrous attacks without impacting performance for our customers. We will describe the key aspects of our defenses, starting with how our systems generate real-time (dynamic) signatures to match the attack traffic all the way to how we leverage kernel features to drop packets at wire-speed.

Campaign analysis

We have observed this attack campaign targeting multiple customers in the financial services, Internet, and telecommunication industries, among others. This attack campaign targets bandwidth saturation as well as resource exhaustion of in-line applications and devices.

The attacks predominantly leverage UDP on a fixed port, and originated from across the globe with larger shares coming from Vietnam, Russia, Brazil, Spain, and the US. 

The high packet rate attacks appear to originate from multiple types of compromised devices, including MikroTik devices, DVRs, and Web servers, orchestrated to work in tandem and flood the target with exceptionally large volumes of traffic. The high bitrate attacks appear to originate from a large number of compromised ASUS home routers, likely exploited using a CVE 9.8 (Critical) vulnerability that was recently discovered by Censys.


Anatomy of DDoS attacks

Before we discuss how Cloudflare automatically detected and mitigated the largest DDoS attacks ever seen, it‘s important to understand the basics of DDoS attacks. 


Simplified diagram of a DDoS attack

The goal of a Distributed Denial of Service (DDoS) attack is to deny legitimate users access to a service. This is usually done by exhausting resources needed to provide the service. In the context of these recent Layer 3/4 DDoS attacks, that resource is CPU cycles and network bandwidth.

Exhausting CPU cycles

Processing a packet consumes CPU cycles. In the case of regular (non-attack) traffic, a legitimate packet received by a service will cause that service to perform some action, and different actions require different amounts of CPU processing. However, before a packet is even delivered to a service there is per-packet work that needs to be done. Layer 3 packet headers need to be parsed and processed to deliver the packet to the correct machine and interface. Layer 4 packet headers need to be processed and routed to the correct socket (if any). There may be multiple additional processing steps that inspect every packet. Therefore, if an attacker sends at a high enough packet rate, then they can potentially saturate the available CPU resources, denying service to legitimate users.


To defend against high packet rate attacks, you need to be able to inspect and discard the bad packets using as few CPU cycles as possible, leaving enough CPU to process the good packets. You can additionally acquire more, or faster, CPUs to perform the processing — but that can be a very lengthy process that bears high costs. 

Exhausting network bandwidth

Network bandwidth is the total amount of data per time that can be delivered to a server. You can think of bandwidth like a pipe to transport water. The amount of water we can deliver through a drinking straw is less than what we could deliver through a garden hose. If an attacker is able to push more garbage data into the pipe than it can deliver, then both the bad data and the good data will be discarded upstream, at the entrance to the pipe, and the DDoS is therefore successful.


Defending against attacks that can saturate network bandwidth can be difficult because there is very little that can be done if you are on the downstream side of the saturated pipe. There are really only a few choices: you can get a bigger pipe, you can potentially find a way to move the good traffic to a new pipe that isn’t saturated, or you can hopefully ask the upstream side of the pipe to stop sending some or all of the data into the pipe.

Generating DDoS attacks

If we think about what this means from the attackers point of view you realize there are similar constraints. Just as it takes CPU cycles to receive a packet, it also takes CPU cycles to create a packet. If, for example, the cost to send and receive a packet were equal, then the attacker would need an equal amount of CPU power to generate the attack as we would need to defend against it. In most cases this is not true — there is a cost asymmetry, as the attacker is able to generate packets using fewer CPU cycles than it takes to receive those packets. However, it is worth noting that generating attacks is not free and can require a large amount of CPU power.

Saturating network bandwidth can be even more difficult for an attacker. Here the attacker needs to be able to output more bandwidth than the target service has allocated. They actually need to be able to exceed the capacity of the receiving service. This is so difficult that the most common way to achieve a network bandwidth attack is to use a reflection/amplification attack method, for example a DNS Amplification attack. These attacks allow the attacker to send a small packet to an intermediate service, and the intermediate service will send a large packet to the victim.

In both scenarios, the attacker needs to acquire or gain access to many devices to generate the attack. These devices can be acquired in a number of different ways. They may be server class machines from cloud providers or hosting services, or they can be compromised devices like DVRs, routers, and webcams that have been infected with the attacker’s malware. These machines together form the botnet.

How Cloudflare defends against large attacks

Now that we understand the fundamentals of how DDoS attacks work, we can explain how Cloudflare can defend against these attacks.

Spreading the attack surface using global anycast

The first not-so-secret ingredient is that Cloudflare’s network is built on anycast. In brief, anycast allows a single IP address to be advertised by multiple machines around the world. A packet sent to that IP address will be served by the closest machine. This means when an attacker uses their distributed botnet to launch an attack, the attack will be received in a distributed manner across the Cloudflare network. An infected DVR in Dallas, Texas will send packets to a Cloudflare server in Dallas. An infected webcam in London will send packets to a Cloudflare server in London.


Anycast vs. Unicast networks

Our anycast network additionally allows Cloudflare to allocate compute and bandwidth resources closest to the regions that need them the most. Densely populated regions will generate larger amounts of legitimate traffic, and the data centers placed in those regions will have more bandwidth and CPU resources to meet those needs. Sparsely populated regions will naturally generate less legitimate traffic, so Cloudflare data centers in those regions can be sized appropriately. Since attack traffic is mainly coming from compromised devices, those devices will tend to be distributed in a manner that matches normal traffic flows sending the attack traffic proportionally to datacenters that can handle it. And similarly, within the datacenter, traffic is distributed across multiple machines.

Additionally, for high bandwidth attacks, Cloudflare’s network has another advantage. A large proportion of traffic on the Cloudflare network does not consume bandwidth in a symmetrical manner. For example, an HTTP request to get a webpage from a site behind Cloudflare will be a relatively small incoming packet, but produce a larger amount of outgoing traffic back to the client. This means that the Cloudflare network tends to egress far more legitimate traffic than we receive. However, the network links and bandwidth allocated are symmetrical, meaning there is an abundance of ingress bandwidth available to receive volumetric attack traffic.

Generating real-time signatures

By the time you’ve reached an individual server inside a datacenter, the bandwidth of the attack has been distributed enough that none of the upstream links are saturated. That doesn’t mean the attack has been fully stopped yet, since we haven’t dropped the bad packets. To do that, we need to sample traffic, qualify an attack, and create rules to block the bad packets. 

Sampling traffic and dropping bad packets is the job of our l4drop component, which uses XDP (eXpress Data Path) and leverages an extended version of the Berkeley Packet Filter known as eBPF (extended BPF). This enables us to execute custom code in kernel space and process (drop, forward, or modify) each packet directly at the network interface card (NIC) level. This component helps the system drop packets efficiently without consuming excessive CPU resources on the machine. 


Cloudflare DDoS protection system overview

We use XDP to sample packets to look for suspicious attributes that indicate an attack. The samples include fields such as the source IP, source port, destination IP, destination port, protocol, TCP flags, sequence number, options, packet rate and more. This analysis is conducted by the denial of service daemon (dosd). Dosd holds our secret sauce. It has many filters which instruct it, based on our curated heuristics, when to initiate mitigation. To our customers, these filters are logically grouped by attack vectors and exposed as the DDoS Managed Rules. Our customers can customize their behavior to some extent, as needed.

As it receives samples from XDP, dosd will generate multiple permutations of fingerprints for suspicious traffic patterns. Then, using a data streaming algorithm, dosd will identify the most optimal fingerprints to mitigate the attack. Once attack is qualified, dosd will push a mitigation rule inline as an eBPF program to surgically drop the attack traffic. 

The detection and mitigation of attacks by dosd is done at the server level, at the data center level and at the global level — and it’s all software defined. This makes our network extremely resilient and leads to almost instant mitigation. There are no out-of-path “scrubbing centers” or “scrubbing devices”. Instead, each server runs the full stack of the Cloudflare product suite including the DDoS detection and mitigation component. And it is all done autonomously. Each server also gossips (multicasts) mitigation instructions within a data center between servers, and globally between data centers. This ensures that whether an attack is localized or globally distributed, dosd will have already installed mitigation rules inline to ensure a robust mitigation.

Strong defenses against strong attacks

Our software-defined, autonomous DDoS detection and mitigation systems run across our entire network. In this post we focused mainly on our dynamic fingerprinting capabilities, but our arsenal of defense systems is much larger. The Advanced TCP Protection system and Advanced DNS Protection system work alongside our dynamic fingerprinting to identify sophisticated and highly randomized TCP-based DDoS attacks and also leverages statistical analysis to thwart complex DNS-based DDoS attacks. Our defenses also incorporate real-time threat intelligence, traffic profiling, and machine learning classification as part of our Adaptive DDoS Protection to mitigate traffic anomalies. 

Together, these systems, alongside the full breadth of the Cloudflare Security portfolio, are built atop of the Cloudflare network — one of the largest networks in the world — to ensure our customers are protected from the largest attacks in the world.

Network trends and natural language: Cloudflare Radar’s new Data Explorer & AI Assistant

Post Syndicated from David Belson original https://blog.cloudflare.com/radar-data-explorer-ai-assistant

Cloudflare Radar showcases global Internet traffic patterns, attack activity, and technology trends and insights. It is powered by data from Cloudflare’s global network, as well as aggregated and anonymized data from Cloudflare’s 1.1.1.1 public DNS Resolver, and is built on top of a rich, publicly accessible API. This API allows users to explore Radar data beyond the default set of visualizations, for example filtering by protocol, comparing metrics across multiple locations or autonomous systems, or examining trends over two different periods of time. However, not every user has the technical know-how to make a raw API query or process the JSON-formatted response.

Today, we are launching the Cloudflare Radar Data Explorer, which provides a simple Web-based interface to enable users to easily build more complex API queries, including comparisons and filters, and visualize the results. And as a complement to the Data Explorer, we are also launching an AI Assistant, which uses Cloudflare Workers AI to translate a user’s natural language statements or questions into the appropriate Radar API calls, the results of which are visualized in the Data Explorer. Below, we introduce the AI Assistant and Data Explorer, and also dig into how we used Cloudflare Developer Platform tools to build the AI Assistant.

Ask the AI Assistant

Sometimes, a user may know what they are looking for, but aren’t quite sure how to build the relevant API query by selecting from the available options and filters. (The sheer number may appear overwhelming.) In those cases, they can simply pose a question to the AI Assistant, like “Has there been an uptick in malicious email over the last week?” The AI Assistant makes a series of Workers AI and Radar API calls to retrieve the relevant data, which is visualized within seconds:


The AI Assistant pane is found on the right side of the page in desktop browsers, and appears when the user taps the “AI Assistant” button on a mobile browser. To use the AI Assistant, users just need to type their question into the “Ask me something” area at the bottom of the pane and submit it. A few sample queries are also displayed by default to provide examples of how and what to ask, and clicking on one submits it.


The submitted question is evaluated by the AI Assistant (more below on how that happens), and the resulting visualization is displayed in the Results section of the Data Explorer. In addition to the visualization of the results, the appropriate Data, Filter, and Compare options are selected in the Query section above the visualization, allowing the user to further tune or refine the results if necessary. The Keep current filters toggle within the AI Assistant pane allows users to build on the previous question. For example, with that toggle active, a user could ask “Traffic in the United States”, see the resultant graph, and then ask “Compare it with traffic in Mexico” to add Mexico’s data to the graph.

Building a query directly

For users that prefer a more hands-on approach, a wide variety of Radar datasets are available to explore, including traffic metrics, attacks, Internet quality, email security, and more. Once the user selects a dataset, the Breakdown By: dropdown is automatically populated with relevant options (if any), and Filter options are also dynamically populated. As the user selects additional options, the visualization in the Result section is automatically updated.

In addition to building the query of interest, Data Explorer also enables the user to compare the results, both against a specific date range and/or another location or autonomous system (AS). To compare results with the immediately previous period (the last seven days with the seven days before that, for instance), just toggle on the Previous period switch. Otherwise, clicking on the Date Range field brings up a calendar that enables the user to select a starting date — the corresponding date range is intelligently selected, based on the date range selected in the Filter section. To compare results across locations or ASNs, clicking on the “Location or ASN” field brings up a search box in which the user can enter a location (country/region) name, AS name, or AS number, with search results updating as the user types. Note that locations can be compared with other locations or ASes, and ASes can be compared with other ASes or locations. This enables a user, for example, to compare trends for their ISP with trends for their country.

Visualizing the results

Much of the value of Cloudflare Radar comes from its visualizations – the graphs, maps, and tables that illustrate the underlying data, and Data Explorer does not disappoint here. Depending on the dataset and filters selected, and the volume of data returned, results may be visualized in a time series graph, bar chart, treemap, or global choropleth map. The visualization type is determined automatically based on the contents of the API response. For example, the presence of countryalpha2 keys in the response means a choropleth map will be used, the presence of timestamps in the response means a line graph (“xychart”) should be shown, and more than 40 items in the response selects a treemap as the visualization type.

To illustrate the extended visualizations available in Data Explorer, the figure below is an expanded version of one that would normally be found on Radar’s Adoption & Usage page. The “standard” version of the graph plots the shares of the HTTP versions over the last seven days for the United States, as well as the summary share values. In this extended version of the graph generated in the Data Explorer, we compare data for the United States with HTTP version share data for AS701 (Verizon), for both the past seven days and the previous seven-day period. In addition to the comparisons plotted on the time series graph, the associated summary values are also compared in an accompanying bar chart. This comprehensive visualization makes comparisons easy.


For some combinations of datasets/filters/comparisons, time series graphs can get quite busy, with a significant number of lines being plotted. To isolate just a single line on the graph, double-click on the item in the legend. To add/remove additional lines back to/from the graph, single-click on the relevant legend item.

Similar to other visualizations on Radar, the resulting graphs or maps can be downloaded, copied, or embedded into another website or application. Simply click on the “Share” button above the visualization card to bring up the Share modal dialog. We hope to see these graphs shared in articles, blog posts, and presentations, and to see embedded visualizations with real-time data in your portals and operations centers!

Still want to use the API? No problem.

Although Data Explorer was designed to simplify the process of building, and viewing the results of, more complex API queries, we recognize that some users may still want to retrieve data directly from the API. To enable that, Data Explorer’s API section provides copyable API calls as a direct request URL and a cURL command. The raw data returned by the query is also available to copy or download as a JSON blob, for those users that want to save it locally, or paste it into another application for additional manipulation or analysis.


How we built the AI Assistant

Knowing all that AI is capable of these days, we thought that creating a system for an LLM to answer questions didn’t seem like an overly complex task. While there were some challenges, Cloudflare’s developer platform tools thankfully made it fairly straightforward. 

LLM-assisted API querying

The main challenge we encountered in building the API Assistant was the large number of combinations of datasets and parameters that can potentially be visualized in the Data Explorer. There are around 100 API endpoints from which the data can be fetched, with most able to take multiple parameters.

There were a few potential approaches to getting started. One was to take a previously trained LLM and further train it with the API endpoint descriptions in order to have it return the output in the required structured format which would then be used to execute the API query. However, for the first version, we decided against this approach of fine-tuning, as we wanted to quickly test a few different models supported by Workers AI, and we wanted the flexibility to easily add or remove parameter combinations, as Data Explorer development was still under way. As such, we decided to start with prompt engineering, where all the endpoint-specific information is placed in the instructions sent to the LLM.

Putting the full detailed description of the API endpoints supported by the Data Explorer into the system prompt would be possible for an LLM with a larger context window (the number of tokens the model takes as input before generating output). Newer models are getting better with the needle in a haystack problem, which refers to the issue whereby LLMs do not retrieve information (the needle) equally well if it is placed in different positions within the long textual input (the haystack). However, it has been empirically shown that the position of information within the large context still matters. Additionally, many of the Radar API endpoints have quite similar descriptions, and putting all the descriptions in a single instruction could be more confusing for the model, and the processing time also increases with larger contexts. Based on this, we adopted the approach of having multiple inference calls to an LLM.

First, when the user enters a question, a Worker sends this question and a short general description of the available datasets to the LLM, asking it to determine the topic of the question. Then, based on the topic returned by the model, a system prompt is generated with the endpoint descriptions, including only those related to the topic. This prompt, along with the original question, is sent to the LLM asking it to select the appropriate endpoint and its specific parameters. At the same time, two parallel inference calls to the model are also made, one with the question and the system prompt related to the description of location parameters, and another with the description of time range parameters. Then, all three model outputs are put together and validated.

If the final output is a valid dataset and parameter combination, it is sent back to the Data Explorer, which executes the API query and displays the resulting visualization for the user. Different LLMs were tested for this task, and at the end, openhermes-2.5-mistral-7b, trained on code datasets, was selected as the best option. To give the model more context, not only is the user’s current question sent to the model, but the previous one and its response are as well, in case the next question asked by the user is related to the previous one. In addition, calls to the model are sent through Cloudflare’s AI Gateway, to allow for caching, rate limiting, and logging.

After the user is shown the result, they can indicate whether what was shown to them was useful or not by clicking the “thumbs up” or “thumbs down” icons in the response. This rating information is saved with the original question in D1, our serverless SQL database, so the results can be analyzed and applied to future AI Assistant improvements.

The full end-to-end data flow for the Cloudflare Radar AI Assistant is illustrated in the diagram below.


When the LLM doesn’t know the answer

In some cases, however, the LLM may not “know” the answer to the question posed by the user. If the model does not generate a valid final response, then the user is shown three alternative questions. The intent here is to guide the user into asking an answerable question — that is, a question that is answerable with data from Radar.

This is achieved using a previously compiled (static) list of various questions related to different Radar datasets. For each of these questions, their embedding is calculated using an embeddings model, and stored in our Vectorize vector database. “Embeddings” are  numerical representations of textual data (vectors) capturing their semantic meaning and relationships, with similar text having vectors that are closer. When a user’s question does not generate a valid model response, the embedding of that question is calculated, and its vector is compared against all the stored vectors from the vector database, and the three most similar ones are selected. These three questions, determined to be similar to the user’s original question, are then shown to the user.

There are also cases when the LLM gives answers which do not correspond to what the user asked, as hallucinations are currently inevitable in LLMs, or when time durations are calculated inaccurately, as LLMs sometimes struggle with mathematical calculations. To help guard against this, AI Assistant responses are first validated against the API schema to confirm that the dataset and the parameter combination is valid. Additionally, Data Explorer dropdown options are automatically populated based on the AI Assistant’s response, and the chart titles are also automatically generated, so the user always knows exactly what data is shown in the visualization, even if it might not answer their actual question. 

Looking ahead

We’re excited to enable more granular access to the rich datasets that currently power Cloudflare Radar. As we add new datasets in the future, such as DNS metrics, these will be available through Data Explorer and AI Assistant as well.

As noted above, Radar offers a predefined set of visualizations, and these serve as an excellent starting point for further exploration. We are adding links from each Radar visualization into Data Explorer, enabling users to further analyze the associated data to answer more specific questions. Clicking the “pie chart” icon next to a graph’s description brings up a Data Explorer page with the relevant metrics, options, and filters selected.


Correlating observations across two different metrics is another capability that we are also working on adding to Data Explorer. For example, if you are investigating an Internet disruption, you will be able to plot traffic trends and announced IP address space for a given country or autonomous system on the same graph to determine if both dropped concurrently.

But for now, use the Data Explorer and AI Assistant to go beyond what Cloudflare Radar offers, finding answers to your questions about what’s happening on the Internet.  If you share Data Explorer visualizations on social media, be sure to tag us: @CloudflareRadar (X), noc.social/@cloudflareradar (Mastodon), and radar.cloudflare.com (Bluesky). You can also reach out on social media, or contact us via email, with suggestions for future Data Explorer and AI Assistant functionality.


DDoS threat report for 2024 Q2

Post Syndicated from Omer Yoachimik original https://blog.cloudflare.com/ddos-threat-report-for-2024-q2


Welcome to the 18th edition of the Cloudflare DDoS Threat Report. Released quarterly, these reports provide an in-depth analysis of the DDoS threat landscape as observed across the Cloudflare network. This edition focuses on the second quarter of 2024.

With a 280 terabit per second network located across over 230 cities worldwide, serving 19% of all websites, Cloudflare holds a unique vantage point that enables us to provide valuable insights and trends to the broader Internet community.

Key insights for 2024 Q2

  • Cloudflare recorded a 20% year-over-year increase in DDoS attacks.
  • 1 out of every 25 survey respondents said that DDoS attacks against them were carried out by state-level or state-sponsored threat actors.
  • Threat actor capabilities reached an all-time high as our automated defenses generated 10 times more fingerprints to counter and mitigate the ultrasophisticated DDoS attacks.

Quick recap – what is a DDoS attack?

Before diving in deeper, let’s recap what a DDoS attack is. Short for Distributed Denial of Service, a DDoS attack is a type of cyber attack designed to take down or disrupt Internet services, such as websites or mobile apps, making them unavailable to users. This is typically achieved by overwhelming the victim’s server with more traffic than it can handle — usually from multiple sources across the Internet, rendering it unable to handle legitimate user traffic.

Diagram of a DDoS attack

To learn more about DDoS attacks and other types of cyber threats, visit our Learning Center, access previous DDoS threat reports on the Cloudflare blog or visit our interactive hub, Cloudflare Radar. There’s also a free API for those interested in investigating these and other Internet trends.

To learn about our report preparation, refer to our Methodologies.

Threat actor sophistication fuels the continued increase in DDoS attacks

In the first half of 2024, we mitigated 8.5 million DDoS attacks: 4.5 million in Q1 and 4 million in Q2. Overall, the number of DDoS attacks in Q2 decreased by 11% quarter-over-quarter, but increased 20% year-over-year.

Distribution of DDoS attacks by types and vectors

For context, in the entire year of 2023, we mitigated 14 million DDoS attacks, and halfway through 2024, we have already mitigated 60% of last year’s figure.

Cloudflare successfully mitigated 10.2 trillion HTTP DDoS requests and 57 petabytes of network-layer DDoS attack traffic, preventing it from reaching our customers’ origin servers.

DDoS attacks stats for 2024 Q2

When we break it down further, those 4 million DDoS attacks were composed of 2.2 million network-layer DDoS attacks and 1.8 million HTTP DDoS attacks. This number of 1.8 million HTTP DDoS attacks has been normalized to compensate for the explosion in sophisticated and randomized HTTP DDoS attacks. Our automated mitigation systems generate real-time fingerprints for DDoS attacks, and due to the randomized nature of these sophisticated attacks, we observed many fingerprints being generated for single attacks. The actual number of fingerprints that was generated was closer to 19 million – over ten times larger than the normalized figure of 1.8 million. The millions of fingerprints that were generated to deal with the randomization stemmed from a few single rules. These rules did their job to stop attacks, but they inflated the numbers, so we excluded them from the calculation.

HTTP DDoS attacks by quarter, with the excluded fingerprints

This ten-fold difference underscores the dramatic change in the threat landscape. The tools and capabilities that allowed threat actors to carry out such randomized and sophisticated attacks were previously associated with capabilities reserved for state-level actors or state-sponsored actors. But, coinciding with the rise of generative AI and autopilot systems that can help actors write better code faster, these capabilities have made their way to the common cyber criminal.

Ransom DDoS attacks

In May 2024, the percentage of attacked Cloudflare customers that reported being threatened by a DDoS attack threat actor, or subjected to a Ransom DDoS attack reached 16% – the highest it’s been in the past 12 months. The quarter started relatively low, at 7% of customers reporting a threat or a ransom attack. That quickly jumped to 16% in May and slightly dipped in June to 14%.

Percentage of customers reporting DDoS threats or ransom extortion (by month)

Overall, ransom DDoS attacks have been increasing quarter over quarter throughout the past year. In Q2 2024, the percentage of customers that reported being threatened or extorted was 12.3%, slightly higher than the previous quarter (10.2%) but similar to the percentage of the year before (also 12.0%).

Percentage of customers reporting DDoS threats or ransom extortion (by quarter)

Threat actors

75% of respondents reported that they did not know who attacked them or why. These respondents are Cloudflare customers that were targeted by HTTP DDoS attacks.

Of the respondents that claim they did know, 59% said it was a competitor who attacked them. Another 21% said the DDoS attack was carried out by a disgruntled customer or user, and another 17% said that the attacks were carried out by state-level or state-sponsored threat actors. The remaining 3% reported it being a self-inflicted DDoS attack.

Percentage of threat actor type reported by Cloudflare customers, excluding unknown attackers and outliers

Top attacked countries and regions

In the second quarter of 2024, China was ranked the most attacked country in the world. This ranking takes into consideration HTTP DDoS attacks, network-layer DDoS attacks, the total volume and the percentage of DDoS attack traffic out of the total traffic, and the graphs show this overall DDoS attack activity per country or region. A longer bar in the chart means more attack activity.

After China, Turkey came in second place, followed by Singapore, Hong Kong, Russia, Brazil, and Thailand. The remaining countries and regions comprising the top 15 most attacked countries are provided in the chart below.

15 most attacked countries and regions in 2024 Q2

Most attacked industries

The Information Technology & Services was ranked as the most targeted industry in the second quarter of 2024. The ranking methodologies that we’ve used here follow the same principles as previously described to distill the total volume and relative attack traffic for both HTTP and network-layer DDoS attacks into one single DDoS attack activity ranking.

The Telecommunications, Services Providers and Carrier sector came in second. Consumer Goods came in third place.

15 most attacked industries in 2024 Q2

When analyzing only the HTTP DDoS attacks, we see a different picture. Gaming and Gambling saw the most attacks in terms of HTTP DDoS attack request volume. The per-region breakdown is provided below.

Top attacked industries by region (HTTP DDoS attacks)

Largest sources of DDoS attacks

Libya was ranked as the largest source of DDoS attacks in the second quarter of 2024. The ranking methodologies that we’ve used here follow the same principles as previously described to distill the total volume and relative attack traffic for both HTTP and network-layer DDoS attacks into one single DDoS attack activity ranking.

Indonesia followed closely in second place, followed by the Netherlands in third.

15 largest sources of DDoS attacks in 2024 Q2

DDoS attack characteristics

Network-layer DDoS attack vectors

Despite a 49% decrease quarter-over-quarter, DNS-based DDoS attacks remain the most common attack vector, with a combined share of 37% for DNS floods and DNS amplification attacks. SYN floods came in second place with a share of 23%, followed by RST floods accounting for a little over 10%. SYN floods and RST floods are both types of TCP-based DDoS attacks. Collectively, all types of TCP-based DDoS attacks accounted for 38% of all network-layer DDoS attacks.

Top attack vectors (network-layer)

HTTP DDoS attack vectors

One of the advantages of operating a large network is that we see a lot of traffic and attacks. This helps us improve our detection and mitigation systems to protect our customers. In the last quarter, half of all HTTP DDoS attacks were mitigated using proprietary heuristics that targeted botnets known to Cloudflare. These heuristics guide our systems on how to generate a real-time fingerprint to match against the attacks.

Another 29% were HTTP DDoS attacks that used fake user agents, impersonated browsers, or were from headless browsers. An additional 13% had suspicious HTTP attributes which triggered our automated system, and 7% were marked as generic floods. One thing to note is that these attack vectors, or attack groups, are not necessarily exclusive. For example, known botnets also impersonate browsers and have suspicious HTTP attributes, but this breakdown is our initial attempt to categorize the HTTP DDoS attacks.

Top attack vectors (HTTP)

HTTP versions used in DDoS attacks

In Q2, around half of all web traffic used HTTP/2, 29% used HTTP/1.1, an additional fifth used HTTP/3, nearly 0.62% used HTTP/1.0, and 0.01% for HTTP/1.2.

Distribution of web traffic by HTTP version

HTTP DDoS attacks follow a similar pattern in terms of version adoption, albeit a larger bias towards HTTP/2. 76% of HTTP DDoS attack traffic was over the HTTP/2 version and nearly 22% over HTTP/1.1. HTTP/3, on the other hand, saw a much smaller usage. Only 0.86% of HTTP DDoS attack traffic were over HTTP/3 — as opposed to its much broader adoption of 20% by all web traffic.

Distribution of HTTP DDoS attack traffic by HTTP version

DDoS attack duration

The vast majority of DDoS attacks are short. Over 57% of HTTP DDoS attacks and 88% of network-layer DDoS attacks end within 10 minutes or less. This emphasizes the need for automated, in-line detection and mitigation systems. Ten minutes are hardly enough time for a human to respond to an alert, analyze the traffic, and apply manual mitigations.

On the other side of the graphs, we can see that approximately a quarter of HTTP DDoS attacks last over an hour, and almost a fifth last more than a day. On the network layer, longer attacks are significantly less common. Only 1% of network-layer DDoS attacks last more than 3 hours.

HTTP DDoS attacks: distribution by duration
Network-layer DDoS attacks: distribution by duration

DDoS attack size

Most DDoS attacks are relatively small. Over 95% of network-layer DDoS attacks stay below 500 megabits per second, and 86% stay below 50,000 packets per second.

Distribution of network-layer DDoS attacks by bit rate
Distribution of network-layer DDoS attacks by packet rate

Similarly, 81% of HTTP DDoS attacks stay below 50,000 requests per second. Although these rates are small on Cloudflare’s scale, they can still be devastating for unprotected websites unaccustomed to such traffic levels.

Distribution of HTTP DDoS attacks by request rate

Despite the majority of attacks being small, the number of larger volumetric attacks has increased. One out of every 100 network-layer DDoS attacks exceed 1 million packets per second (pps), and two out of every 100 exceed 500 gigabits per second. On layer 7, four out of every 1,000 HTTP DDoS attacks exceed 1 million requests per second.

Key takeaways

The majority of DDoS attacks are small and quick. However, even these attacks can disrupt online services that do not follow best practices for DDoS defense.

Furthermore, threat actor sophistication is increasing, perhaps due to the availability of Generative AI and developer copilot tools, resulting in attack code that delivers DDoS attacks that are harder to defend against. Even prior to the rise in attack sophistication, many organizations struggled to defend against these threats on their own. But they don’t need to. Cloudflare is here to help. We invest significant resources – so you don’t have to – to ensure our automated defenses, along with the entire portfolio of Cloudflare security products, to protect against existing and emerging threats.

French elections: political cyber attacks and Internet traffic shifts

Post Syndicated from João Tomé original https://blog.cloudflare.com/2024-french-elections-political-cyber-attacks-and-internet-traffic-shifts


The 2024 French legislative election runoff on July 7 yielded surprising results compared to the first round on June 30, with the New Popular Front (NPF) gaining the most seats, followed by French President Macron’s Ensemble party, and the National Rally. Coalition negotiations will follow. In this post, we examine the ongoing online attacks against French political parties and how initial election predictions at 20:00 local time led to a noticeable drop in France’s Internet traffic.

This blog post is part of a series tracking the numerous elections of 2024. We have covered elections in South Africa, India, Iceland, Mexico, the European Union, the UK and also the 2024 US presidential debate. We also continuously update our election report on Cloudflare Radar.

Let’s start with the attacks, and then move on to the Internet traffic trends.

Political parties under attack

As we highlighted last week, the first round of the French elections saw specific DDoS (Distributed Denial of Service) attacks targeting French political party websites. While online attacks are common and not always election-related, recent activities in France, the Netherlands, and the UK confirm that DDoS attacks frequently target political parties during election periods.

Two French political parties were attacked shortly before the first round of elections, and a third party was targeted on June 30. This third party, indicated in green on the chart below, faced attacks on the evening of June 29. Several attempts were thwarted by Cloudflare throughout election day, from 10:00 to 23:00 UTC (12:00 to 01:00 local time). The most intense attack occurred at 19:00 UTC (21:00 local time), reaching nearly 40,000 requests per second, with a total of 620 million DDoS requests recorded on that day (June 29).

Our data indicates that the most significant attack Cloudflare intercepted targeted a party shown in yellow on the chart above. The party had already been attacked on June 23, 2024, and this subsequent attack happened on July 3 at 21:36 UTC (23:36 local time), lasting four minutes and peaking at 151,000 requests per second (rps), making it the second-largest attack we’ve observed on political parties recently. This was comparable in intensity and duration to another attack on a UK political party right after their election.

On the runoff election day, July 7, the party represented by the blue line was again a target, having been attacked previously on June 24, 27, and 29. The most severe of these occurred on June 27, with attacks reaching 118,000 rps during a day that totaled 610 million daily DDoS requests. On July 7, the attacks resumed, with the first starting at 09:55 UTC (11:55 local time) and continuing sporadically until 23:18 UTC (01:18 local time on July 8). The peak of these attacks came at 11:40 UTC (13:40 local time), reaching 96,000 rps.

While these rates may seem small to Cloudflare, they can be devastating for websites not well-protected against such high levels of traffic. DDoS attacks not only overwhelm systems but also serve, if successful, as a distraction for IT teams while attackers attempt other types of breaches.

Exit polls came with a 20:00 Internet traffic dip

Each election brings its own unique circumstances. For instance, the UK’s snap election took place on Thursday, July 4, 2024, aligning with Britain’s tradition of weekday elections. In contrast, France and many other countries hold elections on weekends, typically Sundays.

During the first round of the French elections on June 30, morning traffic was lower than the previous week and rose in the afternoon. The runoff, a week later, displayed a different pattern. Morning traffic remained stable compared to June 30, but it saw a significant decrease in the afternoon, especially after 17:30 local time. Polling stations in major cities closed at 20:00. At this time, TV media began broadcasting the first results, causing a 16% drop in traffic compared to the previous week. This trend, where traffic dips as initial results are announced, is also seen in other elections, like the UK’s.

Traffic shifts during voting day, compared to the previous week, are more revealing when viewed in detail. The map and table below summarize the traffic changes observed at the state level within France, when voting closed and initial results predictions were revealed on TV at around 20:00 local time. This was the moment when, from Cloudflare’s data perspective, attention was diverted from online use.

(Source: Cloudflare; created with Datawrapper)

The table below shows the drops in traffic on July 7, at 20:00 local time, compared to the previous week.

State Drop in traffic (%)
Bourgogne-Franche-Comté -19%
Grand Est -19%
Brittany -15%
Auvergne-Rhône-Alpes -15%
Corsica -14%
Occitanie -11%
Nouvelle-Aquitaine -11%
Normandy -10%
Île-de-France -10%
Hauts-de-France -9%
Pays de la Loire -8%
Provence-Alpes-Côte d’Azur -7%
Centre-Val de Loire -6%

On election day in France, Internet traffic decreased most significantly in the regions of Bourgogne-Franche-Comté and Grand Est, both in the eastern part of the country and both experiencing a 19% drop. When comparing these regions to the Île-de-France region, where Paris is located, we see a smaller traffic decrease, at 10%. In the south, in regions like Provence-Alpes-Côte d’Azur, the drop was even less pronounced, at 7%.

Mobile device usage

Also notable was the increase in mobile device request traffic share during both election days, driving the share to levels higher than usual. Over the past month, mobile device traffic share on Sundays typically ranged from 53% to 54%. However, it rose to 57% on the first election day, June 30, and increased further to 58% on the runoff day, July 7, 2024. Mobile device traffic share was especially elevated from 11:00 to 22:00 local time on these days.

DNS trends: news outlets bring results

Switching focus to domain trends, our 1.1.1.1 resolver DNS data reveals a targeted impact from the French elections, allowing for a comparison between the two election days. Analyzing French news media outlets, DNS traffic in France was significantly higher on the first election day, June 30, with a 250% increase at 20:00 local time compared to the previous week. This was 6% higher than on the runoff day, July 7.

For French TV domains, the situation reversed during the runoff on July 7, showing 31% more DNS traffic at 20:00 local time than in the first round. On June 30, DNS traffic at that time was already 274% higher than the previous week, but the increase on July 7 was even more significant, at 391% compared to June 23, 2024—the Sunday before the two election days.

For microblogging social media in France, traffic was higher during the two election days, peaking on the first round. At the close of voting polls at 20:00 local time on June 30, traffic surged 38% compared to June 23, 2024. On July 7, runoff day, traffic increased by 32% at 20:00 local time compared to June 23, but was 4% lower than on June 30.​

Conclusion: keeping track of elections

In France, more attention was diverted from the Internet during the decisive runoff election day than in the first round, with a noticeable dip in traffic when TV stations announced predicted results at 20:00 local time.

If you want to follow more trends and insights about the Internet and elections in particular, you can check Cloudflare Radar, and more specifically our new 2024 Elections Insights report, which will be updated as elections take place throughout the year.

Since last week, we’ve updated our trends to include last-minute voting during the elections in Iran on June 28, 2024, and the suspension of mobile Internet in Mauritania following protests after the presidential elections on June 29, 2024, and the UK election.

Automatically replacing polyfill.io links with Cloudflare’s mirror for a safer Internet

Post Syndicated from Matthew Prince original https://blog.cloudflare.com/automatically-replacing-polyfill-io-links-with-cloudflares-mirror-for-a-safer-internet


polyfill.io, a popular JavaScript library service, can no longer be trusted and should be removed from websites.

Multiple reports, corroborated with data seen by our own client-side security system, Page Shield, have shown that the polyfill service was being used, and could be used again, to inject malicious JavaScript code into users’ browsers. This is a real threat to the Internet at large given the popularity of this library.

We have, over the last 24 hours, released an automatic JavaScript URL rewriting service that will rewrite any link to polyfill.io found in a website proxied by Cloudflare to a link to our mirror under cdnjs. This will avoid breaking site functionality while mitigating the risk of a supply chain attack.

Any website on the free plan has this feature automatically activated now. Websites on any paid plan can turn on this feature with a single click.

You can find this new feature under Security ⇒ Settings on any zone using Cloudflare.

Contrary to what is stated on the polyfill.io website, Cloudflare has never recommended the polyfill.io service or authorized their use of Cloudflare’s name on their website. We have asked them to remove the false statement and they have, so far, ignored our requests. This is yet another warning sign that they cannot be trusted.

If you are not using Cloudflare today, we still highly recommend that you remove any use of polyfill.io and/or find an alternative solution. And, while the automatic replacement function will handle most cases, the best practice is to remove polyfill.io from your projects and replace it with a secure alternative mirror like Cloudflare’s even if you are a customer.

You can do this by searching your code repositories for instances of polyfill.io and replacing it with cdnjs.cloudflare.com/polyfill/ (Cloudflare’s mirror). This is a non-breaking change as the two URLs will serve the same polyfill content. All website owners, regardless of the website using Cloudflare, should do this now.

How we came to this decision

Back in February, the domain polyfill.io, which hosts a popular JavaScript library, was sold to a new owner: Funnull, a relatively unknown company. At the time, we were concerned that this created a supply chain risk. This led us to spin up our own mirror of the polyfill.io code hosted under cdnjs, a JavaScript library repository sponsored by Cloudflare.

The new owner was unknown in the industry and did not have a track record of trust to administer a project such as polyfill.io. The concern, highlighted even by the original author, was that if they were to abuse polyfill.io by injecting additional code to the library, it could cause far reaching security problems on the Internet affecting several hundreds of thousands websites. Or it could be used to perform a targeted supply-chain attack against specific websites.

Unfortunately, that worry came true on June 25, 2024 as the polyfill.io service was being used to inject nefarious code that, under certain circumstances, redirected users to other websites.

We have taken the exceptional step of using our ability to modify HTML on the fly to replace references to the polyfill.io CDN in our customers’ websites with links to our own, safe, mirror created back in February.

In the meantime, additional threat feed providers have also taken the decision to flag the domain as malicious. We have not outright blocked the domain through any of the mechanisms we have because we are concerned it could cause widespread web outages given how broadly polyfill.io is used with some estimates indicating usage on nearly 4% of all websites.

Corroborating data with Page Shield

The original report indicates that malicious code was injected that, under certain circumstances, would redirect users to betting sites. It was doing this by loading additional JavaScript that would perform the redirect, under a set of additional domains which can be considered Indicators of Compromise (IoCs):

https://www.googie-anaiytics.com/analytics.js
https://www.googie-anaiytics.com/html/checkcachehw.js
https://www.googie-anaiytics.com/gtags.js
https://www.googie-anaiytics.com/keywords/vn-keyword.json
https://www.googie-anaiytics.com/webs-1.0.1.js
https://www.googie-anaiytics.com/analytics.js
https://www.googie-anaiytics.com/webs-1.0.2.js
https://www.googie-anaiytics.com/ga.js
https://www.googie-anaiytics.com/web-1.0.1.js
https://www.googie-anaiytics.com/web.js
https://www.googie-anaiytics.com/collect.js
https://kuurza.com/redirect?from=bitget

(note the intentional misspelling of Google Analytics)

Page Shield, our client side security solution, is available on all paid plans. When turned on, it collects information about JavaScript files loaded by end user browsers accessing your website.

By looking at the database of detected JavaScript files, we immediately found matches with the IoCs provided above starting as far back as 2024-06-08 15:23:51 (first seen timestamp on Page Shield detected JavaScript file). This was a clear indication that malicious activity was active and associated with polyfill.io.

Replacing insecure JavaScript links to polyfill.io

To achieve performant HTML rewriting, we need to make blazing-fast HTML alterations as responses stream through Cloudflare’s network. This has been made possible by leveraging ROFL (Response Overseer for FL). ROFL powers various Cloudflare products that need to alter HTML as it streams, such as Cloudflare Fonts, Email Obfuscation and Rocket Loader

ROFL is developed entirely in Rust. The memory-safety features of Rust are indispensable for ensuring protection against memory leaks while processing a staggering volume of requests, measuring in the millions per second. Rust’s compiled nature allows us to finely optimize our code for specific hardware configurations, delivering performance gains compared to interpreted languages.

The performance of ROFL allows us to rewrite HTML on-the-fly and modify the polyfill.io links quickly, safely, and efficiently. This speed helps us reduce any additional latency added by processing the HTML file.

If the feature is turned on, for any HTTP response with an HTML Content-Type, we parse all JavaScript script tag source attributes. If any are found linking to polyfill.io, we rewrite the src attribute to link to our mirror instead. We map to the correct version of the polyfill service while the query string is left untouched.

The logic will not activate if a Content Security Policy (CSP) header is found in the response. This ensures we don’t replace the link while breaking the CSP policy and therefore potentially breaking the website.

Default on for free customers, optional for everyone else

Cloudflare proxies millions of websites, and a large portion of these sites are on our free plan. Free plan customers tend to have simpler applications while not having the resources to update and react quickly to security concerns. We therefore decided to turn on the feature by default for sites on our free plan, as the likelihood of causing issues is reduced while also helping keep safe a very large portion of applications using polyfill.io.

Paid plan customers, on the other hand, have more complex applications and react quicker to security notices. We are confident that most paid customers using polyfill.io and Cloudflare will appreciate the ability to virtually patch the issue with a single click, while controlling when to do so.

All customers can turn off the feature at any time.

This isn’t the first time we’ve decided a security problem was so widespread and serious that we’d enable protection for all customers regardless of whether they were a paying customer or not. Back in 2014, we enabled Shellshock protection for everyone. In 2021, when the log4j vulnerability was disclosed we rolled out protection for all customers.

Do not use polyfill.io

If you are using Cloudflare, you can remove polyfill.io with a single click on the Cloudflare dashboard by heading over to your zone ⇒ Security ⇒ Settings. If you are a free customer, the rewrite is automatically active. This feature, we hope, will help you quickly patch the issue.

Nonetheless, you should ultimately search your code repositories for instances of polyfill.io and replace them with an alternative provider, such as Cloudflare’s secure mirror under cdnjs (https://cdnjs.cloudflare.com/polyfill/). Website owners who are not using Cloudflare should also perform these steps.

The underlying bundle links you should use are:

For minified: https://cdnjs.cloudflare.com/polyfill/v3/polyfill.min.js
For unminified: https://cdnjs.cloudflare.com/polyfill/v3/polyfill.js

Doing this ensures your website is no longer relying on polyfill.io.

Dutch political websites hit by cyber attacks as EU voting starts

Post Syndicated from João Tomé original https://blog.cloudflare.com/dutch-political-websites-hit-by-cyber-attacks-as-eu-voting-starts


The 2024 European Parliament election started in the Netherlands today, June 6, 2024, and will continue through June 9 in the other 26 countries that are part of the European Union. Cloudflare observed DDoS attacks targeting multiple election or politically-related Internet properties on election day in the Netherlands, as well as the preceding day.

These elections are highly anticipated. It’s also the first European election without the UK after Brexit.

According to news reports, several websites of political parties in the Netherlands suffered cyberattacks on Thursday, with a pro-Russian hacker group called HackNeT claiming responsibility.

On June 5 and 6, 2024, Cloudflare systems automatically detected and mitigated DDoS attacks that targeted at least three politically-related Dutch websites. Significant attack activity targeted two of them, and is described below.

A DDoS attack, short for Distributed Denial of Service attack, is a type of cyber attack that aims to take down or disrupt Internet services such as websites or mobile apps and make them unavailable for users. DDoS attacks are usually done by flooding the victim’s server with more traffic than it can handle. To learn more about DDoS attacks and other types of attacks, visit our Learning Center.

Attackers typically use DDoS attacks but also exploit other vulnerabilities and types of attacks simultaneously.

Daily DDoS mitigations on June 5 reached over 1 billion HTTP requests in the Netherlands, most of which targeted two election or political party websites. The attack continued on June 6. Attacks on one website peaked on June 5 at 14:00 UTC (16:00 local time) with 115 million requests per hour, with the attack lasting around four hours. Attacks on another politically-related website peaked at the same time at 65 million requests per hour.

On June 6, the first politically-related site with the highest peak on June 5 referenced above was attacked again for several hours. The main attack peak occurred at 11:00 UTC (13:00 local time), with 44 million requests per hour.

The main June 5 DDoS attack on one of the websites peaked at 14:13 UTC (16:13 local time), reaching 73,000 requests per second (rps) in an attack that lasted for a few hours. This attack is illustrated by the blue line in the graph below, which shows that it ramped slowly over the first half of the day, and then appeared to abruptly stop at 18:06. And on June 6, the main attack on the second website peaked at 11:01 UTC (13:01 local time) with 52,000 rps.

Geopolitical motivations

Elections, geopolitical changes, and disputes also impact the online world and cyberattacks. Our DDoS threat report for Q1 2024 gives a few recent examples. One notable case was the 466% surge in DDoS attacks on Sweden after its acceptance into the NATO alliance, mirroring the pattern observed during Finland’s NATO accession in 2023.

As we’ve seen in recent years, real-world conflicts, disputed and highly anticipated elections, and wars are always accompanied by cyberattacks. We reported (1, 2) on an increase in cyberattacks following the start of the Israel-Hamas war on October 7, 2023. We’ve put together a list of recommendations to optimize your defenses against DDoS attacks, and you can also follow our step-by-step wizards to secure your applications and prevent DDoS attacks.

If you want to follow more trends and insights about the Internet and elections in particular, you can check Cloudflare Radar, and more specifically our new 2024 Elections Insights report, that we’re keeping up to date as national elections take place throughout the year.

DDoS threat report for 2024 Q1

Post Syndicated from Omer Yoachimik original https://blog.cloudflare.com/ddos-threat-report-for-2024-q1


Welcome to the 17th edition of Cloudflare’s DDoS threat report. This edition covers the DDoS threat landscape along with key findings as observed from the Cloudflare network during the first quarter of 2024.

What is a DDoS attack?

But first, a quick recap. A DDoS attack, short for Distributed Denial of Service attack, is a type of cyber attack that aims to take down or disrupt Internet services such as websites or mobile apps and make them unavailable for users. DDoS attacks are usually done by flooding the victim’s server with more traffic than it can handle.

To learn more about DDoS attacks and other types of attacks, visit our Learning Center.

Accessing previous reports

Quick reminder that you can access previous editions of DDoS threat reports on the Cloudflare blog. They are also available on our interactive hub, Cloudflare Radar. On Radar, you can find global Internet traffic, attacks, and technology trends and insights, with drill-down and filtering capabilities, so you can zoom in on specific countries, industries, and networks. There’s also a free API allowing academics, data sleuths, and other web enthusiasts to investigate Internet trends across the globe.

To learn how we prepare this report, refer to our Methodologies.

2024 Q1 key insights

Key insights from the first quarter of 2024 include:

  • 2024 started with a bang. Cloudflare’s defense systems automatically mitigated 4.5 million DDoS attacks during the first quarter — representing a 50% year-over-year (YoY) increase.
  • DNS-based DDoS attacks increased by 80% YoY and remain the most prominent attack vector.
  • DDoS attacks on Sweden surged by 466% after its acceptance to the NATO alliance, mirroring the pattern observed during Finland’s NATO accession in 2023.

Starting 2024 with a bang

We’ve just wrapped up the first quarter of 2024, and, already, our automated defenses have mitigated 4.5 million DDoS attacks — an amount equivalent to 32% of all the DDoS attacks we mitigated in 2023.

Breaking it down to attack types, HTTP DDoS attacks increased by 93% YoY and 51% quarter-over-quarter (QoQ). Network-layer DDoS attacks, also known as L3/4 DDoS attacks, increased by 28% YoY and 5% QoQ.

2024 Q1: Cloudflare mitigated 4.5 million DDoS attacks

When comparing the combined number of HTTP DDoS attacks and L3/4 DDoS attacks, we can see that, overall, in the first quarter of 2024, the count increased by 50% YoY and 18% QoQ.

DDoS attacks by year and quarter

In total, our systems mitigated 10.5 trillion HTTP DDoS attack requests in Q1. Our systems also mitigated over 59 petabytes of DDoS attack traffic — just on the network-layer.

Among those network-layer DDoS attacks, many of them exceeded the 1 terabit per second rate — almost on a weekly basis. The largest attack that we have mitigated so far in 2024 was launched by a Mirai-variant botnet. This attack reached 2 Tbps and was aimed at an Asian hosting provider protected by Cloudflare Magic Transit. Cloudflare’s systems automatically detected and mitigated the attack.

The Mirai botnet, infamous for its massive DDoS attacks, was primarily composed of infected IoT devices. It notably disrupted Internet access across the US in 2016 by targeting DNS service providers. Almost eight years later, Mirai attacks are still very common. Four out of every 100 HTTP DDoS attacks, and two out of every 100 L3/4 DDoS attacks are launched by a Mirai-variant botnet. The reason we say “variant” is that the Mirai source code was made public, and over the years there have been many permutations of the original.

Mirai botnet targets Asian hosting provider with 2 Tbps DDoS attack

DNS attacks surge by 80%

In March 2024, we introduced one of our latest DDoS defense systems, the Advanced DNS Protection system. This system complements our existing systems, and is designed to protect against the most sophisticated DNS-based DDoS attacks.

It is not out of the blue that we decided to invest in this new system. DNS-based DDoS attacks have become the most prominent attack vector and its share among all network-layer attacks continues to grow. In the first quarter of 2024, the share of DNS-based DDoS attacks increased by 80% YoY, growing to approximately 54%.

DNS-based DDoS attacks by year and quarter

Despite the surge in DNS attacks and due to the overall increase in all types of DDoS attacks, the share of each attack type, remarkably, remains the same as seen in our previous report for the final quarter of 2023. HTTP DDoS attacks remain at 37% of all DDoS attacks, DNS DDoS attacks at 33%, and the remaining 30% is left for all other types of L3/4 attacks, such as SYN Flood and UDP Floods.

Attack type distribution

And in fact, SYN Floods were the second most common L3/4 attack. The third was RST Floods, another type of TCP-based DDoS attack. UDP Floods came in fourth with a 6% share.

Top attack vectors

When analyzing the most common attack vectors, we also check for the attack vectors that experienced the largest growth but didn’t necessarily make it into the top ten list. Among the top growing attack vectors (emerging threats), Jenkins Flood experienced the largest growth of over 826% QoQ.

Jenkins Flood is a DDoS attack that exploits vulnerabilities in the Jenkins automation server, specifically through UDP multicast/broadcast and DNS multicast services. Attackers can send small, specially crafted requests to a publicly facing UDP port on Jenkins servers, causing them to respond with disproportionately large amounts of data. This can amplify the traffic volume significantly, overwhelming the target’s network and leading to service disruption. Jenkins addressed this vulnerability (CVE-2020-2100) in 2020 by disabling these services by default in later versions. However, as we can see, even 4 years later, this vulnerability is still being abused in the wild to launch DDoS attacks.

Attack vectors that experienced the largest growth QoQ

HTTP/2 Continuation Flood

Another attack vector that’s worth discussing is the HTTP/2 Continuation Flood. This attack vector is made possible by a vulnerability that was discovered and reported publicly by researcher Bartek Nowotarski on April 3, 2024.

The HTTP/2 Continuation Flood vulnerability targets HTTP/2 protocol implementations that improperly handle HEADERS and multiple CONTINUATION frames. The threat actor sends a sequence of CONTINUATION frames without the END_HEADERS flag, leading to potential server issues such as out-of-memory crashes or CPU exhaustion. HTTP/2 Continuation Flood allows even a single machine to disrupt websites and APIs using HTTP/2, with the added challenge of difficult detection due to no visible requests in HTTP access logs.

This vulnerability poses a potentially severe threat more damaging than the previously known

HTTP/2 Rapid Reset, which resulted in some of the largest HTTP/2 DDoS attack campaigns in recorded history. During that campaign, thousands of hyper-volumetric DDoS attacks targeted Cloudflare. The attacks were multi-million requests per second strong. The average attack rate in that campaign, recorded by Cloudflare, was 30M rps. Approximately 89 of the attacks peaked above 100M rps and the largest one we saw hit 201M rps. Additional coverage was published in our 2023 Q3 DDoS threat report.

HTTP/2 Rapid Reset campaign of hyper-volumetric DDoS attacks in 2023 Q3

Cloudflare’s network, its HTTP/2 implementation, and customers using our WAF/CDN services are not affected by this vulnerability. Furthermore, we are not currently aware of any threat actors exploiting this vulnerability in the wild.

Multiple CVEs have been assigned to the various implementations of HTTP/2 that are impacted by this vulnerability. A CERT alert published by Christopher Cullen at Carnegie Mellon University, which was covered by Bleeping Computer, lists the various CVEs:

Affected service CVE Details
Node.js HTTP/2 server CVE-2024-27983 Sending a few HTTP/2 frames can cause a race condition and memory leak, leading to a potential denial of service event.
Envoy’s oghttp codec CVE-2024-27919 Not resetting a request when header map limits are exceeded can cause unlimited memory consumption which can potentially lead to a denial of service event.
Tempesta FW CVE-2024-2758 Its rate limits are not entirely effective against empty CONTINUATION frames flood, potentially leading to a denial of service event.
amphp/http CVE-2024-2653 It collects CONTINUATION frames in an unbounded buffer, risking an out of memory (OOM) crash if the header size limit is exceeded, potentially resulting in a denial of service event.
Go’s net/http and net/http2 packages CVE-2023-45288 Allows an attacker to send an arbitrarily large set of headers, causing excessive CPU consumption, potentially leading to a denial of service event.
nghttp2 library CVE-2024-28182 Involves an implementation using nghttp2 library, which continues to receive CONTINUATION frames, potentially leading to a denial of service event without proper stream reset callback.
Apache Httpd CVE-2024-27316 A flood of CONTINUATION frames without the END_HEADERS flag set can be sent, resulting in the improper termination of requests, potentially leading to a denial of service event.
Apache Traffic Server CVE-2024-31309 HTTP/2 CONTINUATION floods can cause excessive resource consumption on the server, potentially leading to a denial of service event.
Envoy versions 1.29.2 or earlier CVE-2024-30255 Consumption of significant server resources can lead to CPU exhaustion during a flood of CONTINUATION frames, which can potentially lead to a denial of service event.

Top attacked industries

When analyzing attack statistics, we use our customer’s industry as it is recorded in our systems to determine the most attacked industries. In the first quarter of 2024, the top attacked industry by HTTP DDoS attacks in North America was Marketing and Advertising. In Africa and Europe, the Information Technology and Internet industry was the most attacked. In the Middle East, the most attacked industry was Computer Software. In Asia, the most attacked industry was Gaming and Gambling. In South America, it was the Banking, Financial Services and Insurance (BFSI) industry. Last but not least, in Oceania, was the Telecommunications industry.

Top attacked industries by HTTP DDoS attacks, by region

Globally, the Gaming and Gambling industry was the number one most targeted by HTTP DDoS attacks. Just over seven of every 100 DDoS requests that Cloudflare mitigated were aimed at the Gaming and Gambling industry. In second place, the Information Technology and Internet industry, and in third, Marketing and Advertising.

Top attacked industries by HTTP DDoS attacks

With a share of 75% of all network-layer DDoS attack bytes, the Information Technology and Internet industry was the most targeted by network-layer DDoS attacks. One possible explanation for this large share is that Information Technology and Internet companies may be “super aggregators” of attacks and receive DDoS attacks that are actually targeting their end customers. The Telecommunications industry, the Banking, Financial Services and Insurance (BFSI) industry, the Gaming and Gambling industry and the Computer Software industry accounted for the next three percent.

Top attacked industries by L3/4 DDoS attacks

When normalizing the data by dividing the attack traffic by the total traffic to a given industry, we get a completely different picture. On the HTTP front, Law Firms and Legal Services was the most attacked industry, as over 40% of their traffic was HTTP DDoS attack traffic. The Biotechnology industry came in second with a 20% share of HTTP DDoS attack traffic. In third place, Nonprofits had an HTTP DDoS attack share of 13%. In fourth, Aviation and Aerospace, followed by Transportation, Wholesale, Government Relations, Motion Pictures and Film, Public Policy, and Adult Entertainment to complete the top ten.

Top attacked industries by HTTP DDoS attacks (normalized)

Back to the network layer, when normalized, Information Technology and Internet remained the number one most targeted industry by L3/4 DDoS attacks, as almost a third of their traffic were attacks. In second, Textiles had a 4% attack share. In third, Civil Engineering, followed by Banking Financial Services and Insurance (BFSI), Military, Construction, Medical Devices, Defense and Space, Gaming and Gambling, and lastly Retail to complete the top ten.

Top attacked industries by L3/4 DDoS attacks (normalized)

Largest sources of DDoS attacks

When analyzing the sources of HTTP DDoS attacks, we look at the source IP address to determine the origination location of those attacks. A country/region that’s a large source of attacks indicates that there is most likely a large presence of botnet nodes behind Virtual Private Network (VPN) or proxy endpoints that attackers may use to obfuscate their origin.

In the first quarter of 2024, the United States was the largest source of HTTP DDoS attack traffic, as a fifth of all DDoS attack requests originated from US IP addresses. China came in second, followed by Germany, Indonesia, Brazil, Russia, Iran, Singapore, India, and Argentina.

The top sources of HTTP DDoS attacks

At the network layer, source IP addresses can be spoofed. So, instead of relying on IP addresses to understand the source, we use the location of our data centers where the attack traffic was ingested. We can gain geographical accuracy due to Cloudflare’s large global coverage in over 310 cities around the world.

Using the location of our data centers, we can see that in the first quarter of 2024, over 40% L3/4 DDoS attack traffic was ingested in our US data centers, making the US the largest source of L3/4 attacks. Far behind, in second, Germany at 6%, followed by Brazil, Singapore, Russia, South Korea, Hong Kong, United Kingdom, Netherlands, and Japan.

The top sources of L3/4 DDoS attacks

When normalizing the data by dividing the attack traffic by the total traffic to a given country or region, we get a totally different lineup. Almost a third of the HTTP traffic originating from Gibraltar was DDoS attack traffic, making it the largest source. In second place, Saint Helena, followed by the British Virgin Islands, Libya, Paraguay, Mayotte, Equatorial Guinea, Argentina, and Angola.

The top sources of HTTP DDoS attacks (normalized)

Back to the network layer, normalized, things look rather different as well. Almost 89% of the traffic we ingested in our Zimbabwe-based data centers were L3/4 DDoS attacks. In Paraguay, it was over 56%, followed by Mongolia reaching nearly a 35% attack share. Additional top locations included Moldova, Democratic Republic of the Congo, Ecuador, Djibouti, Azerbaijan, Haiti, and Dominican Republic.

The top sources of L3/4 DDoS attacks (normalized)

Most attacked locations

When analyzing DDoS attacks against our customers, we use their billing country to determine the “attacked country (or region)”. In the first quarter of 2024, the US was the most attacked by HTTP DDoS attacks. Approximately one out of every 10 DDoS requests that Cloudflare mitigated targeted the US. In second, China, followed by Canada, Vietnam, Indonesia, Singapore, Hong Kong, Taiwan, Cyprus, and Germany.

Top attacked countries and regions by HTTP DDoS attacks

When normalizing the data by dividing the attack traffic by the total traffic to a given country or region, the list changes drastically. Over 63% of HTTP traffic to Nicaragua was DDoS attack traffic, making it the most attacked location. In second, Albania, followed by Jordan, Guinea, San Marino, Georgia, Indonesia, Cambodia, Bangladesh, and Afghanistan.

Top attacked countries and regions by HTTP DDoS attacks (normalized)

On the network layer, China was the number one most attacked location, as 39% of all DDoS bytes that Cloudflare mitigated during the first quarter of 2024 were aimed at Cloudflare’s Chinese customers. Hong Kong came in second place, followed by Taiwan, the United States, and Brazil.

Top attacked countries and regions by L3/4 DDoS attacks

Back to the network layer, when normalized, Hong Kong takes the lead as the most targeted location. L3/4 DDoS attack traffic accounted for over 78% of all Hong Kong-bound traffic. In second place, China with a DDoS share of 75%, followed by Kazakhstan, Thailand, Saint Vincent and the Grenadines, Norway, Taiwan, Turkey, Singapore, and Brazil.

Top attacked countries and regions by L3/4 DDoS attacks (normalized)

Cloudflare is here to help – no matter the attack type, size, or duration

Cloudflare’s mission is to help build a better Internet, a vision where it remains secure, performant, and accessible to everyone. With four out of every 10 HTTP DDoS attacks lasting over 10 minutes and approximately three out of 10 extending beyond an hour, the challenge is substantial. Yet, whether an attack involves over 100,000 requests per second, as is the case in one out of every 10 attacks, or even exceeds a million requests per second — a rarity seen in only four out of every 1,000 attacks — Cloudflare’s defenses remain impenetrable.

Since pioneering unmetered DDoS Protection in 2017, Cloudflare has steadfastly honored its promise to provide enterprise-grade DDoS protection at no cost to all organizations, ensuring that our advanced technology and robust network architecture do not just fend off attacks but also preserve performance without compromise.

Eliminate VPN vulnerabilities with Cloudflare One

Post Syndicated from Dan Hall original https://blog.cloudflare.com/eliminate-vpn-vulnerabilities-with-cloudflare-one


On January 19, 2024, the Cybersecurity & Infrastructure Security Agency (CISA) issued Emergency Directive 24-01: Mitigate Ivanti Connect Secure and Ivanti Policy Secure Vulnerabilities. CISA has the authority to issue emergency directives in response to a known or reasonably suspected information security threat, vulnerability, or incident. U.S. Federal agencies are required to comply with these directives.

Federal agencies were directed to apply a mitigation against two recently discovered vulnerabilities; the mitigation was to be applied within three days. Further monitoring by CISA revealed that threat actors were continuing to exploit the vulnerabilities and had developed some workarounds to earlier mitigations and detection methods. On January 31, CISA issued Supplemental Direction V1 to the Emergency Directive instructing agencies to immediately disconnect all instances of Ivanti Connect Secure and Ivanti Policy Secure products from agency networks and perform several actions before bringing the products back into service.

This blog post will explore the threat actor’s tactics, discuss the high-value nature of the targeted products, and show how Cloudflare’s Secure Access Service Edge (SASE) platform protects against such threats.

As a side note and showing the value of layered protections, Cloudflare’s WAF had proactively detected the Ivanti zero-day vulnerabilities and deployed emergency rules to protect Cloudflare customers.

Threat Actor Tactics

Forensic investigations (see the Volexity blog for an excellent write-up) indicate that the attacks began as early as December 2023. Piecing together the evidence shows that the threat actors chained two previously unknown vulnerabilities together to gain access to the Connect Secure and Policy Secure appliances and achieve unauthenticated remote code execution (RCE).

CVE-2023-46805 is an authentication bypass vulnerability in the products’ web components that allows a remote attacker to bypass control checks and gain access to restricted resources. CVE-2024-21887 is a command injection vulnerability in the products’ web components that allows an authenticated administrator to execute arbitrary commands on the appliance and send specially crafted requests. The remote attacker was able to bypass authentication and be seen as an “authenticated” administrator, and then take advantage of the ability to execute arbitrary commands on the appliance.

By exploiting these vulnerabilities, the threat actor had near total control of the appliance. Among other things, the attacker was able to:

  • Harvest credentials from users logging into the VPN service
  • Use these credentials to log into protected systems in search of even more credentials
  • Modify files to enable remote code execution
  • Deploy web shells to a number of web servers
  • Reverse tunnel from the appliance back to their command-and-control server (C2)
  • Avoid detection by disabling logging and clearing existing logs

Little Appliance, Big Risk

This is a serious incident that is exposing customers to significant risk. CISA is justified in issuing their directive, and Ivanti is working hard to mitigate the threat and develop patches for the software on their appliances. But it also serves as another indictment of the legacy “castle-and-moat” security paradigm. In that paradigm, remote users were outside the castle while protected applications and resources remained inside. The moat, consisting of a layer of security appliances, separated the two. The moat, in this case the Ivanti appliance, was responsible for authenticating and authorizing users, and then connecting them to protected applications and resources. Attackers and other bad actors were blocked at the moat.

This incident shows us what happens when a bad actor is able to take control of the moat itself, and the challenges customers face to recover control. Two typical characteristics of vendor-supplied appliances and the legacy security strategy highlight the risks:

  • Administrators have access to the internals of the appliance
  • Authenticated users indiscriminately have access to a wide range of applications and resources on the corporate network, increasing the risk of bad actor lateral movement

A better way: Cloudflare’s SASE platform

Cloudflare One is Cloudflare’s SSE and single-vendor SASE platform. While Cloudflare One spans broadly across security and networking services (and you can read about the latest additions here), I want to focus on the two points noted above.

First, Cloudflare One employs the principles of Zero Trust, including the principle of least privilege. As such, users that authenticate successfully only have access to the resources and applications necessary for their role. This principle also helps in the event of a compromised user account as the bad actor does not have indiscriminate network-level access. Rather, least privilege limits the range of lateral movement that a bad actor has, effectively reducing the blast radius.

Second, while customer administrators need to have access to configure their services and policies, Cloudflare One does not provide any external access to the system internals of Cloudflare’s platform. Without that access, a bad actor would not be able to launch the types of attacks executed when they had access to the internals of the Ivanti appliance.  

It’s time to eliminate the legacy VPN

If your organization is impacted by the CISA directive, or you are just ready to modernize and want to augment or replace your current VPN solution, Cloudflare is here to help. Cloudflare’s Zero Trust Network Access (ZTNA) service, part of the Cloudflare One platform, is the fastest and safest way to connect any user to any application.

Contact us to get immediate onboarding help or to schedule an architecture workshop to help you augment or replace your Ivanti (or any) VPN solution.
Not quite ready for a live conversation? Read our learning path article on how to replace your VPN with Cloudflare or our SASE reference architecture for a view of how all of our SASE services and on-ramps work together.

DDoS threat report for 2023 Q4

Post Syndicated from Omer Yoachimik http://blog.cloudflare.com/author/omer/ original https://blog.cloudflare.com/ddos-threat-report-2023-q4


Welcome to the sixteenth edition of Cloudflare’s DDoS Threat Report. This edition covers DDoS trends and key findings for the fourth and final quarter of the year 2023, complete with a review of major trends throughout the year.

What are DDoS attacks?

DDoS attacks, or distributed denial-of-service attacks, are a type of cyber attack that aims to disrupt websites and online services for users, making them unavailable by overwhelming them with more traffic than they can handle. They are similar to car gridlocks that jam roads, preventing drivers from getting to their destination.

There are three main types of DDoS attacks that we will cover in this report. The first is an HTTP request intensive DDoS attack that aims to overwhelm HTTP servers with more requests than they can handle to cause a denial of service event. The second is an IP packet intensive DDoS attack that aims to overwhelm in-line appliances such as routers, firewalls, and servers with more packets than they can handle. The third is a bit-intensive attack that aims to saturate and clog the Internet link causing that ‘gridlock’ that we discussed. In this report, we will highlight various techniques and insights on all three types of attacks.

Previous editions of the report can be found here, and are also available on our interactive hub, Cloudflare Radar. Cloudflare Radar showcases global Internet traffic, attacks, and technology trends and insights, with drill-down and filtering capabilities for zooming in on insights of specific countries, industries, and service providers. Cloudflare Radar also offers a free API allowing academics, data sleuths, and other web enthusiasts to investigate Internet usage across the globe.

To learn how we prepare this report, refer to our Methodologies.

Key findings

  1. In Q4, we observed a 117% year-over-year increase in network-layer DDoS attacks, and overall increased DDoS activity targeting retail, shipment and public relations websites during and around Black Friday and the holiday season.
  2. In Q4, DDoS attack traffic targeting Taiwan registered a 3,370% growth, compared to the previous year, amidst the upcoming general election and reported tensions with China. The percentage of DDoS attack traffic targeting Israeli websites grew by 27% quarter-over-quarter, and the percentage of DDoS attack traffic targeting Palestinian websites grew by 1,126% quarter-over-quarter — as the military conflict between Israel and Hamas continues.
  3. In Q4, there was a staggering 61,839% surge in DDoS attack traffic targeting Environmental Services websites compared to the previous year, coinciding with the 28th United Nations Climate Change Conference (COP 28).

For an in-depth analysis of these key findings and additional insights that could redefine your understanding of current cybersecurity challenges, read on!

Illustration of a DDoS attack

Hyper-volumetric HTTP DDoS attacks

2023 was the year of uncharted territories. DDoS attacks reached new heights — in size and sophistication. The wider Internet community, including Cloudflare, faced a persistent and deliberately engineered campaign of thousands of hyper-volumetric DDoS attacks at never before seen rates.

These attacks were highly complex and exploited an HTTP/2 vulnerability. Cloudflare developed purpose-built technology to mitigate the vulnerability’s effect and worked with others in the industry to responsibly disclose it.

As part of this DDoS campaign, in Q3 our systems mitigated the largest attack we’ve ever seen — 201 million requests per second (rps). That’s almost 8 times larger than our previous 2022 record of 26 million rps.

Largest HTTP DDoS attacks as seen by Cloudflare, by year

Growth in network-layer DDoS attacks

After the hyper-volumetric campaign subsided, we saw an unexpected drop in HTTP DDoS attacks. Overall in 2023, our automated defenses mitigated over 5.2 million HTTP DDoS attacks consisting of over 26 trillion requests. That averages at 594 HTTP DDoS attacks and 3 billion mitigated requests every hour.

Despite these astronomical figures, the amount of HTTP DDoS attack requests actually declined by 20% compared to 2022. This decline was not just annual but was also observed in 2023 Q4 where the number of HTTP DDoS attack requests decreased by 7% YoY and 18% QoQ.

On the network-layer, we saw a completely different trend. Our automated defenses mitigated 8.7 million network-layer DDoS attacks in 2023. This represents an 85% increase compared to 2022.

In 2023 Q4, Cloudflare’s automated defenses mitigated over 80 petabytes of network-layer attacks. On average, our systems auto-mitigated 996 network-layer DDoS attacks and 27 terabytes every hour. The number of network-layer DDoS attacks in 2023 Q4 increased by 175% YoY and 25% QoQ.

HTTP and Network-layer DDoS attacks by quarter

DDoS attacks increase during and around COP 28

In the final quarter of 2023, the landscape of cyber threats witnessed a significant shift. While the Cryptocurrency sector was initially leading in terms of the volume of HTTP DDoS attack requests, a new target emerged as a primary victim. The Environmental Services industry experienced an unprecedented surge in HTTP DDoS attacks, with these attacks constituting half of all its HTTP traffic. This marked a staggering 618-fold increase compared to the previous year, highlighting a disturbing trend in the cyber threat landscape.

This surge in cyber attacks coincided with COP 28, which ran from November 30th to December 12th, 2023. The conference was a pivotal event, signaling what many considered the ‘beginning of the end’ for the fossil fuel era. It was observed that in the period leading up to COP 28, there was a noticeable spike in HTTP attacks targeting Environmental Services websites. This pattern wasn’t isolated to this event alone.

Looking back at historical data, particularly during COP 26 and COP 27, as well as other UN environment-related resolutions or announcements, a similar pattern emerges. Each of these events was accompanied by a corresponding increase in cyber attacks aimed at Environmental Services websites.

In February and March 2023, significant environmental events like the UN’s resolution on climate justice and the launch of United Nations Environment Programme’s Freshwater Challenge potentially heightened the profile of environmental websites, possibly correlating with an increase in attacks on these sites​​​​.

This recurring pattern underscores the growing intersection between environmental issues and cyber security, a nexus that is increasingly becoming a focal point for attackers in the digital age.

DDoS attacks and Iron Swords

It’s not just UN resolutions that trigger DDoS attacks. Cyber attacks, and particularly DDoS attacks, have long been a tool of war and disruption. We witnessed an increase in DDoS attack activity in the Ukraine-Russia war, and now we’re also witnessing it in the Israel-Hamas war. We first reported the cyber activity in our report Cyber attacks in the Israel-Hamas war, and we continued to monitor the activity throughout Q4.

Operation “Iron Swords” is the military offensive launched by Israel against Hamas following the Hamas-led 7 October attack. During this ongoing armed conflict, we continue to see DDoS attacks targeting both sides.

DDoS attacks targeting Israeli and Palestinian websites, by industry

Relative to each region’s traffic, the Palestinian territories was the second most attacked region by HTTP DDoS attacks in Q4. Over 10% of all HTTP requests towards Palestinian websites were DDoS attacks, a total of 1.3 billion DDoS requests — representing a 1,126% increase in QoQ. 90% of these DDoS attacks targeted Palestinian Banking websites. Another 8% targeted Information Technology and Internet platforms.

Top attacked Palestinian industries

Similarly, our systems automatically mitigated over 2.2 billion HTTP DDoS requests targeting Israeli websites. While 2.2 billion represents a decrease compared to the previous quarter and year, it did amount to a larger percentage out of the total Israel-bound traffic. This normalized figure represents a 27% increase QoQ but a 92% decrease YoY. Notwithstanding the larger amount of attack traffic, Israel was the 77th most attacked region relative to its own traffic. It was also the 33rd most attacked by total volume of attacks, whereas the Palestinian territories was 42nd.

Of those Israeli websites attacked, Newspaper & Media were the main target — receiving almost 40% of all Israel-bound HTTP DDoS attacks. The second most attacked industry was the Computer Software industry. The Banking, Financial Institutions, and Insurance (BFSI) industry came in third.

Top attacked Israeli industries

On the network layer, we see the same trend. Palestinian networks were targeted by 470 terabytes of attack traffic — accounting for over 68% of all traffic towards Palestinian networks. Surpassed only by China, this figure placed the Palestinian territories as the second most attacked region in the world, by network-layer DDoS attack, relative to all Palestinian territories-bound traffic. By absolute volume of traffic, it came in third. Those 470 terabytes accounted for approximately 1% of all DDoS traffic that Cloudflare mitigated.

Israeli networks, though, were targeted by only 2.4 terabytes of attack traffic, placing it as the 8th most attacked country by network-layer DDoS attacks (normalized). Those 2.4 terabytes accounted for almost 10% of all traffic towards Israeli networks.

Top attacked countries

When we turned the picture around, we saw that 3% of all bytes that were ingested in our Israeli-based data centers were network-layer DDoS attacks. In our Palestinian-based data centers, that figure was significantly higher — approximately 17% of all bytes.

On the application layer, we saw that 4% of HTTP requests originating from Palestinian IP addresses were DDoS attacks, and almost 2% of HTTP requests originating from Israeli IP addresses were DDoS attacks as well.

Main sources of DDoS attacks

In the third quarter of 2022, China was the largest source of HTTP DDoS attack traffic. However, since the fourth quarter of 2022, the US took the first place as the largest source of HTTP DDoS attacks and has maintained that undesirable position for five consecutive quarters. Similarly, our data centers in the US are the ones ingesting the most network-layer DDoS attack traffic — over 38% of all attack bytes.

HTTP DDoS attacks originating from China and the US by quarter

Together, China and the US account for a little over a quarter of all HTTP DDoS attack traffic in the world. Brazil, Germany, Indonesia, and Argentina account for the next twenty-five percent.

Top source of HTTP DDoS attacks

These large figures usually correspond to large markets. For this reason, we also normalize the attack traffic originating from each country by comparing their outbound traffic. When we do this, we often get small island nations or smaller market countries that a disproportionate amount of attack traffic originates from. In Q4, 40% of Saint Helena’s outbound traffic were HTTP DDoS attacks — placing it at the top. Following the ‘remote volcanic tropical island’, Libya came in second, Swaziland (also known as Eswatini) in third. Argentina and Egypt follow in fourth and fifth place.

Top source of HTTP DDoS attacks with respect to each country’s traffic

On the network layer, Zimbabwe came in first place. Almost 80% of all traffic we ingested in our Zimbabwe-based data center was malicious. In second place, Paraguay, and Madagascar in third.

Top source of Network-layer DDoS attacks with respect to each country’s traffic

Most attacked industries

By volume of attack traffic, Cryptocurrency was the most attacked industry in Q4. Over 330 billion HTTP requests targeted it. This figure accounts for over 4% of all HTTP DDoS traffic for the quarter. The second most attacked industry was Gaming & Gambling. These industries are known for being coveted targets and attract a lot of traffic and attacks.

Top industries targeted by HTTP DDoS attacks

On the network layer, the Information Technology and Internet industry was the most attacked — over 45% of all network-layer DDoS attack traffic was aimed at it. Following far behind were the Banking, Financial Services and Insurance (BFSI), Gaming & Gambling, and Telecommunications industries.

Top industries targeted by Network-layer DDoS attacks

To change perspectives, here too, we normalized the attack traffic by the total traffic for a specific industry. When we do that, we get a different picture.

Top attacked industries by HTTP DDoS attacks, by region

We already mentioned in the beginning of this report that the Environmental Services industry was the most attacked relative to its own traffic. In second place was the Packaging and Freight Delivery industry, which is interesting because of its timely correlation with online shopping during Black Friday and the winter holiday season. Purchased gifts and goods need to get to their destination somehow, and it seems as though attackers tried to interfere with that. On a similar note, DDoS attacks on retail companies increased by 23% compared to the previous year.

Top industries targeted by HTTP DDoS attacks with respect to each industry’s traffic

On the network layer, Public Relations and Communications was the most targeted industry — 36% of its traffic was malicious. This too is very interesting given its timing. Public Relations and Communications companies are usually linked to managing public perception and communication. Disrupting their operations can have immediate and widespread reputational impacts which becomes even more critical during the Q4 holiday season. This quarter often sees increased PR and communication activities due to holidays, end-of-year summaries, and preparation for the new year, making it a critical operational period — one that some may want to disrupt.

Top industries targeted by Network-layer DDoS attacks with respect to each industry’s traffic

Most attacked countries and regions

Singapore was the main target of HTTP DDoS attacks in Q4. Over 317 billion HTTP requests, 4% of all global DDoS traffic, were aimed at Singaporean websites. The US followed closely in second and Canada in third. Taiwan came in as the fourth most attacked region — amidst the upcoming general elections and the tensions with China. Taiwan-bound attacks in Q4 traffic increased by 847% compared to the previous year, and 2,858% compared to the previous quarter. This increase is not limited to the absolute values. When normalized, the percentage of HTTP DDoS attack traffic targeting Taiwan relative to all Taiwan-bound traffic also significantly increased. It increased by 624% quarter-over-quarter and 3,370% year-over-year.

Top targeted countries by HTTP DDoS attacks

While China came in as the ninth most attacked country by HTTP DDoS attacks, it’s the number one most attacked country by network-layer attacks. 45% of all network-layer DDoS traffic that Cloudflare mitigated globally was China-bound. The rest of the countries were so far behind that it is almost negligible.

Top targeted countries by Network-layer DDoS attacks

When normalizing the data, Iraq, Palestinian territories, and Morocco take the lead as the most attacked regions with respect to their total inbound traffic. What’s interesting is that Singapore comes up as fourth. So not only did Singapore face the largest amount of HTTP DDoS attack traffic, but that traffic also made up a significant amount of the total Singapore-bound traffic. By contrast, the US was second most attacked by volume (per the application-layer graph above), but came in the fiftieth place with respect to the total US-bound traffic.

Top targeted countries by HTTP DDoS attacks with respect to each country’s traffic

Similar to Singapore, but arguably more dramatic, China is both the number one most attacked country by network-layer DDoS attack traffic, and also with respect to all China-bound traffic. Almost 86% of all China-bound traffic was mitigated by Cloudflare as network-layer DDoS attacks. The Palestinian territories, Brazil, Norway, and again Singapore followed with large percentages of attack traffic.

Top targeted countries by Network-layer DDoS attacks with respect to each country’s traffic

Attack vectors and attributes

The majority of DDoS attacks are short and small relative to Cloudflare’s scale. However, unprotected websites and networks can still suffer disruption from short and small attacks without proper inline automated protection — underscoring the need for organizations to be proactive in adopting a robust security posture.

In 2023 Q4, 91% of attacks ended within 10 minutes, 97% peaked below 500 megabits per second (mbps), and 88% never exceeded 50 thousand packets per second (pps).

Two out of every 100 network-layer DDoS attacks lasted more than an hour, and exceeded 1 gigabit per second (gbps). One out of every 100 attacks exceeded 1 million packets per second. Furthermore, the amount of network-layer DDoS attacks exceeding 100 million packets per second increased by 15% quarter-over-quarter.

DDoS attack stats you should know

One of those large attacks was a Mirai-botnet attack that peaked at 160 million packets per second. The packet per second rate was not the largest we’ve ever seen. The largest we’ve ever seen was 754 million packets per second. That attack occurred in 2020, and we have yet to see anything larger.

This more recent attack, though, was unique in its bits per second rate. This was the largest network-layer DDoS attack we’ve seen in Q4. It peaked at 1.9 terabits per second and originated from a Mirai botnet. It was a multi-vector attack, meaning it combined multiple attack methods. Some of those methods included UDP fragments flood, UDP/Echo flood, SYN Flood, ACK Flood, and TCP malformed flags.

This attack targeted a known European Cloud Provider and originated from over 18 thousand unique IP addresses that are assumed to be spoofed. It was automatically detected and mitigated by Cloudflare’s defenses.

This goes to show that even the largest attacks end very quickly. Previous large attacks we’ve seen ended within seconds — underlining the need for an in-line automated defense system. Though still rare, attacks in the terabit range are becoming more and more prominent.

1.9 Terabit per second Mirai DDoS attacks

The use of Mirai-variant botnets is still very common. In Q4, almost 3% of all attacks originate from Mirai. Though, of all attack methods, DNS-based attacks remain the attackers’ favorite. Together, DNS Floods and DNS Amplification attacks account for almost 53% of all attacks in Q4. SYN Flood follows in second and UDP floods in third. We’ll cover the two DNS attack types here, and you can visit the hyperlinks to learn more about UDP and SYN floods in our Learning Center.

DNS floods and amplification attacks

DNS floods and DNS amplification attacks both exploit the Domain Name System (DNS), but they operate differently. DNS is like a phone book for the Internet, translating human-friendly domain names like “www.cloudfare.com” into numerical IP addresses that computers use to identify each other on the network.

Simply put, DNS-based DDoS attacks comprise the method computers and servers used to identify one another to cause an outage or disruption, without actually ‘taking down’ a server. For example, a server may be up and running, but the DNS server is down. So clients won’t be able to connect to it and will experience it as an outage.

A DNS flood attack bombards a DNS server with an overwhelming number of DNS queries. This is usually done using a DDoS botnet. The sheer volume of queries can overwhelm the DNS server, making it difficult or impossible for it to respond to legitimate queries. This can result in the aforementioned service disruptions, delays or even an outage for those trying to access the websites or services that rely on the targeted DNS server.

On the other hand, a DNS amplification attack involves sending a small query with a spoofed IP address (the address of the victim) to a DNS server. The trick here is that the DNS response is significantly larger than the request. The server then sends this large response to the victim’s IP address. By exploiting open DNS resolvers, the attacker can amplify the volume of traffic sent to the victim, leading to a much more significant impact. This type of attack not only disrupts the victim but also can congest entire networks.

In both cases, the attacks exploit the critical role of DNS in network operations. Mitigation strategies typically include securing DNS servers against misuse, implementing rate limiting to manage traffic, and filtering DNS traffic to identify and block malicious requests.

Top attack vectors

Amongst the emerging threats we track, we recorded a 1,161% increase in ACK-RST Floods as well as a 515% increase in CLDAP floods, and a 243% increase in SPSS floods, in each case as compared to last quarter. Let’s walk through some of these attacks and how they’re meant to cause disruption.

Top emerging attack vectors

ACK-RST floods

An ACK-RST Flood exploits the Transmission Control Protocol (TCP) by sending numerous ACK and RST packets to the victim. This overwhelms the victim’s ability to process and respond to these packets, leading to service disruption. The attack is effective because each ACK or RST packet prompts a response from the victim’s system, consuming its resources. ACK-RST Floods are often difficult to filter since they mimic legitimate traffic, making detection and mitigation challenging.

CLDAP floods

CLDAP (Connectionless Lightweight Directory Access Protocol) is a variant of LDAP (Lightweight Directory Access Protocol). It’s used for querying and modifying directory services running over IP networks. CLDAP is connectionless, using UDP instead of TCP, making it faster but less reliable. Because it uses UDP, there’s no handshake requirement which allows attackers to spoof the IP address thus allowing attackers to exploit it as a reflection vector. In these attacks, small queries are sent with a spoofed source IP address (the victim’s IP), causing servers to send large responses to the victim, overwhelming it. Mitigation involves filtering and monitoring unusual CLDAP traffic.

SPSS floods

Floods abusing the SPSS (Source Port Service Sweep) protocol is a network attack method that involves sending packets from numerous random or spoofed source ports to various destination ports on a targeted system or network. The aim of this attack is two-fold: first, to overwhelm the victim’s processing capabilities, causing service disruptions or network outages, and second, it can be used to scan for open ports and identify vulnerable services. The flood is achieved by sending a large volume of packets, which can saturate the victim’s network resources and exhaust the capacities of its firewalls and intrusion detection systems. To mitigate such attacks, it’s essential to leverage in-line automated detection capabilities.

Cloudflare is here to help – no matter the attack type, size, or duration

Cloudflare’s mission is to help build a better Internet, and we believe that a better Internet is one that is secure, performant, and available to all. No matter the attack type, the attack size, the attack duration or the motivation behind the attack, Cloudflare’s defenses stand strong. Since we pioneered unmetered DDoS Protection in 2017, we’ve made and kept our commitment to make enterprise-grade DDoS protection free for all organizations alike — and of course, without compromising performance. This is made possible by our unique technology and robust network architecture.

It’s important to remember that security is a process, not a single product or flip of a switch. Atop of our automated DDoS protection systems, we offer comprehensive bundled features such as firewall, bot detection, API protection, and caching to bolster your defenses. Our multi-layered approach optimizes your security posture and minimizes potential impact. We’ve also put together a list of recommendations to help you optimize your defenses against DDoS attacks, and you can follow our step-by-step wizards to secure your applications and prevent DDoS attacks. And, if you’d like to benefit from our easy to use, best-in-class protection against DDoS and other attacks on the Internet, you can sign up — for free! — at cloudflare.com. If you’re under attack, register or call the cyber emergency hotline number shown here for a rapid response.

HTTP/2 Rapid Reset: deconstructing the record-breaking attack

Post Syndicated from Lucas Pardue original http://blog.cloudflare.com/technical-breakdown-http2-rapid-reset-ddos-attack/

HTTP/2 Rapid Reset: deconstructing the record-breaking attack

HTTP/2 Rapid Reset: deconstructing the record-breaking attack

Starting on Aug 25, 2023, we started to notice some unusually big HTTP attacks hitting many of our customers. These attacks were detected and mitigated by our automated DDoS system. It was not long however, before they started to reach record breaking sizes — and eventually peaked just above 201 million requests per second. This was nearly 3x bigger than our previous biggest attack on record.

Concerning is the fact that the attacker was able to generate such an attack with a botnet of merely 20,000 machines. There are botnets today that are made up of hundreds of thousands or millions of machines. Given that the entire web typically sees only between 1–3 billion requests per second, it's not inconceivable that using this method could focus an entire web’s worth of requests on a small number of targets.

Detecting and Mitigating

This was a novel attack vector at an unprecedented scale, but Cloudflare's existing protections were largely able to absorb the brunt of the attacks. While initially we saw some impact to customer traffic — affecting roughly 1% of requests during the initial wave of attacks — today we’ve been able to refine our mitigation methods to stop the attack for any Cloudflare customer without it impacting our systems.

We noticed these attacks at the same time two other major industry players — Google and AWS — were seeing the same. We worked to harden Cloudflare’s systems to ensure that, today, all our customers are protected from this new DDoS attack method without any customer impact. We’ve also participated with Google and AWS in a coordinated disclosure of the attack to impacted vendors and critical infrastructure providers.

This attack was made possible by abusing some features of the HTTP/2 protocol and server implementation details (see  CVE-2023-44487 for details). Because the attack abuses an underlying weakness in the HTTP/2 protocol, we believe any vendor that has implemented HTTP/2 will be subject to the attack. This included every modern web server. We, along with Google and AWS, have disclosed the attack method to web server vendors who we expect will implement patches. In the meantime, the best defense is using a DDoS mitigation service like Cloudflare’s in front of any web-facing web or API server.

This post dives into the details of the HTTP/2 protocol, the feature that attackers exploited to generate these massive attacks, and the mitigation strategies we took to ensure all our customers are protected. Our hope is that by publishing these details other impacted web servers and services will have the information they need to implement mitigation strategies. And, moreover, the HTTP/2 protocol standards team, as well as teams working on future web standards, can better design them to prevent such attacks.

RST attack details

HTTP is the application protocol that powers the Web. HTTP Semantics are common to all versions of HTTP — the overall architecture, terminology, and protocol aspects such as request and response messages, methods, status codes, header and trailer fields, message content, and much more. Each individual HTTP version defines how semantics are transformed into a "wire format" for exchange over the Internet. For example, a client has to serialize a request message into binary data and send it, then the server parses that back into a message it can process.

HTTP/1.1 uses a textual form of serialization. Request and response messages are exchanged as a stream of ASCII characters, sent over a reliable transport layer like TCP, using the following format (where CRLF means carriage-return and linefeed):

 HTTP-message   = start-line CRLF
                   *( field-line CRLF )
                   CRLF
                   [ message-body ]

For example, a very simple GET request for https://blog.cloudflare.com/ would look like this on the wire:

GET / HTTP/1.1 CRLFHost: blog.cloudflare.comCRLF

And the response would look like:

HTTP/1.1 200 OK CRLFServer: cloudflareCRLFContent-Length: 100CRLFtext/html; charset=UTF-8CRLF<100 bytes of data>

This format frames messages on the wire, meaning that it is possible to use a single TCP connection to exchange multiple requests and responses. However, the format requires that each message is sent whole. Furthermore, in order to correctly correlate requests with responses, strict ordering is required; meaning that messages are exchanged serially and can not be multiplexed. Two GET requests, for https://blog.cloudflare.com/ and https://blog.cloudflare.com/page/2/, would be:

GET / HTTP/1.1 CRLFHost: blog.cloudflare.comCRLFGET /page/2 HTTP/1.1 CRLFHost: blog.cloudflare.comCRLF  

With the responses:

HTTP/1.1 200 OK CRLFServer: cloudflareCRLFContent-Length: 100CRLFtext/html; charset=UTF-8CRLF<100 bytes of data>HTTP/1.1 200 OK CRLFServer: cloudflareCRLFContent-Length: 100CRLFtext/html; charset=UTF-8CRLF<100 bytes of data>

Web pages require more complicated HTTP interactions than these examples. When visiting the Cloudflare blog, your browser will load multiple scripts, styles and media assets. If you visit the front page using HTTP/1.1 and decide quickly to navigate to page 2, your browser can pick from two options. Either wait for all of the queued up responses for the page that you no longer want before page 2 can even start, or cancel in-flight requests by closing the TCP connection and opening a new connection. Neither of these is very practical. Browsers tend to work around these limitations by managing a pool of TCP connections (up to 6 per host) and implementing complex request dispatch logic over the pool.

HTTP/2 addresses many of the issues with HTTP/1.1. Each HTTP message is serialized into a set of HTTP/2 frames that have type, length, flags, stream identifier (ID) and payload. The stream ID makes it clear which bytes on the wire apply to which message, allowing safe multiplexing and concurrency. Streams are bidirectional. Clients send frames and servers reply with frames using the same ID.

In HTTP/2 our GET request for https://blog.cloudflare.com would be exchanged across stream ID 1, with the client sending one HEADERS frame, and the server responding with one HEADERS frame, followed by one or more DATA frames. Client requests always use odd-numbered stream IDs, so subsequent requests would use stream ID 3, 5, and so on. Responses can be served in any order, and frames from different streams can be interleaved.

HTTP/2 Rapid Reset: deconstructing the record-breaking attack

Stream multiplexing and concurrency are powerful features of HTTP/2. They enable more efficient usage of a single TCP connection. HTTP/2 optimizes resources fetching especially when coupled with prioritization. On the flip side, making it easy for clients to launch large amounts of parallel work can increase the peak demand for server resources when compared to HTTP/1.1. This is an obvious vector for denial-of-service.

In order to provide some guardrails, HTTP/2 provides a notion of maximum active concurrent streams. The SETTINGS_MAX_CONCURRENT_STREAMS parameter allows a server to advertise its limit of concurrency. For example, if the server states a limit of 100, then only 100 requests can be active at any time. If a client attempts to open a stream above this limit, it must be rejected by the server using a RST_STREAM frame. Stream rejection does not affect the other in-flight streams on the connection.

The true story is a little more complicated. Streams have a lifecycle. Below is a diagram of the HTTP/2 stream state machine. Client and server manage their own views of the state of a stream. HEADERS, DATA and RST_STREAM frames trigger transitions when they are sent or received. Although the views of the stream state are independent, they are synchronized.

HEADERS and DATA frames include an END_STREAM flag, that when set to the value 1 (true), can trigger a state transition.

HTTP/2 Rapid Reset: deconstructing the record-breaking attack

Let's work through this with an example of a GET request that has no message content. The client sends the request as a HEADERS frame with the END_STREAM flag set to 1. The client first transitions the stream from idle to open state, then immediately transitions into half-closed state. The client half-closed state means that it can no longer send HEADERS or DATA, only WINDOW_UPDATE, PRIORITY or RST_STREAM frames. It can receive any frame however.

Once the server receives and parses the HEADERS frame, it transitions the stream state from idle to open and then half-closed, so it matches the client. The server half-closed state means it can send any frame but receive only WINDOW_UPDATE, PRIORITY or RST_STREAM frames.

The response to the GET contains message content, so the server sends HEADERS with END_STREAM flag set to 0, then DATA with END_STREAM flag set to 1. The DATA frame triggers the transition of the stream from half-closed to closed on the server. When the client receives it, it also transitions to closed. Once a stream is closed, no frames can be sent or received.

Applying this lifecycle back into the context of concurrency, HTTP/2 states:

Streams that are in the "open" state or in either of the "half-closed" states count toward the maximum number of streams that an endpoint is permitted to open. Streams in any of these three states count toward the limit advertised in the SETTINGS_MAX_CONCURRENT_STREAMS setting.

In theory, the concurrency limit is useful. However, there are practical factors that hamper its effectiveness— which we will cover later in the blog.

HTTP/2 request cancellation

Earlier, we talked about client cancellation of in-flight requests. HTTP/2 supports this in a much more efficient way than HTTP/1.1. Rather than needing to tear down the whole connection, a client can send a RST_STREAM frame for a single stream. This instructs the server to stop processing the request and to abort the response, which frees up server resources and avoids wasting bandwidth.

Let's consider our previous example of 3 requests. This time the client cancels the request on stream 1 after all of the HEADERS have been sent. The server parses this RST_STREAM frame before it is ready to serve the response and instead only responds to stream 3 and 5:

HTTP/2 Rapid Reset: deconstructing the record-breaking attack

Request cancellation is a useful feature. For example, when scrolling a webpage with multiple images, a web browser can cancel images that fall outside the viewport, meaning that images entering it can load faster. HTTP/2 makes this behaviour a lot more efficient compared to HTTP/1.1.

A request stream that is canceled, rapidly transitions through the stream lifecycle. The client's HEADERS with END_STREAM flag set to 1 transitions the state from idle to open to half-closed, then RST_STREAM immediately causes a transition from half-closed to closed.

HTTP/2 Rapid Reset: deconstructing the record-breaking attack

Recall that only streams that are in the open or half-closed state contribute to the stream concurrency limit. When a client cancels a stream, it instantly gets the ability to open another stream in its place and can send another request immediately. This is the crux of what makes CVE-2023-44487 work.

Rapid resets leading to denial of service

HTTP/2 request cancellation can be abused to rapidly reset an unbounded number of streams. When an HTTP/2 server is able to process client-sent RST_STREAM frames and tear down state quickly enough, such rapid resets do not cause a problem. Where issues start to crop up is when there is any kind of delay or lag in tidying up. The client can churn through so many requests that a backlog of work accumulates, resulting in excess consumption of resources on the server.

A common HTTP deployment architecture is to run an HTTP/2 proxy or load-balancer in front of other components. When a client request arrives it is quickly dispatched and the actual work is done as an asynchronous activity somewhere else. This allows the proxy to handle client traffic very efficiently. However, this separation of concerns can make it hard for the proxy to tidy up the in-process jobs. Therefore, these deployments are more likely to encounter issues from rapid resets.

When Cloudflare's reverse proxies process incoming HTTP/2 client traffic, they copy the data from the connection’s socket into a buffer and process that buffered data in order. As each request is read (HEADERS and DATA frames) it is dispatched to an upstream service. When RST_STREAM frames are read, the local state for the request is torn down and the upstream is notified that the request has been canceled. Rinse and repeat until the entire buffer is consumed. However this logic can be abused: when a malicious client started sending an enormous chain of requests and resets at the start of a connection, our servers would eagerly read them all and create stress on the upstream servers to the point of being unable to process any new incoming request.

Something that is important to highlight is that stream concurrency on its own cannot mitigate rapid reset. The client can churn requests to create high request rates no matter the server's chosen value of SETTINGS_MAX_CONCURRENT_STREAMS.

Rapid Reset dissected

Here's an example of rapid reset reproduced using a proof-of-concept client attempting to make a total of 1000 requests. I've used an off-the-shelf server without any mitigations; listening on port 443 in a test environment. The traffic is dissected using Wireshark and filtered to show only HTTP/2 traffic for clarity. Download the pcap to follow along.

HTTP/2 Rapid Reset: deconstructing the record-breaking attack

It's a bit difficult to see, because there are a lot of frames. We can get a quick summary via Wireshark's Statistics > HTTP2 tool:

HTTP/2 Rapid Reset: deconstructing the record-breaking attack

The first frame in this trace, in packet 14, is the server's SETTINGS frame, which advertises a maximum stream concurrency of 100. In packet 15, the client sends a few control frames and then starts making requests that are rapidly reset. The first HEADERS frame is 26 bytes long, all subsequent HEADERS are only 9 bytes. This size difference is due to a compression technology called HPACK. In total, packet 15 contains 525 requests, going up to stream 1051.

HTTP/2 Rapid Reset: deconstructing the record-breaking attack

Interestingly, the RST_STREAM for stream 1051 doesn't fit in packet 15, so in packet 16 we see the server respond with a 404 response.  Then in packet 17 the client does send the RST_STREAM, before moving on to sending the remaining 475 requests.

Note that although the server advertised 100 concurrent streams, both packets sent by the client sent a lot more HEADERS frames than that. The client did not have to wait for any return traffic from the server, it was only limited by the size of the packets it could send. No server RST_STREAM frames are seen in this trace, indicating that the server did not observe a concurrent stream violation.

Impact on customers

As mentioned above, as requests are canceled, upstream services are notified and can abort requests before wasting too many resources on it. This was the case with this attack, where most malicious requests were never forwarded to the origin servers. However, the sheer size of these attacks did cause some impact.

First, as the rate of incoming requests reached peaks never seen before, we had reports of increased levels of 502 errors seen by clients. This happened on our most impacted data centers as they were struggling to process all the requests. While our network is meant to deal with large attacks, this particular vulnerability exposed a weakness in our infrastructure. Let's dig a little deeper into the details, focusing on how incoming requests are handled when they hit one of our data centers:

HTTP/2 Rapid Reset: deconstructing the record-breaking attack

We can see that our infrastructure is composed of a chain of different proxy servers with different responsibilities. In particular, when a client connects to Cloudflare to send HTTPS traffic, it first hits our TLS decryption proxy: it decrypts TLS traffic, processes HTTP 1, 2 or 3 traffic, then forwards it to our "business logic" proxy. This one is responsible for loading all the settings for each customer, then routing the requests correctly to other upstream services — and more importantly in our case, it is also responsible for security features. This is where L7 attack mitigation is processed.

The problem with this attack vector is that it manages to send a lot of requests very quickly in every single connection. Each of them had to be forwarded to the business logic proxy before we had a chance to block it. As the request throughput became higher than our proxy capacity, the pipe connecting these two services reached its saturation level in some of our servers.

When this happens, the TLS proxy cannot connect anymore to its upstream proxy, this is why some clients saw a bare "502 Bad Gateway" error during the most serious attacks. It is important to note that, as of today, the logs used to create HTTP analytics are also emitted by our business logic proxy. The consequence of that is that these errors are not visible in the Cloudflare dashboard. Our internal dashboards show that about 1% of requests were impacted during the initial wave of attacks (before we implemented mitigations), with peaks at around 12% for a few seconds during the most serious one on August 29th. The following graph shows the ratio of these errors over a two hours while this was happening:

HTTP/2 Rapid Reset: deconstructing the record-breaking attack

We worked to reduce this number dramatically in the following days, as detailed later on in this post. Both thanks to changes in our stack and to our mitigation that reduce the size of these attacks considerably, this number is today is effectively zero:

HTTP/2 Rapid Reset: deconstructing the record-breaking attack

499 errors and the challenges for HTTP/2 stream concurrency

Another symptom reported by some customers is an increase in 499 errors. The reason for this is a bit different and is related to the maximum stream concurrency in a HTTP/2 connection detailed earlier in this post.

HTTP/2 settings are exchanged at the start of a connection using SETTINGS frames. In the absence of receiving an explicit parameter, default values apply. Once a client establishes an HTTP/2 connection, it can wait for a server's SETTINGS (slow) or it can assume the default values and start making requests (fast). For SETTINGS_MAX_CONCURRENT_STREAMS, the default is effectively unlimited (stream IDs use a 31-bit number space, and requests use odd numbers, so the actual limit is 1073741824). The specification recommends that a server offer no fewer than 100 streams. Clients are generally biased towards speed, so don't tend to wait for server settings, which creates a bit of a race condition. Clients are taking a gamble on what limit the server might pick; if they pick wrong the request will be rejected and will have to be retried. Gambling on 1073741824 streams is a bit silly. Instead, a lot of clients decide to limit themselves to issuing 100 concurrent streams, with the hope that servers followed the specification recommendation. Where servers pick something below 100, this client gamble fails and streams are reset.

HTTP/2 Rapid Reset: deconstructing the record-breaking attack

There are many reasons a server might reset a stream beyond concurrency limit overstepping. HTTP/2 is strict and requires a stream to be closed when there are parsing or logic errors. In 2019, Cloudflare developed several mitigations in response to HTTP/2 DoS vulnerabilities. Several of those vulnerabilities were caused by a client misbehaving, leading the server to reset a stream. A very effective strategy to clamp down on such clients is to count the number of server resets during a connection, and when that exceeds some threshold value, close the connection with a GOAWAY frame. Legitimate clients might make one or two mistakes in a connection and that is acceptable. A client that makes too many mistakes is probably either broken or malicious and closing the connection addresses both cases.

While responding to DoS attacks enabled by CVE-2023-44487, Cloudflare reduced maximum stream concurrency to 64. Before making this change, we were unaware that clients don't wait for SETTINGS and instead assume a concurrency of 100. Some web pages, such as an image gallery, do indeed cause a browser to send 100 requests immediately at the start of a connection. Unfortunately, the 36 streams above our limit all needed to be reset, which triggered our counting mitigations. This meant that we closed connections on legitimate clients, leading to a complete page load failure. As soon as we realized this interoperability issue, we changed the maximum stream concurrency to 100.

Actions from the Cloudflare side

In 2019 several DoS vulnerabilities were uncovered related to implementations of HTTP/2. Cloudflare developed and deployed a series of detections and mitigations in response.  CVE-2023-44487 is a different manifestation of HTTP/2 vulnerability. However, to mitigate it we were able to extend the existing protections to monitor client-sent RST_STREAM frames and close connections when they are being used for abuse. Legitimate client uses for RST_STREAM are unaffected.

In addition to a direct fix, we have implemented several improvements to the server's HTTP/2 frame processing and request dispatch code. Furthermore, the business logic server has received improvements to queuing and scheduling that reduce unnecessary work and improve cancellation responsiveness. Together these lessen the impact of various potential abuse patterns as well as giving more room to the server to process requests before saturating.

Mitigate attacks earlier

Cloudflare already had systems in place to efficiently mitigate very large attacks with less expensive methods. One of them is named "IP Jail". For hyper volumetric attacks, this system collects the client IPs participating in the attack and stops them from connecting to the attacked property, either at the IP level, or in our TLS proxy. This system however needs a few seconds to be fully effective; during these precious seconds, the origins are already protected but our infrastructure still needs to absorb all HTTP requests. As this new botnet has effectively no ramp-up period, we need to be able to neutralize attacks before they can become a problem.

To achieve this we expanded the IP Jail system to protect our entire infrastructure: once an IP is "jailed", not only it is blocked from connecting to the attacked property, we also forbid the corresponding IPs from using HTTP/2 to any other domain on Cloudflare for some time. As such protocol abuses are not possible using HTTP/1.x, this limits the attacker's ability to run large attacks, while any legitimate client sharing the same IP would only see a very small performance decrease during that time. IP based mitigations are a very blunt tool — this is why we have to be extremely careful when using them at that scale and seek to avoid false positives as much as possible. Moreover, the lifespan of a given IP in a botnet is usually short so any long term mitigation is likely to do more harm than good. The following graph shows the churn of IPs in the attacks we witnessed:

HTTP/2 Rapid Reset: deconstructing the record-breaking attack

As we can see, many new IPs spotted on a given day disappear very quickly afterwards.

As all these actions happen in our TLS proxy at the beginning of our HTTPS pipeline, this saves considerable resources compared to our regular L7 mitigation system. This allowed us to weather these attacks much more smoothly and now the number of random 502 errors caused by these botnets is down to zero.

Observability improvements

Another front on which we are making change is observability. Returning errors to clients without being visible in customer analytics is unsatisfactory. Fortunately, a project has been underway to overhaul these systems since long before the recent attacks. It will eventually allow each service within our infrastructure to log its own data, instead of relying on our business logic proxy to consolidate and emit log data. This incident underscored the importance of this work, and we are redoubling our efforts.

We are also working on better connection-level logging, allowing us to spot such protocol abuses much more quickly to improve our DDoS mitigation capabilities.

Conclusion

While this was the latest record-breaking attack, we know it won’t be the last. As attacks continue to become more sophisticated, Cloudflare works relentlessly to proactively identify new threats — deploying countermeasures to our global network so that our millions of customers are immediately and automatically protected.

Cloudflare has provided free, unmetered and unlimited DDoS protection to all of our customers since 2017. In addition, we offer a range of additional security features to suit the needs of organizations of all sizes. Contact us if you’re unsure whether you’re protected or want to understand how you can be.

HTTP/2 Zero-Day Vulnerability Results in Record-Breaking DDoS Attacks

Post Syndicated from Grant Bourzikas original http://blog.cloudflare.com/zero-day-rapid-reset-http2-record-breaking-ddos-attack/

HTTP/2 Zero-Day Vulnerability Results in Record-Breaking DDoS Attacks

HTTP/2 Zero-Day Vulnerability Results in Record-Breaking DDoS Attacks

Earlier today, Cloudflare, along with Google and Amazon AWS, disclosed the existence of a novel zero-day vulnerability dubbed the “HTTP/2 Rapid Reset” attack. This attack exploits a weakness in the HTTP/2 protocol to generate enormous, hyper-volumetric Distributed Denial of Service (DDoS) attacks. Cloudflare has mitigated a barrage of these attacks in recent months, including an attack three times larger than any previous attack we’ve observed, which exceeded 201 million requests per second (rps). Since the end of August 2023, Cloudflare has mitigated more than 1,100 other attacks with over 10 million rps — and 184 attacks that were greater than our previous DDoS record of 71 million rps.

This zero-day provided threat actors with a critical new tool in their Swiss Army knife of vulnerabilities to exploit and attack their victims at a magnitude that has never been seen before. While at times complex and challenging to combat, these attacks allowed Cloudflare the opportunity to develop purpose-built technology to mitigate the effects of the zero-day vulnerability.

If you are using Cloudflare for HTTP DDoS mitigation, you are protected. And below, we’ve included more information on this vulnerability, and resources and recommendations on what you can do to secure yourselves.

Deconstructing the attack: What every CSO needs to know

In late August 2023, our team at Cloudflare noticed a new zero-day vulnerability, developed by an unknown threat actor, that exploits the standard HTTP/2 protocol — a fundamental protocol that is critical to how the Internet and all websites work. This novel zero-day vulnerability attack, dubbed Rapid Reset, leverages HTTP/2’s stream cancellation feature by sending a request and immediately canceling it over and over.  

By automating this trivial “request, cancel, request, cancel” pattern at scale, threat actors are able to create a denial of service and take down any server or application running the standard implementation of HTTP/2. Furthermore, one crucial thing to note about the record-breaking attack is that it involved a modestly-sized botnet, consisting of roughly 20,000 machines. Cloudflare regularly detects botnets that are orders of magnitude larger than this — comprising hundreds of thousands and even millions of machines. For a relatively small botnet to output such a large volume of requests, with the potential to incapacitate nearly any server or application supporting HTTP/2, underscores how menacing this vulnerability is for unprotected networks.

Threat actors used botnets in tandem with the HTTP/2 vulnerability to amplify requests at rates we have never seen before. As a result, our team at Cloudflare experienced some intermittent edge instability. While our systems were able to mitigate the overwhelming majority of incoming attacks, the volume overloaded some components in our network, impacting a small number of customers’ performance with intermittent 4xx and 5xx errors — all of which were quickly resolved.

Once we successfully mitigated these issues and halted potential attacks for all customers, our team immediately kicked off a responsible disclosure process. We entered into conversations with industry peers to see how we could work together to help move our mission forward and safeguard the large percentage of the Internet that relies on our network prior to releasing this vulnerability to the general public.

We cover the technical details of the attack in more detail in a separate blog post: HTTP/2 Rapid Reset: deconstructing the record-breaking attack.

How is Cloudflare and the industry thwarting this attack?

There is no such thing as a “perfect disclosure.” Thwarting attacks and responding to emerging incidents requires organizations and security teams to live by an assume-breach mindset — because there will always be another zero-day, new evolving threat actor groups, and never-before-seen novel attacks and techniques.

This “assume-breach” mindset is a key foundation towards information sharing and ensuring in instances such as this that the Internet remains safe. While Cloudflare was experiencing and mitigating these attacks, we were also working with industry partners to guarantee that the industry at-large could withstand this attack.  

During the process of mitigating this attack, our Cloudflare team developed and purpose-built new technology to stop these DDoS attacks and further improve our own mitigations for this and other future attacks of massive scale. These efforts have significantly increased our overall mitigation capabilities and resiliency. If you are using Cloudflare, we are confident that you are protected.

Our team also alerted web server software partners who are developing patches to ensure this vulnerability cannot be exploited — check their websites for more information.

HTTP/2 Zero-Day Vulnerability Results in Record-Breaking DDoS Attacks

Disclosures are never one and done. The lifeblood of Cloudflare is to ensure a better Internet, which stems from instances such as these. When we have the opportunity to work with our industry partners and governments to ensure there are no widespread impacts on the Internet, we are doing our part in increasing the cyber resiliency of every organization no matter the size or vertical.

To gain more of an understanding around mitigation tactics and next steps on patching, register for our webinar.

What are the origins of the HTTP/2 Rapid Reset and these record-breaking attacks on Cloudflare?

It may seem odd that Cloudflare was one of the first companies to witness these attacks. Why would threat actors attack a company that has some of the most robust defenses against DDoS attacks in the world?  

The reality is that Cloudflare often sees attacks before they are turned on more vulnerable targets. Threat actors need to develop and test their tools before they deploy them in the wild. Threat actors who possess record-shattering attack methods can have an extremely difficult time testing and understanding how large and effective they are, because they don't have the infrastructure to absorb the attacks they are launching. Because of the transparency that we share on our network performance, and the measurements of attacks they could glean from our public performance charts, this threat actor was likely targeting us to understand the capabilities of the exploit.

But that testing, and the ability to see the attack early, helps us develop mitigations for the attack that benefit both our customers and industry as a whole.

From CSO to CSO: What should you do?

I have been a CSO for over 20 years, on the receiving end of countless disclosures and  announcements like this. But whether it was Log4J, Solarwinds, EternalBlue WannaCry/NotPetya, Heartbleed, or Shellshock, all of these security incidents have a commonality. A tremendous explosion that ripples across the world and creates an opportunity to completely disrupt any of the organizations that I have led — regardless of the industry or the size.

Many of these were attacks or vulnerabilities that we may have not been able to control. But regardless of whether the issue arose from something that was in my control or not, what has set any successful initiative I have led apart from those that did not lean in our favor was the ability to respond when zero-day vulnerabilities and exploits like this are identified.    

While I wish I could say that Rapid Reset may be different this time around, it is not. I am calling all CSOs — no matter if you’ve lived through the decades of security incidents that I have, or this is your first day on the job — this is the time to ensure you are protected and stand up your cyber incident response team.

We’ve kept the information restricted until today to give as many security vendors as possible the opportunity to react. However, at some point, the responsible thing becomes to publicly disclose zero-day threats like this. Today is that day. That means that after today, threat actors will be largely aware of the HTTP/2 vulnerability; and it will inevitably become trivial to exploit and kickoff the race between defenders and attacks — first to patch vs. first to exploit. Organizations should assume that systems will be tested, and take proactive measures to ensure protection.

To me, this is reminiscent of a vulnerability like Log4J, due to the many variants that are emerging daily, and will continue to come to fruition in the weeks, months, and years to come. As more researchers and threat actors experiment with the vulnerability, we may find different variants with even shorter exploit cycles that contain even more advanced bypasses.  

And just like Log4J, managing incidents like this isn’t as simple as “run the patch, now you’re done”. You need to turn incident management, patching, and evolving your security protections into ongoing processes — because the patches for each variant of a vulnerability reduce your risk, but they don’t eliminate it.

I don’t mean to be alarmist, but I will be direct: you must take this seriously. Treat this as a full active incident to ensure nothing happens to your organization.

Recommendations for a New Standard of Change

While no one security event is ever identical to the next, there are lessons that can be learned. CSOs, here are my recommendations that must be implemented immediately. Not only in this instance, but for years to come:

  • Understand your external and partner network’s external connectivity to remediate any Internet facing systems with the mitigations below.
  • Understand your existing security protection and capabilities you have to protect, detect and respond to an attack and immediately remediate any issues you have in your network.
  • Ensure your DDoS Protection resides outside of your data center because if the traffic gets to your datacenter, it will be difficult to mitigate the DDoS attack.
  • Ensure you have DDoS protection for Applications (Layer 7) and ensure you have Web Application Firewalls. Additionally as a best practice, ensure you have complete DDoS protection for DNS, Network Traffic (Layer 3) and API Firewalls
  • Ensure web server and operating system patches are deployed across all Internet Facing Web Servers. Also, ensure all automation like Terraform builds and images are fully patched so older versions of web servers are not deployed into production over the secure images by accident.
  • As a last resort, consider turning off HTTP/2 and HTTP/3 (likely also vulnerable) to mitigate the threat.  This is a last resort only, because there will be a significant performance issues if you downgrade to HTTP/1.1
  • Consider a secondary, cloud-based DDoS L7 provider at perimeter for resilience.

Cloudflare’s mission is to help build a better Internet. If you are concerned with your current state of DDoS protection, we are more than happy to provide you with our DDoS capabilities and resilience for free to mitigate any attempts of a successful DDoS attack.  We know the stress that you are facing as we have fought off these attacks for the last 30 days and made our already best in class systems, even better.

If you’re interested in finding out more, we have a webinar coming up with more details on the zero-day and how to respond; you can register here. We also have more technical details of the attack in more detail in a separate blog post: HTTP/2 Rapid Reset: deconstructing the record-breaking attack. Finally, if you’re being targeted or need immediate protection, please contact your local Cloudflare representative or visit https://www.cloudflare.com/under-attack-hotline/.

Cloudflare Radar’s 2023 overview of new tools and insights

Post Syndicated from João Tomé original http://blog.cloudflare.com/cloudflare-radars-2023-overview-of-new-tools-and-insights/

Cloudflare Radar’s 2023 overview of new tools and insights

Cloudflare Radar’s 2023 overview of new tools and insights

Cloudflare Radar was launched in September 2020, almost three years ago, when the pandemic was affecting Internet traffic usage. It is a free tool to show Internet usage patterns from both human and automated systems, as well as attack trends, top domains, and adoption and usage of browsers and protocols. As Cloudflare has been publishing data-driven insights related to the general Internet for more than 10 years now, Cloudflare Radar is a natural evolution.

This year, we have introduced several new features to Radar, also available through our public API, that enables deeper data exploration. We’ve also launched an Internet Quality section, a Trending Domains section, a URL Scanner tool, and a Routing section to track network interconnection, routing security, and observed routing anomalies.

In this reading list, we want to highlight some of those new additions, as well as some of the Internet disruptions and trends we’ve observed and published posts about during this year, including the war in Ukraine, the impact of Easter, and exam-related shutdowns in Iraq and Algeria.

We also encourage everyone to explore Cloudflare Radar and its new features, and to give you a partial review of the year, in terms of Internet insights — our 2023 Year in Review is coming later this year.

New additions to Cloudflare Radar

In 2022, Cloudflare Radar 2.0 was released last September, refreshing the look & feel and building on a new platform that allows us to easily add new features in the future. At that time, we added two new sections:

Cloudflare Radar’s 2022 Year in Review and the related blog were published at the end of the year.

Without further ado, here are some of the new features launched in 2023.

Analyze any URL safely using the Cloudflare Radar URL Scanner (✍️)

If you're invited to click on a link and if you're unsure about its safety, or if you simply want to verify technical details about a particular site, URL Scanner is here to assist. Provide us with a URL, and our scanner will compile a report containing a myriad of technical details: risk assessment, SSL certificate data, HTTP request and response data, page performance data, DNS records, associated cookies, what technologies and libraries the page uses, and more.

Introducing the Cloudflare Radar Internet Quality Page (✍️)

In June 2023, the new Internet Quality page was introduced to Cloudflare Radar, offering both country and network (autonomous system) level insight. This provides information on Internet connection performance (bandwidth) and quality (latency, jitter) over time based on benchmark test data as well as speed.cloudflare.com test results.

You can also see in a world map how the different countries compare with each other in different metrics from bandwidth to latency and jitter. Autonomous systems (AS) or networks are presented on individual pages, including Starlink’s AS14593. Latency is the metric that gives a better perspective on quality and improved Internet experience. Here’s the most recent global view on latency-based connection quality (lower is better):

Cloudflare Radar’s 2023 overview of new tools and insights

Starting July 2023, our Domain Rankings page received enhancements through the inclusion of specific Trending Domains lists. While the top 100 list is typically dominated by the big names such as Google, Facebook, and Apple, there are trending domains that also tell interesting and even more local stories.

The Trending Domains lists highlight surges in interest from the previous day and previous week. For instance, we captured how nba.com was trending in 28 locations during the NBA Draft 2023, and how rt.com (a Russian-based news site) gained attention in multiple countries during the Wagner group mutiny in Russia. More recently, on the same subject, after the death of Wagner’s leader, Yevgeny Prigozhin, in a plane crash, flightradar24.com was trending in our daily list both in Russia and Ukraine.

Routing information now on Cloudflare Radar (✍️)

The Internet is a vast, sprawling collection of networks (autonomous systems) that connect to each other, and routing is one of the most critical operations of the Internet. Launched in late July 2023, the new Cloudflare Radar Routing page examines the routing status of the Internet, including secure routing protocol deployment for a country and routing changes and anomalies. Included are routing security statistics, and also announced prefixes and connectivity insights. Why is that important? Routing decides how and where the Internet traffic should flow from the source to the destination, and deviations or anomalies can indicate potential issues that lead to connectivity disruptions.

Border Gateway Protocol (BGP), is considered the postal service of the Internet, but as a routing protocol suffers from a number of security weaknesses. Within the Routing page, we also present BGP route leaks and BGP hijack detection results, highlighting relevant events detected for any given network or globally. Notably, BGP origin hijacks allow attackers to intercept, monitor, redirect, or drop traffic destined for the victim's networks. In this related blog post, we also explain how Cloudflare built its BGP hijack detection system (including notifications), from its design and implementation to its integration: Cloudflare Radar's new BGP origin hijack detection system.

Cloudflare Radar’s 2023 overview of new tools and insights

General Internet insights from 2023

This blog post details Internet insights during the war in Europe and discusses how Ukraine's Internet remained resilient in spite of dozens of attacks and disruptions in three different stages of the conflict.

Cloudflare observed multiple Internet disruptions in the first weeks of the war (Internet infrastructure was damaged, and Internet access was limited in besieged areas, like Mariupol), as well as airstrikes on Ukrainian energy infrastructure. We also emphasize how application-layer cyber attacks in Ukraine rose 1,300% in early March 2022 as compared to pre-war levels, the country’s Internet resilience during the war, and major growth in Starlink traffic from the country.

Cloudflare’s view of the Virgin Media outage in the UK (✍️)

At times, major Internet operators experience significant outages due to technical issues. In 2022, it was Canada’s Rogers that experienced a 17-hour disruption impacting millions of users, and in early April 2023, a similar incident occurred with the United Kingdom’s Virgin Media. In this case, there were two clear outages for a few hours during April 4, 2023.

The post examines the impact on Internet traffic, the availability of Virgin Media web properties, and how BGP activity offered insights into the root cause.

National holidays celebrated in various countries can influence local Internet traffic trends. That was the case during Easter, celebrated between April 7-10, 2023. In countries including Italy, Poland, Germany, France, Spain, Portugal, the United States, Mexico, and Australia, the Easter long weekend led to the lowest traffic levels of 2023 up to that point—over 100 days into the year. Traffic dipped most significantly on Easter Sunday, compared to the previous Sunday, in Poland (22% lower), Italy (18% lower), France (16% lower).

The post also illustrates Orthodox Easter trends, with Greece being most impacted. It examines Ramadan-related changes, where eating rituals impacted Internet patterns in several countries with significant Muslim populations, and Passover trends, showing how Israel’s Internet traffic dropped as much as 24%.

Effects of the conflict in Sudan on Internet patterns (✍️)

We’ve been monitoring changes and disruptions in Internet patterns linked to military interventions. In this Sudan-related blog post, we analyze the impact of the armed conflict between rival factions of the military government that began on April 15, 2023. Cloudflare observed varying disruptions in Internet traffic after that day, with a mix of clear outages and general decrease in traffic.

The country’s Internet continues to be impacted ever since, as our 12-month traffic graph illustrates, with the relevant Sudatel, Mobitel, and MTN autonomous systems from local ISPs remaining the most affected.

The most recent Internet pattern change linked to military intervention is the ongoing coup in Niger. This particular event caused a distinct traffic drop, likely tied to shifts in human Internet usage, given the absence of signs of consistent connectivity disruption.

How the coronation of King Charles III affected Internet traffic (✍️)

As the coronation ceremony of King Charles III unfolded in London on May 6, 2023, distinct spikes and dips in Internet traffic were observed, each coinciding with key moments of the event. Also, on Sunday during the Coronation Big Lunch event, and Prince William’s speech at night, both instances led to a clear traffic drop of up to 18% compared with the previous Sunday. The accompanying chart displays this trend.

Cloudflare Radar’s 2023 overview of new tools and insights

During the coronation weekend, Canada and Australia also exhibited shifts in Internet traffic patterns. And within this coronation post, there’s also analysis on Internet traffic pattern changes when Queen Elizabeth II passed away on September 8, 2022.

Cloudflare’s view of Internet disruptions in Pakistan (✍️)

Following the arrest of ex-PM Imran Khan, violent protests led the Pakistani government to order the shutdown of mobile Internet services and blocking of social media platforms. Mobile network shutdowns in the country lasted for several days.

We examined the impact of these shutdowns on Internet traffic in Pakistan and traffic to Cloudflare’s 1.1.1.1 DNS resolver and how Pakistanis appeared to be using it in an attempt to maintain access to the open Internet.

Nine years of Project Galileo and how the last year has changed it (✍️)

For the ninth anniversary of our Project Galileo in June 2023, the focus turned towards providing access to affordable cybersecurity tools and sharing our learnings from protecting the most vulnerable communities. We also published a ninth anniversary Project Galileo report.

One of the highlights of the report was a clear DDoS attack targeting an organization related to international law. This incident occurred on the same day an international arrest warrant was issued for Russian President Vladimir Putin and Russian official Maria Lvova-Belova, on March 17, 2023. Another standout observation involved the spikes in traffic experienced by Ukrainian emergency and humanitarian services, coinciding with bombings within the country.

Since early June 2023, we’ve seen Iraq implementing a series of multi-hour shutdowns that continued through July and into August, as documented in our Outage Center. Algeria took similar actions, but using a content blocking-based approach, instead of the wide-scale Internet shutdowns, to prevent cheating on baccalaureate exams. This summer, these exam-related shutdowns were also  implemented in Syria.

Cloudflare has previously observed and reported on similar occurrences in 2022 and also in 2021, in Syria and Sudan.

Cloudflare Radar’s 2023 overview of new tools and insights
2023 has been a busy year for different types of Internet disruptions and outages, from government-directed shutdowns to natural incidents.

Reports: DDoS, Internet disruptions, and application security

Within Cloudflare Radar’s reports section, you will find a diverse array of perspectives on the Internet. From the Project Galileo 9th Anniversary — focused on aiding significant yet vulnerable online voices — to the more recent Q2 2023 Browsers and Search Engines reports. Some reports, such as the DDoS attack trends one, are also blog posts. Others are only available as blog posts, like the Internet disruptions summary, expanding on entries in the Outage Center, and the Application Security report.

Q2 2023 Internet disruption summary (✍️)

This post delves into Internet disruptions observed by Cloudflare during the second quarter of 2023. Since 2022, we have been consistently offering these quarterly overviews of disruptions, and Q2 proved to be a busy quarter, with different types of disruptions:

  • There were several government directed shutdowns, including the ones related to “exam season” in several Middle Eastern and African countries, that continue through August.
  • Severe weather also played a role with a “Super Typhoon”-related disruption on the US territory of Guam.
  • Cable damage was behind disruptions in Bolivia, the Gambia and the Philippines.
  • Power outage-related Internet disruptions were observed in Curaçao, Portugal, and Botswana.
  • More generic technical problems impacted SpaceX Starlink’s satellite service, and Virgin Media in the United Kingdom.
  • Cyberattacks played a role in disruptions in both Russia and Ukraine.
  • Military action-related outages were observed in Chad and Sudan.
  • There were also maintenance related outages that affected Togo, Republic of Congo (Brazzaville), and Burkina Faso.

The Internet disruptions overview for Q1 2023 included another cause, a massive earthquake. The early February 7.8 magnitude earthquake in Turkey, which also affected Syria, caused widespread damage and tens of thousands of fatalities, and resulted in significant disruptions to Internet connectivity in multiple regions for several weeks.

DDoS threat report for 2023 Q2 (✍️)

Since 2020, our DDoS reports/blog posts have been focused on uncovering new attack trends, identifying the most affected countries, and showing targeted industries. Our Q2 2023 DDoS threats blog post highlights an unprecedented escalation in DDoS attack sophistication. Pro-Russian hacktivists REvil, Killnet, and Anonymous Sudan joined forces to attack Western sites. Exploits related to the zero-day vulnerability known as TP240PhoneHome surged by a whopping 532%, and attacks on crypto rocketed up by 600%.

An associated interactive version of this report is available on Cloudflare Radar. Furthermore, we’ve also added a new interactive component to Radar’s security section that allows you to dive deeper into attack activity in each country or region.

Our previous 2023 Q1 DDoS threat report highlighted a record-breaking hyper volumetric 71 million requests per second (rps) attack.

Application Security Report: Q2 2023  (✍️)

Our Application Security report has been around since 2022. The latest one highlights new attack trends and insights visible through Cloudflare’s global network. Some highlights include:

  • Daily mitigated HTTP requests decreased by 2 percentage points to 6% on average from 2021 to 2022, but days with larger than usual malicious activity were clearly seen across the network.
  • Application owners are increasingly relying on geo location blocks.
  • Old CVEs (Common Vulnerabilities and Exposures) are still exploited en masse. In that regard, also in August 2023, we also published a “Unmasking the top exploited vulnerabilities of 2022” analysis.
  • On average, more than 10% of non-verified bot traffic is mitigated. Compared to the last report, non-verified bot HTTP traffic mitigation is currently on a downward trend (down 6 percentage points).
  • 65% of global API traffic is generated by browsers.
  • HTTP Anomalies are the most common attack vector on API endpoints, with 64%, followed by SQLi injection attacks (11%) and XSS attacks (9%).

For a comprehensive overview of online attacks and security in 2023, you can also explore the post titled “An August reading list about online security and 2023 attacks landscape”.

Wrap up

The network of networks, also known as the Internet, is both complex and already seen as a human basic right—enabling work, leisure, communication, knowledge acquisition, and the pursuit of opportunities.

In 2023, Cloudflare Radar introduced new capabilities that facilitate the exploration of a broader array of insights and trends showing the Internet's various facets. These include Internet quality, insights into trending domains, and pertinent routing changes. There’s also no lack of general Internet insights and reports that try to offer different perspectives on 2023 events and occurrences and their impact. And already in August 2023, we’ve launched the “date picker” functionality, allowing any user to go back in time by selecting arbitrary date ranges. It looks like this:

Cloudflare Radar’s 2023 overview of new tools and insights

Visit Cloudflare Radar for additional insights around (Internet disruptions, routing issues, Internet traffic trends, attacks, Internet quality, etc.). Follow us on social media at @CloudflareRadar (Twitter), cloudflare.social/@radar (Mastodon), and radar.cloudflare.com (Bluesky), or contact us via e-mail.

An August reading list about online security and 2023 attacks landscape

Post Syndicated from João Tomé original http://blog.cloudflare.com/an-august-reading-list-about-online-security-and-2023-attacks-landscape/

An August reading list about online security and 2023 attacks landscape

An August reading list about online security and 2023 attacks landscape

In 2023, cybersecurity continues to be in most cases a need-to-have for those who don’t want to take chances on getting caught in a cyberattack and its consequences. Attacks have gotten more sophisticated, while conflicts (online and offline, and at the same time) continue, including in Ukraine. Governments have heightened their cyber warnings and put together strategies, including around critical infrastructure (including health and education). All of this, at a time when there were never so many online risks, but also people online — over five billion in July 2023, 64.5% of the now eight billion that are the world’s total population.

Here we take a look at what we’ve been discussing in 2023, so far, in our Cloudflare blog related to attacks and online security in general, with several August reading list suggestions. From new trends, products, initiatives or partnerships, including AI service safety, to record-breaking blocked cyberattacks. On that note, our AI hub (ai.cloudflare.com) was just launched.

Throughout the year, Cloudflare has continued to onboard customers while they were being attacked, and we have provided protection to many others, including once.net, responsible for the 2023 Eurovision Song Contest online voting system — the European event reached 162 million people.

Our global network — a.k.a. Supercloud — gives us a unique vantage point. Cloudflare’s extensive scale also helps enhance security, with preventive services powered by machine learning, like our recent WAF attack scoring system to stop attacks before they become known or even malware.

Recently, we announced our presence in more than 300 cities across over 100 countries, with interconnections to over 12,000 networks and still growing. We provide services for around 20% of websites online and to millions of Internet properties.

Attacks increasing. A readiness and trust game

Let’s start with providing some context. There are all sorts of attacks, but they have been, generally speaking, increasing. In Q2 2023, Cloudflare blocked an average of 140 billion cyber threats per day. One year ago, when we wrote a similar blog post, it was 124 billion, a 13% increase year over year. Attackers are not holding back, with more sophisticated attacks rising, and sectors such as education or healthcare as the target.

Artificial intelligence (AI), like machine learning, is not new, but it has been trending in 2023, and certain capabilities are more generally available. This has raised concerns about the quality of deception and even AI hackers.

This year, governments have also continued to release reports and warnings. In 2022, the US Cybersecurity and Infrastructure Security Agency (CISA) created the Shields Up initiative in response to Russia's invasion of Ukraine. In March 2023, the Biden-Harris Administration released the National Cybersecurity Strategy aimed at securing the Internet.

The UK’s Cyber Strategy was launched at the end of 2022, and in March of this year, a strategy was released to specifically protect its National Health Service (NHS) from cyber attacks — in May it was time for the UK’s Ministry of Defence to do the same. In Germany, the new Digital Strategy is from 2022, but the Security Strategy arrived in June. A similar scenario is seen in Japan, Australia, and others.

That said, here are the reading suggestions related to more general country related attacks, but also policy and trust cybersecurity:

This blog post reports on Internet insights during the war in Europe, and discusses how Ukraine's Internet remained resilient in spite of dozens of attacks, and disruptions in three different stages of the conflict.

An August reading list about online security and 2023 attacks landscape
Application-layer cyber attacks in Ukraine rose 1,300% in early March 2022 compared to pre-war levels.

The White House’s National Cybersecurity Strategy asks the private sector to step up to fight cyber attacks. Cloudflare is ready (✍️)

The White House released in March 2023 the National Cybersecurity Strategy aimed at preserving and extending the open, free, global, interoperable, reliable, and securing the Internet. Cloudflare welcomed the Strategy, and the much-needed policy initiative, highlighting the need of defending critical infrastructure, where Zero Trust plays a big role. In the same month, Cloudflare announced its commitment to the 2023 Summit for Democracy. Also related to these initiatives, in March 2022, we launched our very own Critical Infrastructure Defense Project (CIDP), and in December 2022, Cloudflare launched Project Safekeeping, offering Zero Trust solutions to certain eligible entities in Australia, Japan, Germany, Portugal and the United Kingdom.

Secure by default: recommendations from the CISA’s newest guide, and how Cloudflare follows these principles to keep you secure (✍️)

In this April 2023 post we reviewed the “default secure” posture, and recommendations that were the focus of a recently published guide jointly authored by several international agencies. It had US, UK, Australia, Canada, Germany, Netherlands, and New Zealand contributions. Long story short, using all sorts of tools, machine learning and a secure-by-default and by-design approach, and a few principles, will make all the difference.

Nine years of Project Galileo and how the last year has changed it (✍️) + Project Galileo Report (✍️)

For the ninth anniversary of our Project Galileo in June 2023, the focus turned towards providing access to affordable cybersecurity tools and sharing our learnings from protecting the most vulnerable communities. There are also Project Galileo case studies and how it has made a difference, including to those in education and health, cultural, veterans’ services, Internet archives, and investigative journalism. A Cloudflare Radar Project Galileo report was also disclosed, with some highlights worth mentioning:

  • Between July 1, 2022, and May 5, 2023, Cloudflare mitigated 20 billion attacks against organizations protected under Project Galileo. This is an average of nearly 67.7 million cyber attacks per day over the last 10 months.
  • For LGBTQ+ organizations, we saw an average of 790,000 attacks mitigated per day over the last 10 months, with a majority of those classified as DDoS attacks.
  • Attacks targeting civil society organizations are generally increasing. We have broken down an attack aimed at a prominent organization, with the request volume climbing as high as 667,000 requests per second. Before and after this time the organization saw little to no traffic.
  • In Ukraine, spikes in traffic to organizations that provide emergency response and disaster relief coincide with bombings of the country over the 10-month period.

Project Cybersafe Schools: bringing security tools for free to small K-12 school districts in the US (✍️)

Already in August 2023, Cloudflare introduced an initiative aimed at small K-12 public school districts: Project Cybersafe Schools. Announced as part of the Back to School Safely: K-12 Cybersecurity Summit at the White House on August 7, Project Cybersafe Schools will support eligible K-12 public school districts with a package of Zero Trust cybersecurity solutions — for free, and with no time limit. In Q2 2023, Cloudflare blocked an average of 70 million cyber threats each day targeting the U.S. education sector, and a 47%  increase in DDoS attacks quarter-over-quarter.

Privacy concerns also go hand in hand with security online, and we’ve provided further details on this topic earlier this year in relation to our investment in security to protect data privacy. Cloudflare also achieved a new EU Cloud Code of Conduct privacy validation.

An August reading list about online security and 2023 attacks landscape
This is what a record-breaking DDoS attack (exceeding 71 million requests per second) looks like.

1. DDoS attacks & solutions

DDoS threat report for 2023 Q2 (✍️)

DDoS attacks (distributed denial-of-service) are not new, but they’re still one of the main tools used by attackers. In Q2 2023, Cloudflare witnessed an unprecedented escalation in DDoS attack sophistication, and our report delves into this phenomenon. Pro-Russian hacktivists REvil, Killnet and Anonymous Sudan joined forces to attack Western sites. Mitel vulnerability exploits surged by a whopping 532%, and attacks on crypto rocketed up by 600%. Also, more broadly, attacks exceeding three hours have increased by 103% quarter-over-quarter.

This blog post and the corresponding Cloudflare Radar report shed light on some of these trends. On the other hand, in our Q1 2023 DDoS threat report, a surge in hyper-volumetric attacks that leverage a new generation of botnets that are comprised of Virtual Private Servers (VPS) was observed.

Killnet and AnonymousSudan DDoS attack Australian university websites, and threaten more attacks — here’s what to do about it  (✍️)

In late March 2023, Cloudflare observed HTTP DDoS attacks targeting university websites in Australia. Universities were the first of several groups publicly targeted by the pro-Russian hacker group Killnet and their affiliate AnonymousSudan. This post not only shows a trend with these organized groups targeted attacks but also provides specific recommendations.

In January 2023, something similar was seen with increased cyberattacks to Holocaust educational websites protected by Cloudflare’s Project Galileo.

Uptick in healthcare organizations experiencing targeted DDoS attacks (✍️)

In early February 2023, Cloudflare, as well as other sources, observed an uptick in healthcare organizations targeted by a pro-Russian hacktivist group claiming to be Killnet. There was an increase in the number of these organizations seeking our help to defend against such attacks. Additionally, healthcare organizations that were already protected by Cloudflare experienced mitigated HTTP DDoS attacks.

Cloudflare mitigates record-breaking 71 million request-per-second DDoS attack (✍️)

Also in early February, Cloudflare detected and mitigated dozens of hyper-volumetric DDoS attacks, one of those that became a record-breaking one. The majority of attacks peaked in the ballpark of 50-70 million requests per second (rps) with the largest exceeding 71Mrps. This was the largest reported HTTP DDoS attack on record to date, more than 54% higher than the previous reported record of 46M rps in June 2022.

SLP: a new DDoS amplification vector in the wild (✍️)

This blog post from April 2023 highlights how researchers have published the discovery of a new DDoS reflection/amplification attack vector leveraging the SLP protocol (Service Location Protocol). The prevalence of SLP-based DDoS attacks is also expected to rise, but our automated DDoS protection system keeps Cloudflare customers safe.

Additionally, this year, also in April, a new and improved Network Analytics dashboard was introduced, providing security professionals insights into their DDoS attack and traffic landscape.

2. Application level attacks & WAF

The state of application security in 2023 (✍️)

For the second year in a row we published our Application Security Report. There’s a lot to unpack here, in a year when, according to Netcraft, Cloudflare became the most commonly used web server vendor within the top million sites (it has now a 22% market share). Here are some highlights:

  • 6% of daily HTTP requests (proxied by the Cloudflare network) are mitigated on average. It’s down two percentage points compared to last year.
  • DDoS mitigation accounts for more than 50% of all mitigated traffic, so it’s still the largest contributor to mitigated layer 7 (application layer) HTTP requests.
  • Compared to last year, however, mitigation by the Cloudflare WAF (Web Application Firewall) has grown significantly, and now accounts for nearly 41% of mitigated requests.
  • HTTP Anomaly (examples include malformed method names, null byte characters in headers, etc.) is the most frequent layer 7 attack vectors mitigated by the WAF.
  • 30% of HTTP traffic is automated (bot traffic). 55% of dynamic (non cacheable) traffic is API related. 65% of global API traffic is generated by browsers.
  • 16% of non-verified bot HTTP traffic is mitigated.
  • HTTP Anomaly surpasses SQLi (code injection technique used to attack data-driven applications) as the most common attack vector on API endpoints. Brute force account takeover attacks are increasing. Also, Microsoft Exchange is attacked more than WordPress.

How Cloudflare can help stop malware before it reaches your app (✍️)

In April 2023, we made the job of application security teams easier, by providing a content scanning engine integrated with our Web Application Firewall (WAF), so that malicious files being uploaded by end users, never reach origin servers in the first place. Since September 2022, our Cloudflare WAF became smarter in helping stop attacks before they are known.

Announcing WAF Attack Score Lite and Security Analytics for business customers  (✍️)

In March 2023, we announced that our machine learning empowered WAF and Security analytics view were made available to our Business plan customers, to help detect and stop attacks before they are known. In a nutshell: Early detection + Powerful mitigation = Safer Internet. Or:

early_detection = True
powerful_mitigation = True
safer_internet = early_detection and powerful_mitigation

An August reading list about online security and 2023 attacks landscape

3. Phishing (Area 1 and Zero Trust)

Phishing remains the primary way to breach organizations. According to CISA, 90% of cyber attacks begin with it. The FBI has been publishing Internet Crime Reports, and in the most recent, phishing continues to be ranked #1 in the top five Internet crime types. Reported phishing crimes and victim losses increased by 1038% since 2018, reaching 300,497 incidents in 2022. The FBI also referred to Business Email Compromise as the $43 billion problem facing organizations, with complaints increasing by 127% in 2022, resulting in $3.31 billion in related losses, compared to 2021.

In 2022, Cloudflare Area 1 kept 2.3 billion unwanted messages out of customer inboxes. This year, that number will be easily surpassed.

Introducing Cloudflare's 2023 phishing threats report (✍️)

In August 2023, Cloudflare published its first phishing threats report — fully available here. The report explores key phishing trends and related recommendations, based on email security data from May 2022 to May 2023.

Some takeaways include how attackers using deceptive links was the #1 phishing tactic — and how they are evolving how they get you to click and when they weaponize the link. Also, identity deception takes multiple forms (including business email compromise (BEC) and brand impersonation), and can easily bypass email authentication standards.

Cloudflare Area 1 earns SOC 2 report (✍️)

More than one year ago, Cloudflare acquired Area 1 Security, and with that we added to our Cloudflare Zero Trust platform an essential cloud-native email security service that identifies and blocks attacks before they hit user inboxes. This year, we’ve obtained one of the best ways to provide customers assurance that the sensitive information they send to us can be kept safe: a SOC 2 Type II report.

Back in January, during our CIO Week, Email Link Isolation was made generally available to all our customers. What is it? A safety net for the suspicious links that end up in inboxes and that users may click — anyone can click on the wrong link by mistake. This added protection turns Cloudflare Area 1 into the most comprehensive email security solution when it comes to protecting against malware, phishing attacks, etc. Also, in true Cloudflare fashion, it’s a one-click deployment.

Additionally, from the same week, Cloudflare combined capabilities from Area 1 Email Security and Data Loss Prevention (DLP) to provide complete data protection for corporate email, and also partnered with KnowBe4 to equip organizations with real-time security coaching to avoid phishing attacks.

How to stay safe from phishing (✍️)

Phishing attacks come in all sorts of ways to fool people. This high level “phish” guide, goes over the different types — while email is definitely the most common, there are others —, and provides some tips to help you catch these scams before you fall for them.

Top 50 most impersonated brands in phishing attacks and new tools you can use to protect your employees from them (✍️)

Here we go over arguably one of the hardest challenges any security team is constantly facing, detecting, blocking, and mitigating the risks of phishing attacks. During our Security Week in March, a Top 50 list of the most impersonated brands in phishing attacks was presented (spoiler alert: AT&T Inc., PayPal, and Microsoft are on the podium).

Additionally, it was also announced the expansion of the phishing protections available to Cloudflare One customers by automatically identifying — and blocking — so-called “confusable” domains. What is Cloudflare One? It’s our suite of products that provides a customizable, and integrated with what a company already uses, Zero Trust network-as-a-service platform. It’s built for that already mentioned ease of mind and fearless online use. Cloudflare One, along with the use of physical security keys, was what thwarted the sophisticated “Oktapus” phishing attack targeting Cloudflare employees last summer.

On the Zero Trust front, you can also find our recent PDF guide titled “Cloudflare Zero Trust: A roadmap for highrisk organizations”.

An August reading list about online security and 2023 attacks landscape

4. AI/Malware/Ransomware & other risks

We have shown in previous years the role of our Cloudflare Security Center to investigate threats, and the relevance of different types of risks, such as these two 2022 and 2021 examples: “Anatomy of a Targeted Ransomware Attack” and “Ransom DDoS attacks target a Fortune Global 500 company”. However, there are new risks in the 2023 horizon.

How to secure Generative AI applications (✍️)

Groundbreaking technology brings groundbreaking challenges. Cloudflare has experience protecting some of the largest AI applications in the world, and in this blog post there are some tips and best practices for securing generative AI applications. Success in consumer-facing applications inherently expose the underlying AI systems to millions of users, vastly increasing the potential attack surface.

Using the power of Cloudflare’s global network to detect malicious domains using machine learning  (✍️)

Taking into account the objective of preventing threats before they create havoc, here we go over that Cloudflare recently developed proprietary models leveraging machine learning and other advanced analytical techniques. These are able to detect security threats that take advantage of the domain name system (DNS), known as the phonebook of the Internet.

How sophisticated scammers and phishers are preying on customers of Silicon Valley Bank (✍️)

In order to breach trust and trick unsuspecting victims, threat actors overwhelmingly use topical events as lures. The news about what happened at Silicon Valley Bank earlier this year was one of the latest events to watch out for and stay vigilant against opportunistic phishing campaigns using SVB as the lure. At that time, Cloudforce One (Cloudflare’s threat operations and research team) significantly increased our brand monitoring focused on SVB’s digital presence.

How Cloudflare can help stop malware before it reaches your app (✍️)

In April 2023, Cloudflare launched a tool to make the job of application security teams easier, by providing a content scanning engine integrated with our Web Application Firewall (WAF), so that malicious files being uploaded by end users, never reach origin servers in the first place.

Analyze any URL safely using the Cloudflare Radar URL Scanner  (✍️)

Cloudflare Radar is our free platform for Internet insights. In March, our URL Scanner was launched, allowing anyone to analyze a URL safely. The report that it creates contains a myriad of technical details, including a phishing scan. Many users have been using it for security reasons, but others are just exploring what’s under-the-hood look at any webpage.

Unmasking the top exploited vulnerabilities of 2022 (✍️)

Last, but not least, already from August 2023, this blog post focuses on the most commonly exploited vulnerabilities, according to the Cybersecurity and Infrastructure Security Agency (CISA). Given Cloudflare’s role as a reverse proxy to a large portion of the Internet, we delve into how the Common Vulnerabilities and Exposures (CVEs) mentioned by CISA are being exploited on the Internet, and a bit of what has been learned.

If you want to learn about making a website more secure (and faster) while loading third-party tools like Google Analytics 4, Facebook CAPI, TikTok, and others, you can get to know our Cloudflare Zaraz solution. It reached general availability in July 2023.

Wrap up

“The Internet was not built for what it has become”.

This is how one of Cloudflare’s S-1 document sections begins. It is also commonly referenced in our blog to show how this remarkable experiment, the network of networks, wasn’t designed for the role it now plays in our daily lives and work. Security, performance and privacy are crucial in a time when anyone can be the target of an attack, threat, or vulnerability. While AI can aid in mitigating attacks, it also adds complexity to attackers' tactics.

With that in mind, as we've highlighted in this 2023 reading list suggestions/online attacks guide, prioritizing the prevention of detrimental attack outcomes remains the optimal strategy. Hopefully, it will make some of the attacks on your company go unnoticed or be consequences-free, or even transform them into interesting stories to share when you access your security dashboard.

If you're interested in exploring specific examples, you can delve into case studies within our hub, where you’ll find security related stories from different institutions. From a technology company like Sage, to the State of Arizona, or the Republic of Estonia Information Security Authority, and even Cybernews, a cybersecurity news media outlet.

And because the future of a private and secure Internet is also in our minds, it's worth mentioning that in March 2022, Cloudflare enabled post-quantum cryptography support for all our customers. The topic of post-quantum cryptography, designed to be secure against the threat of quantum computers, is quite interesting and worth some delving into, but even without knowing what it is, it’s good to know that protection is already here.

If you want to try some security features mentioned, the Cloudflare Security Center is a good place to start (free plans included). The same applies to our Zero Trust ecosystem (or Cloudflare One as our SASE, Secure Access Service Edge) that is available as self-serve, and also includes a free plan. This vendor-agnostic roadmap shows the general advantages of the Zero Trust architecture, and as we’ve seen, there’s also one focused on high risk organizations.

Be cautious. Be prepared. Be safe.