Post Syndicated from Omer Yoachimik original https://blog.cloudflare.com/ddos-attack-trends-for-2022-q2/

Welcome to our 2022 Q2 DDoS report. This report includes insights and trends about the DDoS threat landscape — as observed across the global Cloudflare network. An interactive version of this report is also available on Radar.
In Q2, we’ve seen some of the largest attacks the world has ever seen including a 26 million request per second HTTPS DDoS attacks that Cloudflare automatically detected and mitigated. Furthermore, attacks against Ukraine and Russia continue, whilst a new Ransom DDoS attack campaign emerged.
The Highlights
Ukrainian and Russian Internet
- The war on the ground is accompanied by attacks targeting the spread of information.
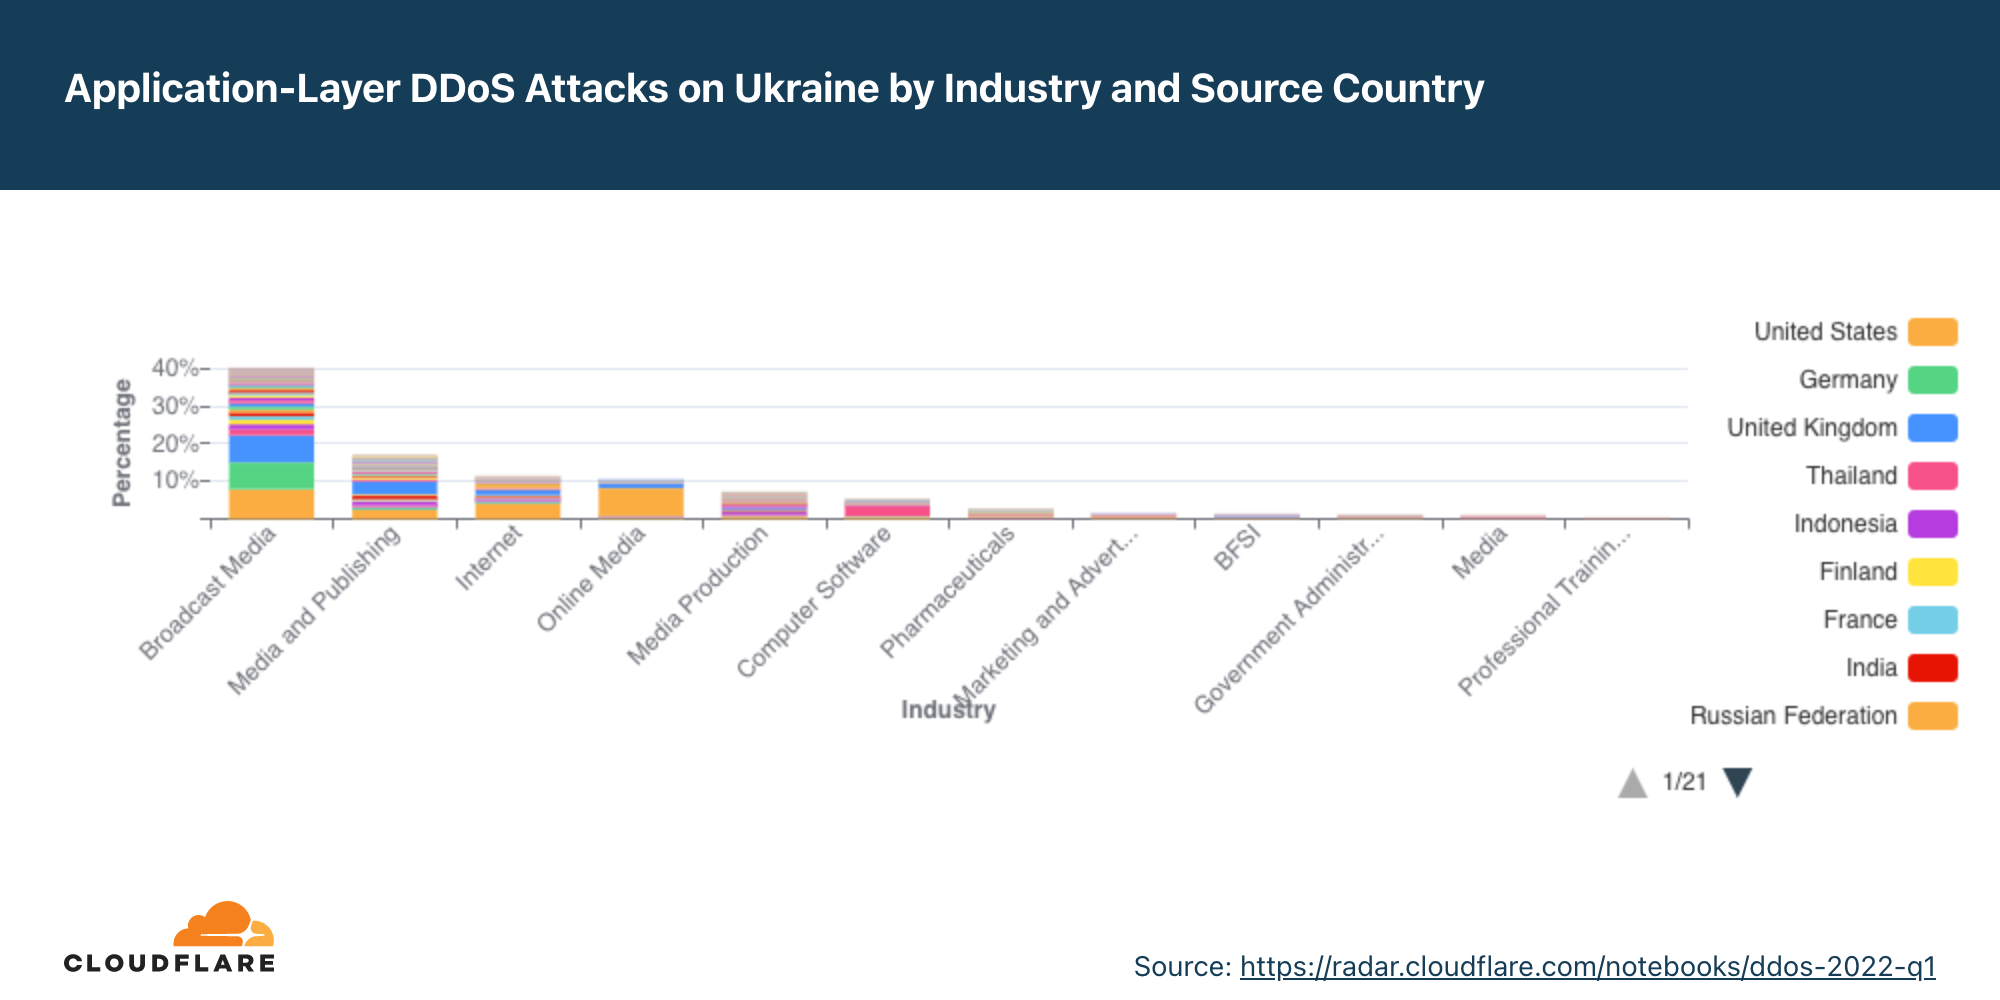
- Broadcast Media companies in the Ukraine were the most targeted in Q2 by DDoS attacks. In fact, all the top five most attacked industries are all in online/Internet media, publishing, and broadcasting.
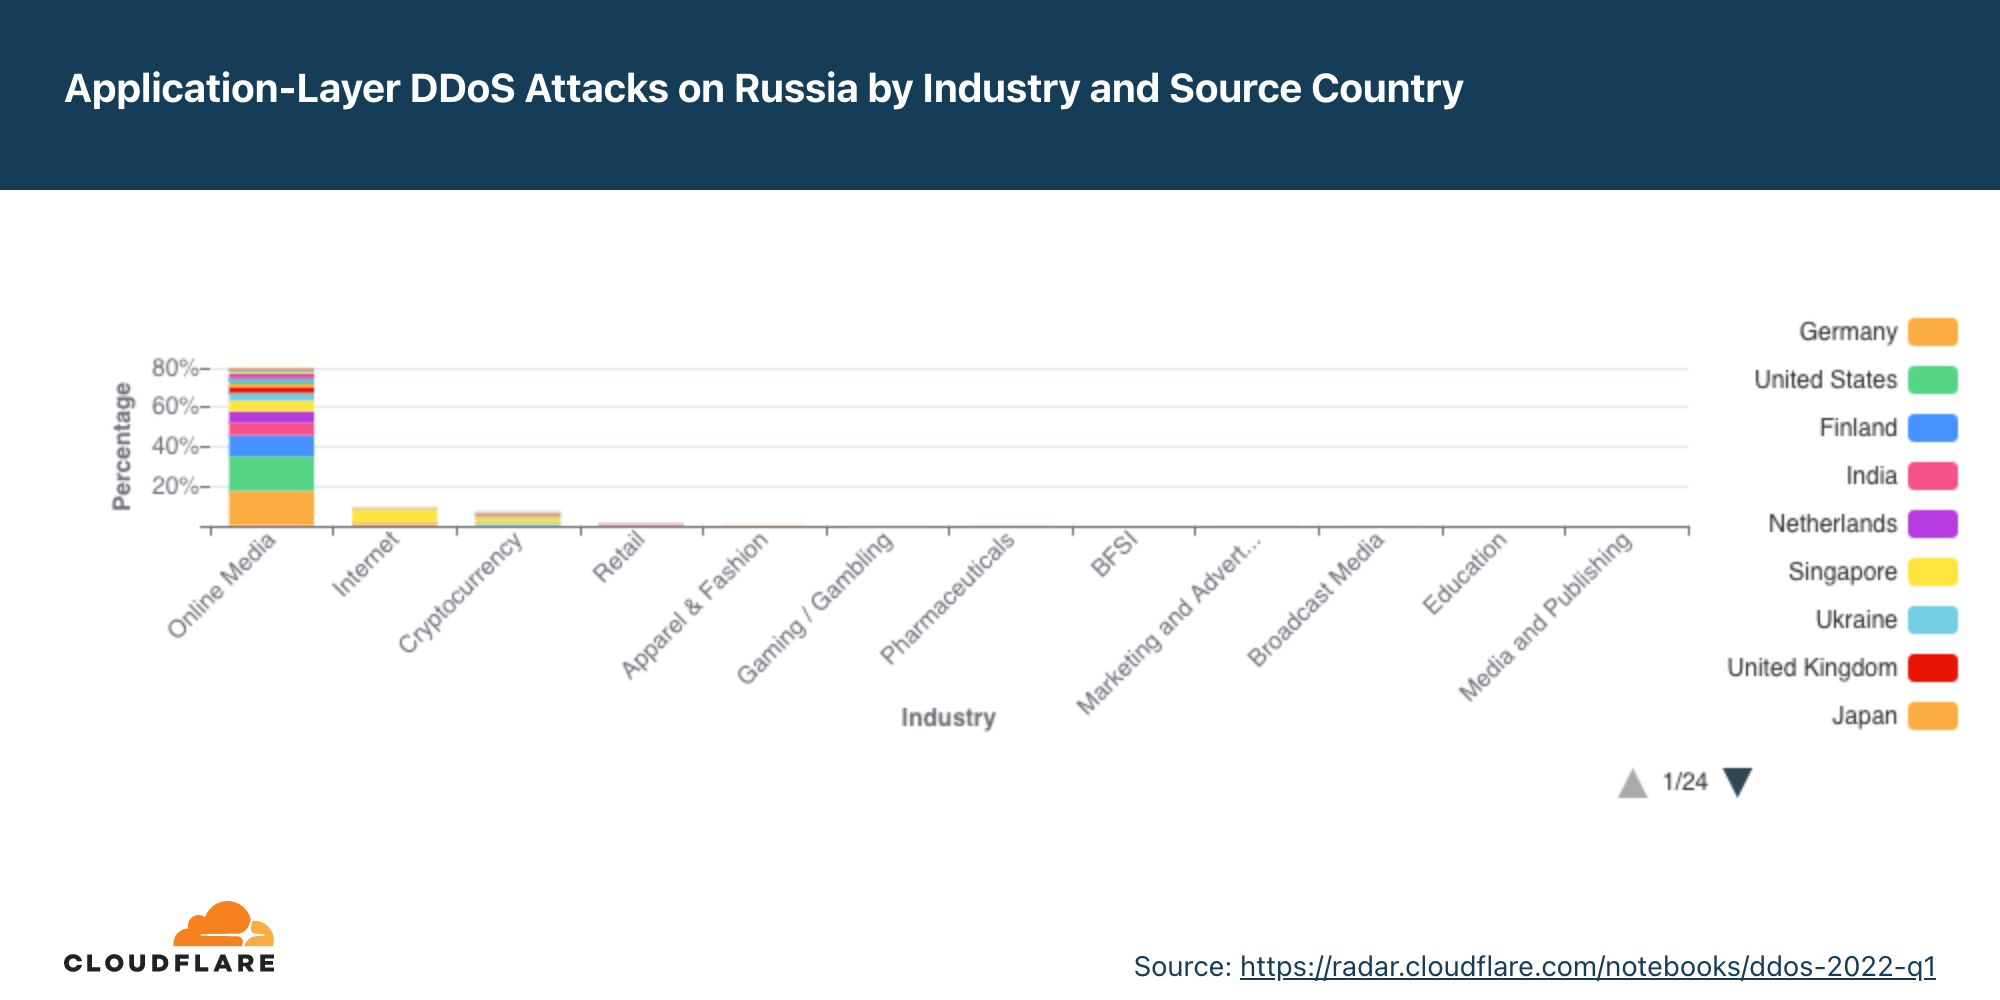
- In Russia on the other hand, Online Media drops as the most attacked industry to the third place. Making their way to the top, Banking, Financial Services and Insurance (BFSI) companies in Russia were the most targeted in Q2; almost 45% of all application-layer DDoS attacks targeted the BFSI sector. Cryptocurrency companies in Russia were the second most attacked.
Read more about what Cloudflare is doing to keep the Open Internet flowing into Russia and keep attacks from getting out.
Ransom DDoS attacks
- We’ve seen a new wave of Ransom DDoS attacks by entities claiming to be the Fancy Lazarus.
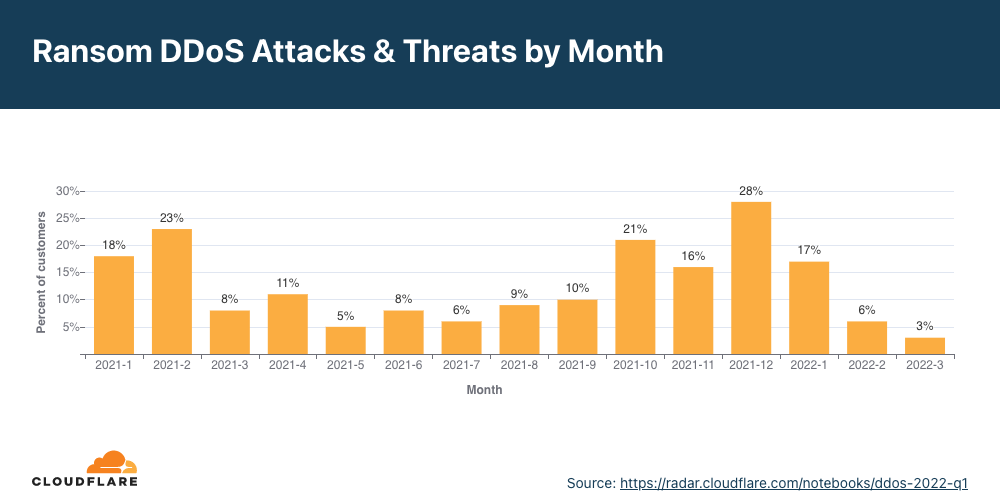
- In June 2022, ransom attacks peaked to the highest of the year so far: one out of every five survey respondents who experienced a DDoS attack reported being subject to a Ransom DDoS attack or other threats.
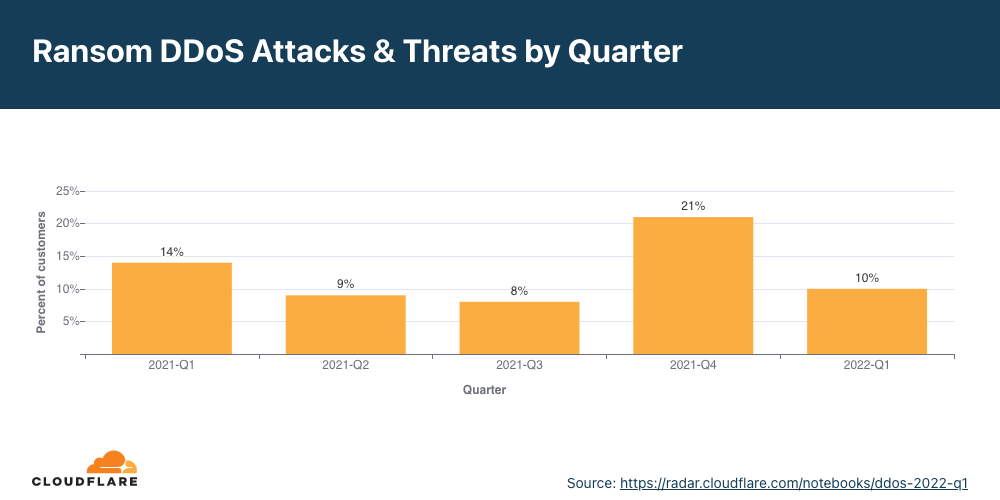
- Overall in Q2, the percent of Ransom DDoS attacks increased by 11% QoQ.
Application-layer DDoS attacks
- In 2022 Q2, application-layer DDoS attacks increased by 72% YoY.
- Organizations in the US were the most targeted, followed by Cyprus, Hong Kong, and China. Attacks on organizations in Cyprus increased by 166% QoQ.
- The Aviation & Aerospace industry was the most targeted in Q2, followed by the Internet industry, Banking, Financial Services and Insurance, and Gaming / Gambling in fourth place.
Network-layer DDoS attacks
- In 2022 Q2, network-layer DDoS attacks increased by 109% YoY. Attacks of 100 Gbps and larger increased by 8% QoQ, and attacks lasting more than 3 hours increased by 12% QoQ.
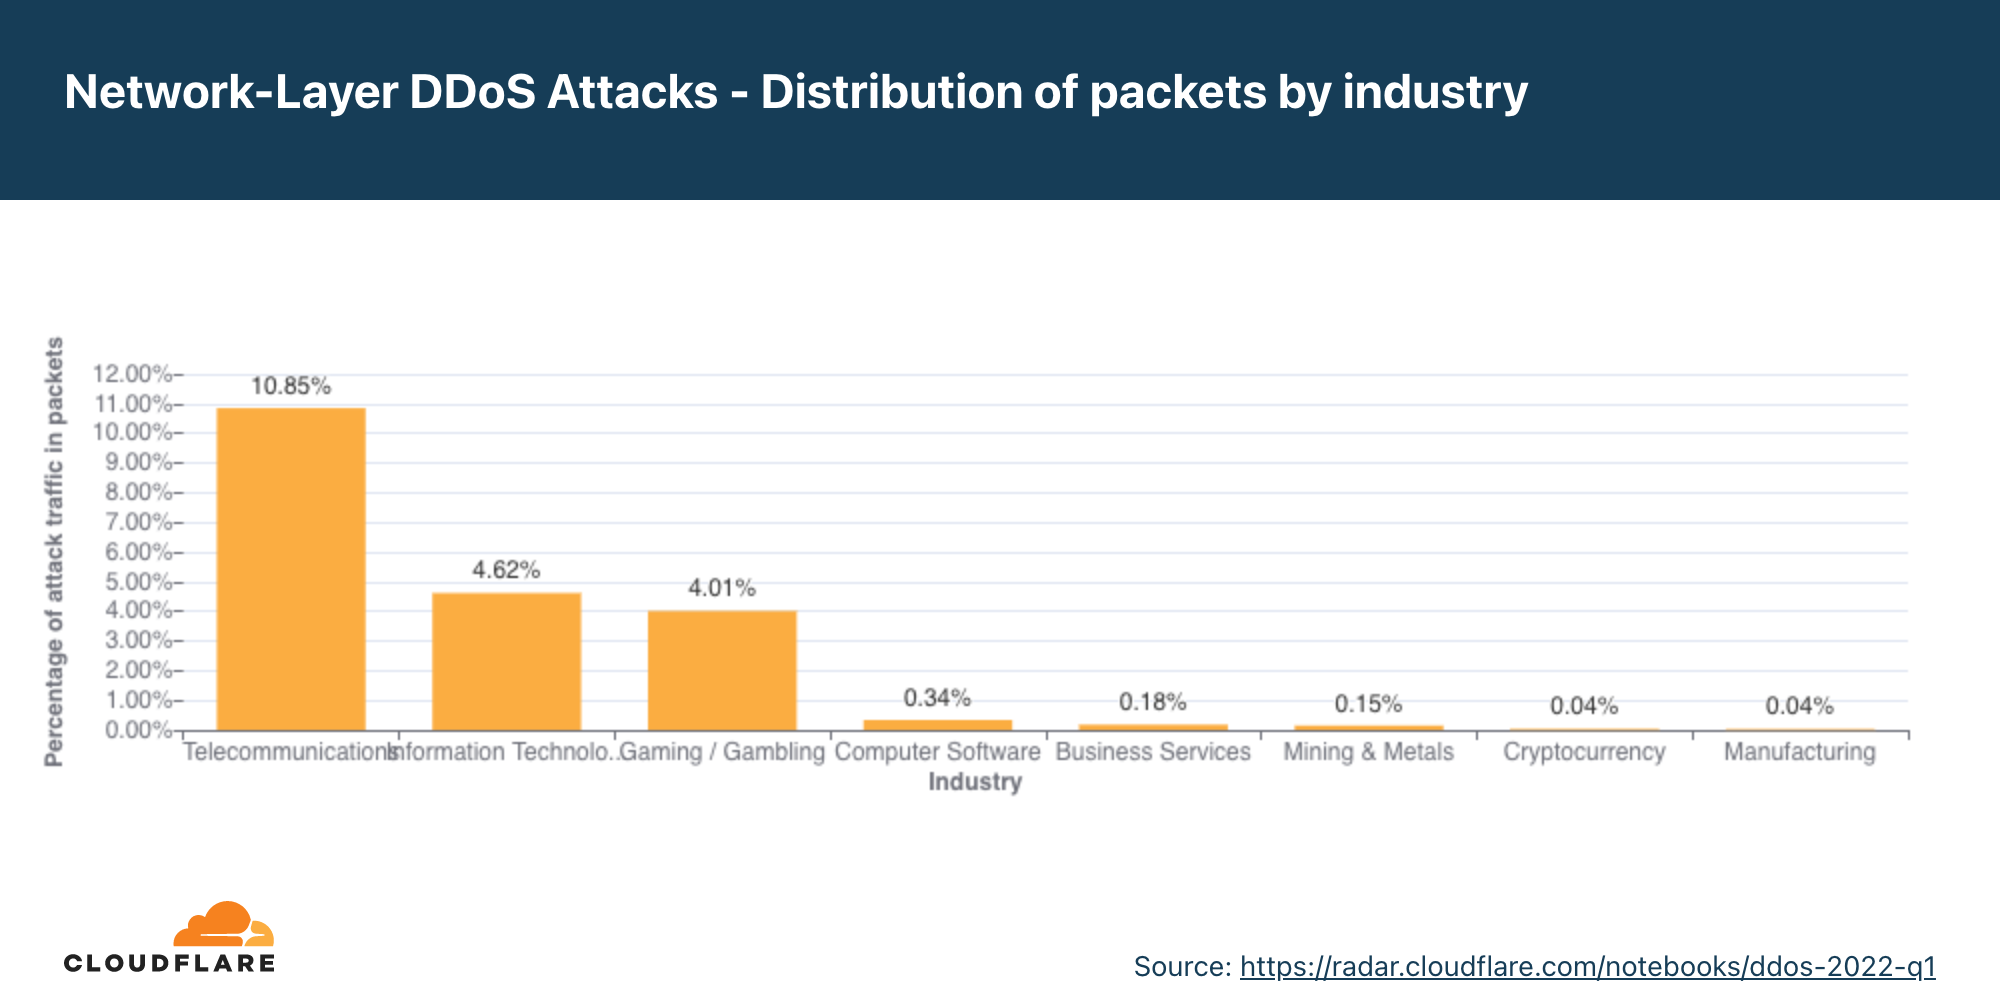
- The top attacked industries were Telecommunications, Gaming / Gambling and the Information Technology and Services industry.
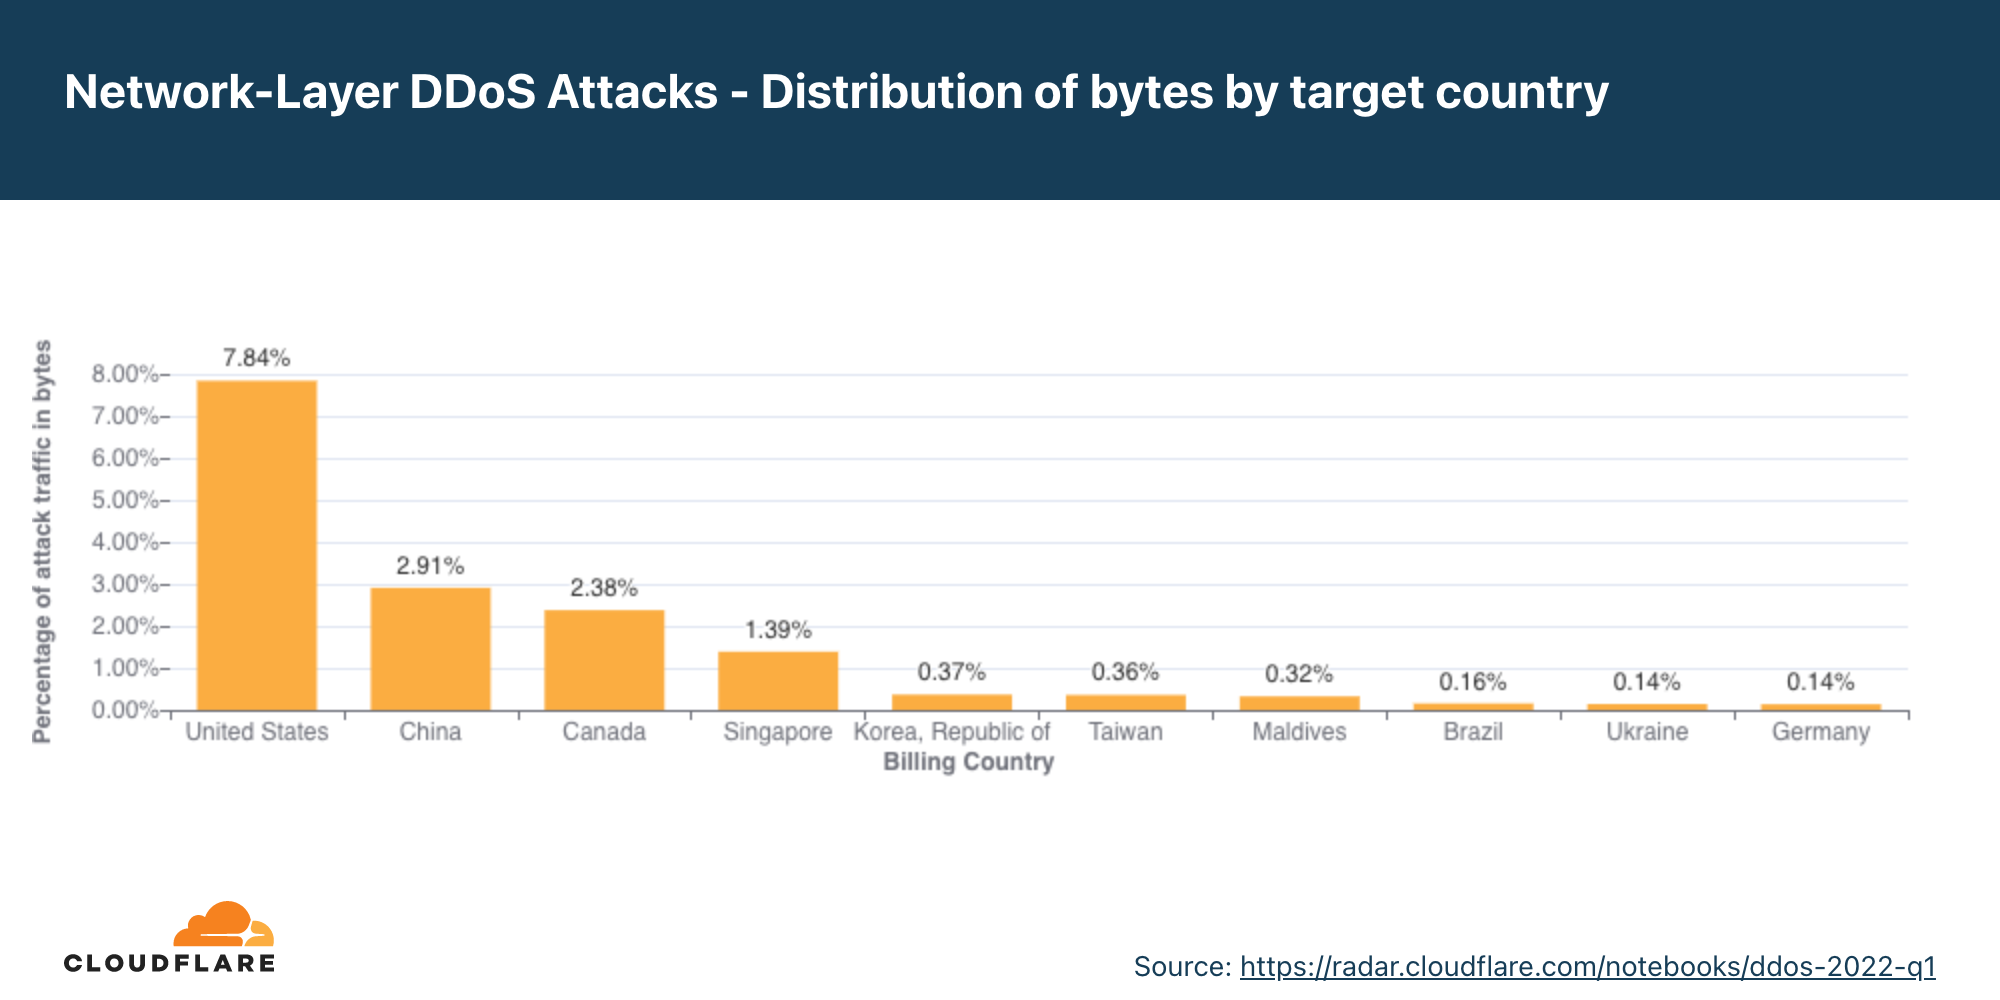
- Organizations in the US were the most targeted, followed by China, Singapore, and Germany.
This report is based on DDoS attacks that were automatically detected and mitigated by Cloudflare’s DDoS Protection systems. To learn more about how it works, check out this deep-dive blog post.
A note on how we measure DDoS attacks observed over our network
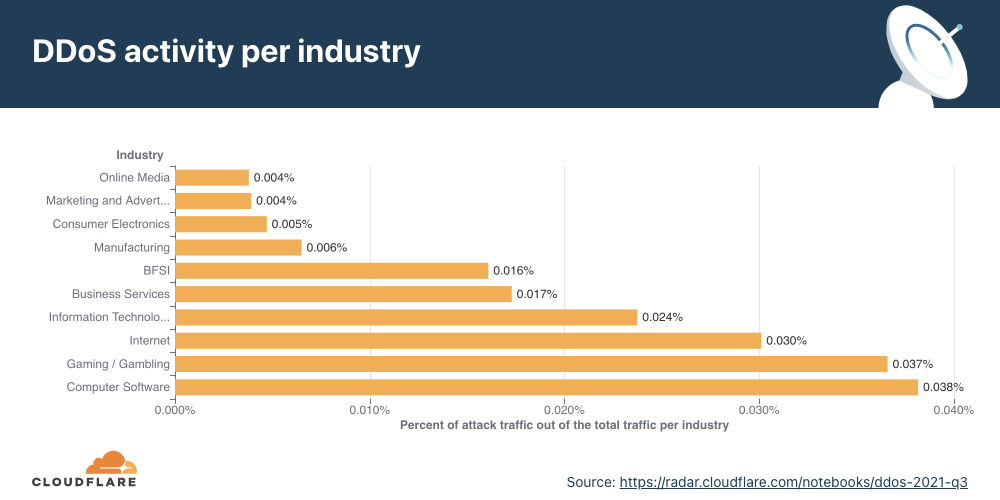
To analyze attack trends, we calculate the “DDoS activity” rate, which is either the percentage of attack traffic out of the total traffic (attack + clean) observed over our global network, or in a specific location, or in a specific category (e.g., industry or billing country). Measuring the percentages allows us to normalize data points and avoid biases reflected in absolute numbers towards, for example, a Cloudflare data center that receives more total traffic and likely, also more attacks.
Ransom Attacks
Our systems constantly analyze traffic and automatically apply mitigation when DDoS attacks are detected. Each DDoS’d customer is prompted with an automated survey to help us better understand the nature of the attack and the success of the mitigation.
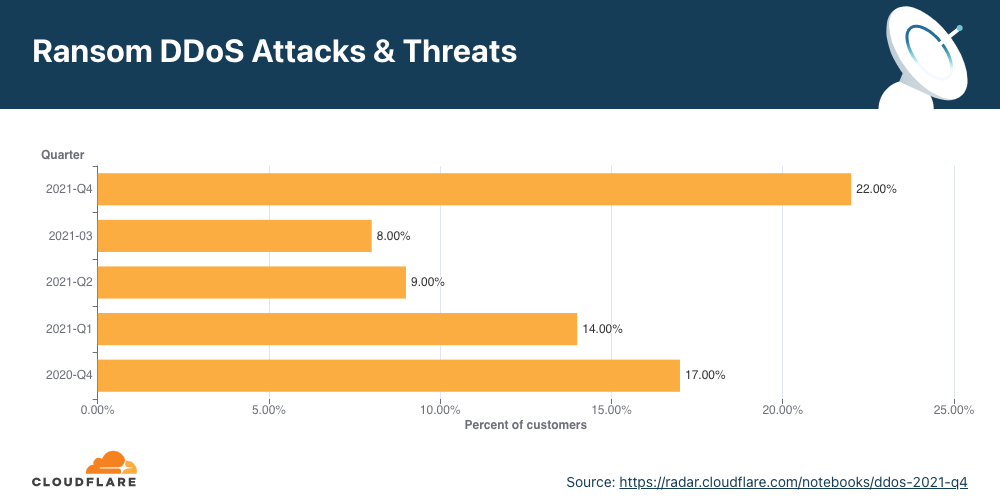
For over two years now, Cloudflare has been surveying attacked customers — one question on the survey being if they received a threat or a ransom note demanding payment in exchange to stop the DDoS attack.
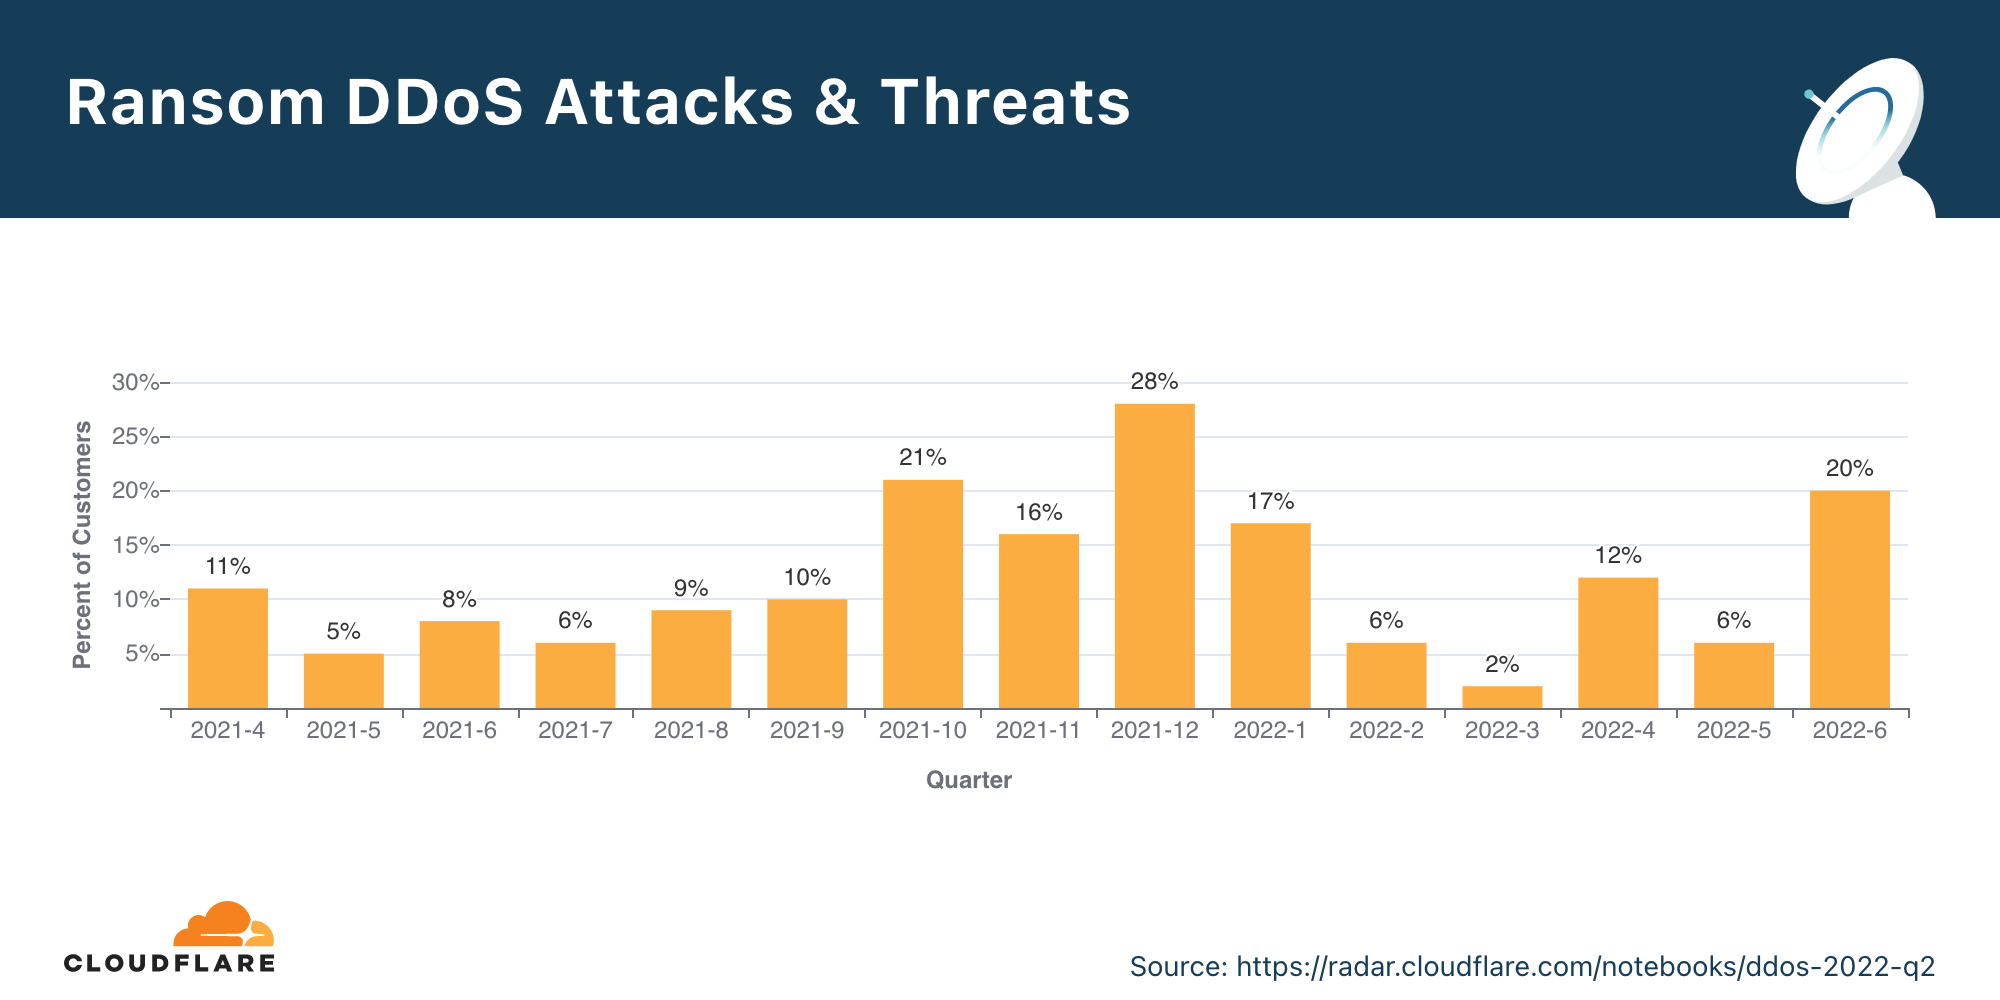
The number of respondents reporting threats or ransom notes in Q2 increased by 11% QoQ and YoY. During this quarter, we’ve been mitigating Ransom DDoS attacks that have been launched by entities claiming to be the Advanced Persistent Threat (APT) group “Fancy Lazarus”. The campaign has been focusing on financial institutions and cryptocurrency companies.

Drilling down into Q2, we can see that in June one out of every five respondents reported receiving a ransom DDoS attack or threat — the highest month in 2022, and the highest since December 2021.
Application-layer DDoS attacks
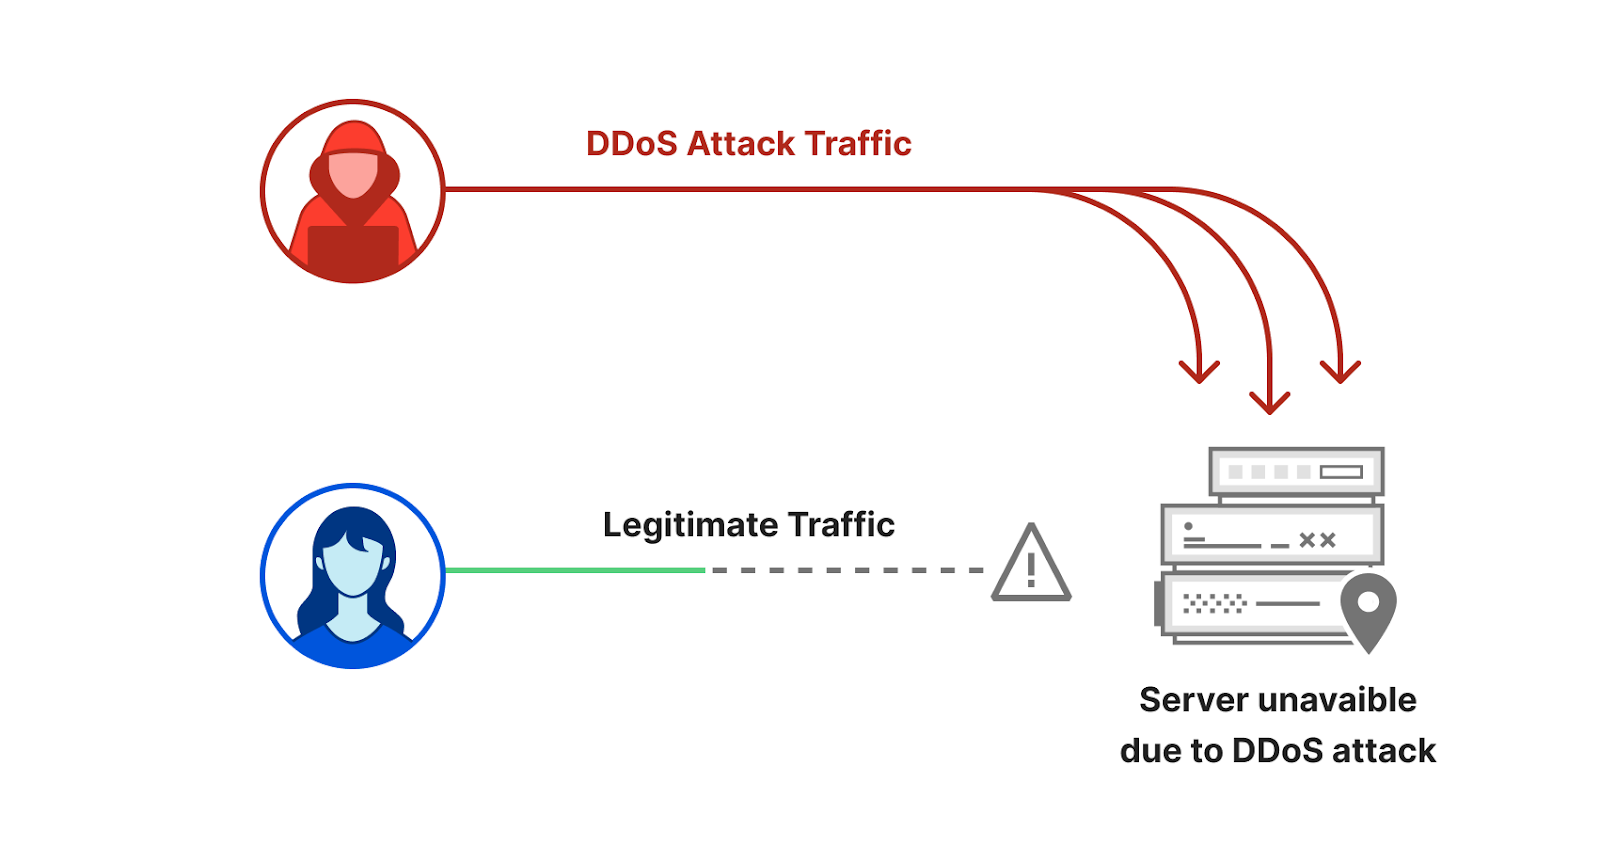
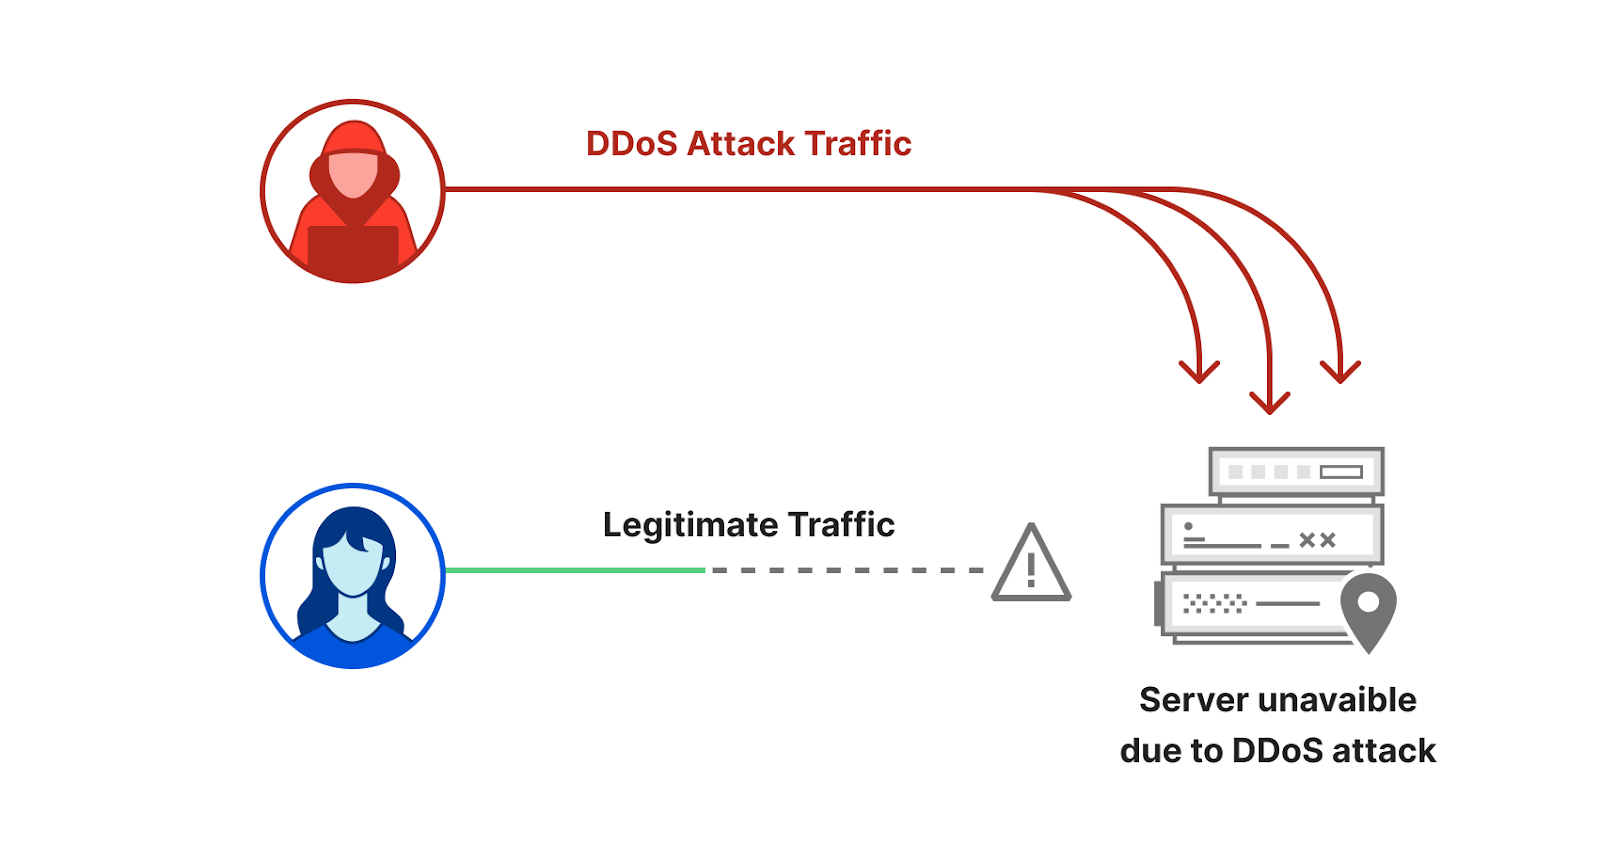
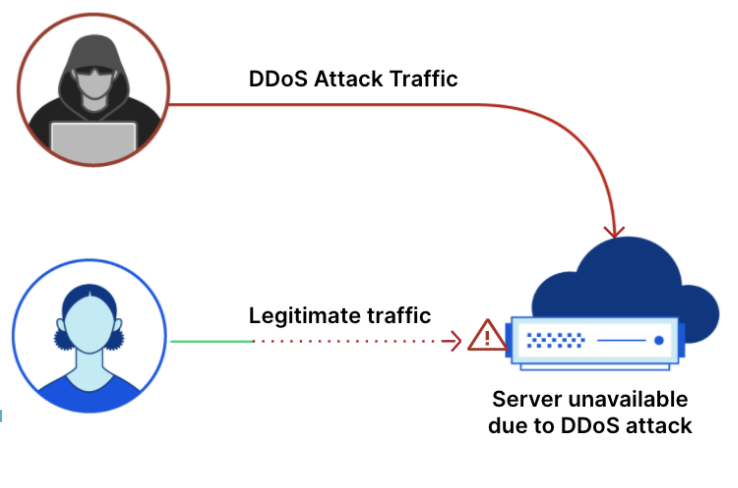
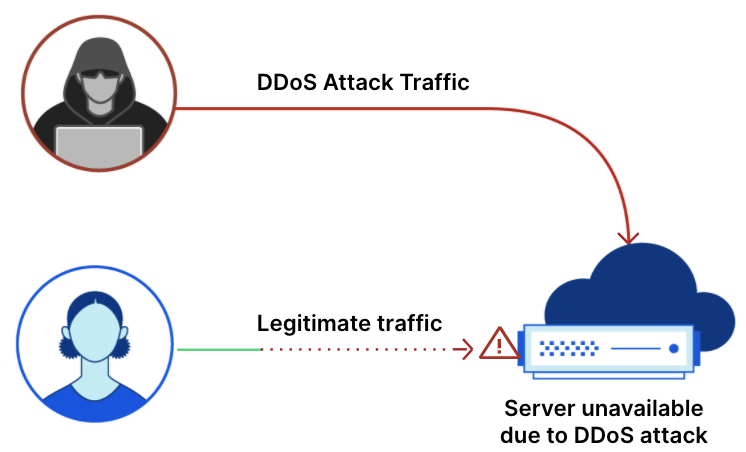
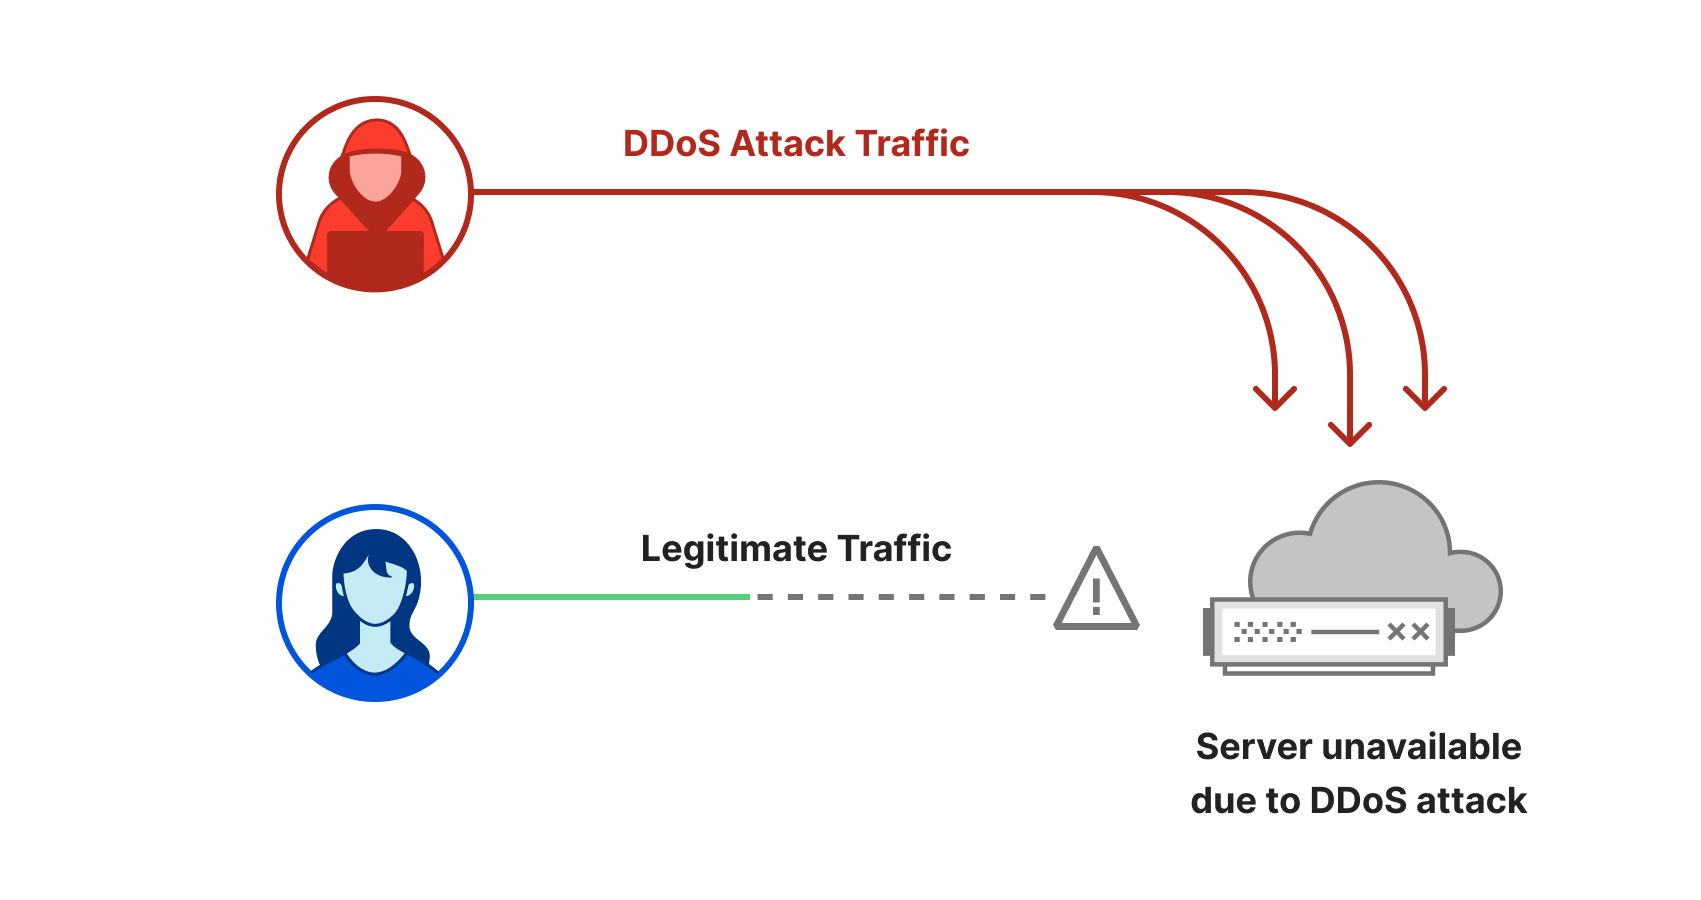
Application-layer DDoS attacks, specifically HTTP DDoS attacks, are attacks that usually aim to disrupt a web server by making it unable to process legitimate user requests. If a server is bombarded with more requests than it can process, the server will drop legitimate requests and — in some cases — crash, resulting in degraded performance or an outage for legitimate users.

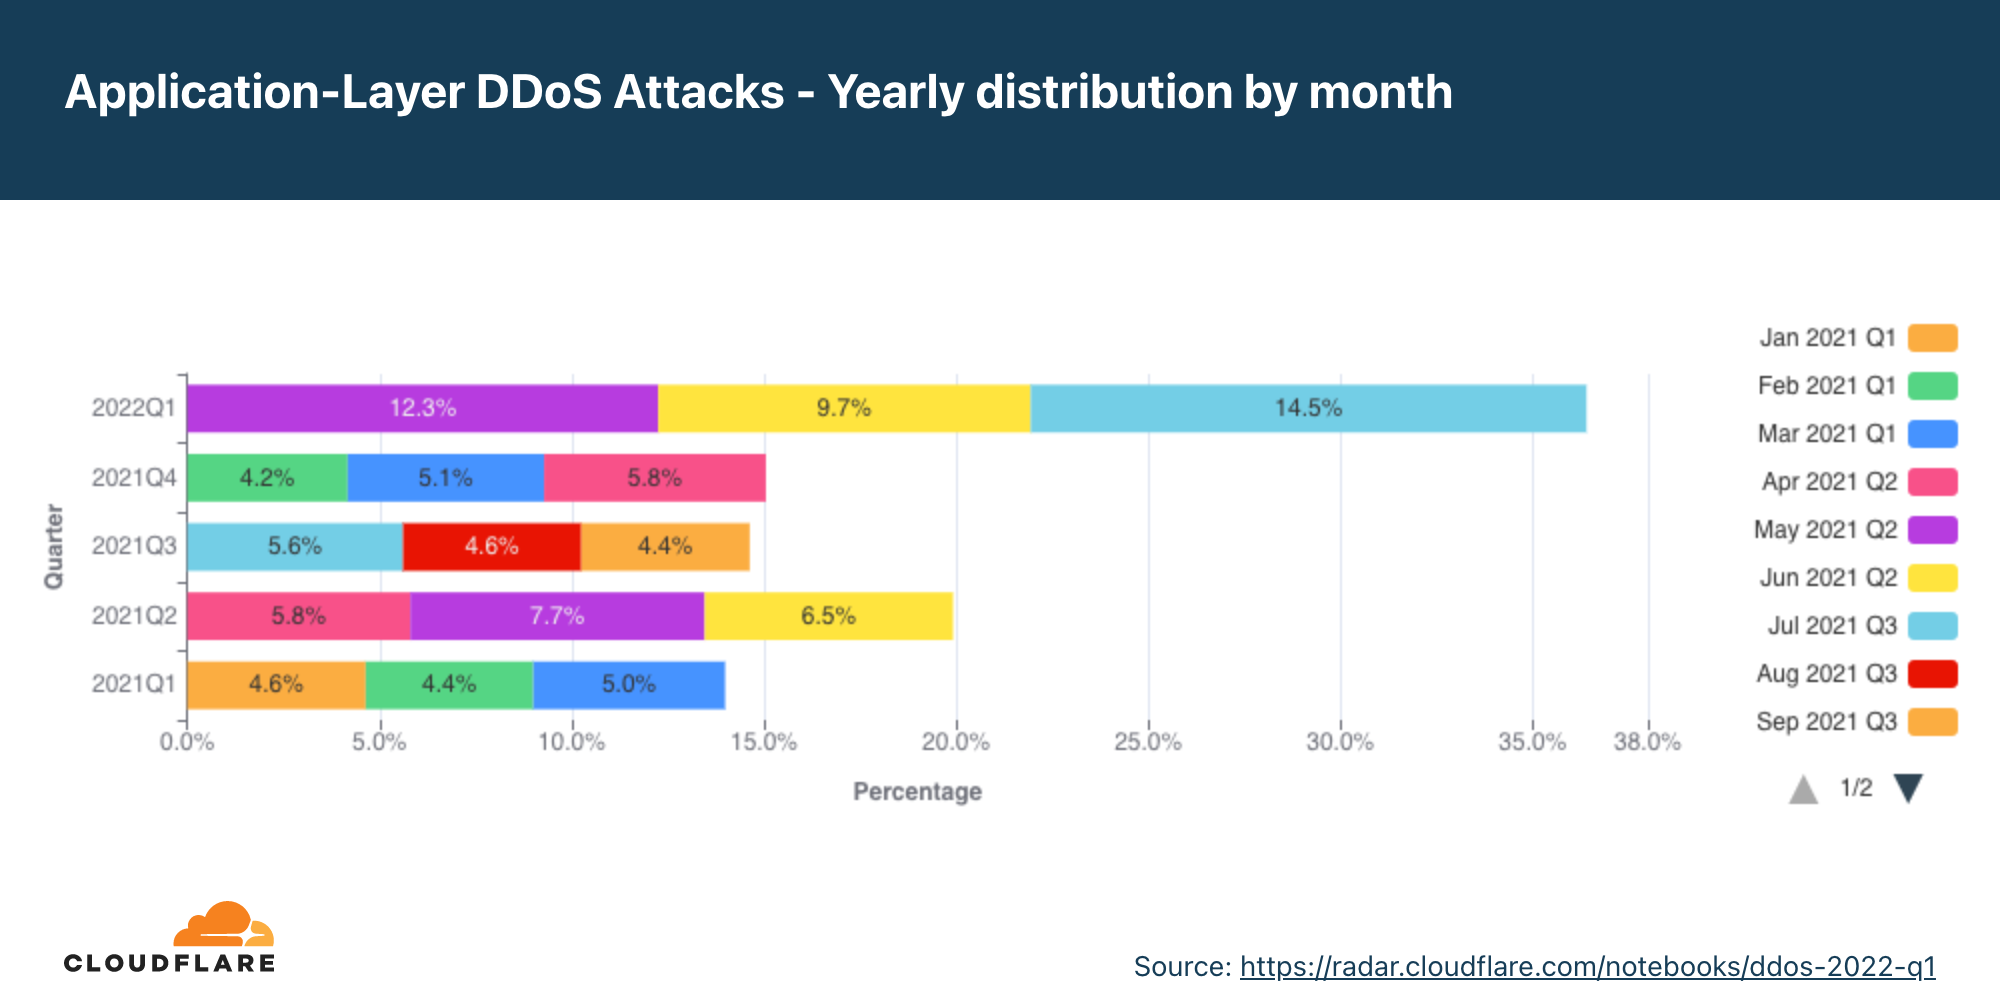
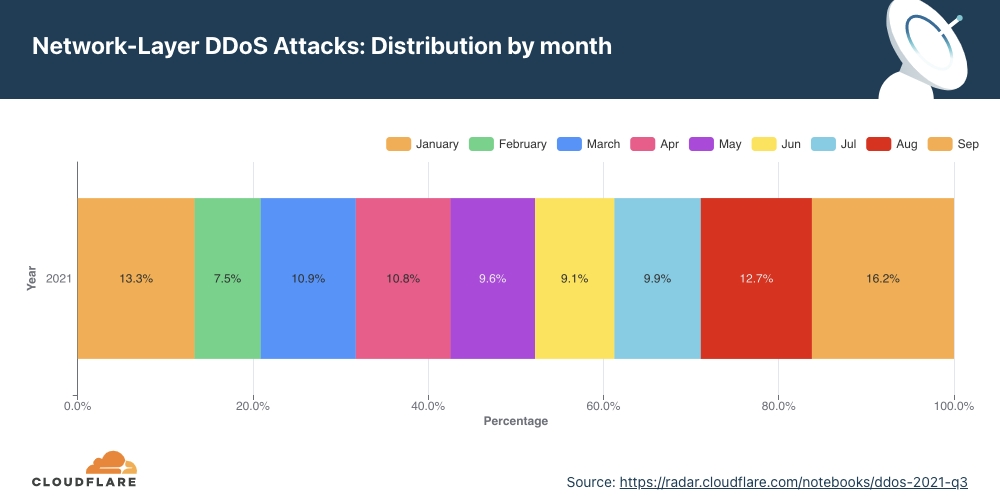
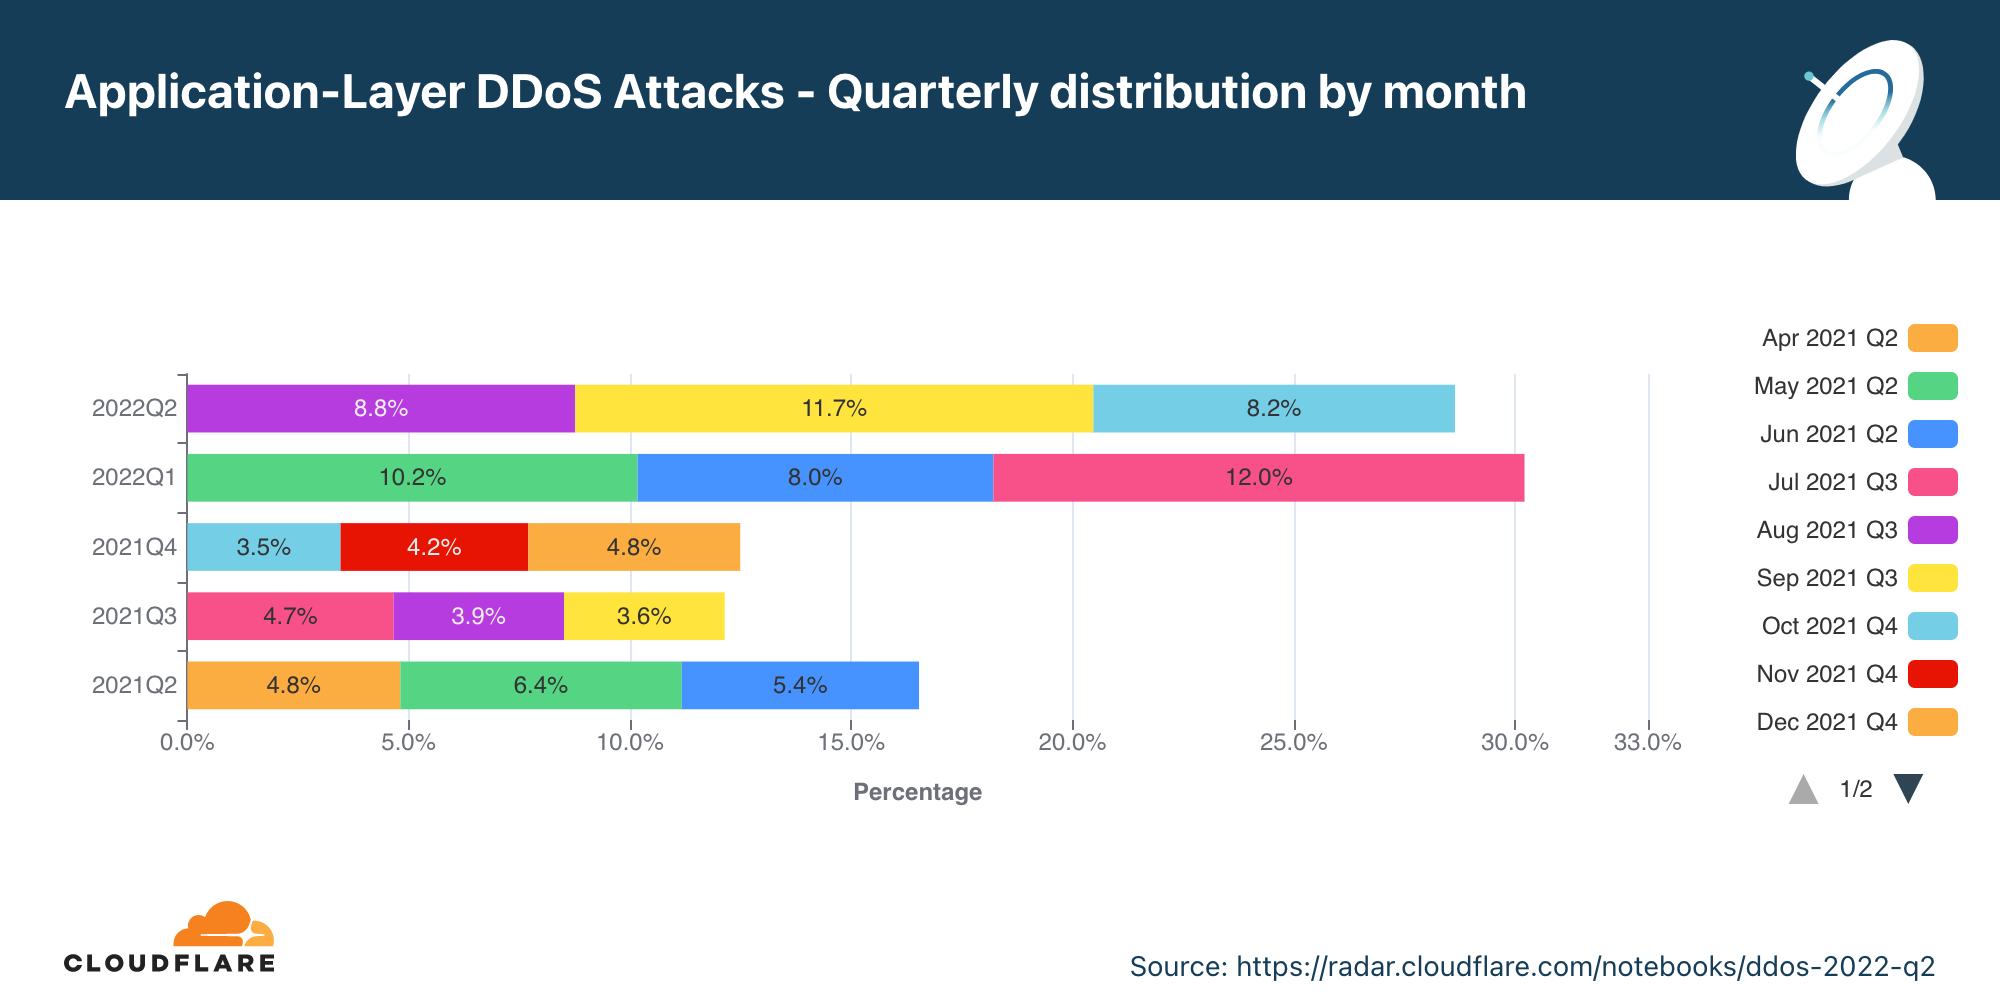
Application-layer DDoS attacks by month
In Q2, application-layer DDoS attacks increased by 72% YoY.
Overall, in Q2, the volume of application-layer DDoS attacks increased by 72% YoY, but decreased 5% QoQ. May was the busiest month in the quarter. Almost 41% of all application-layer DDoS attacks took place in May, whereas the least number of attacks took place in June (28%).
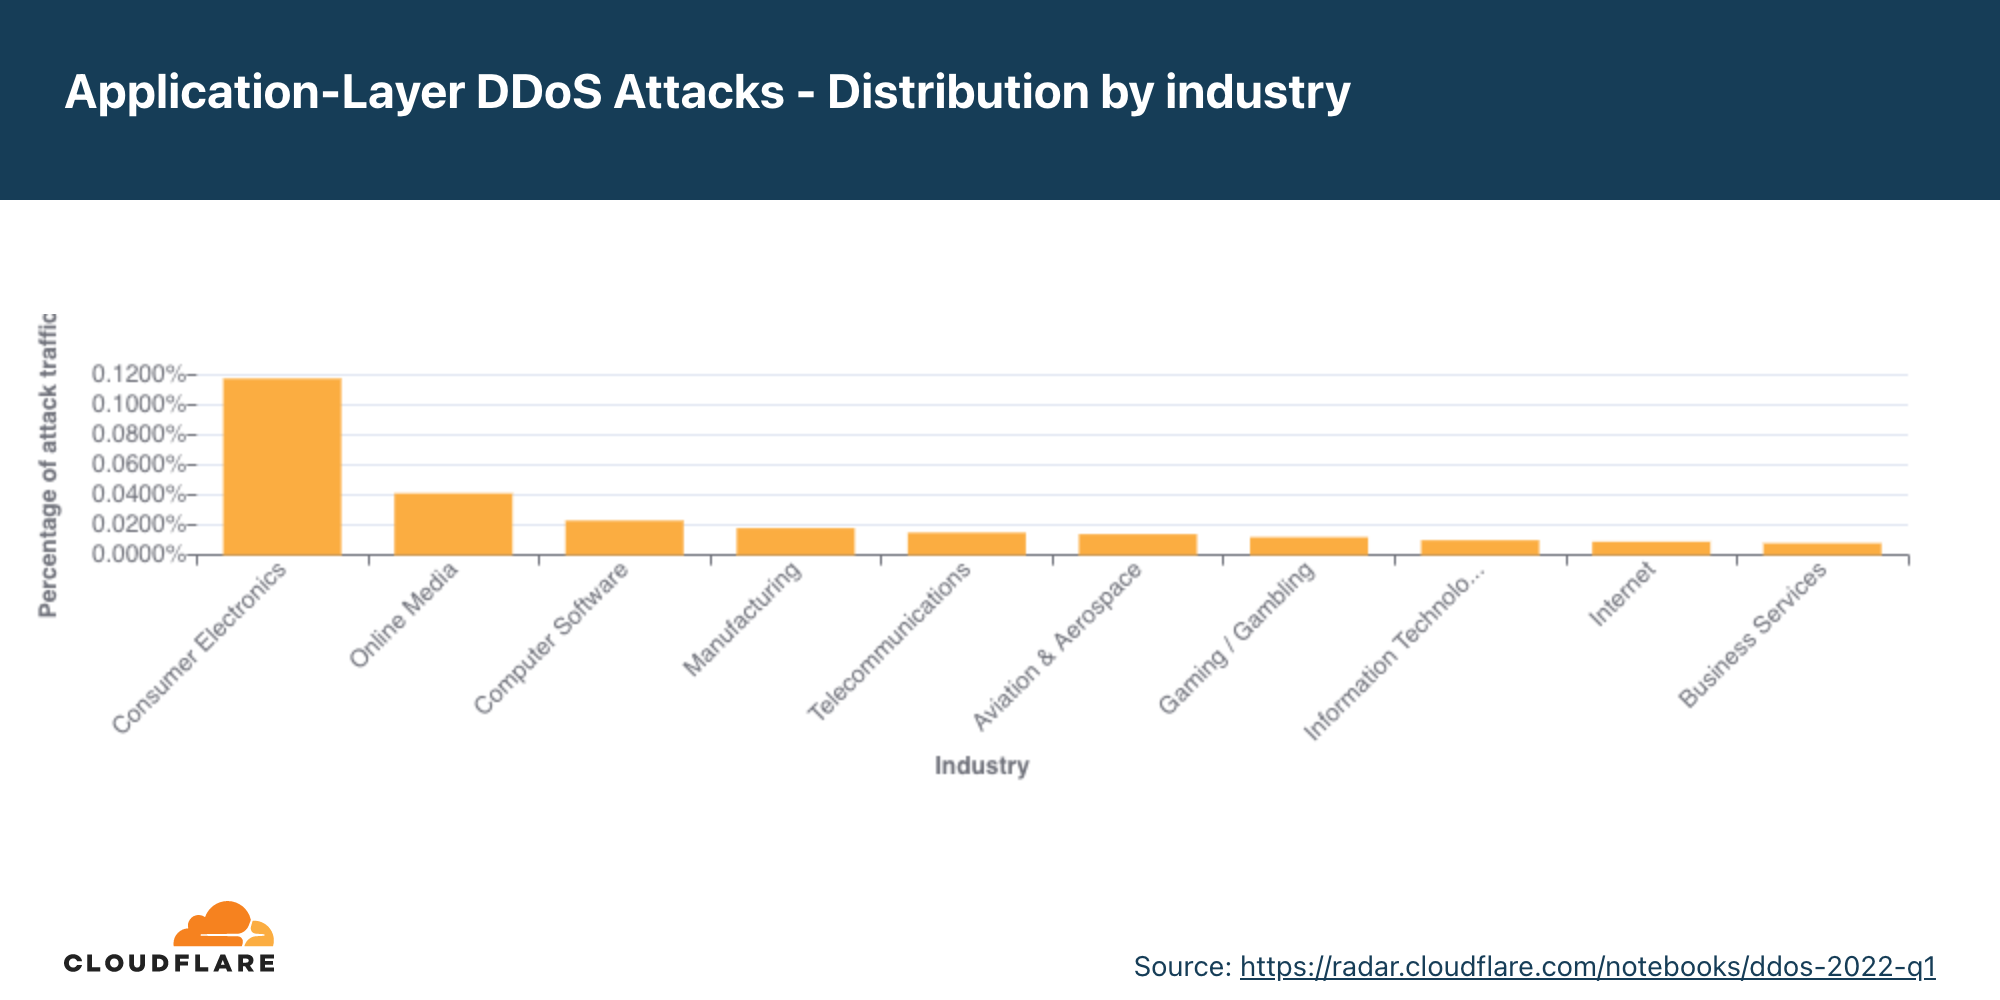
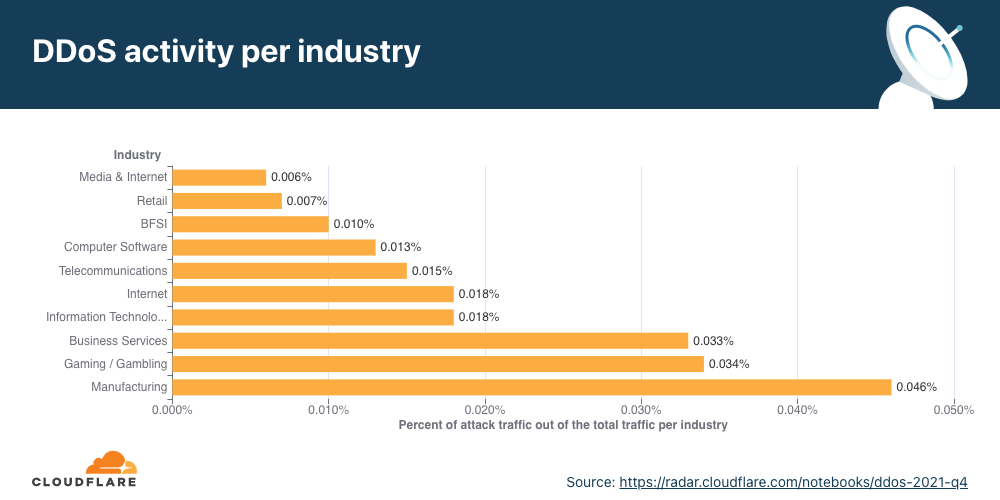
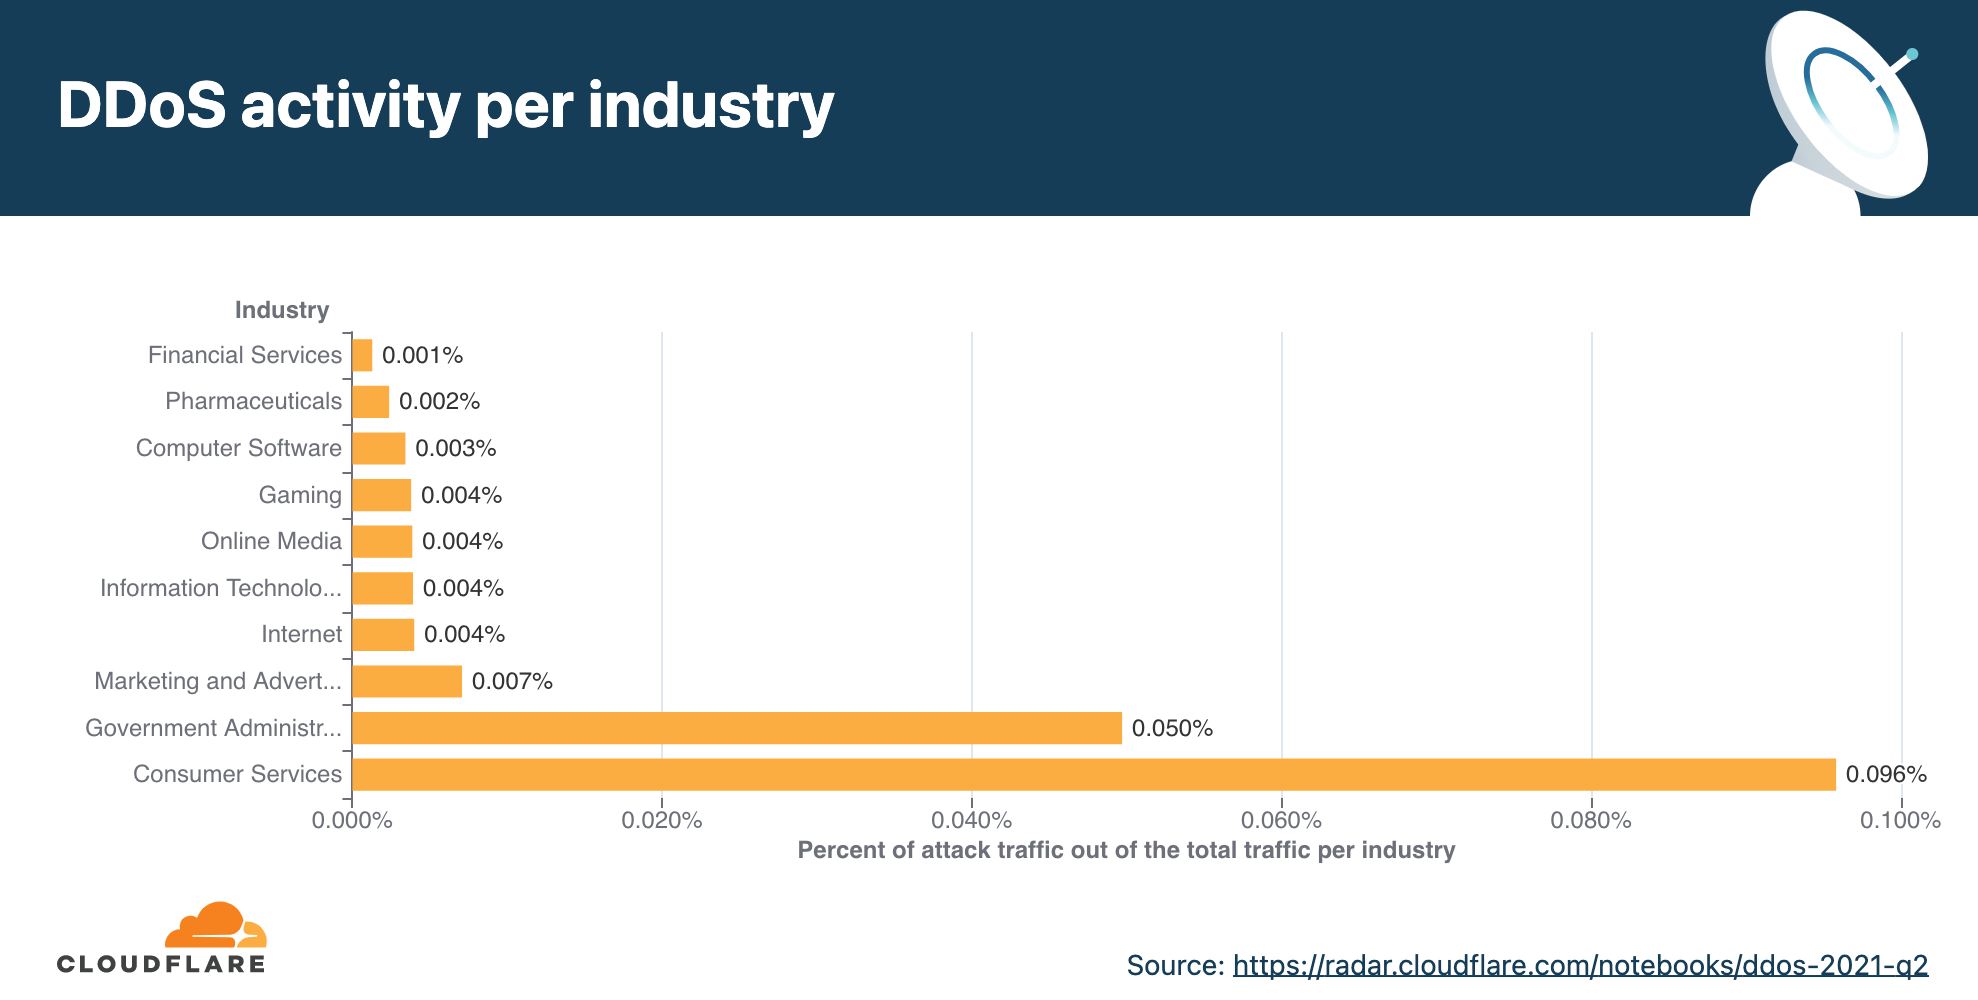
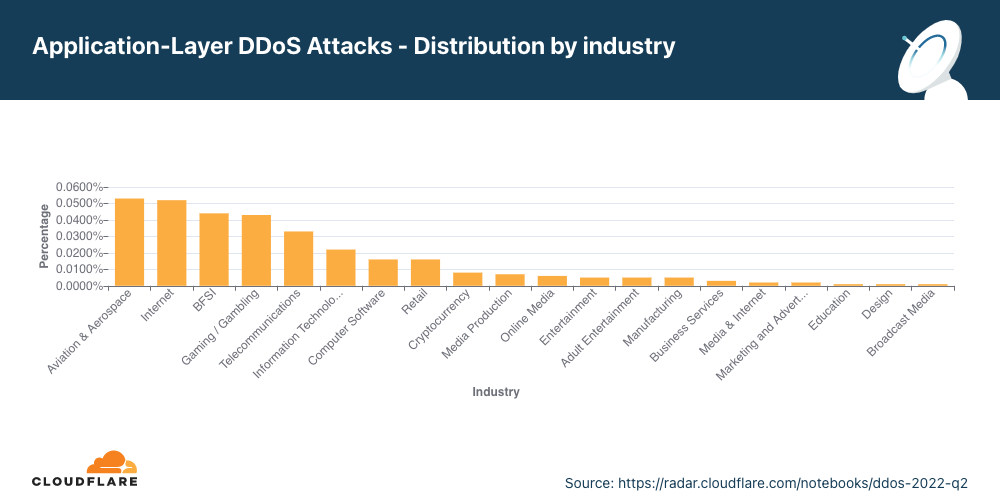
Application-layer DDoS attacks by industry
Attacks on the Aviation and Aerospace industry increased by 493% QoQ.
In Q2, Aviation and Aerospace was the most targeted industry by application-layer DDoS attacks. After it, was the Internet industry, Banking, Financial Institutions and Insurance (BFSI) industry, and in fourth place the Gaming / Gambling industry.
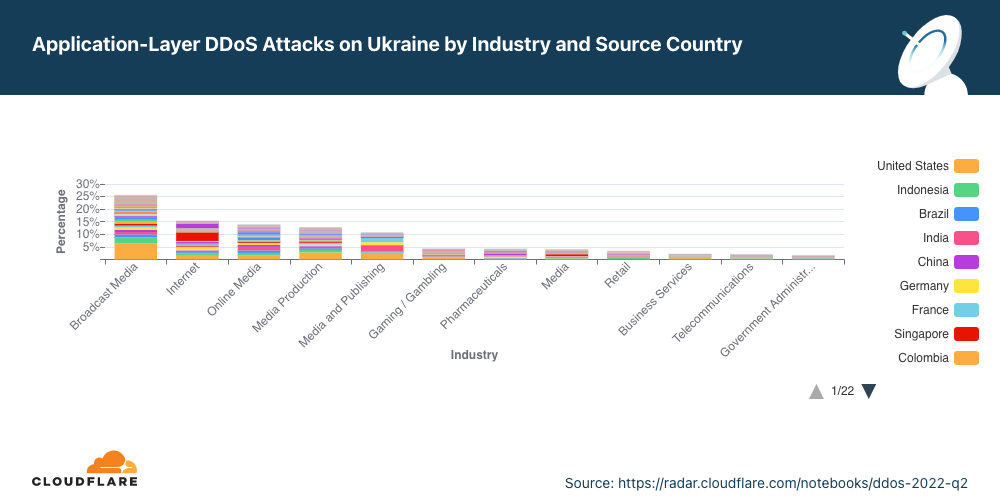
Ukraine and Russia cyberspace
Media and publishing companies are the most targeted in Ukraine.
As the war in Ukraine continues on the ground, in the air and on the water, so does it continue in cyberspace. Entities targeting Ukrainian companies appear to be trying to silence information. The top five most attacked industries in the Ukraine are all in broadcasting, Internet, online media, and publishing — that’s almost 80% of all DDoS Attacks targeting Ukraine.
On the other side of the war, the Russian Banks, Financial Institutions and Insurance (BFSI) companies came under the most attacks. Almost 45% of all DDoS attacks targeted the BFSI sector. The second most targeted was the Cryptocurrency industry, followed by Online media.
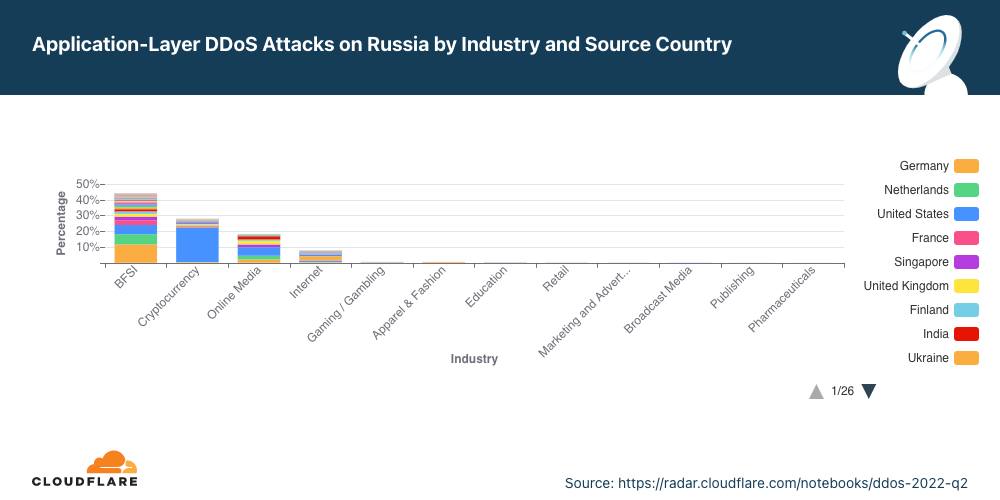
In both sides of the war, we can see that the attacks are highly distributed, indicating the use of globally distributed botnets.
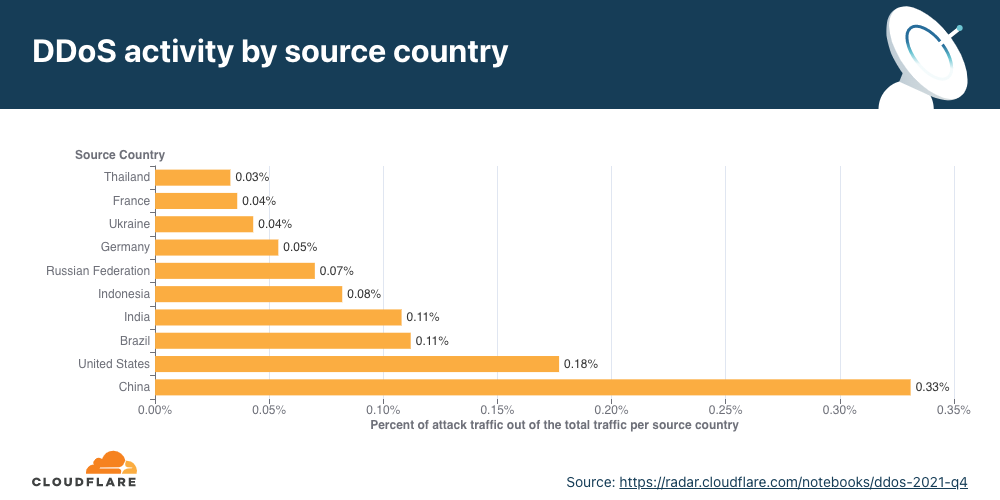
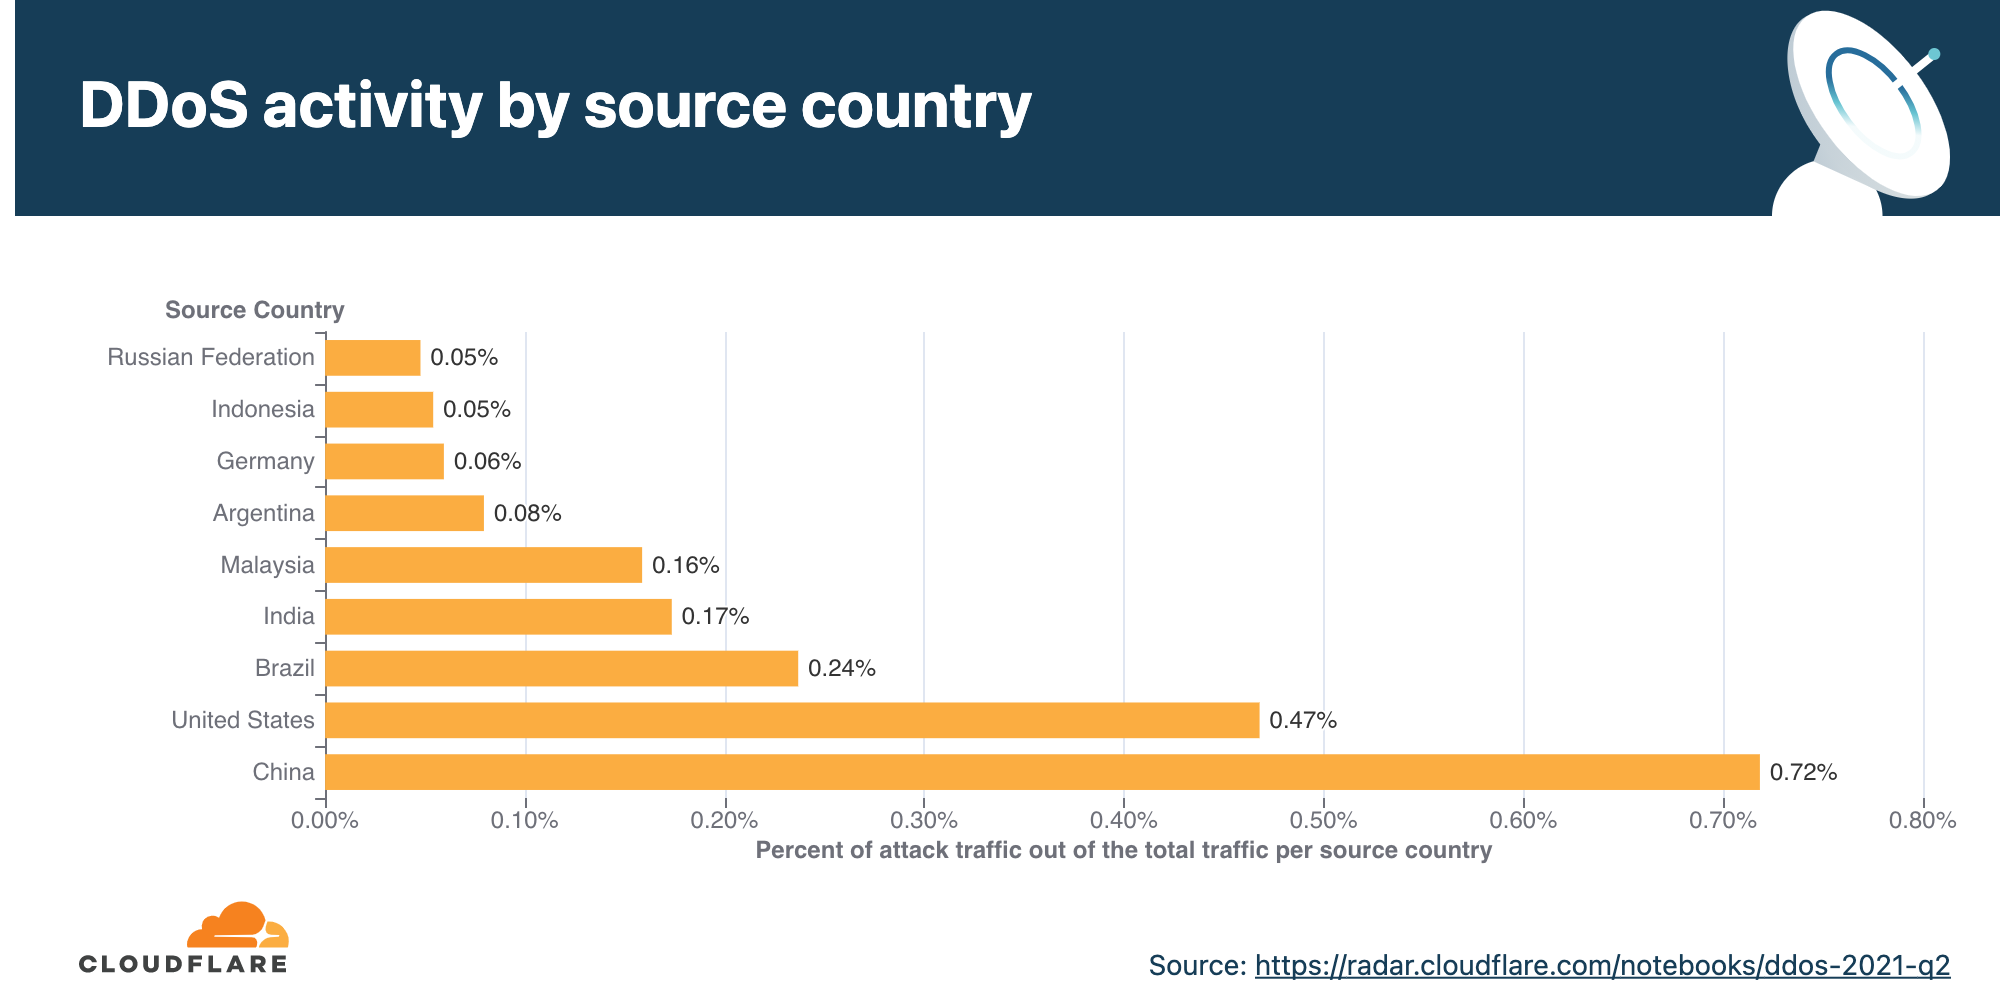
Application-layer DDoS attacks by source country
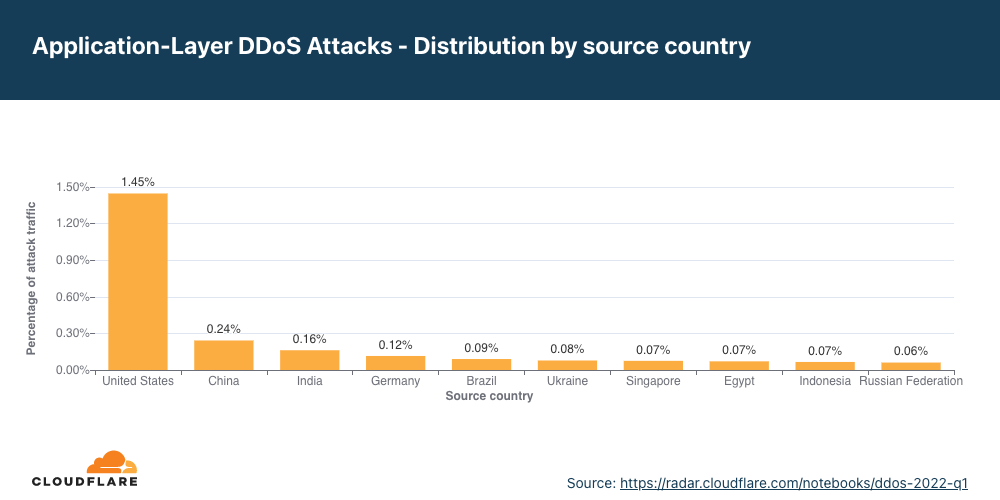
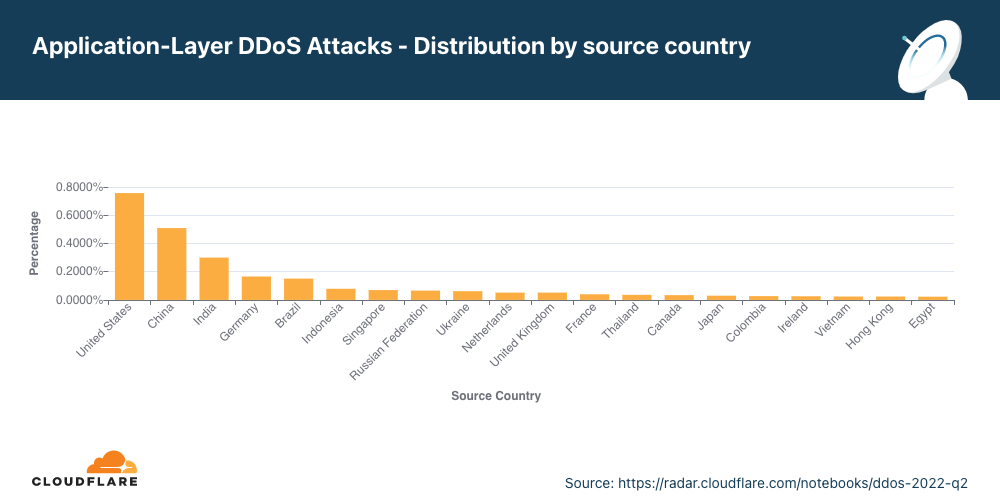
In Q2, attacks from China shrank by 78%, and attacks from the US shrank by 43%.
To understand the origin of the HTTP attacks, we look at the geolocation of the source IP address belonging to the client that generated the attack HTTP requests. Unlike network-layer attacks, source IP addresses cannot be spoofed in HTTP attacks. A high percentage of DDoS activity in a given country doesn’t mean that that specific country is launching the attacks but rather indicates the presence of botnets operating from within the country’s borders.
For the second quarter in a row, the United States tops the charts as the main source of HTTP DDoS attacks. Following the US is China in second place, and India and Germany in the third and fourth. Even though the US remained in the first place, attacks originating from the US shrank by 48% QoQ while attacks from other regions grew; attacks from India grew by 87%, from Germany by 33%, and attacks from Brazil grew by 67%.
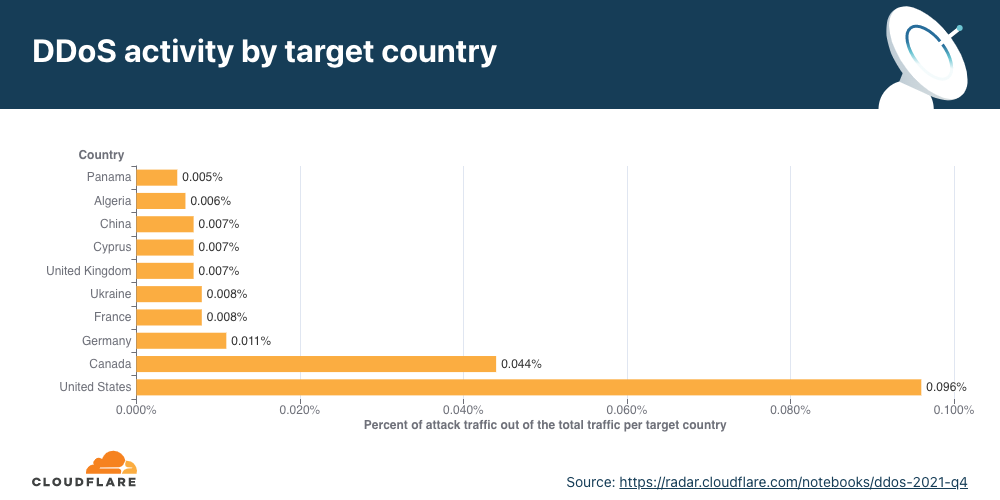
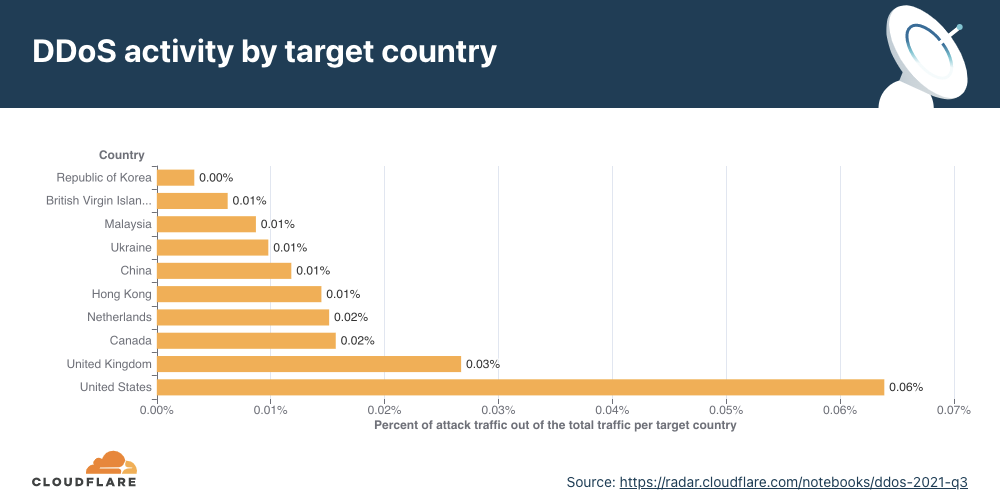
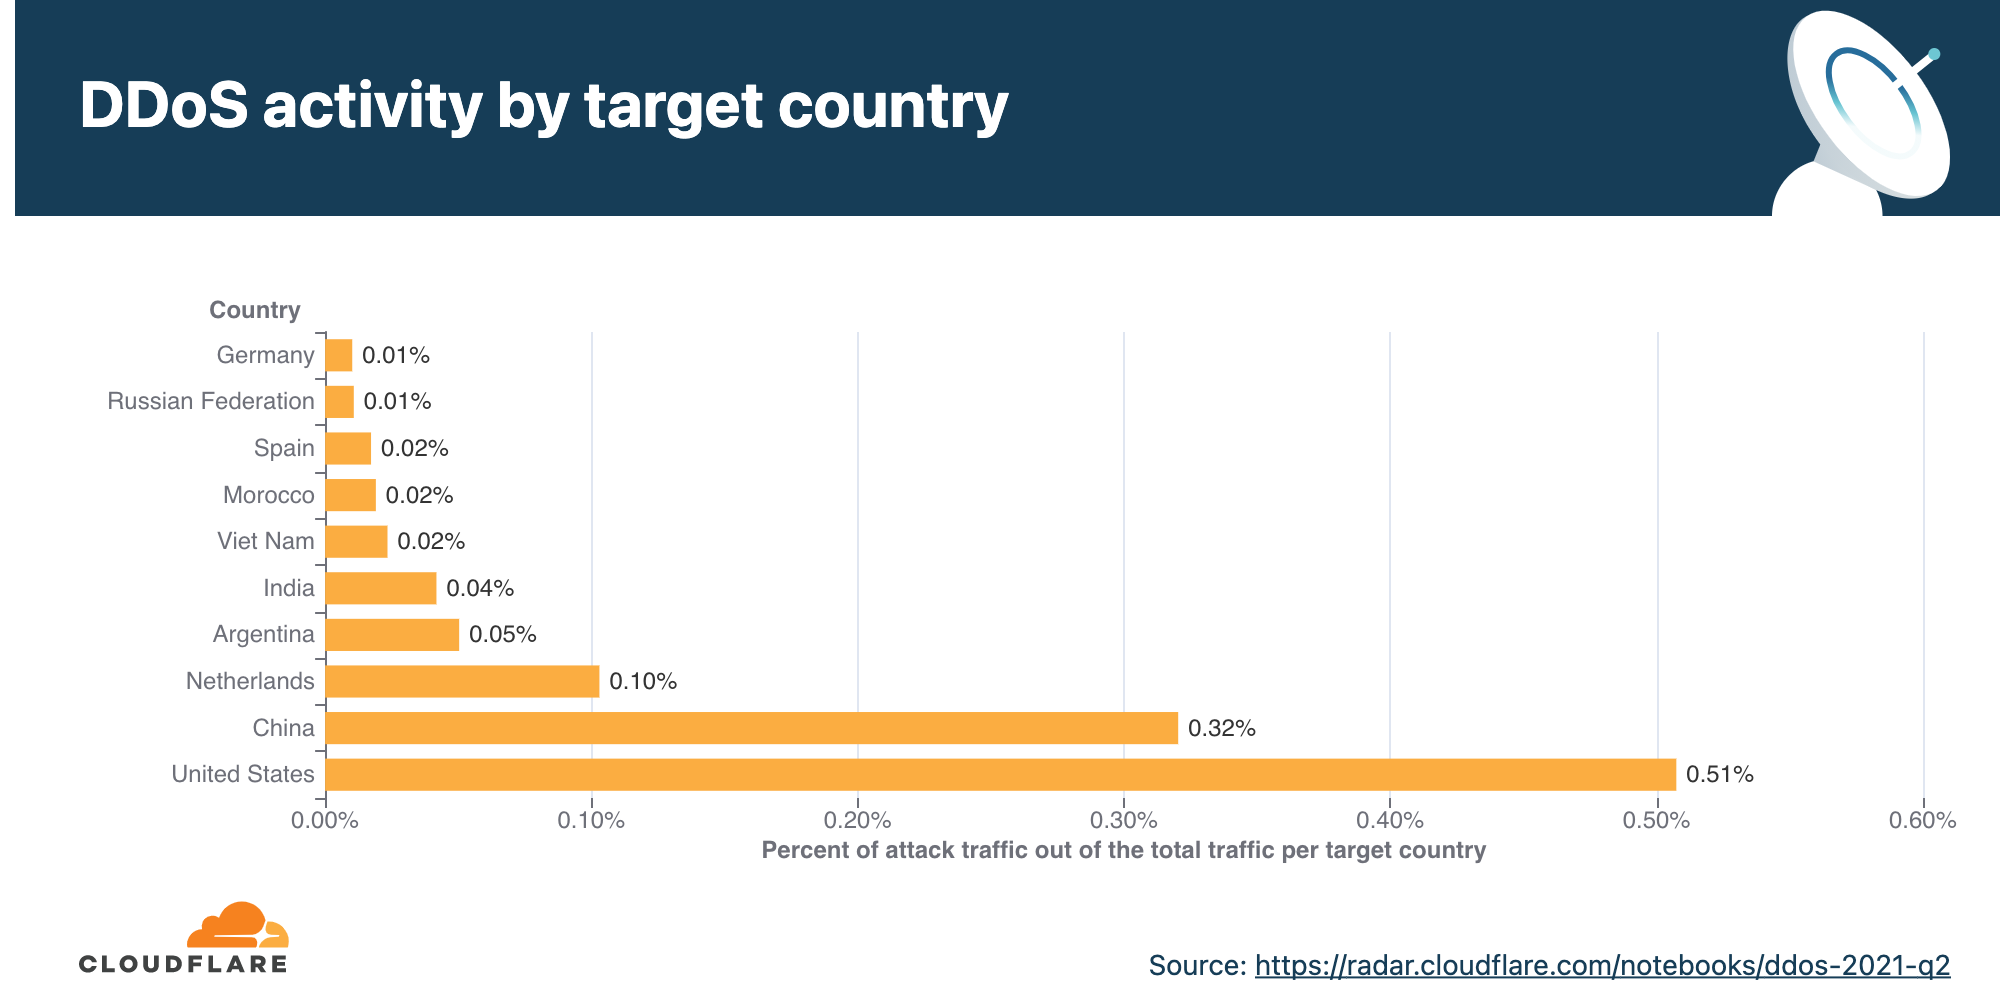
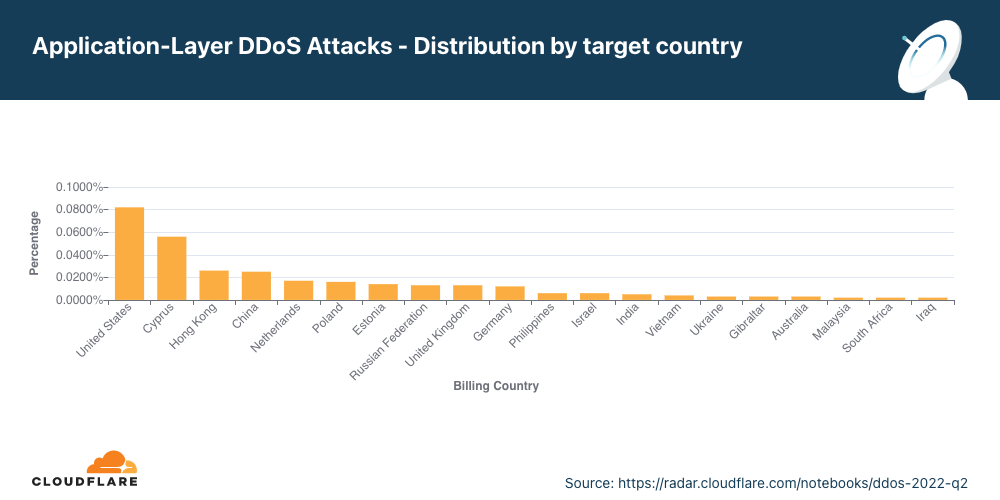
Application-layer DDoS attacks by target country
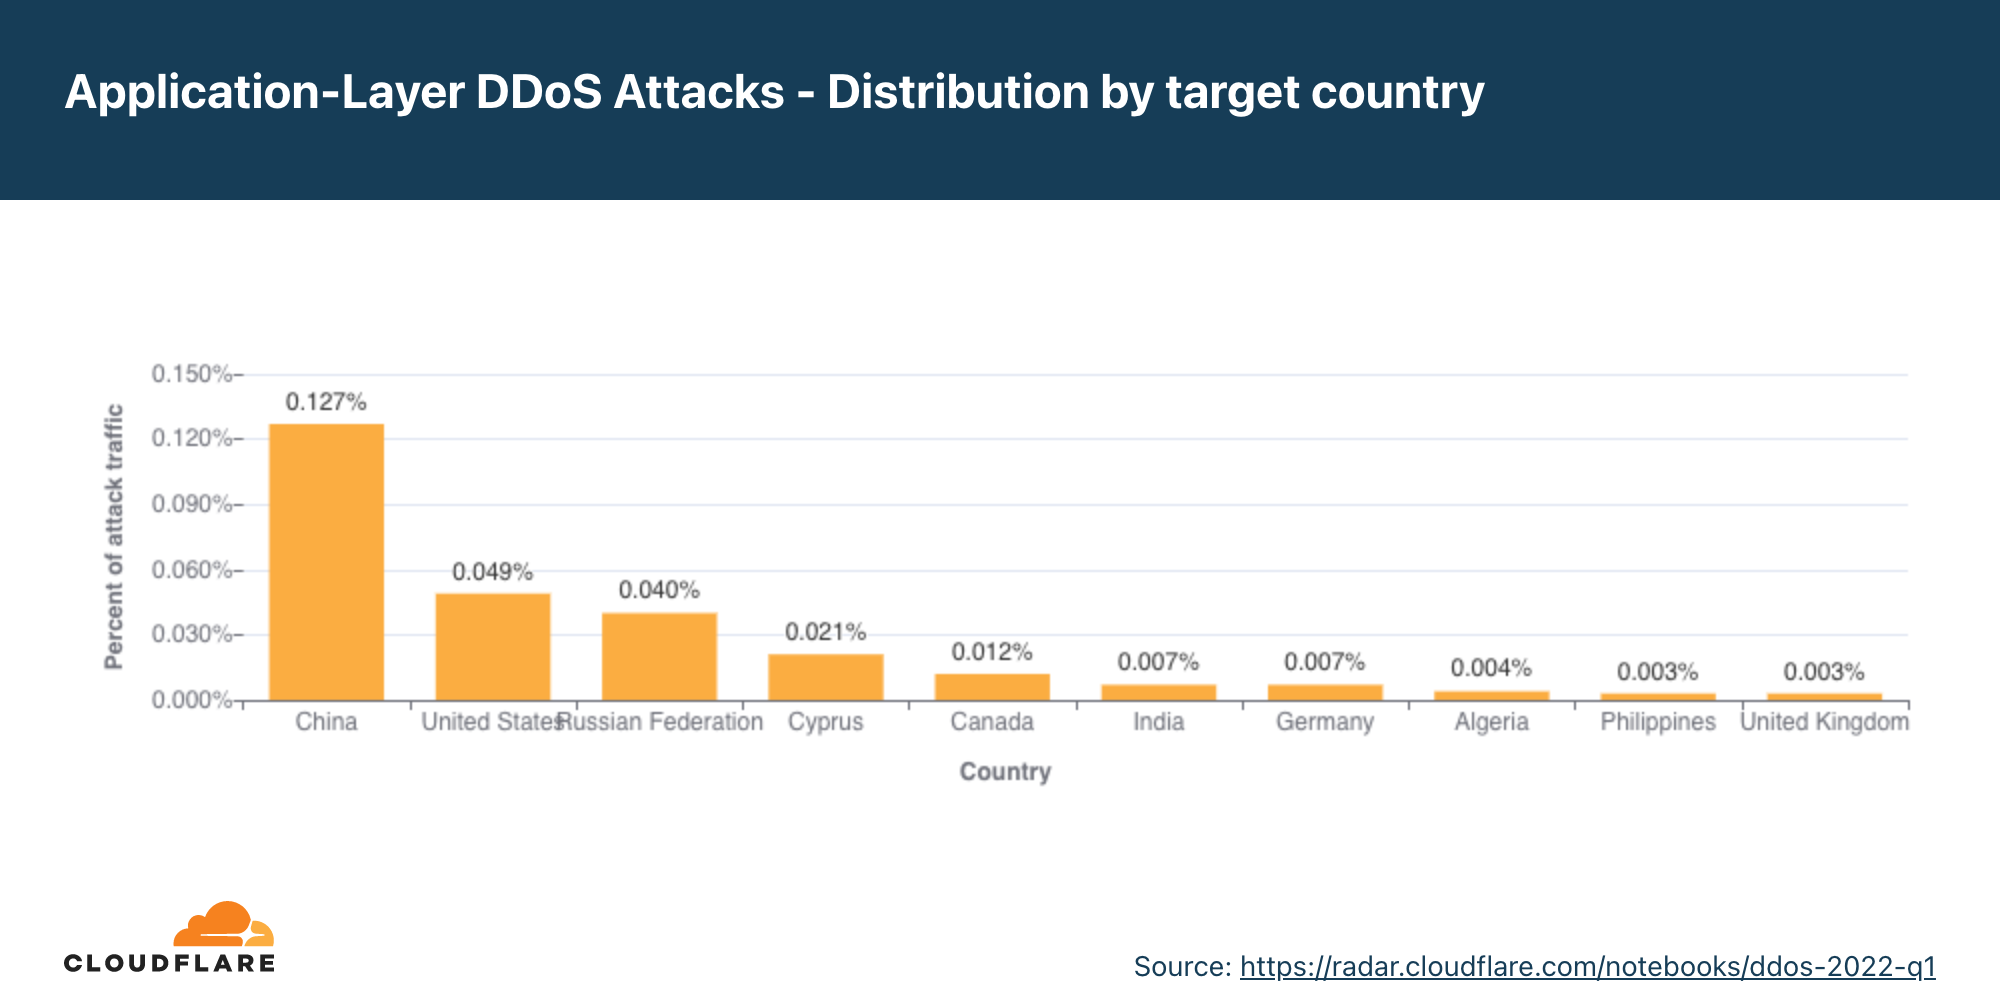
In order to identify which countries are targeted by the most HTTP DDoS attacks, we bucket the DDoS attacks by our customers’ billing countries and represent it as a percentage out of all DDoS attacks.
HTTP DDoS attacks on US-based countries increased by 67% QoQ pushing the US back to the first place as the main target of application-layer DDoS attacks. Attacks on Chinese companies plunged by 80% QoQ dropping it from the first place to the fourth. Attacks on Cyprus increase by 167% making it the second most attacked country in Q2. Following Cyprus is Hong Kong, China, and the Netherlands.
Network-layer DDoS attacks
While application-layer attacks target the application (Layer 7 of the OSI model) running the service that end users are trying to access (HTTP/S in our case), network-layer attacks aim to overwhelm network infrastructure (such as in-line routers and servers) and the Internet link itself.
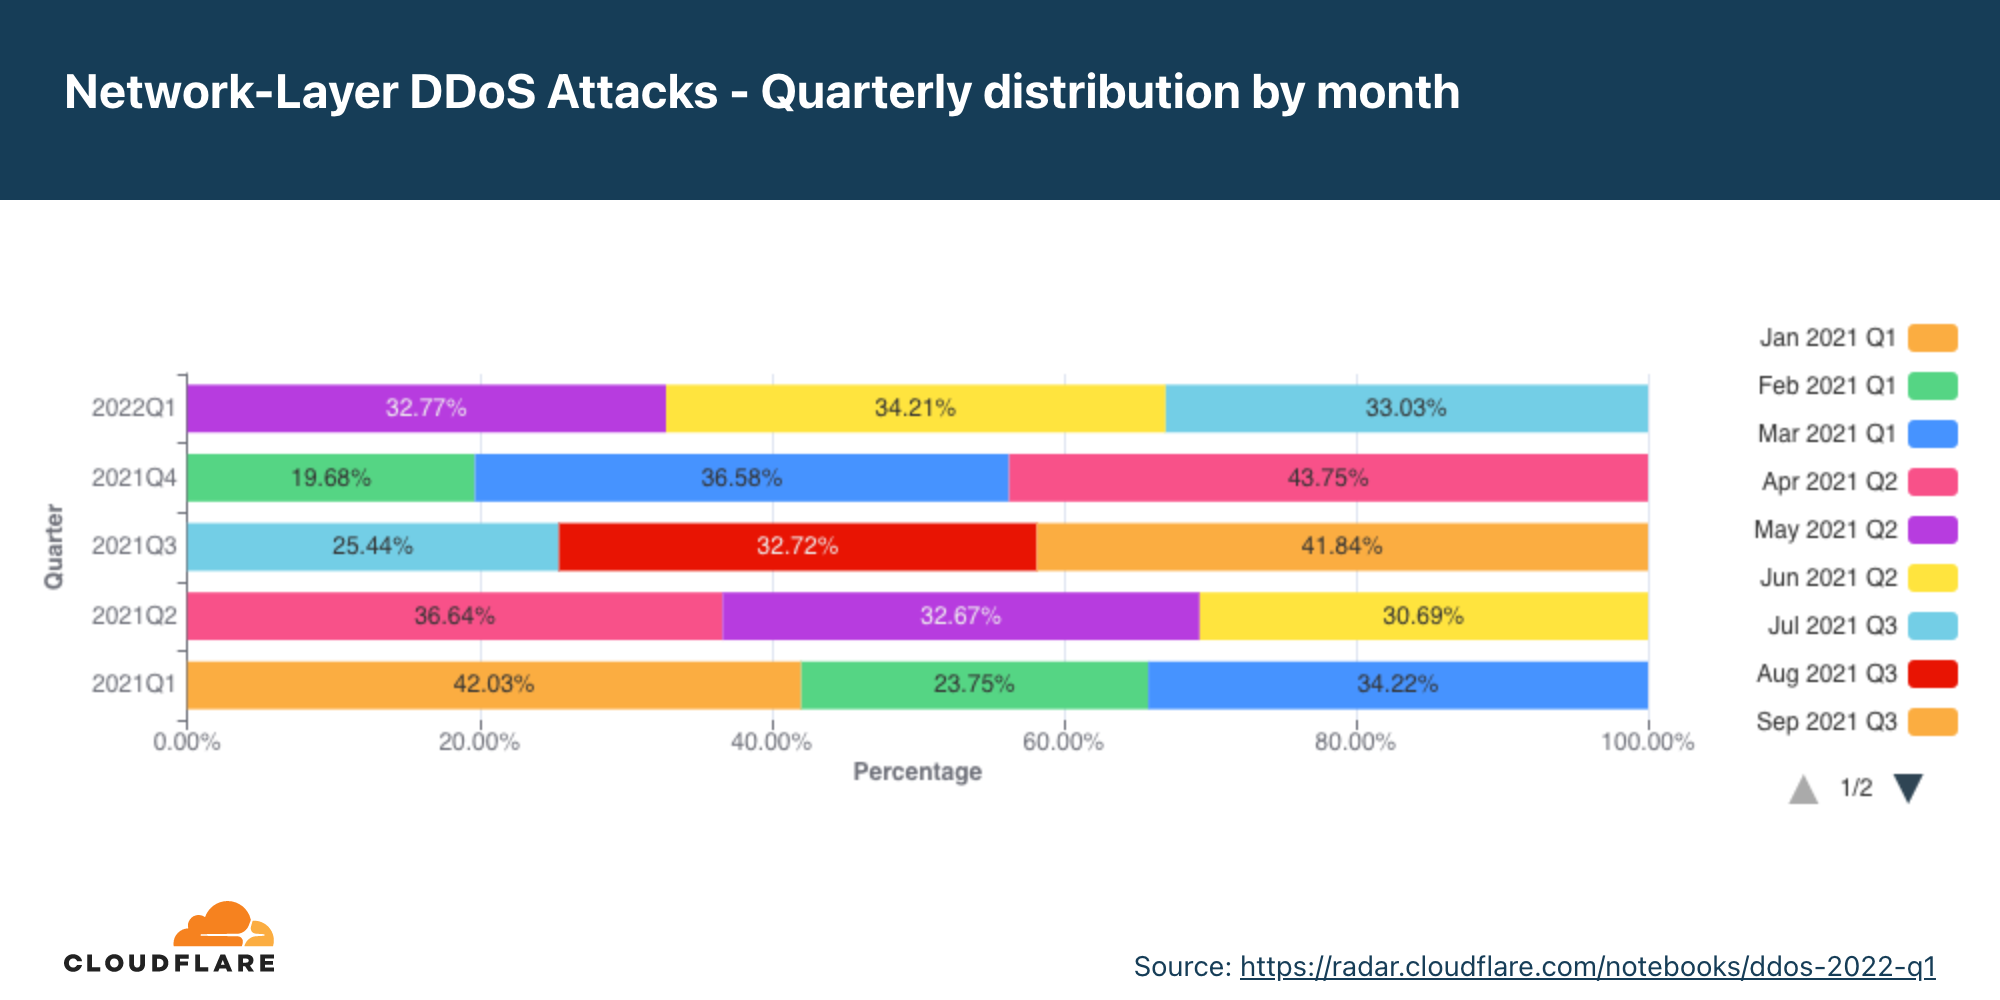
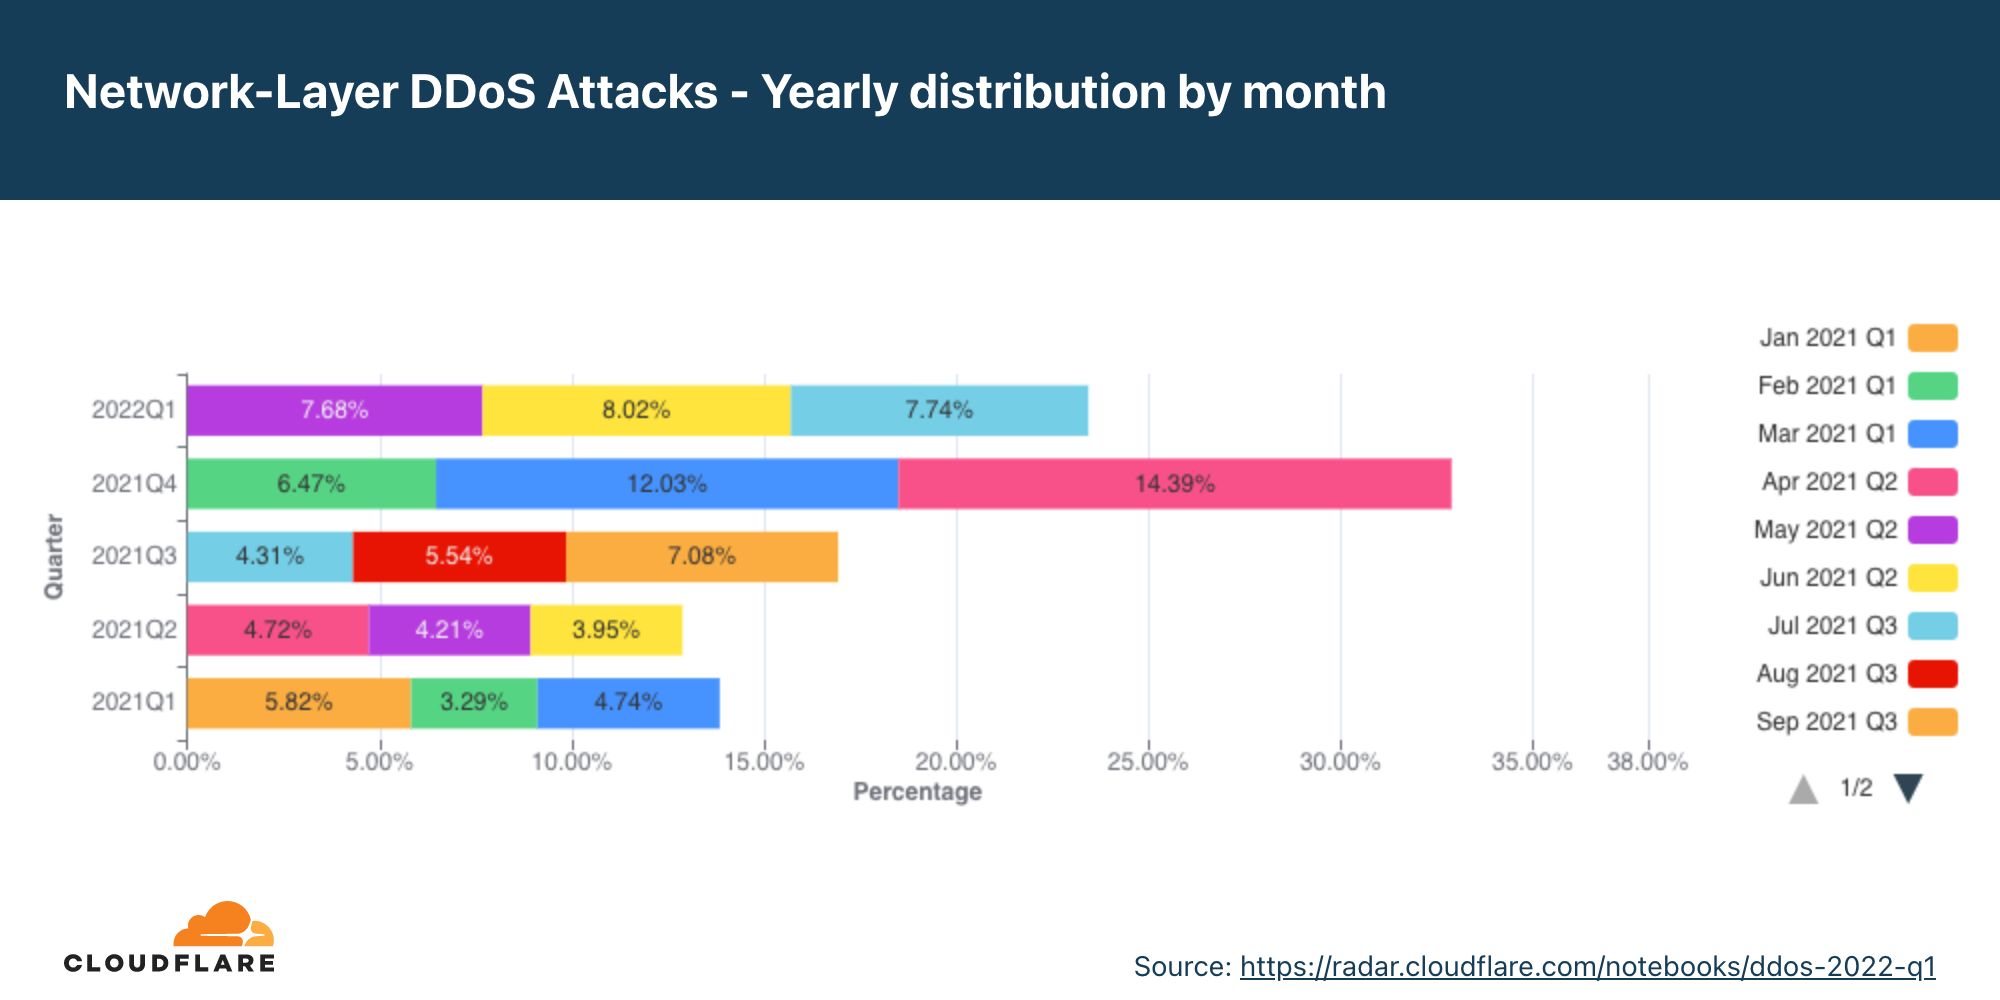
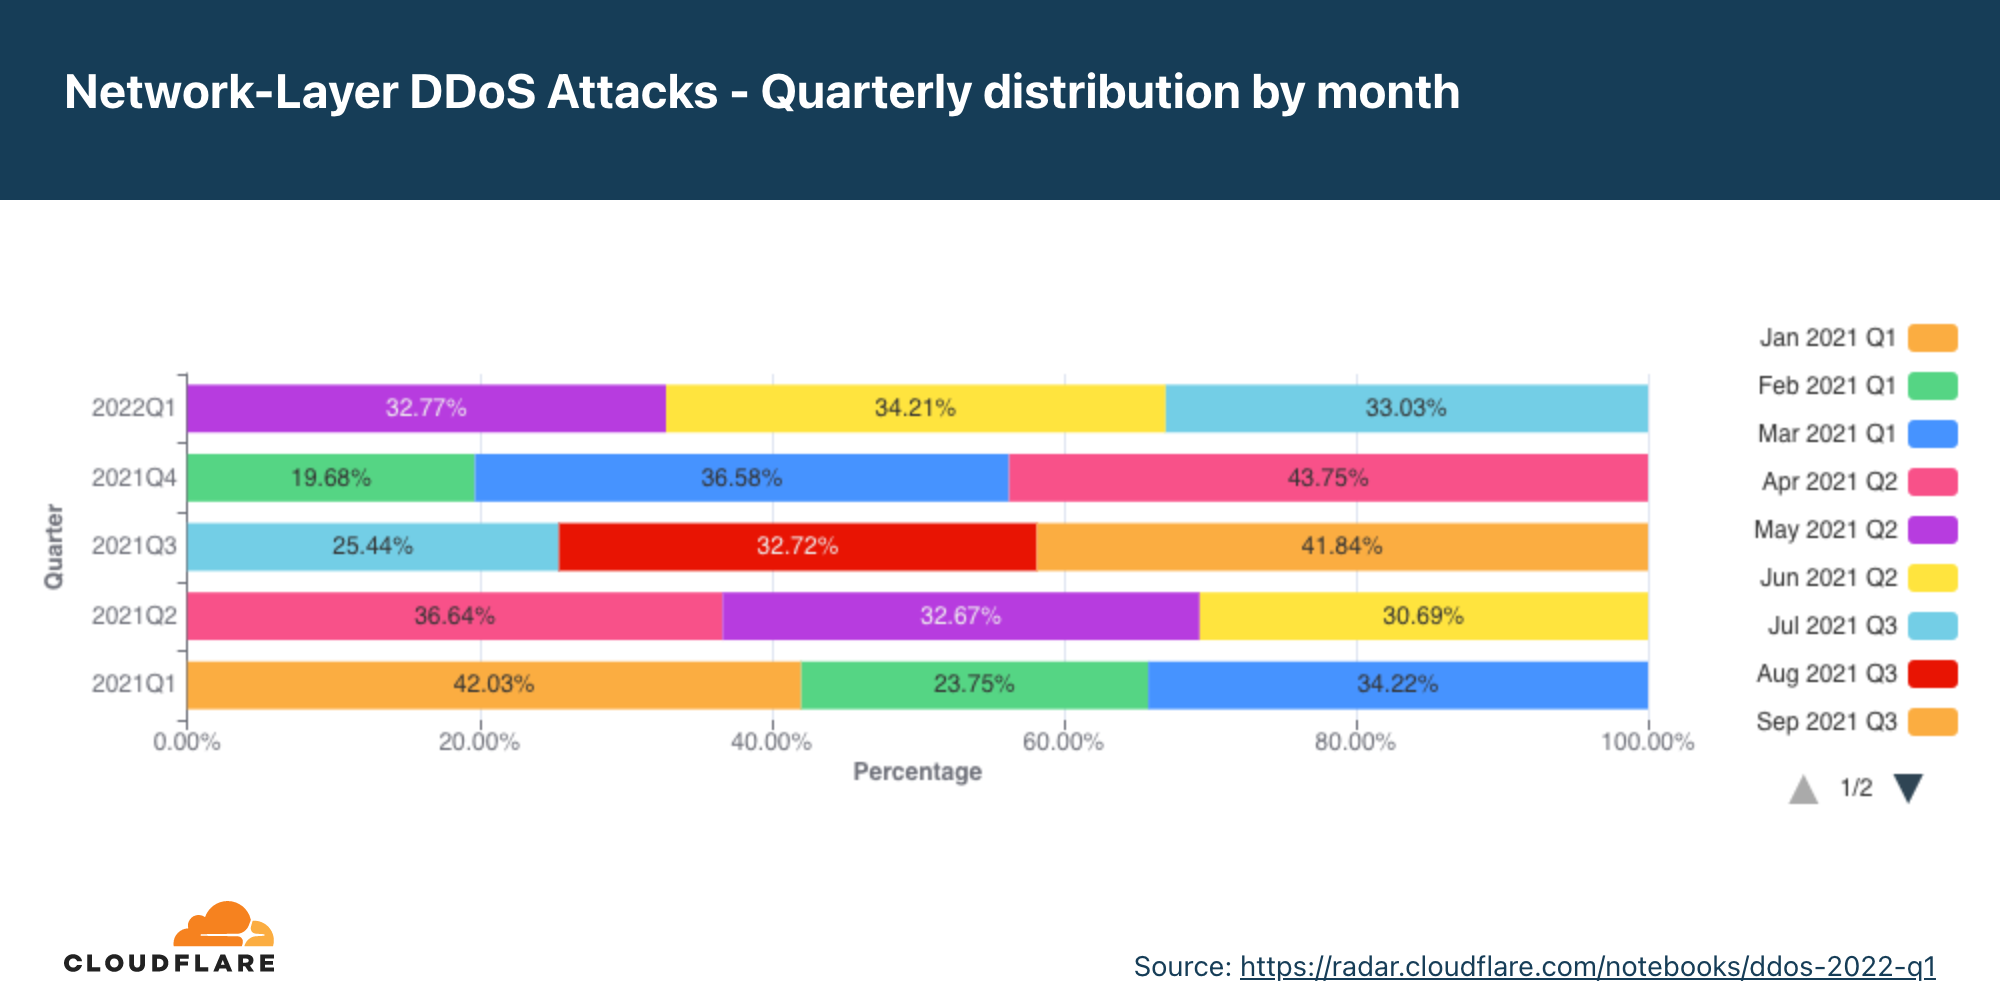
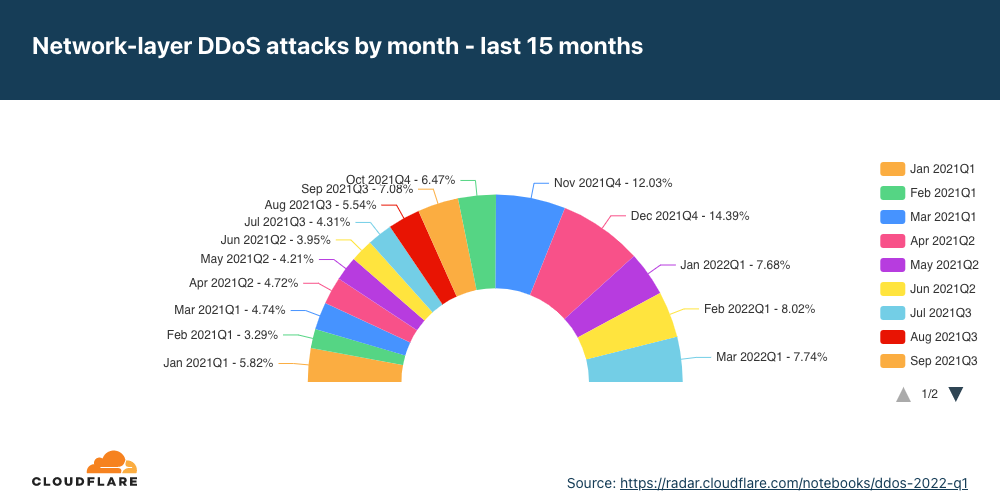
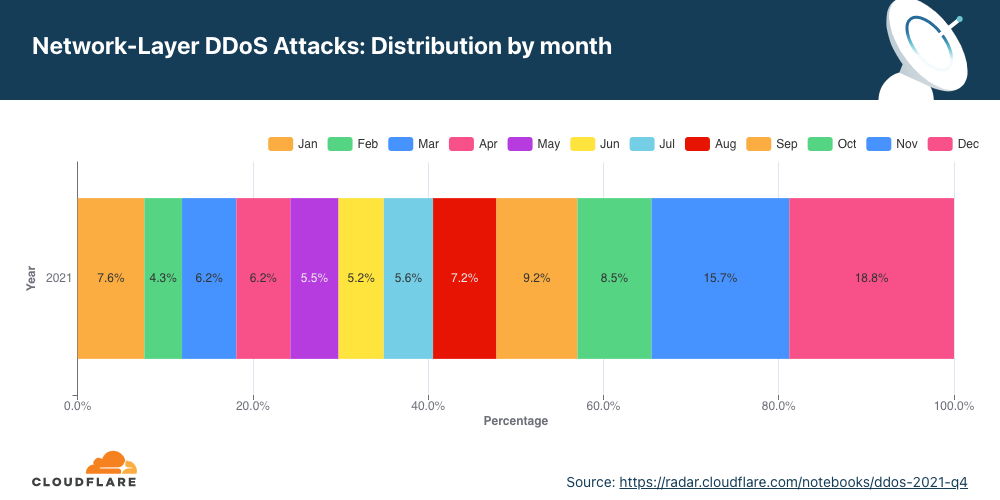
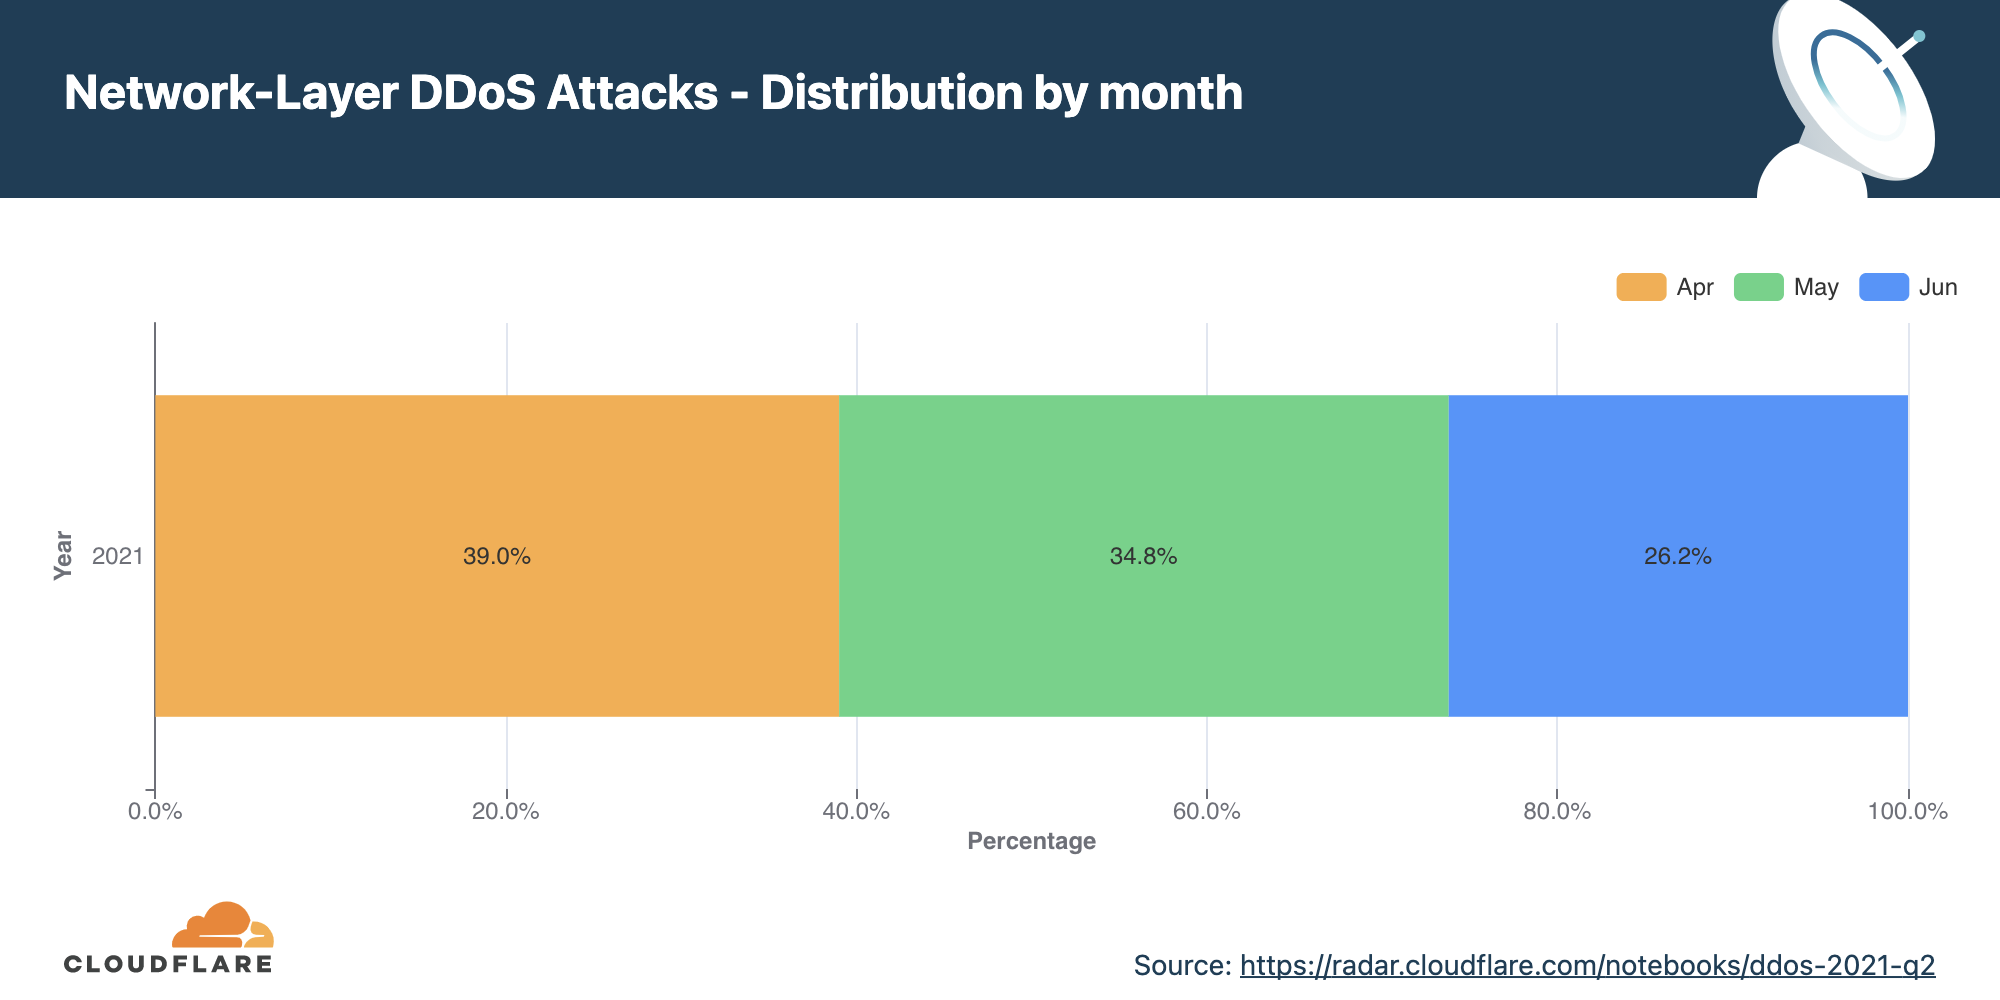
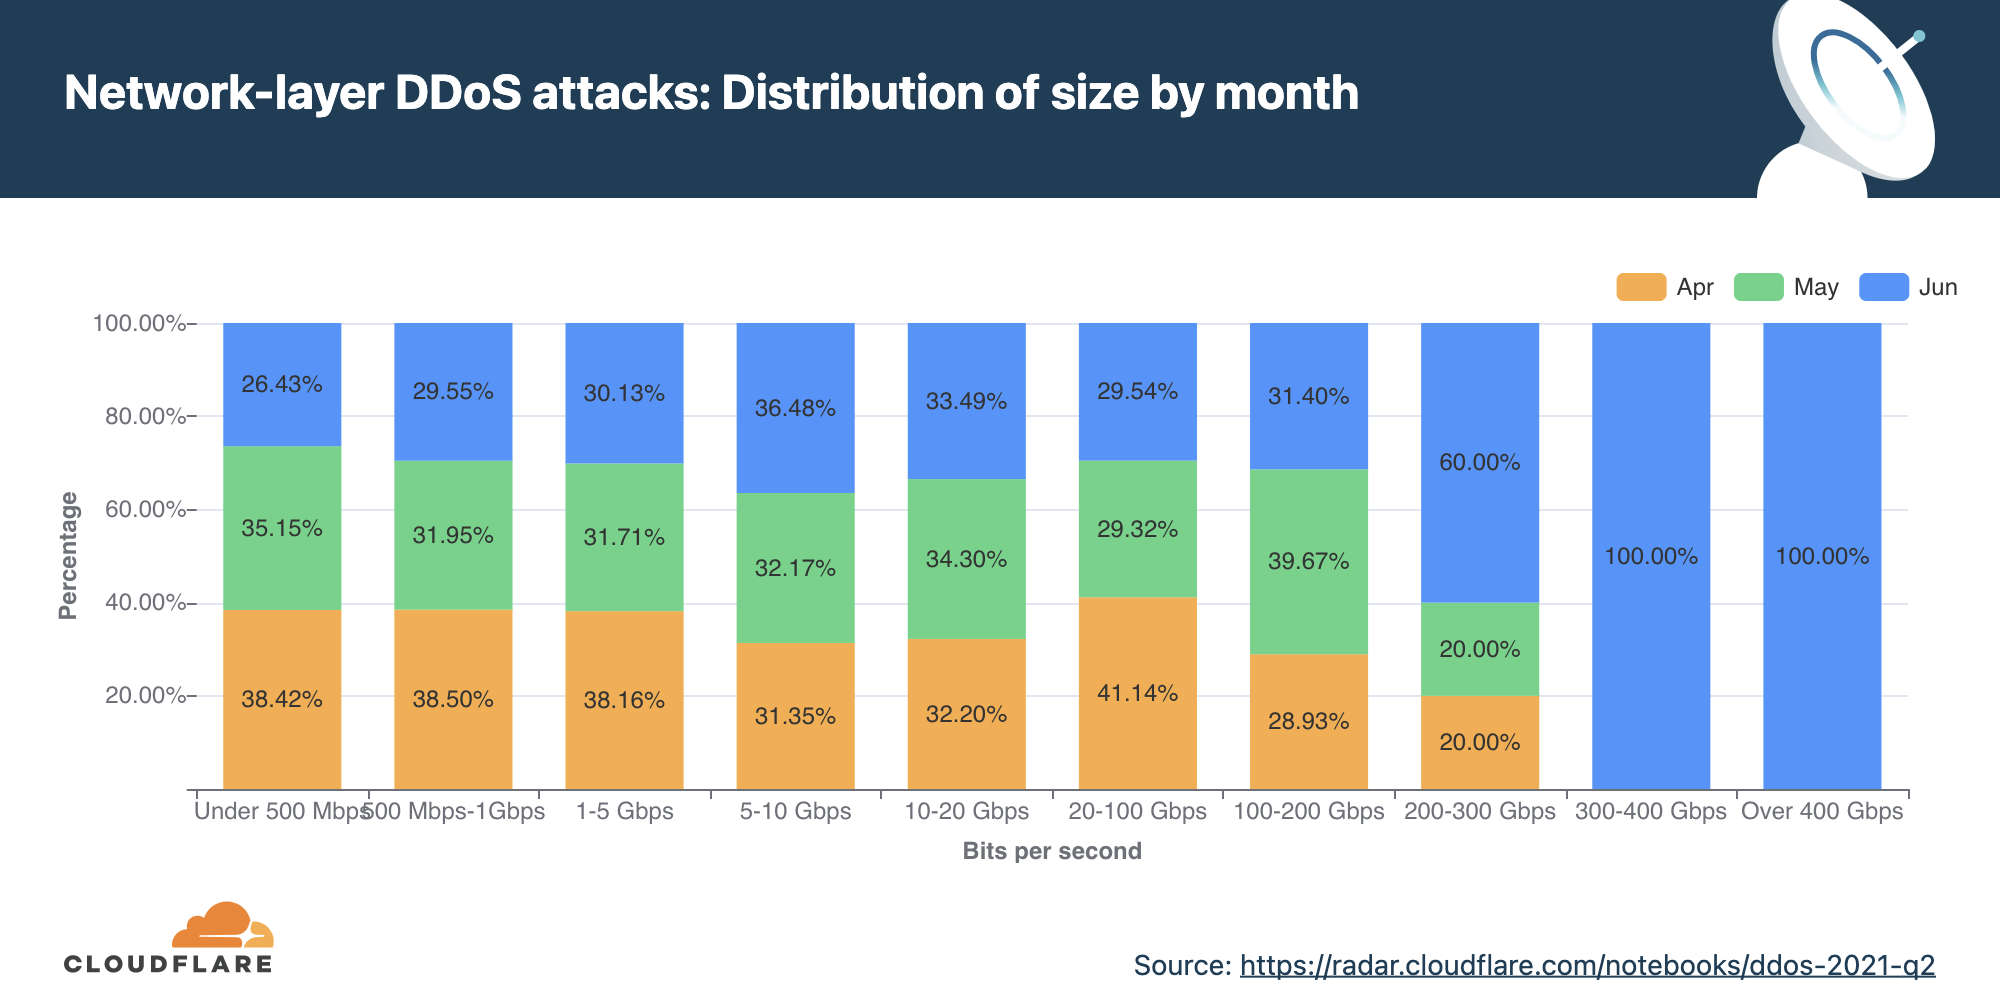
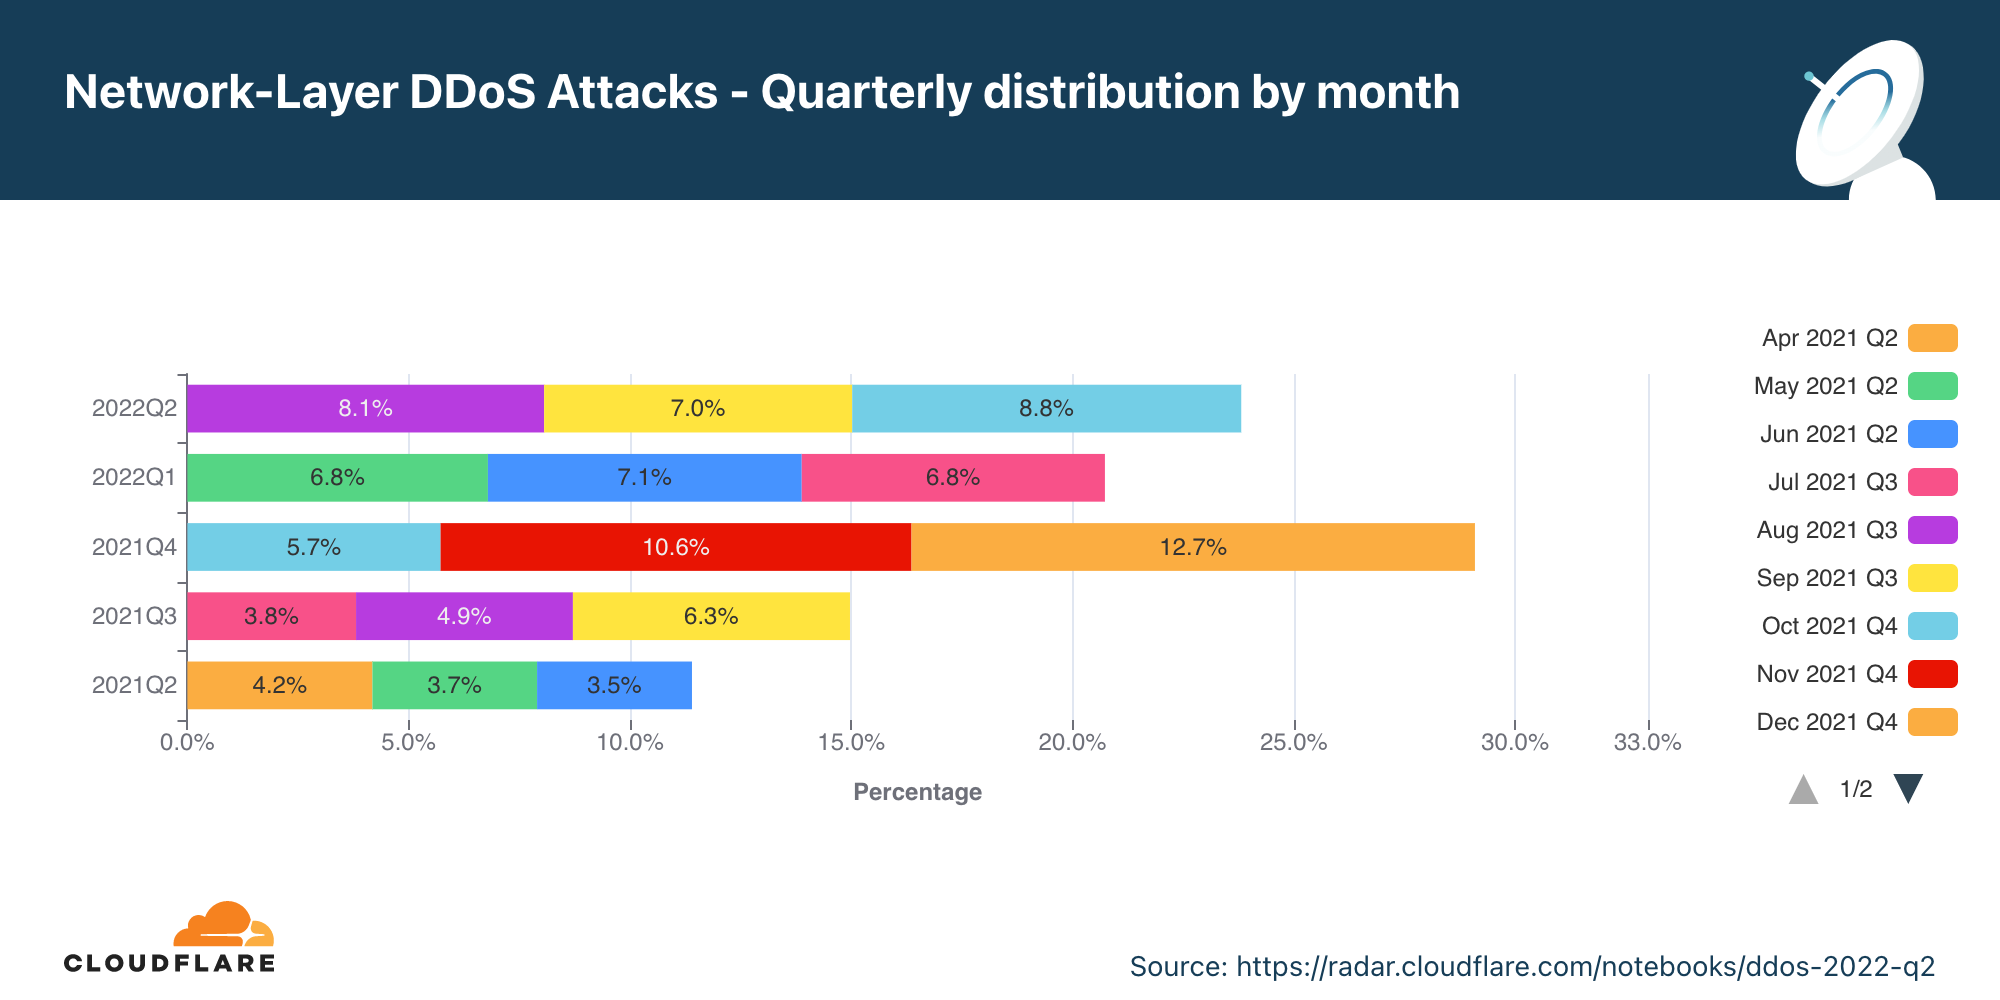
Network-layer DDoS attacks by month
In Q2, network-layer DDoS attacks increased by 109% YoY, and volumetric attacks of 100 Gbps and larger increased by 8% QoQ.
In Q2, the total amount of network-layer DDoS attacks increased by 109% YoY and 15% QoQ. June was the busiest month of the quarter with almost 36% of the attacks occurring in June.
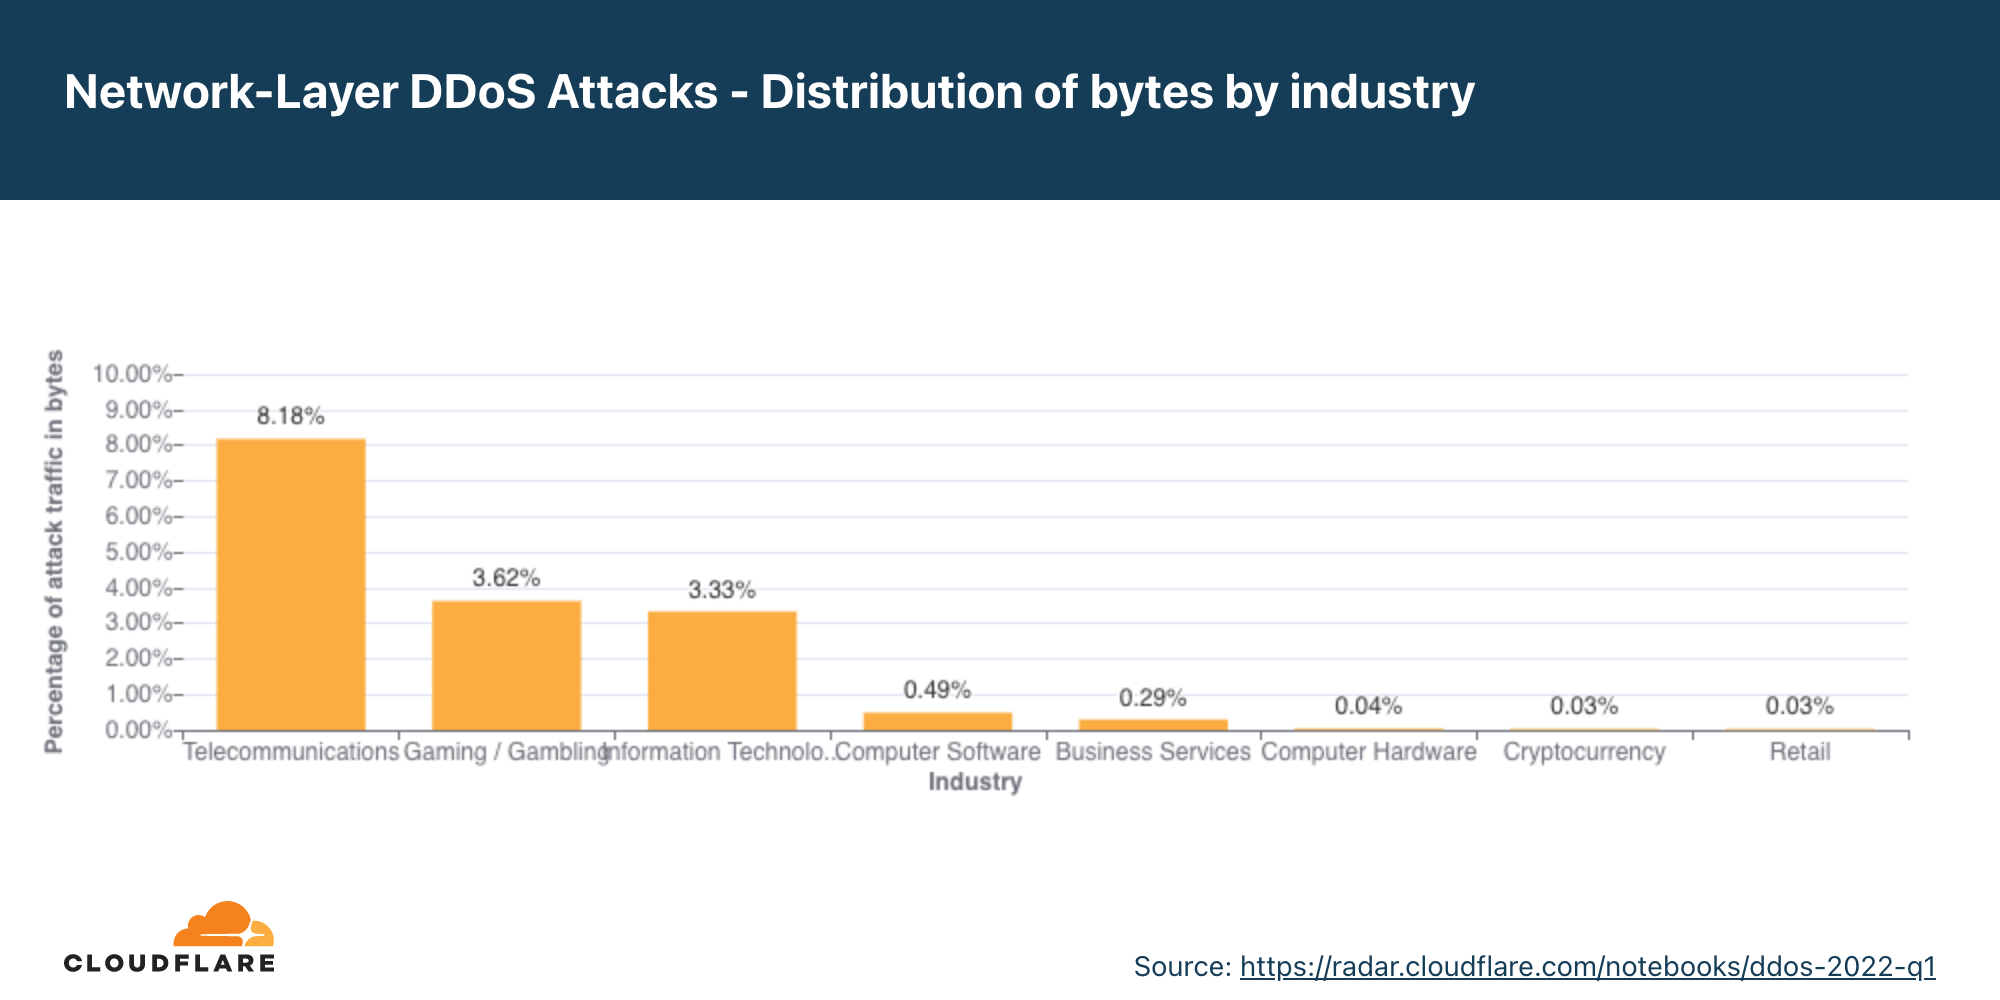
Network-layer DDoS attacks by industry
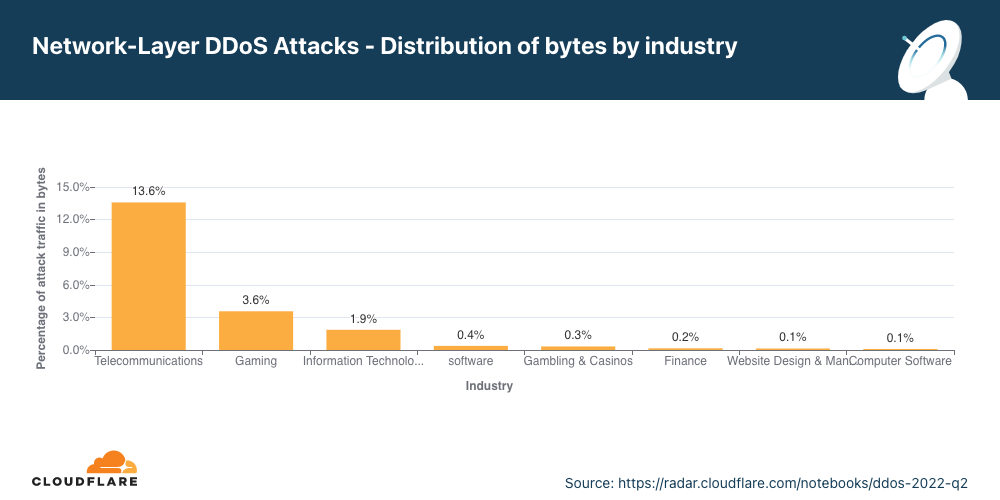
In Q2, attacks on Telecommunication companies grew by 66% QoQ.
For the second consecutive quarter, the Telecommunications industry was the most targeted by network-layer DDoS attacks. Even more so, attacks on Telecommunication companies grew by 66% QoQ. The Gaming industry came in second place, followed by Information Technology and Services companies.
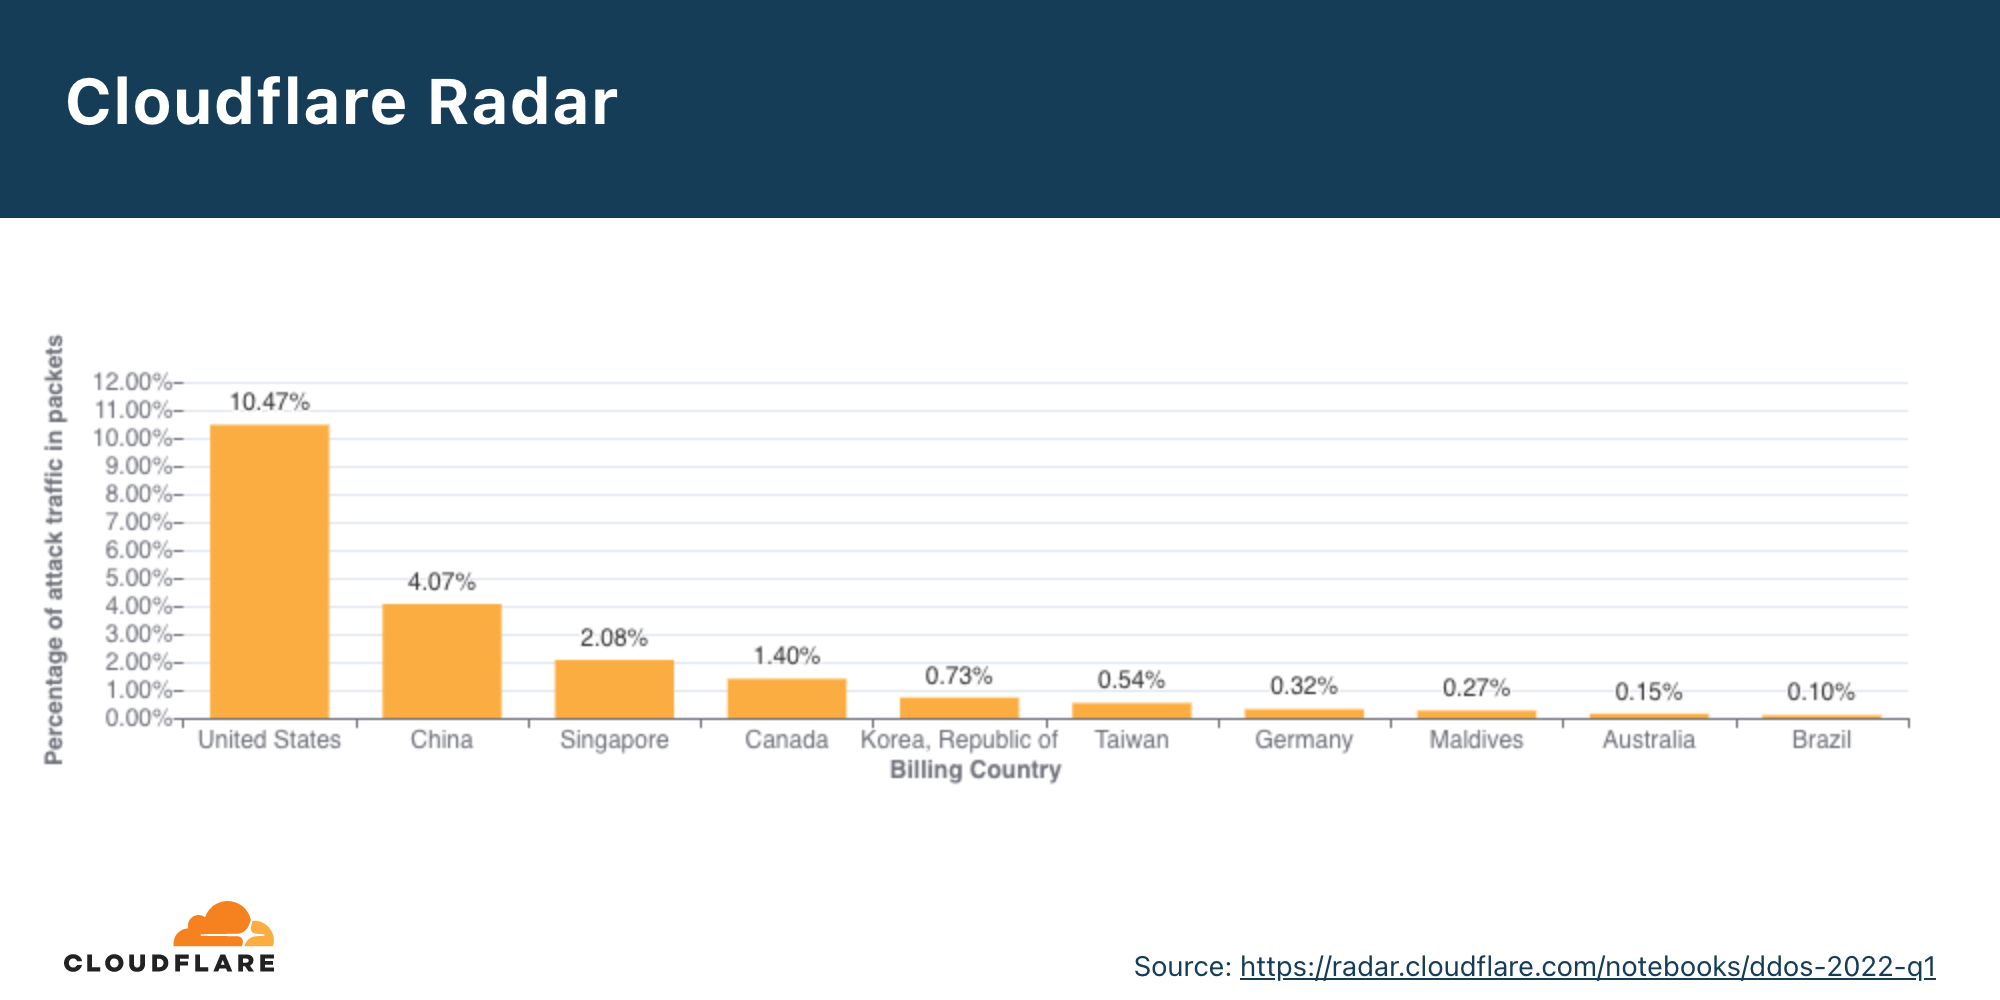
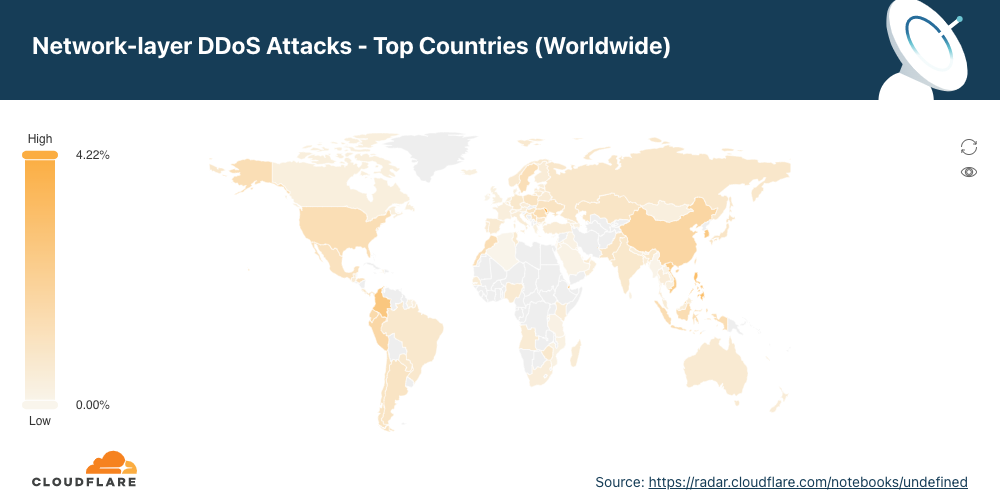
Network-layer DDoS attacks by target country
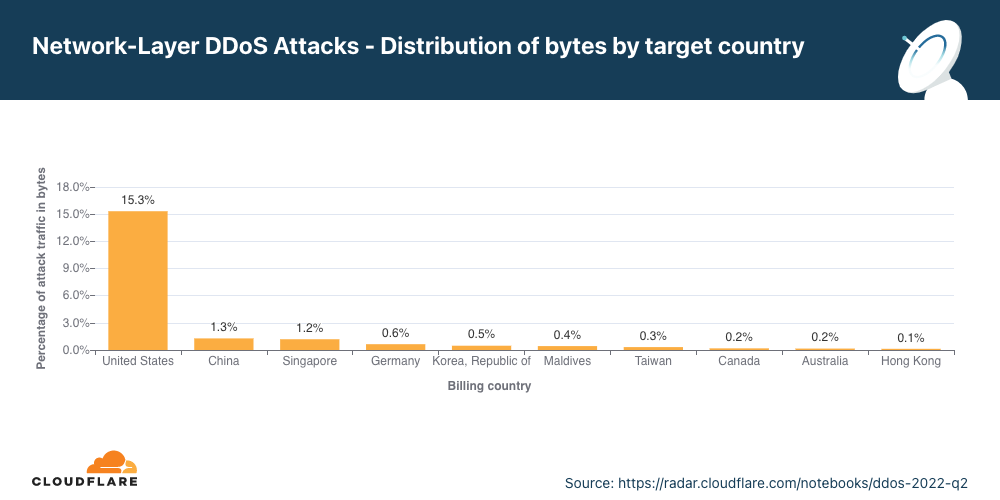
Attacks on US networks grew by 95% QoQ.
In Q2, the US remains the most attacked country. After the US came China, Singapore and Germany.
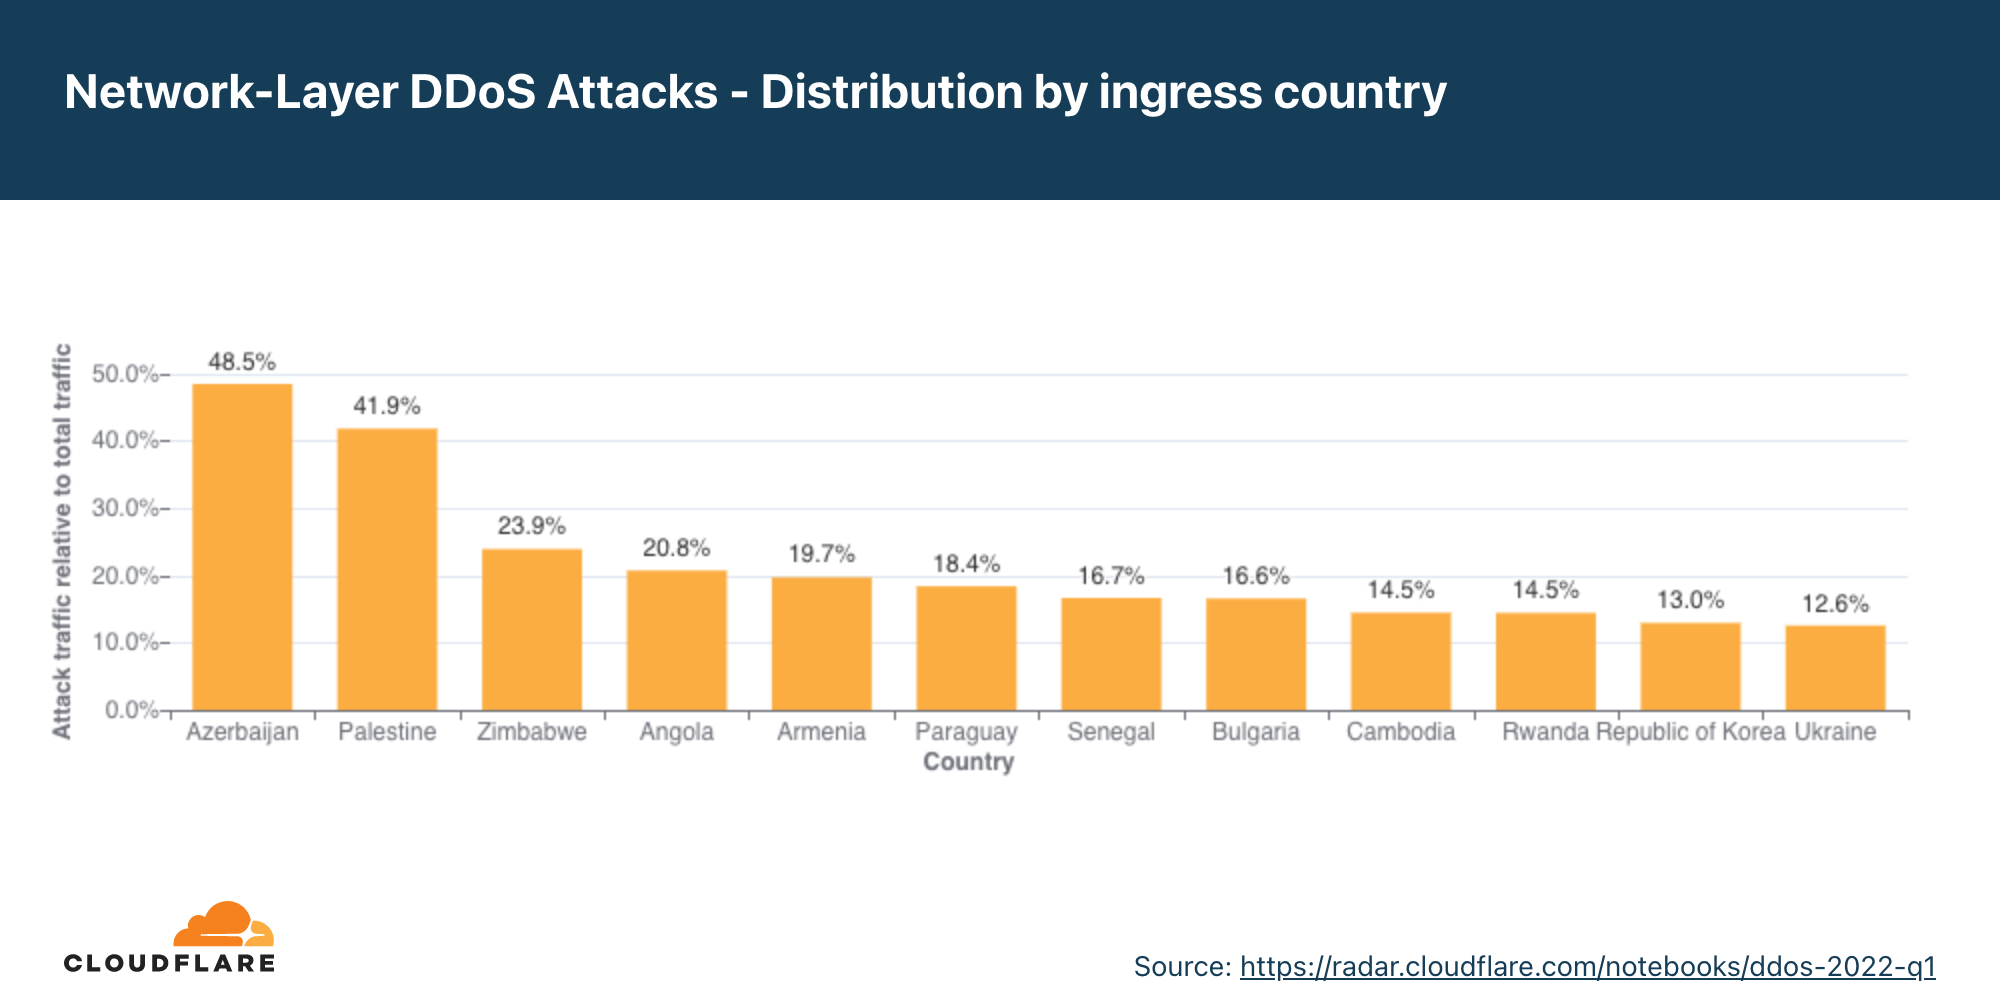
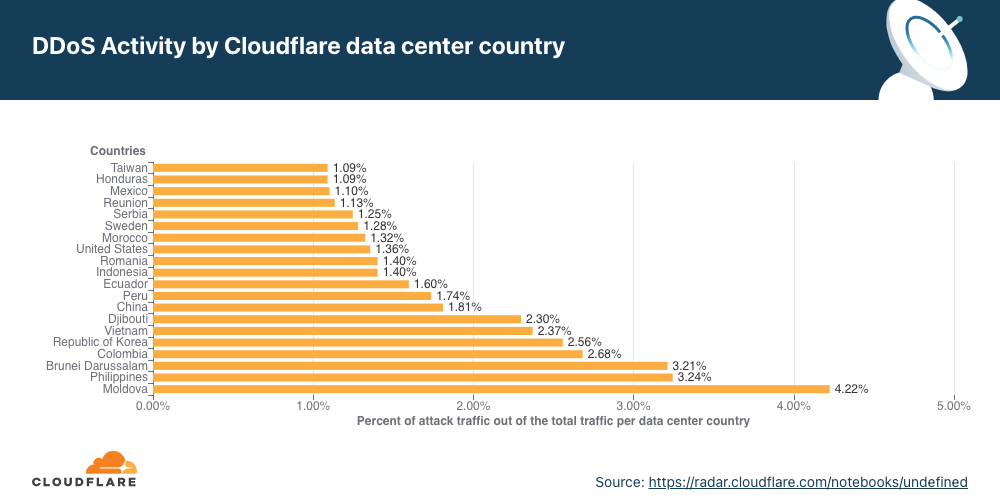
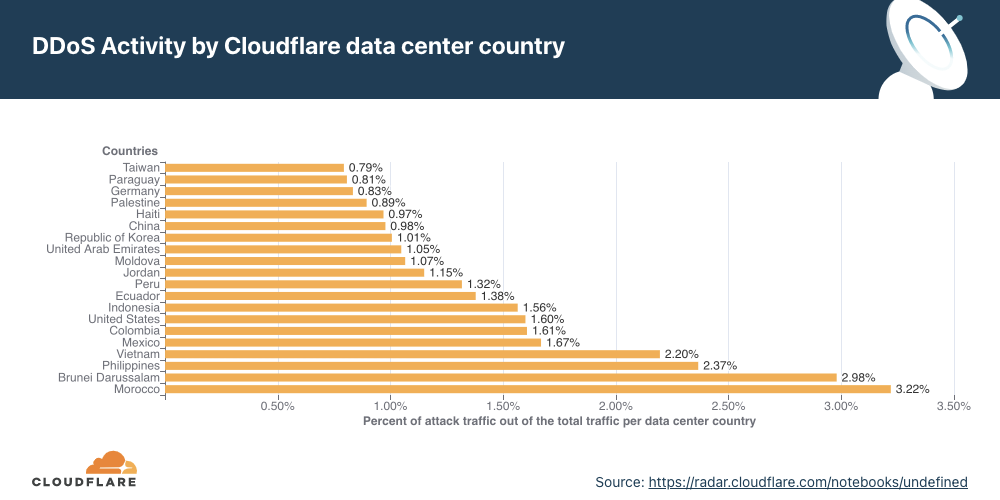
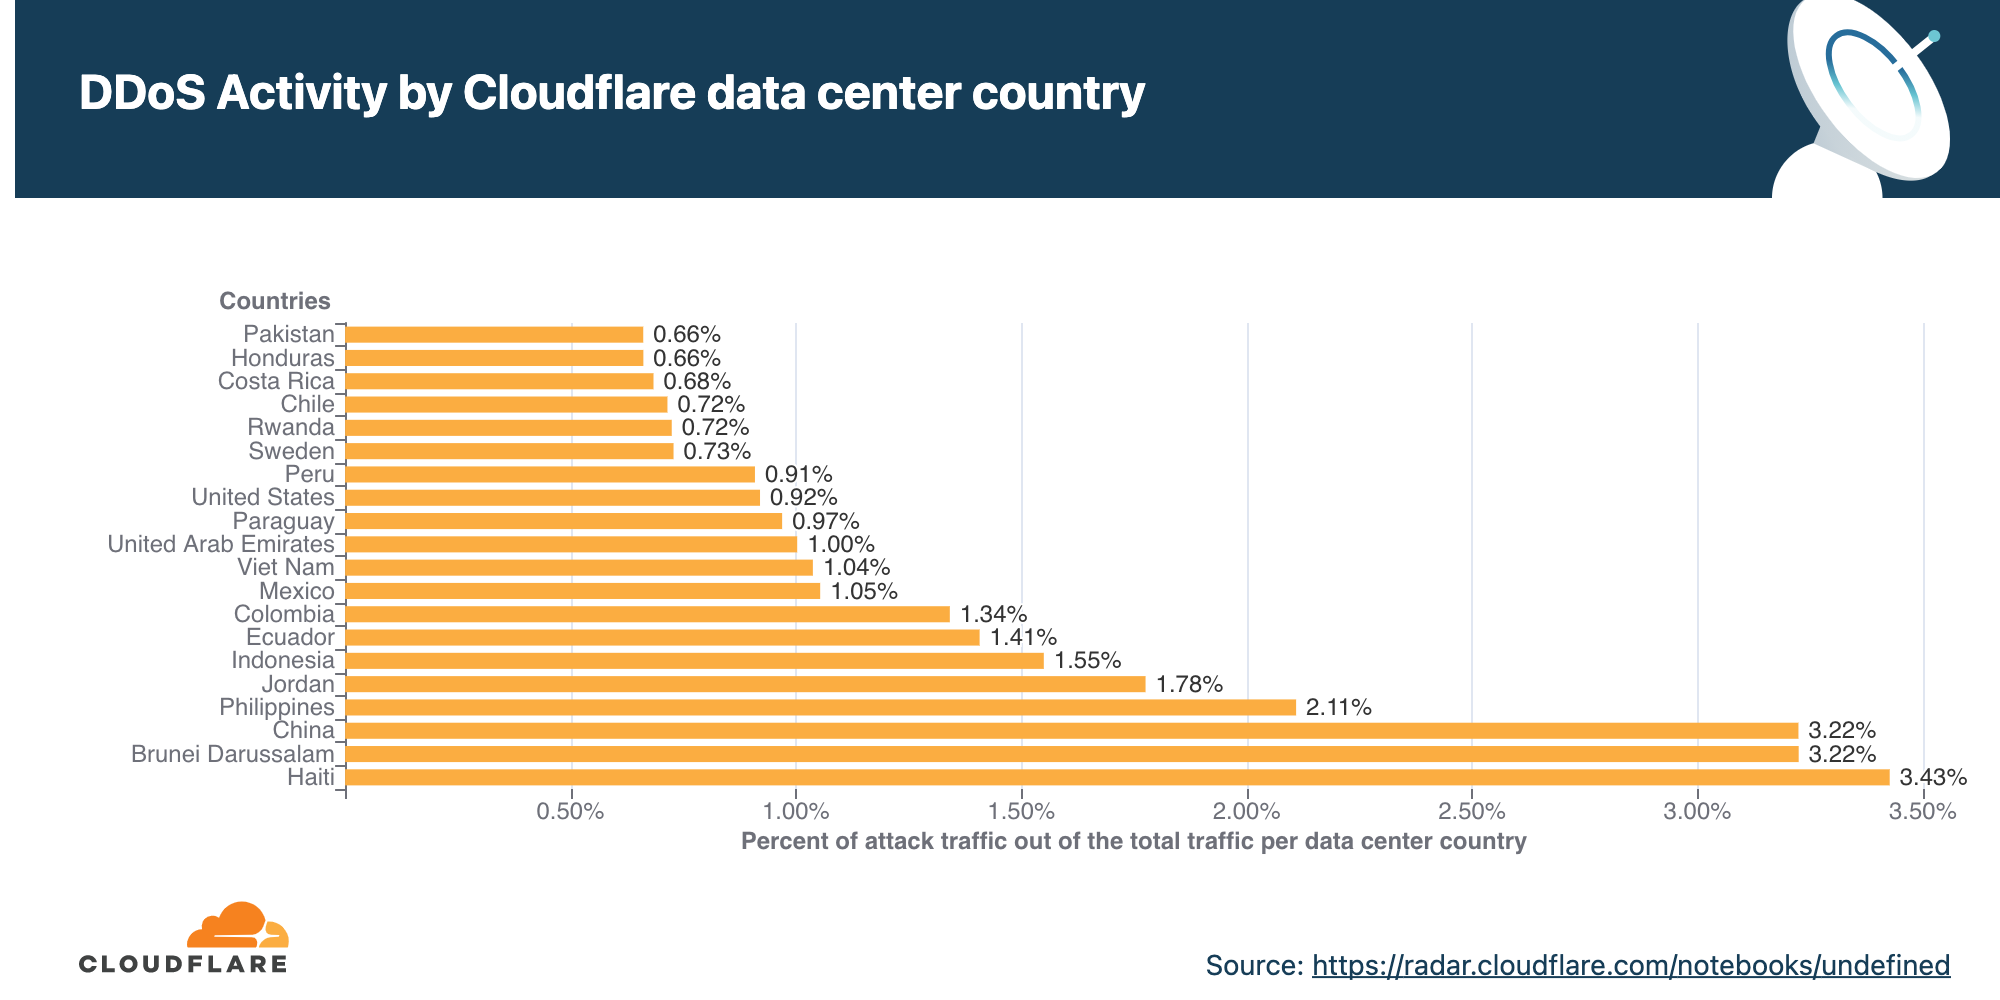
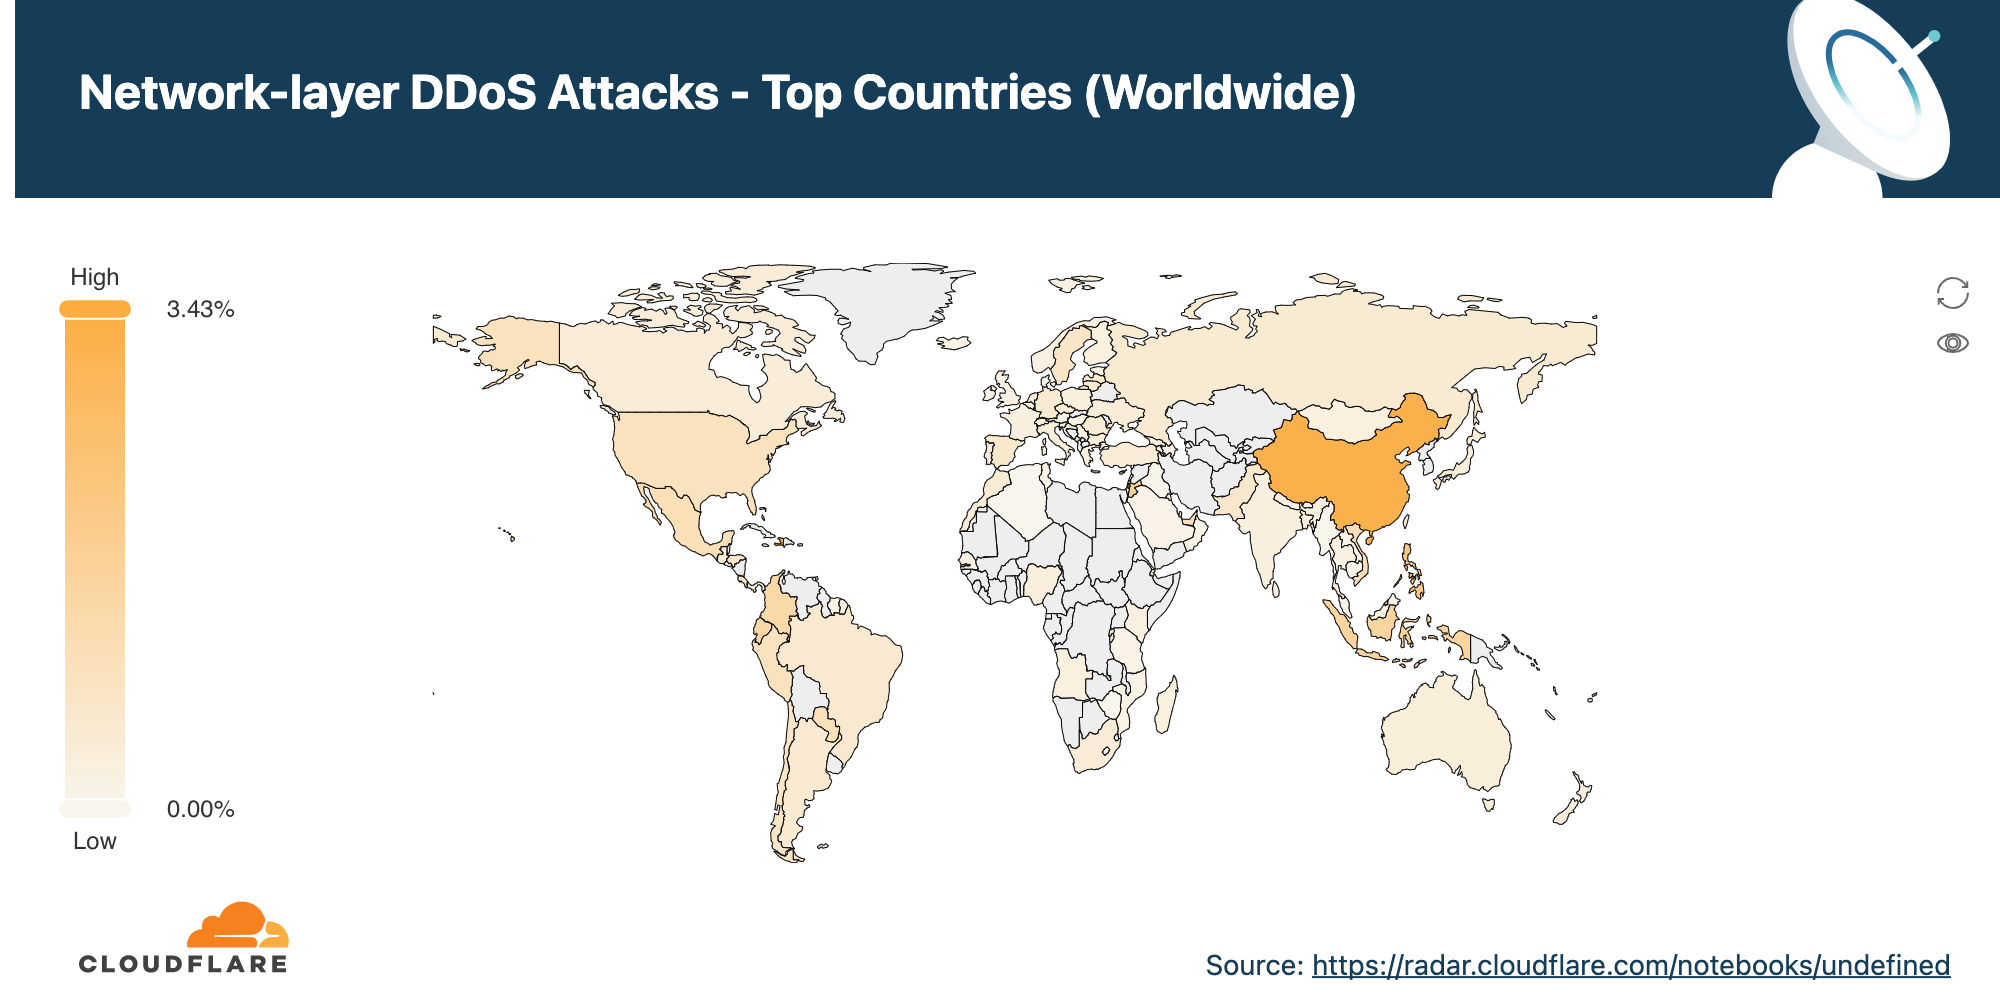
Network-layer DDoS attacks by ingress country
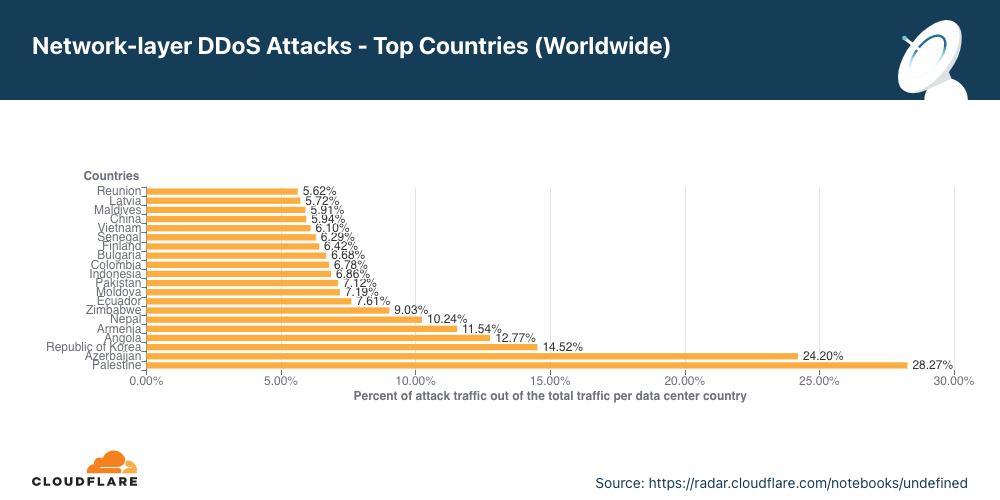
In Q2, almost a third of the traffic Cloudflare observed in Palestine and a fourth in Azerbaijan was part of a network-layer DDoS attack.
When trying to understand where network-layer DDoS attacks originate, we cannot use the same method as we use for the application-layer attack analysis. To launch an application-layer DDoS attack, successful handshakes must occur between the client and the server in order to establish an HTTP/S connection. For a successful handshake to occur, the attacks cannot spoof their source IP address. While the attacker may use botnets, proxies, and other methods to obfuscate their identity, the attacking client’s source IP location does sufficiently represent the attack source of application-layer DDoS attacks.
On the other hand, to launch network-layer DDoS attacks, in most cases, no handshake is needed. Attackers can spoof the source IP address in order to obfuscate the attack source and introduce randomness into the attack properties, which can make it harder for simple DDoS protection systems to block the attack. So if we were to derive the source country based on a spoofed source IP, we would get a ‘spoofed country’.
For this reason, when analyzing network-layer DDoS attack sources, we bucket the traffic by the Cloudflare data center locations where the traffic was ingested, and not by the (potentially) spoofed source IP to get an understanding of where the attacks originate from. We are able to achieve geographical accuracy in our report because we have data centers in over 270 cities around the world. However, even this method is not 100% accurate, as traffic may be back hauled and routed via various Internet Service Providers and countries for reasons that vary from cost reduction to congestion and failure management.
Palestine jumps from the second to the first place as the Cloudflare location with the highest percentage of network-layer DDoS attacks. Following Palestine is Azerbaijan, South Korea, and Angola.
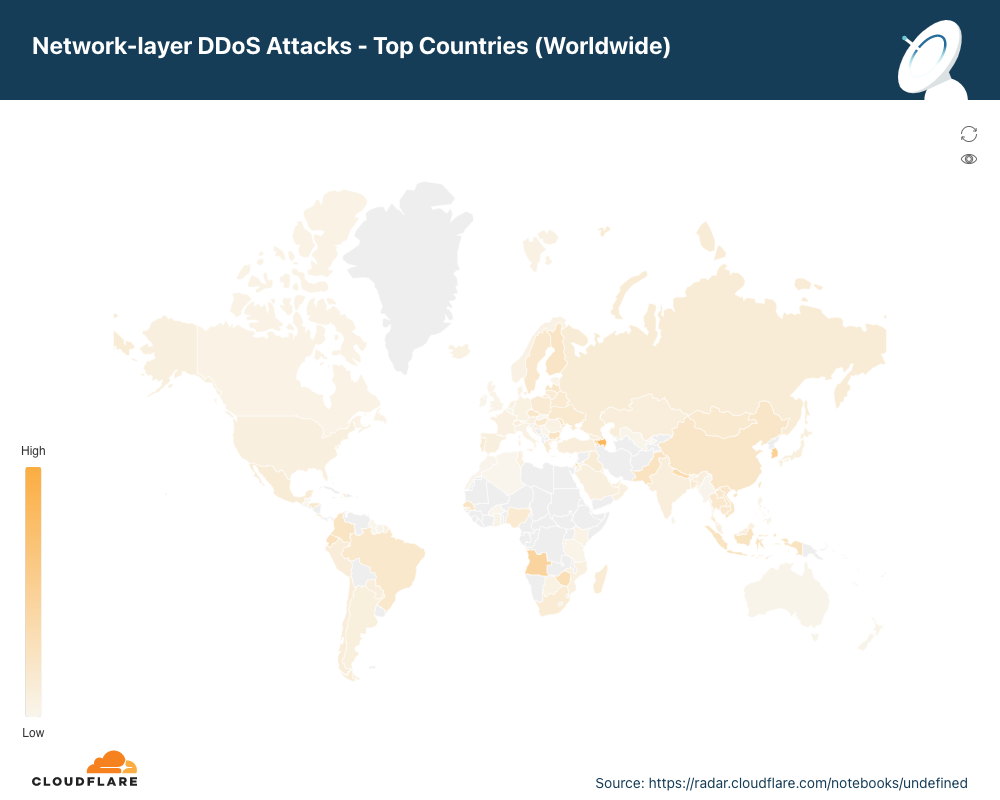
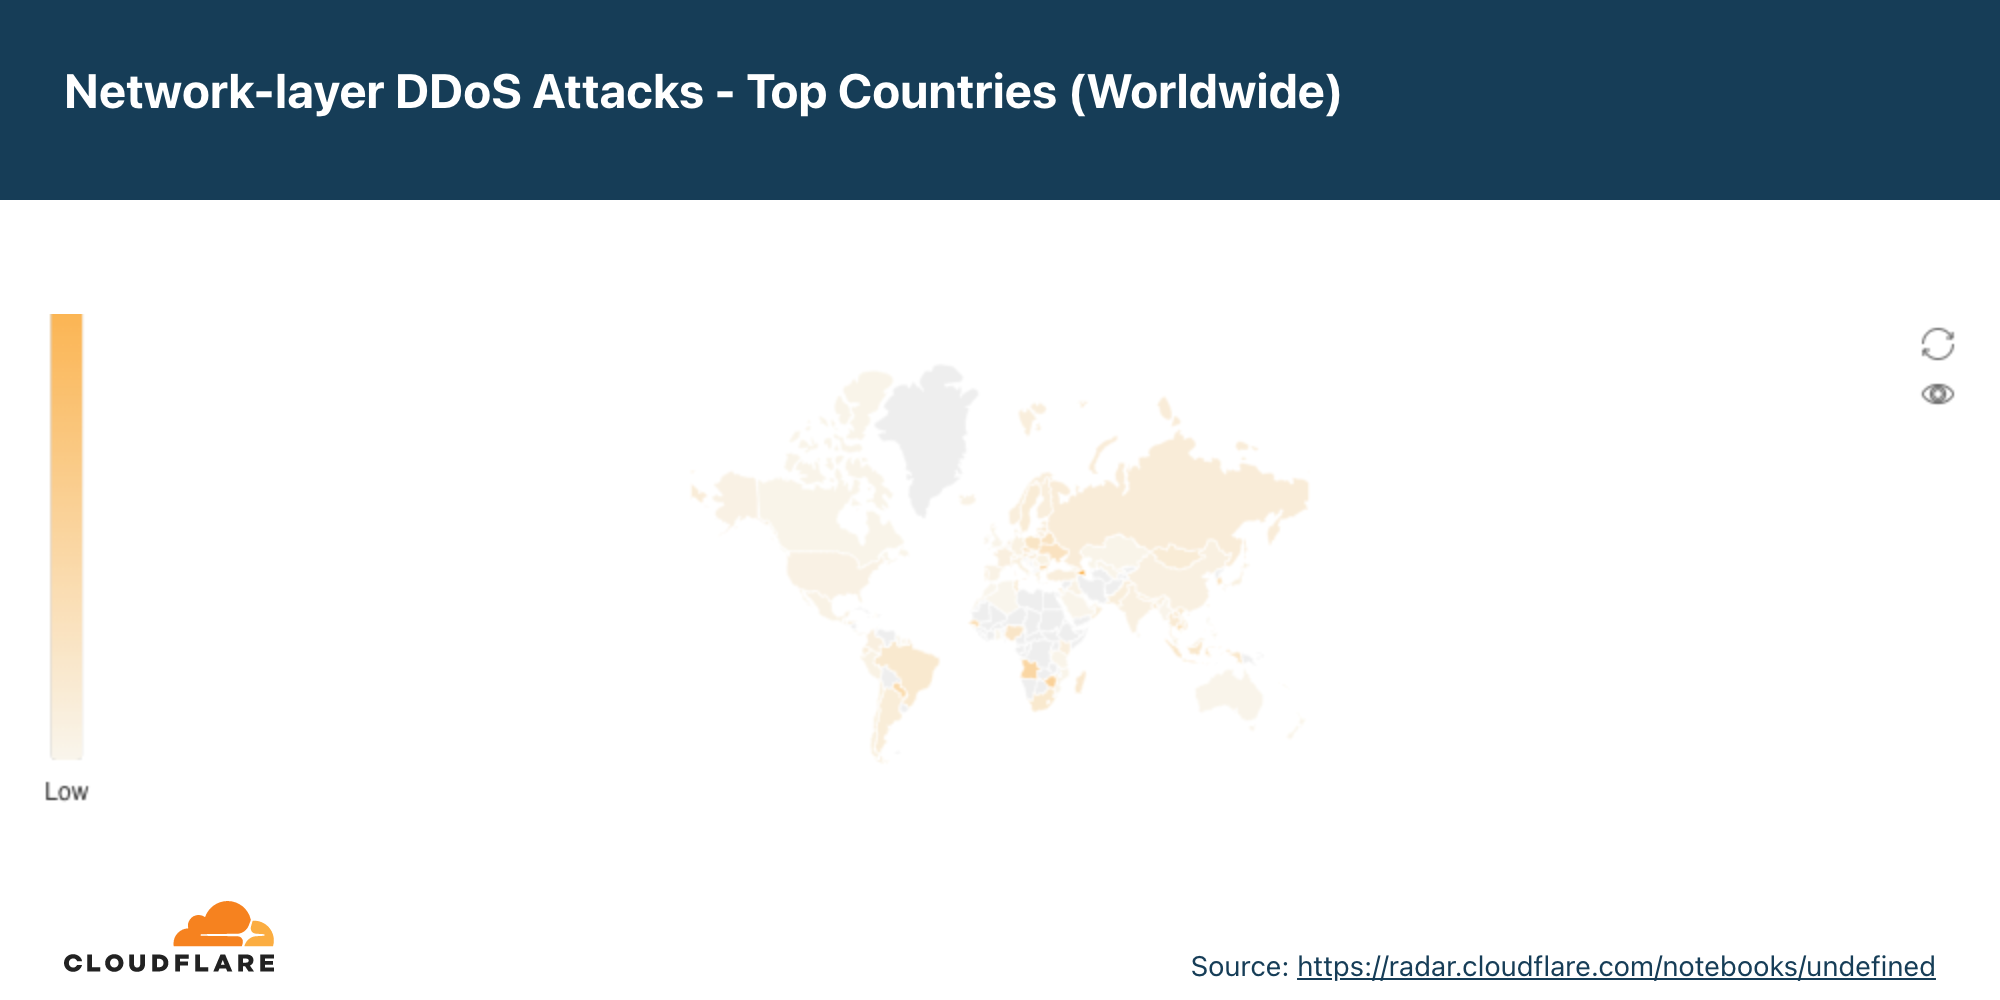
To view all regions and countries, check out the interactive map.
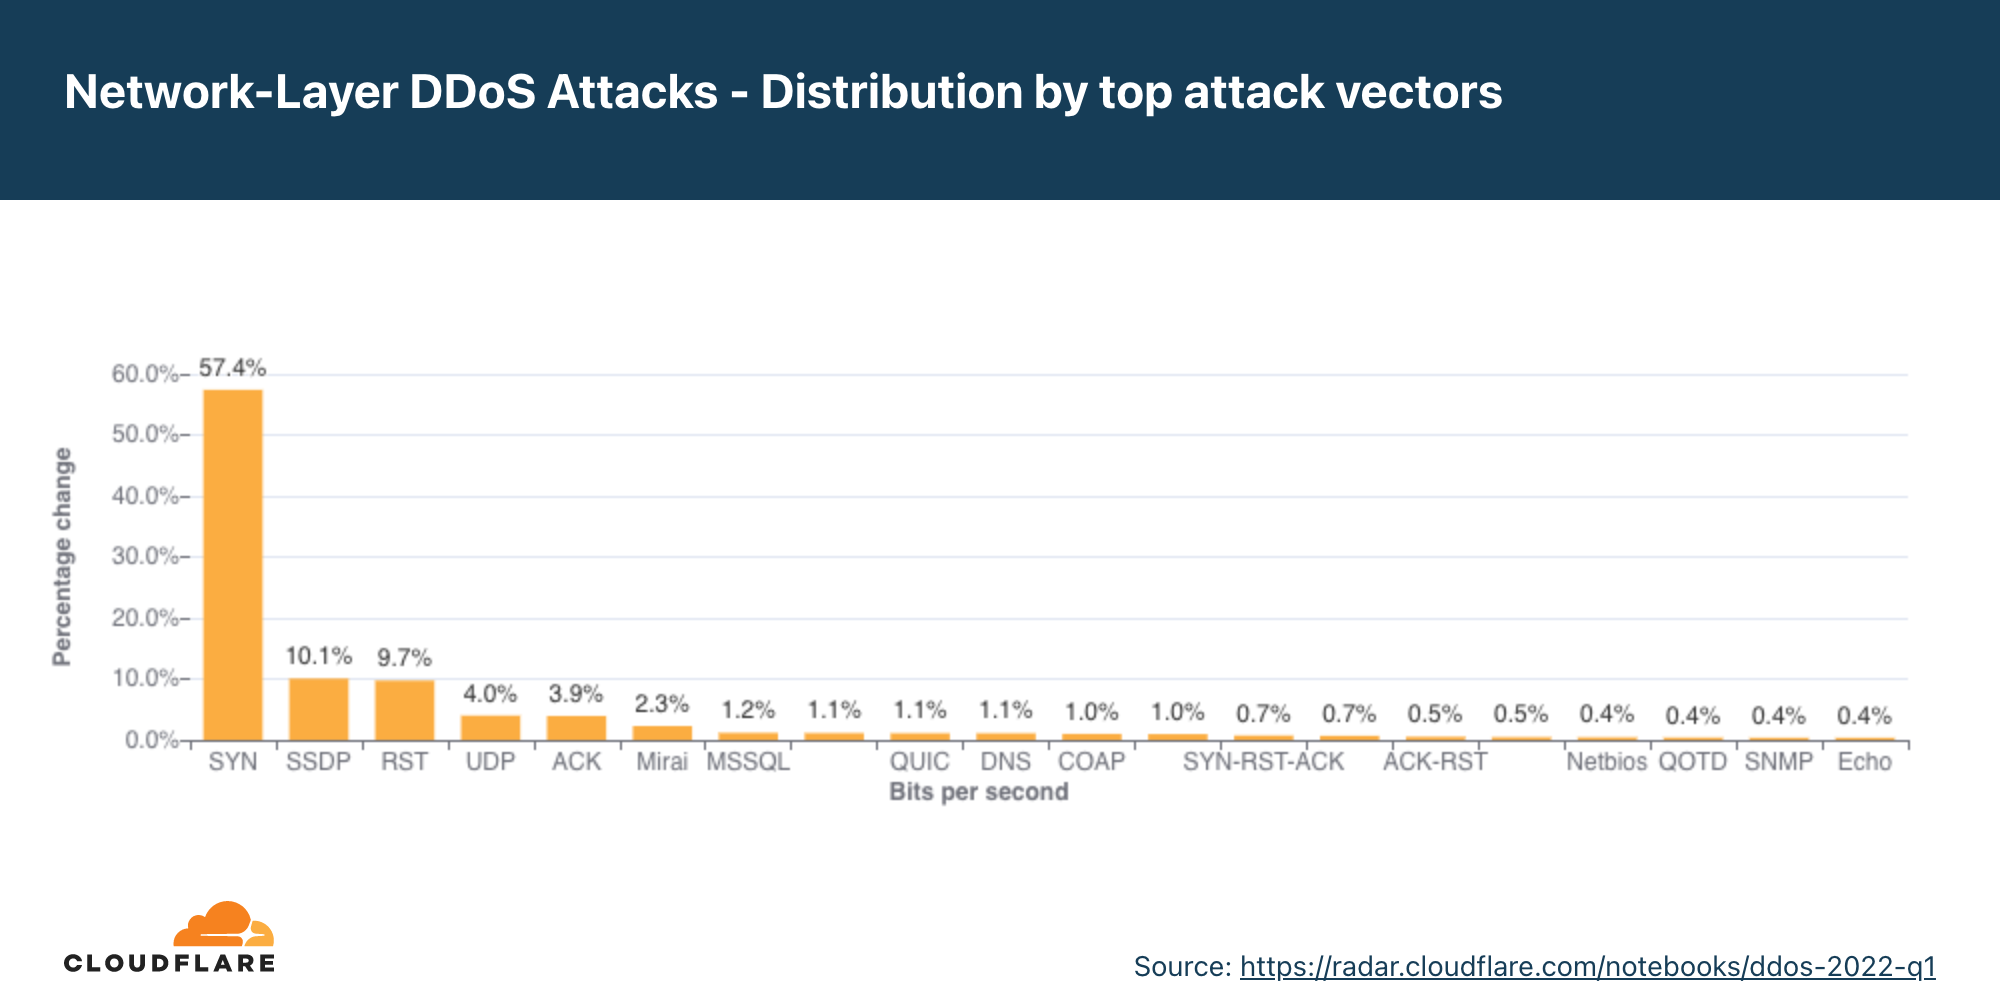
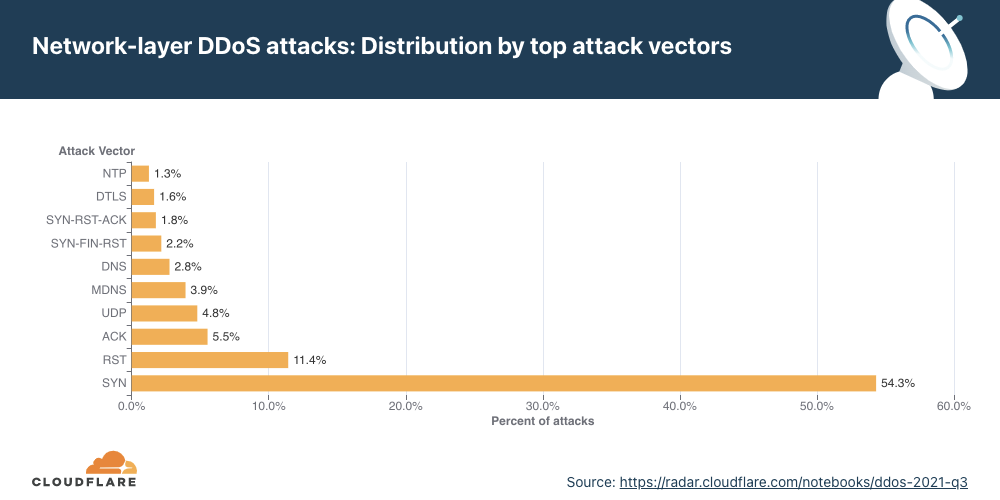
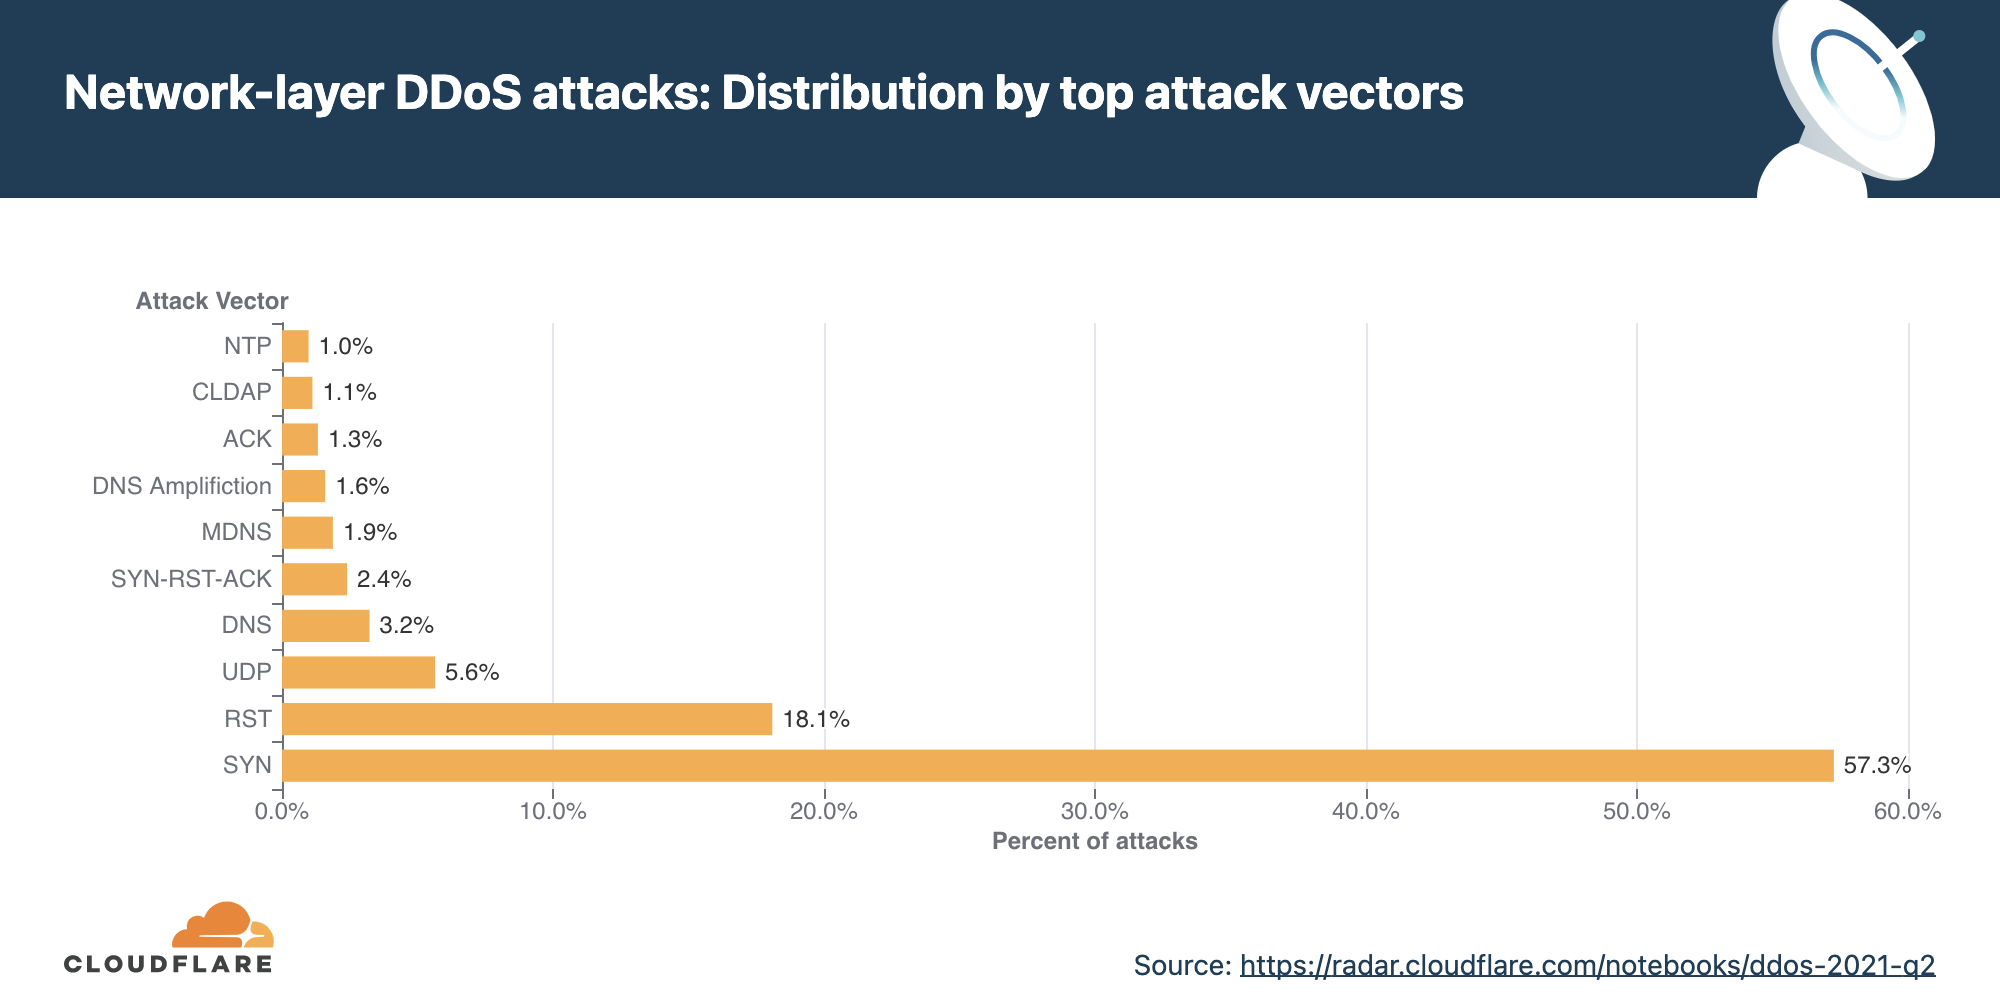
Attack vectors
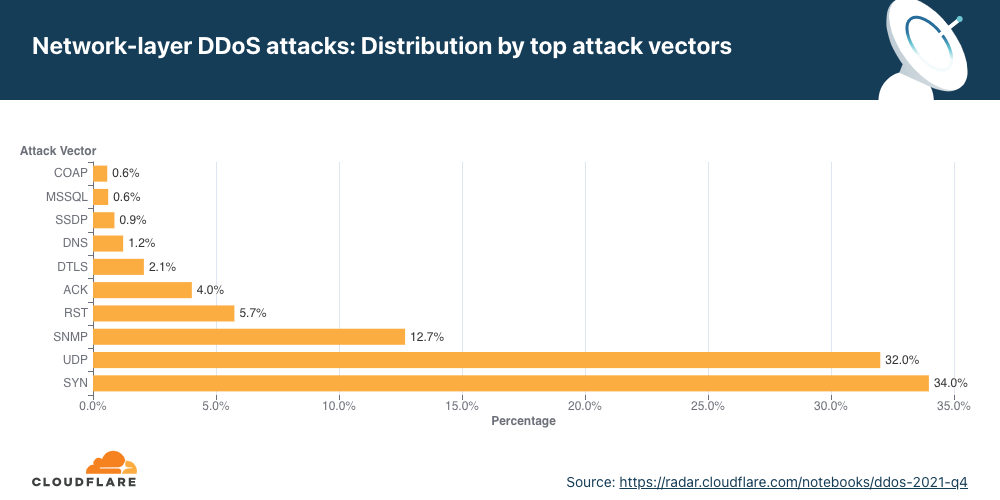
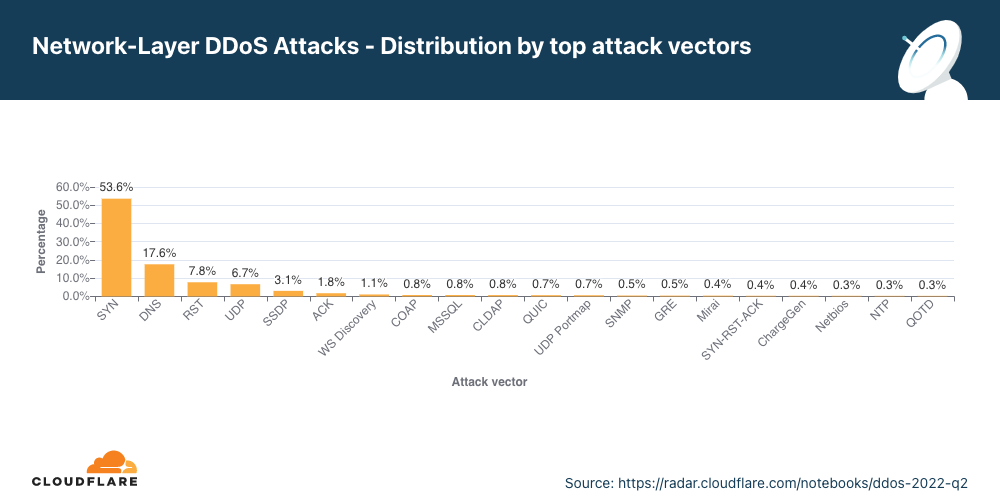
In Q2, DNS attacks increased making it the second most frequent attack vector.
An attack vector is a term used to describe the method that the attacker uses to launch their DDoS attack, i.e., the IP protocol, packet attributes such as TCP flags, flooding method, and other criteria.
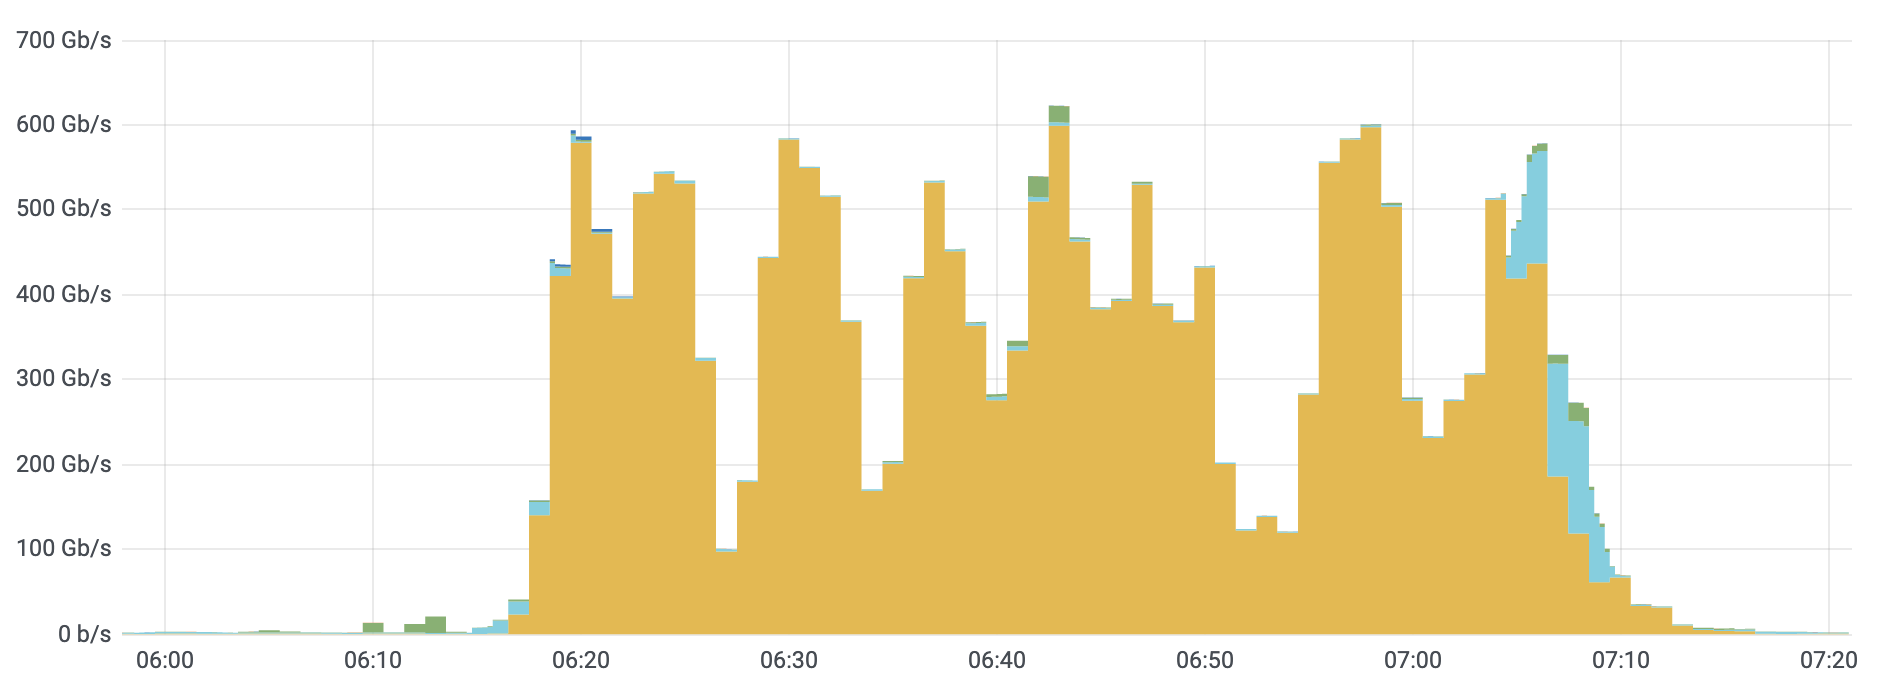
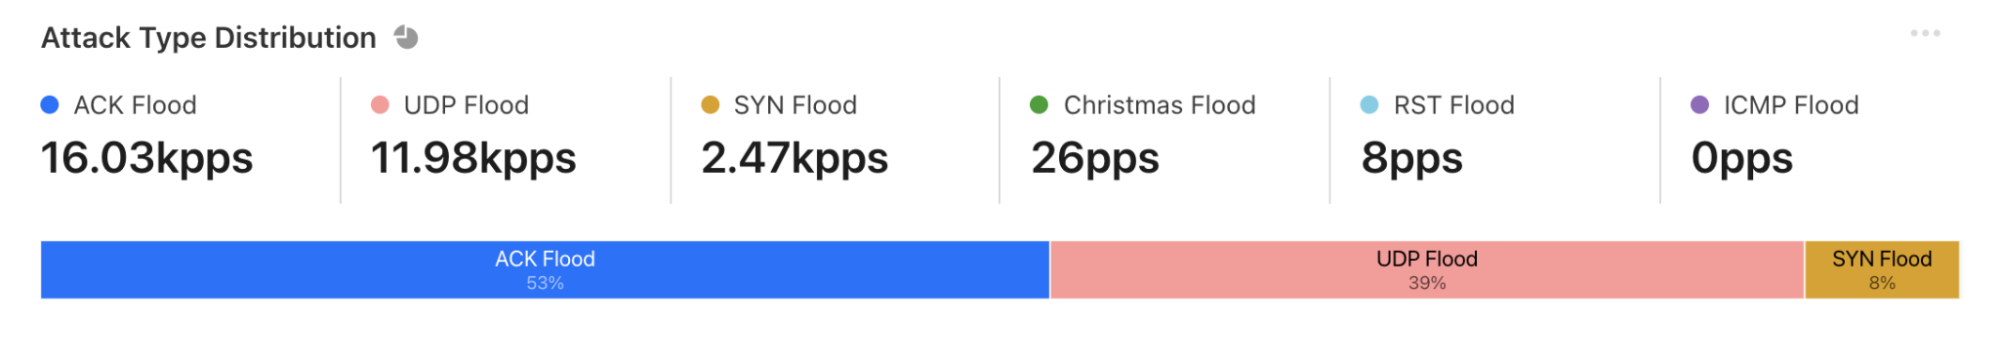
In Q2, 53% of all network-layer attacks were SYN floods. SYN floods remain the most popular attack vector. They abuse the initial connection request of the stateful TCP handshake. During this initial connection request, servers don’t have any context about the TCP connection as it is new and without the proper protection may find it hard to mitigate a flood of initial connection requests. This makes it easier for the attacker to consume an unprotected server’s resources.
After the SYN floods are attacks targeting DNS infrastructure, RST floods again abusing TCP connection flow, and generic attacks over UDP.
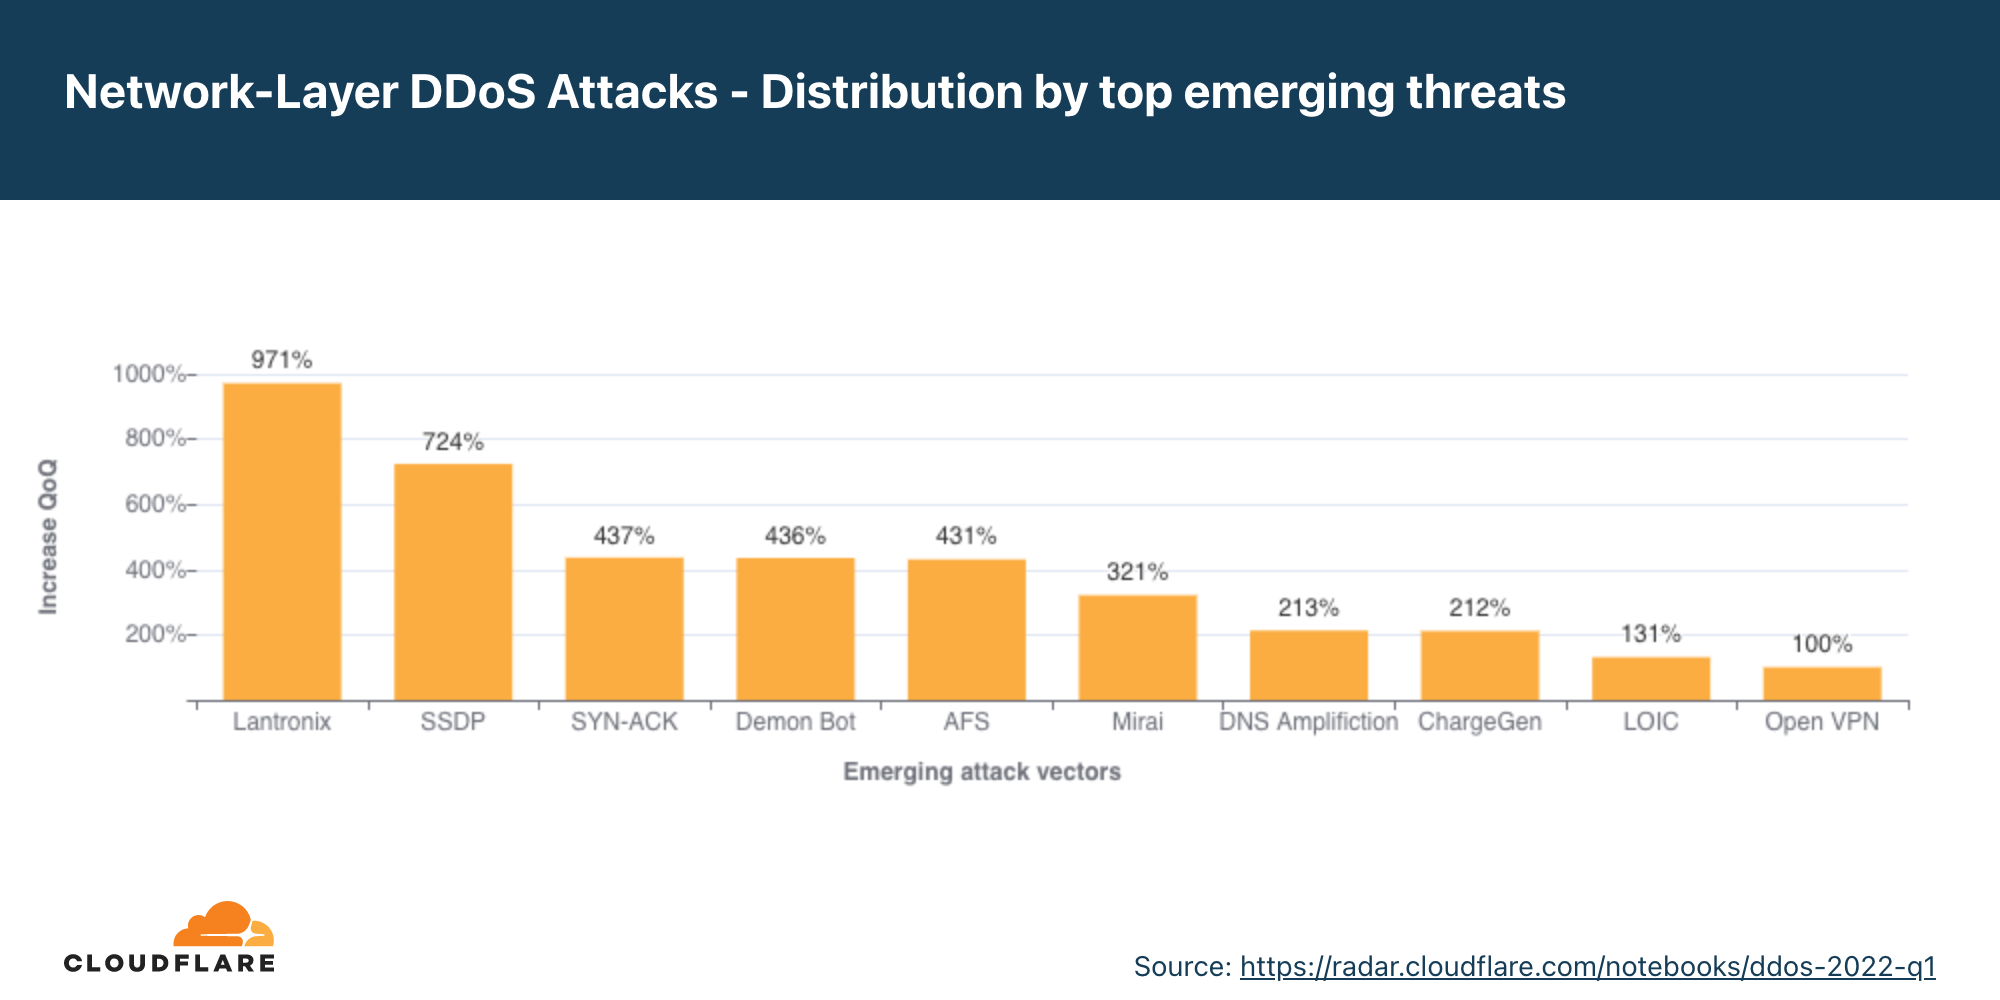
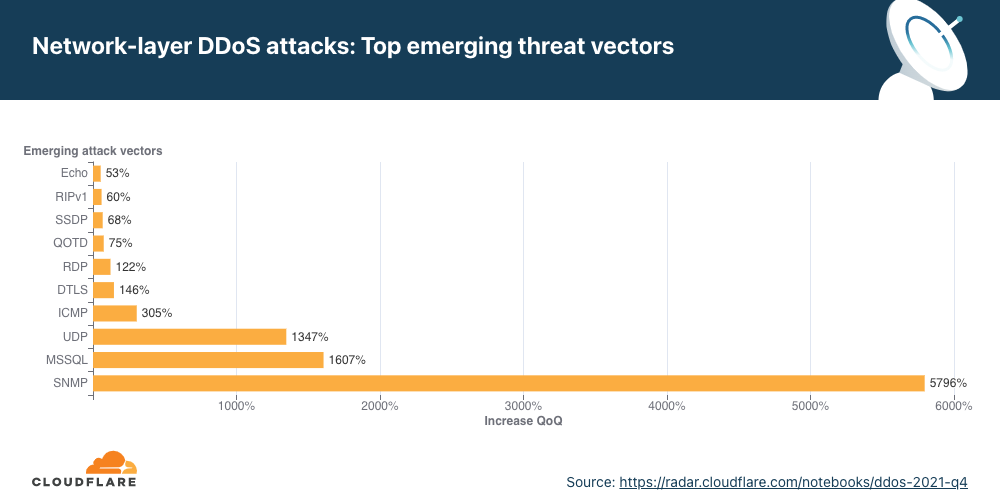
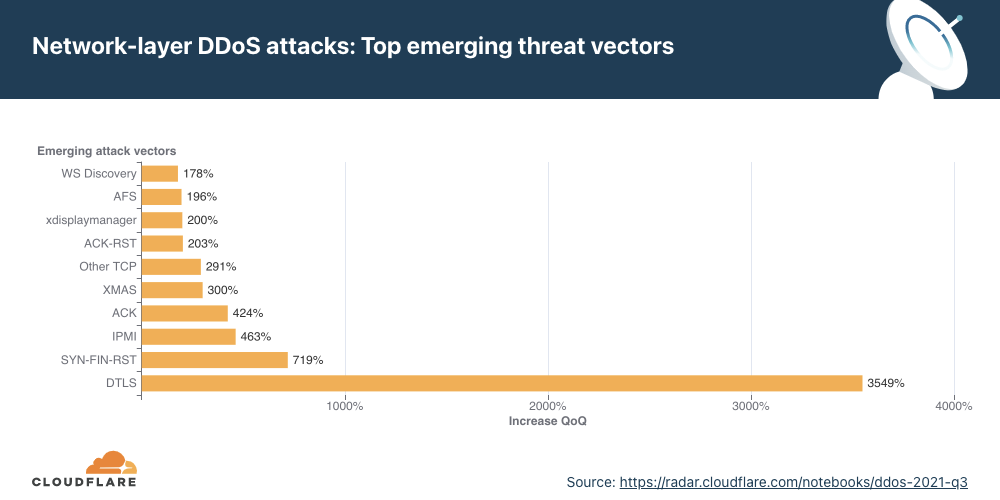
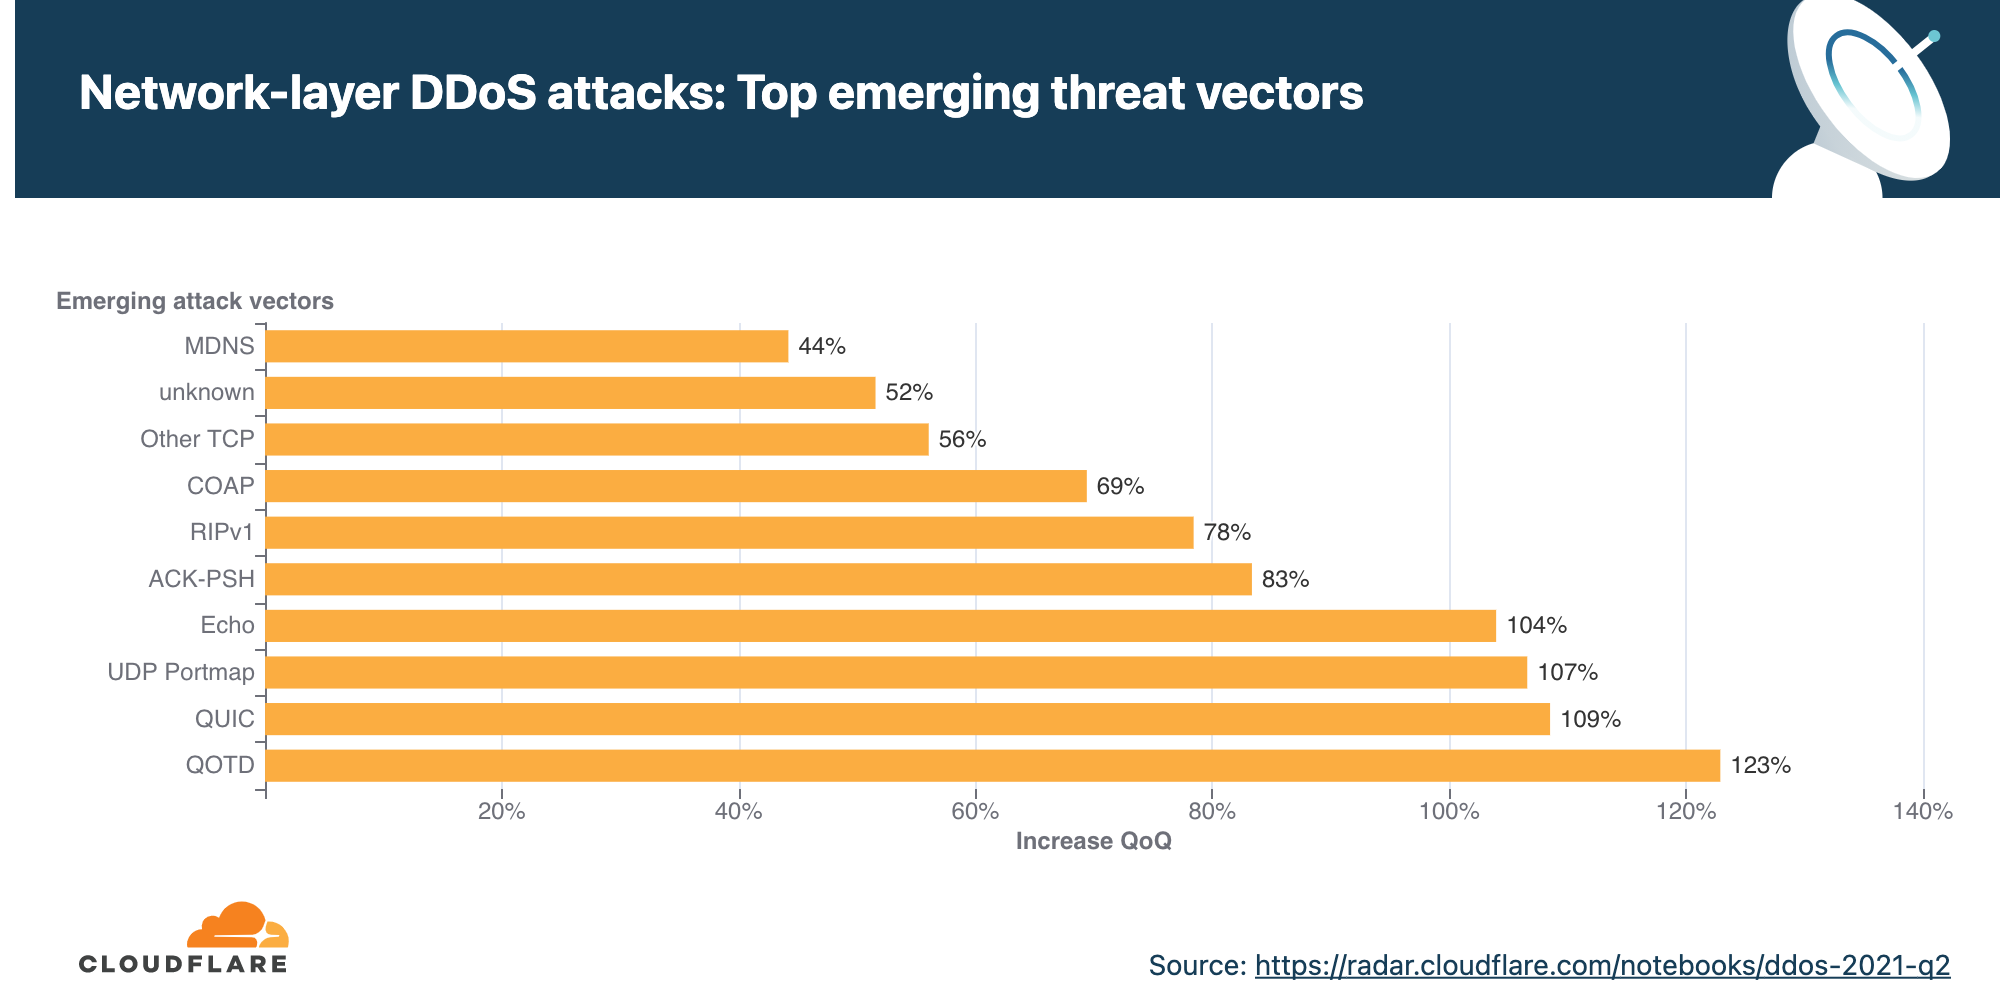
Emerging threats
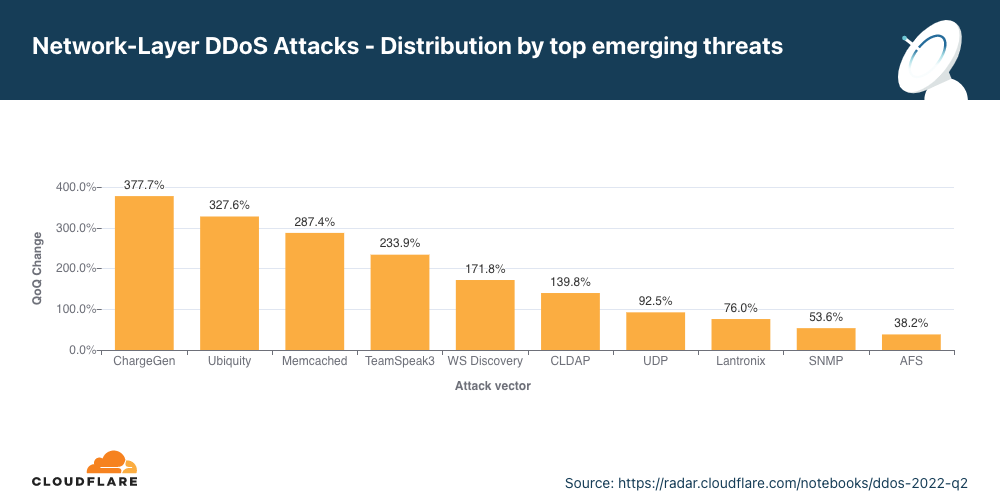
In Q2, the top emerging threats included attacks over CHARGEN, Ubiquiti and Memcached.
Identifying the top attack vectors helps organizations understand the threat landscape. In turn, this may help them improve their security posture to protect against those threats. Similarly, learning about new emerging threats that may not yet account for a significant portion of attacks, can help mitigate them before they become a significant force.
In Q2, the top emerging threats were amplification attacks abusing the Character Generator Protocol (CHARGEN), amplification attacks reflecting traffic off of exposed Ubiquiti devices, and the notorious Memcached attack.
Abusing the CHARGEN protocol to launch amplification attacks
In Q2, attacks abusing the CHARGEN protocol increased by 378% QoQ.
Initially defined in RFC 864 (1983), the Character Generator (CHARGEN) protocol is a service of the Internet Protocol Suite that does exactly what it says it does – it generates characters arbitrarily, and it doesn’t stop sending them to the client until the client closes the connection. Its original intent was for testing and debugging. However, it’s rarely used because it can so easily be abused to generate amplification/reflection attacks.
An attacker can spoof the source IP of their victim and fool supporting servers around the world to direct a stream of arbitrary characters “back” to the victim’s servers. This type of attack is amplification/reflection. Given enough simultaneous CHARGEN streams, the victim’s servers, if unprotected, would be flooded and unable to cope with legitimate traffic — resulting in a denial of service event.
Amplification attacks exploiting the Ubiquiti Discovery Protocol
In Q2, attacks over Ubiquity increased by 327% QoQ.
Ubiquiti is a US-based company that provides networking and Internet of Things (IoT) devices for consumers and businesses. Ubiquiti devices can be discovered on a network using the Ubiquiti Discovery protocol over UDP/TCP port 10001.
Similarly to the CHARGEN attack vector, here too, attackers can spoof the source IP to be the victim’s IP address and spray IP addresses that have port 10001 open. Those would then respond to the victim and essentially flood it if the volume is sufficient.
Memcached DDoS attacks
In Q2, Memcached DDoS attacks increased by 287% QoQ.
Memcached is a database caching system for speeding up websites and networks. Similarly to CHARGEN and Ubiquiti, Memcached servers that support UDP can be abused to launch amplification/reflection DDoS attacks. In this case, the attacker would request content from the caching system and spoof the victim’s IP address as the source IP in the UDP packets. The victim will be flooded with the Memcache responses which can be amplified by a factor of up to 51,200x.
Network-layer DDoS attacks by attack rate
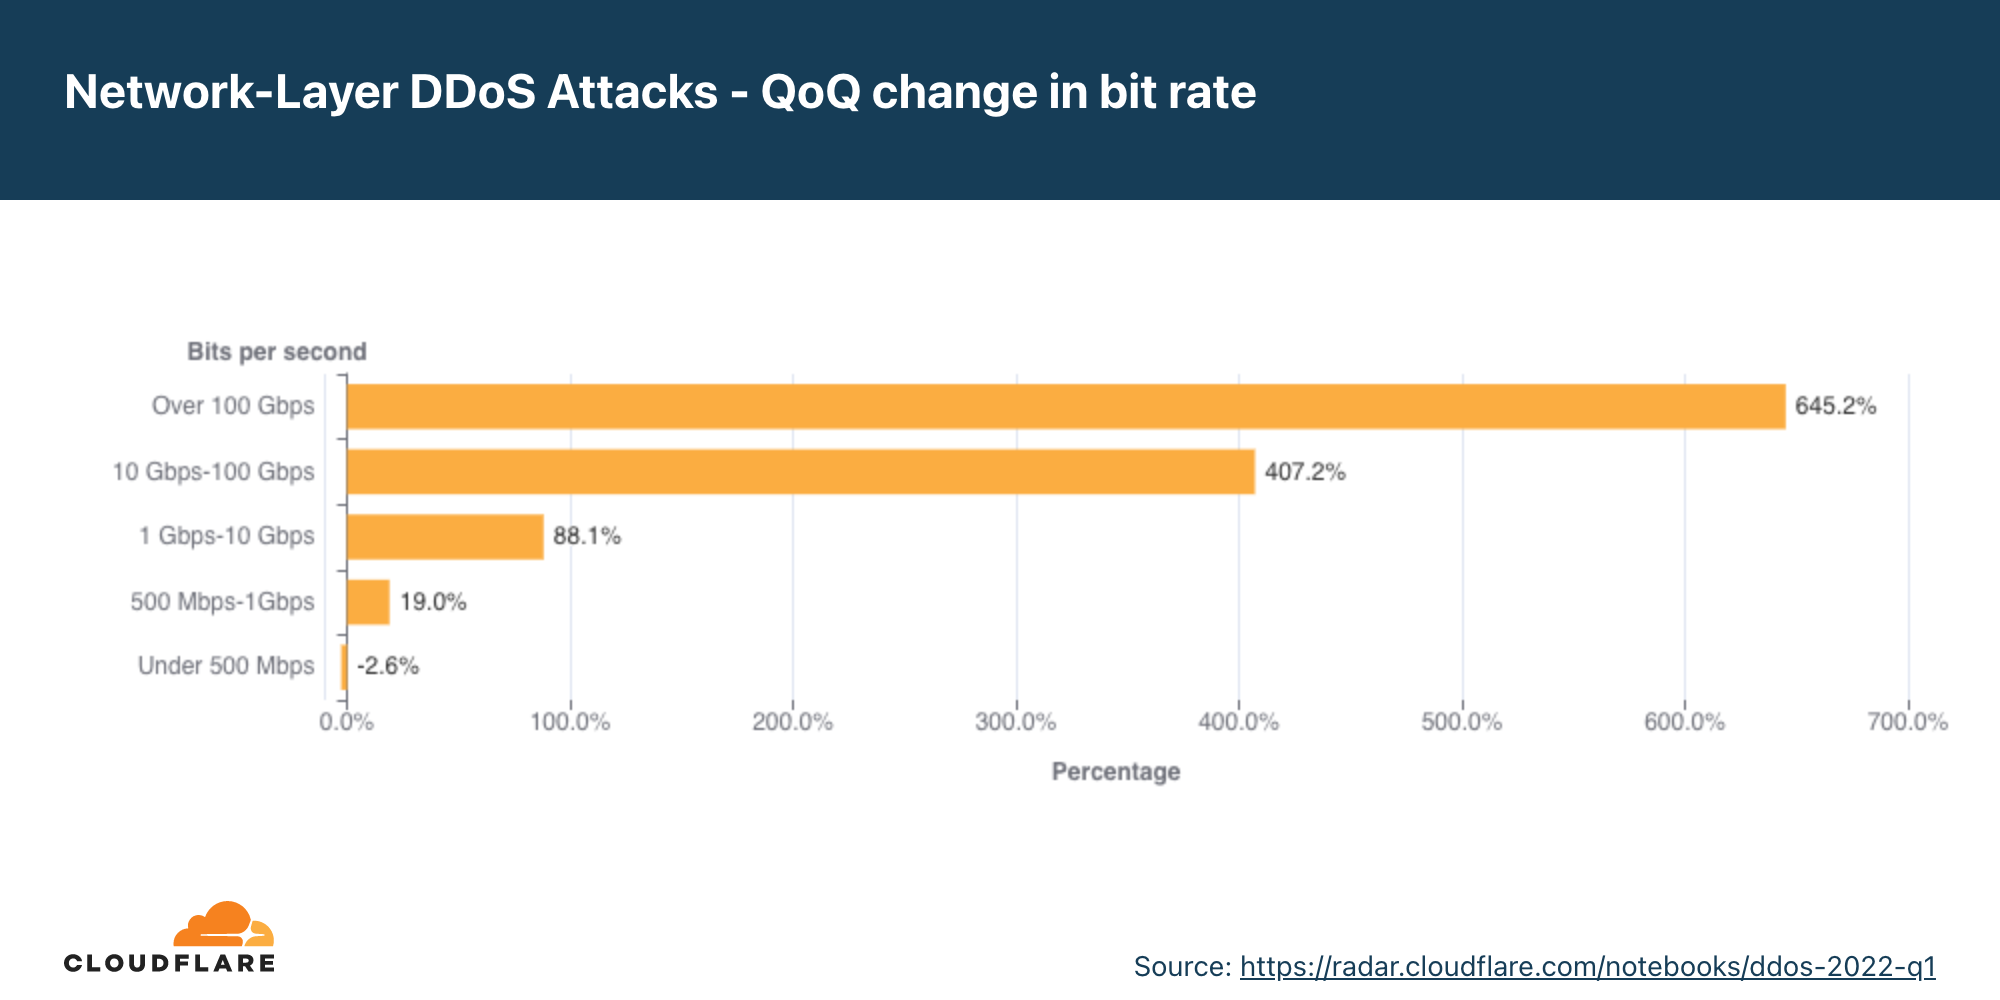
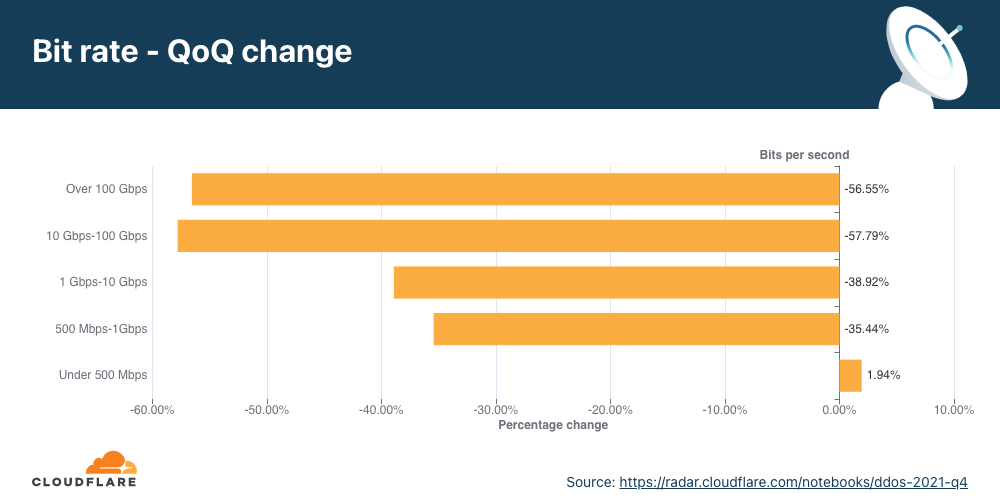
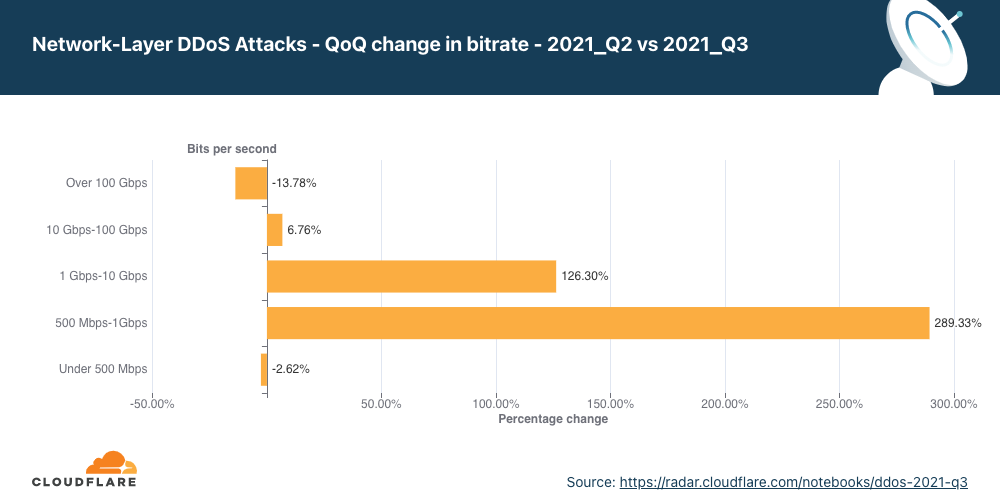
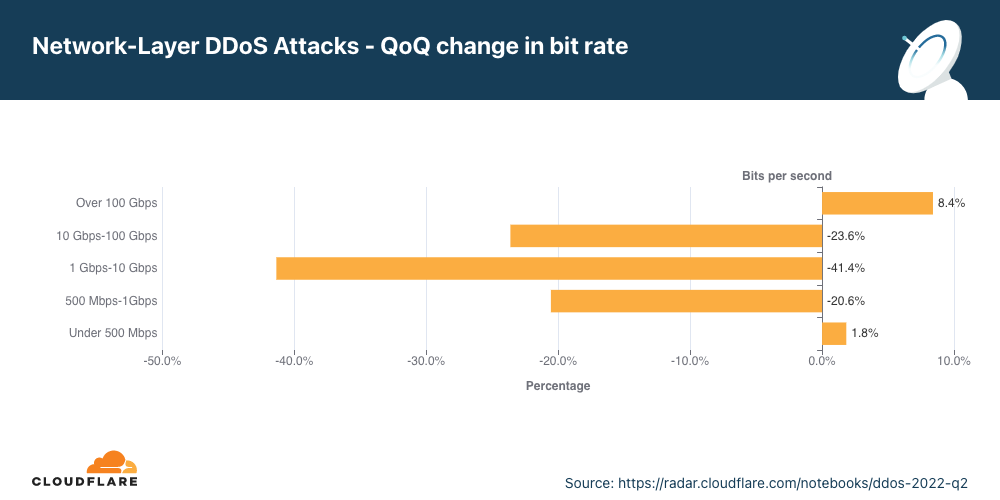
Volumetric attacks of over 100 Gbps increase by 8% QoQ.
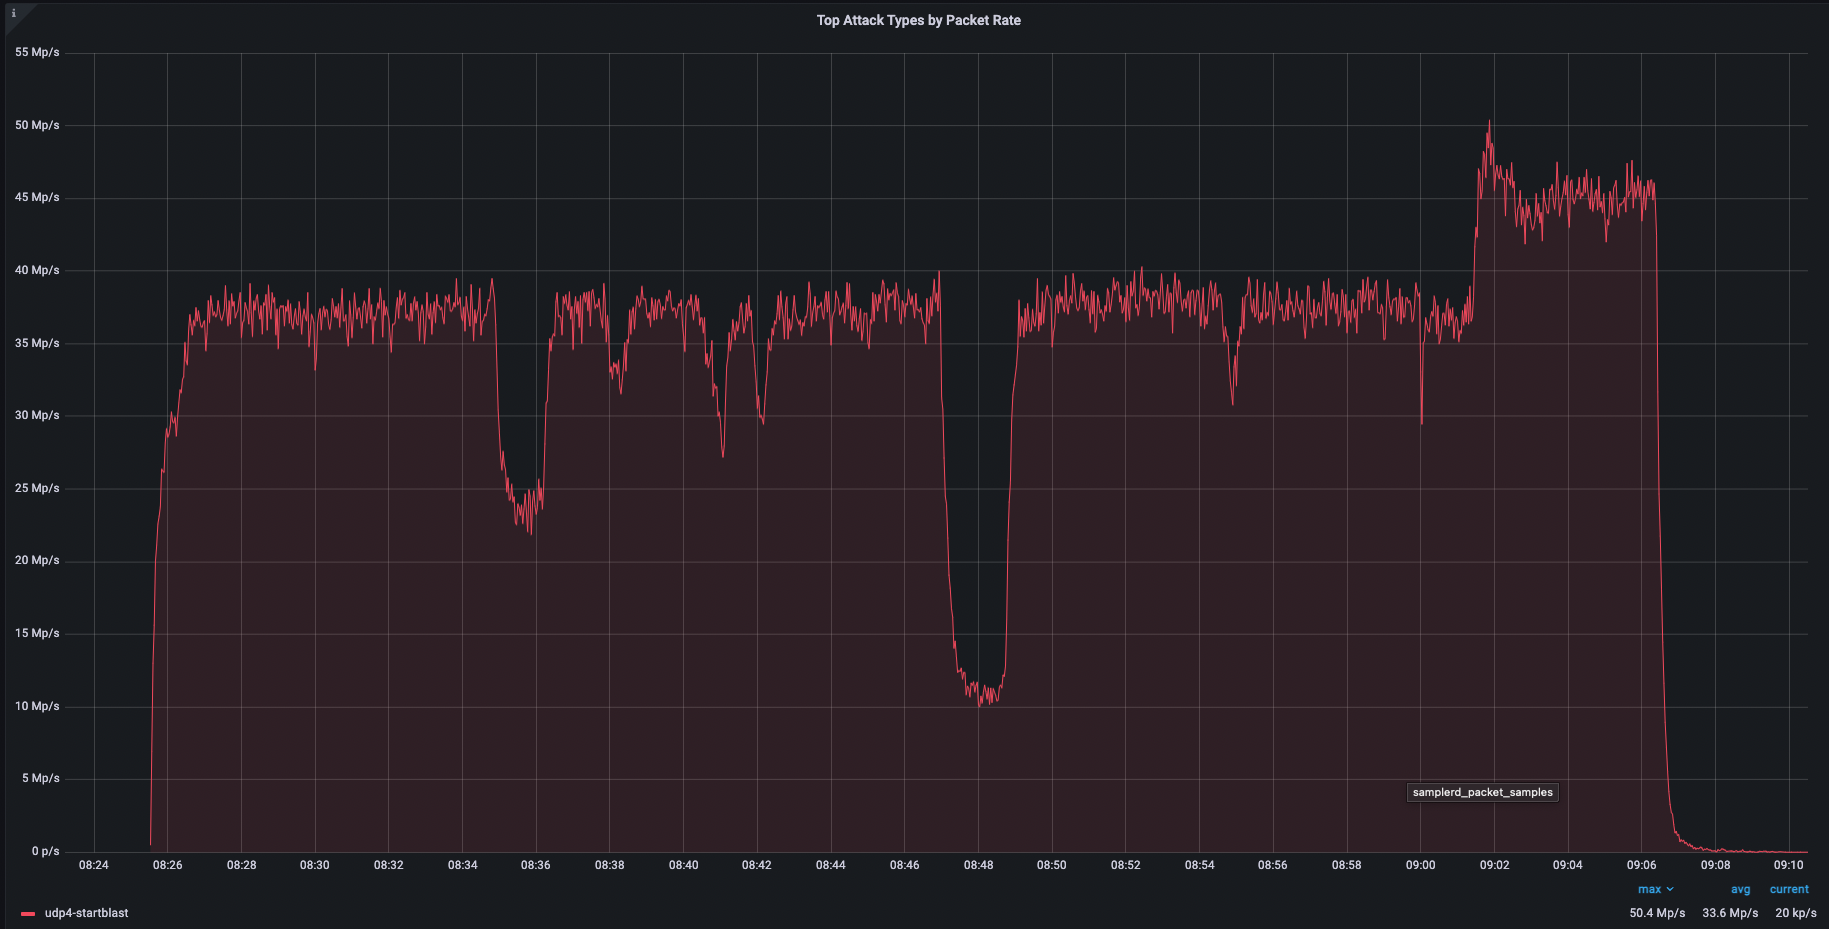
There are different ways of measuring the size of an L3/4 DDoS attack. One is the volume of traffic it delivers, measured as the bit rate (specifically, terabits per second or gigabits per second). Another is the number of packets it delivers, measured as the packet rate (specifically, millions of packets per second).
Attacks with high bit rates attempt to cause a denial-of-service event by clogging the Internet link, while attacks with high packet rates attempt to overwhelm the servers, routers, or other in-line hardware appliances. These devices dedicate a certain amount of memory and computation power to process each packet. Therefore, by bombarding it with many packets, the appliance can be left with no further processing resources. In such a case, packets are “dropped,” i.e., the appliance is unable to process them. For users, this results in service disruptions and denial of service.
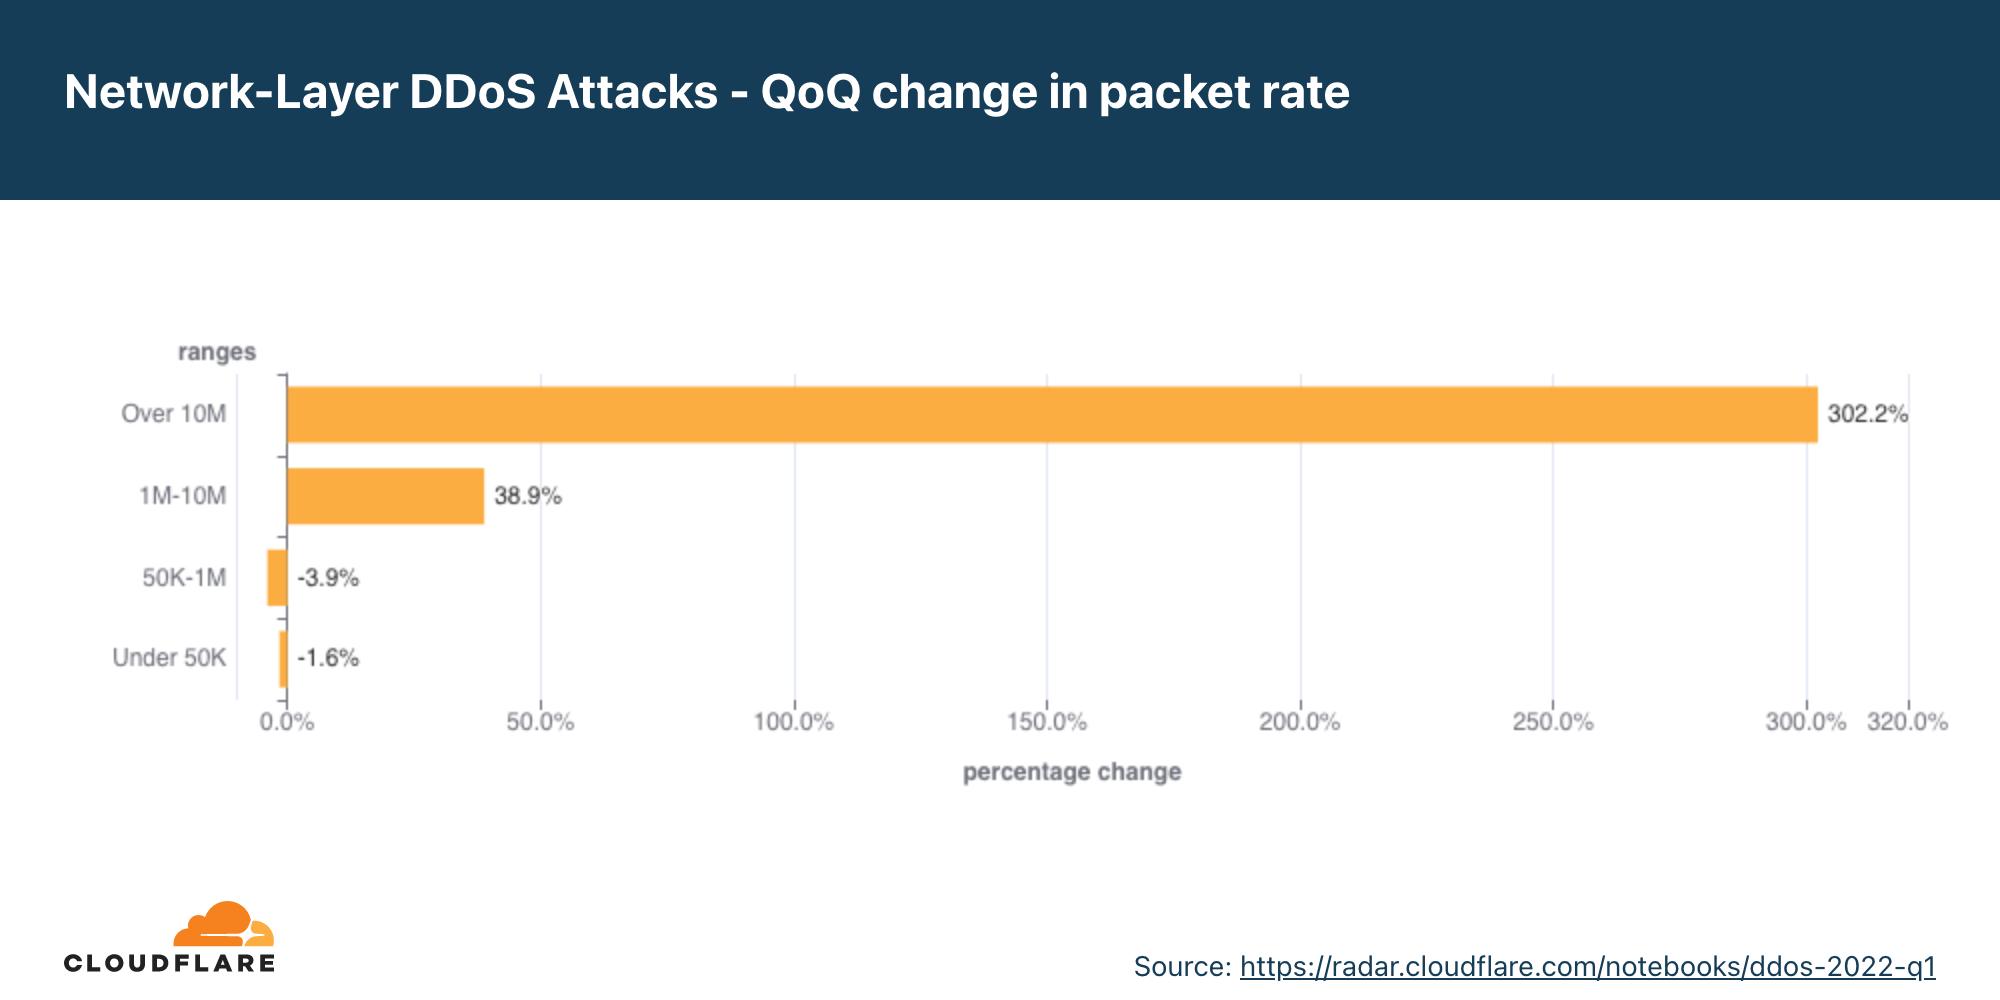
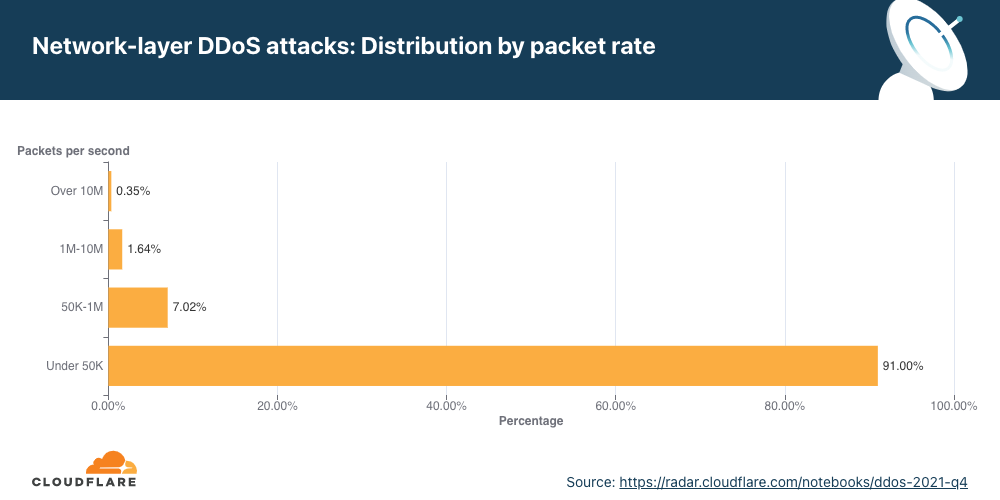
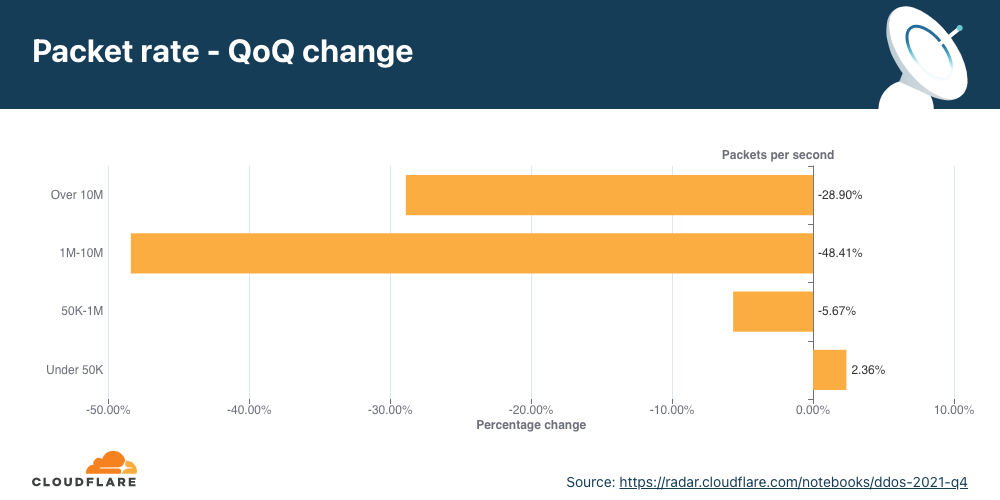
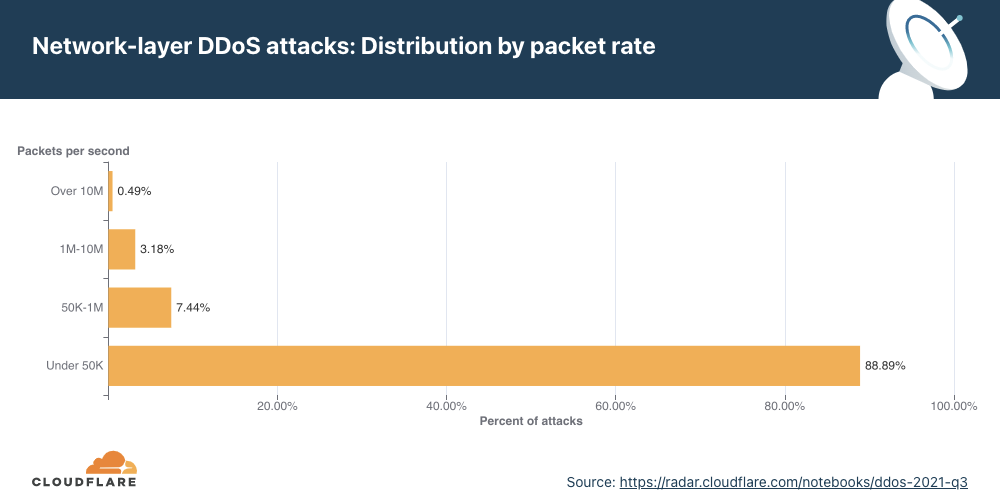
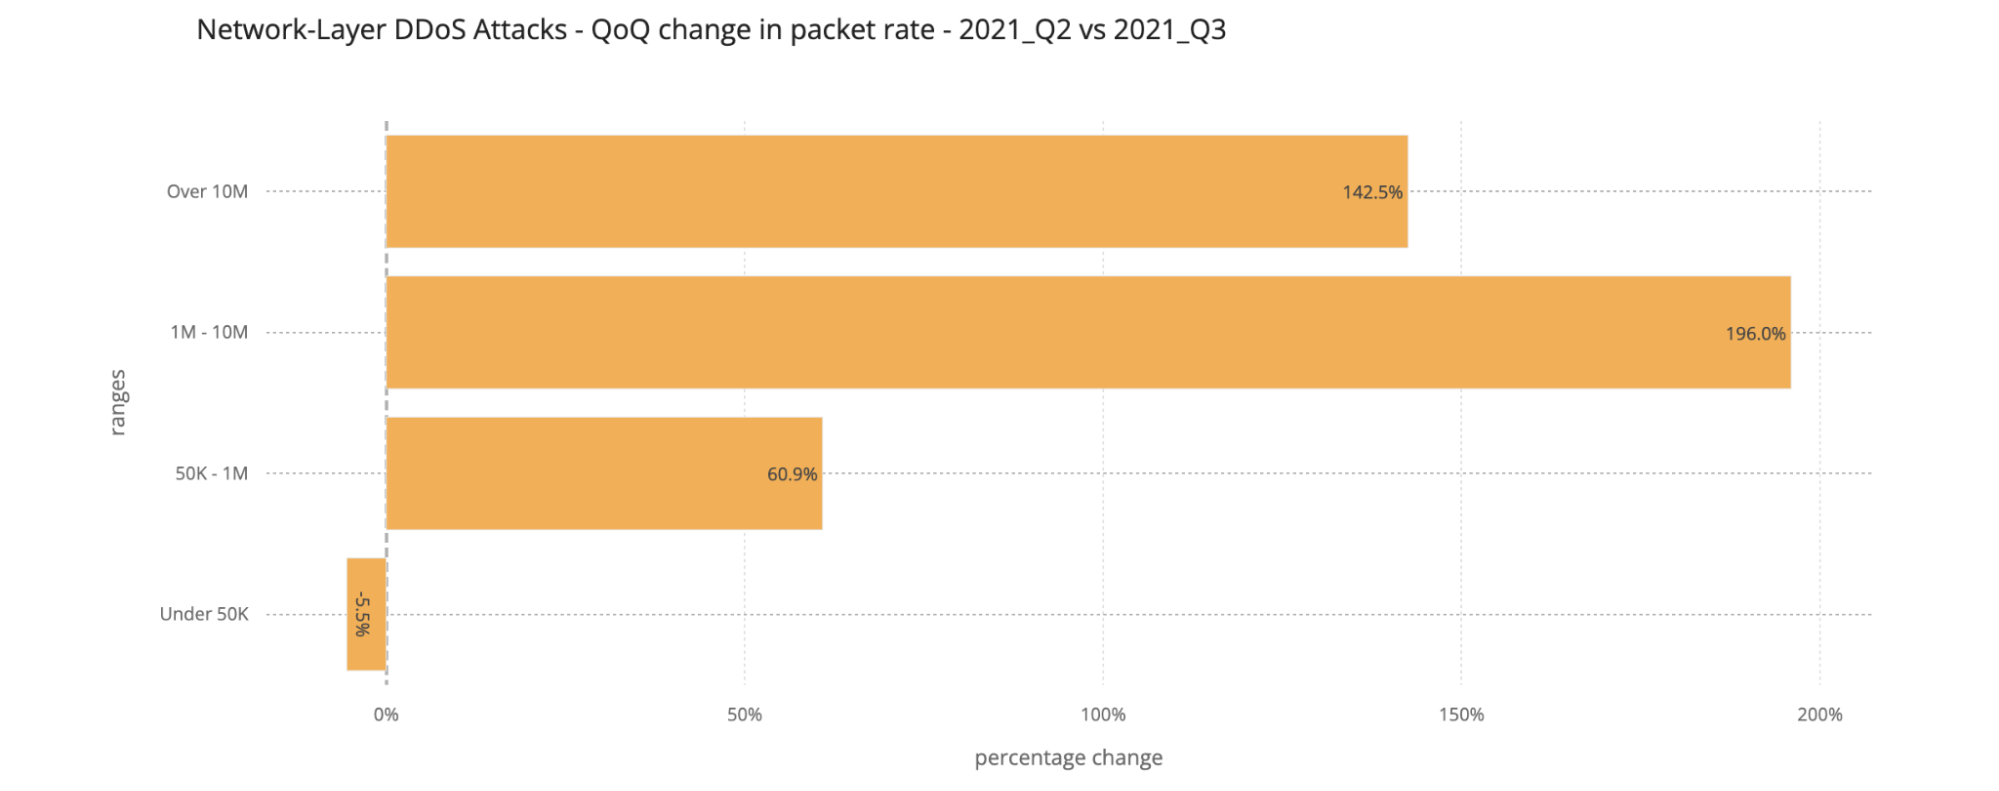
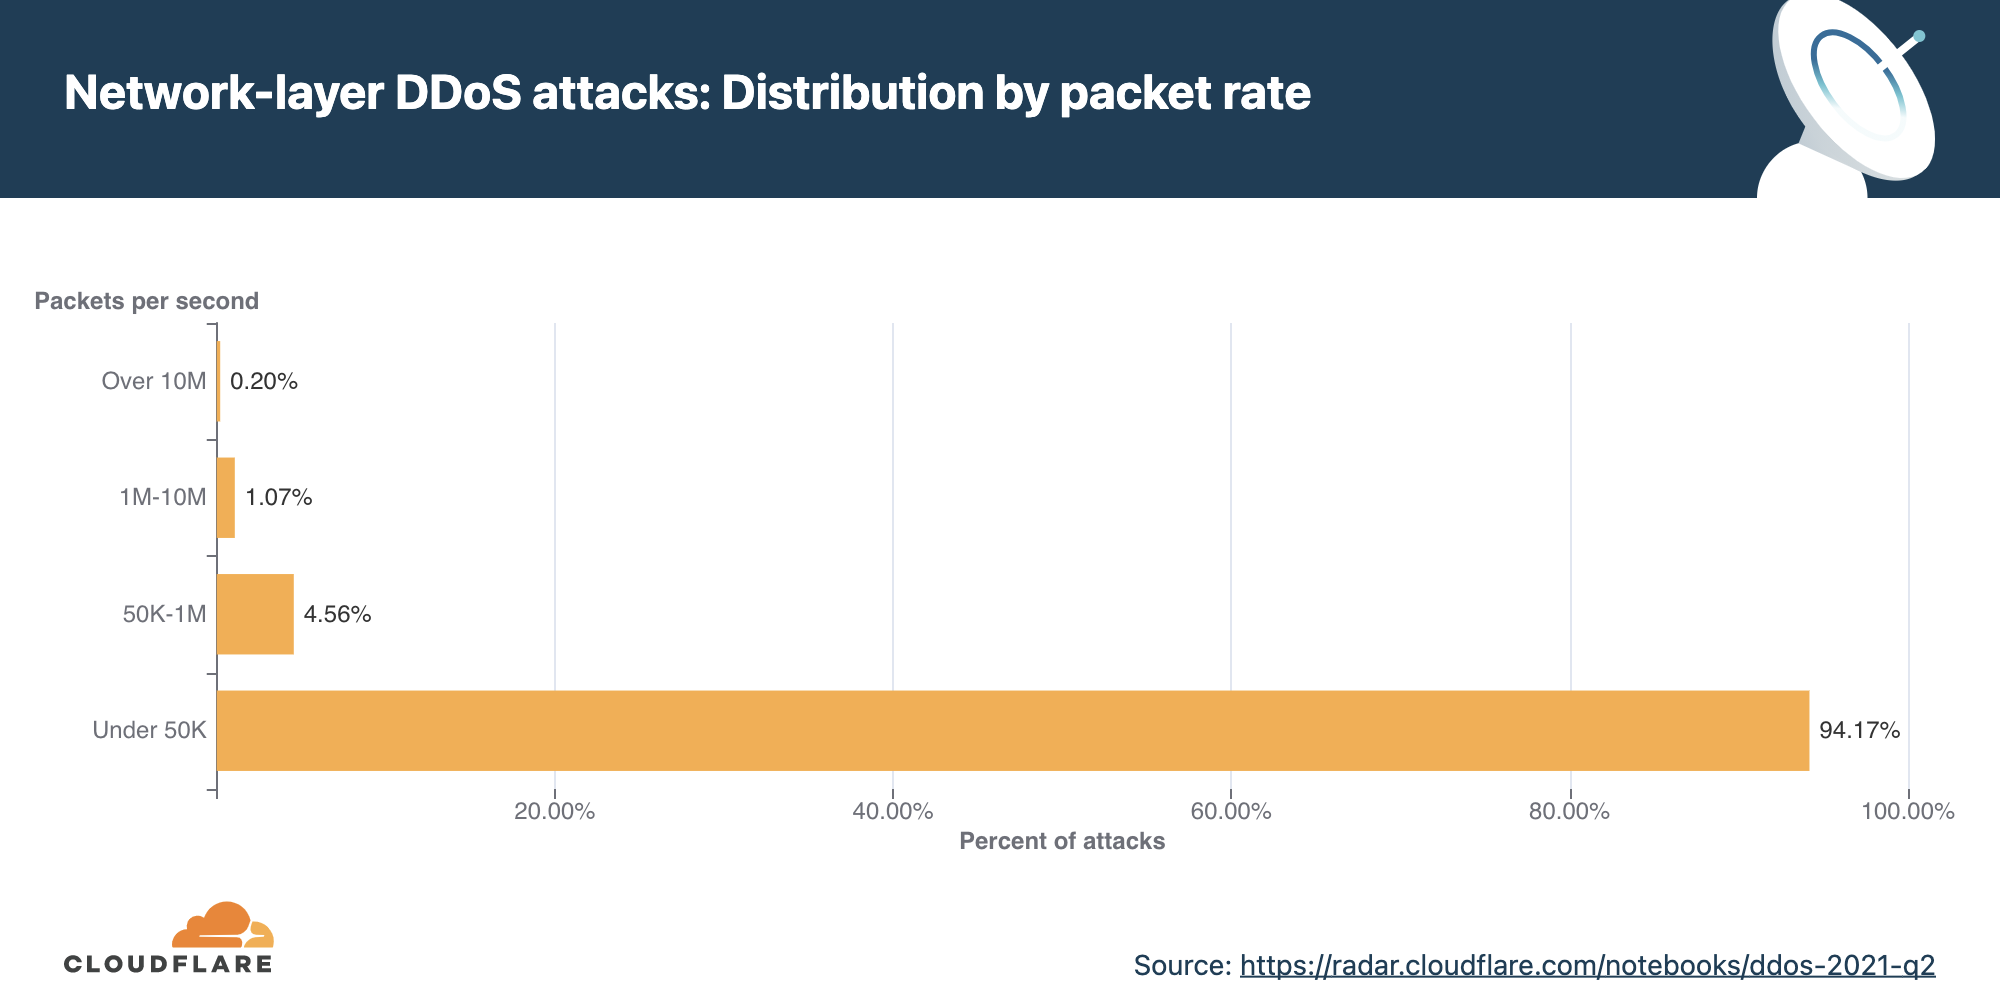
Distribution by packet rate
The majority of network-layer DDoS attacks remain below 50,000 packets per second. While 50 kpps is on the lower side of the spectrum at Cloudflare scale, it can still easily take down unprotected Internet properties and congest even a standard Gigabit Ethernet connection.
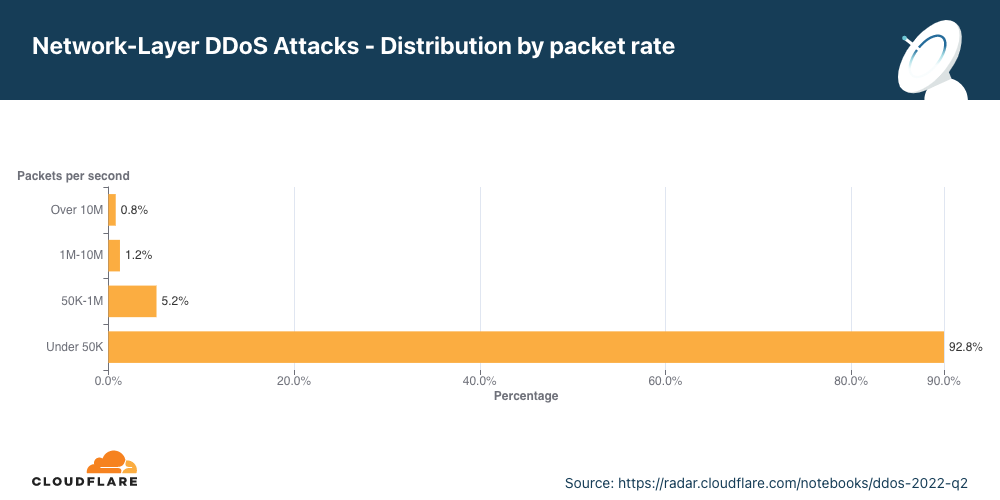
When we look at the changes in the attack sizes, we can see that packet-intensive attacks above 50 kpps decreased in Q2, resulting in an increase of 4% in small attacks.
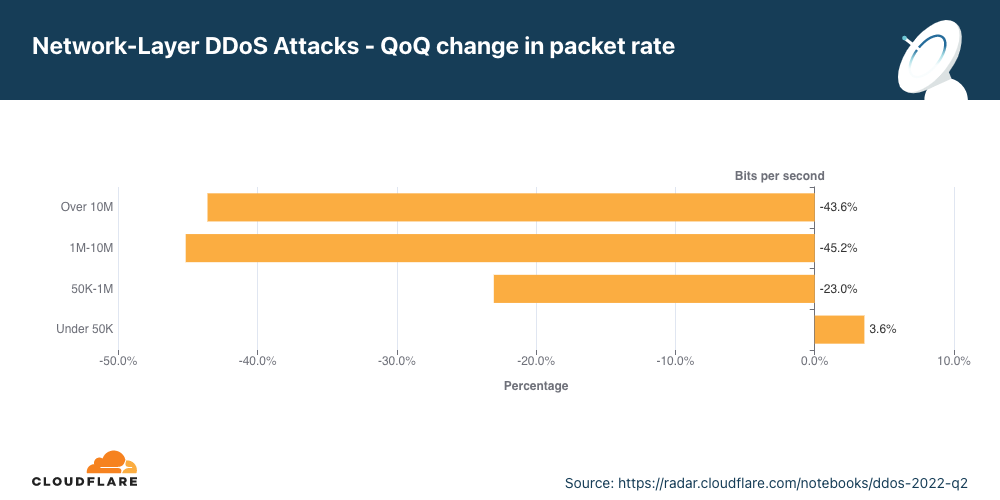
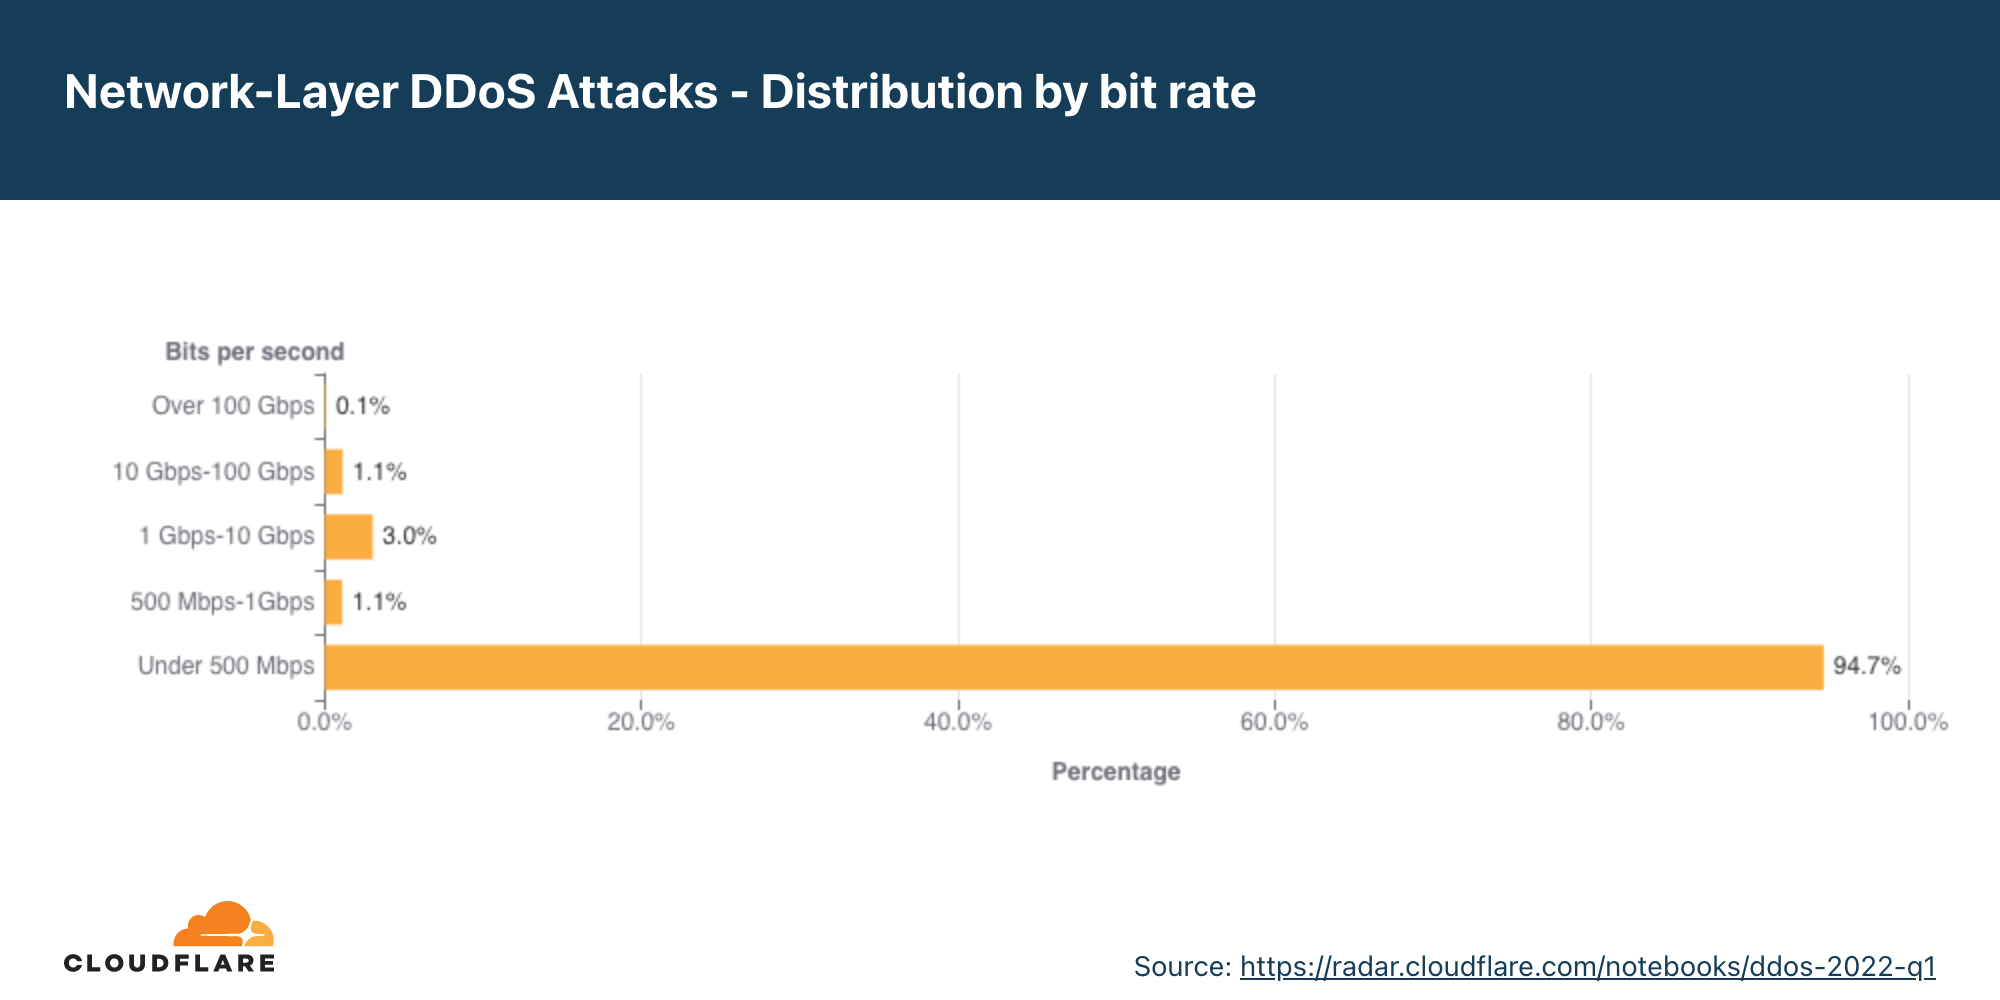
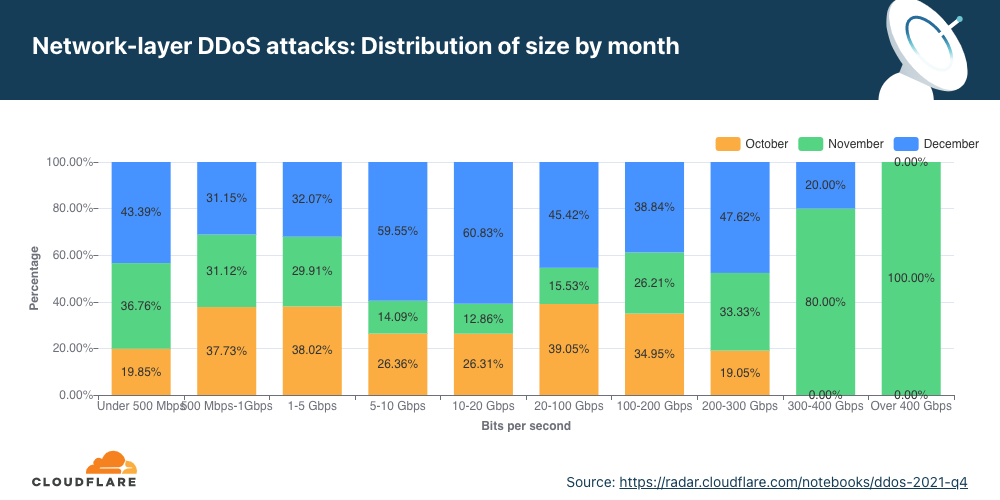
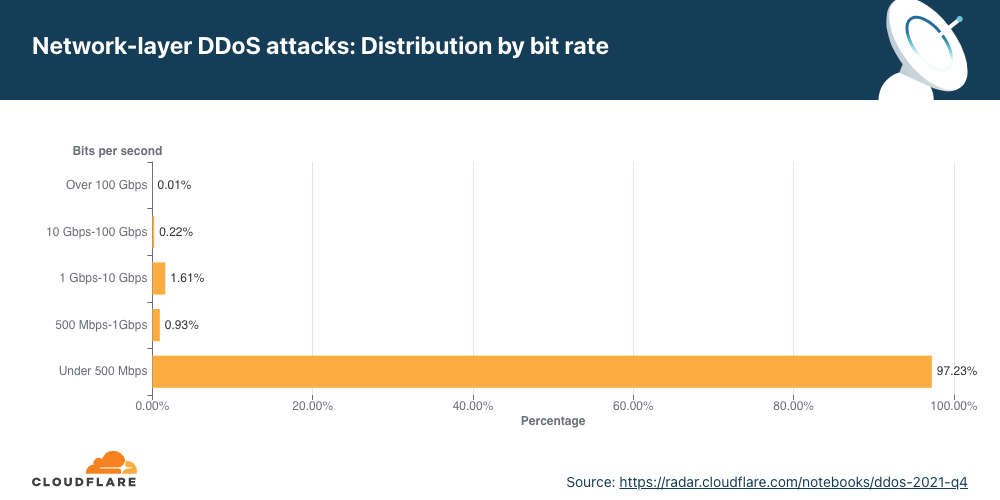
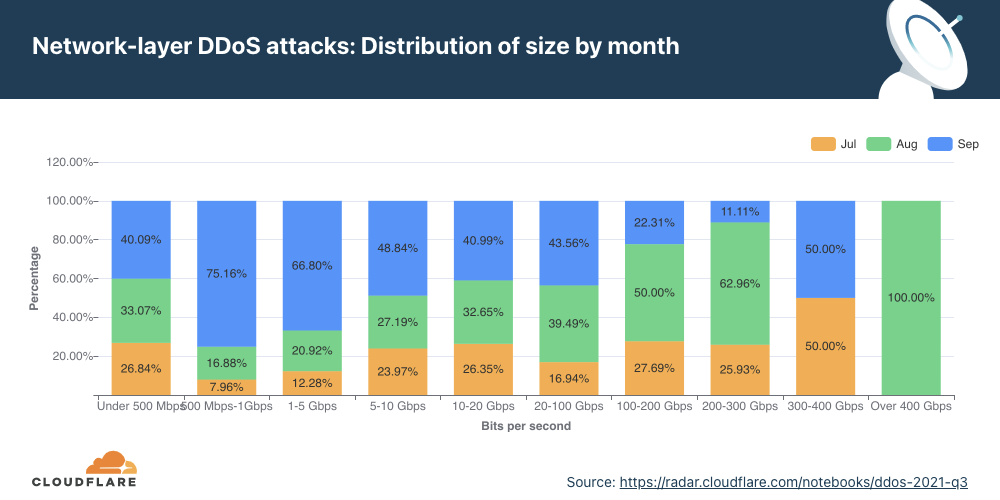
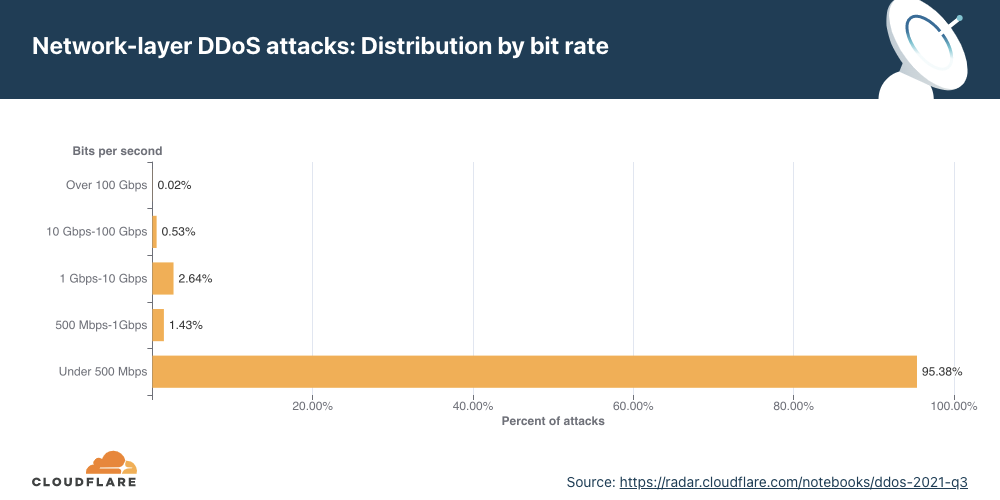
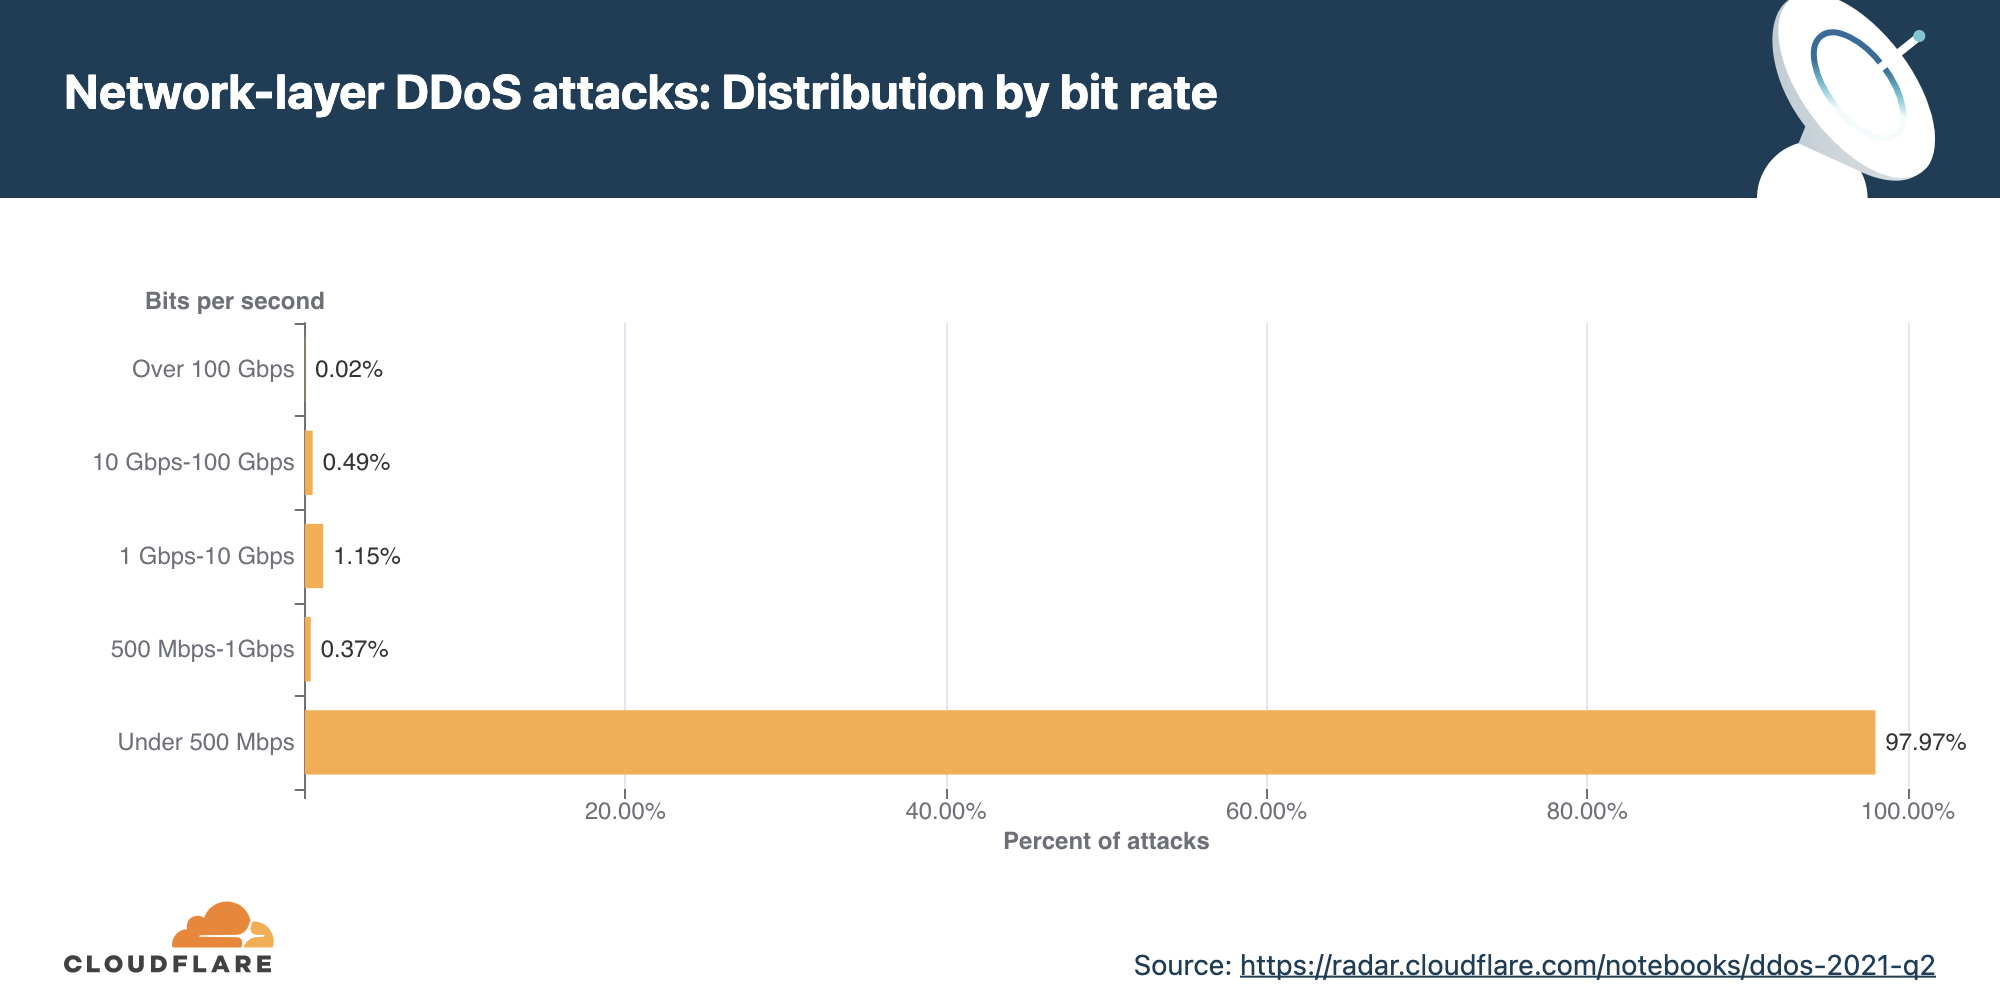
Distribution by bitrate
In Q2, most of the network-layer DDoS attacks remain below 500 Mbps. This too is a tiny drop in the water at Cloudflare scale, but can very quickly shut down unprotected Internet properties with less capacity or at the very least cause congestion for even a standard Gigabit Ethernet connection.
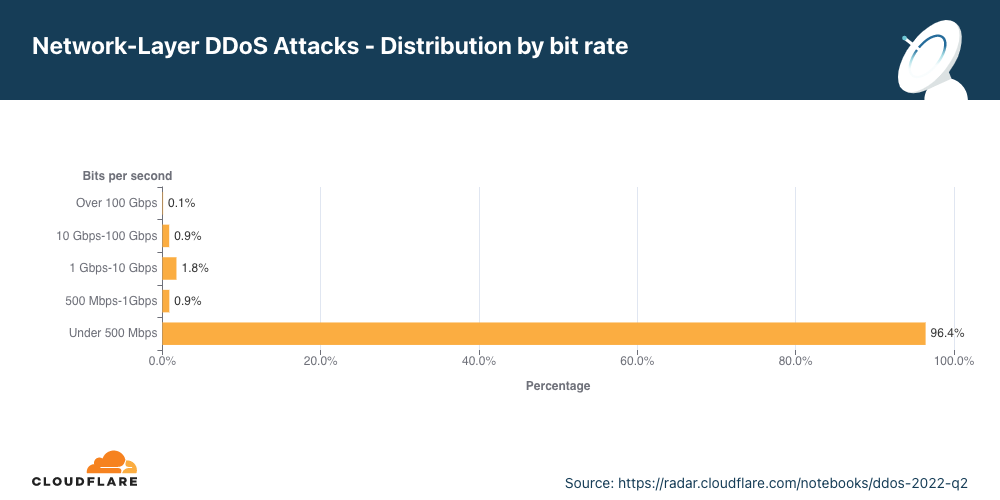
Interestingly enough, large attacks between 500 Mbps and 100 Gbps decreased by 20-40% QoQ, but volumetric attacks above 100 Gbps increased by 8%.
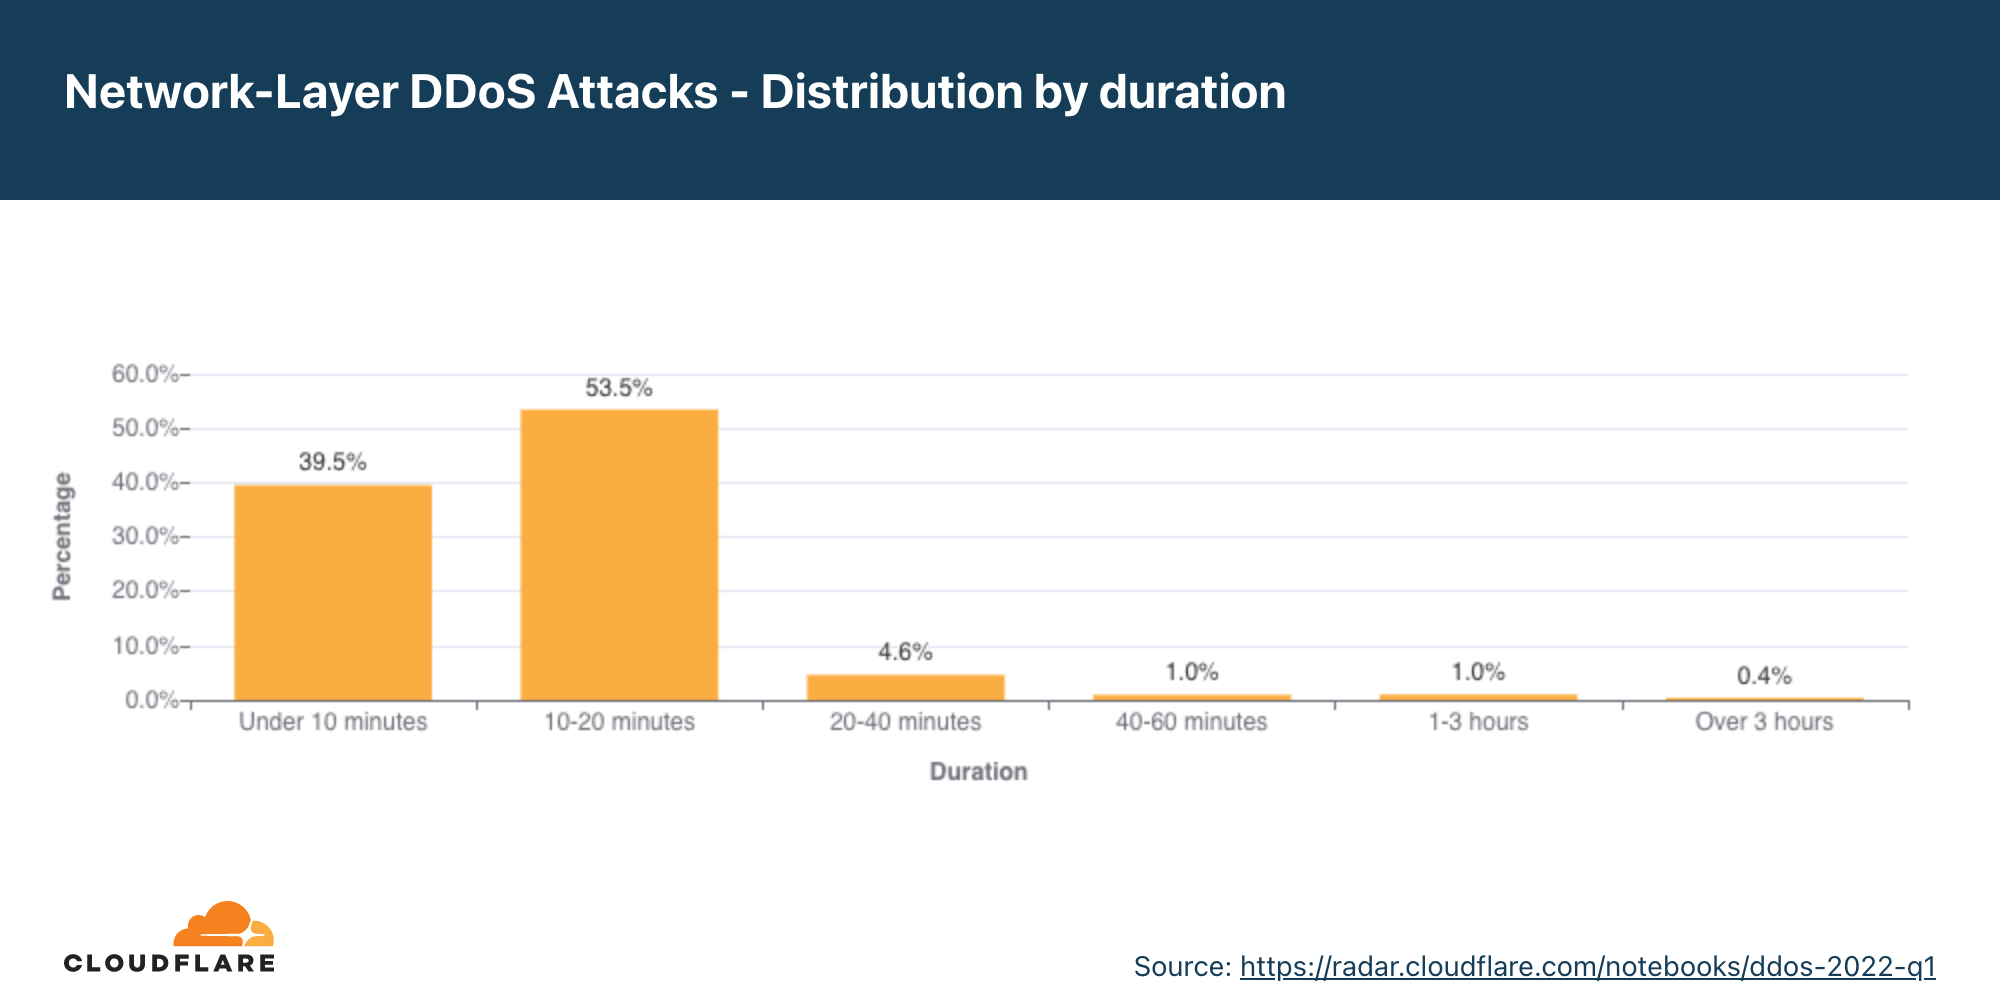
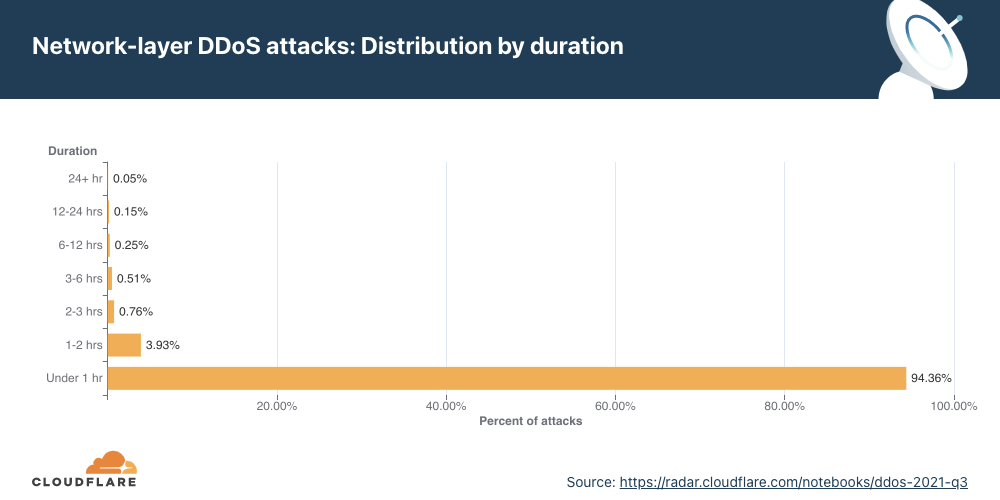
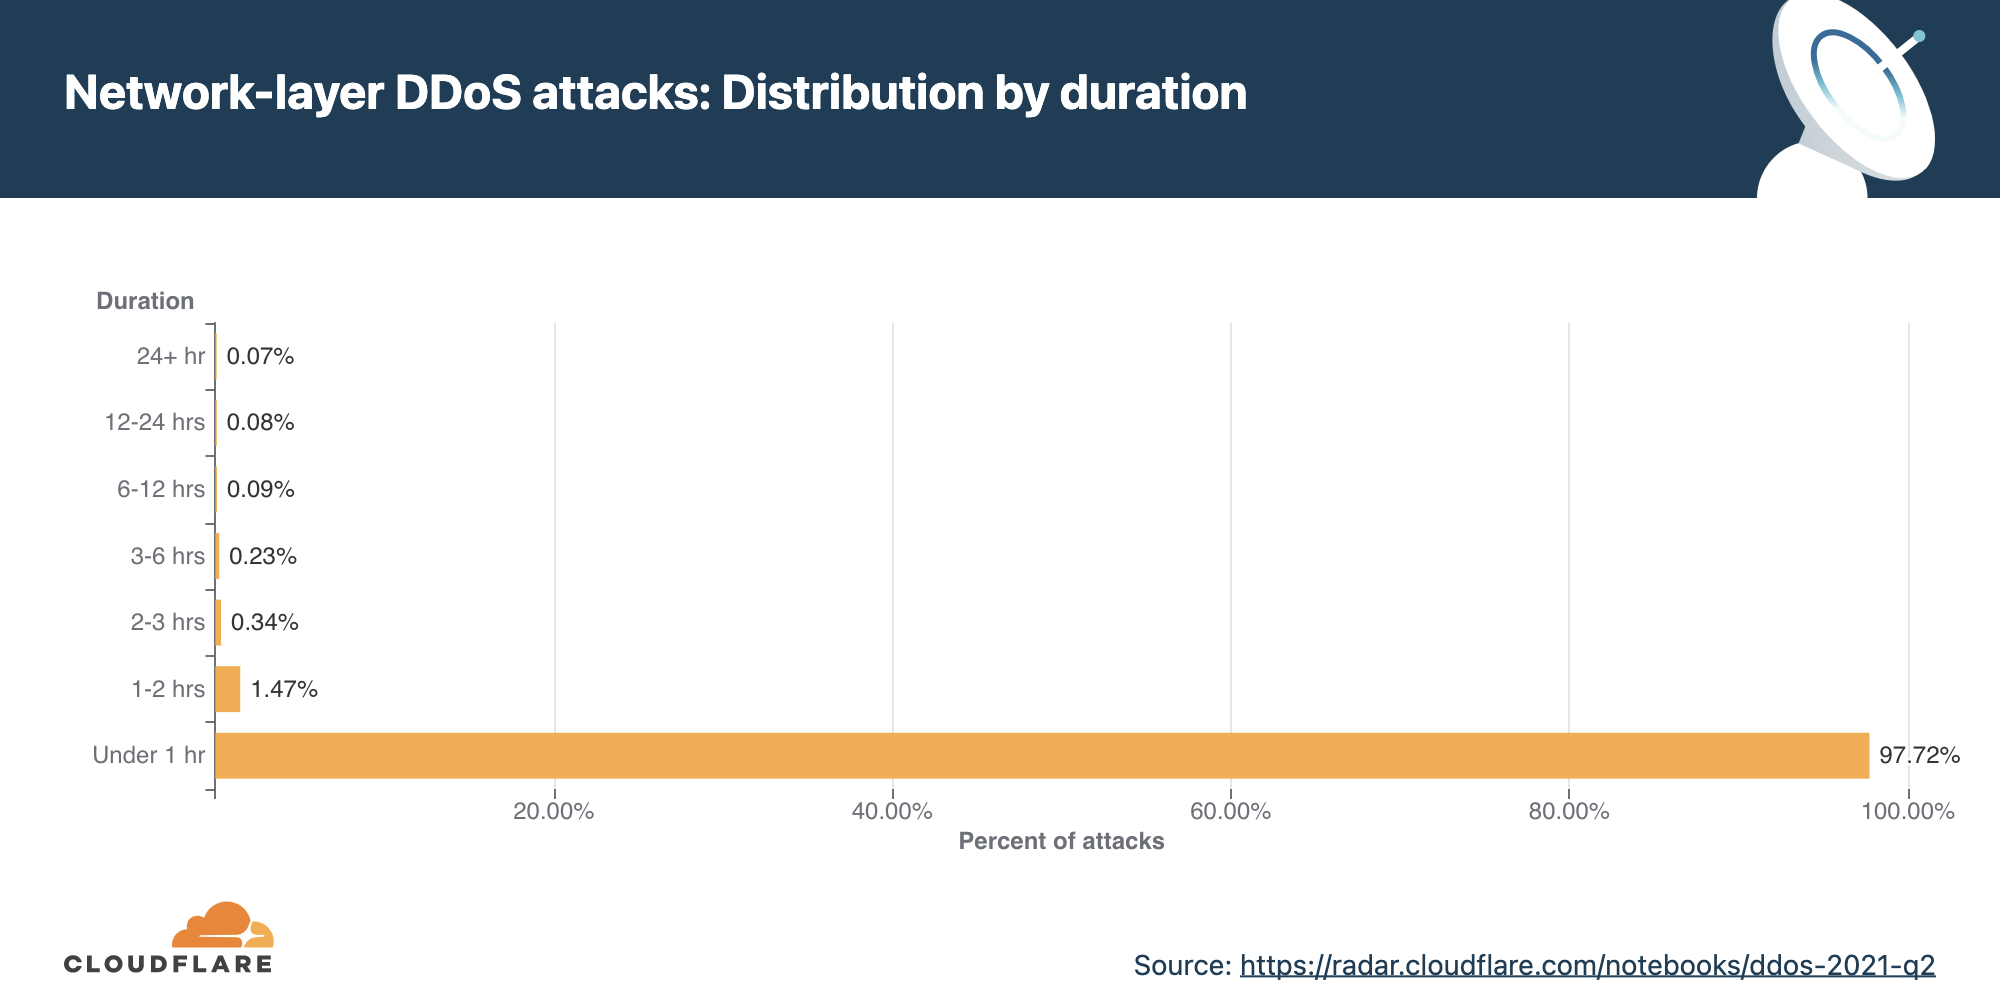
Network-layer DDoS attacks by duration
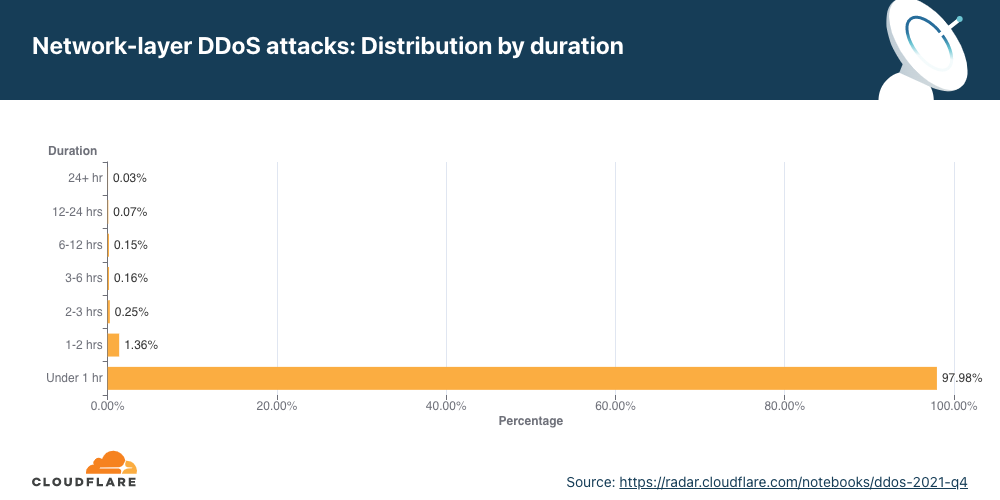
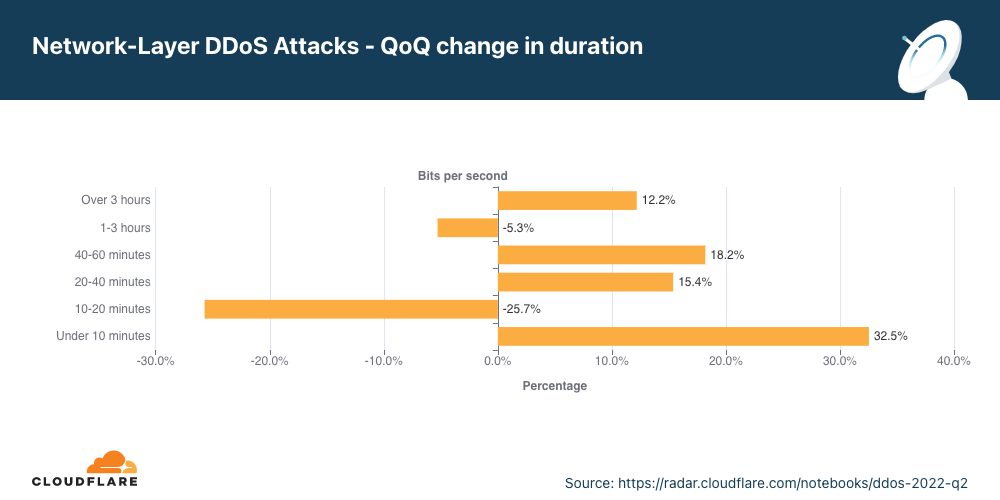
In Q2, attacks lasting over three hours increased by 9%.
We measure the duration of an attack by recording the difference between when it is first detected by our systems as an attack and the last packet we see with that attack signature towards that specific target.
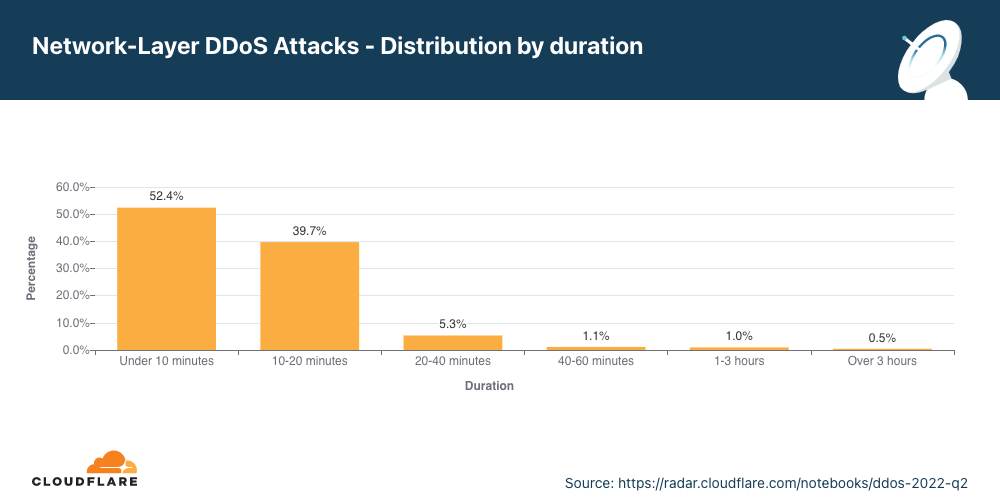
In Q2, 52% of network-layer DDoS attacks lasted less than 10 minutes. Another 40% lasted 10-20 minutes. The remaining 8% include attacks ranging from 20 minutes to over three hours.
One important thing to keep in mind is that even if an attack lasts only a few minutes, if it is successful, the repercussions could last well beyond the initial attack duration. IT personnel responding to a successful attack may spend hours and even days restoring their services.
While most of the attacks are indeed short, we can see an increase of over 15% in attacks ranging between 20-60 minutes, and a 12% increase of attacks lasting more than three hours.
Short attacks can easily go undetected, especially burst attacks that, within seconds, bombard a target with a significant number of packets, bytes, or requests. In this case, DDoS protection services that rely on manual mitigation by security analysis have no chance in mitigating the attack in time. They can only learn from it in their post-attack analysis, then deploy a new rule that filters the attack fingerprint and hope to catch it next time. Similarly, using an “on-demand” service, where the security team will redirect traffic to a DDoS provider during the attack, is also inefficient because the attack will already be over before the traffic routes to the on-demand DDoS provider.
It’s recommended that companies use automated, always-on DDoS protection services that analyze traffic and apply real-time fingerprinting fast enough to block short-lived attacks.
Summary
Cloudflare’s mission is to help build a better Internet. A better Internet is one that is more secure, faster, and reliable for everyone — even in the face of DDoS attacks. As part of our mission, since 2017, we’ve been providing unmetered and unlimited DDoS protection for free to all of our customers. Over the years, it has become increasingly easier for attackers to launch DDoS attacks. But as easy as it has become, we want to make sure that it is even easier — and free — for organizations of all sizes to protect themselves against DDoS attacks of all types.
Not using Cloudflare yet? Start now with our Free and Pro plans to protect your websites, or contact us for comprehensive DDoS protection for your entire network using Magic Transit.