Post Syndicated from Anton Dort-Golts original https://blog.cloudflare.com/quicksilver-v2-evolution-of-a-globally-distributed-key-value-store-part-1/
Quicksilver is a key-value store developed internally by Cloudflare to enable fast global replication and low-latency access on a planet scale. It was initially designed to be a global distribution system for configurations, but over time it gained popularity and became the foundational storage system for many products in Cloudflare.
A previous post described how we moved Quicksilver to production and started replicating on all machines across our global network. That is what we called Quicksilver v1: each server has a full copy of the data and updates it through asynchronous replication. The design served us well for some time. However, as our business grew with an ever-expanding data center footprint and a growing dataset, it became more and more expensive to store everything everywhere.
We realized that storing the full dataset on every server is inefficient. Due to the uniform design, data accessed in one region or data center is replicated globally, even if it’s never accessed elsewhere. This leads to wasted disk space. We decided to introduce a more efficient system with two new server roles: replica, which stores the full dataset and proxy, which acts as a persistent cache, evicting unused key-value pairs to free up some disk space. We call this design Quicksilver v1.5 – an interim step towards a more sophisticated and scalable system.
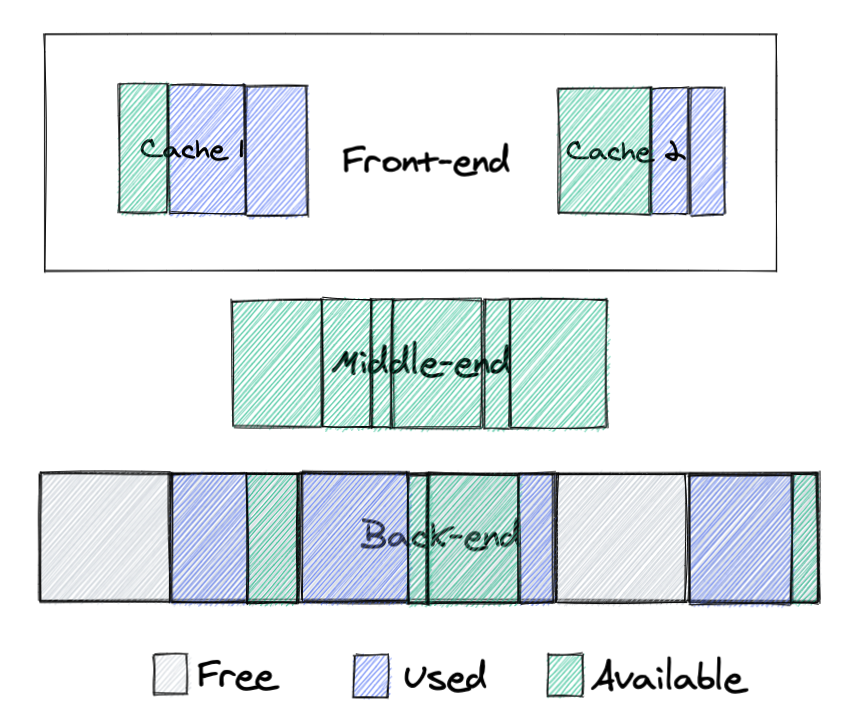
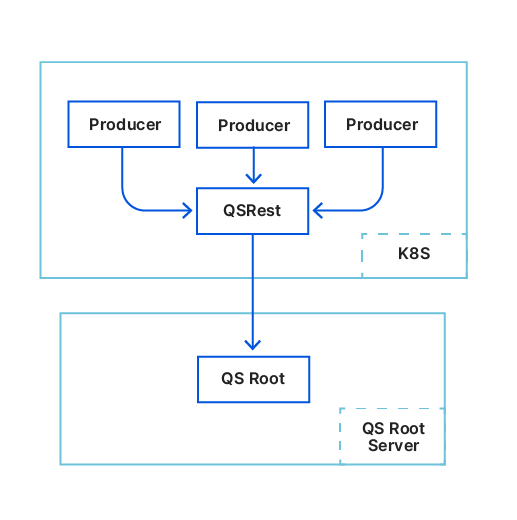
To understand how those two roles helped us reduce disk space usage, we first need to share some background on our setup and introduce some terminology. Cloudflare is architected in a way where we have a few hyperscale core data centers that form our control plane, and many smaller data centers distributed across the globe where resources are more constrained. Quicksilver has dozens of servers in the core data centers with terabytes of storage called root nodes. In the smaller data centers, though, things are different. A typical data center has two types of nodes: intermediate nodes and leaf nodes. Intermediate servers replicate data either from the other intermediate nodes or directly from the root nodes. Leaf nodes serve end user traffic, and receive updates from intermediate servers, effectively being leaves of a replication tree. Disk capacity varies significantly between node types. While root nodes aren’t facing an imminent disk space bottleneck, it’s a definite concern for leaf nodes.
Every server – whether it’s a root, intermediate, or leaf – hosts 10 Quicksilver instances. These are independent databases, each used by specific Cloudflare services or products such as the DNS, CDN or WAF.
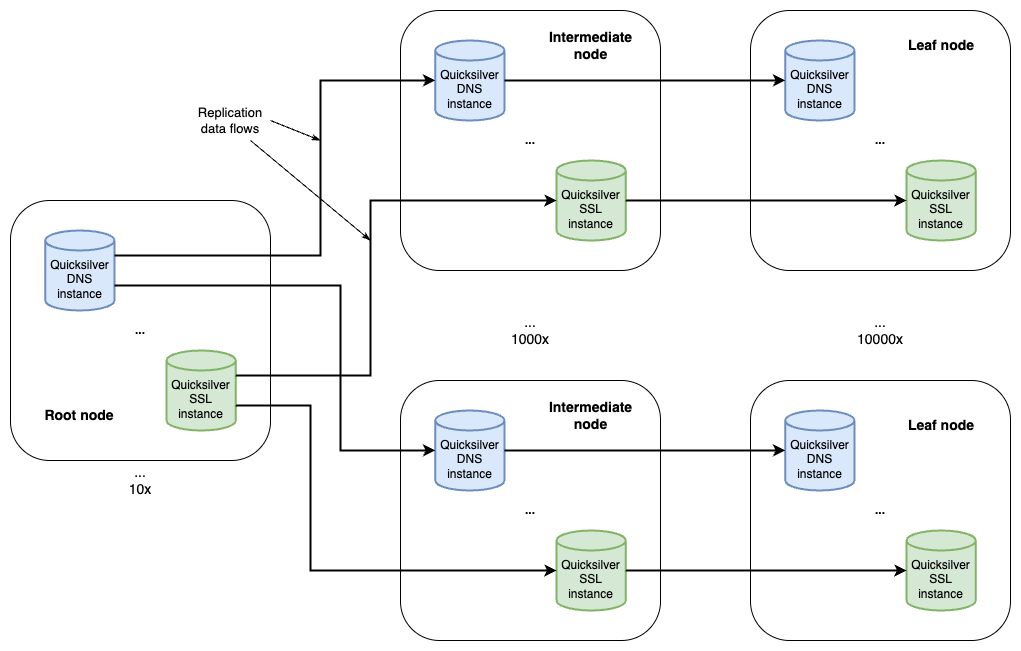
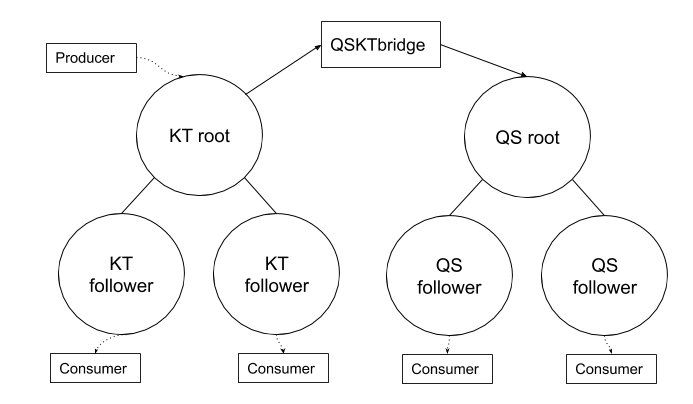
Figure 1. Global Quicksilver
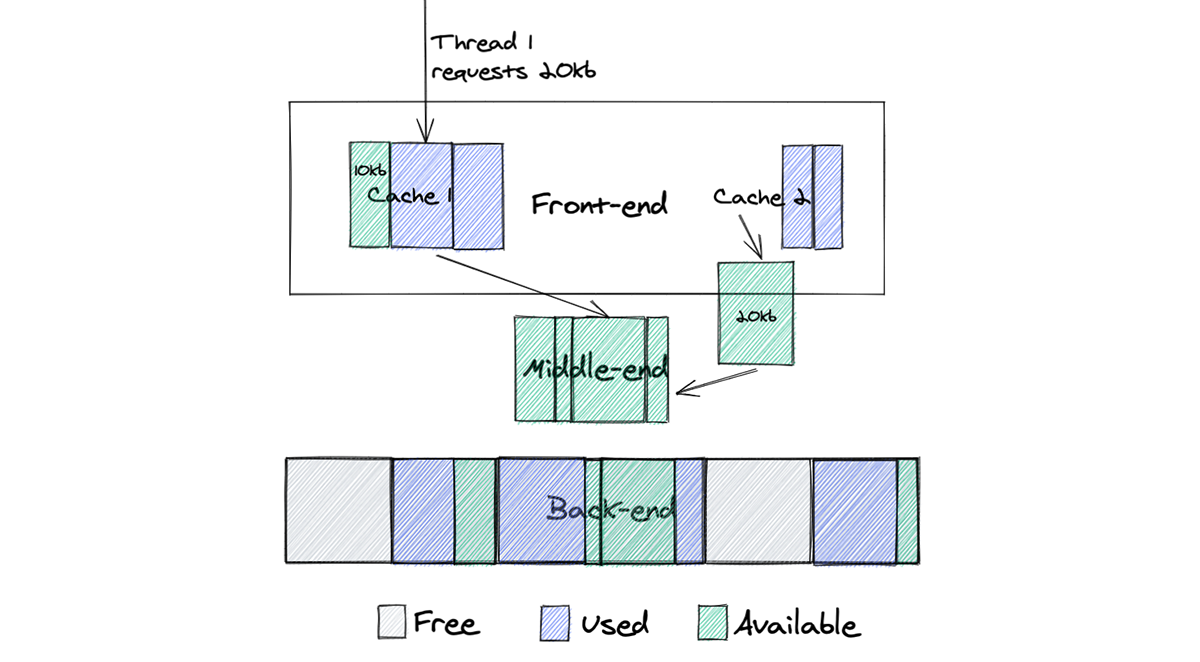
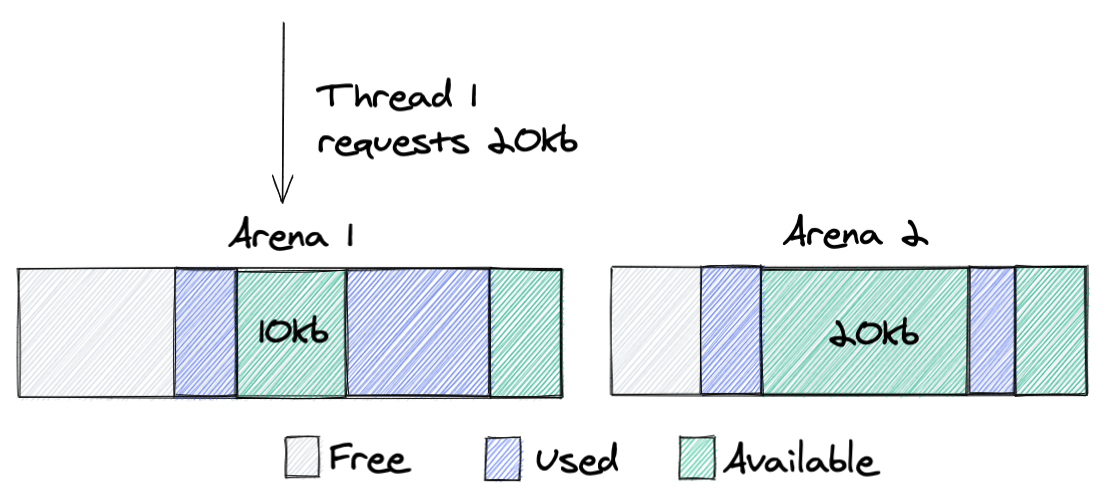
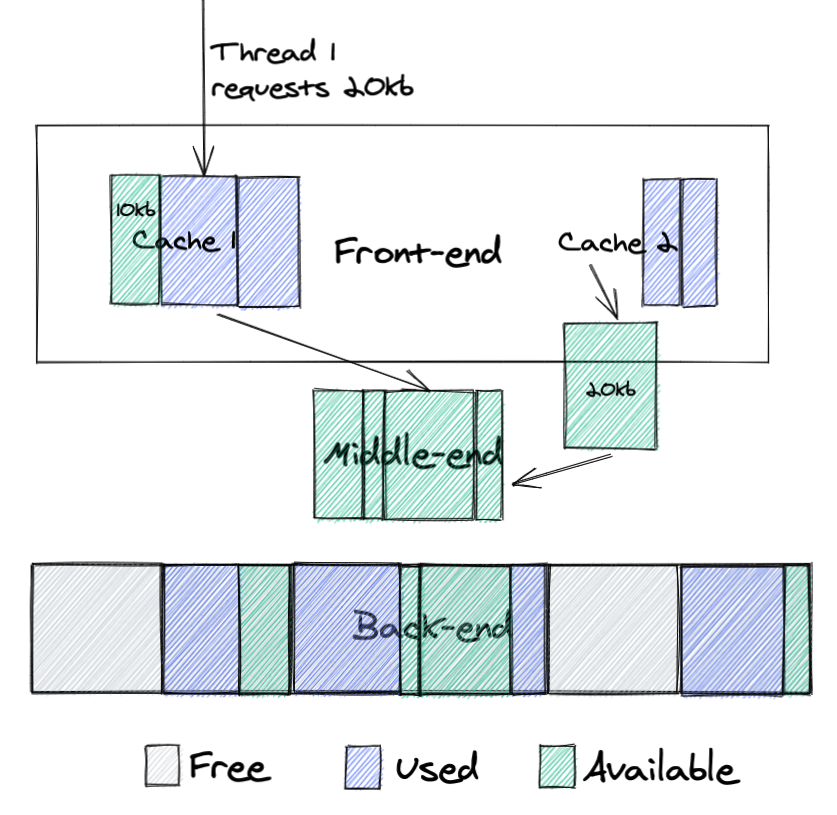
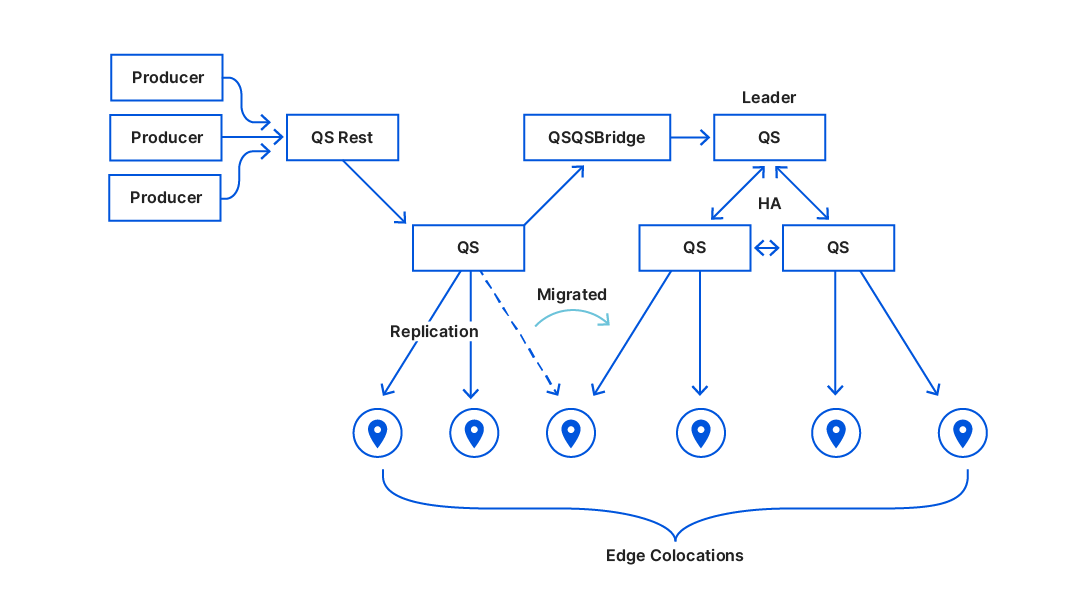
Let’s consider the role distribution. Instead of hosting ten full datasets on every machine within a data center, what if we deploy only a few replicas in each? The remaining servers would be proxies, maintaining a persistent cache of hot keys and querying replicas for any cache misses.
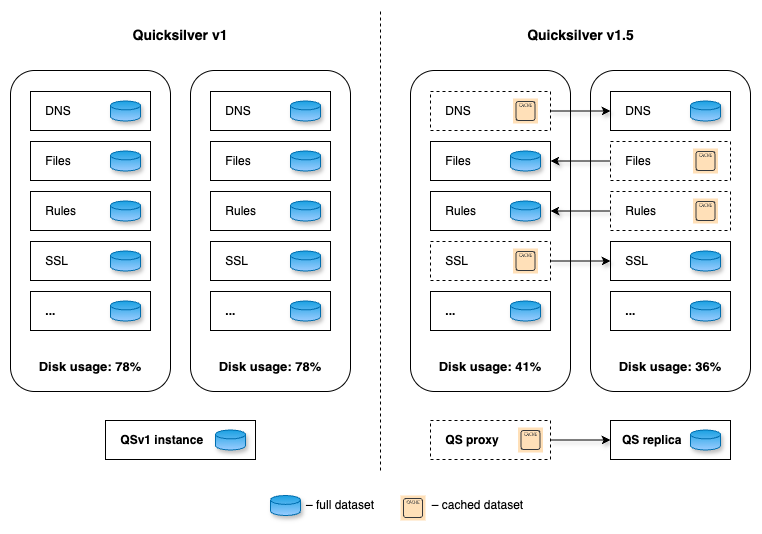
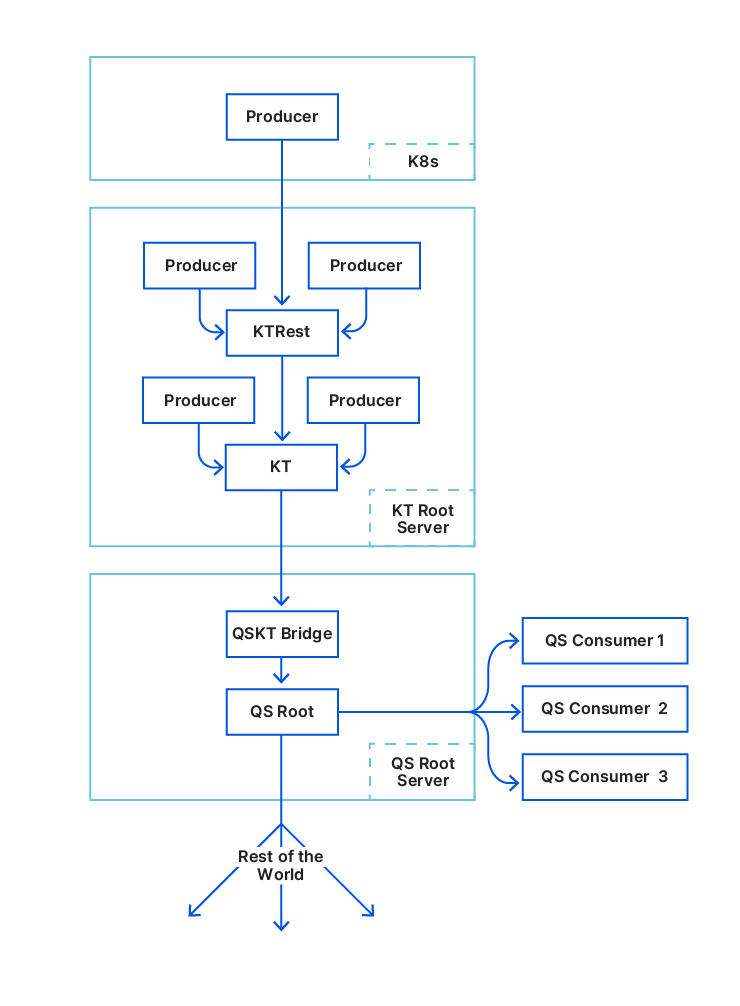
Figure 2. Role allocation for different Quicksilver instances
Data centers across our network are very different in size, ranging from hundreds of servers to a single rack with just a few servers. To ensure every data center has at least one replica, the simplest initial step is an even split: on each server, place five replicas of some instances and five proxies for others. The change immediately frees up disk space, as the cached hot dataset on a proxy should be smaller than a full replica. While it doesn’t remove the bottleneck entirely, it could, in theory, lead to an up to 50% reduction in disk space usage. More importantly, it lays the foundation for a new distributed design of Quicksilver, where queries can be served by multiple machines in a data center, paving the way for further horizontal scaling. Additionally, an iterative approach helps to battle-proof the code changes earlier.
Before committing to building Quicksilver v1.5, we wanted to be sure that the proxy/replica design would actually work for our workload. If proxies needed to cache the entire dataset for good performance, then it would be a dead end, offering no potential disk space benefits. To assess this, we built a data pipeline which pushes accessed keys from all across our network to ClickHouse. This allowed us to estimate typical sizes of working sets. Our analysis revealed that:
-
in large data centers approximately, 20% of the keyspace was in use
-
in small data centers this number dropped to just about 1%
These findings gave us confidence that the caching approach should work, though it wouldn’t be without its challenges.
When talking about caches, the first thing that comes to mind is an in-memory cache. However, this cannot work for Quicksilver for two main reasons: memory usage and the “cold cache” problem.
Indeed, with billions of stored keys, even a fraction of them would lead to an unmanageable increase in memory usage. System restarts should not affect performance, which means that cache data must be preserved somewhere anyway. So we decided to make the cache persistent and store it in the same way as full datasets: in our embedded RocksDB. Thus, cached keys normally sit on disk and can be retrieved on-demand with low memory footprint.
When a key cannot be found in the proxy’s cache, we request it from a replica using our internal distributed key-value protocol, and put it into a local cache after processing.
Evictions are based on RocksDB compaction filters. Compaction filters allow defining custom logic executed in background RocksDB threads responsible for compacting files on disk. Each key-value pair is processed with a filter on a regular basis, evicting least recently used data from the disk when available disk space drops below a certain threshold called a soft limit. To track keys accessed on disk, we have an LRU-like in-memory data structure, which is passed to the compaction filter to set last access date in key metadata and inform potential evictions.
However, with some specific workloads there is still a chance that evictions will not keep up with disk space growth, and for this scenario we have a hard limit: when available disk space drops below a critical threshold, we temporarily stop adding new keys to the cache. This hurts performance, but it acts as a safeguard, ensuring our proxies remain stable and don’t overflow under a massive surge of requests.
Quicksilver has, from the start, provided sequential consistency to clients: if key A was written before B, it’s not possible to read B and not A. We are committed to maintaining this guarantee in the new design. We have experienced Hyrum’s Law first hand, with Quicksilver being so widely adopted across the company that every property we introduced in earlier versions is now relied upon by other teams. This means that changing behaviour would inevitably break existing functionality and introduce bugs.
However, there is one thing standing in our way: asynchronous replication. Quicksilver replication is asynchronous mainly because machines in different parts of the world replicate at different speeds, and we don’t want a single server to slow down the entire tree. But it turns out in a proxy-replica design, independent replication progress can result in non-monotonic reads!
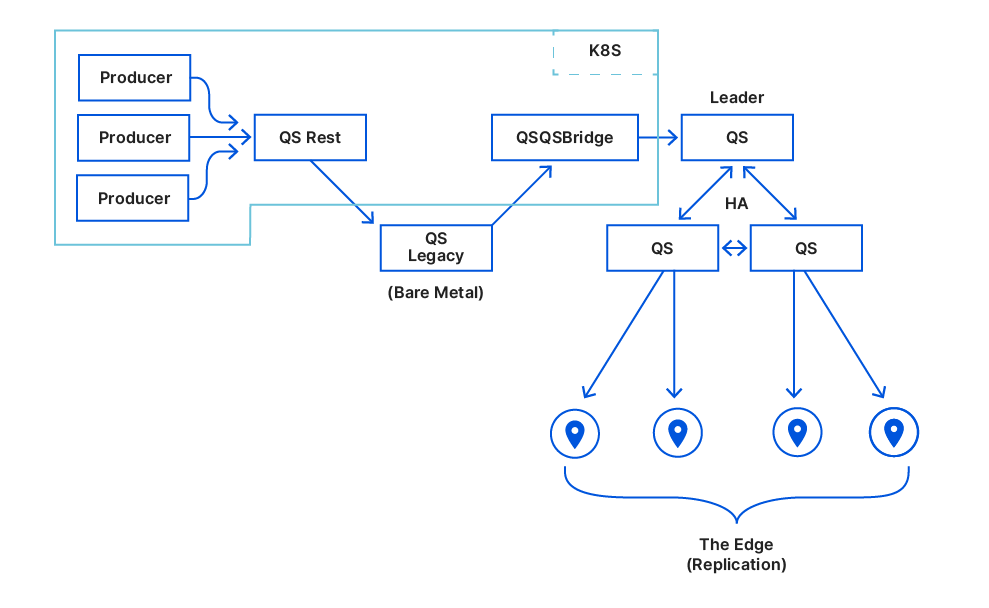
Consider the following scenario: a client sequentially writes keys A, B, C, .. K one after another to the Quicksilver root node. These keys are asynchronously replicated through data centers across our network with varying latency. Imagine we have a proxy on index 5, which has observed keys from A to E, and two replicas:
-
replica_1 is at index 2 (slightly behind the proxy), having only received A and B
-
replica_2 at index 9, which is slightly ahead due to a faster replication path and has received all keys from A to I

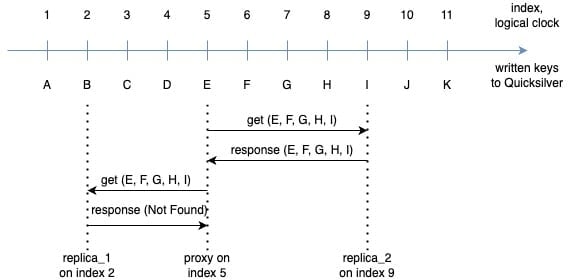
Figure 3. Asynchronous replication in QSv1.5
Now, a client performs two successive requests on a proxy, each time reading the keys E, F, G, H and I. For simplicity, we assume these keys are not cacheable (for example, due to low disk space). The proxy’s first remote request is routed to replica_2, which already has all keys and responds back with values. To prevent hot spots in a data center, we load balance requests from proxies, and the next one lands on replica_1, which hasn’t received any of the requested keys yet, and responds with a “not found” error.
So, which result is correct?
The correct behavior here is that of Quicksilver v1, which we aim to preserve. If the server on replication index 5 were a replica instead of a proxy, it would have seen updates for keys A through E inclusive, resulting in E being the only key in both replies, while all other keys cannot be found yet. Which means responses from both replica_1 and replica_2 are wrong!
Therefore, to maintain previous guarantees and API backwards compatibility, Quicksilver v1.5 must address two crucial consistency problems: cases where the replica is ahead of the proxy, and conversely, where it lags behind. For now let’s focus on the case where a proxy lags behind a replica.
In our example, replica_2 responds to a request from a proxy “from the past”. We cannot use any locks for synchronizing two servers, as it would introduce undesirable delays to the replication tree, defeating the purpose of asynchronous replication. The only option is for replicas to maintain a history of recent updates. This naturally leads us to implementing multiversion concurrency control (MVCC), a popular database mechanism for tracking changes in a non-blocking fashion, where for any key we can keep multiple versions of its values for different points in time.
With MVCC, we no longer overwrite the latest value of a key in the default column family for every update. Instead, we introduced a new MVCC column family in RocksDB, where all updates are stored with a corresponding replication index. Lookup for a key at some index in the past goes as follows:
-
First we search in the default column family. If a key is found and the write timestamp is not greater than the index of a requesting proxy, we can use it straight away.
-
Otherwise, we begin scanning the MVCC column family, where keys have unique suffixes based on latest timestamps for which they are still valid.
In the example above, replica_2 has MVCC enabled and has keys A@1 .. K@11 in its default column family. The MVCC is initially empty, because no keys have been overwritten yet. When it receives a request for, say, key H with target index 5, it first makes a lookup in a default column family and finds the given key, but its timestamp is 8, which means this version should not be visible to the proxy yet. It then scans the MVCC, finds no matching previous versions and responds with “not found” to the proxy. Should key H be updated twice at indexes 4 and 8, we would have placed the initial version into MVCC before overwriting it in the default column family, and the proxy would receive the first version in response.
If a key E is requested at index 5, replica_2 can find it quickly in the default column family and return it back to the proxy. There is no need to read from MVCC, as the timestamp of the latest version (5) satisfies the request.
Another corner case to consider is deletions. When a key is deleted and then re-written, we need to explicitly mark the period of removal in MVCC. For that we’ve implemented tombstones – a special value format for absent keys.
Finally, we need to make sure that key history is not growing uncontrollably, using up all of the disk space available. Luckily we don’t actually need to record history for a long period of time, it just needs to cover the maximum replication index difference between any two machines. And in practice, a two-hour interval turned out to be way more than enough, while adding only about 500 MB of extra disk space usage. All records in the MVCC column family older than two hours are garbage collected, and for that again we use custom RocksDB compaction filters.
Now we know how to deal with proxies lagging behind replicas. But what about the opposite case, when a proxy is ahead of replicas?
The simplest solution is for replicas to not serve requests with a target index higher than its own. After all, it cannot know about keys from the future, whether they will be added, updated, or removed. In fact, our first implementation just returned an error when the proxy was ahead, as we expected it to happen quite infrequently. But after rolling out gradually to a few data centers, our metrics made it clear that the approach was not going to work.
This led us to analyze which keys are affected by this kind of replication asymmetry. It’s definitely not keys added or updated a long time ago, because replicas would already have the changes replicated. The only problematic keys are those updated very recently, which the proxy already knows about, but the replica does not.
With this insight, we realized that the issue should be solved on the proxies rather than on the replica side. By preserving all recent updates locally, the proxy can avoid querying the replica. This became known as the sliding window approach.
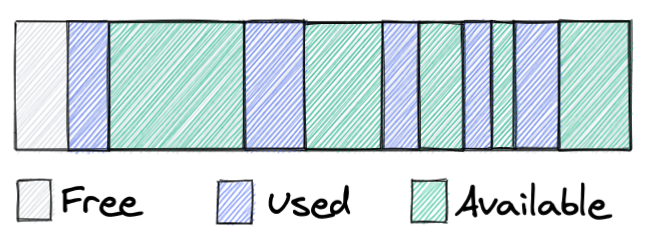
The sliding window retains all recent updates written in a short, rolling timeframe. Unlike cached keys, items in the window cannot be evicted until they move outside of the window. Internally, the sliding window is defined by lower and upper boundary pointers. These are kept in memory, and can easily be restored after a reload from the current database index and the pre-configured window size.
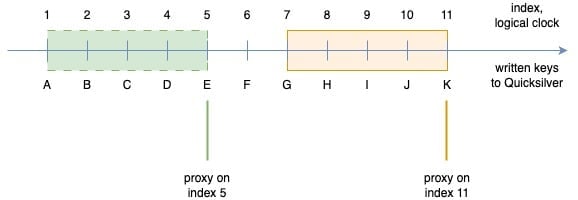
Figure 4. The sliding window shifts when replication updates arrive
When a new update event arrives from the replication layer we add it to the sliding window by moving both the upper and lower boundary one position higher. Thereby, we maintain the fixed size of the window. Keys written before the lower bound can be evicted by the compaction filter, which is aware of current sliding window boundaries.
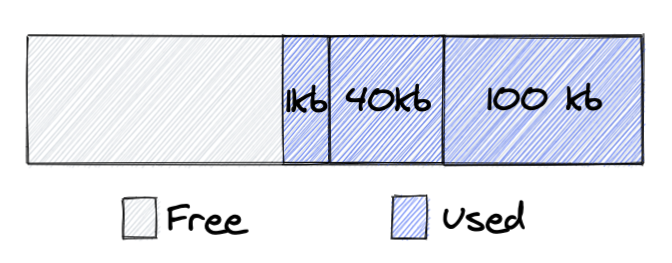
Another problem arising with our distributed replica-proxy design is negative lookups – requests for keys which don’t exist in the database. Interestingly, in our workloads we see about ten times more negative lookups than positive ones!
But why is it a problem? Unfortunately, each negative lookup will be a cache miss on a proxy, requiring a request to a replica. Given the volume of requests and proportion of such lookups, it would be a disaster for performance, with overloaded replicas, overused data center networks, and massive latency degradation. We needed a fast and efficient approach to identifying non-existing keys directly at the proxy level.
In v1, negative lookups are the quickest type of requests. We rely on a special probabilistic data structure – Bloom filters – used in RocksDB to determine if the requested key might belong to a certain data file containing a range of sorted keys (called Sorted Sequence Table or SST) or definitely not. 99% of the time, negative lookups are served using only this in-memory data structure, avoiding the need for disk I/O.
One approach we considered for proxies was to cache negative lookups. Two problems immediately arise:
-
How big is the keyspace of negative lookups? In theory, it’s infinite, but the real size was unclear. We can store it in our cache only if it is small enough.
-
Cached negative lookups would no longer be served by the fast Bloom filters. We have row and block caches in RocksDB, but the hit rate is nowhere near the filters for SSTs, which means negative lookups would end up going to disk more often.
These turned out to be dealbreakers: not only was the negative keyspace vast, greatly exceeding the actual keyspace (by a thousand times for some instances!), but clients also need lookups to be really fast, ideally served from memory.
In pursuit of probabilistic data structures which could give us a dynamic compact representation of a full keyspace on proxies, we spent some time exploring Cuckoo filters. Unfortunately, with 5 billion keys it takes about 18 GB to have a false positive rate similar to Bloom filters (which only require 6 GB). And this is not only about wasted disk space — to be fast we have to keep it all in memory too!
Clearly some other solution was needed.
Finally, we decided to implement key and value separation, storing all keys on proxies, but persisting values only for cached keys. Evicting a key from the cache actually results in the removal of its value.
But wait, don’t the keys, even stripped of values, take a lot of space? Well, yes and no.
The total size of pure keys in Quicksilver is approximately 11 times smaller than the full dataset. Of course, it’s larger than any representation by probabilistic data structure, but there are some very desirable properties to such a solution. Firstly, we continue to enjoy fast Bloom filter lookups in RocksDB. Another benefit is that it unlocks some cool optimizations for range queries in a distributed context.
We may revisit it one day, but so far it has worked great for us.
Having solved all of the above challenges, one bit remained to be sorted out to make distributed query execution work: how can proxies discover replicas?
Within the local data center it is fairly easy. Each one runs its own consul cluster, where machines are registered as services. Consul is well integrated with our internal DNS resolvers, and with a single DNS request, we can get the names of all replicas running in a data center, which proxies can directly connect to.
However, data centers vary in size, servers are constantly added and removed, and having only local discovery would not be enough for the system to work reliably. Proxies also need to find replicas in other nearby data centers.
We had previously encountered a similar problem with our replication layer. Initially, the replication topology was statically defined in a configuration and distributed to all servers, such that they know from which sources they should replicate. While simple, this approach was quite fragile and tedious to operate. It led to a rigid replication tree with suboptimal overall performance, unable to adapt to network changes.
Our solution to this problem was the Network Oracle – a special overlay network based on a gossip protocol and consisting of intermediate nodes in our data centers. Each member of this overlay constantly exchanges status and metainformation with other nodes, which helps us see active members in near-real time. Each member runs network probes measuring round-trip time to its peers, making it easy to find closest (in terms of RTT) active intermediate nodes to form a low-latency replication tree. Introducing the Network Oracle was a major improvement: we no longer needed to reconfigure the topology, watch intermediate nodes or entire data centers go down, or investigate frequent replication issues. Replication is now a completely self-organized and self-healing dynamic system.
Naturally, we decided to reuse the Network Oracle for our discovery mechanism. It consists of two subproblems: data center discovery and specific service lookup. We use the Network Oracle to find the closest data centers. Adding all machines running Quicksilver to the same overlay would be inefficient because of significant increase of network traffic and message delivery times. Instead, we use intermediate nodes as sources of network proximity information for the leaf nodes. Knowing which data centers are nearby, we can directly send DNS queries there to resolve specific services – Quicksilver replicas in this case.
Proxies maintain a pool of connections to active replicas and distribute requests among them to smooth out the load and avoid hotspots in a data center. Proxies also have a health-tracking mechanism, monitoring the state of connections and errors coming from replicas, and temporarily deprioritizing or isolating potentially faulty ones.
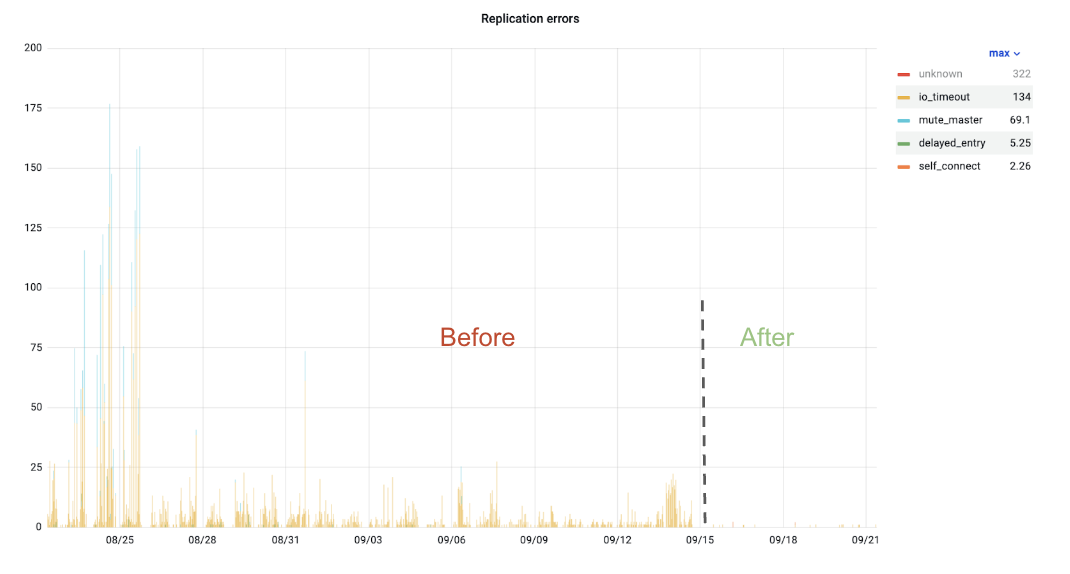
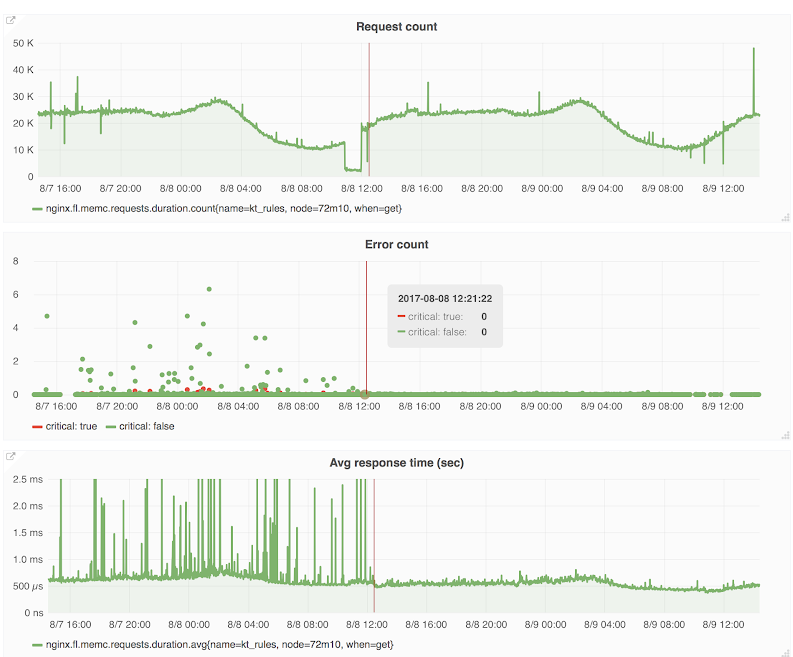
Figure 5. Internal replica request errors
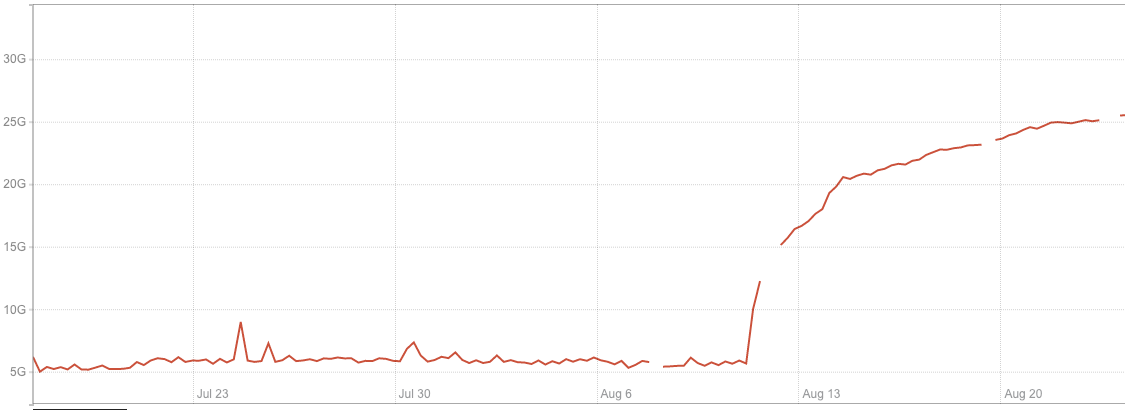
To demonstrate its efficiency, we graphed errors coming from replica requests, which showed that such errors almost disappeared after introducing the new discovery system.
Our objective with Quicksilver v1.5 was simple: gain some disk space without losing request latency, because clients rely heavily on us being fast. While the replica-proxy design delivered significant space savings, what about latencies?
Proxy
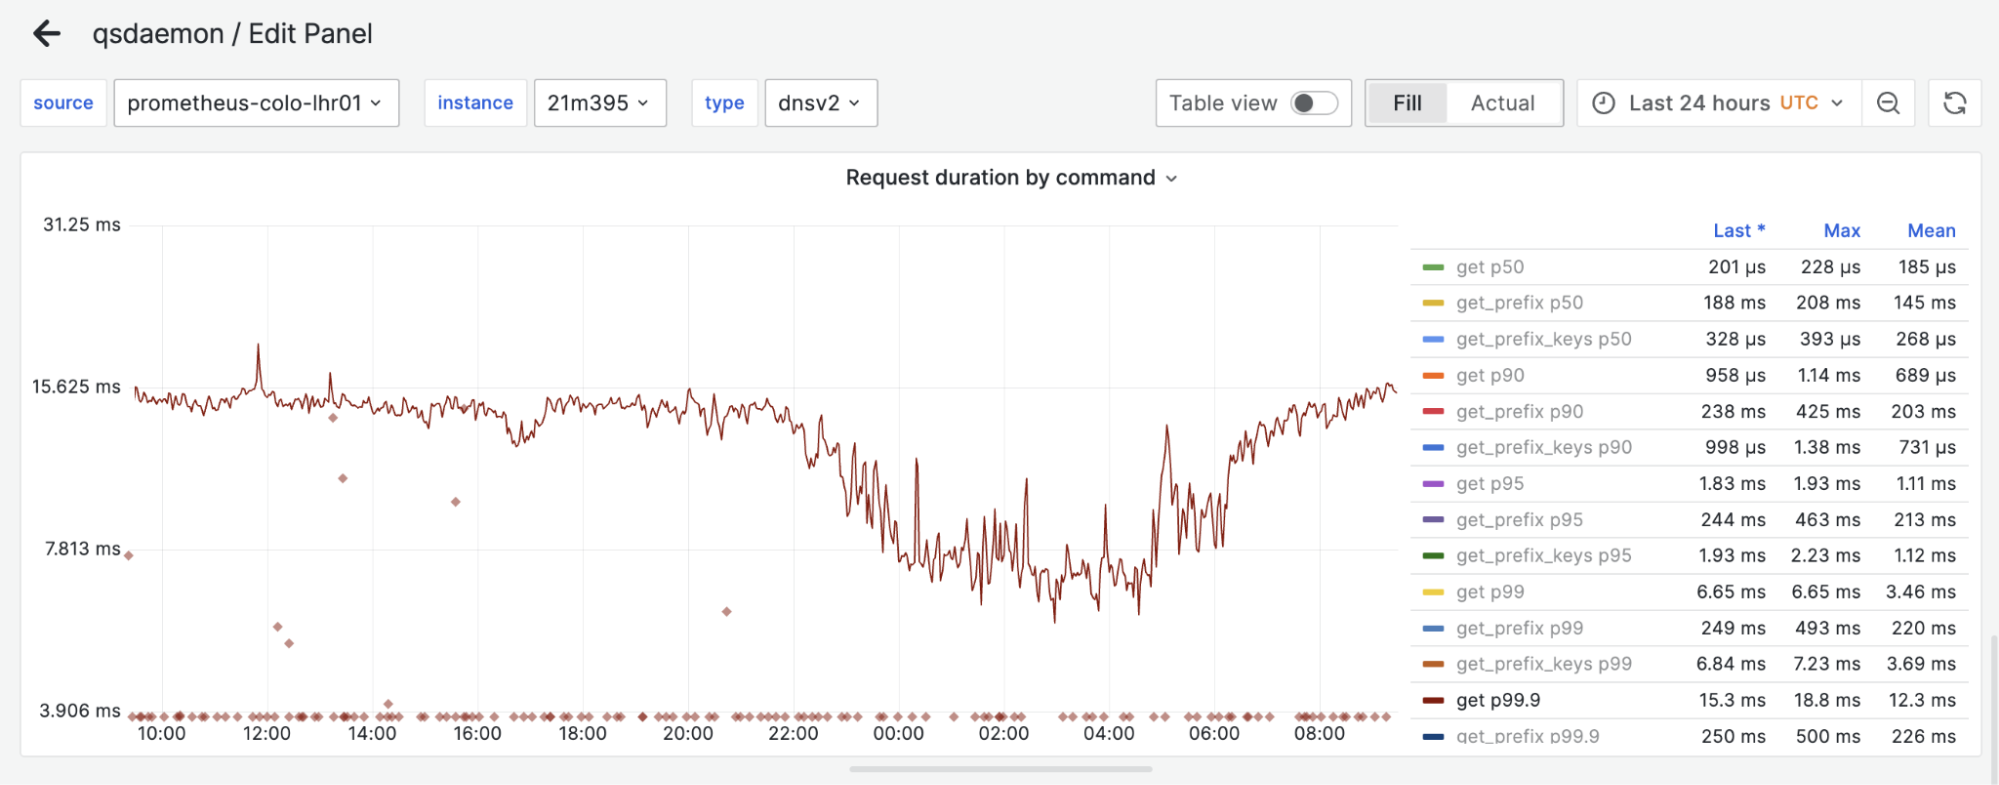
Replica
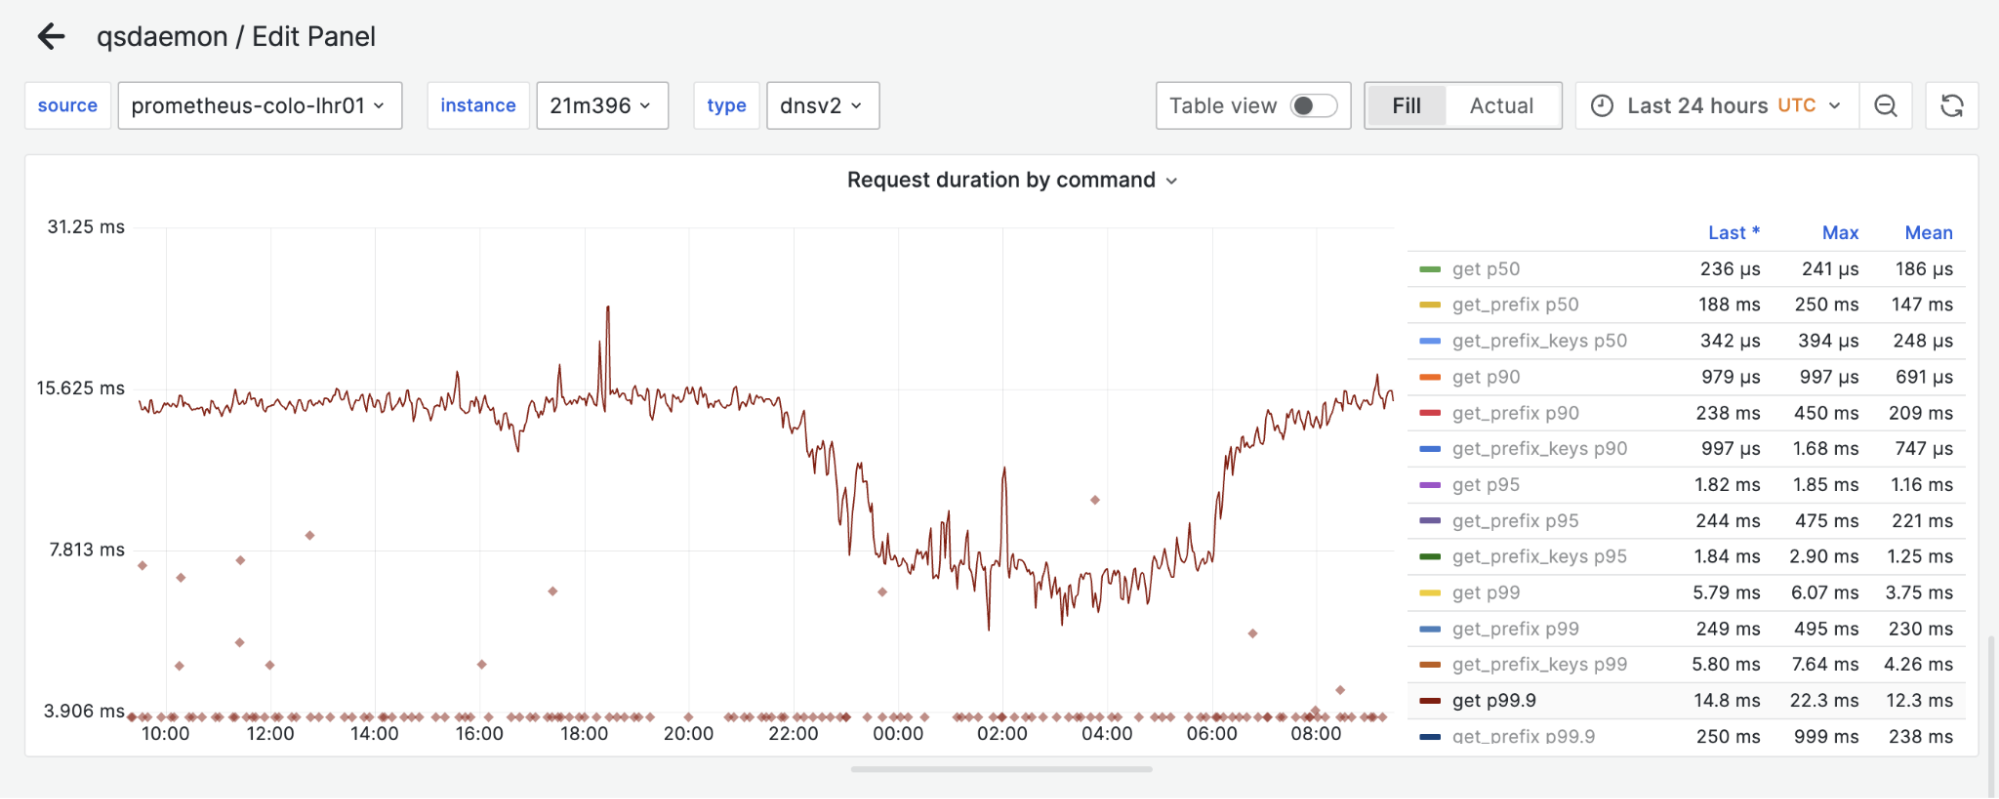
Figure 6. Proxy-replica latency comparison
Above, we have the 99.9% percentile of request latency on both a replica and proxy during a 24-hour window. One can hardly find a difference between the two. Surprisingly, proxies can even be slightly faster than replicas sometimes, likely because of smaller datasets on disk!
Quicksilver v1.5 is released but our journey to a highly scalable and efficient solution is not over. In the next post we’ll share what challenges we faced with the following iteration. Stay tuned!
This project was a big team effort, so we’d like to thank everyone on the Quicksilver team – it would not have come true without you all.
-
Aleksandr Matveev
-
Aleksei Surikov
-
Alex Dzyoba
-
Alexandra (Modi) Stana-Palade
-
Francois Stiennon
-
Geoffrey Plouviez
-
Ilya Polyakovskiy
-
Manzur Mukhitdinov
-
Volodymyr Dorokhov