Post Syndicated from Chris Deigan original https://aws.amazon.com/blogs/big-data/handling-data-erasure-requests-in-your-data-lake-with-amazon-s3-find-and-forget/
Data lakes are a popular choice for organizations to store data around their business activities. Best practice design of data lakes impose that data is immutable once stored, but new regulations such as the European General Data Protection Regulation (GDPR), California Consumer Privacy Act (CCPA), and others have created new obligations that operators now need to be able to erase private data from their data lake when requested.
When asked to erase an individual’s private data, as a data lake operator you have to find all the objects in your Amazon Simple Storage Service (Amazon S3) buckets that contain data relating to that individual. This can be complex because data lakes contain many S3 objects (each of which may contain multiple rows), as shown in the following diagram. You often can’t predict which objects contain data relating to an individual, so you need to check each object. For example, if the user mary34 asks to be removed, you need to check each object to determine if it contains data relating to mary34. This is the first challenge operators face: identifying which objects contain data of interest.
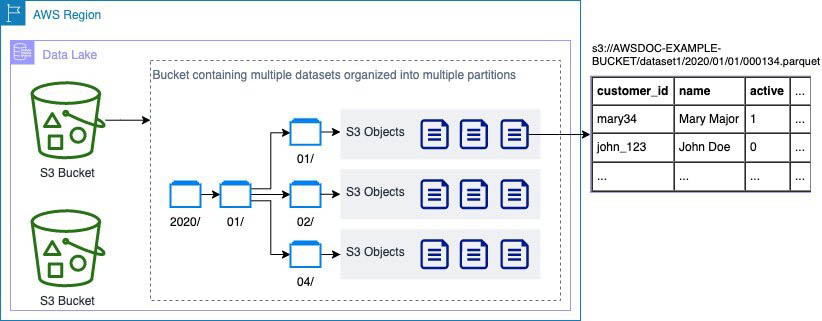
After you identify objects containing data of interest, you face a second challenge: you need to retrieve the object from the S3 bucket, remove relevant rows from the file, put a new version of the object into S3, and make sure you delete any older versions.
Locating and removing data manually can be time-consuming and prone to mistakes, considering the large number of objects typically in data lakes.
Amazon S3 Find and Forget solves these challenges with ready-to-use automations. It allows you to remove records from data lakes of any size that are in AWS Glue Data Catalog. The solution includes a web user interface that you can use and an API that you can use to integrate with your own applications.
Solution overview
Amazon S3 Find and Forget enables you to find and delete records automatically in data lakes on Amazon S3. Using the solution, you can:
- Define which tables from your AWS Glue Data Catalog contain data you want to erase
- Manage a queue of identifiers (such as unique customer identifiers) to erase
- Erase rows from your data lake matching the queued record identifiers
- Access a log of all actions taken by the solution
You can use Amazon S3 Find and Forget to work with data lakes stored on Amazon S3 in a supported file format.
The solution is developed and distributed as open-source software that you deploy and run inside your own AWS account. When deploying this solution, you only pay for the AWS services consumed to run it. We recommend reviewing the Cost Estimate guide and creating Amazon CloudWatch Billing Alarms to monitor charges before deploying the solution in your own account.
When you handle requests to remove data, you add the identifiers through the web interface or API to a Deletion Queue. The identifiers remain in the queue until you start a Deletion Job. The Deletion Job processes the queue and removes matching rows from objects in your data lake.
Where your requirements allow it, batching deletions can provide significant cost savings by minimizing the number of times the data lake needs to be re-scanned and processed. For example, you could start a Deletion Job once a week to process all requests received in the preceding week.
Solution demonstration
This section provides a demonstration of using Amazon S3 Find and Forget’s main features. To deploy the solution in your own account, refer to the User Guide.
For this demonstration, I have prepared in advance:
- An AWS account
- A data lake on Amazon S3, using a supported file format
- My data lake cataloged in AWS Glue
The first step is to deploy the solution using AWS CloudFormation by following the instructions in the User Guide. The CloudFormation stack can take 20-30 minutes to deploy depending on the options chosen when deploying.
Once deployed, I visit the web user interface by going to the address in the WebUIUrl CloudFormation stack output. Using a temporary password emailed to the address I provided in my CloudFormation parameters, I login and set a password for future use. I then see a dashboard with some base metrics for my Amazon S3 Find and Forget deployment:
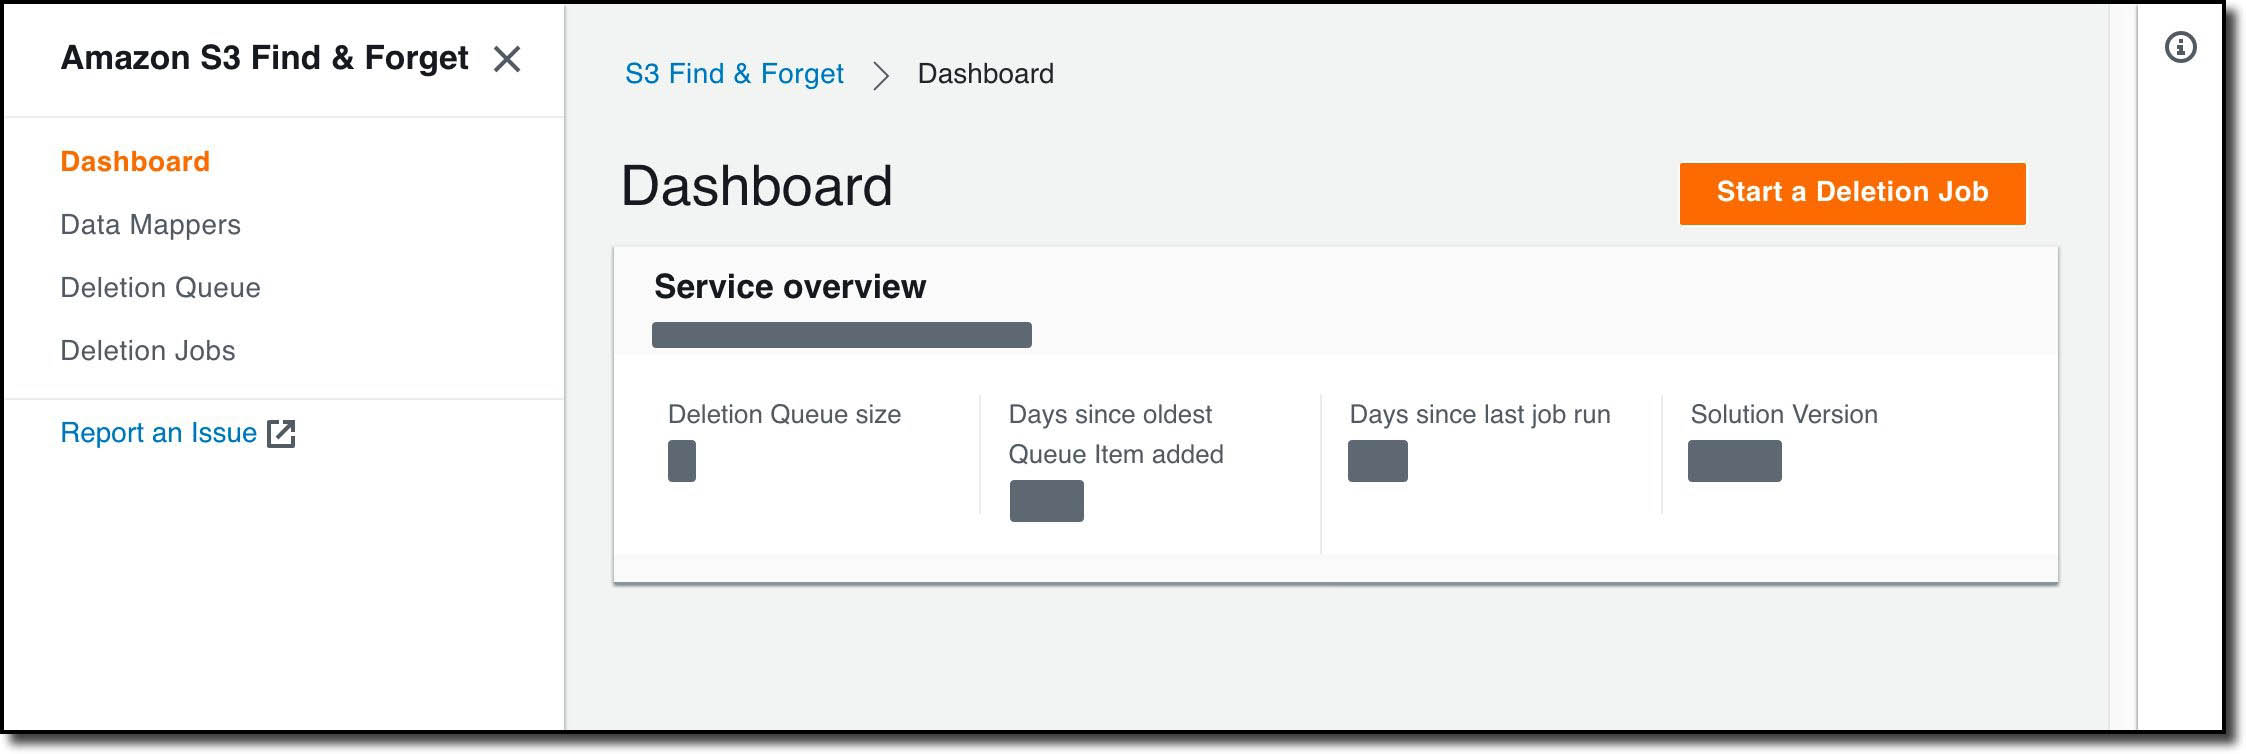
I now need to create a Data Mapper so that Amazon S3 Find and Forget can find my data lake. To do this, I select Data Mappers, then Create Data Mapper:
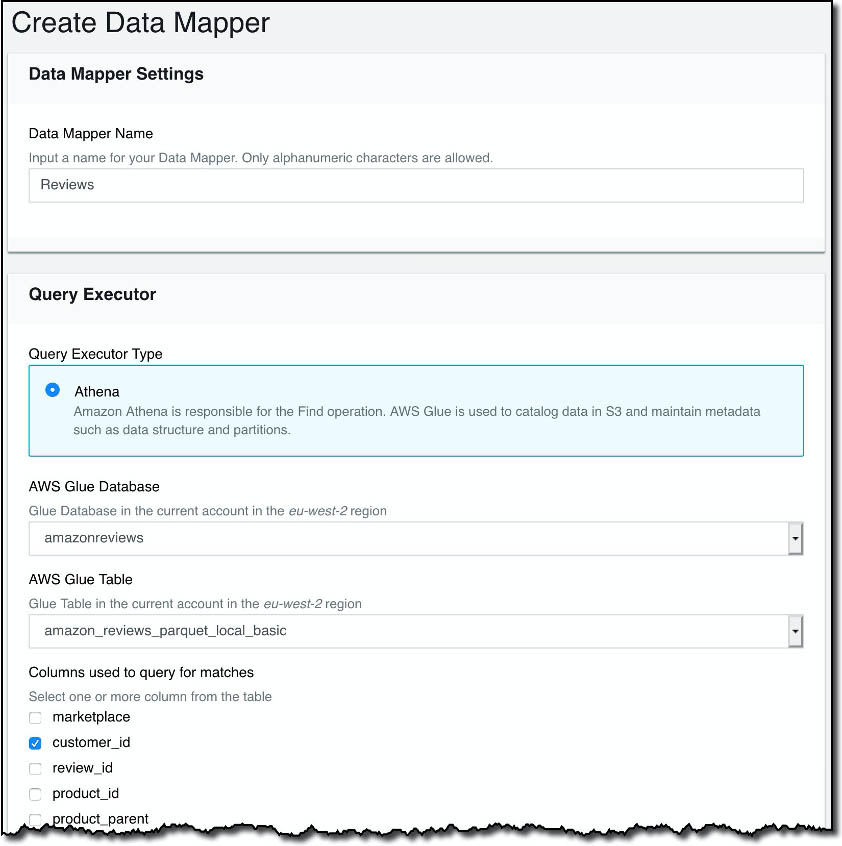
On this screen, I give my Data Mapper a name, choose the AWS Glue database and table in my account that I want to operate on, and the columns that I want my deletions to match. In this demonstration, I’m using a copy of the Amazon Customer Reviews Dataset that I copied to my own S3 bucket. I’ll be using the customer_id column to remove data. In the dataset, this field contains a unique identifier for each customer who has created a product review.
I then specify the IAM role to be used when modifying the objects in S3. I also choose whether I want the old S3 object versions to be deleted for me. I can turn this off if I want to implement my own strategy to manage deleting old object versions, such as by using S3 lifecycle policies.

After choosing Create Data Mapper the Data Mapper is created, and I am prompted to grant permissions for S3 Find and Forget to operate in my bucket. In the Data Mapper list, I select my new Data Mapper, then choose Generate Access Policies. The interface displays a sample bucket policy that I copy and paste into the bucket policy for my S3 bucket in the AWS Management Console.
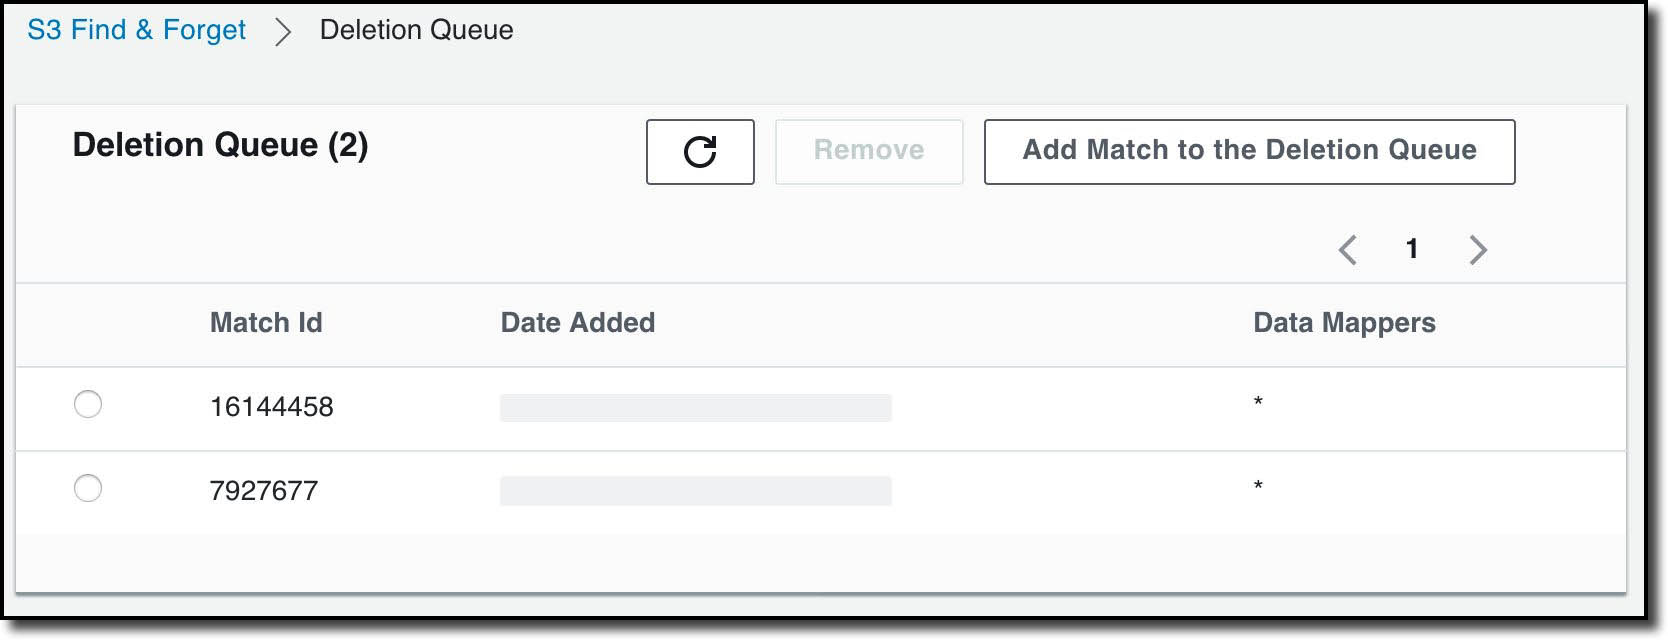
With the Data Mapper set up, I’m now able to add the customers who have requested to have their data deleted to the Deletion Queue. Using their Customer IDs, I go to the Deletion Queue section and select Add Match to the Deletion Queue.
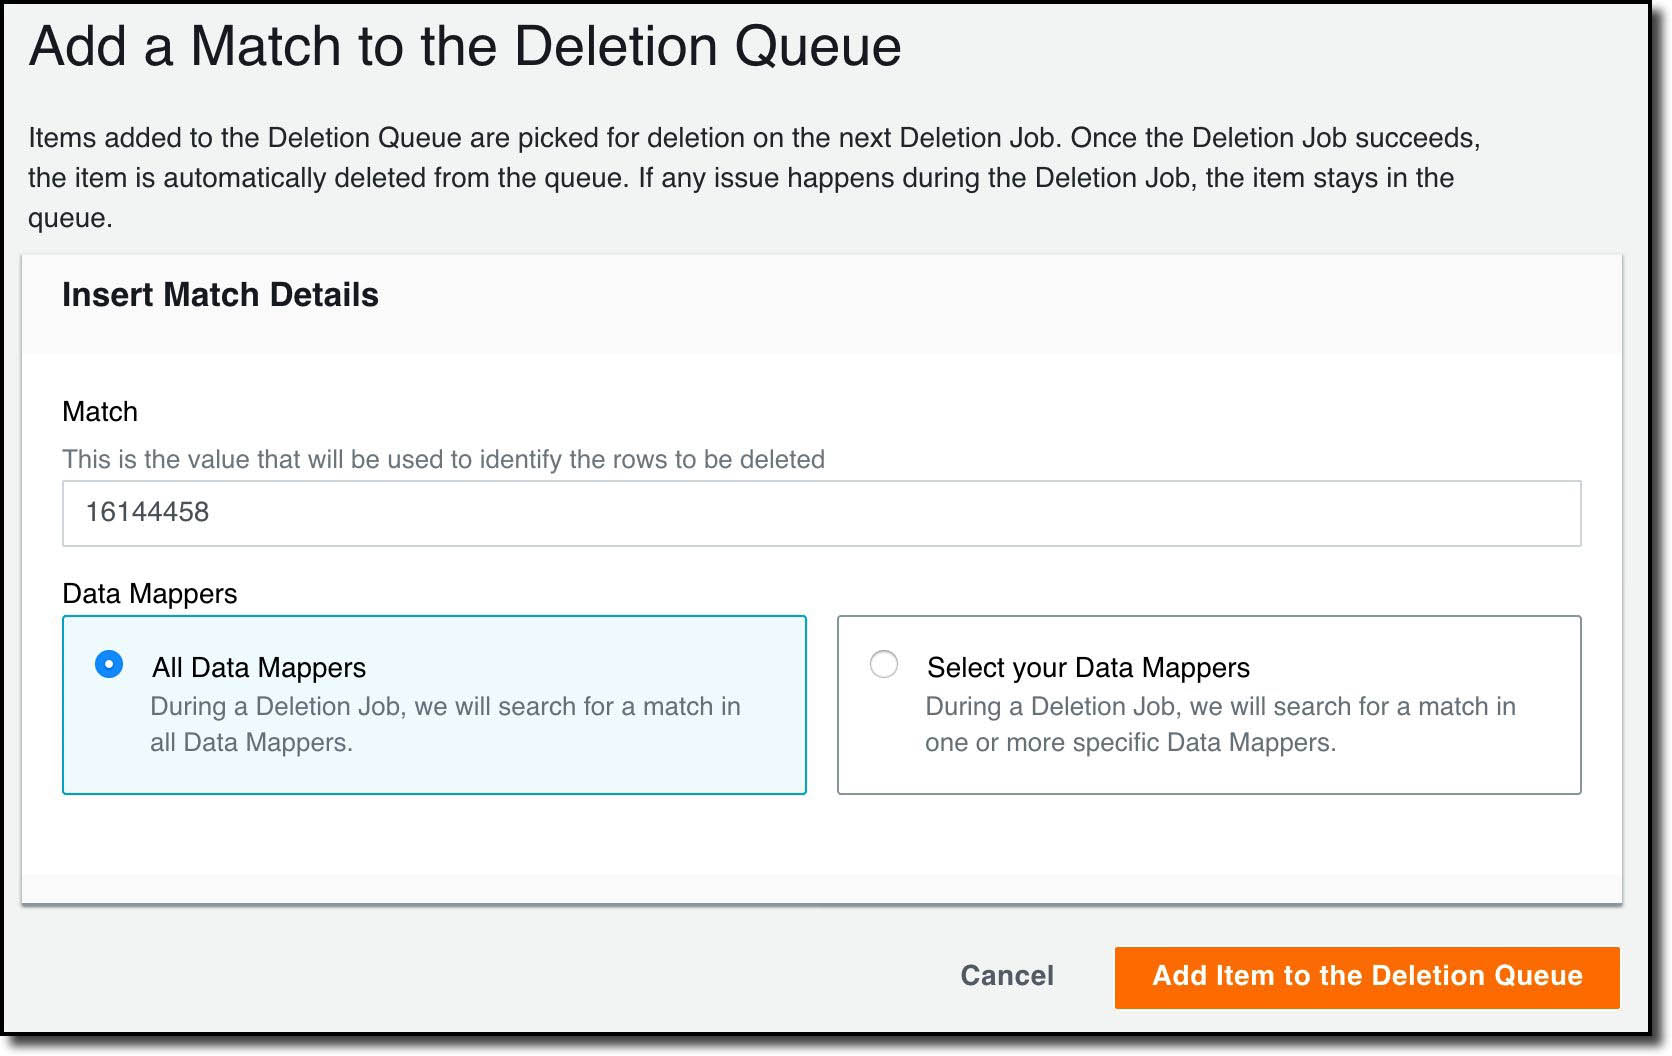
I’ve chosen to delete from all the available Data Mappers, but I can also choose specific ones. Once I’ve added my matches, I can see a list of them on Deletion Queue page:
I can now run a deletion job that will cause the matches to be deleted from the data lake. To do this, I select Deletion Jobs then Start a Deletion Job.
After a few minutes the Deletion Job completes, and I can see metrics collected during the job including that the job took just over two-and-a-half minutes:
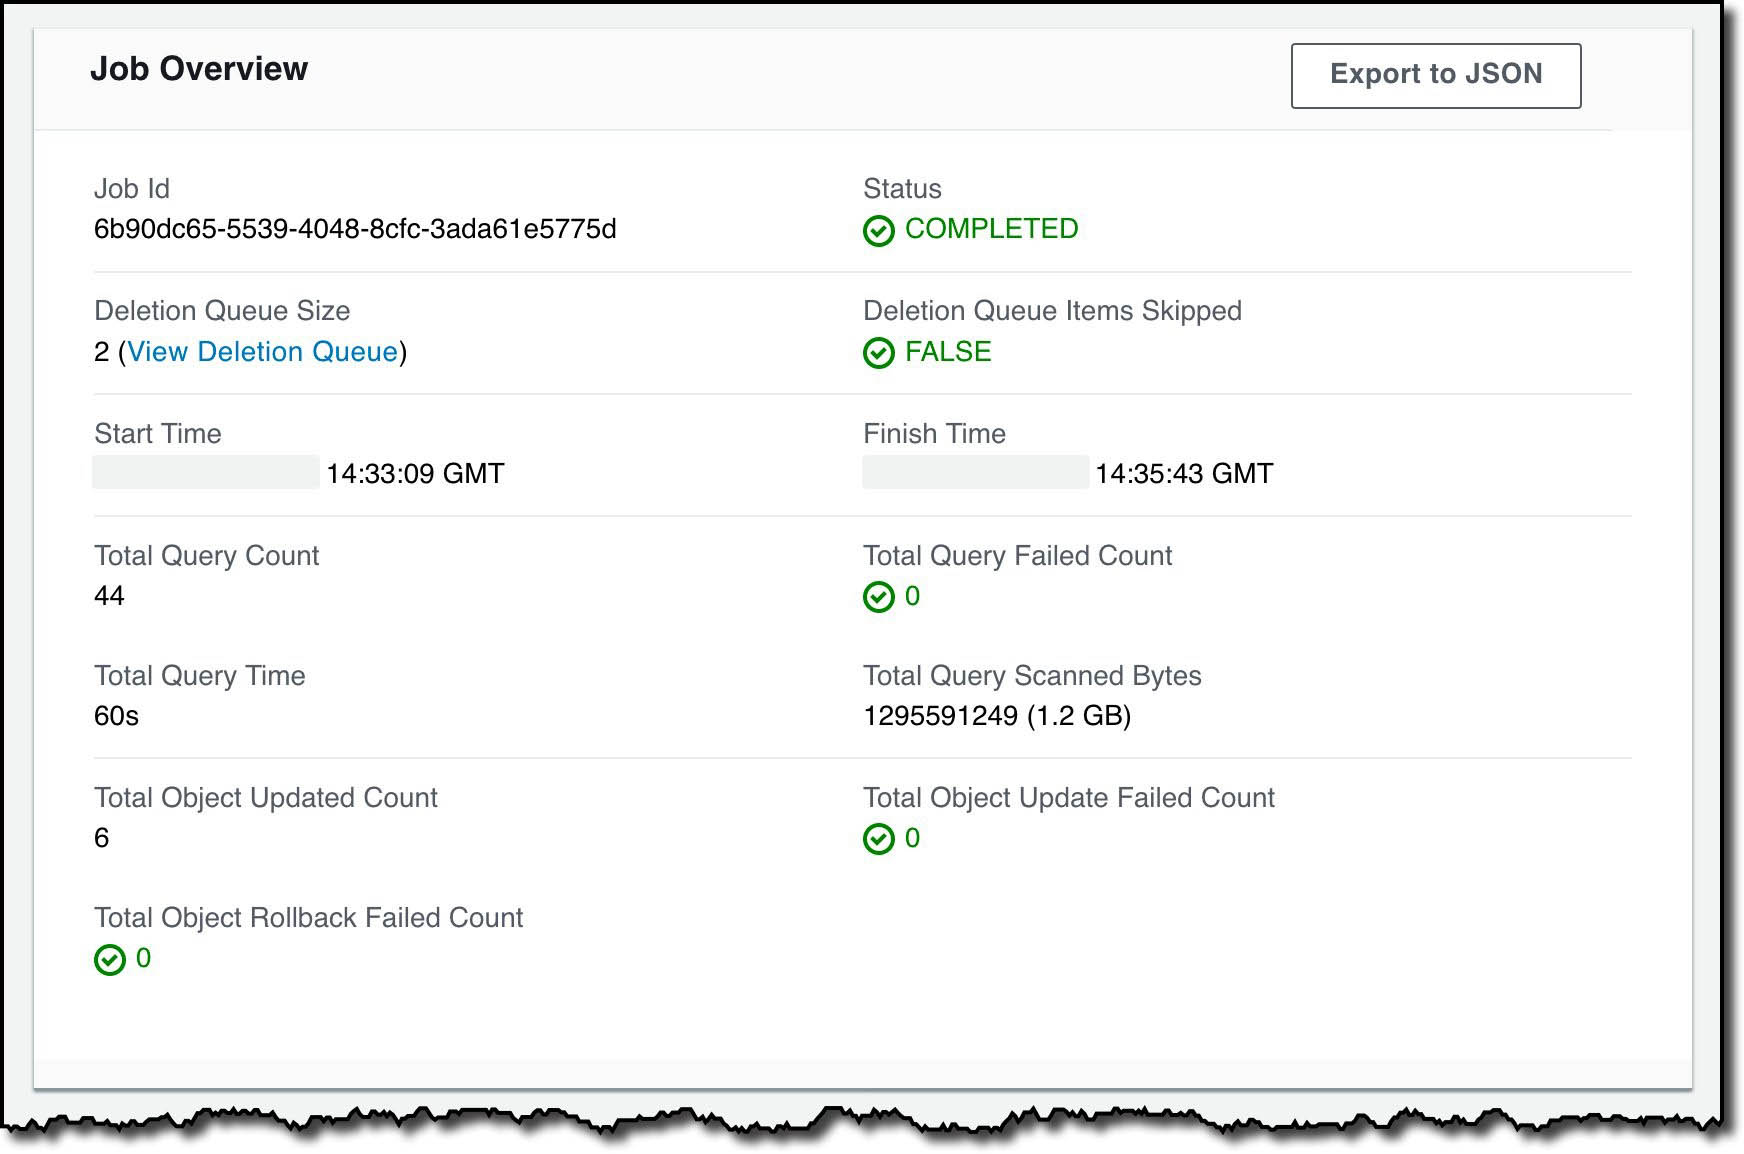
There is an Export to JSON option that includes all the metrics shown, more granular information about the Deletion Job, and which S3 objects were modified.
At this point the Deletion Queue is empty, and ready for me to use for future requests.
Solution design
This section includes a brief introduction to how the solution works. More comprehensive design documentation is available in the Amazon S3 Find and Forget GitHub repository.
The following diagram illustrates the architecture of this solution.
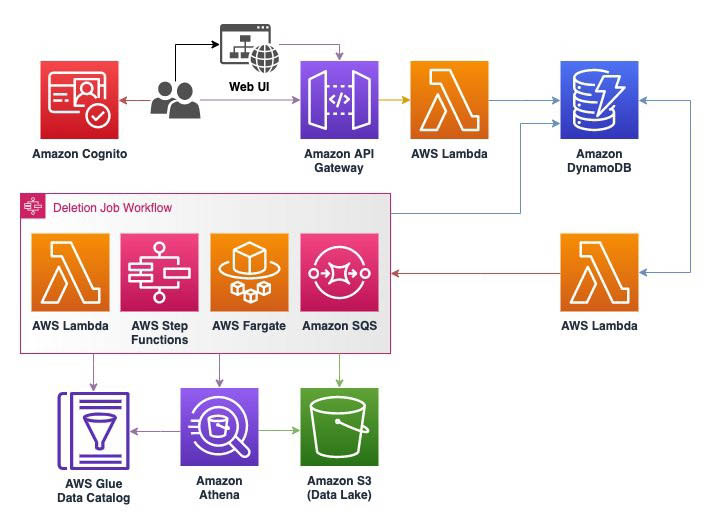
Amazon S3 Find and Forget uses AWS Serverless services to optimize for cost and scalability. The user interface and API are built using Amazon S3, Amazon Cognito, AWS Lambda, Amazon DynamoDB, and Amazon API Gateway, which automatically scale down when not in use so that there is no expensive baseline cost just for having the solution installed. These AWS services are always available and scale in concert with when the solution is used with a pay-for-what-you-use price model.
The Deletion Job workflow is coordinated using AWS Step Functions, Lambda, and Amazon Simple Queue Service (Amazon SQS). The solution uses Step Functions for high-level coordination and state tracking in the workflow, Lambda functions for discrete computation tasks, and Amazon SQS to store queues of repetitive work.
A deletion job has two phases: Find and Forget. In the Find phase, the solution uses Amazon Athena to scan the data lake for objects containing rows matching the identifiers in the deletion queue. For this to work at scale, we built a query planner Lambda function that uses the partition list in the AWS Glue Data Catalog for each data mapper to run an Athena query on each partition, returning the path to S3 objects that contain matches with the identifiers in the Deletion Queue. The object keys are then added to an SQS queue that we refer to as the Object Deletion Queue.
In the Forget phase, deletion workers are started as a service running on AWS Fargate. These workers process each object in the Object Deletion Queue by downloading the objects from the S3 bucket into memory, deleting the rows that contain matched identifiers, then putting a new version of the object to the S3 bucket using the same key. By default, older versions of the object are then deleted from the S3 bucket to make the deletion irreversible. You can alternatively disable this feature to implement your own strategy for deleting old object versions, such as by using an S3 Lifecycle policy.
Note that during the Forget phase, affected S3 objects are replaced at the time they are processed and are subject to the Amazon S3 data consistency model. We recommend that you avoid running a Deletion Job in parallel to a workload that reads from the data lake unless it has been designed to handle temporary inconsistencies between objects.
When the object deletion queue is empty, the Forget phase is complete and a final status is determined for the Deletion Job based on whether any errors occurred (for example, due to missing permissions for S3 objects).
Logs are generated for all actions throughout the Deletion Job, which you can use for reporting or troubleshooting. These are stored in DynamoDB, along with other persistent data including the Data Mappers and Deletion Queue.
Conclusion
In this post, we introduced the Amazon S3 Find and Forget solution, which assists data lake operators to handle data erasure requests they may receive pursuant to regulations such as GDPR, CCPA, and others. We then described features of the solution and how to use it for a basic use case.
You can get started today by deploying the solution from the GitHub repository, where you can also find more documentation of how the solution works, its features, and limits. We are continuing to develop the solution and welcome you to send feedback, feature requests, or questions through GitHub Issues.
About the Authors
 Chris Deigan is an AWS Solution Engineer in London, UK. Chris works with AWS Solution Architects to create standardized tools, code samples, demonstrations, and quick starts.
 Matteo Figus is an AWS Solution Engineer based in the UK. Matteo works with the AWS Solution Architects to create standardized tools, code samples, demonstrations and quickstarts. He is passionate about open-source software and in his spare time he likes to cook and play the piano.
 Nick Lee is an AWS Solution Engineer based in the UK. Nick works with the AWS Solution Architects to create standardized tools, code samples, demonstrations and quickstarts. In his spare time he enjoys playing football and squash, and binge-watching TV shows.
 Adir Sharabi is a Solutions Architect with Amazon Web Services. He works with AWS customers to help them architect secure, resilient, scalable and high performance applications in the cloud. He is also passionate about Data and helping customers to get the most out of it.
 Cristina Fuia is a Specialist Solutions Architect for Analytics at AWS. She works with customers across EMEA helping them to solve complex problems, design and build data architectures so that they can get business value from analyzing their data.




 Mahesh Goyal is a Data Architect in Big Data at AWS. He works with customers in their journey to the cloud with a focus on big data and data warehouses. In his spare time, Mahesh likes to listen to music and explore new food places with his family.