Post Syndicated from Benjamin Smith original https://aws.amazon.com/blogs/compute/introducing-aws-x-ray-new-integration-with-aws-step-functions/
AWS Step Functions now integrates with AWS X-Ray to provide a comprehensive tracing experience for serverless orchestration workflows.
Step Functions allows you to build resilient serverless orchestration workflows with AWS services such as AWS Lambda, Amazon SNS, Amazon DynamoDB, and more. Step Functions provides a history of executions for a given state machine in the AWS Management Console or with Amazon CloudWatch Logs.
AWS X-Ray is a distributed tracing system that helps developers analyze and debug their applications. It traces requests as they travel through the individual services and resources that make up an application. This provides an end-to-end view of how an application is performing.
What is new?
The new Step Functions integration with X-Ray provides an additional workflow monitoring experience. Developers can now view maps and timelines of the underlying components that make up a Step Functions workflow. This helps to discover performance issues, detect permission problems, and track requests made to and from other AWS services.
The Step Functions integration with X-Ray can be analyzed in three constructs:
Service map: The service map view shows information about a Step Functions workflow and all of its downstream services. This enables developers to identify services where errors are occurring, connections with high latency, or traces for requests that are unsuccessful among the large set of services within their account. The service map aggregates data from specific time intervals from one minute through six hours and has a 30-day retention.
Trace map view: The trace map view shows in-depth information from a single trace as it moves through each service. Resources are listed in the order in which they are invoked.
Trace timeline: The trace timeline view shows the propagation of a trace through the workflow and is paired with a time scale called a latency distribution histogram. This shows how long it takes for a service to complete its requests. The trace is composed of segments and sub-segments. A segment represents the Step Functions execution. Subsegments each represent a state transition.

Getting Started
X-Ray tracing is enabled using AWS Serverless Application Model (AWS SAM), AWS CloudFormation or from within the AWS Management Console. To get started with Step Functions and X-Ray using the AWS Management Console:
- Go to the Step Functions page of the AWS Management Console.
- Choose Get Started, review the Hello World example, then choose Next.
- Check Enable X-Ray tracing from the Tracing section.

Workflow visibility
The following Step Functions workflow example is invoked via Amazon EventBridge when a new file is uploaded to an Amazon S3 bucket. The workflow uses Amazon Textract to detect text from an image file. It translates the text into multiple languages using Amazon Translate and saves the results into an Amazon DynamoDB table. X-Ray has been enabled for this workflow.

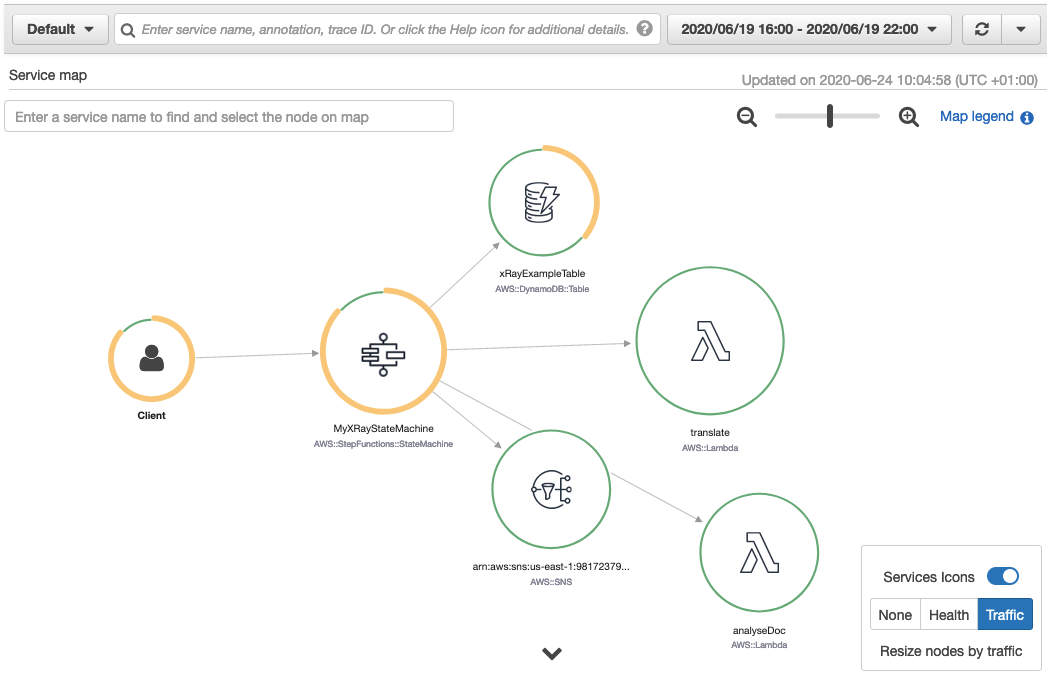
To view the X-Ray service map for this workflow, I choose the X-Ray trace map link at the top of the Step Functions Execution details page:

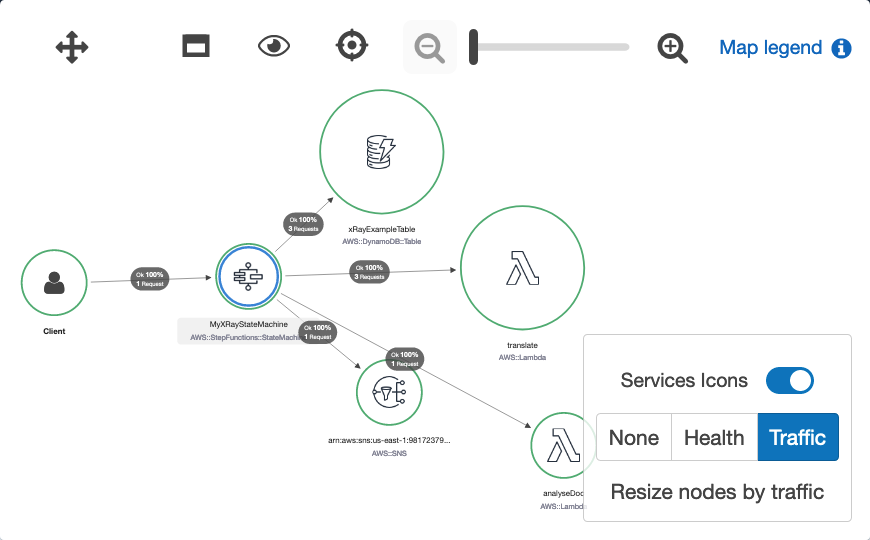
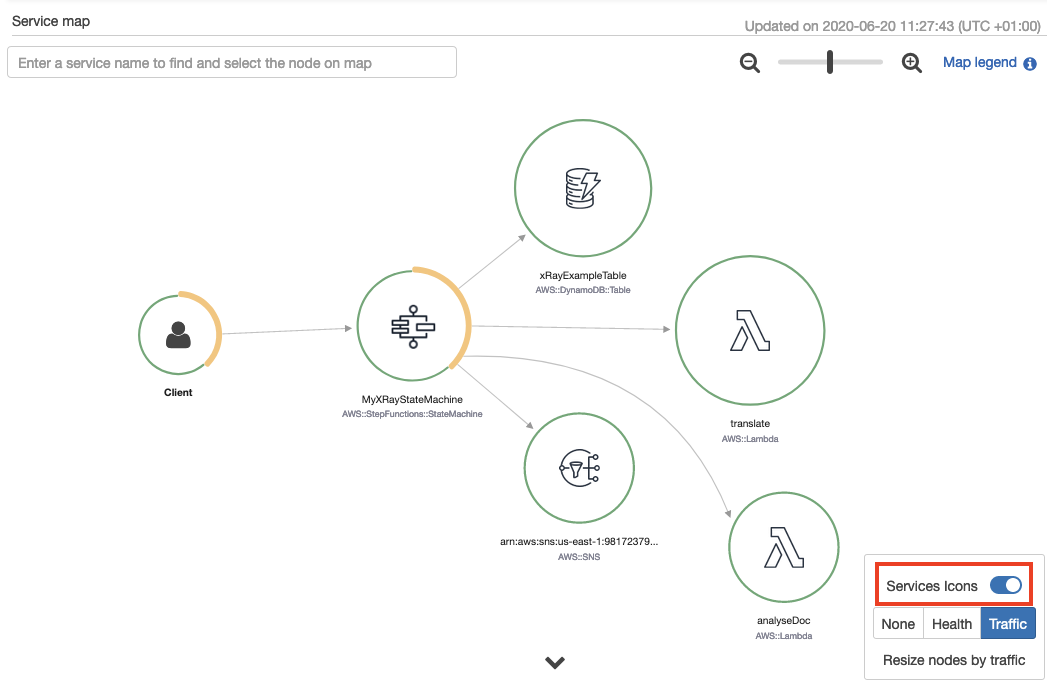
The service map is generated from trace data sent through the workflow. Toggling the Service Icons displays each individual service in this workload. The size of each node is weighted by traffic or health, depending on the selection.
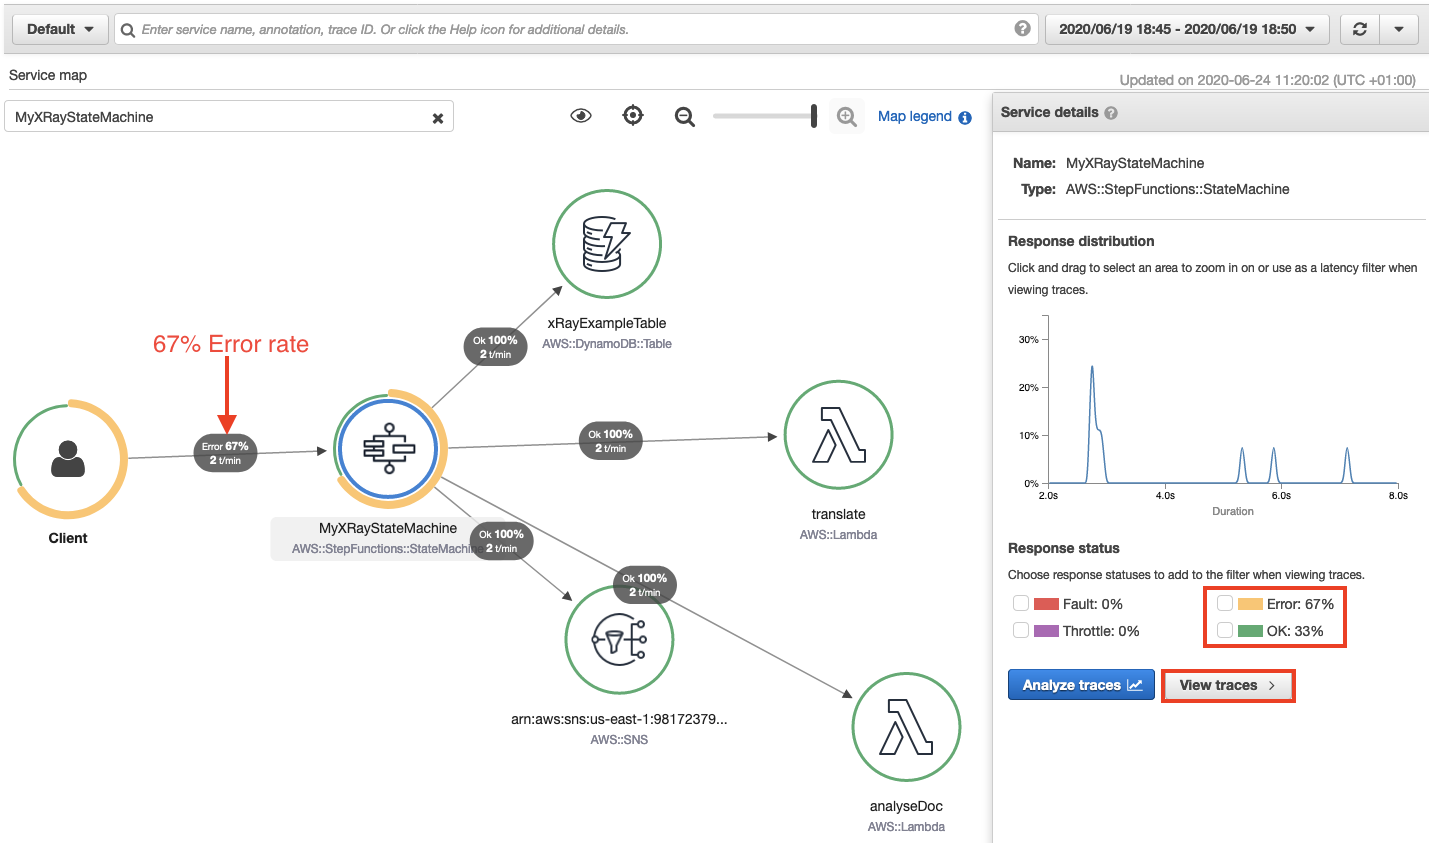
This shows the error percentage and average response times for each downstream service. T/min is the number of traces sent per minute in the selected time range. The following map shows a 67% error rate for the Step Functions workflow.
Accelerated troubleshooting
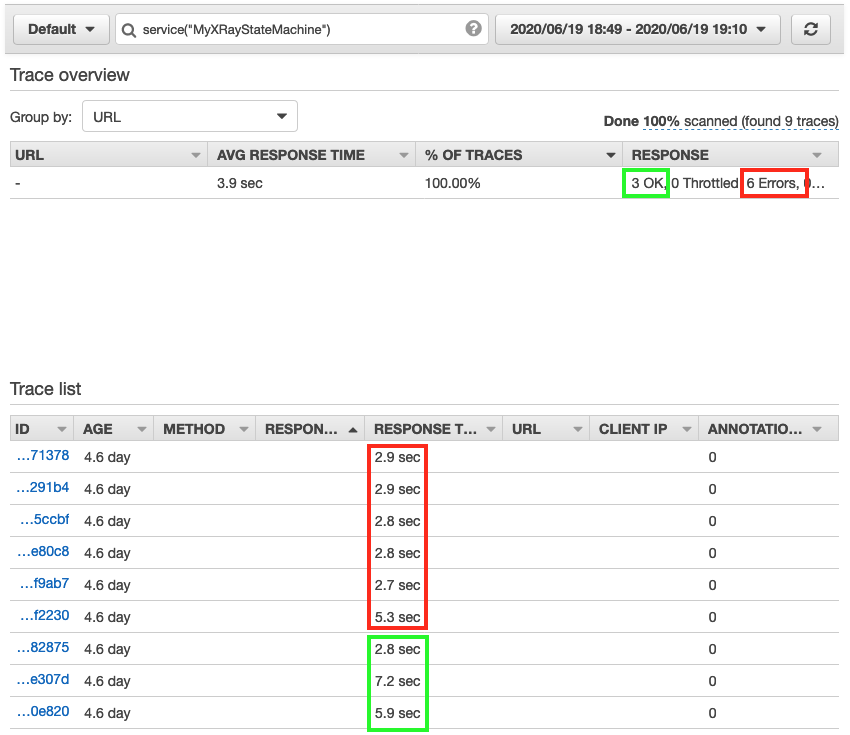
By drilling down through the service map, to the individual trace map, I quickly pinpoint the error in this workflow. I choose the Step Functions service from the trace map. This opens the service details panel. I then choose View traces. The trace data shows that from a group of nine responses, 3 completed successfully and 6 completed with error. This correlates with the response times listed for each individual trace. Three traces complete in over 5 seconds, while 6 took less than 3 seconds.
Choosing one of the faster traces opens the trace timeline map. This illustrates the aggregate response time for the workflow and each of its states. It shows a state named Read text from image invoked by a Lambda Function. This takes 2.3 seconds of the workflow’s total 2.9 seconds to complete.
A warning icon indicates that an error has occurred in this Lambda function. Hovering the curser over the icon, reveals that the property “Blocks” is undefined. This shows that an error occurred within the Lambda function (no text was found within the image). The Lambda function did not have sufficient error handling to manage this error gracefully, so the workflow exited.

Here’s how that same state execution failure looks in the Step Functions Graph inspector.

Performance profiling
The visualizations provided in the service map are useful for estimating the average latency in a workflow, but issues are often indicated by statistical outliers. To help investigate these, the Response distribution graph shows a distribution of latencies for each state within a workflow, and its downstream services.
Latency is the amount of time between when a request starts and when it completes. It shows duration on the x-axis, and the percentage of requests that match each duration on the y-axis. Additional filters are applied to find traces by duration or status code. This helps to discover patterns and to identify specific cases and clients with issues at a given percentile.

Sampling
X-Ray applies a sampling algorithm to determine which requests to trace. A sampling rate of 100% is used for state machines with an execution rate of less than one per second. State machines running at a rate greater than one execution per second default to a 5% sampling rate. Configure the sampling rate to determine what percentage of traces to sample. Enable trace sampling with the AWS Command Line Interface (AWS CLI) using the CreateStateMachine and UpdateStateMachine APIs with the enable-Trace-Sampling attribute:
--enable-trace-sampling trueIt can also be configured in the AWS Management Console.
Trace data retention and limits
X-Ray retains tracing data for up to 30 days with a single trace holding up to 7 days of execution data. The current minimum guaranteed trace size is 100Kb, which equates to approximately 80 state transitions. The actual number of state transitions supported will depend on the upstream and downstream calls and duration of the workflow. When the trace size limit is reached, the trace cannot be updated with new segments or updates to existing segments. The traces that have reached the limit are indicated with a banner in the X-Ray console.
For a full service comparison of X-Ray trace data and Step Functions execution history, please refer to the documentation.
Conclusion
The Step Functions integration with X-Ray provides a single monitoring dashboard for workflows running at scale. It provides a high-level system overview of all workflow resources and the ability to drill down to view detailed timelines of workflow executions. You can now use the orchestration capabilities of Step Functions with the tracing, visualization, and debug capabilities of AWS X-Ray.
This enables developers to reduce problem resolution times by visually identifying errors in resources and viewing error rates across workflow executions. You can profile and improve application performance by identifying outliers while analyzing and debugging high latency and jitter in workflow executions.
This feature is available in all Regions where both AWS Step Functions and AWS X-Ray are available. View the AWS Regions table to learn more. For pricing information, see AWS X-Ray pricing.
To learn more about Step Functions, read the Developer Guide. For more serverless learning resources, visit https://serverlessland.com.