Post Syndicated from Aritra Nag original https://aws.amazon.com/blogs/architecture/implement-monitoring-for-amazon-eks-with-managed-services/
In this post, we show you how to implement comprehensive monitoring for Amazon Elastic Kubernetes Service (Amazon EKS) workloads using AWS managed services. Amazon EKS offers compelling solutions with EKS Auto Mode and AWS Fargate, each designed for different use cases. This solution demonstrates building an EKS platform that combines flexible compute options with enterprise-grade observability using AWS native services and OpenTelemetry.
Modern containerized environments require observability that goes beyond basic CPU and memory metrics. Our approach addresses three critical challenges: reducing compute management complexity, closing observability gaps, and enabling metrics-driven automatic scaling that responds to real application demand rather than infrastructure utilization alone.
Architecture components
Amazon Managed Service for Prometheus is a fully managed Prometheus-compatible service that alleviates the operational overhead of running Prometheus infrastructure while providing automatic scaling to handle billions of metrics, built-in high availability across multiple Availability Zones, 150 days of metrics retention by default, and native integration with Grafana and other visualization tools.
AWS Distro for OpenTelemetry (ADOT) is a secure, enterprise-grade distribution of OpenTelemetry that provides standardized metrics, traces, and logs collection, native AWS service integration, automatic instrumentation for popular frameworks, and efficient data processing and export.
Amazon CloudWatch is a centralized logging and monitoring service offering structured log aggregation and search, custom metrics and alarms, integration with AWS services, and long-term log retention and analysis.
Solution overview
This section outlines the comprehensive monitoring solution architecture and its key components. We explore how the different AWS services work together to provide complete observability for your Amazon EKS workloads.
Our solution addresses key challenges through a comprehensive observability pipeline using Amazon Managed Service for Prometheus, AWS X-Ray, and Amazon CloudWatch; real metrics-based automatic scaling using custom Prometheus metrics instead of basic resource utilization; and cost optimization through strategic virtual private cloud (VPC) endpoints and compute mode selection.
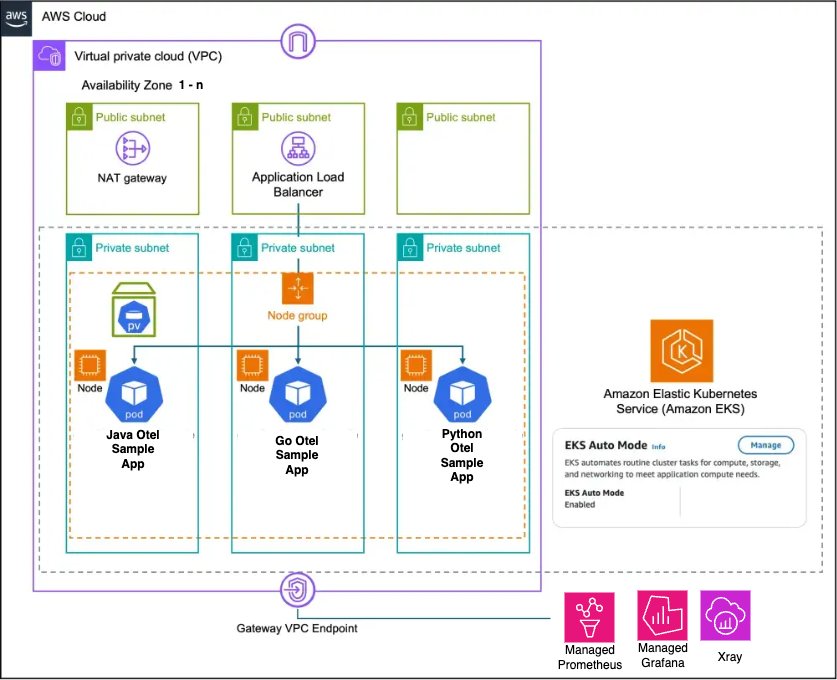
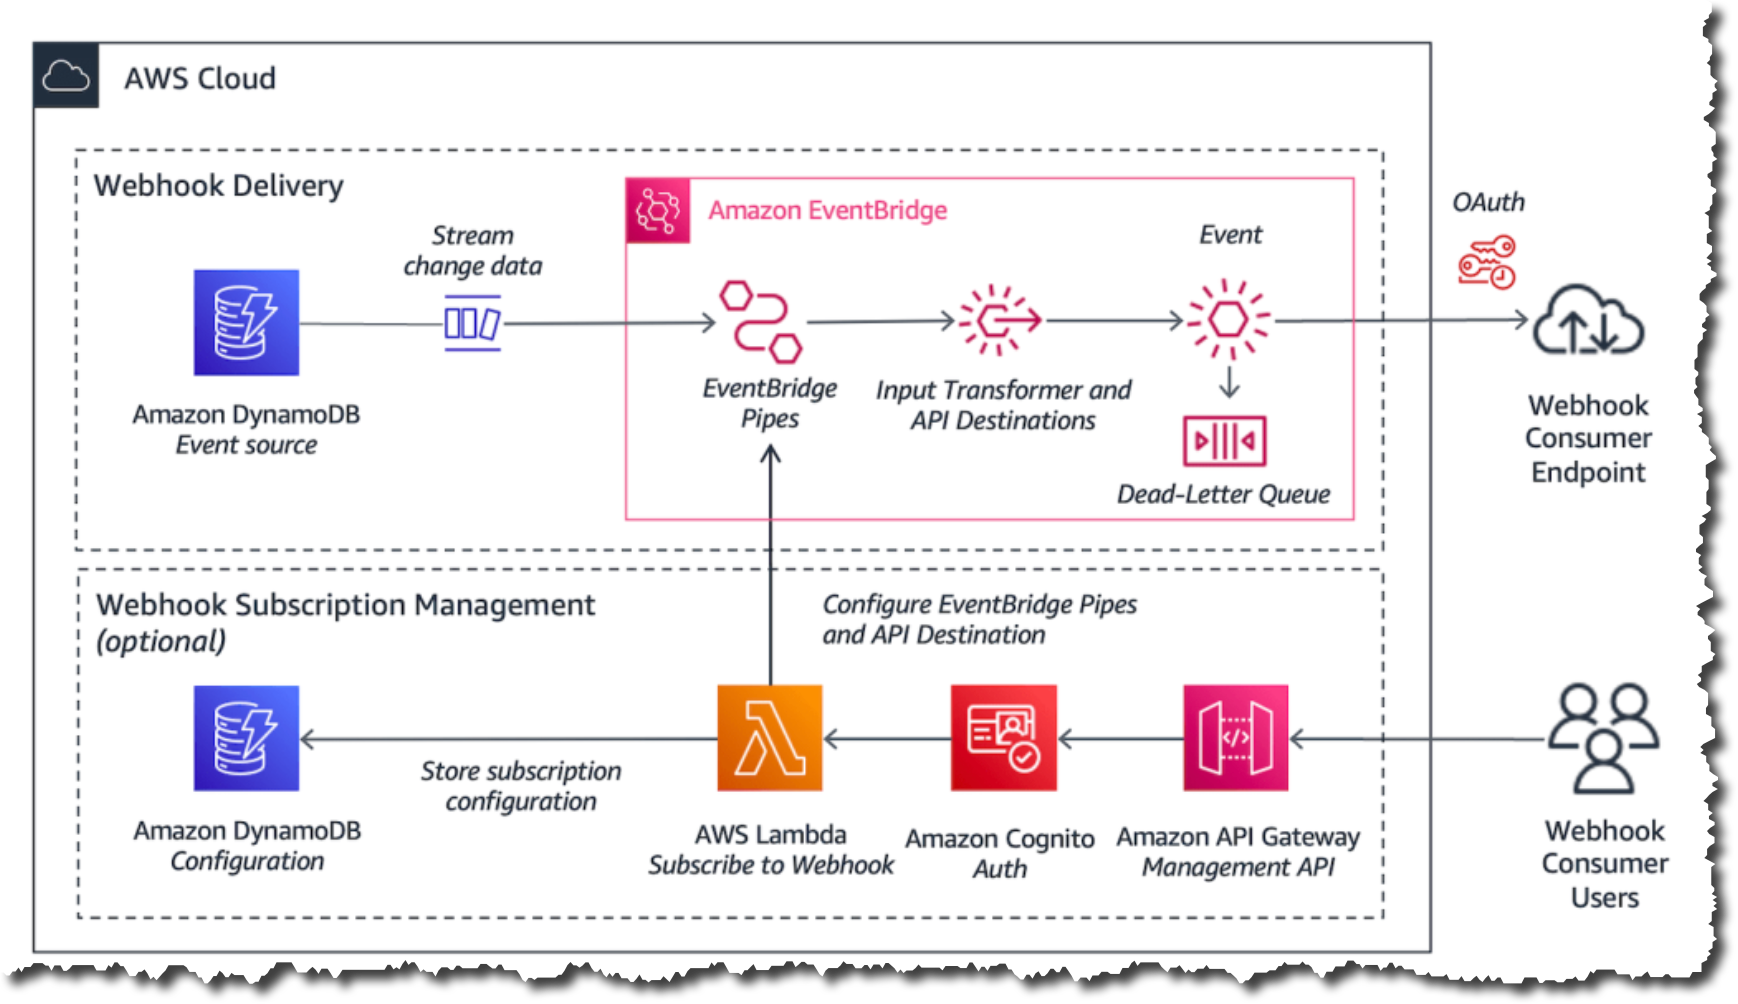
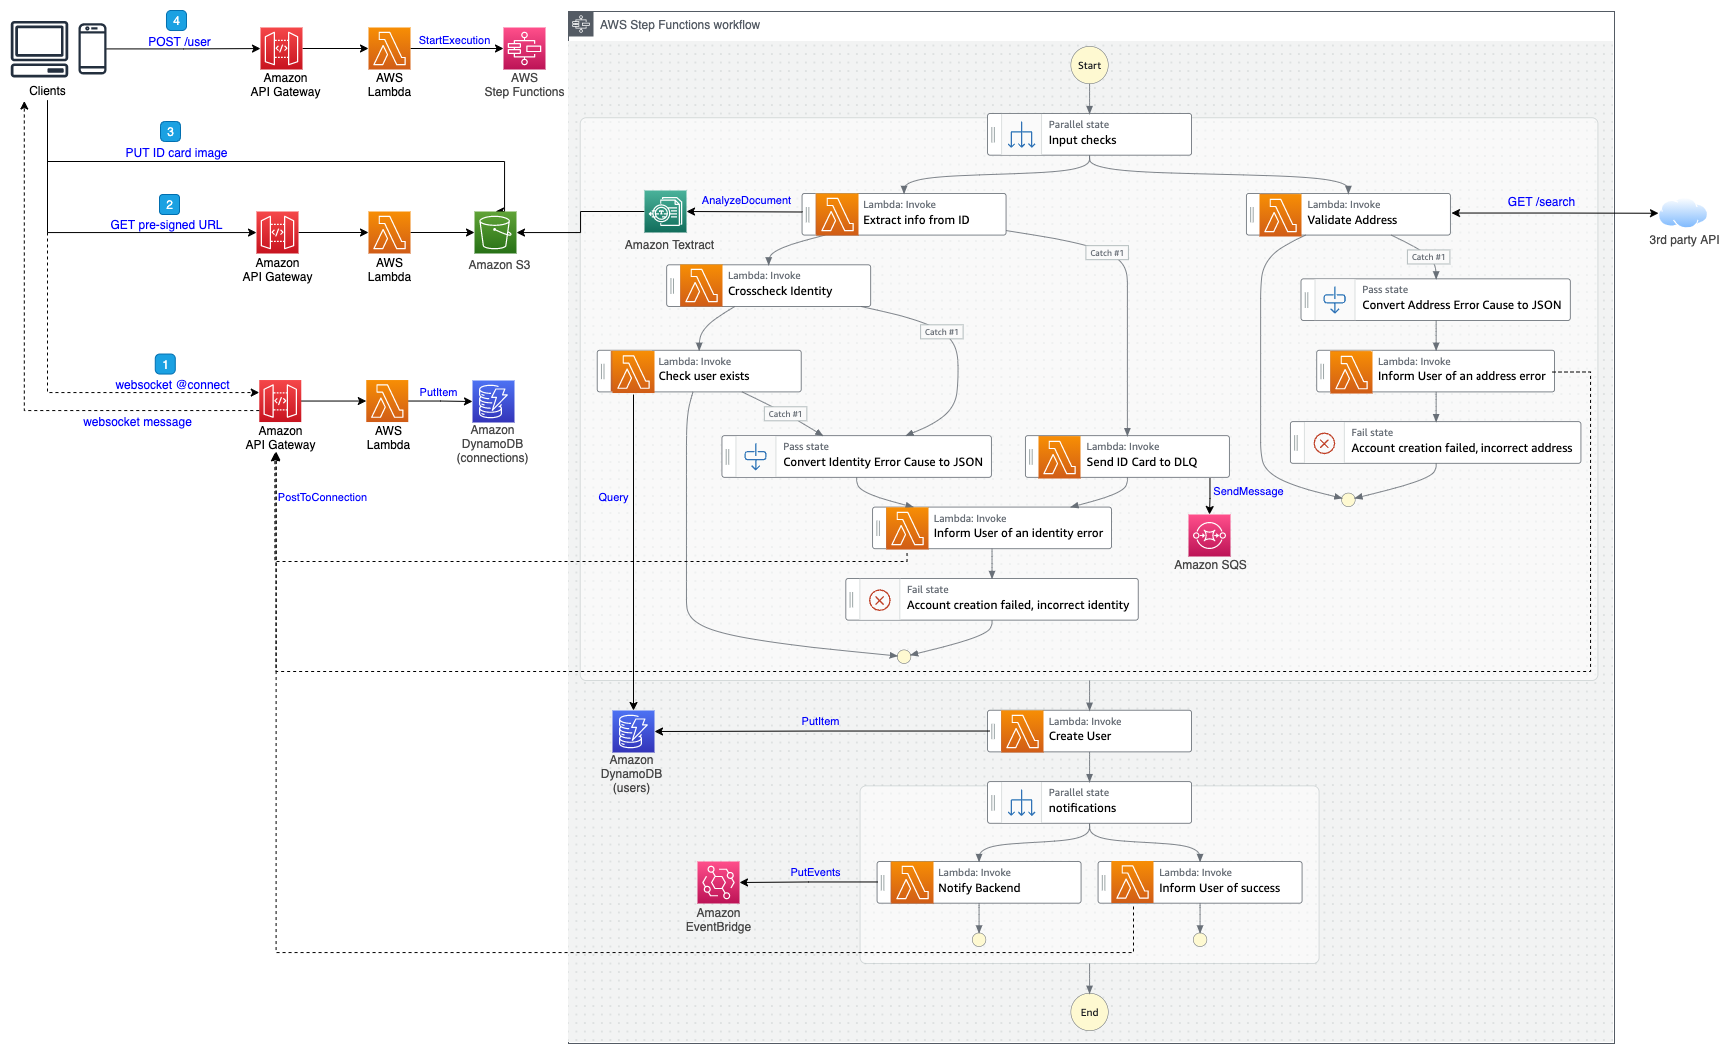
The architecture showcases a Kubernetes environment with two distinct compute modes, each optimized for different use cases. EKS Auto Mode represents AWS’s latest approach to managed Kubernetes compute. It eliminates the need for node management by removing the requirement to configure node groups or instance types. The platform automatically scales compute resources based on your actual workload demands, ensuring you pay only for the resources your applications consume. It comes with integrated services including automatic configuration of VPC CNI, EBS CSI driver, and load balancer integration, making it ideal for general workloads and cost-optimized deployments. The Amazon EKS Auto Mode architecture (shown in the following diagram) provides zero node management with automatic scaling based on workload demands. This mode includes integrated networking, storage, and load balancing capabilities, making it ideal for general workloads and cost-optimized deployments.
AWS Fargate takes a different approach by providing true serverless container execution. With Fargate, you don’t need to manage any Amazon EC2 instances, as each pod runs in its own isolated compute environment. This isolation extends to billing, where costs are tracked at the individual pod level, providing granular control over your expenses. Pods can scale independently without requiring capacity planning, making Fargate particularly well-suited for security-sensitive workloads and applications requiring strict resource isolation.The Amazon EKS Fargate architecture (shown in the following diagram) offers serverless container execution with strong isolation, where each pod runs in its own compute environment. This approach works best for security-sensitive workloads and applications requiring granular cost control.
The key architectural difference lies in networking and scaling behavior. Auto Mode uses shared node networking with cluster-wide scaling decisions, whereas Fargate provides isolated pod networking with individual pod scaling.
Comprehensive observability pipeline
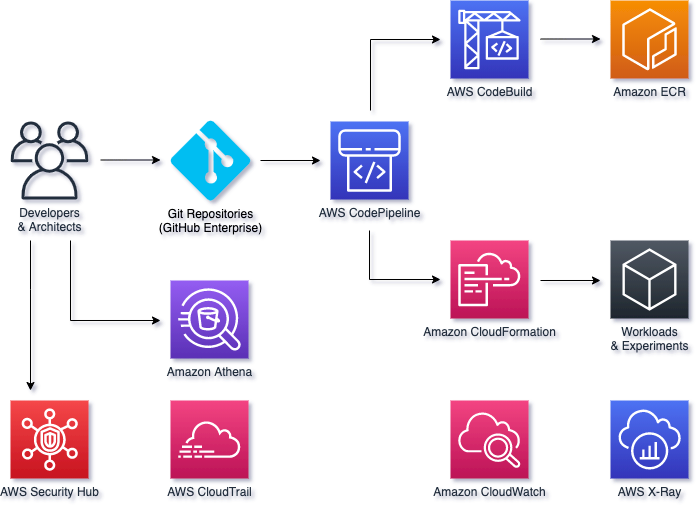
The following diagram illustrates the workflow of the observability pipeline.
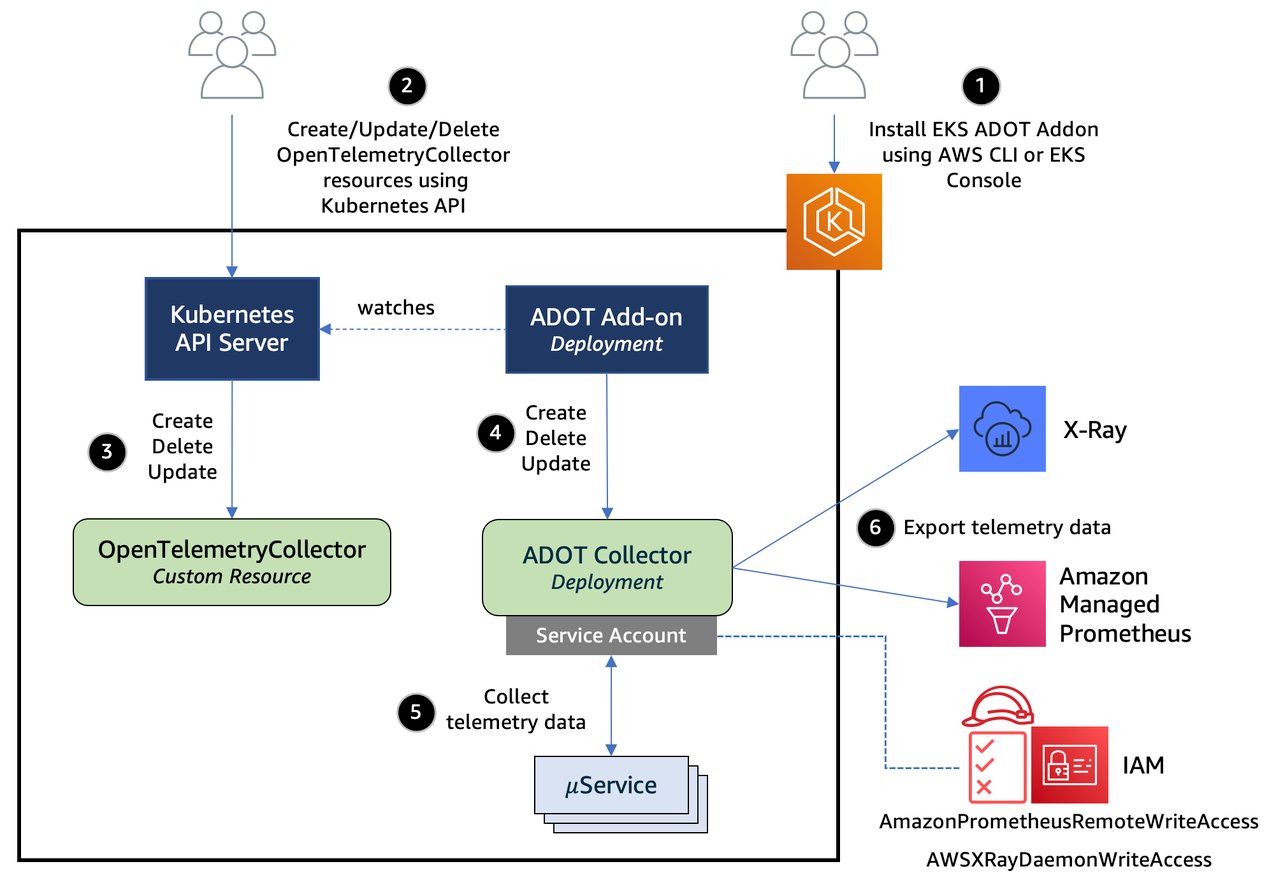
The observability architecture implements the three pillars of observability using AWS native services:
- Metrics collection and storage:
- Dual collection strategy combining direct Prometheus scraping and OpenTelemetry SDK
- Local Prometheus server for Horizontal Pod Autoscaler (HPA) metrics and Prometheus Adapter integration
- Amazon Managed Service for Prometheus for long-term storage and querying
- Custom metrics exposed through Kubernetes custom metrics API
- Distributed tracing:
- OpenTelemetry SDK integration for automatic trace collection
- AWS Distro for OpenTelemetry (ADOT) collector for data processing
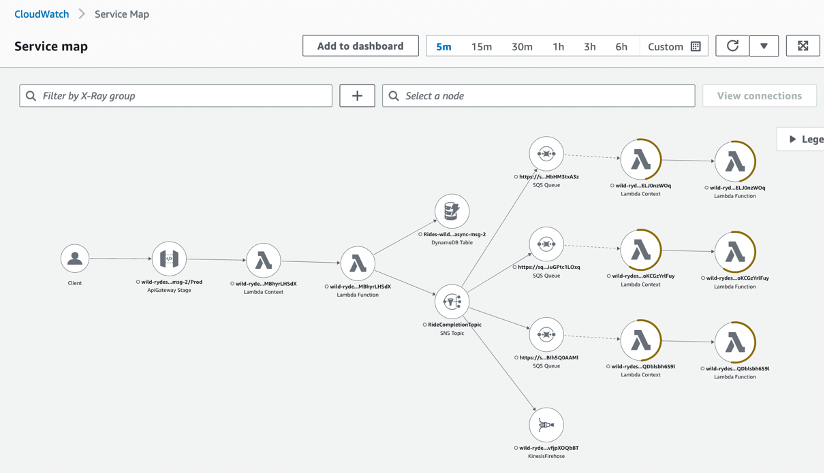
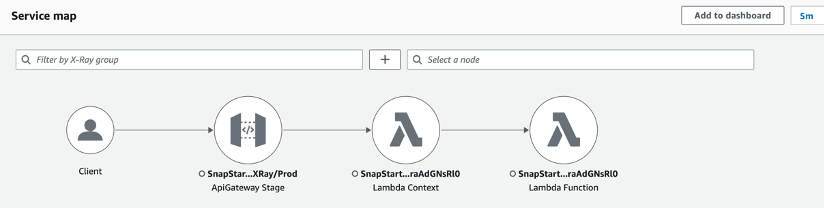
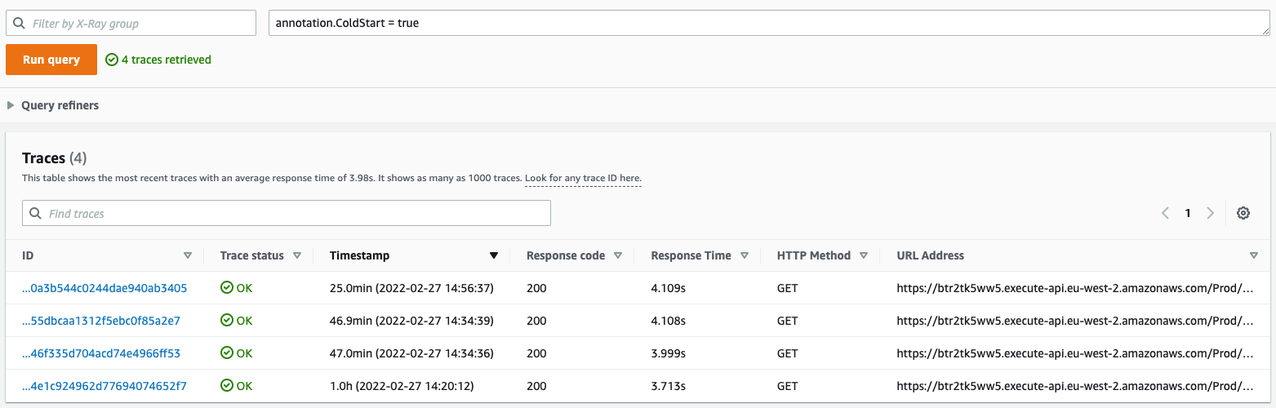
- AWS X-Ray for trace storage and service map visualization
- End-to-end transaction monitoring across microservices
- Centralized logging:
- OpenTelemetry SDK for structured application logging
- FluentBit for container log collection
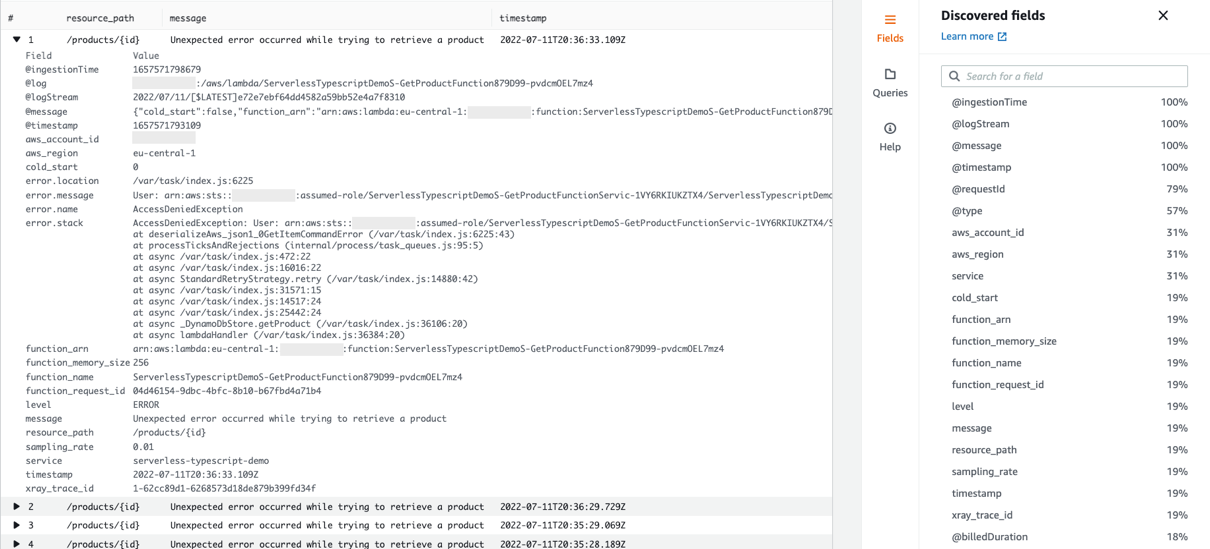
- CloudWatch Logs with proper retention policies
- Log correlation with traces and metrics for comprehensive debugging
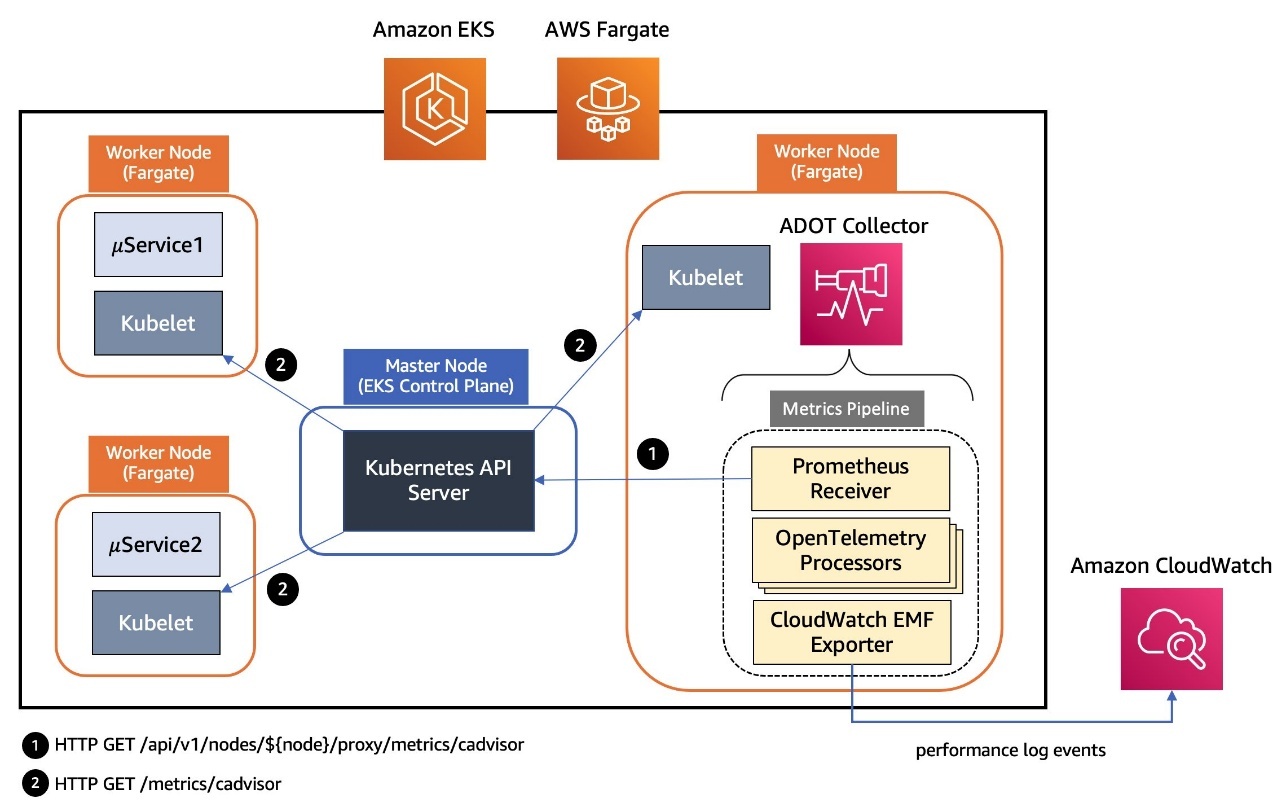
The below diagram demonstrates a modern cloud-native monitoring solution that collects and analyzes performance data from containerized applications, with data flowing from the Kubernetes workloads through the metrics pipeline to CloudWatch for centralized monitoring and observability.
In the following sections, we walk you through deploying the complete observability stack. We start with the foundational AWS services, then configure the collection agents, and finally instrument your applications.
Prerequisites
Before implementing this solution, you must have the following:
- AWS account setup:
- AWS Command Line Interface (AWS CLI) version 2.15.0 or later
- AWS Identity and Access Management (IAM) roles with the following permissions:
- Development environment:
- Node.js 18.x or later
- Python 3.9+
- Docker 24.0+
- Kubectl 1.28+
- AWS Cloud Development Kit (AWS CDK) 2.100.0 or later
- Basic understanding and familiarity with the following:
- Kubernetes concepts
- AWS networking (VPC, subnets, security groups)
- Observability concepts (metrics, traces, logs)
- Containerized applications
Create the observability stack
The first step to implement the observability stack involves creating the core AWS services that will store and process your observability data using the AWS CDK:
Deploy the infrastructure stack using the following commands:
Deploy local Prometheus for HPA
This step configures Prometheus for service discovery and remote write to Amazon Managed Service for Prometheus. The local Prometheus instance enables the HPA to access custom metrics:
Apply the configuration to your cluster:
Configure the ADOT Collector
Deploy the ADOT Collector with proper AWS service integration. This collector processes telemetry data from your applications and exports it to AWS services:
Deploy the collector:
Instrument your applications
This section shows how to instrument your applications to emit telemetry data. We cover both Python and Java applications.
Instrument a Python Flask application
The following code demonstrates how to add OpenTelemetry instrumentation to a Python Flask application:
Instrument a Java application
For Java applications using Spring Boot, add the following instrumentation:
Build and deploy your instrumented applications to the EKS cluster with the appropriate annotations for Prometheus scraping.
Configure the Prometheus Adapter for custom metrics
The Prometheus Adapter exposes custom metrics from Prometheus to the Kubernetes custom metrics API, enabling the HPA to use application-specific metrics:
Deploy the Prometheus Adapter:
Configure HPAs with custom metrics
Create HPAs that use custom metrics instead of basic resource utilization:
Apply the HPA configuration:
Monitoring and visualization
After implementing this solution, you can create custom dashboards in Amazon Managed Grafana to monitor the following:
- Application performance metrics
- Request rates and latencies
- Resource utilization
- Error rates
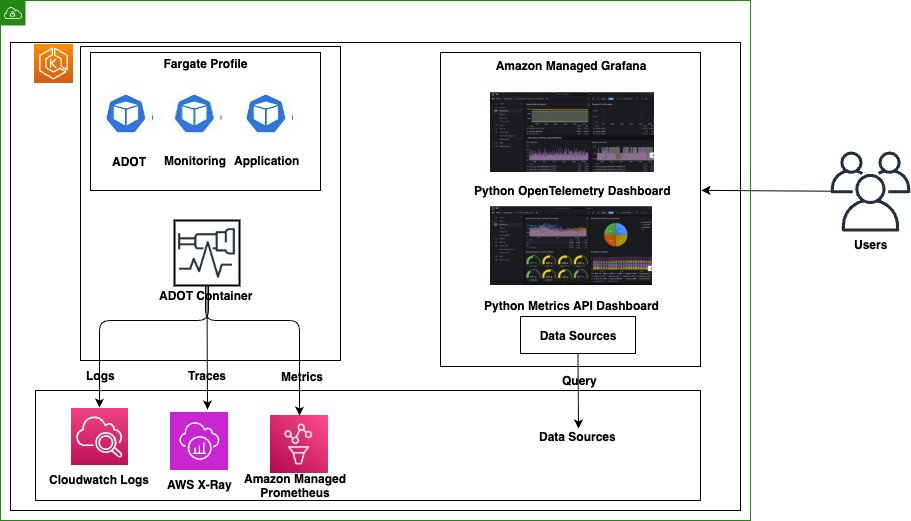
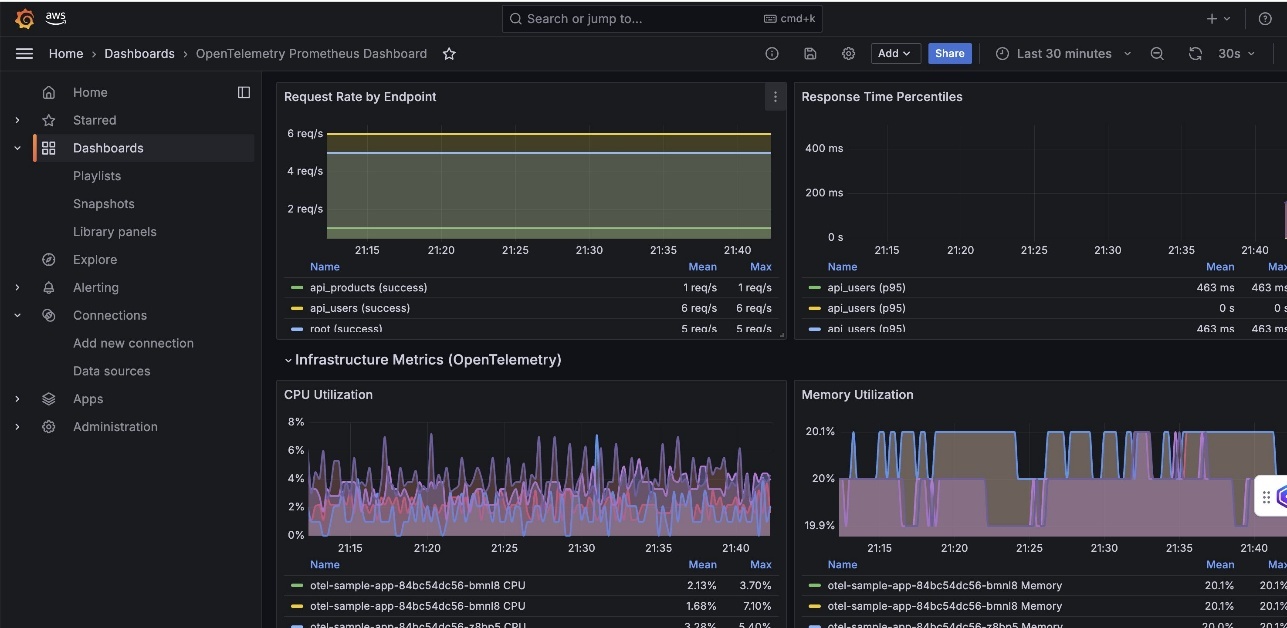
For dashboard examples and templates, refer to the Amazon Managed Grafana documentation. The following screenshots are examples of some of the dashboards you can build:
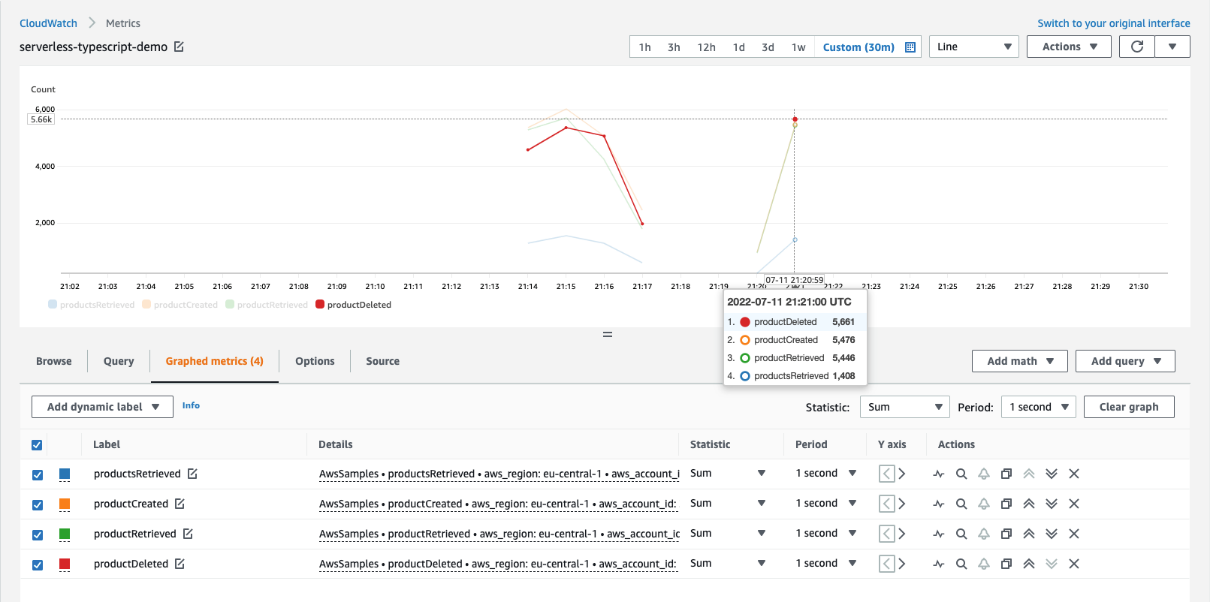
- OpenTelemetry Prometheus Dashboard – This dashboard displays Python application performance with request rate by endpoints, response time percentiles (P50, P95, P99), CPU utilization trends, memory usage patterns, and error rates segmented by HTTP status codes.
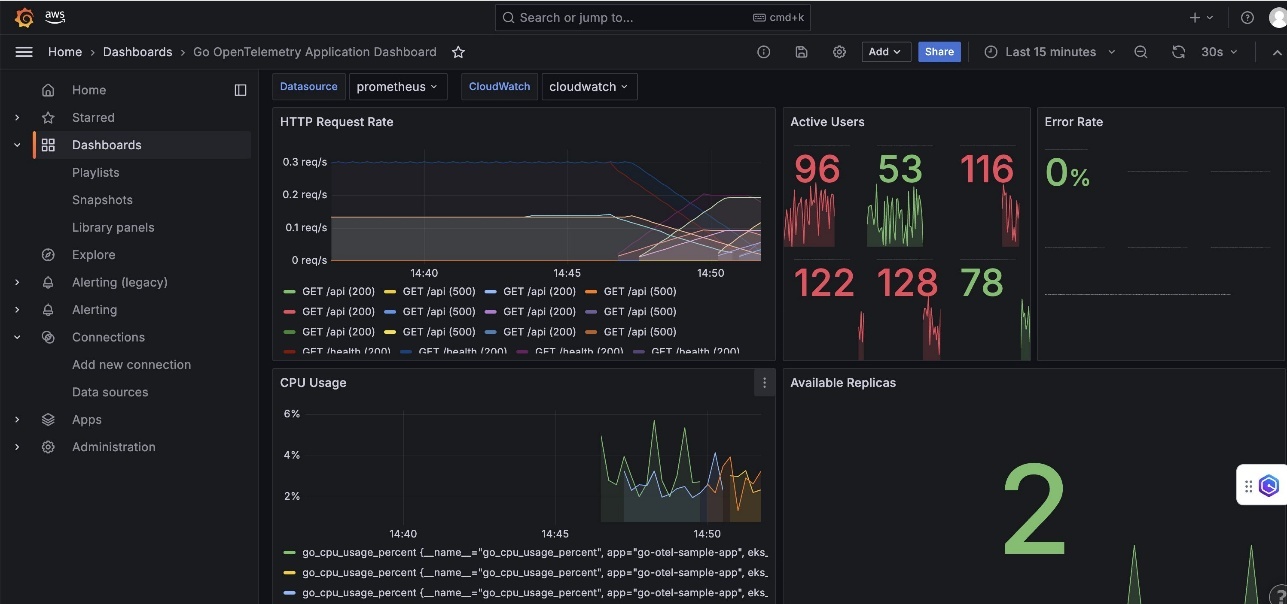
- Go OpenTelemetry Application Dashboard – This dashboard focuses on Go-specific metrics including HTTP request rate, active concurrent users, goroutine counts, CPU usage, and memory allocation patterns with garbage collection insights.
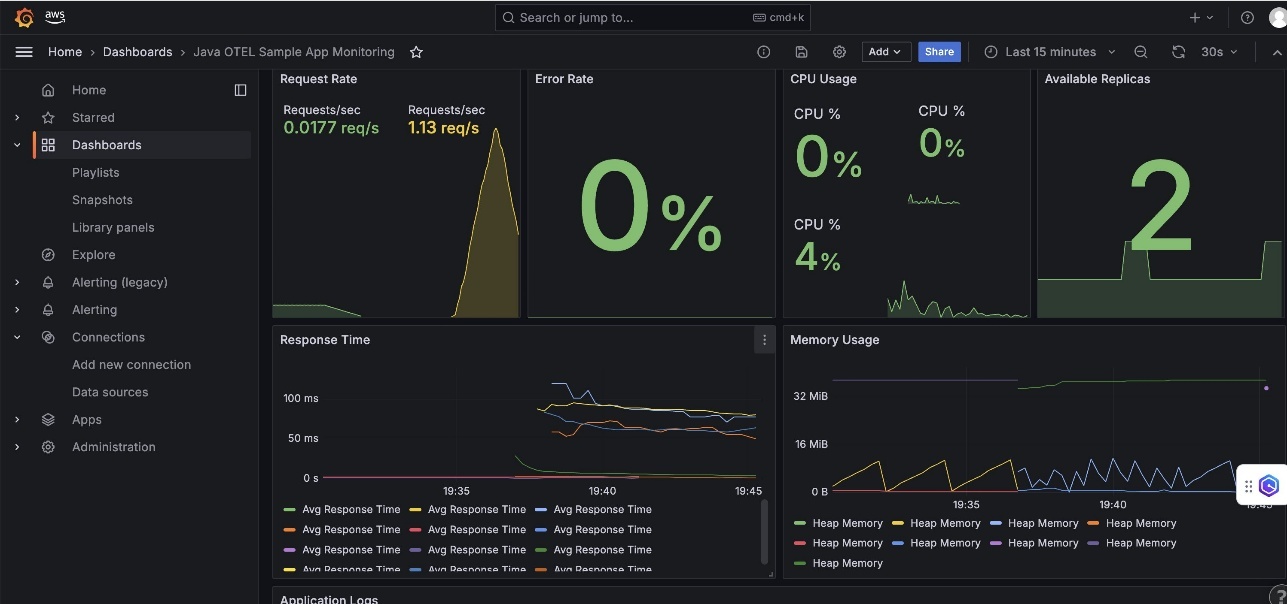
- Java OTEL Sample App Monitoring – This dashboard shows JVM-specific metrics like heap memory utilization, alongside application-level metrics such as requests per second, garbage collection insights, and thread pool utilization.
The dashboards enable real-time application performance monitoring, infrastructure resource utilization tracking, error rate monitoring and alerting, and automatic scaling visualization and trends.
Best practices and recommendations
Choose Amazon EKS Auto Mode for the following use cases and features:
- You’re building general-purpose applications that benefit from cost optimization and operational simplicity
- You’re managing mixed workload types and want to use integrated AWS service features
- Teams want to avoid the complexity of node management
- Cost-efficiency and ease of operations are priorities for production workloads
Choose Amazon EKS with Fargate in the following scenarios:
- Security isolation is paramount for your applications
- You’re running batch or event-driven workloads that require strong container isolation
- Your organization requires granular cost attribution at the pod level
- Compliance mandates dictate complete container isolation from the underlying infrastructure
For your observability strategy, consider the following monitoring approach:
- Use business metrics for HPA scaling decisions
- Implement proper metric labeling for filtering and aggregation
- Monitor both application and infrastructure metrics
- Set up alerting based on Service Level Indicator (SLI) and Service Level Objective (SLO) definitions
Additionally, implement the following tracing approach:
- Instrument critical code paths with OpenTelemetry
- Use consistent trace context propagation
- Monitor service dependencies through AWS X-Ray service maps
- Implement proper error handling and trace sampling
Benefits of the solution
Instead of relying on basic CPU and memory metrics, this solution configures the Prometheus Adapter to expose custom metrics to the Kubernetes HPA. The HPA configuration shown in this post enables more intelligent scaling decisions based on actual application load, resulting in better resource efficiency and improved application performance. This approach allows your applications to scale based on business-relevant metrics such as request rate, queue length, or custom application metrics rather than generic infrastructure utilization. This solution offers reduced management overhead through the following features:
- Fully managed – Amazon Managed Service for Prometheus eliminates infrastructure management
- Automatic scaling – Built-in high availability and scaling
- Integrated security – Native IAM integration
- Cost-effective – Pay only for metrics ingested and stored
You also benefit from enhanced observability:
- Three pillars – Complete metrics, traces, and logs coverage
- Real-time monitoring – Custom metrics for intelligent automatic scaling
- Correlation – Trace IDs link logs, metrics, and traces
- Business metrics – Scale based on application behavior, not just infrastructure
Troubleshooting
If the ADOT Collector isn’t receiving data, troubleshoot as follows:
- Verify the collector service is running:
$ kubectl get pods -n opentelemetry - Check application configuration for correct endpoint URLs
- Verify IAM roles have proper permissions for AWS services
If the custom metrics aren’t available in the HPA, check the following:
- Confirm the Prometheus Adapter is deployed and running
- Verify metrics are being scraped by Prometheus:
$ kubectl port-forward svc/prometheus 9090:9090 - Check the Prometheus Adapter configuration for correct metric queries
Deployment cost considerations
In this section, we provide an estimate of the cost that will incur with the preceding solutions:
- Amazon Managed Service for Prometheus – $0.90 per million samples ingested + $0.03 per GB-month storage
- AWS X-Ray – $5.00 per million traces recorded
- Amazon CloudWatch Logs – $0.50 per GB ingested + $0.03 per GB-month storage
- Amazon EKS – $73/month control plane + compute costs (Auto Mode/Fargate variable)
For a medium-scale application (5 microservices, 2 million samples/hour, 100,000 traces/day, 10 GB logs/day), the costs are as follows:|
| Service | Cost |
|---|---|
| Amazon Managed Prometheus | ~$80 |
| AWS X-Ray | ~$45 |
| CloudWatch Logs | ~$165 |
| EKS Control Plane | ~$73 |
| Compute costs | ~$200-400 |
| Total | ~$563-763/month |
Costs are estimates based on US East (N. Virginia) pricing as of 2025 and might vary based on AWS Region, usage patterns, and AWS pricing changes. Consider the following cost optimization methods:
- Sampling – Implement intelligent sampling for high-cardinality metrics
- Retention – Set appropriate log retention (7–30 days for debug logs)
- Monitoring – Use CloudWatch billing alarms to track spending
- Regional – Deploy in single Region to minimize data transfer costs
Clean up
To avoid ongoing charges, delete the resources created in this walkthrough:
- Remove IAM roles and policies created for this solution through the IAM console or AWS CLI.
- Delete the AWS CDK stack:
Conclusion
This solution demonstrates how organizations can achieve enterprise-grade Kubernetes deployments that balance flexibility, observability, and cost optimization. By combining Amazon EKS Auto Mode or Fargate with comprehensive AWS native observability services, teams can focus on application development while maintaining deep visibility into system performance. The real metrics-based automatic scaling approach represents a significant improvement over traditional resource-based scaling, enabling more intelligent infrastructure decisions that align with actual application behavior. Combined with the flexible compute options and modular architecture, this platform provides a robust foundation for modern containerized applications at scale. Key takeaways include:
- Use AWS managed services – Reduce operational overhead with Amazon Managed Service for Prometheus and CloudWatch
- Implement OpenTelemetry – Standardize observability across all applications
- Custom metrics for HPA – Scale based on business metrics, not just CPU/memory
- Structured logging – Enable better debugging and correlation
- Security first – Implement proper IAM roles and network isolation
Organizations implementing this solution can expect reduced operational complexity, improved cost-efficiency, and enhanced visibility into their containerized applications, enabling faster development cycles and more reliable production deployments.


 One-year anniversary of CloudFront Functions – I can’t believe it’s been


 Mike is a Principal Solutions Architect with the Startup Team at Amazon Web Services. He is a former founder, current mentor, and enjoys helping startups live their best cloud life.
 Sean is a Senior Startup Solutions Architect at AWS. Before AWS, he was Director of Scientific Computing at the Howard Hughes Medical Institute.