Today, I’m excited to announce enhanced local testing capabilities for AWS Step Functions through the TestState API, our testing API.
These enhancements are available through the API, so you can build automated test suites that validate your workflow definitions locally on your development machines, test error handling patterns, data transformations, and mock service integrations using your preferred testing frameworks. This launch introduces an API-based approach for local unit testing, providing programmatic access to comprehensive testing capabilities without deploying to Amazon Web Services (AWS).
There are three key capabilities introduced in this enhanced TestState API:
Mocking support – Mock state outputs and errors without invoking downstream services, enabling true unit testing of state machine logic. TestState validates mocked responses against AWS API models with three validation modes: STRICT (this is the default and validates all required fields), PRESENT (validates field types and names), and NONE (no validation), providing high-fidelity testing.
Support for all state types – All state types, including advanced states such as Map states (inline and distributed), Parallel states, activity-based Task states, .sync service integration patterns, and .waitForTaskToken service integration patterns, can now be tested. This means you can use TestState API across your entire workflow definition and write unit tests to verify control flow logic, including state transitions, error handling, and data transformations.
Testing individual states – Test specific states within a full state machine definition using the new stateName parameter. You can provide the complete state machine definition one time and test each state individually by name. You can control execution context to test specific retry attempts, Map iteration positions, and error scenarios.
Getting started with enhanced TestState Let me walk you through these new capabilities in enhanced TestState.
Scenario 1: Mock successful results
The first capability is mocking support, which you can use to test your workflow logic without invoking actual AWS services or even external HTTP requests. You can either mock service responses for fast unit testing or test with actual AWS services for integration testing. When using mocked responses, you don’t need AWS Identity and Access Management (IAM) permissions.
Here’s how to mock a successful AWS Lambda function response:
This command tests a Lambda invocation state without actually calling the function. TestState validates your mock response against the Lambda service API model so your test data matches what the real service would return.
The response shows the successful execution with detailed inspection data (when using DEBUG inspection level):
When you specify a mock response, TestState validates it against the AWS service’s API model so your mocked data conforms to the expected schema, maintaining high-fidelity testing without requiring actual AWS service calls.
Scenario 2: Mock error conditions You can also mock error conditions to test your error handling logic:
This simulates a Lambda service exception so you can verify how your state machine handles failures without triggering actual errors in your AWS environment.
The response shows the failed execution with error details:
The mock result represents the complete output from processing multiple items. In this case, the mocked array must match the expected Map state output format.
The response shows successful processing of the array input:
The mock result must be an array with one element per branch. By using TestState, your mock data structure matches what a real Parallel state execution would produce.
The response shows the parallel execution results:
Scenario 5: Test individual states within complete workflows You can test specific states within a full state machine definition using the stateName parameter. Here’s an example testing a single state, though you would typically provide your complete workflow definition and specify which state to test:
This tests a Lambda invocation state with specific input data, showing how TestState processes the input and transforms it through the state execution.
The response shows detailed input processing and validation:
These enhancements bring the familiar local development experience to Step Functions workflows, helping me to get instant feedback on changes before deploying to my AWS account. I can write automated test suites to validate all Step Functions features with the same reliability as cloud execution, providing confidence that my workflows will work as expected when deployed.
Things to know Here are key points to note:
Availability – Enhanced TestState capabilities are available in all AWS Regions where Step Functions is supported.
Pricing – TestState API calls are included with AWS Step Functions at no additional charge.
Framework compatibility – TestState works with any testing framework that can make HTTP requests, including Jest, pytest, JUnit, and others. You can write test suites that validate your workflows automatically in your continuous integration and continuous delivery (CI/CD) pipeline before deployment.
Feature support – Enhanced TestState supports all Step Functions features including Distributed Map, Parallel states, error handling, and JSONata expressions.
Documentation – For detailed options for different configurations, refer to the TestState documentation and API reference for the updated request and response model.
Get started today with enhanced local testing by integrating TestState into your development workflow.
Cloudflare launched fifteen years ago with a mission to help build a better Internet. Over that time the Internet has changed and so has what it needs from teams like ours. In this year’s Founder’s Letter, Matthew and Michelle discussed the role we have played in the evolution of the Internet, from helping encryption grow from 10% to 95% of Internet traffic to more recent challenges like how people consume content.
This year’s themes focused on helping prepare the Internet for a new model of monetization that encourages great content to be published, fostering more opportunities to build community both inside and outside of Cloudflare, and evergreen missions like making more features available to everyone and constantly improving the speed and security of what we offer.
We shipped a lot of new things this year. In case you missed the dozens of blog posts, here is a breakdown of everything we announced during Birthday Week 2025.
To support a diverse and open Internet, we are now sponsoring Ladybird (an independent browser) and Omarchy (an open-source Linux distribution and developer environment).
We are opening our office doors in four major cities (San Francisco, Austin, London, and Lisbon) as free hubs for startups to collaborate and connect with the builder community.
We are removing cost as a barrier for the next generation by giving students with .edu emails 12 months of free access to our paid developer platform features.
We are partnering with Coinbase to create the x402 Foundation, encouraging the adoption of the x402 protocol to allow clients and services to exchange value on the web using a common language
Our Automatic SSL/TLS system has upgraded over 6 million domains to more secure encryption modes by default and will soon automatically enable post-quantum connections.
We made our CSAM Scanning Tool easier to adopt by removing the need to create and provide unique credentials, helping more site owners protect their platforms.
Updates across Workers and beyond for a more powerful developer platform – such as support for larger and more concurrent Container images, support for external models from OpenAI and Anthropic in AI Search (previously AutoRAG), and more.
A deep-dive into how we’ve hardened the Workers runtime with new defense-in-depth security measures, including V8 sandboxes and hardware-assisted memory protection keys.
We announced the Cloudflare Email Service private beta, allowing developers to reliably send and receive transactional emails directly from Cloudflare Workers.
The TCP Connection Time (Trimean) graph shows that we are the fastest TCP connection time in 40% of measured ISPs – and the fastest across the top networks.
We are using our network’s vast performance data to tune congestion control algorithms, improving speeds by an average of 10% for QUIC traffic.
Come build with us!
Helping build a better Internet has always been about more than just technology. Like the announcements about interns or working together in our offices, the community of people behind helping build a better Internet matters to its future. This week, we rolled out our most ambitious set of initiatives ever to support the builders, founders, and students who are creating the future.
For founders and startups, we are thrilled to welcome Cohort #6 to the Workers Launchpad, our accelerator program that gives early-stage companies the resources they need to scale. But we’re not stopping there. We’re opening our doors, literally, by launching new physical hubs for startups in our San Francisco, Austin, London, and Lisbon offices. These spaces will provide access to mentorship, resources, and a community of fellow builders.
We’re also investing in the next generation of talent. We announced free access to the Cloudflare developer platform for all students, giving them the tools to learn and experiment without limits. To provide a path from the classroom to the industry, we also announced our goal to hire 1,111 interns in 2026 — our biggest commitment yet to fostering future tech leaders.
And because a better Internet is for everyone, we’re extending our support to non-profits and public-interest organizations, offering them free access to our production-grade developer tools, so they can focus on their missions.
Whether you’re a founder with a big idea, a student just getting started, or a team working for a cause you believe in, we want to help you succeed.
Until next year
Thank you to our customers, our community, and the millions of developers who trust us to help them build, secure, and accelerate the Internet. Your curiosity and feedback drive our innovation.
It’s been an incredible 15 years. And as always, we’re just getting started!
The recent Salesloft breach taught us one thing: connections between SaaS applications are hard to monitor and create blind spots for security teams with disastrous side effects. This will likely not be the last breach of this type.
To fix this, Cloudflare is working towards a set of solutions that consolidates all SaaS connections via a single proxy, for easier monitoring, detection and response. A SaaS to SaaS proxy for everyone.
As we build this, we need feedback from the community, both data owners and SaaS platform providers. If you are interested in gaining early access, please sign up here.
SaaS platform providers, who often offer marketplaces for additional applications, store data on behalf of their customers and ultimately become the trusted guardians. As integrations with marketplace applications take place, that guardianship is put to the test. A key breach in any one of these integrations can lead to widespread data exfiltration and tampering. As more apps are added the attack surface grows larger. Security teams who work for the data owner have no ability, today, to detect and react to any potential breach.
In this post we explain the underlying technology required to make this work and help keep your data on the Internet safe.
SaaS to SaaS integrations
No one disputes the value provided by SaaS applications and their integrations. Major SaaS companies implement flourishing integration ecosystems, often presented as marketplaces. For many, it has become part of their value pitch. Salesforce provides an AppExchange. Zendesk provides a marketplace. ServiceNow provides an Integration Hub. And so forth.
These provide significant value to any organisation and complex workflows. Data analysis or other tasks that are not supported natively by the SaaS vendor are easily carried out via a few clicks.
On the other hand, SaaS applications present security teams with a growing list of unknowns. Who can access this data? What security processes are put in place? And more importantly: how do we detect data leak, compromise, or other malicious intent?
Following the Salesloft breach, which compromised the data of hundreds of companies, including Cloudflare, the answers to these questions are top of mind.
The power of the proxy: seamless observability
There are two approaches Cloudflare is actively prototyping to address the growing security challenges SaaS applications pose, namely visibility into SaaS to SaaS connections, including anomaly detection and key management in the event of a breach. Let’s go over each of these, both relying on proxying SaaS to SaaS traffic.
1) Giving control back to the data owner
Cloudflare runs one of the world’s largest reverse proxy networks. As we terminate L7 traffic, we are able to perform security-related functions including blocking malicious requests, detecting anomalies, detecting automated traffic and so forth. This is one of the main use cases customers approach us for.
Cloudflare can proxy any hostname under the customer’s control.
It is this specific ability, often referred to as “vanity”, “branded” or “custom” hostnames, that allows us to act as a front door to the SaaS vendor on behalf of a customer. Provided a marketplace app integrates via a custom domain, the data owner can choose to use Cloudflare’s new SaaS integration protection capabilities.
For a customer (Acme Corp in this example) to access, say SaaS Application, the URL needs to become saas.acme.com as that is under Acme’s control (and not acme.saas.com).
This setup allows Cloudflare to be placed in front of SaaS Corp as the customer controls the DNS hostname. By proxying traffic, Cloudflare can be the only integration entity with programmatic access to SaaS Corp’s APIs and data and transparently “swap” authorisation tokens with valid ones and issue separate tokens, using key splitting, to any integrations.
Note that in many cases, authorization and authentication flows fall outside any vanity/branded hostname. It is in fact very common for an OAuth flow to still hit the SaaS provider url oauth.saas.com. It is therefore required, in this setup, for marketplace applications to provide the ability to support vanity/branded URLs for their OAuth and similar flows, oauth.saas.acme.com in the diagram above.
Ultimately Cloudflare provides a full L7 reverse proxy for all traffic inbound/outbound to the given SaaS provider solving for the core requirements that would lessen the impact of a similar breach to the Salesloft example. Had Salesloft integrated via a Cloudflare-proxied domain, then data owners would be able to:
Gain visibility into who or what can access data, and where it’s accessed from, in the SaaS platform. Cloudflare already provides analytics and filtering tools to identify traffic sources, including hosting locations, IPs, user agents and other tools.
Instantly shut off access to the SaaS provider without the need to rotate credentials on the SaaS platform, as Cloudflare would be able to block access from the proxy.
Detects anomalies in data access by observing baselines and traffic patterns. For example a change in data exfiltration traffic flows would trigger an alert.
2) Improve SaaS platform security
The approach listed above assumes the end user is the company whose data is at risk. However, SaaS platforms themselves are now paying a lot of attention to marketplace applications and access patterns. From a deployment perspective, it’s actually easier to provide additional visibility to a SaaS provider as it is a standard reverse proxy deployment and we have tools designed for SaaS applications, such as Cloudflare for SaaS.
This deployment model allows Cloudflare to proxy all traffic to the SaaS vendor, including to all API endpoints therefore gaining visibility into any SaaS to SaaS connections. As part of this, we are building improvements to our API Shield solution to provide SaaS security teams with additional controls:
Token / session logging: Ability to keep track of OAuth tokens and provide session logs for audit purposes.
Session anomaly detection: Ability to warn when a given OAuth (or other session) shows anomalous behavior.
Token / session replacement: Ability to substitute SaaS-generated tokens with Cloudflare-generated tokens to allow for fast rotation and access lock down.
The SaaS vendor may of course expose some of the affordances to their end customer as part of their dashboard.
How key splitting enables secure token management
Both deployment approaches described above rely on our ability to control access without storing complete credentials. While we already store SSL/TLS private keys for millions of web applications, storing complete SaaS bearer tokens would create an additional security burden. To solve this, and enable the token swapping and instant revocation capabilities mentioned above, we use key splitting.
Key splitting cryptographically divides bearer tokens into two mathematically interdependent fragments called Part A and Part B. Part A goes to the fourth-party integration (like Drift or Zapier) while Part B stays in Cloudflare’s edge storage. Part A is just random noise that won’t authenticate to Salesforce or any SaaS platform expecting complete tokens, so neither fragment is usable alone.
This creates an un-bypassable control point. Integrations cannot make API calls without going through Cloudflare’s proxy because they only possess Part A. When an integration needs to access data, it must present Part A to our edge where we retrieve Part B, reconstruct the token in memory for microseconds, forward the authenticated request, and then immediately clear the token. This makes sure that the complete bearer token never exists in any database or log.
This forced cooperation means every API call flows through Cloudflare where we can monitor for anomalies, delete Part B to instantly revoke access (transforming incident response from hours to seconds), and maintain complete audit trails. Even more importantly, this approach minimizes our burden of storing sensitive credentials since a breach of our systems wouldn’t yield usable tokens.
If attackers compromise the integration and steal Part A, or somehow breach Cloudflare’s storage and obtain Part B, neither fragment can authenticate on its own. This fundamentally changes the security model from protecting complete tokens to managing split fragments that are individually worthless. It also gives security teams unprecedented visibility and control over how their data is accessed across third-party integrations.
Regaining control of your data
We are excited to develop solutions mentioned above to give better control and visibility around data stored in SaaS environments, or more generally, outside a customer’s network.
If you are a company worried about this risk, and would like to be notified to take part in our early access, please sign up here.
If you are a SaaS vendor who would like to provide feedback and take part in developing better API security tooling for third party integrations towards your platform, sign up here.
We are looking forward to helping you get better control of your data in SaaS to SaaS environments.
Measuring and improving performance on the Internet can be a daunting task because it spans multiple layers: from the user’s device and browser, to DNS lookups and the network routes, to edge configurations and origin server location. Each layer introduces its own variability such as last-mile bandwidth constraints, third-party scripts, or limited CPU resources, that are often invisible unless you have robust observability tooling in place. Even if you gather data from most of these Internet hops, performance engineers still need to correlate different metrics like front-end events, network processing times, and server-side logs in order to pinpoint where and why elusive “latency” occurs to understand how to fix it.
We want to solve this problem by providing a powerful, in-depth monitoring solution that helps you debug and optimize applications, so you can understand and trace performance issues across the Internet, end to end.
That’s why we’re excited to announce the start of a major upgrade to Cloudflare’s performance analytics suite: Web Analytics as part of our real user monitoring (RUM) tools will soon be combined with network-level insights to help you pinpoint performance issues anywhere on a packet’s journey — from a visitor’s browser, through Cloudflare’s network, to your origin.
Some popular web performance monitoring tools have also sacrificed user privacy in order to achieve depth of visibility. We’re also going to remove that tradeoff. By correlating client-side metrics (like Core Web Vitals) with detailed network and origin data, developers can see where slowdowns occur — and why — all while preserving end user privacy (by dropping client-specific information and aggregating data by visits as explained in greater detail below).
Over the next several months we’ll share:
How Web Analytics work
Real-world debugging examples from across the Internet
Tips to get the most value from Cloudflare’s analytics tools
The journey starts on October 15, 2025, when Cloudflare will enable Web Analyticsfor all free domains by default — helping you see how your site actually performs for visitors around the world in real time, without ever collecting any personal data (not applicable to traffic originating from the EU or UK, see below). By the middle of 2026, we’ll deliver something nobody has ever had before: a comprehensive, privacy-first platform for performance monitoring and debugging. Unlike many other tools, this platform won’t just show you where latency lives, it will help you fix it, all in one place. From untangling the trickiest bottlenecks, to getting a crystal-clear view of global performance, this new tool will change how you see your web application and experiment with new performance features. And we’re not building it behind closed doors, we want to bring you along as we launch it in public. Follow along in this series, The RUM Diaries, as we share the journey.
Why this matters
Performance monitoring is only as good as the detail you can see — and the trust your users have that while you’re watching traffic performance, you aren’t watching them. As we explain below, by combining real user metrics with deep, in-network instrumentation, we’ll give developers the visibility to debug any layer of the stack while maintaining Cloudflare’s zero-compromise stance on privacy.
What problem are we solving?
Many performance monitoring solutions provide only a narrow slice of the performance layer cake, focusing on either the client or the origin while lumping everything in between under a vague “processing time” due to lack of visibility. But as web applications get more complex and user expectations continue to rise, traditional analytics alone don’t cut it. Knowing what happened is just the tip of the iceberg; modern teams need to understand why a bottleneck occurred and how network conditions, code changes, or even a single external script can degrade load times. Moreover, often the tools available can only observe performance rather than helping to optimize it, which leaves teams unable to understand what to try to move the needle on latency.
We want to pull back the curtain so you can understand performance implications of the services you use on our platform and how you can make sure you’re getting the best performance possible.
Consider Shannon in Detroit, Michigan. She operates an e-commerce site selling hard-to-find watches to horology enthusiasts around the globe. Shannon knows that her customers are impatient (she pictures them frequently checking their wrists). If her site loads slowly, she loses sales, her SEO drops, and her customers go to a different store where they have a better online shopping experience.
As a result, Shannon continually monitors her site performance, but she frequently runs into problems trying to understand how her site is experienced by customers in different parts of the world. After updating her site, she frequently spot checks its performance using her browser on her office wifi in Detroit, but she continually hears complaints about slow load from her customers in Germany. So Shannon shops around for a solution that monitors performance around the globe.
This off-the-shelf performance monitoring solution offers her the ability to run similar tests from virtual machines situated around the world across various desktops, mobile devices, and even ISPs, close to her customers. Shannon receives data from these tests, ranging from how fast these synthetic clients’ DNS resolved, how quickly they connected to a particular server, and even when a response was on its way back to a client. Thankfully for Shannon, the off-the-shelf performance monitoring solution identified “server processing time” as the latency culprit in Germany. However, she can’t help but wonder, is it my server that is slow or the transit connection of my users in Germany? Can I make my site faster by adding another server in Germany, or updating my CDN configuration? It’s a three option head-scratcher: is it a networking problem, a server problem, or something else?
Cloudflare can help Shannon (and others!) because we sit in a unique place to provide richer performance analytics. As a reverse proxy positioned between the client and the origin, we are often the first web server a user connects to when requesting content. In addition to moving what’s important closer to your customers, our product suite can generate responses at our edge (e.g. Workers), steer traffic through our dedicated backbone (e.g. cloudflared and more), and route around Internet traffic jams (e.g. Argo). By tailoring a solution that brings together:
client performance data,
real-time network metrics,
customer configuration settings, and
origin performance measurements
we can provide more insightful information about what’s happening in the vague “processing time.” This will allow developers like Shannon to understand what they should tweak to make their site more performant, build her business and her customers happier.
What is Web Analytics?
Turning back to what’s happening on October 15, 2025: We’re enabling Web Analytics so teams can track down performance bottlenecks. Web Analytics works by adding a lightweight JavaScript snippet to your website, which helps monitor performance metrics from visitors to your site. In the Web Analytics dashboard you can see aggregate performance data related to: how a browser has painted the page (via LCP, INP, and CLS), general load time metrics associated with server processing, as well as aggregate counts of visitors.
If you’ve ever popped open DevTools in your browser and stared at the waterfall chart of a slow-loading page, you’ve had a taste of what Web Analytics is doing, except instead of measuring your load times from your laptop, it’s measuring it directly from the browsers of real visitors.
Here’s the high-level architecture:
A lightweight beacon in the browser Every page that you track with Cloudflare’s Web Analytics includes a tiny JavaScript snippet, optimized to load asynchronously so it won’t block rendering.
This snippet hooks into modern browser APIs like the Performance API, Resource Timing, etc
This is how Cloudflare collects Core Web Vital metrics like Largest Contentful Paint and Interaction to Next Paint, plus data about resource load times, TLS handshake duration from the perspective of the client.
Aggregation at the edge When the browser sends performance data, it goes to the nearest Cloudflare data center. Instead of pushing raw events straight to a database, we pre-process at the edge. This reduces storage needs, minimizes latency, and removes personal information like IP addresses. After this pre-processing, it is sent to a core datacenter to be processed and queried by users.
Web Analytics sits under the Analytics & Logs section of the dashboard (at both the account and domain level of the dashboard). Starting on October 15, 2025, free domains will begin to see Web Analytics enabled by default and will be able to view the performance of their visitors in their dashboard. Pro, Biz and ENT accounts can enable Web Analytics by selecting the hostname of the website to add the snippet to and selecting Automatic Setup. Alternatively, you can manually paste the JavaScript beacon before the closing </body> tag on any HTML page you’d like to track from your origin. Just select “manage site” from the Web Analytics tab in the dashboard.
Once enabled, the JS snippet works with visitors’ browsers to measure how the user experienced page load times and reports on critical client-side metrics. Below these metrics are resource attribution tables that help users understand which assets are taking the most time per metrics to load so that users can better optimize their site performance.
What does privacy-first mean?
From the beginning, our Web Analytics tools have centered on providing insights without compromising privacy. Being privacy-first means we don’t track individual users for analytics. We don’t use any client-side state (like cookies or localStorage) for analytics purposes, and we don’t track users over time by IP address, User Agent, or any other fingerprinting technique.
Moreover, when enabling Web Analytics, you can choose to drop requests from European and UK visitors if you so desire (listed here specifically), meaning we will not collect any RUM metrics from traffic that passes through our European and UK data centers. The version of Web Analytics that will be enabled by default excludes data from EU visitors (this can be changed in the dashboard if you want).
The concept of a visit is key to our privacy approach. Rather than count unique IP addresses (requiring storing state about each visitor), we simply count page views that originate from a distinct referral or navigation event, avoiding the need to store information that might be considered personal data. We believe this same concept that we’ve used for years in providing our privacy-first Web Analytics can be logically extended to network and origin metrics. This will allow customers to gain the insights they need to debug and solve performance issues while ensuring they are not collecting unneeded data on visitors.
Opting-out
We built our Web Analytics service to give you the insights you need to run your website, all while maintaining a privacy-first approach. However, if you do want to opt-out, here are the steps to do so.
Via Dashboard
If you have a free domain and do not want Web Analytics automatically enabled for your zone you should do the following before October 15, 2025:
Navigate to the zone in the Cloudflare dashboard
In the list on the left of the screen, navigate to Web Analytics
On the next page, select either `Enable Globally` or `Exclude EU` to activate the feature
Once Web Analytics has been activated, navigate to `Manage RUM Settings` in the Web Analytics dashboard
Then, on the next page, select `Disable` to disable Web Analytics for the zone
OR, to remove Web Analytics from the zone entirely, delete the configs by clicking Advanced Options and then Delete
Once you have disabled the product once, we will not re-enable it again. You can choose to enable it whenever you want, however.
Via API
Create a Web Analytics configuration with the following API call:
Today, Web Analytics gives you visibility into how people experience your site in the browser. Next, we’re expanding that lens to show what’s happening across the entire request path, from the click in a user’s browser, through Cloudflare’s global network, to your origin servers, and back.
Here’s what’s coming:
Correlating Across Layers We’ll match RUM data from the client with network timing, Cloudflare edge processing, and origin response latency, allowing you to pinpoint whether a spike in TTFB comes from a slow script, a cache miss, or an origin bottleneck.
Proactive Alerting Configurable alerts will tell you when performance regresses in specific geographies, when a data center underperforms, or when origin latency spikes.
Actionable Insights We’ll go beyond “processing time” as a single number, breaking it into the real-world steps that make up the journey: proxy routing, security checks, cache lookups, origin fetches, and more.
Unified View All of this will live in one place (your Cloudflare dashboard) alongside your analytics, logs, firewall events, and configuration settings, so you can see cause and effect in one workflow.
Conclusion
Stay tuned as we work alongside you, in public, to build the most comprehensive, privacy-focused performance analytics platform. Together, we will illuminate every corner of the request journey so you can optimize, innovate, and deliver the best experiences to your users, every time.
The next chapters of this journey will unlock proactive alerts, cross-layer correlation, and actionable insights you can’t get anywhere else. Follow along as the RUM Diaries are just getting started.
You can use these open source solutions to develop applications faster, using up-to-date knowledge of Amazon Web Services (AWS) capabilities and configurations during the build and deployment process. Whether you’re writing code in your integrated development environment (IDE), or debugging production issues, these MCP servers support AI code assistants with deep understanding of Amazon ECS, Amazon EKS, and AWS Serverless capabilities, accelerating the journey from code to production. They work with popular AI-enabled IDEs, including Amazon Q Developer on the command line (CLI), to help you build and deploy applications using natural language commands.
The Amazon ECS MCP Server containerizes and deploys applications to Amazon ECS within minutes by configuring all relevant AWS resources, including load balancers, networking, auto-scaling, monitoring, Amazon ECS task definitions, and services. Using natural language instructions, you can manage cluster operations, implement auto-scaling strategies, and use real-time troubleshooting capabilities to identify and resolve deployment issues quickly.
For Kubernetes environments, the Amazon EKS MCP Server provides AI assistants with up-to-date, contextual information about your specific EKS environment. It offers access to the latest EKS features, knowledge base, and cluster state information. This gives AI code assistants more accurate, tailored guidance throughout the application lifecycle, from initial setup to production deployment.
The AWS Serverless MCP Server enhances the serverless development experience by providing AI coding assistants with comprehensive knowledge of serverless patterns, best practices, and AWS services. Using AWS Serverless Application Model Command Line Interface (AWS SAM CLI) integration, you can handle events and deploy infrastructure while implementing proven architectural patterns. This integration streamlines function lifecycles, service integrations, and operational requirements throughout your application development process. The server also provides contextual guidance for infrastructure as code decisions, AWS Lambda specific best practices, and event schemas for AWS Lambda event source mappings.
Let’s see it in action If this is your first time using AWS MCP servers, visit the Installation and Setup guide in the AWS Labs GitHub repository to installation instructions. Once installed, add the following MCP server configuration to your local setup:
Install Amazon Q for command line and add the configuration to ~/.aws/amazonq/mcp.json. If you’re already an Amazon Q CLI user, add only the configuration.
I want to create a backend application that automatically extracts metadata and understands the content of images and videos uploaded to an S3 bucket and stores that information in a database. I'd like to use a serverless system for processing. Could you generate everything I need, including the code and commands or steps to set up the necessary infrastructure, for it to work from start to finish? - Use 02_using_converse_api.ipynb as example code for the image and video understanding.
Amazon Q CLI identifies the necessary tools, including the MCP serverawslabs.aws-serverless-mcp-server. Through a single interaction, the AWS Serverless MCP server determines all requirements and best practices for building a robust architecture.
I ask to Amazon Q CLI that build and test the application, but encountered an error. Amazon Q CLI quickly resolved the issue using available tools. I verified success by checking the record created in the Amazon DynamoDB table and testing the application with the dog2.jpeg file.
To enhance video processing capabilities, I decided to migrate my media analysis application to a containerized architecture. I used this prompt:
I'd like you to create a simple application like the media analysis one, but instead of being serverless, it should be containerized. Please help me build it in a new CDK stack.
Amazon Q Developer begins building the application. I took advantage of this time to grab a coffee. When I returned to my desk, coffee in hand, I was pleasantly surprised to find the application ready. To ensure everything was up to current standards, I simply asked:
please review the code and all app using the awslabsecs_mcp_server tools
Amazon Q Developer CLI gives me a summary with all the improvements and a conclusion.
I ask it to make all the necessary changes, once ready I ask Amazon Q developer CLI to deploy it in my account, all using natural language.
After a few minutes, I review that I have a complete containerized application from the S3 bucket to all the necessary networking.
I ask Amazon Q developer CLI to test the app send it the-sea.mp4 video file and received a timed out error, so Amazon Q CLI decides to use the fetch_task_logs from awslabsecs_mcp_server tool to review the logs, identify the error and then fix it.
After a new deployment, I try it again, and the application successfully processed the video file
I can see the records in my Amazon DynamoDB table.
To test the Amazon EKS MCP server, I have code for a web app in the auction-website-main folder and I want to build a web robust app, for that I asked Amazon Q CLI to help me with this prompt:
Create a web application using the existing code in the auction-website-main folder. This application will grow, so I would like to create it in a new EKS cluster
Once the Docker file is created, Amazon Q CLI identifies generate_app_manifests from awslabseks_mcp_server as a reliable tool to create a Kubernetes manifests for the application.
Then create a new EKS cluster using the manage_eks_staks tool.
Once the app is ready, the Amazon Q CLI deploys it and gives me a summary of what it created.
I can see the cluster status in the console.
After a few minutes and resolving a couple of issues using the search_eks_troubleshoot_guide tool the application is ready to use.
Now I have a Kitties marketplace web app, deployed on Amazon EKS using only natural language commands through Amazon Q CLI.
Get started today Visit the AWS Labs GitHub repository to start using these AWS MCP servers and enhance your AI-powered developmen there. The repository includes implementation guides, example configurations, and additional specialized servers to run AWS Lambda function, which transforms your existing AWS Lambda functions into AI-accessible tools without code modifications, and Amazon Bedrock Knowledge Bases Retrieval MCP server, which provides seamless access to your Amazon Bedrock knowledge bases. Other AWS specialized servers in the repository include documentation, example configurations, and implementation guides to begin building applications with greater speed and reliability.
Developers face numerous challenges when building telephony applications: managing unpredictable user responses, handling disconnections, processing incorrect inputs, and addressing errors. These challenges extend development cycles and create unstable applications that fail to meet user expectations.
This blog demonstrates how Amazon Web Services (AWS) Step Functions, combined with Amazon Chime SDK Public Switched Telephone Network (PSTN) audio service, offers a solution to overcome these challenges.
Overview of the solution
To demonstrate our solution, we built a sample telephony application that lets business owners manage customer calls through a dedicated business phone number. This solution helps small business owners separate personal and business communications, while managing all calls from their existing phone.
The beta version of this sample application delivers these six core call flows:
During business hours: Routes incoming customer calls to the business owner
After hours: Enables customers to leave voice messages
Message retrieval: Allows owner to access customer voice messages
Business caller ID: Enables owner to call customers using the business number
Call scheduling: Permits owner to schedule customer calls for later in the day
Automated calling: Initiates scheduled calls between owner and customer automatically
Using Workflow Studio, we built a Step Functions workflow (Figure 1) that processes all six call flows and handles unexpected scenarios.
Figure 1 – Step Functions telephony workflow designed in Workflow Studio
How it works
AWS Step Functions enable agile visual workflow design, through pre-built components and error handling rules. This creates workflows composed of event-driven states that input, process, and output JavaScript Object Notation (JSON)-formatted messages. The PSTN audio service streamlines telephony applications through its serverless approach using a request/response programming model. It invokes AWS Lambda functions with Events and waits for Actions responses, both in predefined JSON formats. This shared JSON format enables seamless integration between the PSTN audio service and Step Functions, leading us to design a serverless architecture (Figure 2) that allows for bidirectional JSON message exchange between the two services.
Figure 2 – Serverless architecture for Step Functions and PSTN audio service integration
Main components:
eventRouter: Lambda function managing JSON message exchange
Update the eventRouter Lambda function’s “CallFlowsDIDMap” environment variable to map phone numbers to their workflow Amazon Resource Name (ARN)
Set workflow variables in the “Init” state Variables tab (Figure 3). The eventRouter function automatically sets “QueueUrl”, and adding other variables here removes the need for external storage
Figure 3 – Step Functions “Init” state Variables tab showing workflow data configuration
Configure Choice state rules to route calls based on conditions. Rules one through three (Figure 4) handle call routing based on inbound/outbound direction, owner/customer identification, while the default rule manages unexpected scenarios.
Figure 4 – Step Functions Choice state defines rules for call routing decisions
Configure the SQS: SendMessage state (Figure 5) to instruct the next action to the PSTN audio service by:
Formatting the message content to match supported actions for the PSTN audio service
Setting TransactionAttributes to pass back and forth the values of the “WaitToken” and “QueueUrl” throughout the call duration
Enabling the Wait for Callback with a Task Token integration pattern
Figure 5 – SQS: SendMessage state configuration for PSTN audio service callback integration
Example: Use a DynamoDB PutItem state (Figure 6) to store Amazon Simple Storage Service (Amazon S3) recording files, including bucket name and key, in Amazon DynamoDB.
Figure 6 – AWS service integration states enable direct service connections without custom code
Utilize JSONata expressions (Figure 7) to minimize the number of Lambda functions.
Example: For Amazon EventBridge scheduling, compute time expressions using JSONata functions [$fromMillis(), $millis(), number()] and string concatenation to handle customer call scheduling.
Figure 7 – JSONata expressions for direct data transformation without Lambda functions
Use Step Functions error handling with success and fail states (Figure 8) to manage error paths and call termination results.
Figure 8 – Call error handling and termination setup
Key benefits
This approach for building telephony applications offers multiple advantages:
Visual workflow-based designer
Self-document call flow logic
Managed versioning and publishing
Native integration with AWS Services
Visual log and inspection for each call
Auto-scalable
Pay-per-use pricing
Deploying the solution
The following steps allows you to deploy the sample telephony application together with the serverless architecture (Figure 2).
AWS Command Line Interface (AWS CLI) installed and configured
Walkthrough:
The Cloud Development Kit (CDK) project on the AWS GitHub repository will deploy the following resources:
phoneNumberBusiness – Provisioned phone number for the sample application
sipMediaApp – SIP media application that routes calls to lambdaProcessPSTNAudioServiceCalls
sipRule – SIP rule that directs calls from phoneNumberBusiness to sipMediaApp.
stepfunctionBusinessProxyWorkflow – Step Functions workflow for the sample application
roleStepfuntionBusinessProxyWorkflow – IAM Role for stepfunctionBusinessProxyWorkflow
lambdaProcessPSTNAudioServiceCalls – Lambda function for call processing
roleLambdaProcessPSTNAudioServiceCalls – IAM Role for lambdaProcessPSTNAudioServiceCalls
dynamoDBTableBusinessVoicemails – DynamoDB table to store customer voicemails
s3BucketApp –S3 bucket for storing system recordings and customer voicemails
s3BucketPolicy – IAM Policy granting PSTN audio service access to s3BucketApp
lambdaOutboundCall – Lambda function for placing scheduled customer calls
roleLambdaOutboundCall – IAM Role for lambdaOutboundCall
roleEventBridgeLambdaCall – IAM Role to allow the EventBridge service to execute lambdaOutboundCall
Follow these steps to deploy the CDK stack:
Clone the repository
git clone https://github.com/aws-samples/amazon-chime-sdk-visual-media-applications

cd amazon-chime-sdk-visual-media-applications

npm install
Bootstrap the stack
#default AWS CLI credentials are used, otherwise use the –-profile parameter
#provide the <account-id> and <region> to deploy this stack
cdk bootstrap aws://<account-id>/<region>
Deploy the stack
#default AWS CLI credentials are used, otherwise use the –-profile parameter
#personalNumber: the personal phone number of the business owner in E.164 format
#businessAreaCode: the United States area code used to provision the business number
cdk deploy –-context personalNumber=+1NPAXXXXXXX –-context businessAreaCode=NPA
Call the provisioned phone number to test the sample application. Optionally, edit the workflow to update the business name and working hours on the “Init” Task state, in the Variables tab.
Cleaning up:
To clean up this demo, execute:
cdk destroy
Conclusion
This blog demonstrates how combining AWS Step Functions and Amazon Chime SDK PSTN audio service streamlines the development of reliable telephony applications through visual workflow design and managed error handling. We provided a sample application, implementing six core business phone features, showcasing how the solution effectively manages multiple conditional paths and edge cases like disconnections and invalid inputs.
The serverless architecture created enables seamless integration between the two services through JSON-based communication, while providing automatic scaling and pay-per-use pricing. Together, these components create a robust foundation for building sophisticated telephony applications that reduce maintenance costs and enhance reliability.
Contact an AWS Representative to know how we can help accelerate your business.
Enterprises face many challenges when they build and manage application programming interfaces (APIs). These challenges include security controls, version management, traffic control, and usage analytics. As digital businesses expand, a mature API management (APIM) solution is crucial for ensuring scalability, security, and operational efficiency.
This blog post shows how you can use Amazon API Gateway—along with AWS Lambda, Amazon DynamoDB, and other AWS services—to create a comprehensive and customizable APIM solution. This solution addresses the complex requirements of large enterprises managing APIs at scale.
Core features of APIM
API Management (APIM) centralizes the management and publishing of APIs for the entire enterprise, acting as a hub between clients, applications, and administrators on one side, and internal services, external systems, and large language models (LLMs) on the other, as shown in the following figure.
The key features of APIM include:
Security and governance
Authentication, authorization, rate limiting, and security policy enforcement.
Helps ensure APIs meet organizational or industry standards.
Monitoring and logging
Provides monitoring, alarms, and logging to track API performance and troubleshoot issues quickly.
Customization and transformation
Offers protocol and field transformations, plus orchestration and aggregation.
Makes it easier to integrate with different systems and meet various client needs.
API lifecycle management
Publishing, rollback, version control, and documentation.
Streamlines development and maintenance throughout the API lifecycle.
Developer and business tools
Portals for developers, business owners, and administrators to manage documentation, billing, and analytics.
Integration with LLMs
Specialized adapters, proxy configurations, and switching to integrate AI models seamlessly.
Flexible deployment options
Canary releases, pipeline automation, and other advanced release strategies.
Helps ensure stable, controlled API updates.
Unified management of multiple API gateways
API Gateway enforces resource limits of 300 resources per gateway, with a hard limit of 600. For enterprises that require more resources, managing multiple gateways individually can be time-consuming and error prone. APIM simplifies this by integrating API Gateway, Lambda, and DynamoDB; creating a centralized platform for managing APIs across multiple gateways. This integration streamlines the process, making it easier to scale and maintain APIs.
API lifecycle management
Managing API versions, publishing updates, and maintaining documentation often requires separate tools and manual processes, leading to inefficiencies. APIM centralizes these tasks in one portal, offering version control, publishing workflows, and rollback options. This streamlines the API lifecycle, ensuring consistency and reducing the chances for errors.
Enhanced security
Enterprises often need to implement different authentication strategies for various clients. These configurations typically require custom Lambda logic and database lookups, adding complexity and cost. APIM introduces configurable security policies that allow client-specific authentication without the need for additional custom code, reducing both complexity and operational overhead.
Customization and transformation
Enterprises frequently handle diverse client requests that involve different formats and protocols. Traditional API management approaches might struggle to support such variations. APIM allows for seamless protocol and field transformations, enabling integrations that meet a wide range of client requirements without additional development effort.
Developer portal
Developers need clear documentation, easy testing environments, and efficient API key management to work effectively. Traditional systems often lack these features, slowing down adoption. APIM provides a developer portal that consolidates API documentation, offers sandbox environments for testing, and simplifies API key management, reducing onboarding time and improving the developer experience.
Logging and monitoring
Log management is key to maintaining API performance, diagnosing issues, and gaining insights into usage. APIM uses API Gateway custom access logging, allowing teams to define logs based on business needs; whether creating separate CloudWatch metrics for each API path or exporting data to external platforms like ELK or Grafana.
Architecture overview
The APIM architecture, shown in the following figure, includes a management state (represented by numbers) and a runtime state (represented by letters). Both parts use a serverless paradigm.
Management state
The management state includes the following elements:
Administrator portal access: Administrators access the APIM solution through a secured web portal.
API Requests to APIM Lambda: Requests from the administrator’s API go through API Gateway, which then invokes the APIM Lambda function. This function handles logic related to configuration changes and other administrative actions.
In the following example, we show you how the APIM Lambda function dynamically applies different middleware based on the route configuration. This approach allows for flexible handling of authentication, client access restrictions, and request/response transformations. Here’s a quick breakdown of the key elements:
// If the route requires OIDC (OpenID Connect) authentication,
// add the OIDC authentication middleware to the route.
if route.Auth == "OIDC" {
    r.Use(middleware.OidcAuthenticator)
}
// If the route configuration specifies a list of allowed clients
// and the list is not empty, add a middleware to restrict access
// to only the specified clients.
if route.Allow.Clients != nil && len(route.Allow.Clients) != 0 {
    r.Use(middleware.AllowClients(route.Allow.Clients, cfg.Clients))
}
// Remove specific headers injected by the API Gateway
// to reduce exposure of internal details to downstream systems.
r.Use(middleware.RemoveGatewayHeaders)

// Add additional middleware for handling outbound logic.
// This could include retries, logging, or other outbound-specific functionality.
r.Use(outboundMiddlewares)
// Dynamically constructs and applies a chain of middlewares
// based on the outbound configuration associated with the current request.
func outboundMiddlewares(next http.Handler) http.Handler {
    return http.HandlerFunc(func(w http.ResponseWriter, r *http.Request) {
        // Retrieve the outbound configuration from the request context.
        outbound, _ := r.Context().Value(selectedOutboundContext).(config.Outbound)

        // Initialize a slice to store the middlewares to be applied.
        middlewares := []func(http.Handler) http.Handler{}

        // Middleware to rewrite the HTTP request based on the outbound configuration.
        middlewares = append(middlewares, middleware.ProxyRequestRewrite(&outbound))

        // Add a middleware for mapping request data if specified in the outbound configuration.
        if len(outbound.Convert.Request) != 0 {
            middlewares = append(middlewares, middleware.RequestDataMapping(outbound.Convert.Request))
        }

        // Middleware to log the outbound response for monitoring or debugging purposes.
        middlewares = append(middlewares, middleware.OutboundResponseLog)

        // Add a middleware for mapping response data if specified in the outbound configuration.
        if len(outbound.Convert.Response) != 0 {
            middlewares = append(middlewares, middleware.ResponseDataMapping(outbound.Convert.Response))
        }

        // Add a middleware for modifying the response if a modification function is defined.
        if outbound.ModifyResponse != "" {
            f, ok := system.MODIFY[outbound.ModifyResponse]
            if ok {
                middlewares = append(middlewares, f())
            }
        }

        // Chain the constructed middlewares together and apply them to the request.
        chain := chi.Chain(middlewares...)
        chain.Handler(next).ServeHTTP(w, r)
    })
}
By using a middleware chain, you can customize how each request and response is processed on a per-route basis. This architecture not only keeps your code organized but also makes the API Gateway-integrated Lambda function far more adaptable to changing requirements. You can add or remove configurations from APIM portal as new use cases emerge—such as data transformations, custom logging, or additional security checks—without rewriting core logic.
Configuration management: Administrators set up server-side and client-side settings, such as API Gateway parameters, authentication requirements, transformations, and more.
Persistence: DynamoDB stores these configurations, providing persistent data storage and auditing capabilities.
Asynchronous resource provisioning: After administrators save configurations and release them from the APIM portal, APIM creates or updates AWS resources—such as API Gateway, Lambda functions, and AWS Identity and Access Management (IAM). Lambda runs these updates in the background, so administrators can continue working uninterrupted.
Runtime state
The runtime state includes the following elements:
A. Client request: Clients send requests to the APIM endpoint.
B. Routing to the correct gateway: APIM uses the URI prefix in the API mappings associated with custom domain names to route requests to the appropriate API gateway, as shown in the following figure. Each mapping defines a specific API, stage, and an optional path. When a request arrives, APIM checks the path and directs the request to the correct stage and API if it matches. Unmatched requests default to the mapping with no path defined.
C. APIM core processing: A Lambda function (APIM CORE) uses DynamoDB configurations to handle authentication, authorization, protocol conversion, field transformation, and routing.
D. Downstream service call: APIM forwards each request to the configured internal or external endpoint.
E. Logging and monitoring: API Gateway access logs and custom logs track requests in detail.
F. Alarm: Metrics and alarms detect anomalies and notify stakeholders. Use Amazon CloudWatch or self-hosted solutions such as ELK to enable real-time monitoring and alerting.
Conclusion
In this post, we’ve demonstrated how to build an enterprise API management (APIM) solution using Amazon API Gateway, AWS Lambda, Amazon DynamoDB, and other AWS services. We’ve also shown how APIM centralizes critical features—such as version management, security policies, and request/response transformations—to accommodate large-scale enterprise requirements.
You can use the APIM portal to store and manage configurations in DynamoDB, dynamically applying these settings to multiple API gateways without rewriting code. This approach ensures consistent governance across diverse client types and business scenarios, helping to keep APIs both secure and flexible.
Finally, you’ve seen how the APIM architecture unifies the management state and runtime state, streamlines administrative tasks, and provides end-to-end monitoring and alerting. By adopting these best practices, your enterprise can establish a robust, scalable, and secure API management foundation, all within a serverless paradigm.
With Cloudflare Waiting Room, you can safeguard your site from traffic surges by placing visitors in a customizable, virtual queue. Previously, many site visitors waited in the queue alongside bots, only to find themselves competing for inventory once in the application. This competition is inherently unfair, as bots are much faster and more efficient than humans. As a result, humans inevitably lose out in these high-demand situations, unable to secure inventory before bots sweep it all up. This creates a frustrating experience for real customers, who feel powerless against the speed and automation of bots, leading to a diminished experience overall. Those days are over! Today, we are thrilled to announce the launch of two Waiting Room solutions that significantly improve the visitor experience.
Now, all Waiting Room customers can add an invisible Turnstile challenge to their queueing page, robustly challenging traffic and gathering analytics on bot activity within their queue. With Advanced Waiting Rooms, you can select between an invisible, managed, or non-interactive widget mode. But, we won’t just block these bots! Instead, traffic with definite bot signals that have failed the Turnstile challenge can be sent to an Infinite Queue, a completely customizable page that mimics a real user experience. This prolongs the time it takes bots to realize they have not actually joined the queue, wasting their resources without impacting real users. This feature not only protects your site against bots, but also reduces wait times and protects inventory by ensuring the queue only consists of genuine users. To offset the environmental impact of wasting bot resources, we’re contributing to a tree planting initiative, helping to reduce the carbon footprint of inefficient bots.
The second solution we have launched to improve the visitor experience is Session Revocation, which allows you to end a user’s session based on an action, dynamically opening up spots and admitting users from the queue. This new capability allows you to integrate Waiting Room more seamlessly with your customer journey, resulting in increased throughput, decreased wait times, and increased fairness by giving more users the opportunity to make it through the queue during high demand events.
This feature has proven to be extremely impactful for our customers, including a large online retailer that frequently has high-demand limited edition product drops. A common challenge in this space is maximizing the number of customers who can make a purchase during a limited-time event, all while maintaining a fair and efficient system for everyone involved. Previously, this customer had to limit their users to only one item in the cart and force them to wait for a period of time after each checkout before allowing them to rejoin the queue. This led to an awkward experience for end users, longer wait times, and reduced site throughput. With session revocation, this online retailer can now end the user’s session immediately after a purchase is complete, placing the user back in the queue if applicable, without being forced to wait for a preset timeout period. This significantly improves the end user experience by reducing unnecessary wait times and streamlining the purchase process.
Let’s deep dive into these two capabilities and how they improve the overall user experience.
How bots impact the Waiting Room user experience
Waiting Room is often used to protect sites from being overwhelmed by traffic surges during high demand online events. These high demand events, such as ticket or e-commerce product sales, attract both a deluge of genuine users, and sophisticated bots, such as scalper bots. This type of bot traffic is unique, as they can complete the checkout process or user journey much quicker than normal human traffic. Bots in the queue negatively affect the user experience by increasing wait times, as they often occupy multiple spots. Additionally, their behavior can exacerbate the issue — if they don’t handle cookies properly, they fail to take their spot in the application when their turn comes, further preventing the queue from progressing smoothly. Once past the queue, bots can also contribute to inventory hoarding, as they often reserve or consume large quantities of stock without genuine intent to purchase. An example of this is the PlayStation 5’s launch in November 2020. Due to high demand and production limitations during the COVID-19 pandemic, scalper bots bought up stock quickly, making it difficult for average consumers to purchase the console at retail prices. This led to extreme frustration for retailers and consumers as these bots drove the prices up significantly.
Quantifying bot traffic to Waiting Room with an invisible Turnstile challenge
Waiting Room customers have long been curious about the nature of large traffic spikes. Historically, bot scores and managed challenges have been the primary methods of collecting this data and acting on it. While these can provide some insight into the distribution of traffic, the Turnstile invisible challenge gives us the ability to actively interrogate the browser, providing the most complete set of data on whether that browser is being operated by a human or a bot.
To start quantifying bot traffic to waiting rooms, we have added an invisible Turnstile challenge to all basic rooms. With the purchase of an Advanced Waiting Room, customers can select between invisible, managed, or non-interactive widget modes. This Turnstile team blog post has more details on the different widget modes.
Waiting Room’s integration with Turnstile aims to protect your site with minimal impact to the user experience by placing a Turnstile challenge on your waiting room’s queuing page. Unlike a standard WAF challenge, the Waiting Room Turnstile challenge is presented only when the waiting room is queuing. This way, users won’t face any interruptions once they are past the queue and into the application.
With an advanced waiting room, you can configure the type of Turnstile challenge from the Cloudflare dashboard and API.
From the analytics we’ve gathered with the invisible Turnstile challenge on all basic waiting rooms, we’ve been able to determine that many large traffic spikes come from user agents that don’t even attempt to run the challenge, leaving it unsolved. In other words, we send the challenge widget in the HTML for the queuing page, but sometimes those challenges never get completed. By subtracting the number of times we see solved challenges from the total number of times we send challenges, we can get a count of requests that are likely from unsophisticated bots. These requests are reported to Waiting Room Analytics as “Likely Bots.” We’ve seen small businesses with low baseline traffic hit with tens of thousands of such requests (or more) in a short period of time. When a large influx of non-human traffic like this comes in, every visitor to the website ends up queued in a waiting room, not just the bots.
These bots could be any software that simply sends out HTTP requests. This data can help determine whether a traffic spike and subsequent queueing is coming from real human users, or a bunch of simple bots that don’t even bother to run JavaScript.
With the Turnstile integration, we are also catching sophisticated bots. While many of the bots we see don’t attempt to run the challenge, there are a few that do. Detecting these bots is more difficult than detecting simple bots that don’t run JavaScript. The Turnstile widget runs a series of checks against the browser to find evidence that a browser isn’t being operated by a human, and is instead being driven by something like Selenium. If Turnstile isn’t able to determine that the browser is being operated by a human, we count that as a failed challenge and report those users to Waiting Room Analytics as “Bots,” since we are quite confident that these users are not human.
About 1 in 20 “users” that run the challenge end up not passing. Just like the previously mentioned unsophisticated bots, these more sophisticated bots inflate the size of the queue, making it more difficult for real humans to make it through to your website.
The remaining 19 in 20 “users” that successfully pass the challenge are counted in Waiting Room Analytics as “Likely Humans.”
These new metrics related to Turnstile challenge outcomes are available in your Waiting Room Analytics dashboard and the analytics GraphQL API, so you can see the distribution of bot to human traffic in your waiting room. Once you know what your traffic looks like, the real question is: what can you do about it?
View the distribution of traffic and challenges issued in Waiting Room Analytics
New Infinite Queue feature
Beyond logging your Turnstile challenge outcomes, Advanced Waiting Room customers have the option to select the Infinite Queue feature. With this feature, all traffic that fails the Turnstile challenge, such as a bot, will be sent to an Infinite Queue page. The Infinite Queue matches the normal queuing experience, prolonging the time it takes the bot to recognize they are being blocked and effectively consuming their resources. While the Infinite Queue will have the same look and feel as the Waiting Room page, the bot is not actually a part of the real queue.
With the infinite Queue enabled, all traffic will have to pass the challenge to enter the real queue. By blocking bots from joining the queue, we will reduce wait times for humans and prevent bots from using up server resources during a traffic spike.
Enable the Infinite Queue option through the Cloudflare dashboard or API.
Bots will be none the wiser, wasting their time and resources waiting in an infinite queue that will never get them to where they’re trying to go.
We keep track of the traffic hitting the infinite queue, counting the number of times they refresh their queuing page in Waiting Room Analytics. This appears as the “infinite queue refreshes” count in the analytics dash and GraphQL API. This metric gives you a good idea of the amount of time these bots have wasted trying to reach your website.
How Waiting Room integrates with Turnstile
Turnstile is a powerful and versatile product that anyone, Cloudflare and others alike, can use to build systems to thwart bot traffic. Waiting Room integrates Turnstile the same as any other Turnstile user.
<!DOCTYPE html>
<html>
	<head>
		<title>Waiting Room</title>
	</head>
	<body>
		<h1>You are currently in the queue.</h1>
		{{#waitTimeKnown}}
			<h2>Your estimated wait time is {{waitTimeFormatted}}.</h2>
		{{/waitTimeKnown}}
		{{^waitTimeKnown}}
			<h2>Your estimated wait time is unknown.</h2>
		{{/waitTimeKnown}}
		{{#turnstile}}
			<!-- for a managed (and potentially interactive) challenge, you may want to instruct the user to complete the challenge -->
			<p>Please complete this challenge so we know you're a human:</p>
			{{{turnstile}}} <!-- include the turnstile widget -->
		{{/turnstile}}
	</body>
</html>
The Turnstile widget can be embedded in custom queuing page templates by including the {{{turnstile}}} variable.
<!DOCTYPE html>
<html>
	<head>
		<title>Waiting Room</title>
	</head>
	<body>
		{{#turnstile}}
			<h1>This website is currently using a waiting room.</h1>
			<p>We use a Turnstile challenge to ensure you aren't waiting in line behind bots. Complete this challenge to enter the queue.</p>
			{{{turnstile}}} <!-- include the turnstile widget -->
		{{/turnstile}}
		{{^turnstile}}
			<h1>You are currently in the queue.</h1>
			{{#waitTimeKnown}}
				<h2>Your estimated wait time is {{waitTimeFormatted}}.</h2>
			{{/waitTimeKnown}}
			{{^waitTimeKnown}}
				<h2>Your estimated wait time is unknown.</h2>
			{{/waitTimeKnown}}
		{{/turnstile}}
	</body>
</html>
When using Infinite Queue (especially with managed challenges which may be interactive), you may want to tell users they will not be in the queue until they complete the challenge.
We embed a plain Turnstile challenge in the queuing page by passing the HTML to the queuing page template in a turnstile variable. The default queuing page template and any newly created custom templates include this variable already. If you have an existing custom HTML template and wish to enable the Turnstile integration, you will need to add {{{turnstile}}} somewhere in the template to tell Waiting Room where the widget should be placed. Waiting Room uses Mustache templates, so including raw HTML within your template without escaping requires three curly braces instead of two.
A managed Turnstile challenge on the default Waiting Room queuing page template
Once the challenge completes, fails, or times out, the page refreshes and passes the Turnstile token to Waiting Room’s worker. Next, we check in with Turnstile’s siteverify endpoint to make sure the challenge was successful. From there, we report the outcome to the Waiting Room’s analytics and optionally send failed traffic (bots) to an infinite queue.
The infinite queue itself is designed to be as close to normal queuing as possible. When a bot is sent to the infinite queue, we issue it a cookie which looks like a normal waiting room cookie. Inside the cookie’s encryption though, we have a boolean flag that tells our worker to send the bot’s requests to the infinite queue. When we see that flag, we skip all the normal queuing logic and just render a queuing page.
That queuing page shows a fake estimated time remaining. It’s based on an asymptotic curve which appears to decrease linearly from the start. As time goes on, the curve gets flatter (and progress through the “queue” gets slower), so the estimated time remaining never quite reaches 0.
This graph is an approximation of the time remaining (y-axis, minutes) that bots will see, compared to the amount of time they’ve waited in the infinite queue (x-axis, minutes).
We reuse much of the same code for rendering the queuing page for the infinite queue and the normal queue. We do this to reduce the amount of signal bots may have that they are in the infinite queue rather than the normal queue.
let cookie
if (query['cf_wr_turnstile']) {
    const turnstileToken = query['cf_wr_turnstile']
    const tokenOk = await siteverify(turnstileToken)
    if (tokenOk) {
        analytics.turnstileSuccesses++
        cookie = newCookie()
    } else {
        analytics.turnstileFailures++
        cookie = { infiniteQueuing: true }
    }
    response.headers['Set-Cookie'] = encryptCookie(cookie)
}
if (!cookie) {
    cookie = decryptCookie(headers['Cookie'])
}
if (!cookie) {
    analytics.turnstileChallenges++
    return await queuingPage(await estimateTimeRemaining(), { turnstileChallenge: true })
} else if (cookie.infiniteQueuing) {
    analytics.infiniteQueueRequests++
    return await queuingPage(fakeTimeRemaining())
} else if (cookie.accepted) {
    return await sendToOrigin()
} else {
    // run Waiting Room's distributed queuing logic to check whether
    // this user has made it to the front of the queue, but only after
    // the user has completed a Turnstile challenge and isn't in the
    // fake infinite queue
    const { letThrough, timeRemaining } = calculateQueuing(cookie)
    if (letThrough) {
        cookie.accepted = true
        response.headers['Set-Cookie'] = encryptCookie(cookie)
        return await sendToOrigin()
    } else {
        return await queuingPage(timeRemaining)
    }
}
Approximate psuedocode for how we handle incoming requests when infinite queue is enabled in the Waiting Room worker
Thanks to the versatility of Turnstile, we only needed to rely on public Turnstile APIs to build this integration.
Adding Turnstile to Waiting Room is a proactive step in managing traffic that directly contributes to a smoother, faster experience for end users. Building on that efficiency, let’s dive into how you can add an additional layer of control to increase throughput and minimize wait times for your customers.
Further improve wait times using session revocation
We have talked extensively in a previous blog post about how we queue users with respect to the current active users on the application and the defined limits, and, in the same blog post, what state and calculations we use to determine the amount of total active users. Here is a quick summary for those who have not read that post:
When a user navigates to a page behind a waiting room, they receive a cookie and are associated with a time period called a bucket. We use these buckets to track the number of users either waiting in the queue or accessing the application for that specific time period. Whenever a user makes a request, we move their session from their previous bucket to the latest bucket. Once a bucket is older than the configured session duration, we know that those user sessions are no longer valid (expired) and we can clean up those values. Thus, that user session expires, and new slots are opened for the next users to enter the application.
These buckets are aggregated at Cloudflare data centers and then globally via the internal state of the waiting room, which is structured as multiple CRDT counters and registers. This allows us to merge the distributed state of the waiting room stored in multiple data centers as a single global state without conflicts.
To calculate the total active users on an application, we first merge the state from all data centers. Then, we sum the active users for all the buckets where a session can still be active.
Because the Waiting Room runs per user request, we do not explicitly know when a user has stopped accessing the application, and instead we only stop receiving requests from them. So, we must consider their session active and as a contributor to the total active users count until it is older than the session duration limit. For waiting rooms that have a high session duration value configured, a user might navigate to the site for a small duration of time but contribute to the total active users count for up to the configured session duration even after they have stopped accessing the application. This can cause decreased throughput and longer wait times for users in the queue.
Introducing Session Revocation
With the Session Revocation feature, we now allow origins to return a command to the waiting room via an HTTP header (Cf-Waiting-Room-Command) to notify the Waiting Room to revoke the user session associated with the current response. This command removes the current user’s session and decreases the number of total active users for the bucket the session was last tracked in. This allows origins to terminate a user’s session early without needing to wait for the session to expire naturally.
This can improve the throughput of waiting rooms in front of applications which have a dynamic user flow where the session duration is set very high to account for users who send infrequent requests to the application.
To set up session revocation in your waiting room, in the user session settings section in the configuration, check the “Allow session termination via origin commands” box. You must also configure your origin to return a session revocation HTTP header (Cf-Waiting-Room-Command: revoke) on the response when you want the session associated with that response to be revoked. For more information on how to do this, refer to our developer documentation.
Enable session revocation in the user session settings configuration
In Waiting Room Analytics, you can view the number of sessions revoked per minute. The sessionsRevokedfield is the count of how many sessions were revoked in that minute in the analytics GraphQL API.
In summary, Waiting Room Turnstile Integration and Session Revocation work together to enhance both security and user experience. The addition of a Turnstile challenge in the Waiting Room helps identify and block bots, ensuring that legitimate users don’t face unnecessary delays. Meanwhile, the Session Revocation feature optimizes resource usage by allowing you to end user sessions after key actions, like completing a purchase, freeing up space for other users.
Together, these features successfully increase throughput and reduce wait times, providing a faster, more efficient experience for your customers. For more information on these features, check out our developer documentation.
Back in 2021, we covered the antics of Grinch Bots and how the combination of proposed regulation and technology could prevent these malicious programs from stealing holiday cheer.
Fast-forward to 2024 — the Stop Grinch Bots Act of 2021 has not passed, and bots are more active and powerful than ever, leaving businesses to fend off increasingly sophisticated attacks on their own. During Black Friday 2024, Cloudflare observed:
29% of all traffic on Black Friday was Grinch Bots. Humans still accounted for the majority of all traffic, but bot traffic was up 4x from three years ago in absolute terms.
1% of traffic on Black Friday came from AI bots. The majority of it came from Claude, Meta, and Amazon. 71% of this traffic was given the green light to access the content requested.
63% of login attempts across our network on Black Friday were from bots. While this number is high, it was down a few percentage points compared to a month prior, indicating that more humans accessed their accounts and holiday deals.
Human logins on e-commerce sites increased 7-8% compared to the previous month.
These days, holiday shopping doesn’t start on Black Friday and stop on Cyber Monday. Instead, it stretches through Cyber Week and beyond, including flash sales, pre-orders, and various other promotions. While this provides consumers more opportunities to shop, it also creates more openings for Grinch Bots to wreak havoc.
Black Friday – Cyber Monday by the numbers
Black Friday and Cyber Monday in 2024 brought record-breaking shopping — and grinching. In addition to looking across our entire network, we also analyzed traffic patterns specifically on a cohort of e-commerce sites.
Legitimate shoppers flocked to e-commerce sites, with requests reaching an astounding 405 billion on Black Friday, accounting for 81% of the day’s total traffic to e-commerce sites. Retailers reaped the rewards of their deals and advertising, seeing a 50% surge in shoppers week-over-week and a 61% increase compared to the previous month.
Unfortunately, Grinch Bots were equally active. Total e-commerce bot activity surged to 103 billion requests, representing up to 19% of all traffic to e-commerce sites. Nearly one in every five requests to an online store was not a real customer. That’s a lot of resources to waste on bogus traffic. Cyber Week was a battleground, with bots hoarding inventory, exploiting deals, and disrupting genuine shopping experiences.
The upside, if there is one, is that there was more human activity on e-commerce sites (81%) than observed on our network more broadly (71%).
The Grinch Bot’s Modus Operandi
Cloudflare saw 4x more bot requests than what we observed in 2021. Being able to observe and score all this traffic at scale means we can help customers keep the grinches away. We also got to see patterns that help us better identify the concentration of these attacks:
19% of traffic on e-commerce sites was Grinch Bots
1% of traffic to e-commerce sites was from AI Bots.
63% of login attempt requests across our network were from bots
22% of bot activity originated from residential proxy networks
What are all of these bots up to?
AI bots
This year marked a breakthrough for AI-driven bots, agents, and models, with their impact spilling into Black Friday. AI bots went from zero to one, now making up 1% of all bot traffic on e-commerce sites.
AI-driven bots generated 29 billion requests on Black Friday alone, with Meta-external, Claudebot, and Amazonbot leading the pack. Based on their owners, these bots are meant to crawl to augment training data sets for Llama, Claude, and Alexa respectively.
We looked at e-commerce sites specifically to find out if these bots were treating all content equally. While Meta-External and Amazonbot were still in the Top 3 of AI bots reaching e-commerce sites, Bytedance’s Bytespider crawled the most shopping sites.
Account Takeover (ATO) bots
In addition to scraping, crawling, and shopping, bots also targeted customer accounts on Black Friday. We saw 14.1 billion requests from bots to /login endpoints, accounting for 63% of that day’s login attempts.
While this number seems high, intuitively it makes sense, given that humans don’t log in to accounts every day, but bots definitely try to crack accounts every day. Interestingly, while humans only accounted for 36% of traffic to login pages on Black Friday, this number was up 7-8% compared to the prior month. This suggests that more shoppers logged in to capitalize on deals and discounts on Black Friday than in preceding weeks. Human logins peaked at around 40% of all traffic to login sites on the Monday before Thanksgiving, and again on Cyber Monday.
Separately, we also saw a 37% increase in leaked passwords used in login requests compared to the prior month. During Birthday Week, we shared how 65% of internet users are at risk of ATO due to re-use of leaked passwords. This surge, coinciding with heightened human and bot traffic, underscores a troubling pattern: both humans and bots continue to depend on common and compromised passwords, amplifying security risks.
Proxy bots: Regardless of whether they’re crawling your content or hoarding your wares, 22% of bot traffic originated from residential proxy networks. This obfuscation makes these requests look like legitimate customers browsing from their homes rather than large cloud networks. The large pool of IP addresses and the diversity of networks poses a challenge to traditional bot defense mechanisms that rely on IP reputation and rate limiting.
Moreover, the diversity of IP addresses enables the attackers to rotate through them indefinitely. This shrinks the window of opportunity for bot detection systems to effectively detect and stop the attacks. The use of residential proxies is a trend we have been tracking for months now and Black Friday traffic was within the range we’ve seen throughout this year.
If you’re using Cloudflare’s Bot Management, your site is already protected from these bots since we update our bot score based on these types of network fingerprints. In May 2024, we introduced our latest model optimized for detecting residential proxies. Early results show promising declines in this type of activity, indicating that bot operators may be reducing their reliance on residential proxies.
The Christmas “Yule” log: how customers can protect themselves
35% of all traffic on Black Friday was Grinch Bots. To keep Grinch Bots at bay, businesses need year-round bot protection and proactive strategies tailored to the unique challenges of holiday shopping.
(2) Monitor potential Account Takeover (ATO) attacks: Bots often test stolen credentials in the months leading up to Cyber Week to refine their strategies. Re-use of stolen credentials makes businesses even more vulnerable. Our account abuse detections help customers monitor login paths for leaked credentials and traffic anomalies.
Check out more examples of related rules you can create.
(3) Rate limit account and purchase paths: Apply rate-limiting best practices on critical application paths. These include limiting new account access/creation from previously seen IP addresses, and leveraging other network fingerprints, to help prevent promo code abuse and inventory hoarding, as well as identifying account takeover attempts through the application of detection IDs and leaked credential checks.
(4) Block AI bots abusing shopping features to maintain fair access for human users. If you’re using Cloudflare, you can quickly block all AI bots by enabling our automatic AI bot blocking feature.
What to expect in 2025?
Over the next year, e-commerce sites should expect to see more humans shopping for longer periods. As sale periods lengthen (like they did in 2024) we expect more peaks in human activity on e-commerce sites across November and December. This is great for consumers and great for merchants.
More AI bots and agents will be integrated into e-commerce journeys in 2025. AI bots will not only be crawling sites for training data, but will also integrate into the shopping experience. AI bots did not exist in 2021, but now make up 1% of all bot traffic. This is only the tip of the iceberg and their growth will explode in the next year. We expect this to pose new risks as bots mimic and act on behalf of humans.
More sophisticated automation through network, device, and cookie cycling will also become a bigger threat. Bot operators will continue to employ advanced evasion tactics like rotating devices, IP addresses, and cookies to bypass detection.
Grinch Bots are evolving, and regulation may be slowing, but businesses don’t have to face them alone. We remain resolute in our mission to help build a better Internet … and holiday shopping experience.
Even though the holiday season is closing out soon, bots are never on vacation. It’s never too late or too early to start protecting your customers and your business from grinches that work all year round.
Wishing you all happy holidays and a bot-free new year!
Cloudflare’s AI Audit dashboard allows you to easily understand how AI companies and services access your content. AI Audit gives a summary of request counts broken out by bot, detailed path summaries for more granular insights, and the ability to filter by categories like AI Search or AI Crawler.
Today, we’re going one step further. You can now quickly see which AI services are honoring your robots.txt policies, which aren’t, and then programmatically enforce these policies.
What is robots.txt?
Robots.txt is a plain text file hosted on your domain that implements the Robots Exclusion Protocol, a standard that has been around since 1994. This file tells crawlers like Google, Bing, and many others which parts of your site, if any, they are allowed to access.
There are many reasons why site owners would want to define which portions of their websites crawlers are allowed to access: they might not want certain content available on search engines or social networks, they might trust one platform more than another, or they might simply want to reduce automated traffic to their servers.
With the advent of generative AI, AI services have started crawling the Internet to collect training data for their models. These models are often proprietary and commercial and are used to generate new content. Many content creators and publishers that want to exercise control over how their content is used have started using robots.txt to declare policies that cover these AI bots, in addition to the traditional search engines.
Here’s an abbreviated real-world example of the robots.txt policy from a top online news site:
This policy declares that the news site doesn’t want ChatGPT, Anthropic AI, Google Gemini, or ByteDance’s Bytespider to crawl any of their content.
From voluntary compliance to enforcement
Compliance with the Robots Exclusion Protocol has historically been voluntary.
That’s where our new feature comes in. We’ve extended AI Audit to give our customers both the visibility into how AI services providers honor their robots.txt policies and the ability to enforce those policies at the network level in your WAF.
Your robots.txt file declares your policy, but now we can help you enforce it. You might even call it … your Robotcop.
How it works
AI Audit takes the robots.txt files from your web properties, parses them, and then matches their rules against the AI bot traffic we see for the selected property. The summary table gives you an aggregated view of the number of requests and violations we see for every Bot across all paths. If you hover your mouse over the Robots.txt column, we will show you the defined policies for each Bot in the tooltip. You can also filter by violations from the top of the page.
In the “Most popular paths” section, whenever a path in your site gets traffic that has violated your policy, we flag it for visibility. Ideally, you wouldn’t see violations in the Robots.txt column — if you do see them, someone’s not complying.
But that’s not all… More importantly, AI Audit allows you to enforce your robots.txt policy at the network level. By pressing the “Enforce robots.txt rules” button on the top of the summary table, we automatically translate the rules defined for AI Bots in your robots.txt into an advanced firewall rule, redirect you to the WAF configuration screen, and allow you to deploy the rule in our network.
This is how the robots.txt policy mentioned above looks after translation:
Once you deploy a WAF rule built from your robots.txt policies, you are no longer simply requesting that AI services respect your policy, you’re enforcing it.
Conclusion
With AI Audit, we are giving our customers even more visibility into how AI services access their content, helping them define their policies and then enforcing them at the network level.
This feature is live today for all Cloudflare customers. Simply log into the dashboard and navigate to your domain to begin auditing the bot traffic from AI services and enforcing your robots.txt directives.
The continued growth of AI has fundamentally changed the Internet over the past 24 months. AI is increasingly ubiquitous, and Cloudflare is leaning into the new opportunities and challenges it presents in a big way. This year for Cloudflare’s birthday, we’ve extended our AI Assistant capabilities to help you build new WAF rules, added AI bot traffic insights on Cloudflare Radar, and given customers new AI bot blocking capabilities.
AI Assistant for WAF Rule Builder
At Cloudflare, we’re always listening to your feedback and striving to make our products as user-friendly and powerful as possible. One area where we’ve heard your feedback loud and clear is in the complexity of creating custom and rate-limiting rules for our Web Application Firewall (WAF). With this in mind, we’re excited to introduce a new feature that will make rule creation easier and more intuitive: the AI Assistant for WAF Rule Builder.
By simply entering a natural language prompt, you can generate a custom or rate-limiting rule tailored to your needs. For example, instead of manually configuring a complex rule matching criteria, you can now type something like, “Match requests with low bot score,” and the assistant will generate the rule for you. It’s not about creating the perfect rule in one step, but giving you a strong foundation that you can build on.
The assistant will be available in the Custom and Rate Limit Rule Builder for all WAF users. We’re launching this feature in Beta for all customers, and we encourage you to give it a try. We’re looking forward to hearing your feedback (via the UI itself) as we continue to refine and enhance this tool to meet your needs.
AI bot traffic insights on Cloudflare Radar
AI platform providers use bots to crawl and scrape websites, vacuuming up data to use for model training. This is frequently done without the permission of, or a business relationship with, the content owners and providers. In July, Cloudflare urged content owners and providers to “declare their AIndependence”, providing them with a way to block AI bots, scrapers, and crawlers with a single click. In addition to this so-called “easy button” approach, sites can provide more specific guidance to these bots about what they are and are not allowed to access through directives in a robots.txt file. Regardless of whether a customer chooses to block or allow requests from AI-related bots, Cloudflare has insight into request activity from these bots, and associated traffic trends over time.
Tracking traffic trends for AI bots can help us better understand their activity over time — which are the most aggressive and have the highest volume of requests, which launch crawls on a regular basis, etc. The new AI bot & crawler traffic graph on Radar’s Traffic page provides insight into these traffic trends gathered over the selected time period for the top known AI bots. The associated list of bots tracked here is based on the ai.robots.txt list, and will be updated with new bots as they are identified. Time series and summary data is available from the Radar API as well. (Traffic trends for the full set of AI bots & crawlers can be viewed in the new Data Explorer.)
Blocking more AI bots
For Cloudflare’s birthday, we’re following up on our previous blog post, Declaring Your AIndependence, with an update on the new detections we’ve added to stop AI bots. Customers who haven’t already done so can simply click the button to block AI bots to gain more protection for their website.
Enabling dynamic updates for the AI bot rule
The old button allowed customers to block verified AI crawlers, those that respect robots.txt and crawl rate, and don’t try to hide their behavior. We’ve added new crawlers to that list, but we’ve also expanded the previous rule to include 27 signatures (and counting) of AI bots that don’t follow the rules. We want to take time to say “thank you” to everyone who took the time to use our “tip line” to point us towards new AI bots. These tips have been extremely helpful in finding some bots that would not have been on our radar so quickly.
For each bot we’ve added, we’re also adding them to our “Definitely automated” definition as well. So, if you’re a self-service plan customer using Super Bot Fight Mode, you’re already protected. Enterprise Bot Management customers will see more requests shift from the “Likely Bot” range to the “Definitely automated” range, which we’ll discuss more below.
Under the hood, we’ve converted this rule logic to a Cloudflare managed rule (the same framework that powers our WAF). This enables our security analysts and engineers to safely push updates to the rule in real-time, similar to how new WAF rule changes are rapidly delivered to ensure our customers are protected against the latest CVEs. If you haven’t logged back into the Bots dashboard since the previous version of our AI bot protection was announced, click the button again to update to the latest protection.
The impact of new fingerprints on the model
One hidden beneficiary of fingerprinting new AI bots is our ML model. As we’ve discussed before, our global ML model uses supervised machine learning and greatly benefits from more sources of labeled bot data. Below, you can see how well our ML model recognized these requests as automated, before and after we updated the button, adding new rules. To keep things simple, we have shown only the top 5 bots by the volume of requests on the chart. With the introduction of our new managed rule, we have observed an improvement in our detection capabilities for the majority of these AI bots. Button v1 represents the old option that let customers block only verified AI crawlers, while Button v2 is the newly introduced feature that includes managed rule detections.
So how did we make our detections more robust? As we have mentioned before, sometimes a single attribute can give a bot away. We developed a sophisticated set of heuristics tailored to these AI bots, enabling us to effortlessly and accurately classify them as such. Although our ML model was already detecting the vast majority of these requests, the integration of additional heuristics has resulted in a noticeable increase in detection rates for each bot, and ensuring we score every request correctly 100% of the time. Transitioning from a purely machine learning approach to incorporating heuristics offers several advantages, including faster detection times and greater certainty in classification. While deploying a machine learning model is complex and time-consuming, new heuristics can be created in minutes.
The initial launch of the AI bots block button was well-received and is now used by over 133,000 websites, with significant adoption even among our Free tier customers. The newly updated button, launched on August 20, 2024, is rapidly gaining traction. Over 90,000 zones have already adopted the new rule, with approximately 240 new sites integrating it every hour. Overall, we are now helping to protect the intellectual property of more than 146,000 sites from AI bots, and we are currently blocking 66 million requests daily with this new rule. Additionally, we’re excited to announce that support for configuring AI bots protection via Terraform will be available by the end of this year, providing even more flexibility and control for managing your bot protection settings.
Bot behavior
With the enhancements to our detection capabilities, it is essential to assess the impact of these changes to bot activity on the Internet. Since the launch of the updated AI bots block button, we have been closely monitoring for any shifts in bot activity and adaptation strategies. The most basic fingerprinting technique we use to identify AI bot looking for simple user-agent matches. User-agent matches are important to monitor because they indicate the bot is transparently announcing who they are when they’re crawling a website.
The graph below shows a volume of traffic we label as AI bot over the past two months. The blue line indicates the daily request count, while the red line represents the monthly average number of requests. In the past two months, we have seen an average reduction of nearly 30 million requests, with a decrease of 40 million in the most recent month.This decline coincides with the release of Button v1 and Button v2. Our hypothesis is that with the new AI bots blocking feature, Cloudflare is blocking a majority of these bots, which is discouraging them from crawling.
This hypothesis is supported by the observed decline in requests from several top AI crawlers. Specifically, the Bytespider bot reduced its daily requests from approximately 100 million to just 50 million between the end of June and the end of August (see graph below). This reduction could be attributed to several factors, including our new AI bots block button and changes in the crawler’s strategy.
We have also observed an increase in the accountability of some AI crawlers. The most basic fingerprinting technique we use to identify AI bot looking for simple user-agent matches. User-agent matches are important to monitor because they indicate the bot is transparently announcing who they are when they’re crawling a website. These crawlers are now more frequently using their agents, reflecting a shift towards more transparent and responsible behavior. Notably, there has been a dramatic surge in the number of requests from the Perplexity user agent. This increase might be linked to previous accusationsthat Perplexity did not properly present its user agent, which could have prompted a shift in their approach to ensure better identification and compliance.
These trends suggest that our updates are likely affecting how AI crawlers interact with content. We will continue to monitor AI bot activity to help users control who accesses their content and how. By keeping a close watch on emerging patterns, we aim to provide users with the tools and insights needed to make informed decisions about managing their traffic.
Wrap up
We’re excited to continue to explore the AI landscape, whether we’re finding more ways to make the Cloudflare dashboard usable or new threats to guard against. Our AI insights on Radar update in near real-time, so please join us in watching as new trends emerge and discussing them in the Cloudflare Community.
Chrome and Mozilla announced that they will stop trusting Entrust’s public TLS certificates issued after November 12, 2024 and December 1, 2024, respectively. This decision stems from concerns related to Entrust’s ability to meet the CA/Browser Forum’s requirements for a publicly trusted certificate authority (CA). To prevent Entrust customers from being impacted by this change, Entrust has announced that they are partnering with SSL.com, a publicly trusted CA, and will be issuing certs from SSL.com’s roots to ensure that they can continue to provide their customers with certificates that are trusted by Chrome and Mozilla.
We’re excited to announce that we’re going to be adding SSL.com as a certificate authority that Cloudflare customers can use. This means that Cloudflare customers that are currently relying on Entrust as a CA and uploading their certificate manually to Cloudflare will now be able to rely on Cloudflare’s certificate management pipeline for automatic issuance and renewal of SSL.com certificates.
CA distrust: responsibilities, repercussions, and responses
With great power comes great responsibility Every publicly trusted certificate authority (CA) is responsible for maintaining a high standard of security and compliance to ensure that the certificates they issue are trustworthy. The security of millions of websites and applications relies on a CA’s commitment to these standards, which are set by the CA/Browser Forum, the governing body that defines the baseline requirements for certificate authorities. These standards include rules regarding certificate issuance, validation, and revocation, all designed to secure the data transferred over the Internet.
However, as with all complex software systems, it’s inevitable that bugs or issues may arise, leading to the mis-issuance of certificates. Improperly issued certificates pose a significant risk to Internet security, as they can be exploited by malicious actors to impersonate legitimate websites and intercept sensitive data.
To mitigate such risk, publicly trusted CAs are required to communicate issues as soon as they are discovered, so that domain owners can replace the compromised certificates immediately. Once the issue is communicated, CAs must revoke the mis-issued certificates within 5 days to signal to browsers and clients that the compromised certificate should no longer be trusted. This level of transparency and urgency around the revocation process is essential for minimizing the risk posed by compromised certificates.
Why Chrome and Mozilla are distrusting Entrust The decision made by Chrome and Mozilla to distrust Entrust’s public TLS certificates stems from concerns regarding Entrust’s incident response and remediation process. In several instances, Entrust failed to report critical issues and did not revoke certificates in a timely manner. The pattern of delayed action has eroded the browsers’ confidence in Entrust’s ability to act quickly and transparently, which is crucial for maintaining trust as a CA.
Google and Mozilla cited the ongoing lack of transparency and urgency in addressing mis-issuances as the primary reason for their distrust decision. Google specifically pointed out that over the past 6 years, Entrust has shown a “pattern of compliance failures” and failed to make the “tangible, measurable progress” necessary to restore trust. Mozilla echoed these concerns, emphasizing the importance of holding Entrust accountable to ensure the integrity and security of the public Internet.
Entrust’s response to the distrust announcement In response to the distrust announcement from Chrome and Mozilla, Entrust has taken proactive steps to ensure continuity for their customers. To prevent service disruption, Entrust has announced that they are partnering with SSL.com, a CA that’s trusted by all major browsers, including Chrome and Mozilla, to issue certificates for their customers. By issuing certificates from SSL.com’s roots, Entrust aims to provide a seamless transition for their customers, ensuring that they can continue to obtain certificates that are recognized and trusted by the browsers their users rely on.
In addition to their partnership with SSL.com, Entrust stated that they are working on a number of improvements, including changes to their organizational structure, revisions to their incident response process and policies, and a push towards automation to ensure compliant certificate issuances.
How Cloudflare can help Entrust customers
Now available: SSL.com as a certificate authority for Advanced Certificate Manager and SSL for SaaS certificates We’re excited to announce that customers using Advanced Certificate Manager will now be able to select SSL.com as a certificate authority for Advanced certificates and Total TLS certificates. Once the certificate is issued, Cloudflare will handle all future renewals on your behalf.
By default, Cloudflare will issue SSL.com certificates with a 90 day validity period. However, customers using Advanced Certificate Manager will have the option to set a custom validity period (14, 30, or 90 days) for their SSL.com certificates. In addition, Enterprise customers will have the option to obtain 1-year SSL.com certificates. Every SSL.com certificate order will include 1 RSA and 1 ECDSA certificate.
Note: We are gradually rolling this out and customers should see the CA become available to them through the end of September and into October.
If you’re using Cloudflare as your DNS provider, there are no additional steps for you to take to get the certificate issued. Cloudflare will validate the ownership of the domain on your behalf to get your SSL.com certificate issued and renewed.
If you’re using an external DNS provider and have wildcard hostnames on your certificates, DNS based validation will need to be used, which means that you’ll need to add TXT DCV tokens at your DNS provider in order to get the certificate issued. With SSL.com, two tokens are returned for every hostname on the certificate. This is because SSL.com uses different tokens for the RSA and ECDSA certificates. To reduce the overhead around certificate management, we recommend setting up DCV Delegation to allow Cloudflare to place domain control validation (DCV) tokens on your behalf. Once DCV Delegation is set up, Cloudflare will automatically issue, renew, and deploy all future certificates for you.
Advanced Certificates: selecting SSL.com as a CA through the UI or API Customers can select SSL.com as a CA through the UI or through the Advanced Certificate API endpoint by specifying “ssl_com” in the certificate_authority parameter.
If you’d like to use SSL.com as a CA for an advanced certificate, you can select “SSL.com” as your CA when creating a new Advanced certificate order.
If you’d like to use SSL.com as a CA for all of your certificates, we recommend setting your Total TLS CA to SSL.com. This will issue an individual certificate for each of your proxied hostname from the CA.
Note: Total TLS is a feature that’s only available to customers that are using Cloudflare as their DNS provider.
SSL for SaaS: selecting SSL.com as a CA through the UI or API Enterprise customers can select SSL.com as a CA through the custom hostname creation UI or through the Custom Hostnames API endpoint by specifying “ssl_com” in the certificate_authority parameter.
All custom hostname certificates issued from SSL.com will have a 90 day validity period. If you have wildcard support enabled for custom hostnames, we recommend using DCV Delegation to ensure that all certificate issuances and renewals are automatic.
Our recommendation if you’re using Entrust as a certificate authority
Cloudflare customers that use Entrust as their CA are required to manually handle all certificate issuances and renewals. Since Cloudflare does not directly integrate with Entrust, customers have to get their certificates issued directly from the CA and upload them to Cloudflare as custom certificates. Once these certificates come up for renewal, customers have to repeat this manual process and upload the renewed certificates to Cloudflare before the expiration date.
Manually managing your certificate’s lifecycle is a time-consuming and error prone process. With certificate lifetimes decreasing from 1 year to 90 days, this cycle needs to be repeated more frequently by the domain owner.
As Entrust transitions to issuing certificates from SSL.com roots, this manual management process will remain unless customers switch to Cloudflare’s managed certificate pipeline. By making this switch, you can continue to receive SSL.com certificates without the hassle of manual management — Cloudflare will handle all issuances and renewals for you!
In early October, we will be reaching out to customers who have uploaded Entrust certificates to Cloudflare to recommend migrating to our managed pipeline for SSL.com certificate issuances, simplifying your certificate management process.
If you’re ready to make the transition today, simply go to the SSL/TLS tab in your Cloudflare dashboard, click “Order Advanced Certificate”, and select “SSL.com” as your certificate authority. Once your new SSL.com certificate is issued, you can either remove your Entrust certificate or simply let it expire. Cloudflare will seamlessly transition to serving the managed SSL.com certificate before the Entrust certificate expires, ensuring zero downtime during the switch.
For many years, Cloudflare has used advanced fingerprinting techniques to help block online threats, in products like our DDoS engine, our WAF, and Bot Management. For the purposes of Bot Management, fingerprinting characteristic elements of client software help us quickly identify what kind of software is making an HTTP request. It’s an efficient and accurate way to differentiate a browser from a Python script, while preserving user privacy. These fingerprints are used on their own for simple rules, and they underpin complex machine learning models as well.
Making sure our fingerprints keep pace with the pace of change on the Internet is a constant and critical task. Bots will always adapt to try and look more browser-like. Less frequently, browsers will introduce major changes to their behavior and affect the entire Internet landscape. Last year, Google did exactly that, making older TLS fingerprints almost useless for identifying the latest version of Chrome.
Cloudflare network fingerprinting techniques
These methods are instrumental in accurately scoring and classifying bots, enhancing security measures, and enriching data analytics capabilities. Below are some examples of the fingerprinting techniques we have implemented over the years:
HTTP Signature: The HTTP Signature technique involves analyzing HTTP headers and other request attributes to create a unique signature for each client. This method is particularly useful for identifying and managing bot traffic, as it can detect inconsistencies between the HTTP signature and the claimed user-agent.
ClientHello fingerprint (v1 & v2): The ClientHello fingerprint technique involves analyzing the ClientHello message during the TLS handshake. This message contains various parameters, such as cipher suites, extensions, and supported groups, which can be used to create a unique fingerprint for each client. The first version of ClientHello fingerprint was introduced as part of Cloudflare’s broader TLS fingerprinting efforts, with subsequent improvements leading to version 2. These fingerprints help in identifying the client software and its configuration, providing a static identifier that can be used to detect anomalies and potential threats.
HTTP/2 fingerprint: HTTP/2 fingerprinting focuses on the unique characteristics of the HTTP/2 protocol, such as the settings frame, stream priority information, and the order of pseudo-header fields. Supported by all major browsers, this method was introduced to leverage the protocol’s binary framing layer, which provides a rich set of attributes for creating unique client fingerprints.
HTTP/3 and QUIC fingerprints: As HTTP/3 and the QUIC protocol gain popularity, Cloudflare has developed fingerprinting techniques tailored to these advanced protocols. Running over QUIC, HTTP/3 uses UDP and introduces unique handshake mechanisms, distinct from TCP-based protocols. Cloudflare’s techniques focus on specific attributes like QUIC version and transport parameters to generate precise fingerprints. These are vital for managing and identifying traffic, particularly in environments that heavily use Google products.
JA3 fingerprint: This TLS fingerprinting technique, introduced by Salesforce researchers in 2017 and later adopted by Cloudflare, involves creating a hash of the TLS ClientHello message. This hash includes the ordered list of TLS cipher suites, extensions, and other parameters, providing a unique identifier for each client. While JA3 is broadly utilized for detecting malicious activity and pinpointing specific client software, it shares similarities with Cloudflare’s proprietary ClientHello fingerprints (v1 & v2). However, the latter distinguish themselves by utilizing different components of the ClientHello message and employing alternative encoding schemes.
These fingerprinting techniques power Cloudflare’s Heuristic engine and machine learning models, both of which compute a Bot Score. This score assesses the likelihood — on a scale from 0 to 100 — of whether a request originated from an automated program (low score) or a human (high score). Additionally, these models leverage aggregated traffic statistics from all fingerprint types, and other dimensions, and integrate features throughout the OSI model’s layers (L1 to L7), enabling them to analyze every request for all customers. They provide sophisticated, real-time security analysis with inferences delivered at microsecond latency, providing prompt and precise responses to potential threats.
Limitations of JA3 fingerprint
In early 2023, Google implemented a change in Chromium-based browsers to shuffle the order of TLS extensions – a strategy aimed at disrupting the detection capabilities of JA3 and enhancing the robustness of the TLS ecosystem. This modification was prompted by concerns that fixed fingerprint patterns could lead to rigid server implementations, potentially causing complications each time Chrome updates were rolled out. Over time, JA3 became less useful due to the following reasons:
Randomization of TLS extensions: Browsers began randomizing the order of TLS extensions in their ClientHello messages. This change meant that the JA3 fingerprints, which relied on the sequential order of these extensions, would vary with each connection, making it unreliable for identifying unique clients. (Further information can be found at Stamus Networks.)
Inconsistencies across tools: Different tools and databases that implemented JA3 fingerprinting often produced varying results due to discrepancies in how they handled TLS extensions and other protocol elements. This inconsistency hindered the effectiveness of JA3 fingerprints for reliable cross-organization sharing and threat intelligence. (Further information can be found at Fingerprint.)
Vulnerability to evasion: While the static and simplistic nature of JA3 made it vulnerable to evasion, Cloudflare’s proprietary ClientHello fingerprint v2 (CHFPv2) addressed this challenge by accounting for the randomization of TLS extensions. In our internal implementations, TLS extensions are sorted before being incorporated into the fingerprint, effectively mitigating the impact of randomization for Cloudflare customers.
Limited scope and lack of adaptability: JA3 focused solely on elements within the TLS ClientHello packet, covering only a narrow portion of the OSI model’s layers. This limited scope often missed crucial context about a client’s environment. Additionally, as newer transport layer protocols like QUIC became popular, JA3’s methodology – originally designed for older versions of TLS and excluding modern protocols – proved ineffective.
Enter JA4 fingerprint
In response to these challenges, FoxIO developed JA4, a successor to JA3 that offers a more robust, adaptable, and reliable method for fingerprinting TLS clients across various protocols, including emerging standards like QUIC. Officially launched in September 2023, JA4 is part of the broader JA4+ suite that includes fingerprints for multiple protocols such as TLS, HTTP, and SSH. This suite is designed to be interpretable by both humans and machines, thereby enhancing threat detection and security analysis capabilities.
JA4 fingerprint is resistant to the randomization of TLS extensions and incorporates additional useful dimensions, such as Application Layer Protocol Negotiation (ALPN), which were not part of JA3. The introduction of JA4 has been met with positive reception in the cybersecurity community, with several open-source tools and commercial products beginning to incorporate it into their systems, including Cloudflare. The JA4 fingerprint is available under the BSD 3-Clause license, promoting seamless upgrades from JA3. Other fingerprints within the suite, such as JA4S (TLS Server Response) and JA4H (HTTP Client Fingerprinting), are licensed under the proprietary FoxIO License, which is designed for broader use but requires specific arrangements for commercial monetization.
Let’s take a look at specific JA4 fingerprint example, representing the latest version of Google Chrome on Linux:
Protocol Identifier (t): Indicates the use of TLS over TCP. This identifier is crucial for determining the underlying protocol, distinguishing it from q for QUIC or d for DTLS.
TLS Version (13): Represents TLS version 1.3, confirming that the client is using one of the latest secure protocols. The version number is derived from analyzing the highest version supported in the ClientHello, excluding any GREASE values.
SNI Presence (d): The presence of a domain name in the Server Name Indication. This indicates that the client specifies a domain (d), rather than an IP address (it would indicate the absence of SNI).
Cipher Suites Count (15): Reflects the total number of cipher suites included in the ClientHello, excluding any GREASE values. It provides insight into the cryptographic options the client is willing to use.
Extensions Count (16): Indicates the count of distinct extensions presented by the client in the ClientHello. This measure helps identify the range of functionalities or customizations the client supports.
ALPN Values (h2): Represents the Application-Layer Protocol Negotiation protocol, in this case, HTTP/2, which indicates the protocol preferences of the client for optimized web performance.
Cipher Hash (8daaf6152771): A truncated SHA256 hash of the list of cipher suites, sorted in hexadecimal order. This unique hash serves as a compact identifier for the client’s cipher suite preferences.
Extension Hash (02713d6af862): A truncated SHA256 hash of the sorted list of extensions combined with the list of signature algorithms. This hash provides a unique identifier that helps differentiate clients based on the extensions and signature algorithms they support.
Integrating JA4 support into Cloudflare required rethinking our approach to parsing TLS ClientHello messages, which were previously handled in separate implementations across C, Lua, and Go. Recognizing the need to boost performance and ensure memory safety, we developed a new Rust-based crate, client-hello-parser. This unified parser not only simplifies modifications by centralizing all related logic but also prepares us for future transitions, such as replacing nginx with an upcoming Rust-based service. Additionally, this streamlined parser facilitates the exposure of JA4 fingerprints across our platform, improving the integration with Cloudflare’s firewall rules, Workers, and analytics systems.
Parsing ClientHello
client-hello-parser is an internal Rust crate designed for parsing TLS ClientHello messages. It aims to simplify the process of analyzing TLS traffic by providing a straightforward way to decode and inspect the initial handshake messages sent by clients when establishing TLS connections. This crate efficiently populates a ClientHelloParsed struct with relevant parsed fields, including version 1 and version 2 fingerprints, and JA3 and JA4 hashes, which are essential for network traffic analysis and fingerprinting.
Key benefits of the client-hello-parser library include:
Optimized memory usage: The library achieves amortized zero heap allocations, verified through extensive testing with the dhat crate to track memory allocations. Utilizing the tiny_vec crate, it begins with stack allocations for small vectors backed by fixed-size arrays, resorting to heap allocations only when these vectors exceed their initial size. This method ensures efficient reuse of all vectors, maintaining amortized zero heap allocations.
Memory safety: Reinforced by Rust’s robust borrow checker and complemented by extensive fuzzing, which has helped identify and resolve potential security vulnerabilities previously undetected in C implementations.
Ultra-low latency: The parser benefits from using faster_hex for efficient hex encoding/decoding, which utilizes SIMD instructions to speed up processing. The use of Rust iterators also helps in optimizing performance, often allowing the compiler to generate SIMD-optimized assembly code. This efficiency is further enhanced through the use of BigEndianIterator, which allows for efficient streaming-like processing of TLS ClientHello bytes in a single pass.
The benchmark results demonstrate that the parser efficiently handles different sizes of ClientHello messages, with shorter messages being processed at a rate of approximately 2 million elements per second, and longer messages at around 1 million elements per second, showcasing the effectiveness of SIMD optimizations and Rust’s iterator performance in real-world applications.
Robust testing suite: Includes dozens of real-life TLS ClientHello message examples, with parsed components verified against Wireshark with JA3 and JA4 plugins. Additionally, Cargo fuzzer with memory sanitizer ensures no memory leaks or edge cases leading to core dumps. Backward compatibility tests with the legacy C parser, imported as a dependency and called via FFI, confirm that both parsers yield equivalent results.
Seamless integration with nginx: The crate, compiled as a dynamic library, is linked to the nginx binary, ensuring a smooth transition from the legacy parser to the new Rust-based parser through backwards compatibility tests.
The transition to a new Rust-based parser has enabled the retirement of multiple implementations across different languages (C, Lua, and Go), significantly enhancing performance and parser robustness against edge cases. This shift also facilitates the easier integration of new features and business logic for parsing TLS ClientHello messages, streamlining future expansions and security updates.
With Cloudflare JA4 fingerprints implemented on our network, we were left with another problem to solve. When JA3 was released, we saw some scenarios where customers were surprised by traffic from a new JA3 fingerprint and blocked it, only to find the fingerprint was a new browser release, or an OS update had caused a change in the fingerprint used by their mobile device. By giving customers just a hash, customers still lack context. We wanted to give our customers the necessary context to help them make informed decisions about the safety of a fingerprint, so they can act quickly and confidently on it. As more of our customers embrace AI, we’ve heard more demand from our customers to break out the signals that power our bot detection. These customers want to run complex models on proprietary data that has to stay in their control, but they want to have Cloudflare’s unique perspective on Internet traffic when they do it. To us, both use cases sounded like the same problem.
Enter JA4 Signals
In the ever-evolving landscape of web security, traditional fingerprinting techniques like JA3 and JA4 have proven invaluable for identifying and managing web traffic. However, these methods alone are not sufficient to address the sophisticated tactics employed by malicious agents. Fingerprints can be easily spoofed, they change frequently, and traffic patterns and behaviors are constantly evolving. This is where JA4 Signals come into play, providing a robust and comprehensive approach to traffic analysis.
JA4 Signals are inter-request features computed based on the last hour of all traffic that Cloudflare sees globally. On a daily basis, we analyze over 15 million unique JA4 fingerprints generated from more than 500 million user agents and billions of IP addresses. This breadth of data enables JA4 Signals to provide aggregated statistics that offer deeper insights into global traffic patterns – far beyond what single-request or connection fingerprinting can achieve. These signals are crucial for enhancing security measures, whether through simple firewall rules, Workers scripts, or advanced machine learning models.
Let’s consider a specific example of JA4 Signals from a Firewall events activity log, which involves the latest version of Chrome:
This example highlights that a particular HTTP request received a Bot Score of 95, suggesting it likely originated from a human user operating a browser rather than an automated program or a bot. Please note that ratio and quantile-based signal values fall within the range of [0.0 to 1.0], whereas rank-based signal values are integer values within the range of [1 to N]. Analyzing JA4 Signals in this context provides deeper insight into the behavior of this client (latest Linux Chrome) in comparison to other network clients and their respective JA4 fingerprints:
JA4 Signal
Description
Value example
Interpretation
browser_ratio_1h
The ratio of requests originating from browser-based user agents for the JA4 fingerprint in the last hour. Higher values suggest a higher proportion of browser-based requests.
0.942
Indicates a 94.2% browser-based request rate for this JA4.
cache_ratio_1h
The ratio of cacheable responses for the JA4 fingerprint in the last hour. Higher values suggest a higher proportion of responses that can be cached.
0.534
Shows a 53.4% cacheable response rate for this JA4.
h2h3_ratio_1h
The ratio of HTTP/2 and HTTP/3 requests combined with the total number of requests for the JA4 fingerprint in the last hour. Higher values indicate a higher proportion of HTTP/2 and HTTP/3 requests compared to other protocol versions.
0.987
Reflects a 98.7% rate of HTTP/2 and HTTP/3 requests.
heuristic_ratio_1h
The ratio of requests with a scoreSrc value of “heuristics” for the JA4 fingerprint in the last hour. Higher values suggest a larger proportion of requests being flagged by heuristic-based scoring.
0.007
Suggests a 0.7% rate of heuristic-based scoring for requests.
ips_quantile_1h
The quantile position of the JA4 fingerprint based on the number of unique client IP addresses across all fingerprints in the last hour. Higher values indicate a relatively higher number of distinct client IPs compared to other fingerprints.
1
Indicates a high diversity of client IPs for this JA4.
ips_rank_1h
The rank of the JA4 fingerprint based on the number of unique client IP addresses across all fingerprints in the last hour. Lower values indicate a higher number of distinct client IPs associated with the fingerprint.
2
High volume of IPs compared to other JA4s.
paths_rank_1h
The rank of the JA4 fingerprint based on the number of unique request paths across all fingerprints in the last hour. Lower values indicate a higher diversity of request paths associated with the fingerprint.
2
High diversity of request paths.
reqs_quantile_1h
The quantile position of the JA4 fingerprint based on the number of requests across all fingerprints in the last hour. Higher values indicate a relatively higher number of requests compared to other fingerprints.
1
High volume of requests compared to other JA4s.
reqs_rank_1h
The rank of the JA4 fingerprint based on the number of requests across all fingerprints in the last hour. Lower values indicate a higher number of requests associated with the fingerprint.
2
High request count for this JA4.
uas_rank_1h
The rank of the JA4 fingerprint based on the number of distinct user agents across all fingerprints in the last hour. Lower values indicate a higher diversity of user agents associated with the fingerprint.
1
Highest diversity of user agents for this JA4.
The JA4 fingerprint and JA4 Signals are now available in the Firewall Rules UI, Bot Analytics and Workers. Customers can now use these fields to write custom rules, rate-limiting rules, transform rules, or Workers logic using JA4 fingerprint and JA4 Signals.
Let’s demonstrate how to use JA4 Signals with the following Worker example. This script processes incoming requests by parsing and categorizing JA4 Signals, providing a clear structure for further analysis or rule application within Cloudflare Workers:
/**
 * Event listener for 'fetch' events. This triggers on every request to the worker.
 */
addEventListener('fetch', event => {
  event.respondWith(handleRequest(event.request))
})

/**
 * Main handler for incoming requests.
 * @param {Request} request - The incoming request object from the fetch event.
 * @returns {Response} A response object with JA4 Signals in JSON format.
 */
async function handleRequest(request) {
  // Safely access the ja4Signals object using optional chaining, which prevents errors if properties are undefined.
  const ja4Signals = request.cf?.botManagement?.ja4Signals || {};

  // Construct the response content, including both the original ja4Signals and the parsed signals.
  const responseContent = {
    ja4Signals: ja4Signals,
    jaSignalsParsed: parseJA4Signals(ja4Signals)
  };

  // Return a JSON response with appropriate headers.
  return new Response(JSON.stringify(responseContent), {
    status: 200,
    headers: {
      "content-type": "application/json;charset=UTF-8"
    }
  })
}

/**
 * Parses the JA4 Signals into categorized groups based on their names.
 * @param {Object} ja4Signals - The JA4 Signals object that may contain various metrics.
 * @returns {Object} An object with categorized JA4 Signals: ratios, ranks, and quantiles.
 */
function parseJA4Signals(ja4Signals) {
  // Define the keys for each category of signals.
  const ratios = ['h2h3_ratio_1h', 'heuristic_ratio_1h', 'browser_ratio_1h', 'cache_ratio_1h'];
  const ranks = ['uas_rank_1h', 'paths_rank_1h', 'reqs_rank_1h', 'ips_rank_1h'];
  const quantiles = ['reqs_quantile_1h', 'ips_quantile_1h'];

  // Return an object with each category containing only the signals that are present.
  return {
    ratios: filterKeys(ja4Signals, ratios),
    ranks: filterKeys(ja4Signals, ranks),
    quantiles: filterKeys(ja4Signals, quantiles)
  };
}

/**
 * Filters the keys in the ja4Signals object that match the list of specified keys and are not undefined.
 * @param {Object} ja4Signals - The JA4 Signals object.
 * @param {Array<string>} keys - An array of keys to filter from the ja4Signals object.
 * @returns {Object} A filtered object containing only the specified keys that are present in ja4Signals.
 */
function filterKeys(ja4Signals, keys) {
  const filtered = {};
  // Iterate over the specified keys and add them to the filtered object if they exist in ja4Signals.
  keys.forEach(key => {
    // Check if the key exists and is not undefined to handle optional presence of each signal.
    if (ja4Signals && ja4Signals[key] !== undefined) {
      filtered[key] = ja4Signals[key];
    }
  });
  return filtered;
}
When JA4 Signals are present, the output from the Worker might look like this:
Comprehensive traffic analysis: JA4 Signals aggregate data over an hour to provide a holistic view of traffic patterns. This method enhances the ability to identify emerging threats and abnormal behaviors by analyzing changes over time rather than in isolation.
Precision in anomaly detection: Leveraging detailed inter-request features, JA4 Signals enable the precise detection of anomalies that may be overlooked by single-request fingerprinting. This leads to more accurate identification of sophisticated cyber threats.
Globally scalable insights: By synthesizing data at a global scale, JA4 Signals harness the strength of Cloudflare’s network intelligence. This extensive analysis makes the system less susceptible to manipulation and provides a resilient foundation for security protocols.
Dynamic security enforcement: JA4 Signals can dynamically inform security rules, from simple firewall configurations to complex machine learning algorithms. This adaptability ensures that security measures evolve in tandem with changing traffic patterns and emerging threats.
Reduction in false positives and negatives: With the detailed insights provided by JA4 Signals, security systems can distinguish between legitimate and malicious traffic more effectively, reducing the occurrence of false positives and negatives and improving overall system reliability.
Conclusion
The introduction of JA4 fingerprint and JA4 Signals marks a significant milestone in advancing Cloudflare’s security offerings, including Bot Management and DDoS protection. These tools not only enhance the robustness of our traffic analysis but also showcase the continuous evolution of our network fingerprinting techniques. The efficiency of computing JA4 fingerprints enables real-time detection and response to emerging threats. Similarly, by leveraging aggregated statistics and inter-request features, JA4 Signals provide deep insights into traffic patterns at speeds measured in microseconds, ensuring that no detail is too small to be captured and analyzed.
These security features are underpinned by the scalable techniques and open-sourced libraries outlined in “Every request, every microsecond: scalable machine learning at Cloudflare”. This discussion highlights how Cloudflare’s innovations not only analyze vast amounts of data but also transform this analysis into actionable, reliable, and dynamically adaptable security measures.
Any Enterprise business with a bot problem will benefit from Cloudflare’s unique JA4 implementation and our perspective on bot traffic, but customers who run their own internal threat models will also benefit from access to data insights from a network that processes over 50 million requests per second. Please get in touch with us to learn more about our Bot Management offering.
polyfill.io, a popular JavaScript library service, can no longer be trusted and should be removed from websites.
Multiple reports, corroborated with data seen by our own client-side security system, Page Shield, have shown that the polyfill service was being used, and could be used again, to inject malicious JavaScript code into users’ browsers. This is a real threat to the Internet at large given the popularity of this library.
We have, over the last 24 hours, released an automatic JavaScript URL rewriting service that will rewrite any link to polyfill.io found in a website proxied by Cloudflare to a link to our mirror under cdnjs. This will avoid breaking site functionality while mitigating the risk of a supply chain attack.
Any website on the free plan has this feature automatically activated now. Websites on any paid plan can turn on this feature with a single click.
You can find this new feature under Security ⇒ Settings on any zone using Cloudflare.
Contrary to what is stated on the polyfill.io website, Cloudflare has never recommended the polyfill.io service or authorized their use of Cloudflare’s name on their website. We have asked them to remove the false statement and they have, so far, ignored our requests. This is yet another warning sign that they cannot be trusted.
If you are not using Cloudflare today, we still highly recommend that you remove any use of polyfill.io and/or find an alternative solution. And, while the automatic replacement function will handle most cases, the best practice is to remove polyfill.io from your projects and replace it with a secure alternative mirror like Cloudflare’s even if you are a customer.
You can do this by searching your code repositories for instances of polyfill.io and replacing it with cdnjs.cloudflare.com/polyfill/ (Cloudflare’s mirror). This is a non-breaking change as the two URLs will serve the same polyfill content. All website owners, regardless of the website using Cloudflare, should do this now.
How we came to this decision
Back in February, the domain polyfill.io, which hosts a popular JavaScript library, was sold to a new owner: Funnull, a relatively unknown company. At the time, we were concerned that this created a supply chain risk. This led us to spin up our own mirror of the polyfill.io code hosted under cdnjs, a JavaScript library repository sponsored by Cloudflare.
The new owner was unknown in the industry and did not have a track record of trust to administer a project such as polyfill.io. The concern, highlighted even by the original author, was that if they were to abuse polyfill.io by injecting additional code to the library, it could cause far reaching security problems on the Internet affecting several hundreds of thousands websites. Or it could be used to perform a targeted supply-chain attack against specific websites.
Unfortunately, that worry came true on June 25, 2024 as the polyfill.io service was being used to inject nefarious code that, under certain circumstances, redirected users to other websites.
We have taken the exceptional step of using our ability to modify HTML on the fly to replace references to the polyfill.io CDN in our customers’ websites with links to our own, safe, mirror created back in February.
In the meantime, additional threat feed providers have also taken the decision to flag the domain as malicious. We have not outright blocked the domain through any of the mechanisms we have because we are concerned it could cause widespread web outages given how broadly polyfill.io is used with some estimates indicating usage on nearly 4% of all websites.
Corroborating data with Page Shield
The original report indicates that malicious code was injected that, under certain circumstances, would redirect users to betting sites. It was doing this by loading additional JavaScript that would perform the redirect, under a set of additional domains which can be considered Indicators of Compromise (IoCs):
(note the intentional misspelling of Google Analytics)
Page Shield, our client side security solution, is available on all paid plans. When turned on, it collects information about JavaScript files loaded by end user browsers accessing your website.
By looking at the database of detected JavaScript files, we immediately found matches with the IoCs provided above starting as far back as 2024-06-08 15:23:51 (first seen timestamp on Page Shield detected JavaScript file). This was a clear indication that malicious activity was active and associated with polyfill.io.
Replacing insecure JavaScript links to polyfill.io
To achieve performant HTML rewriting, we need to make blazing-fast HTML alterations as responses stream through Cloudflare’s network. This has been made possible by leveraging ROFL (Response Overseer for FL). ROFL powers various Cloudflare products that need to alter HTML as it streams, such as Cloudflare Fonts,Email Obfuscation and Rocket Loader
ROFL is developed entirely in Rust. The memory-safety features of Rust are indispensable for ensuring protection against memory leaks while processing a staggering volume of requests, measuring in the millions per second. Rust’s compiled nature allows us to finely optimize our code for specific hardware configurations, delivering performance gains compared to interpreted languages.
The performance of ROFL allows us to rewrite HTML on-the-fly and modify the polyfill.io links quickly, safely, and efficiently. This speed helps us reduce any additional latency added by processing the HTML file.
If the feature is turned on, for any HTTP response with an HTML Content-Type, we parse all JavaScript script tag source attributes. If any are found linking to polyfill.io, we rewrite the src attribute to link to our mirror instead. We map to the correct version of the polyfill service while the query string is left untouched.
The logic will not activate if a Content Security Policy (CSP) header is found in the response. This ensures we don’t replace the link while breaking the CSP policy and therefore potentially breaking the website.
Default on for free customers, optional for everyone else
Cloudflare proxies millions of websites, and a large portion of these sites are on our free plan. Free plan customers tend to have simpler applications while not having the resources to update and react quickly to security concerns. We therefore decided to turn on the feature by default for sites on our free plan, as the likelihood of causing issues is reduced while also helping keep safe a very large portion of applications using polyfill.io.
Paid plan customers, on the other hand, have more complex applications and react quicker to security notices. We are confident that most paid customers using polyfill.io and Cloudflare will appreciate the ability to virtually patch the issue with a single click, while controlling when to do so.
All customers can turn off the feature at any time.
This isn’t the first time we’ve decided a security problem was so widespread and serious that we’d enable protection for all customers regardless of whether they were a paying customer or not. Back in 2014, we enabled Shellshock protection for everyone. In 2021, when the log4j vulnerability was disclosed we rolled out protection for all customers.
Do not use polyfill.io
If you are using Cloudflare, you can remove polyfill.io with a single click on the Cloudflare dashboard by heading over to your zone ⇒ Security ⇒ Settings. If you are a free customer, the rewrite is automatically active. This feature, we hope, will help you quickly patch the issue.
Nonetheless, you should ultimately search your code repositories for instances of polyfill.io and replace them with an alternative provider, such as Cloudflare’s secure mirror under cdnjs (https://cdnjs.cloudflare.com/polyfill/). Website owners who are not using Cloudflare should also perform these steps.
Bots using residential proxies are a major source of frustration for security engineers trying to fight online abuse. These engineers often see a similar pattern of abuse when well-funded, modern botnets target their applications. Advanced bots bypass country blocks, ASN blocks, and rate-limiting. Every time, the bot operator moves to a new IP address space until they blend in perfectly with the “good” traffic, mimicking real users’ behavior and request patterns. Our new Bot Management machine learning model (v8) identifies residential proxy abuse without resorting to IP blocking, which can cause false positives for legitimate users.
Background
One of the main sources of Cloudflare’s bot score is our bot detection machine learning model which analyzes, on average, over 46 million HTTP requests per second in real time. Since our first Bot Management ML model was released in 2019, we have continuously evolved and improved the model. Nowadays, our models leverage features based on request fingerprints, behavioral signals, and global statistics and trends that we see across our network.
Each iteration of the model focuses on certain areas of improvement. This process starts with a rigorous R&D phase to identify the emerging patterns of bot attacks by reviewing feedback from our customers and reports of missed attacks. In v8, we mainly focused on two areas of abuse. First, we analyzed the campaigns that leverage residential IP proxies, which are proxies on residential networks commonly used to launch widely distributed attacks against high profile targets. In addition to that, we improved model accuracy for detecting attacks that originate from cloud providers.
Residential IP proxies
Proxies allow attackers to hide their identity and distribute their attack. Moreover, IP address rotation allows attackers to directly bypass traditional defenses such as IP reputation and IP rate limiting. Knowing this, defenders use a plethora of signals to identify malicious use of proxies. In its simplest forms, IP reputation signals (e.g., data center IP addresses, known open proxies, etc.) can lead to the detection of such distributed attacks.
However, in the past few years, bot operators have started favoring proxies operating in residential network IP address space. By using residential IP proxies, attackers can masquerade as legitimate users by sending their traffic through residential networks. Nowadays, residential IP proxies are offered by companies that facilitate access to large pools of IP addresses for attackers. Residential proxy providers claim to offer 30-100 million IPs belonging to residential and mobile networks across the world. Most commonly, these IPs are sourced by partnering with free VPN providers, as well as including the proxy SDKs into popular browser extensions and mobile applications. This allows residential proxy providers to gain a foothold on victims’ devices and abuse their residential network connections.
Figure 1: Architecture of a residential proxy network
Figure 1 depicts the architecture of a residential proxy. By subscribing to these services, attackers gain access to an authenticated proxy gateway address commonly using the HTTPS/SOCKS5 proxy protocol. Some residential proxy providers allow their users to select the country or region for the proxy exit nodes. Alternatively, users can choose to keep the same IP address throughout their session or rotate to a new one for each outgoing request. Residential proxy providers then identify active exit nodes on their network (on devices that they control within residential networks across the world) and route the proxied traffic through them.
The large pool of IP addresses and the diversity of networks poses a challenge to traditional bot defense mechanisms that rely on IP reputation and rate limiting. Moreover, the diversity of IPs enables the attackers to rotate through them indefinitely. This shrinks the window of opportunity for bot detection systems to effectively detect and stop the attacks. Effective defense against residential proxy attacks should be able to detect this type of bot traffic either based on single request features to stop the attack immediately, or identify unique fingerprints from the browsing agent to track and mitigate the bot traffic regardless of the IP source. Overly broad blocking actions, such as IP block-listing, by definition, would result in blocking legitimate traffic from residential networks where at least one device is acting as a residential proxy node.
ML model training
At its heart, our model is built using a chain of modules that work together. Initially, we fetch and prepare training and validation datasets from our Clickhouse data storage. We use datasets with high confidence labels as part of our training. For model validation, we use datasets consisting of missed attacks reported by our customers, known sources of bot traffic (e.g., verified bots), and high confidence detections from other bot management modules (e.g., heuristics engine). We orchestrate these steps using Apache Airflow, which enables us to customize each stage of the ML model training and define the interdependencies of our training, validation, and reporting modules in the form of directed acyclic graphs (DAGs).
The first step of training a new model is fetching labeled training data from our data store. Under the hood, our dataset definitions are SQL queries that will materialize by fetching data from our Clickhouse cluster where we store feature values and calculate aggregates from the traffic on our network. Figure 2 depicts these steps as train and validation dataset fetch operations. Introducing new datasets can be as straightforward as writing the SQL queries to filter the desired subset of requests.
Figure 2: Airflow DAG for model training and validation
After fetching the datasets, we train our Catboost model and tune its hyper parameters. During evaluation, we compare the performance of the newly trained model against the current default version running for our customers. To capture the intricate patterns in subsets of our data, we split certain validation datasets into smaller slivers called specializations. For instance, we use the detections made by our heuristics engine and managed rulesets as ground truth for bot traffic. To ensure that larger sources of traffic (large ASNs, different HTTP versions, etc.) do not mask our visibility into patterns for the rest of the traffic, we define specializations for these sources of traffic. As a result, improvements in accuracy of the new model can be evaluated for common patterns (e.g., HTTP/1.1 and HTTP/2) as well as less common ones. Our model training DAG will provide a breakdown report for the accuracy, score distribution, feature importance, and SHAP explainers for each validation dataset and its specializations.
Once we are happy with the validation results and model accuracy, we evaluate our model against a checklist of steps to ensure the correctness and validity of our model. We start by ensuring that our results and observations are reproducible over multiple non-overlapping training and validation time ranges. Moreover, we check for the following factors:
Check for the distribution of feature values to identify irregularities such as missing or skewed values.
Check for overlaps between training and validation datasets and feature values.
Verify the diversity of training data and the balance between labels and datasets.
Evaluate performance changes in the accuracy of the model on validation datasets based on their order of importance.
Check for model overfitting by evaluating the feature importance and SHAP explainers.
After the model passes the readiness checks, we deploy it in shadow mode. We can observe the behavior of the model on live traffic in log-only mode (i.e., without affecting the bot score). After gaining confidence in the model’s performance on live traffic, we start onboarding beta customers, and gradually switch the model to active mode all while closely monitoring the real-world performance of our new model.
ML features for bot detection
Each of our models uses a set of features to make inferences about the incoming requests. We compute our features based on single request properties (single request features) and patterns from multiple requests (i.e., inter-request features). We can categorize these features into the following groups:
Global features: inter-request features that are computed based on global aggregates for different types of fingerprints and traffic sources (e.g., for an ASN) seen across our global network. Given the relatively lower cardinality of these features, we can scalably calculate global aggregates for each of them.
High cardinality features: inter-request features focused on fine-grained aggregate data from local traffic patterns and behaviors (e.g., for an individual IP address)
Single request features: features derived from each individual request (e.g., user agent).
Our Bot Management system (named BLISS) is responsible for fetching and computing these feature values and making them available on our servers for inference by active versions of our ML models.
Detecting residential proxies using network and behavioral signals
Attacks originating from residential IP addresses are commonly characterized by a spike in the overall traffic towards sensitive endpoints on the target websites from a large number of residential ASNs. Our approach for detecting residential IP proxies is twofold. First, we start by comparing direct vs proxied requests and looking for network level discrepancies. Revisiting Figure 1, we notice that a request routed through residential proxies (red dotted line) has to traverse through multiple hops before reaching the target, which affects the network latency of the request.
Based on this observation alone, we are able to characterize residential proxy traffic with a high true positive rate (i.e., all residential proxy requests have high network latency). While we were able to replicate this in our lab environment, we quickly realized that at the scale of the Internet, we run into numerous exceptions with false positive detections (i.e., non-residential proxy traffic with high latency). For instance, countries and regions that predominantly use satellite Internet would exhibit a high network latency for the majority of their requests due to the use of performance enhancing proxies.
Realizing that relying solely on network characteristics of connections to detect residential proxies is inadequate given the diversity of the connections on the Internet, we switched our focus to the behavior of residential IPs. To that end, we observe that the IP addresses from residential proxies express a distinct behavior during periods of peak activity. While this observation singles out highly active IPs over their peak activity time, given the pool size of residential IPs, it is not uncommon to only observe a small number of requests from the majority of residential proxy IPs.
These periods of inactivity can be attributed to the temporary nature of residential proxy exit nodes. For instance, when the client software (i.e., browser or mobile application) that runs the exit nodes of these proxies is closed, the node leaves the residential proxy network. One way to filter out periods of inactivity is to increase the monitoring time and punish each IP address that exhibits residential proxy behavior for a period of time. This block-listing approach, however, has certain limitations. Most importantly, by relying only on IP-based behavioral signals, we would block traffic from legitimate users that may unknowingly run mobile applications or browser extensions that turn their devices into proxies. This is further detrimental for mobile networks where many users share their IPs behind CGNATs. Figure 3 demonstrates this by comparing the share of direct vs proxied requests that we received from active residential proxy IPs over a 24-hour period. Overall, we see that 4 out of 5 requests from these networks belong to direct and benign connections from residential devices.
Figure 3: Percentage of direct vs proxied requests from residential proxy IPs.
Using this insight, we combined behavioral and latency-based features along with new datasets to train a new machine learning model that detects residential proxy traffic on a per-request basis. This scheme allows us to block residential proxy traffic while allowing benign residential users to visit Cloudflare-protected websites from the same residential network.
Detection results and case studies
We started testing v8 in shadow mode in March 2024. Every hour, v8 is classifying more than 17 million unique IPs that participate in residential proxy attacks. Figure 4 shows the geographic distribution of IPs with residential proxy activity belonging to more than 45 thousand ASNs in 237 countries/regions. Among the most commonly requested endpoints from residential proxies, we observe patterns of account takeover attempts, such as requests to /login, /auth/login, and /api/login.
Figure 4: Countries and regions with residential network activity. Size of markers are proportionate to the number of IPs with residential proxy activity.
Furthermore, we see significant improvements when evaluating our new machine learning model on previously missed attacks reported by our customers. In one case, v8 was able to correctly classify 95% of requests from distributed residential proxy attacks targeting the voucher redemption endpoint of the customer’s website. In another case, our new model successfully detected a previously missed content scraping attack evident by increased detection during traffic spikes depicted in Figure 5. We are continuing to monitor the behavior of residential proxy attacks in the wild and work with our customers to ensure that we can provide robust detection against these distributed attacks.
Figure 5: Spikes in bot requests from residential proxies detected by ML v8
Improving detection for bots from cloud providers
In addition to residential IP proxies, bot operators commonly use cloud providers to host and run bot scripts that attack our customers. To combat these attacks, we improved our ground truth labels for cloud provider attacks in our latest ML training datasets. Early results show that v8 detects 20% more bots from cloud providers, with up to 70% more bots detected on zones that are marked as under attack. We further plan to expand the list of cloud providers that v8 detects as part of our ongoing updates.
Check out ML v8
For existing Bot Management customers we recommend toggling “Auto-update machine learning model” to instantly gain the benefits of ML v8 and its residential proxy detection, and to stay up to date with our future ML model updates. If you’re not a Cloudflare Bot Management customer, contact our sales team to try out Bot Management.
One of the great benefits of the Internet has been its ability to empower activists and journalists in repressive societies to organize, communicate, and simply find each other. Ten years ago today, Cloudflare launched Project Galileo, a program which today provides security services, at no cost, to more than 2,600 independent journalists and nonprofit organizations around the world supporting human rights, democracy, and local communities. You can read last week’s blog and Radar dashboard that provide a snapshot of what public interest organizations experience on a daily basis when it comes to keeping their websites online.
Origins of Project Galileo
We’ve admitted before that Project Galileo was born out of a mistake, but it’s worth reminding ourselves. In 2014, when Cloudflare was a much smaller company with a smaller network, our free service did not include DDoS mitigation. If a free customer came under a withering attack, we would stop proxying traffic to protect our own network. It just made sense.
One evening, a site that was using us came under a significant DDoS attack, exhausting Cloudflare resources. After pulling up the site and seeing Cyrillic writing and pictures of men with guns, the young engineer on call followed the playbook. He pushed a button and sent all the attack traffic to the site’s origin, effectively kicking it off the Internet.
This was in 2014, during Russia’s first invasion into Ukraine, when Russia invaded Crimea. What the engineer did not know was that he had just kicked off an independent Ukrainian newspaper that was covering the attack and the invasions. The newspaper had tried to pay for services with a credit card but failed because Russia had targeted Ukraine’s financial infrastructure, taking banking institutions offline. It wasn’t the engineer’s fault. He had no reason to know that the site was important, and no alternative playbook to follow.
After that incident, we vowed to never let an organization that was serving such an important purpose go offline simply because they couldn’t pay for services. And so the idea for Project Galileo was born.
Although the idea of providing free security services was straightforward, figuring out which organizations are important enough to deserve such services was not. We know we can’t build a better Internet alone – it’s why Cloudflare’s mission is to help build a better Internet. So with Project Galileo, we sought the assistance of a group of civil society organizations to partner with us and help identify the organizations that need our protection.
Repression of ideas that were threatening to authority hardly started with DDoS attacks or the invention of the Internet. We named the effort Project Galileo after the story of Galileo Galilei. Galileo was persecuted in the 1600s for publishing a book concluding that the Earth was not at the center of the universe, but that the Earth orbits the sun. After Galileo was labeled a heretic, his book was banned and his ideas were suppressed for more than 100 years.
Four hundred years after Galileo, we see attempts to suppress the online voices of journalists and human rights workers who might challenge the status quo. We’re proud of the fact that through Project Galileo, we keep so many of those voices online.
Growth of Project Galileo
Ten years after the launch of Project Galileo, Cloudflare has changed a lot. Our network has grown from data centers in fewer than 30 cities in 2014 to a network that runs in 320 cities and more than 120 countries. We’ve massively expanded our product suite to include whole new lines of products, including a full set of Zero Trust services and a developer suite that enables developers to build a wide range of applications, including AI applications, on our network.
As Cloudflare has grown, so has Project Galileo. We have more than quadrupled the number of entities we protect in the last five years, from 600 at Project Galileo’s five-year anniversary to more than 2,600 today, located in 111 different countries. We’ve expanded from our original 14 civil society partners to 54 today. Our partners span countries, continents, and subject matter areas, sharing their expertise on organizations that would benefit from cybersecurity assistance.
When we expand our product offerings, we routinely ask whether new services would be valuable to the journalists, humanitarian groups, and nonprofits that benefit from Project Galileo. After Cloudflare launched our Zero Trust offering, we announced that we would offer those services for free to participants in Project Galileo to protect themselves against threats like data loss and malware. After Cloudflare acquired Area 1, we announced that we would offer Cloudflare’s email security products for free to the same participants.
We’ve tried to make our products easy for a small organization to use, building a Social Impact Portal and a Zero Trust roadmap for civil society and at-risk communities. Cloudflare’s teams also help participants onboard and troubleshoot when they face challenges.
What Project Galileo means for civil society groups now
On June 6, we celebrated Project Galileo’s 10-year anniversary with partners from government, civil society, and industry at an event in Washington, DC. We used the opportunity to talk about the future of the Internet, and how we can all work together to protect and advance the free and open Internet.
For humanitarian organizations with few resources, the types of services offered under Project Galileo can be life changing. At our Project Galileo event, we heard the story of a small French nonprofit that lost 17 years of data after being targeted by ransomware. Our resources help organizations defend themselves not only against nation states determined to take them offline, but also against common ransomware and phishing attacks.
During our event, the President of the National Endowment for Democracy (NED) told the story of traveling in the Western Balkans where the struggle for an independent media is palpable. NED is a strong supporter of media outlets across the region. But those media outlets come under frequent cyber attacks that have incapacitated their websites. As described by Damon Wilson:
Those attacks prevent news from reaching the public, where information is very much something that is used and weaponized against communities across Bosnia. And this was precisely the case with one of our partners, Buka. It’s a news outlet that’s based in Banja Luka and Republika Srpska. And while I was there, I met with some of our partners from Banja Luka who had been physically beaten up and intimidated. There’s a crackdown on civil society, new restrictions and laws against them. But for Buka, it was a little bit of a different scenario because earlier this year they suffered a DDoS attack, during which their server servers were overwhelmed by up to 700 million page requests. And the sheer volume suggests the attackers had significant resources, making it a particularly severe threat.
But by onboarding Buka into Project Galileo, we were able to help them restore their site’s functionality, and now Buka’s website is equipped to withstand even the most sophisticated attacks, ensuring that their critical reporting continues uninterrupted, exactly at the time when the Republic gets Covid, Republika Srpska government is looking to close and restrict independent civic voices in that part of Bosnia.
And this is just one example. Last week, traveling in Bosnia, of the numerous NED partners who’ve benefited from Cloudflare’s Project Galileo since NED became a partner in 2019, it’s profound to the efficacy of our partners’ work. It effectively ensures that bad actors can’t silence the voices and the work of democracy advocates and independent media around the world.
The importance of collaboration
Our work with Project Galileo highlights the power of the partnerships that we’ve built, not only with civil society, but with government and industry partners as well. By working together, we can expand protections for the many at-risk organizations that need cybersecurity assistance. Cybersecurity is a team sport.
In 2023, one of our Project Galileo partners, the CyberPeace Institute, approached us about doing even more to help protect nonprofit organizations against phishing attacks. The CyberPeace Institute collaborates with its partners to reduce the harms from cyberattacks on people’s lives worldwide and provide them assistance. CyberPeace also analyzes cyberattacks to expose their societal impact, to demonstrate how international laws and norms are being violated, and to advance responsible behavior in cyberspace.
CyberPeace realized that there was an opportunity to document attacks against civil society groups and improve the ecosystem for everyone. Many development and humanitarian organizations are small, with limited staff and little cybersecurity experience. They can easily fall prey to common cyber attacks – like phishing – designed to access their systems or steal their data. If they manage to use tools effectively to defend themselves, they do not typically report on the information about the attacks they see.
CyberPeace proposed to help onboard development and humanitarian organizations to Cloudflare services through their CyberPeace Builders program and analyze the phishing campaigns targeting those organizations. The substantive insights and information gained from that work could then be fed to other civil society organizations as real time security alerts. Cloudflare worked with CyberPeace to develop the new approach, enabling their volunteers to onboard organizations in their network to Area 1 tools and their analysts to access threat indicators from the collective organizations onboarded.
Government can play an important role in helping protect civil society from cyberattacks as well. Since the Summit for Democracy last year, Cloudflare has been working closely with the Joint Cyber Defense Collaborative (JCDC), which is run by the U.S. Cybersecurity and Infrastructure Security Agency (CISA), on their High-Risk Communities initiative. Earlier this year, JCDC launched a web page outlining cybersecurity resources for civil society communities facing digital security threats because of their work. The effort includes tools and services that nonprofits can use to secure themselves online, including those offered under Project Galileo.
Expanding Cloudflare’s Impact
In many ways, the creation of Project Galileo altered the trajectory of the company. Project Galileo cemented the idea that protecting and keeping important organizations online, regardless of whether they could pay us, was part of Cloudflare’s DNA. It pushed us to innovate to improve security not only for the large enterprises that pay us, but for the small organizations doing good for the world that cannot afford to pay for the latest technological innovation. It gave us our mission – to help build a better Internet – and a standard to live up to and measure ourselves against.
To meet that standard, we routinely reach out to offer our services to important organizations in need. In 2022, after Russia’s invasion of Ukraine, Cloudflare jumped in to offer services to Ukrainian critical infrastructure facing a barrage of cyberattacks and have continued providing them services ever since. At our Project Galileo event, the State Department’s Special Envoy and Coordinator for Digital FreedomEnvoy read an email she’d received from Ukraine’s Deputy Foreign Minister and Chief Digital Transformation officer of Ukraine the night before:
It is absolutely definite that Cloudflare services provide a vital layer of cybersecurity within the Ukrainian segment of cyberspace. Numerous DDoS attacks are directed at state electronic services, fintech, official information sources. So if there was no Cloudflare as a proven protection against DDoS attacks, it would have serious consequences causing chaos, especially when these attacks are synchronized by the enemy in parallel with kinetic attacks.
We’ve launched sections of Cloudflare Radar designed to use Cloudflare’s network to help civil society monitor Internet outages and disruptions, as well as route hijacks and other traffic anomalies. We’ve participated in the Freedom Online Coalition’s Task Force on Internet Shutdowns.
Project Galileo also helped pave the way for a variety of Cloudflare projects to provide other at-risk populations free services. These programs include:
Athenian Project: Launched in 2017, the Athenian Project is Cloudflare’s program to protect election-related domains for state and local governments so that citizens have reliable access to information on voter registration, polling places, and the reporting of election results.
Cloudflare for Campaigns: Launched in 2020, Cloudflare for Campaigns helps secure US political candidates’ election websites and internal data while also ensuring site reliability during peak traffic periods. The program is run in partnership with Defending Digital Campaigns.
Project Pangea: Launched in 2021, Project Pangea is a program to provide secure, performant and reliable access to the Internet for community networks that support underserved communities.
Project Safekeeping: Launched in 2022, Project Safekeeping supports at-risk critical infrastructure entities in Australia, Japan, Germany, Portugal, and the UK by providing Zero Trust and application security solutions.
Project Cybersafe Schools: Launched in 2023, Project Cybersafe Schools equips small public school districts in the US with Zero Trust services, including email protection and DNS filtering.
Project Secure Health: Launched on June 10, 2024, Project Secure Health provides security tools to Australia’s general practitioner clinics to safeguard patient data and counter challenges such as data breaches, ransomware attacks, phishing scams, and insider threats.
Looking forward
The world has only gotten more complicated since we first launched Project Galileo in 2014. We face real challenges ranging from malicious cyber actors targeting critical infrastructure, to election interference, to data theft. Governments have responded with increasingly aggressive attempts to control aspects of the Internet. At our recent celebration of Project Galileo, we lamented the thirteenth consecutive year of decline of global Internet freedom, as documented by our Project Galileo partner Freedom House.
But one thing has not changed. We continue to believe the single, global Internet is a miracle that we should all be fighting for. We sometimes forget that the Internet is an incredibly radical concept. The world somehow came together over the last 40 years, agreed on a set of standards, and then made it so that a collection of networks could all exchange data. And that miracle that is the Internet has brought incredible opportunities for the voices of civil society to be heard, to help extend their impact, to spread their message, and to keep them connected.
Connecting everyone online in a permissionless way comes with real harms and real risks. But we need to be surgical as we address those challenges. We need to partner to find solutions that preserve the open Internet, much as we do with projects like Project Galileo. Even if we are at a moment of democratic decline, continuing to defend the open, interoperable Internet preserves space and capacity for a future in which the Internet can also fuel greater freedom.
Let’s Encrypt, a publicly trusted certificate authority (CA) that Cloudflare uses to issue TLS certificates, has been relying on two distinct certificate chains. One is cross-signed with IdenTrust, a globally trusted CA that has been around since 2000, and the other is Let’s Encrypt’s own root CA, ISRG Root X1. Since Let’s Encrypt launched, ISRG Root X1 has been steadily gaining its own device compatibility.
On September 30, 2024, Let’s Encrypt’s certificate chain cross-signed with IdenTrust will expire. After the cross-sign expires, servers will no longer be able to serve certificates signed by the cross-signed chain. Instead, all Let’s Encrypt certificates will use the ISRG Root X1 CA.
Most devices and browser versions released after 2016 will not experience any issues as a result of the change since the ISRG Root X1 will already be installed in those clients’ trust stores. That’s because these modern browsers and operating systems were built to be agile and flexible, with upgradeable trust stores that can be updated to include new certificate authorities.
The change in the certificate chain will impact legacy devices and systems, such as devices running Android version 7.1.1 (released in 2016) or older, as those exclusively rely on the cross-signed chain and lack the ISRG X1 root in their trust store. These clients will encounter TLS errors or warnings when accessing domains secured by a Let’s Encrypt certificate. We took a look at the data ourselves and found that, of all Android requests, 2.96% of them come from devices that will be affected by the change. That’s a substantial portion of traffic that will lose access to the Internet. We’re committed to keeping those users online and will modify our certificate pipeline so that we can continue to serve users on older devices without requiring any manual modifications from our customers.
A better Internet, for everyone
In the past, we invested in efforts like “No Browsers Left Behind” to help ensure that we could continue to support clients as SHA-1 based algorithms were being deprecated. Now, we’re applying the same approach for the upcoming Let’s Encrypt change.
We have made the decision to remove Let’s Encrypt as a certificate authority from all flows where Cloudflare dictates the CA, impacting Universal SSL customers and those using SSL for SaaS with the “default CA” choice.
Starting in June 2024, one certificate lifecycle (90 days) before the cross-sign chain expires, we’ll begin migrating Let’s Encrypt certificates that are up for renewal to use a different CA, one that ensures compatibility with older devices affected by the change. That means that going forward, customers will only receive Let’s Encrypt certificates if they explicitly request Let’s Encrypt as the CA.
The change that Let’s Encrypt is making is a necessary one. For us to move forward in supporting new standards and protocols, we need to make the Public Key Infrastructure (PKI) ecosystem more agile. By retiring the cross-signed chain, Let’s Encrypt is pushing devices, browsers, and clients to support adaptable trust stores.
However, we’ve observed changes like this in the past and while they push the adoption of new standards, they disproportionately impact users in economically disadvantaged regions, where access to new technology is limited.
Our mission is to help build a better Internet and that means supporting users worldwide. We previously published a blog post about the Let’s Encrypt change, asking customers to switch their certificate authority if they expected any impact. However, determining the impact of the change is challenging. Error rates due to trust store incompatibility are primarily logged on clients, reducing the visibility that domain owners have. In addition, while there might be no requests incoming from incompatible devices today, it doesn’t guarantee uninterrupted access for a user tomorrow.
Cloudflare’s certificate pipeline has evolved over the years to be resilient and flexible, allowing us to seamlessly adapt to changes like this without any negative impact to our customers.
How Cloudflare has built a robust TLS certificate pipeline
Today, Cloudflare manages tens of millions of certificates on behalf of customers. For us, a successful pipeline means:
Customers can always obtain a TLS certificate for their domain
CA related issues have zero impact on our customer’s ability to obtain a certificate
The best security practices and modern standards are utilized
Optimizing for future scale
Supporting a wide range of clients and devices
Every year, we introduce new optimizations into our certificate pipeline to maintain the highest level of service. Here’s how we do it…
Ensuring customers can always obtain a TLS certificate for their domain
Since the launch of Universal SSL in 2014, Cloudflare has been responsible for issuing and serving a TLS certificate for every domain that’s protected by our network. That might seem trivial, but there are a few steps that have to successfully execute in order for a domain to receive a certificate:
Domain owners need to complete Domain Control Validation for every certificate issuance and renewal.
The certificate authority needs to verify the Domain Control Validation tokens to issue the certificate.
CAA records, which dictate which CAs can be used for a domain, need to be checked to ensure only authorized parties can issue the certificate.
The certificate authority must be available to issue the certificate.
Each of these steps requires coordination across a number of parties — domain owners, CDNs, and certificate authorities. At Cloudflare, we like to be in control when it comes to the success of our platform. That’s why we make it our job to ensure each of these steps can be successfully completed.
We ensure that every certificate issuance and renewal requires minimal effort from our customers. To get a certificate, a domain owner has to complete Domain Control Validation (DCV) to prove that it does in fact own the domain. Once the certificate request is initiated, the CA will return DCV tokens which the domain owner will need to place in a DNS record or an HTTP token. If you’re using Cloudflare as your DNS provider, Cloudflare completes DCV on your behalf by automatically placing the TXT token returned from the CA into your DNS records. Alternatively, if you use an external DNS provider, we offer the option to Delegate DCV to Cloudflare for automatic renewals without any customer intervention.
Once DCV tokens are placed, Certificate Authorities (CAs) verify them. CAs conduct this verification from multiple vantage points to prevent spoofing attempts. However, since these checks are done from multiple countries and ASNs (Autonomous Systems), they may trigger a Cloudflare WAF rule which can cause the DCV check to get blocked. We made sure to update our WAF and security engine to recognize that these requests are coming from a CA to ensure they’re never blocked so DCV can be successfully completed.
Some customers have CA preferences, due to internal requirements or compliance regulations. To prevent an unauthorized CA from issuing a certificate for a domain, the domain owner can create a Certification Authority Authorization (CAA) DNS record, specifying which CAs are allowed to issue a certificate for that domain. To ensure that customers can always obtain a certificate, we check the CAA records before requesting a certificate to know which CAs we should use. If the CAA records block all of the CAs that are available in Cloudflare’s pipeline and the customer has not uploaded a certificate from the CA of their choice, then we add CAA records on our customers’ behalf to ensure that they can get a certificate issued. Where we can, we optimize for preference. Otherwise, it’s our job to prevent an outage by ensuring that there’s always a TLS certificate available for the domain, even if it does not come from a preferred CA.
Today, Cloudflare is not a publicly trusted certificate authority, so we rely on the CAs that we use to be highly available. But, 100% uptime is an unrealistic expectation. Instead, our pipeline needs to be prepared in case our CAs become unavailable.
Ensuring that CA-related issues have zero impact on our customer’s ability to obtain a certificate
At Cloudflare, we like to think ahead, which means preventing incidents before they happen. It’s not uncommon for CAs to become unavailable — sometimes this happens because of an outage, but more commonly, CAs have maintenance periods every so often where they become unavailable for some period of time.
It’s our job to ensure CA redundancy, which is why we always have multiple CAs ready to issue a certificate, ensuring high availability at all times. If you’ve noticed different CAs issuing your Universal SSL certificates, that’s intentional. We evenly distribute the load across our CAs to avoid any single point of failure. Plus, we keep a close eye on latency and error rates to detect any issues and automatically switch to a different CA that’s available and performant. You may not know this, but one of our CAs has around 4 scheduled maintenance periods every month. When this happens, our automated systems kick in seamlessly, keeping everything running smoothly. This works so well that our internal teams don’t get paged anymore because everything just works.
Adopting best security practices and modern standards
Security has always been, and will continue to be, Cloudflare’s top priority, and so maintaining the highest security standards to safeguard our customer’s data and private keys is crucial.
Over the past decade, the CA/Browser Forum has advocated for reducing certificate lifetimes from 5 years to 90 days as the industry norm. This shift helps minimize the risk of a key compromise. When certificates are renewed every 90 days, their private keys remain valid for only that period, reducing the window of time that a bad actor can make use of the compromised material.
We fully embrace this change and have made 90 days the default certificate validity period. This enhances our security posture by ensuring regular key rotations, and has pushed us to develop tools like DCV Delegation that promote automation around frequent certificate renewals, without the added overhead. It’s what enables us to offer certificates with validity periods as low as two weeks, for customers that want to rotate their private keys at a high frequency without any concern that it will lead to certificate renewal failures.
Cloudflare has always been at the forefront of new protocols and standards. It’s no secret that when we support a new protocol, adoption skyrockets. This month, we will be adding ECDSA support for certificates issued from Google Trust Services. With ECDSA, you get the same level of security as RSA but with smaller keys. Smaller keys mean smaller certificates and less data passed around to establish a TLS connection, which results in quicker connections and faster loading times.
Optimizing for future scale
Today, Cloudflare issues almost 1 million certificates per day. With the recent shift towards shorter certificate lifetimes, we continue to improve our pipeline to be more robust. But even if our pipeline can handle the significant load, we still need to rely on our CAs to be able to scale with us. With every CA that we integrate, we instantly become one of their biggest consumers. We hold our CAs to high standards and push them to improve their infrastructure to scale. This doesn’t just benefit Cloudflare’s customers, but it helps the Internet by requiring CAs to handle higher volumes of issuance.
And now, with Let’s Encrypt shortening their chain of trust, we’re going to add an additional improvement to our pipeline — one that will ensure the best device compatibility for all.
Supporting all clients — legacy and modern
The upcoming Let’s Encrypt change will prevent legacy devices from making requests to domains or applications that are protected by a Let’s Encrypt certificate. We don’t want to cut off Internet access from any part of the world, which means that we’re going to continue to provide the best device compatibility to our customers, despite the change.
Because of all the recent enhancements, we are able to reduce our reliance on Let’s Encrypt without impacting the reliability or quality of service of our certificate pipeline. One certificate lifecycle (90 days) before the change, we are going to start shifting certificates to use a different CA, one that’s compatible with the devices that will be impacted. By doing this, we’ll mitigate any impact without any action required from our customers. The only customers that will continue to use Let’s Encrypt are ones that have specifically chosen Let’s Encrypt as the CA.
What to expect of the upcoming Let’s Encrypt change
Let’s Encrypt’s cross-signed chain will expire on September 30th, 2024. Although Let’s Encrypt plans to stop issuing certificates from this chain on June 6th, 2024, Cloudflare will continue to serve the cross-signed chain for all Let’s Encrypt certificates until September 9th, 2024.
90 days or one certificate lifecycle before the change, we are going to start shifting Let’s Encrypt certificates to use a different certificate authority. We’ll make this change for all products where Cloudflare is responsible for the CA selection, meaning this will be automatically done for customers using Universal SSL and SSL for SaaS with the “default CA” choice.
Any customers that have specifically chosen Let’s Encrypt as their CA will receive an email notification with a list of their Let’s Encrypt certificates and information on whether or not we’re seeing requests on those hostnames coming from legacy devices.
After September 9th, 2024, Cloudflare will serve all Let’s Encrypt certificates using the ISRG Root X1 chain. Here is what you should expect based on the certificate product that you’re using:
Universal SSL
With Universal SSL, Cloudflare chooses the CA that is used for the domain’s certificate. This gives us the power to choose the best certificate for our customers. If you are using Universal SSL, there are no changes for you to make to prepare for this change. Cloudflare will automatically shift your certificate to use a more compatible CA.
Advanced Certificates
With Advanced Certificate Manager, customers specifically choose which CA they want to use. If Let’s Encrypt was specifically chosen as the CA for a certificate, we will respect the choice, because customers may have specifically chosen this CA due to internal requirements, or because they have implemented certificate pinning, which we highly discourage.
If we see that a domain using an Advanced certificate issued from Let’s Encrypt will be impacted by the change, then we will send out email notifications to inform those customers which certificates are using Let’s Encrypt as their CA and whether or not those domains are receiving requests from clients that will be impacted by the change. Customers will be responsible for changing the CA to another provider, if they chose to do so.
SSL for SaaS
With SSL for SaaS, customers have two options: using a default CA, meaning Cloudflare will choose the issuing authority, or specifying which CA to use.
If you’re leaving the CA choice up to Cloudflare, then we will automatically use a CA with higher device compatibility.
If you’re specifying a certain CA for your custom hostnames, then we will respect that choice. We will send an email out to SaaS providers and platforms to inform them which custom hostnames are receiving requests from legacy devices. Customers will be responsible for changing the CA to another provider, if they chose to do so.
Custom Certificates
If you directly integrate with Let’s Encrypt and use Custom Certificates to upload your Let’s Encrypt certs to Cloudflare then your certificates will be bundled with the cross-signed chain, as long as you choose the bundle method “compatible” or “modern” and upload those certificates before September 9th, 2024. After September 9th, we will bundle all Let’s Encrypt certificates with the ISRG Root X1 chain. With the “user-defined” bundle method, we always serve the chain that’s uploaded to Cloudflare. If you upload Let’s Encrypt certificates using this method, you will need to ensure that certificates uploaded after September 30th, 2024, the date of the CA expiration, contain the right certificate chain.
In addition, if you control the clients that are connecting to your application, we recommend updating the trust store to include the ISRG Root X1. If you use certificate pinning, remove or update your pin. In general, we discourage all customers from pinning their certificates, as this usually leads to issues during certificate renewals or CA changes.
Conclusion
Internet standards will continue to evolve and improve. As we support and embrace those changes, we also need to recognize that it’s our responsibility to keep users online and to maintain Internet access in the parts of the world where new technology is not readily available. By using Cloudflare, you always have the option to choose the setup that’s best for your application.
For additional information regarding the change, please refer to our developer documentation.
Browser Rendering API is now available to all paid Workers customers with improved session management
In May 2023, we announced the open beta program for the Browser Rendering API. Browser Rendering allows developers to programmatically control and interact with a headless browser instance and create automation flows for their applications and products.
At the same time, we launched a version of the Puppeteer library that works with Browser Rendering. With that, developers can use a familiar API on top of Cloudflare Workers to create all sorts of workflows, such as taking screenshots of pages or automatic software testing.
Today, we take Browser Rendering one step further, taking it out of beta and making it available to all paid Workers’ plans. Furthermore, we are enhancing our API and introducing a new feature that we’ve been discussing for a long time in the open beta community: session management.
Session Management
Session management allows developers to reuse previously opened browsers across Worker’s scripts. Reusing browser sessions has the advantage that you don’t need to instantiate a new browser for every request and every task, drastically increasing performance and lowering costs.
Before, to keep a browser instance alive and reuse it, you’d have to implement complex code using Durable Objects. Now, we’ve simplified that for you by keeping your browsers running in the background and extending the Puppeteer API with new session management methods that give you access to all of your running sessions, activity history, and active limits.
Observability is an essential part of any Cloudflare product. You can find detailed analytics and logs of your Browser Rendering usage in the dashboard under your account’s Worker & Pages section.
Browser Rendering is now available to all customers with a paid Workers plan. Each account is limited to running two new browsers per minute and two concurrent browsers at no cost during this period. Check our developers page to get started.
We are rolling out access to Cloudflare Snippets
Powerful, programmable, and free of charge, Snippets are the best way to perform complex HTTP request and response modifications on Cloudflare. What was once too advanced to achieve using Rules products is now possible with Snippets. Since the initial announcement during Developer Week 2022, the promise of extending out-of-the-box Rules functionality by writing simple JavaScript code is keeping the Cloudflare community excited.
During the first 3 months of 2024 alone, the amount of traffic going through Snippets increased over 7x, from an average of 2,200 requests per second in early January to more than 17,000 in March.
However, instead of opening the floodgates and letting millions of Cloudflare users in to test (and potentially break) Snippets in the most unexpected ways, we are going to pace ourselves and opt for a phased rollout, much like the newly released Gradual Rollouts for Workers.
In the next few weeks, 5% of Cloudflare users will start seeing “Snippets” under the Rules tab of the zone-level menu in their dashboard. If you happen to be part of the first 5%, snip into action and try out how fast and powerful Snippets are even for advanced use cases like dynamically changing the date in headers or A / B testing leveraging the `math.random` function. Whatever you use Snippets for, just keep one thing in mind: this is still an alpha, so please do not use Snippets for production traffic just yet.
Until then, keep your eyes out for the new Snippets tab in the Cloudflare dashboard and learn more how powerful and flexible Snippets are at the developer documentation in the meantime.
Coming soon: asynchronous revalidation with stale-while-revalidate
One of the features most requested by our customers is the asynchronous revalidation with stale-while-revalidate (SWR) cache directive, and we will be bringing this to you in the second half of 2024. This functionality will be available by design as part of our new CDN architecture that is being built using Rust with performance and memory safety at top of mind.
Currently, when a client requests a resource, such as a web page or an image, Cloudflare checks to see if the asset is in cache and provides a cached copy if available. If the file is not in the cache or has expired and become stale, Cloudflare connects to the origin server to check for a fresh version of the file and forwards this fresh version to the end user. This wait time adds latency to these requests and impacts performance.
Stale-while-revalidate is a cache directive that allows the expired or stale version of the asset to be served to the end user while simultaneously allowing Cloudflare to check the origin to see if there’s a fresher version of the resource available. If an updated version exists, the origin forwards it to Cloudflare, updating the cache in the process. This mechanism allows the client to receive a response quickly from the cache while ensuring that it always has access to the most up-to-date content. Stale-while-revalidate strikes a balance between serving content efficiently and ensuring its freshness, resulting in improved performance and a smoother user experience.
Customers who want to be part of our beta testers and “cache” in on the fun can register here, and we will let you know when the feature is ready for testing!
Coming on April 16, 2024: Workers for Platforms for our pay-as-you-go plan
Today, we’re excited to share that on April 16th, Workers for Platforms will be available to all developers through our new $25 pay-as-you-go plan!
Workers for Platforms is changing the way we build software – it gives you the ability to embed personalization and customization directly into your product. With Workers for Platforms, you can deploy custom code on behalf of your users or let your users directly deploy their own code to your platform, without you or your users having to manage any infrastructure. You can use Workers for Platforms with all the exciting announcements that have come out this Developer Week – it supports all the bindings that come with Workers (including Workers AI, D1 and Durable Objects) as well as Python Workers.
Here’s what some of our customers – ranging from enterprises to startups – are building on Workers for Platforms:
Shopify Oxygen is a hosting platform for their Remix-based eCommerce framework Hydrogen, and it’s built on Workers for Platforms! The Hydrogen/Oxygen combination gives Shopify merchants control over their buyer experience without the restrictions of generic storefront templates.
Grafbase is a data platform for developers to create a serverless GraphQL API that unifies data sources across a business under one endpoint. They use Workers for Platforms to give their developers the control and flexibility to deploy their own code written in JavaScript/TypeScript or WASM.
Triplit is an open-source database that syncs data between server and browser in real-time. It allows users to build low latency, real-time applications with features like relational querying, schema management and server-side storage built in. Their query and sync engine is built on top of Durable Objects, and they’re using Workers for Platforms to allow their customers to package custom Javascript alongside their Triplit DB instance.
Tools for observability and platform level controls
Workers for Platforms doesn’t just allow you to deploy Workers to your platform – we also know how important it is to have observability and control over your users’ Workers. We have a few solutions that help with this:
Custom Limits: Set CPU time or subrequest caps on your users’ Workers. Can be used to set limits in order to control your costs on Cloudflare and/or shape your own pricing and packaging model. For example, if you run a freemium model on your platform, you can lower the CPU time limit for customers on your free tier.
Tail Workers: Tail Worker events contain metadata about the Worker, console.log() messages, and capture any unhandled exceptions. They can be used to provide your developers with live logging in order to monitor for errors and troubleshoot in real time.
Outbound Workers: Get visibility into all outgoing requests from your users’ Workers. Outbound Workers sit between user Workers and the fetch() requests they make, so you get full visibility over the request before it’s sent out to the Internet.
Pricing
We wanted to make sure that Workers for Platforms was affordable for hobbyists, solo developers, and indie developers. Workers for Platforms is part of a new $25 pay-as-you-go plan, and it includes the following:
Included Amounts
Requests
20 million requests/month +$0.30 per additional million
CPU time
60 million CPU milliseconds/month +$0.02 per additional million CPU milliseconds
Scripts
1000 scripts +0.02 per additional script/month
Workers for Platforms will be available to purchase on April 16, 2024!
The Workers for Platforms will be available to purchase under the Workers for Platforms tab on the Cloudflare Dashboard on April 16, 2024.
Cloudforce One is our threat operations and research team. Its primary objective: track and disrupt threat actors targeting Cloudflare and the customer systems we protect. Cloudforce One customers can engage directly with analysts on the team to help understand and stop the specific threats targeting them.
Today, we are releasing in general availability two new tools that will help Cloudforce One customers get the best value out of the service by helping us prioritize and organize the information that matters most to them: Requests for Information (RFIs) and Priority Intelligence Requirements (PIRs). We’d also like to review how we’ve used the Cloudflare Workers and Pages platform to build our internal pipeline to not only perform investigations on behalf of our customers, but conduct our own internal investigations of the threats and attackers we track.
What are Requests for Information (RFIs)?
RFIs are designed to streamline the process of accessing critical intelligence. They provide an avenue for users to submit specific queries and requests directly into Cloudforce One’s analysis queue. Essentially, they are a well-structured way for you to tell the team what to focus their research on to best support your security posture.
Each RFI filed is routed to an analyst and treated as a targeted call for information on specific threat elements. From malware analysis to DDoS attack analysis, we have a group of seasoned threat analysts who can provide deeper insight into a wide array of attacks. Those who have found RFIs invaluable typically belong to Security Operation Centers, Incident Response Teams, and Threat Research/Intelligence teams dedicated to supporting internal investigations within an organization. This approach proves instrumental in unveiling potential vulnerabilities and enhancing the understanding of the security posture, especially when confronting complex risks.
Creating an RFI is straightforward. Through the Security Center dashboard, users can create and track their RFIs:
Submission: Submit requests via Cloudforce One RFI Dashboard:
a. Threat: The threat or campaign you would like more information on
b. Priority: routine, high or urgent
c. Type: Binary Analysis, Indicator Analysis, Traffic Analysis, Threat Detection Signature, Passive DNS Resolution, DDoS Attack or Vulnerability
d. Output: Malware Analysis Report, Indicators of Compromise, or Threat Research Report
Tracking: Our Threat Research team begins work and the customer can track progress (open, in progress, pending, published, complete) via the RFI Dashboard. Automated alerts are sent to the customer with each status change.
Delivery: Customers can access/download the RFI response via the RFI Dashboard.
Fabricated example of the detailed view of an RFI and communication with the Cloudflare Threat Research Team
Once an RFI is submitted, teams can stay informed about the progress of their requests through automated alerts. These alerts, generated when a Cloudforce One analyst has completed the request, are delivered directly to the user’s email or to a team chat channel via a webhook.
What are Priority Intelligence Requirements (PIRs)?
Priority Intelligence Requirements (PIRs) are a structured approach to identifying intelligence gaps, formulating precise requirements, and organizing them into categories that align with Cloudforce One’s overarching goals. For example, you can create a PIR signaling to the Cloudforce One team what topic you would like more information on.
PIR dashboard with fictitious examples of priority intelligence requirements
PIRs help target your intelligence collection efforts toward the most relevant insights, enabling you to make informed decisions and strengthen your organization’s cybersecurity posture.
While PIRs currently offer a framework for prioritizing intelligence requirements, our vision extends beyond static requirements. Looking ahead, our plan is to evolve PIRs into dynamic tools that integrate real-time intelligence from Cloudforce One. Enriching PIRs by integrating them with real-time intelligence from Cloudforce One will provide immediate insights into your Cloudflare environment, facilitating a direct and meaningful connection between ongoing threat intelligence and your predefined intelligence needs.
What drives Cloudforce One?
Since our inception, Cloudforce One has been actively collaborating with our Security Incident Response Team (SIRT) and Trust and Safety (T&S) team, aiming to provide valuable insights into attacks targeting Cloudflare and counteract the misuse of Cloudflare services. Throughout these investigations, we recognized the need for a centralized platform to capture insights from Cloudflare’s unique perspective on the Internet, aggregate data, and correlate reports.
In the past, our approach would have involved deploying a frontend UI and backend API in a core data center, leveraging common services like Postgres, Redis, and a Ceph storage solution. This conventional route would have entailed managing Docker deployments, constantly upgrading hosts for vulnerabilities, and dealing with a complex environment where we must juggle secrets, external service configurations, and maintaining availability.
Instead, we welcomed being Customer Zero for Cloudflare and fully embraced Cloudflare’s Workers and Pages platforms to construct a powerful threat investigation tool, and since then, we haven’t looked back. For anyone that has used Workers in the past, much of what we have done is not revolutionary, but almost commonplace given the ease of configuring and implementing the features in Cloudflare Workers. We routinely store file data in R2, metadata in KV, and indexed data in D1. That being said, we do have a few non-standard deployments as well, further outlined below.
Altogether, our Threats Investigation architecture consists of five services, four of which are deployed at the edge with the other one deployed in our core data centers due to data dependency constraints.
RFIs & PIRs: This API manages our formal Cloudforce One requests and customer priorities submitted via the Cloudflare Dashboard.
Threats: Our UI, deployed via Pages, serves as the interface for interacting with all of our Cloudforce One services, Cloudflare internal services, and the RFIs and PIRs submitted by our customers.
Cases: A case management system that allows analysts to store notes, Indicators of Compromise (IOCs), malware samples, and data analytics related to an attack. The service provides live updates to all analysts viewing the case, facilitating real-time collaboration. Each case is a Durable Object that is connected to via a Websocket that stores “files” and “file content” in the Durable Object’s persistent storage. Metadata for the case is made searchable via D1.
Leads: A queue of informal internal and external requests that may be reviewed by Cloudforce One when doing threat hunting discovery. Lead content is stored into KV, while metadata and extracted IOCs are stored in D1.
Binary DB:A raw binary file warehouse for any file we come across during our investigation. Binary DB also serves as the repository for malware samples used in some of our machine learning training. Each file is stored in R2, with its associated metadata stored in KV.
Cloudforce One Threat Investigation Architecture
At the heart of our Threats ecosystem is our case management service built on Workers and Durable Objects. We were inspired to build this tool because we often had to jump into collaborative documents that were not designed to store forensic data, organize it, mark sections with Traffic Light Protocol (TLP) releasability codes, and relate analysis to existing RFIs or Leads.
Our concept of cases is straightforward — each case is a Durable Object that can accept HTTP REST API or WebSocket connections. Upon initiating a WebSocket connection, it is seamlessly incorporated into the Durable Object’s in-memory state, allowing us to instantly broadcast real-time events to all users engaged with the case. Each case comprises distinct folders, each housing a collection of files containing content, releasability information, and file metadata.
Practically, our Durable Object leverages its persistent storage with each storage key prefixed with the value type: “case”, “folder”, or “file” followed by the UUID assigned to the file. Each case value has metadata associated with the case and a list of folders that belong to the case. Each folder has the folder’s name and a list of files that belong to it.
Our internal Threats UI helps us tie together the service integrations with our threat hunting analysis. It is here we do our day-to-day work which allows us to bring our unique insights into Cloudflare attacks. Below is an example of our Case Management in action where we tracked the RedAlerts attack before we formalized our analysis into the blog.
What good is all of this if we can’t search it? The Workers AI team launched Vectorize and enabled inference on the edge, so we decided to go all in on Workers and began indexing all case files as they’re being edited so that they can be searched. As each case file is being updated in the Durable Object, the content of the file is pushed to Cloudflare Queues. This data is consumed by an indexing engine consumer that does two things: extracts and indexes indicators of compromise, and embeds the content into a vector and pushes it into Vectorize. Both of the search mechanisms also pass the reference case and file identifiers so that the case may be found upon searching.
Given how easy it is to set up Workers AI, we took the final step of implementing a full Retrieval Augmented Generation (RAG) AI to allow analysts to ask questions about our previous analysis. Each question undergoes the same process as the content that is indexed. We pull out any indicators of compromise and embed the question into a vector, so we can use both results to search our indexes and Vectorize respectively, and provide the most relevant results for the request. Lastly, we send the vector data to a text-generation model using Workers AI that then returns a response to our analysts.
Using RFIs and PIRs
Imagine submitting an RFI for “Passive DNS Resolution – IOCs” and receiving real-time updates directly within the PIR, guiding your next steps.
Our workflow ensures that the intelligence you need is not only obtained but also used optimally. This approach empowers your team to tailor your intelligence gathering, strengthening your cybersecurity strategy and security posture.
Our mission for Cloudforce One is to equip organizations with the tools they need to stay one step ahead in the rapidly changing world of cybersecurity. The addition of RFIs and PIRs marks another milestone in this journey, empowering users with enhanced threat intelligence capabilities.
Getting started
Cloudforce One customers can already see the PIR and RFI Dashboard in their Security Center, and they can also use the API if they prefer that option. Click to see more documentation about our RFI and our PIR APIs.
If you’re looking to try out the new RFI and PIR capabilities within the Security Center, contact your Cloudflare account team or fill out this form and someone will be in touch. Finally, if you’re interested in joining the Cloudflare team, check out our open job postings here.
On January 19, 2024, the Cybersecurity & Infrastructure Security Agency (CISA) issued Emergency Directive 24-01: Mitigate Ivanti Connect Secure and Ivanti Policy Secure Vulnerabilities. CISA has the authority to issue emergency directives in response to a known or reasonably suspected information security threat, vulnerability, or incident. U.S. Federal agencies are required to comply with these directives.
Federal agencies were directed to apply a mitigation against two recently discovered vulnerabilities; the mitigation was to be applied within three days. Further monitoring by CISA revealed that threat actors were continuing to exploit the vulnerabilities and had developed some workarounds to earlier mitigations and detection methods. On January 31, CISA issued Supplemental Direction V1 to the Emergency Directive instructing agencies to immediately disconnect all instances of Ivanti Connect Secure and Ivanti Policy Secure products from agency networks and perform several actions before bringing the products back into service.
This blog post will explore the threat actor’s tactics, discuss the high-value nature of the targeted products, and show how Cloudflare’s Secure Access Service Edge (SASE) platform protects against such threats.
As a side note and showing the value of layered protections, Cloudflare’s WAF had proactively detected the Ivanti zero-day vulnerabilities and deployed emergency rules to protect Cloudflare customers.
Threat Actor Tactics
Forensic investigations (see the Volexity blog for an excellent write-up) indicate that the attacks began as early as December 2023. Piecing together the evidence shows that the threat actors chained two previously unknown vulnerabilities together to gain access to the Connect Secure and Policy Secure appliances and achieve unauthenticated remote code execution (RCE).
CVE-2023-46805 is an authentication bypass vulnerability in the products’ web components that allows a remote attacker to bypass control checks and gain access to restricted resources. CVE-2024-21887 is a command injection vulnerability in the products’ web components that allows an authenticated administrator to execute arbitrary commands on the appliance and send specially crafted requests. The remote attacker was able to bypass authentication and be seen as an “authenticated” administrator, and then take advantage of the ability to execute arbitrary commands on the appliance.
By exploiting these vulnerabilities, the threat actor had near total control of the appliance. Among other things, the attacker was able to:
Harvest credentials from users logging into the VPN service
Use these credentials to log into protected systems in search of even more credentials
Modify files to enable remote code execution
Deploy web shells to a number of web servers
Reverse tunnel from the appliance back to their command-and-control server (C2)
Avoid detection by disabling logging and clearing existing logs
Little Appliance, Big Risk
This is a serious incident that is exposing customers to significant risk. CISA is justified in issuing their directive, and Ivanti is working hard to mitigate the threat and develop patches for the software on their appliances. But it also serves as another indictment of the legacy “castle-and-moat” security paradigm. In that paradigm, remote users were outside the castle while protected applications and resources remained inside. The moat, consisting of a layer of security appliances, separated the two. The moat, in this case the Ivanti appliance, was responsible for authenticating and authorizing users, and then connecting them to protected applications and resources. Attackers and other bad actors were blocked at the moat.
This incident shows us what happens when a bad actor is able to take control of the moat itself, and the challenges customers face to recover control. Two typical characteristics of vendor-supplied appliances and the legacy security strategy highlight the risks:
Administrators have access to the internals of the appliance
Authenticated users indiscriminately have access to a wide range of applications and resources on the corporate network, increasing the risk of bad actor lateral movement
A better way: Cloudflare’s SASE platform
Cloudflare One is Cloudflare’s SSE and single-vendor SASE platform. While Cloudflare One spans broadly across security and networking services (and you can read about the latest additions here), I want to focus on the two points noted above.
First, Cloudflare One employs the principles of Zero Trust, including the principle of least privilege. As such, users that authenticate successfully only have access to the resources and applications necessary for their role. This principle also helps in the event of a compromised user account as the bad actor does not have indiscriminate network-level access. Rather, least privilege limits the range of lateral movement that a bad actor has, effectively reducing the blast radius.
Second, while customer administrators need to have access to configure their services and policies, Cloudflare One does not provide any external access to the system internals of Cloudflare’s platform. Without that access, a bad actor would not be able to launch the types of attacks executed when they had access to the internals of the Ivanti appliance.
It’s time to eliminate the legacy VPN
If your organization is impacted by the CISA directive, or you are just ready to modernize and want to augment or replace your current VPN solution, Cloudflare is here to help. Cloudflare’s Zero Trust Network Access (ZTNA) service, part of the Cloudflare One platform, is the fastest and safest way to connect any user to any application.
Contact us to get immediate onboarding help or to schedule an architecture workshop to help you augment or replace your Ivanti (or any) VPN solution. Not quite ready for a live conversation? Read our learning path article on how to replace your VPN with Cloudflare or our SASE reference architecture for a view of how all of our SASE services and on-ramps work together.
The collective thoughts of the interwebz
Manage Consent
To provide the best experiences, we use technologies like cookies to store and/or access device information. Consenting to these technologies will allow us to process data such as browsing behavior or unique IDs on this site. Not consenting or withdrawing consent, may adversely affect certain features and functions.
Functional
Always active
The technical storage or access is strictly necessary for the legitimate purpose of enabling the use of a specific service explicitly requested by the subscriber or user, or for the sole purpose of carrying out the transmission of a communication over an electronic communications network.
Preferences
The technical storage or access is necessary for the legitimate purpose of storing preferences that are not requested by the subscriber or user.
Statistics
The technical storage or access that is used exclusively for statistical purposes.The technical storage or access that is used exclusively for anonymous statistical purposes. Without a subpoena, voluntary compliance on the part of your Internet Service Provider, or additional records from a third party, information stored or retrieved for this purpose alone cannot usually be used to identify you.
Marketing
The technical storage or access is required to create user profiles to send advertising, or to track the user on a website or across several websites for similar marketing purposes.


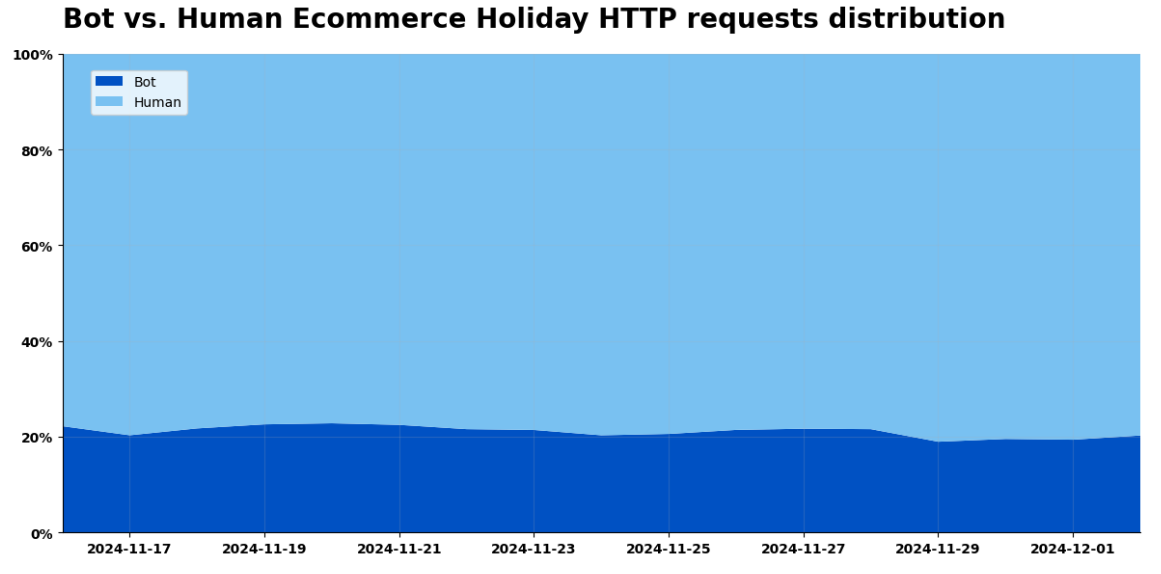

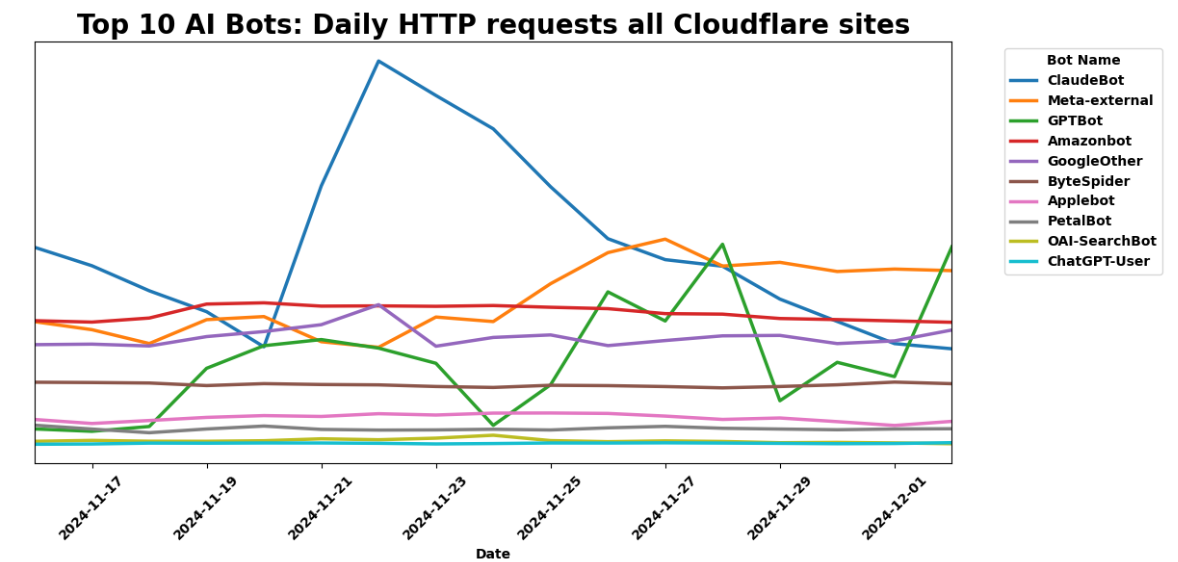
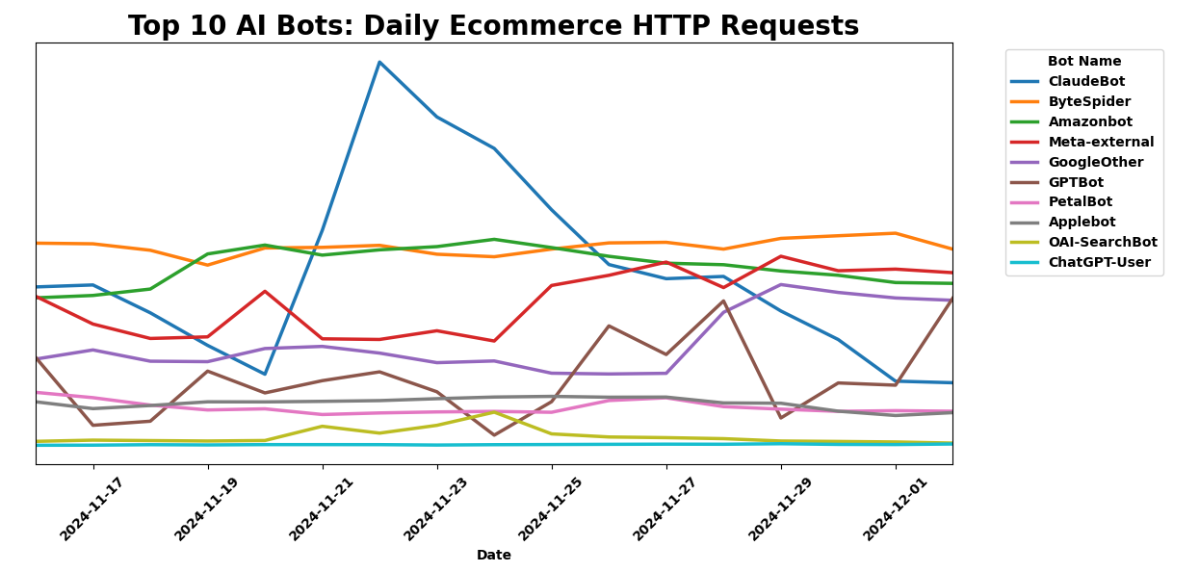
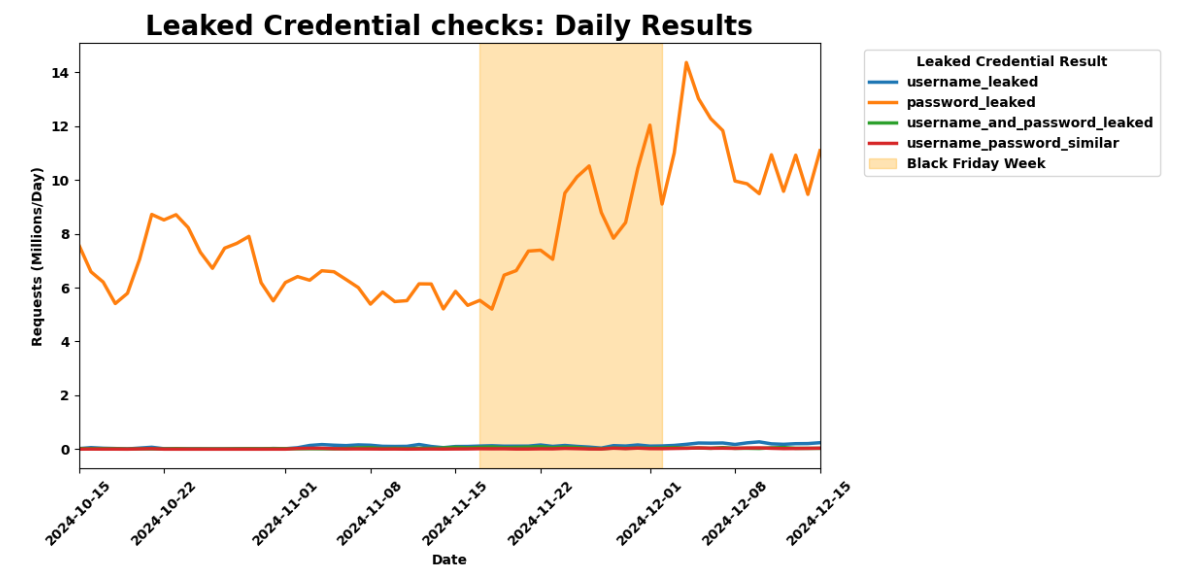
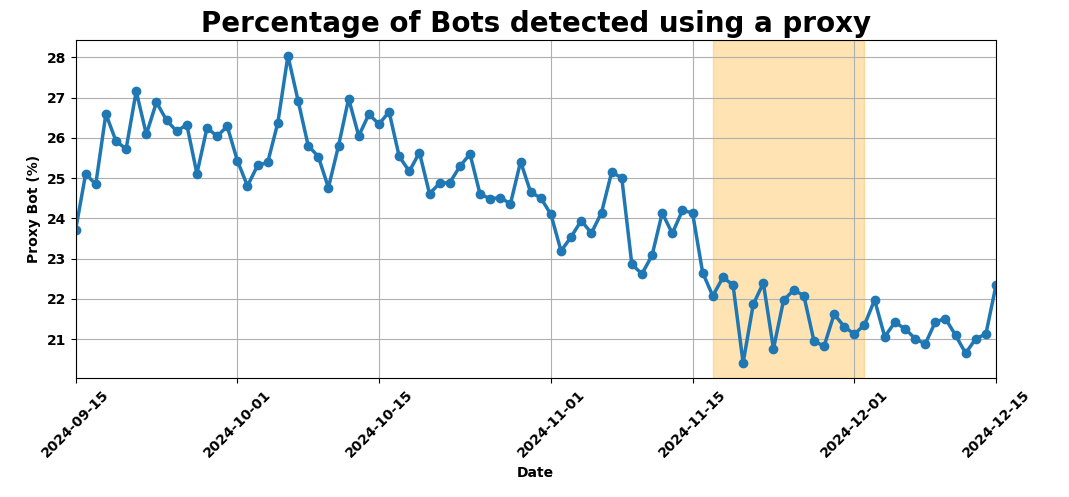


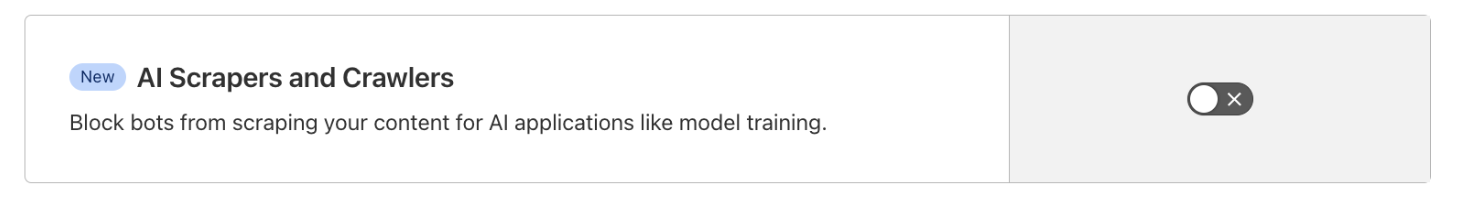


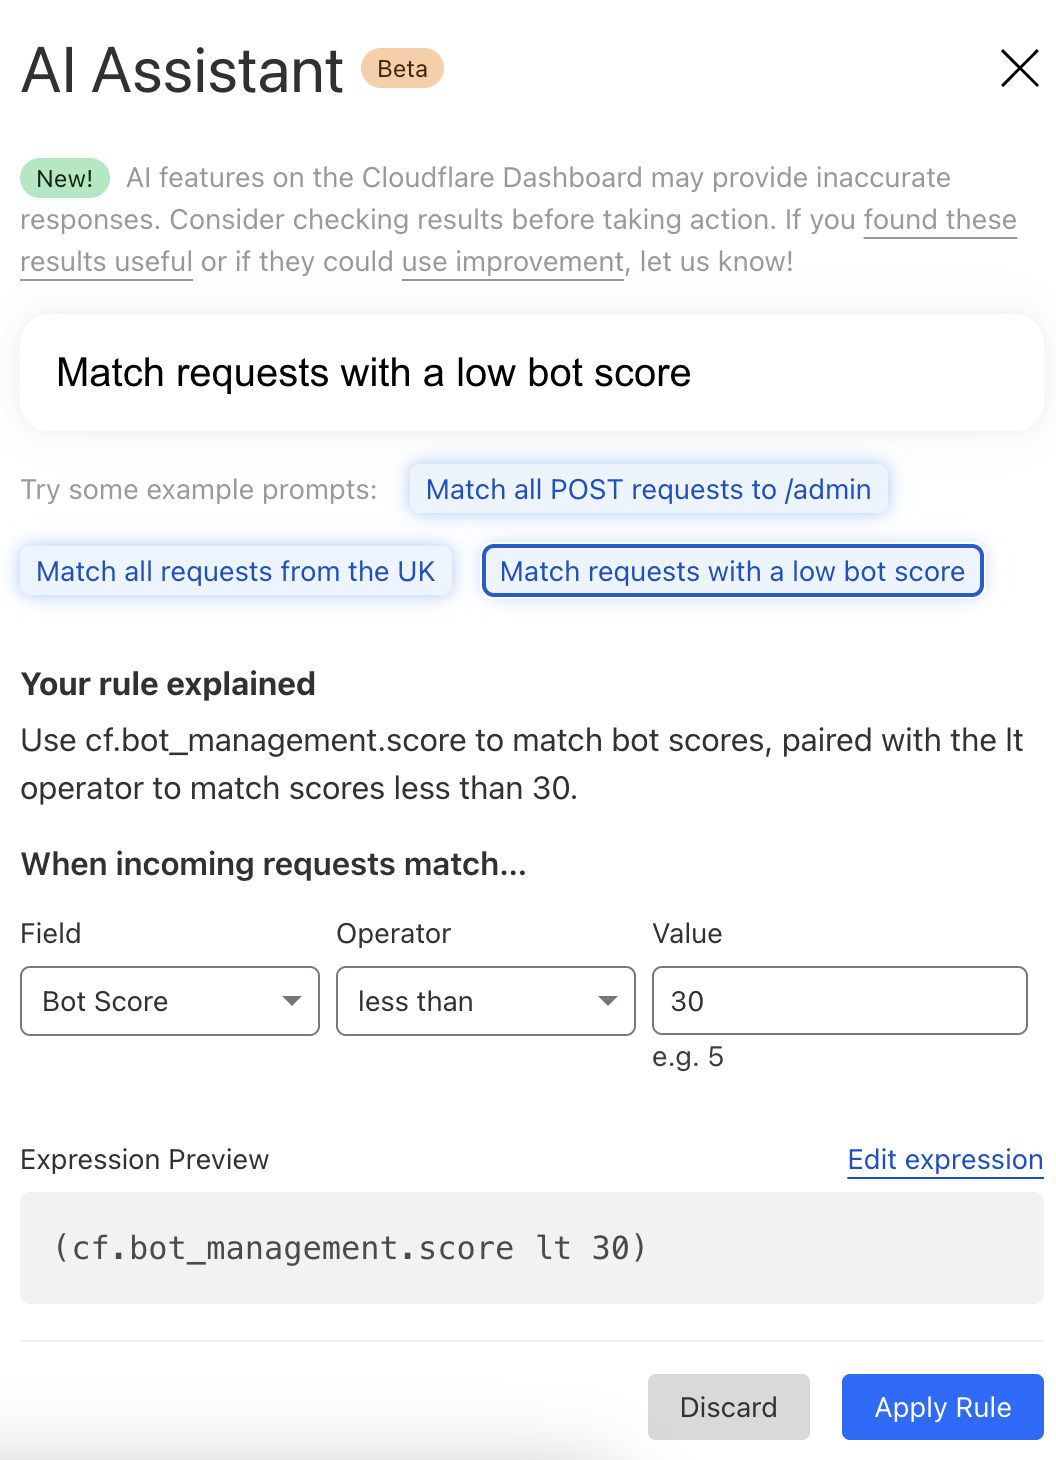
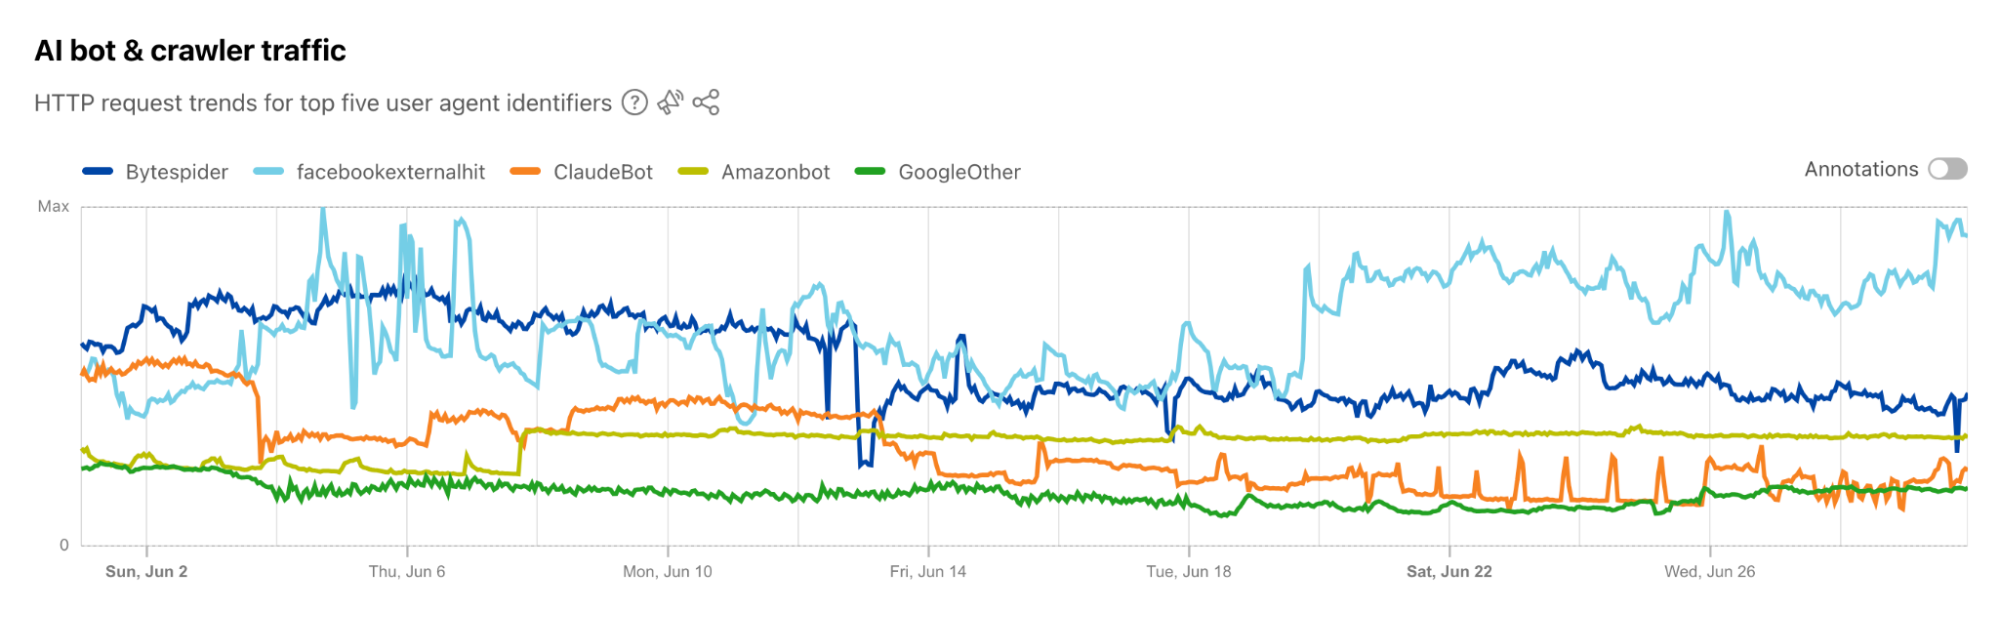

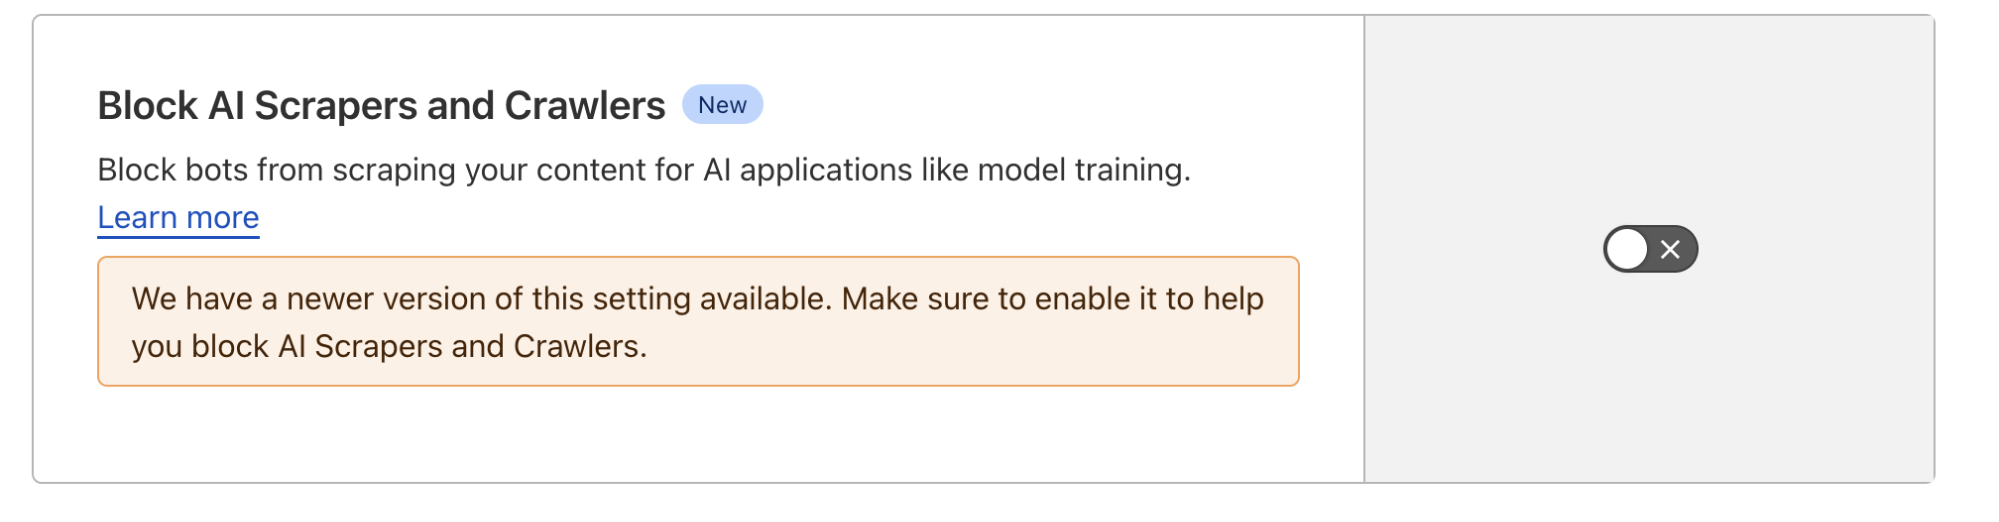
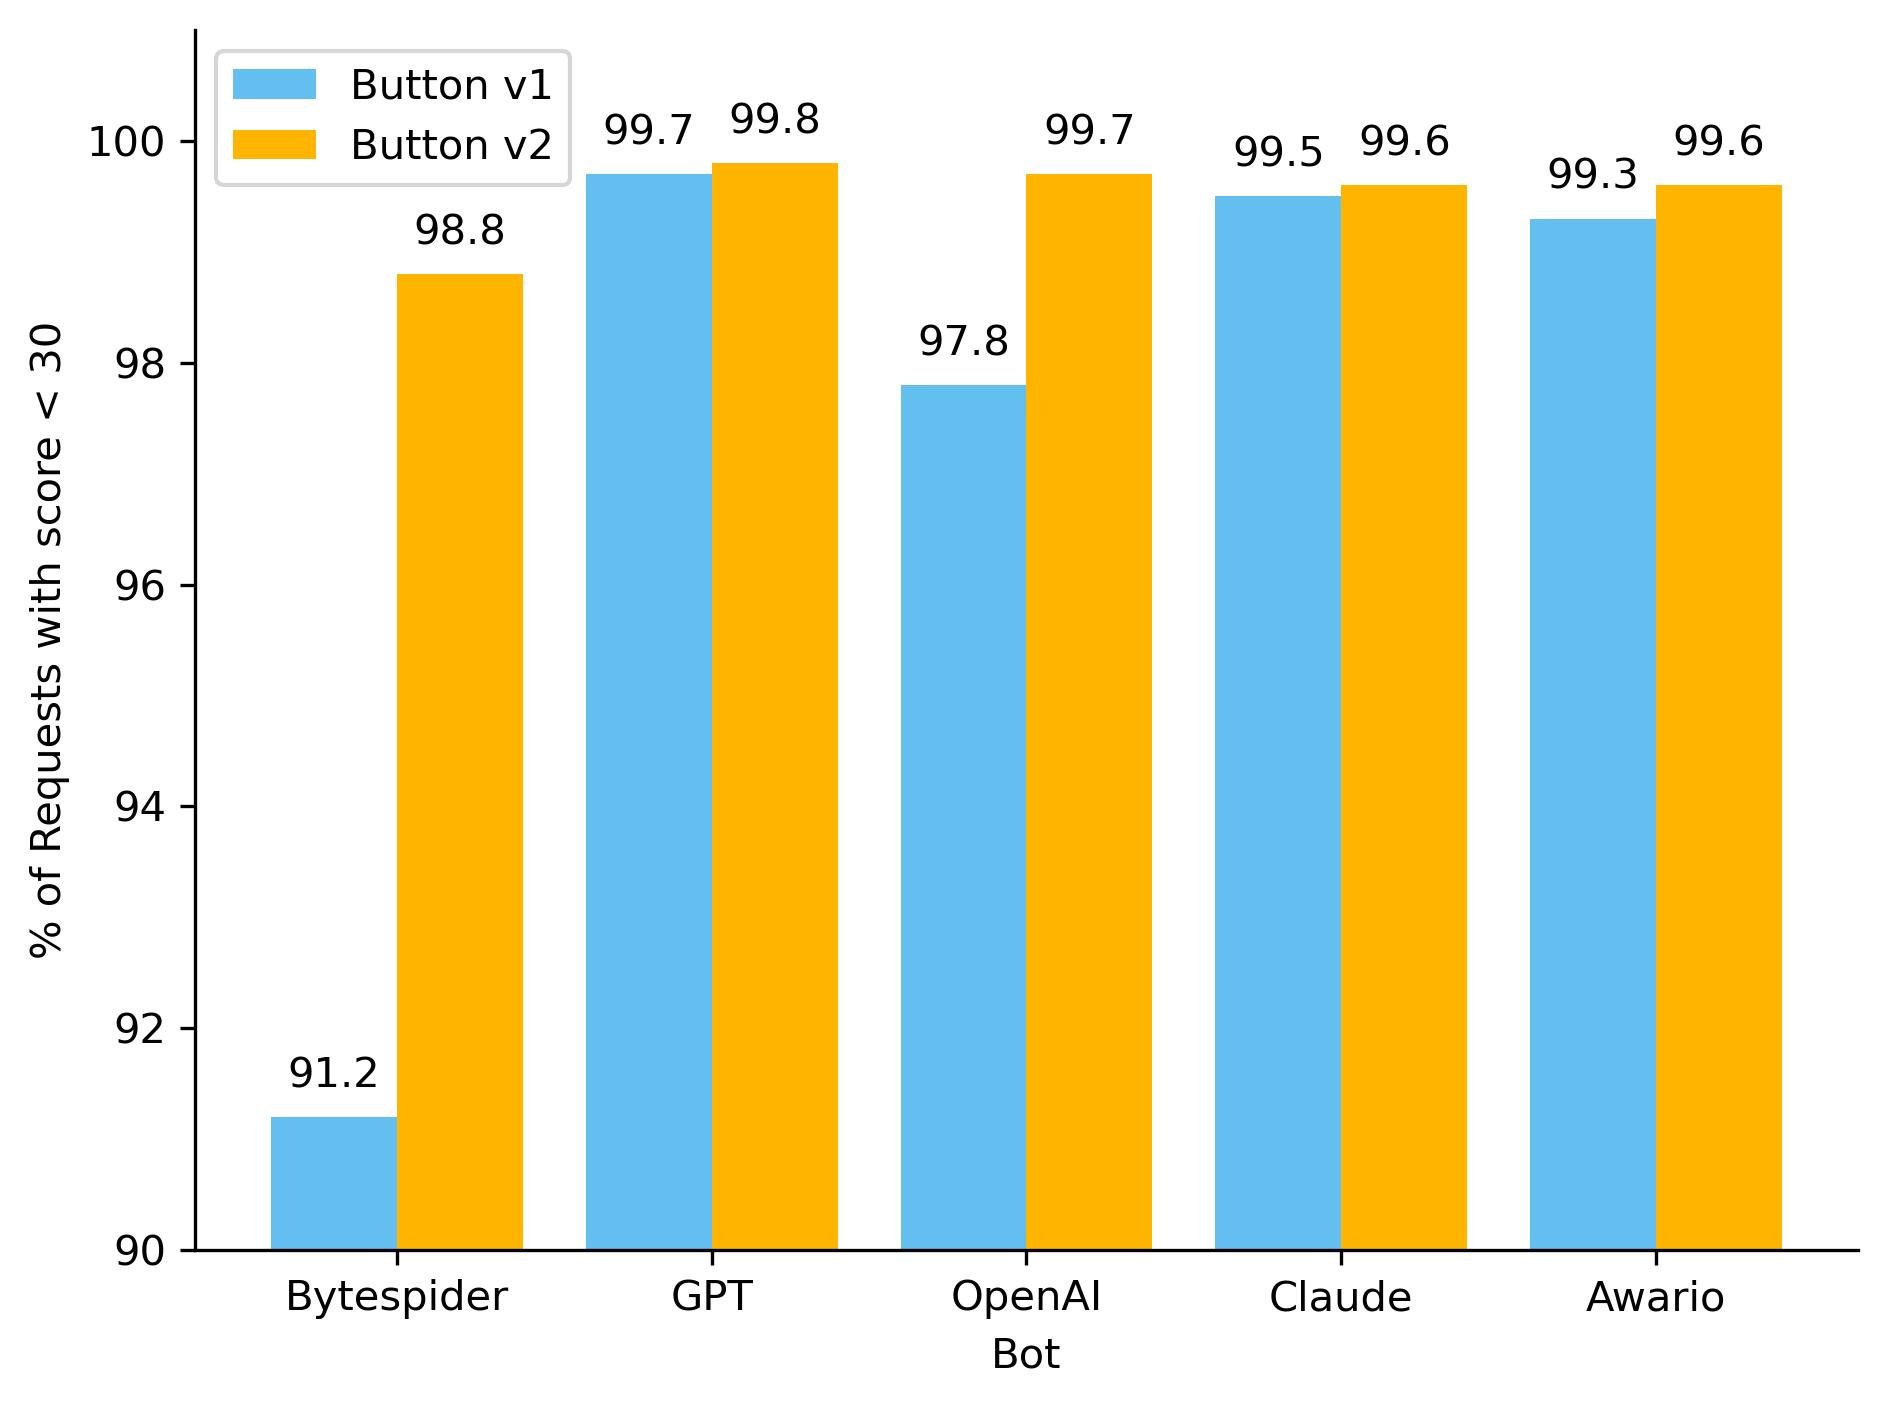
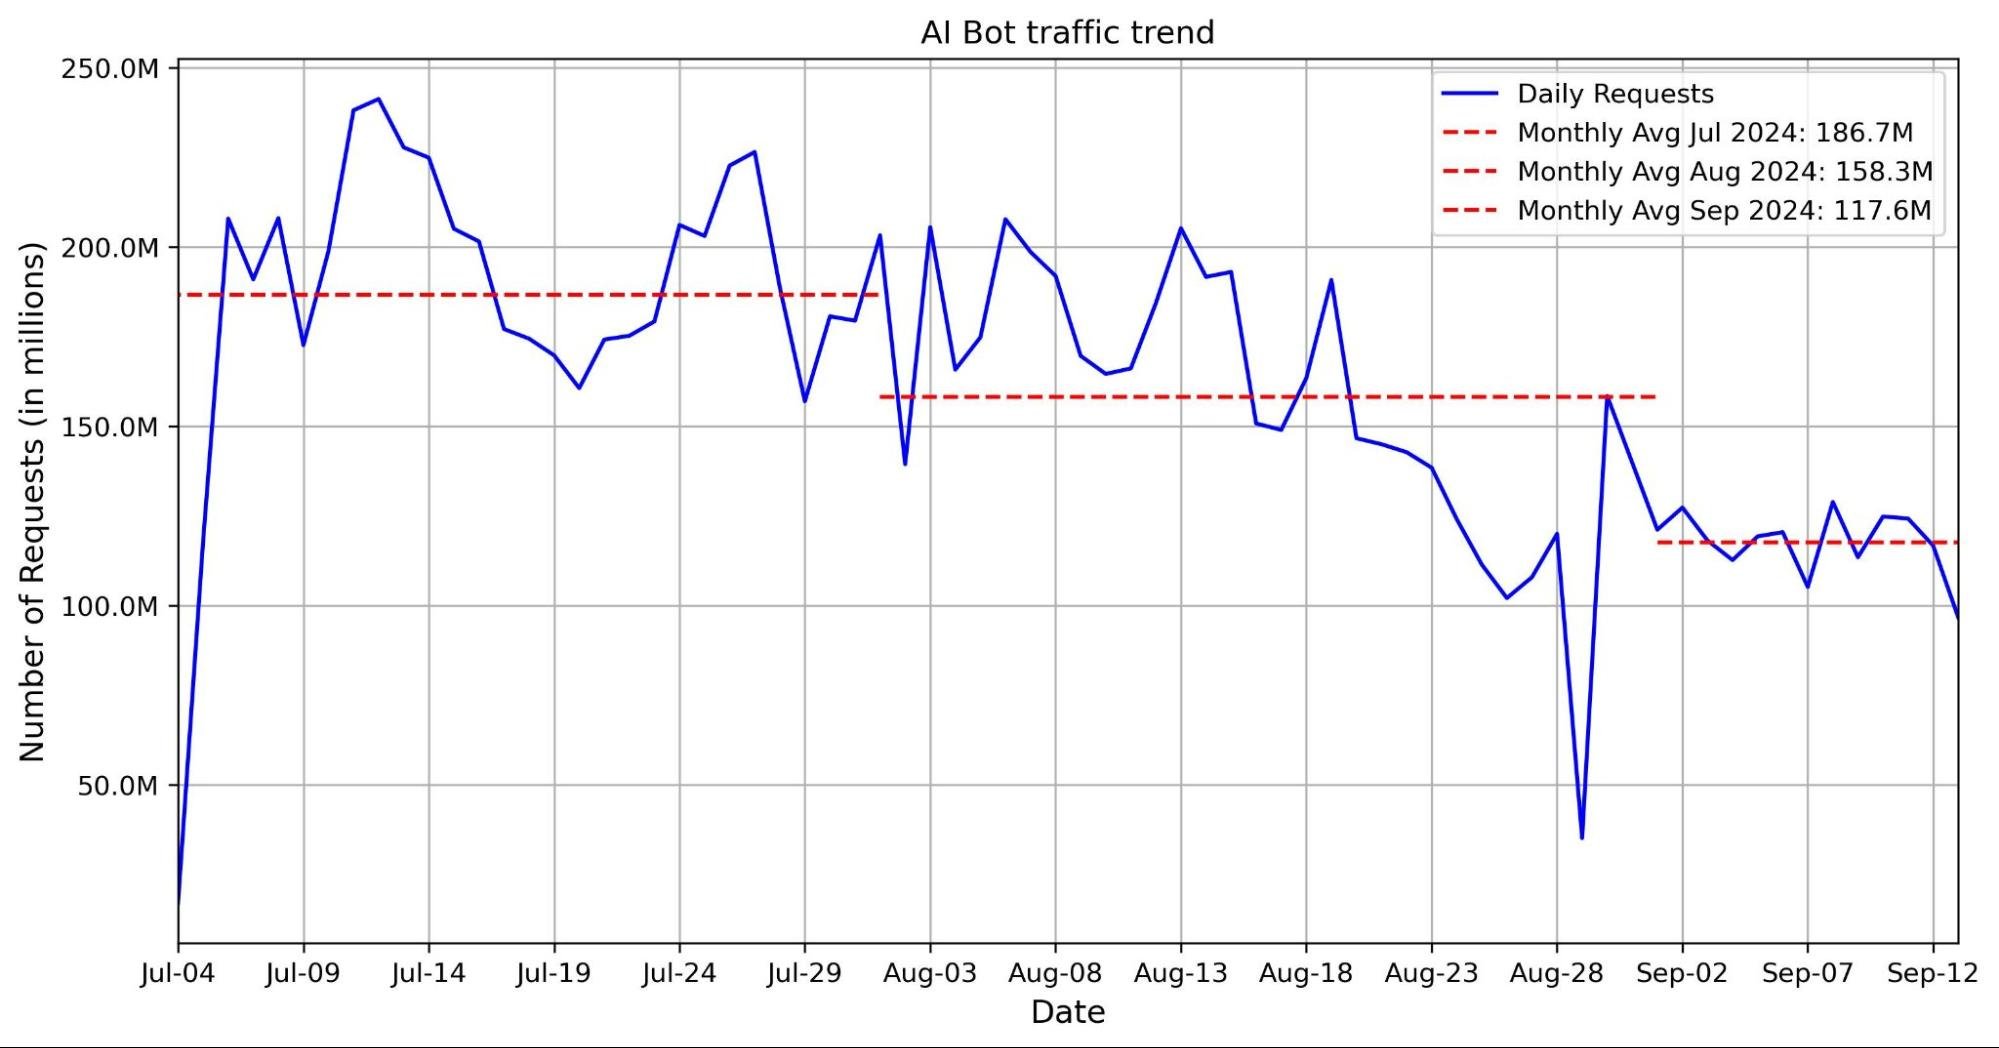
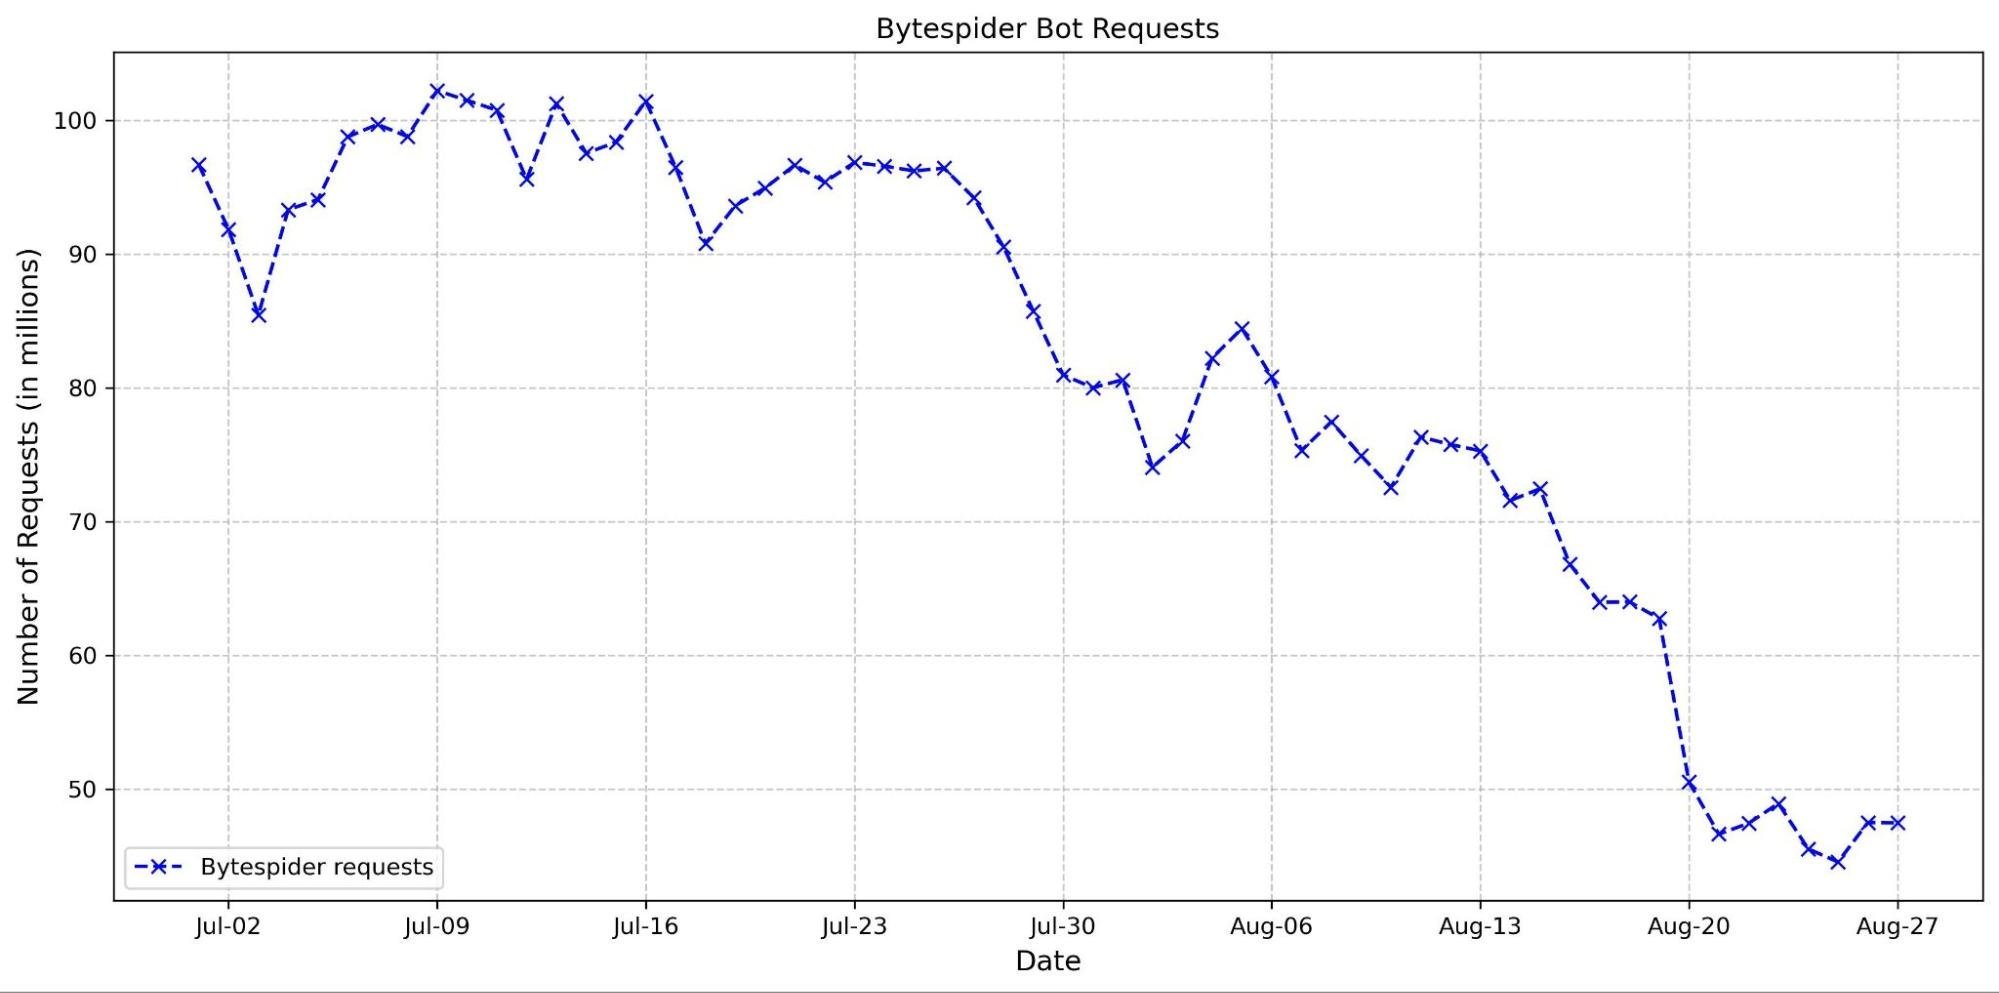
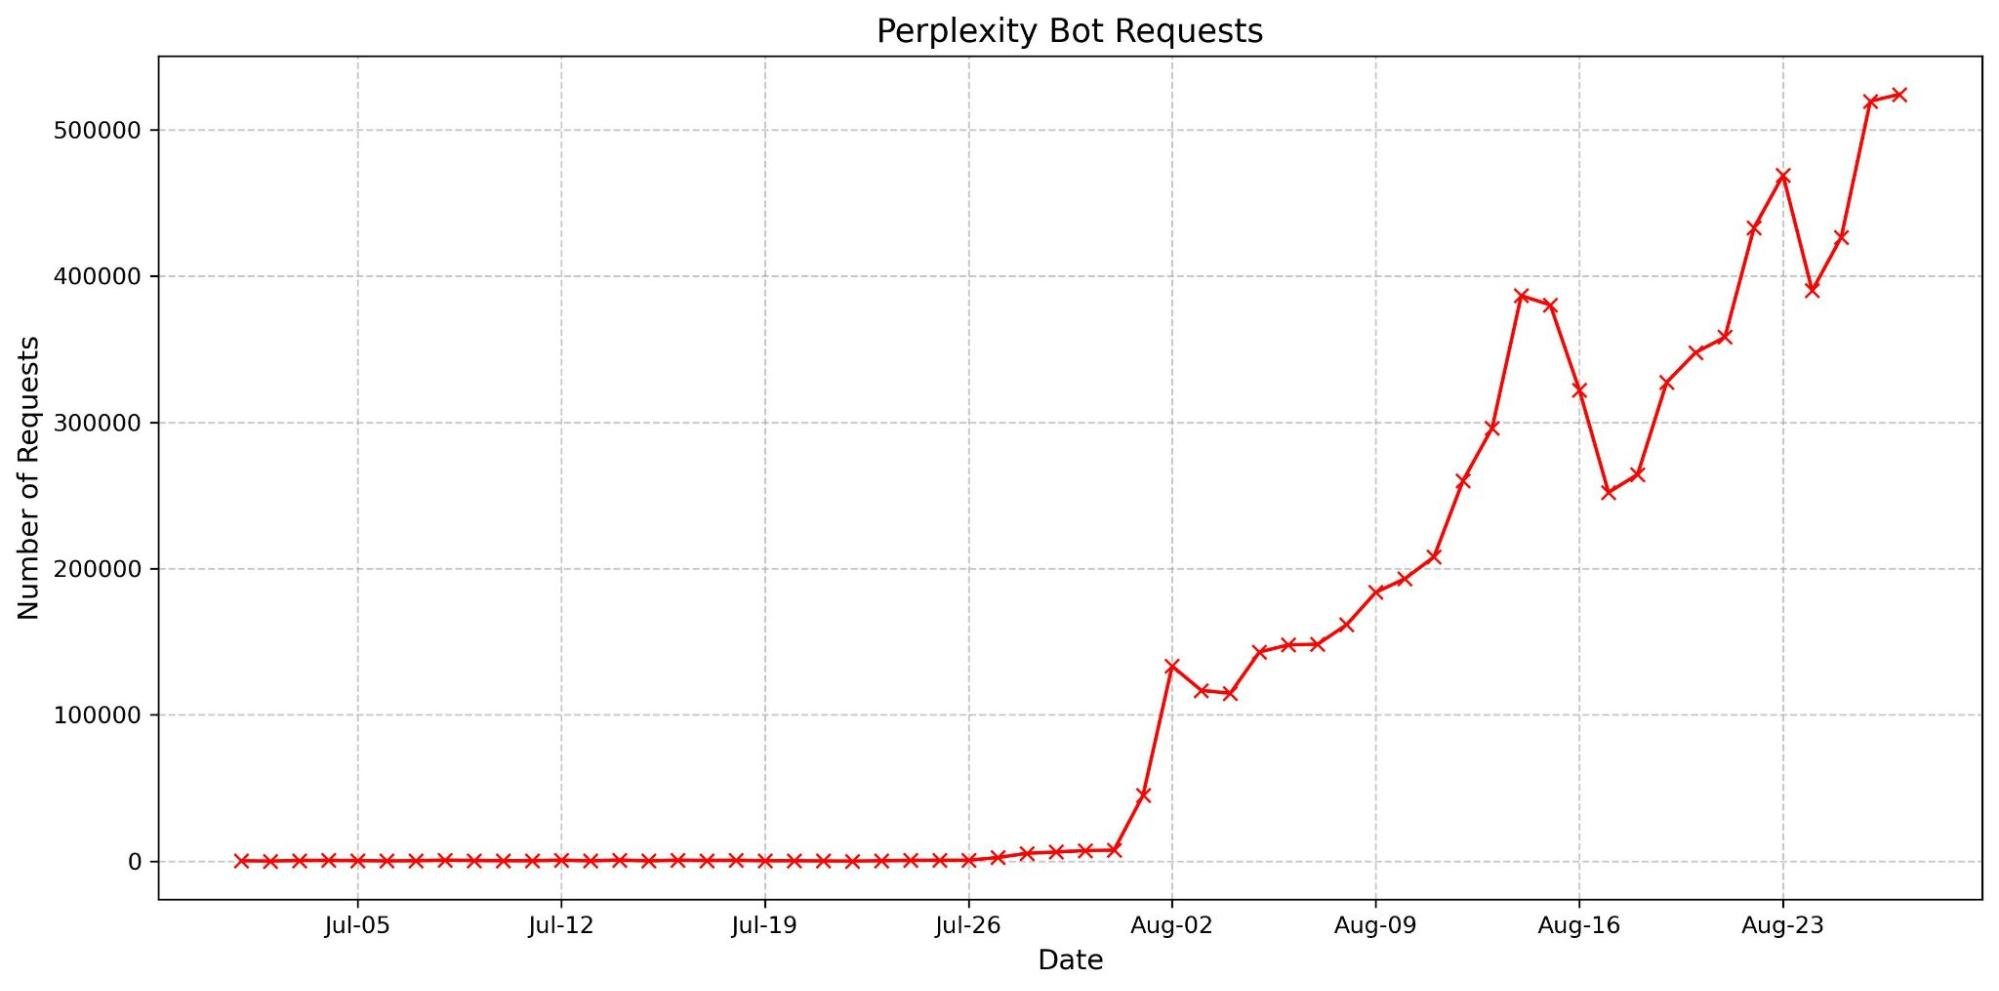
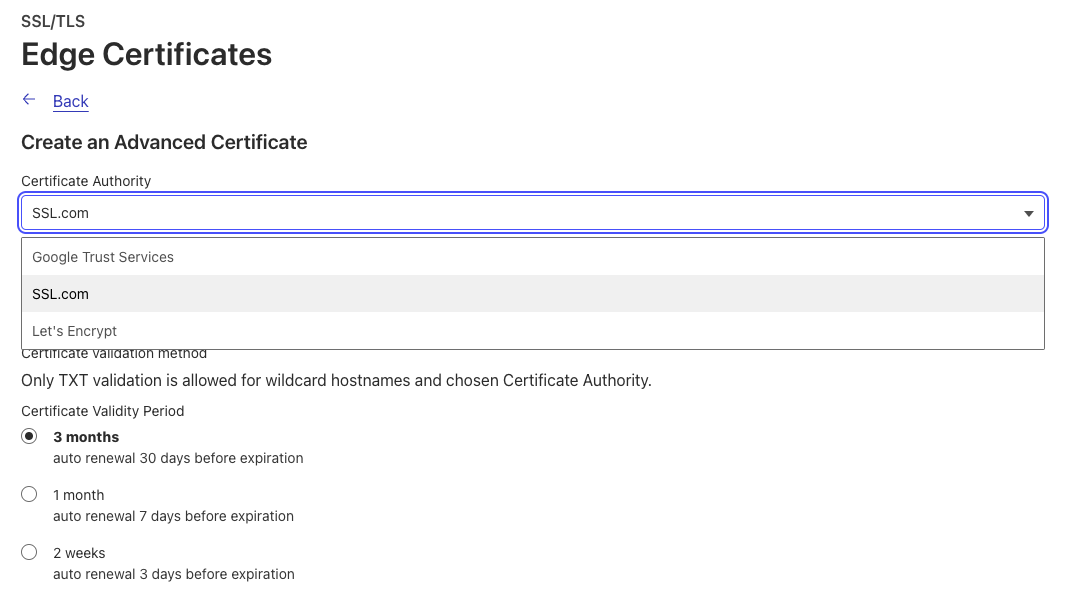
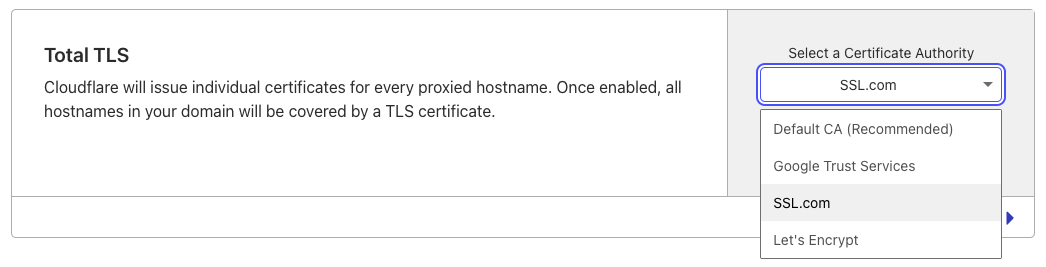
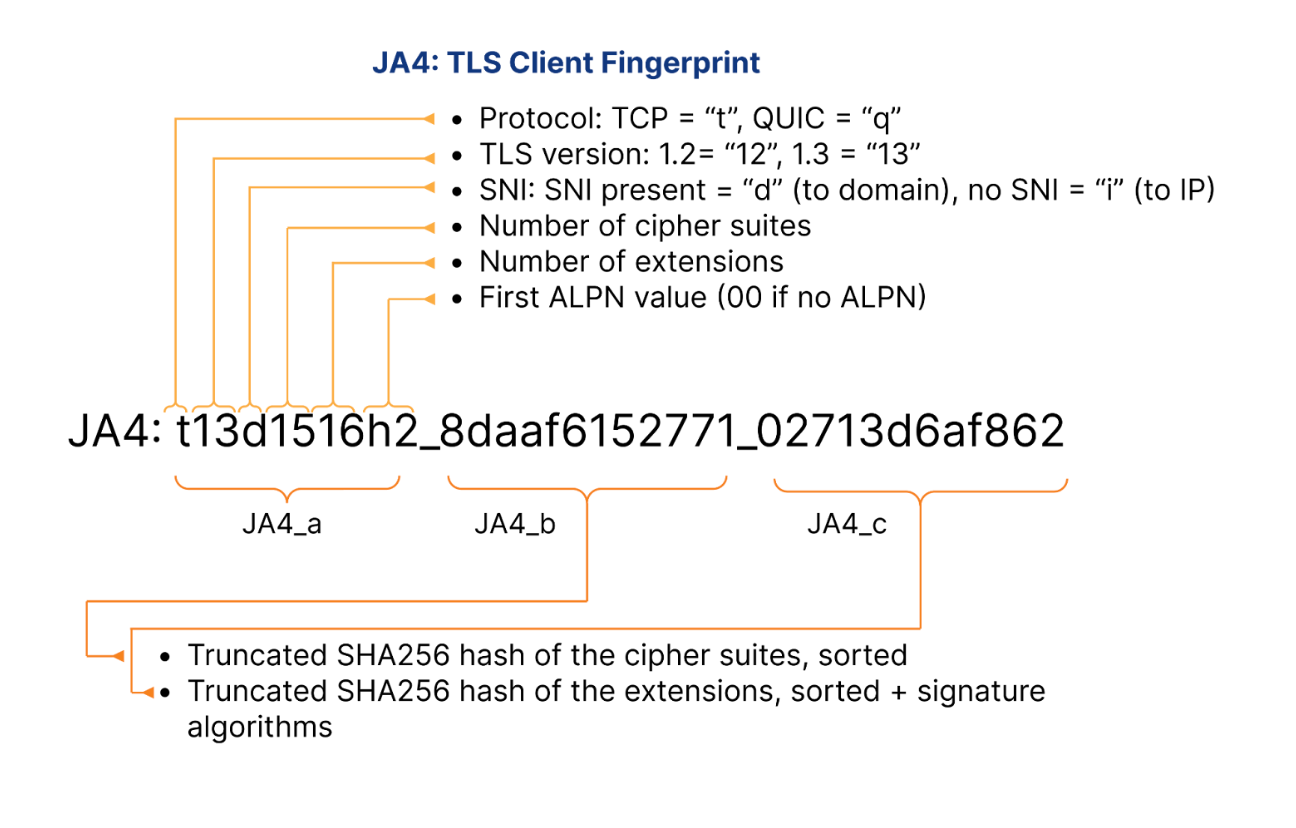
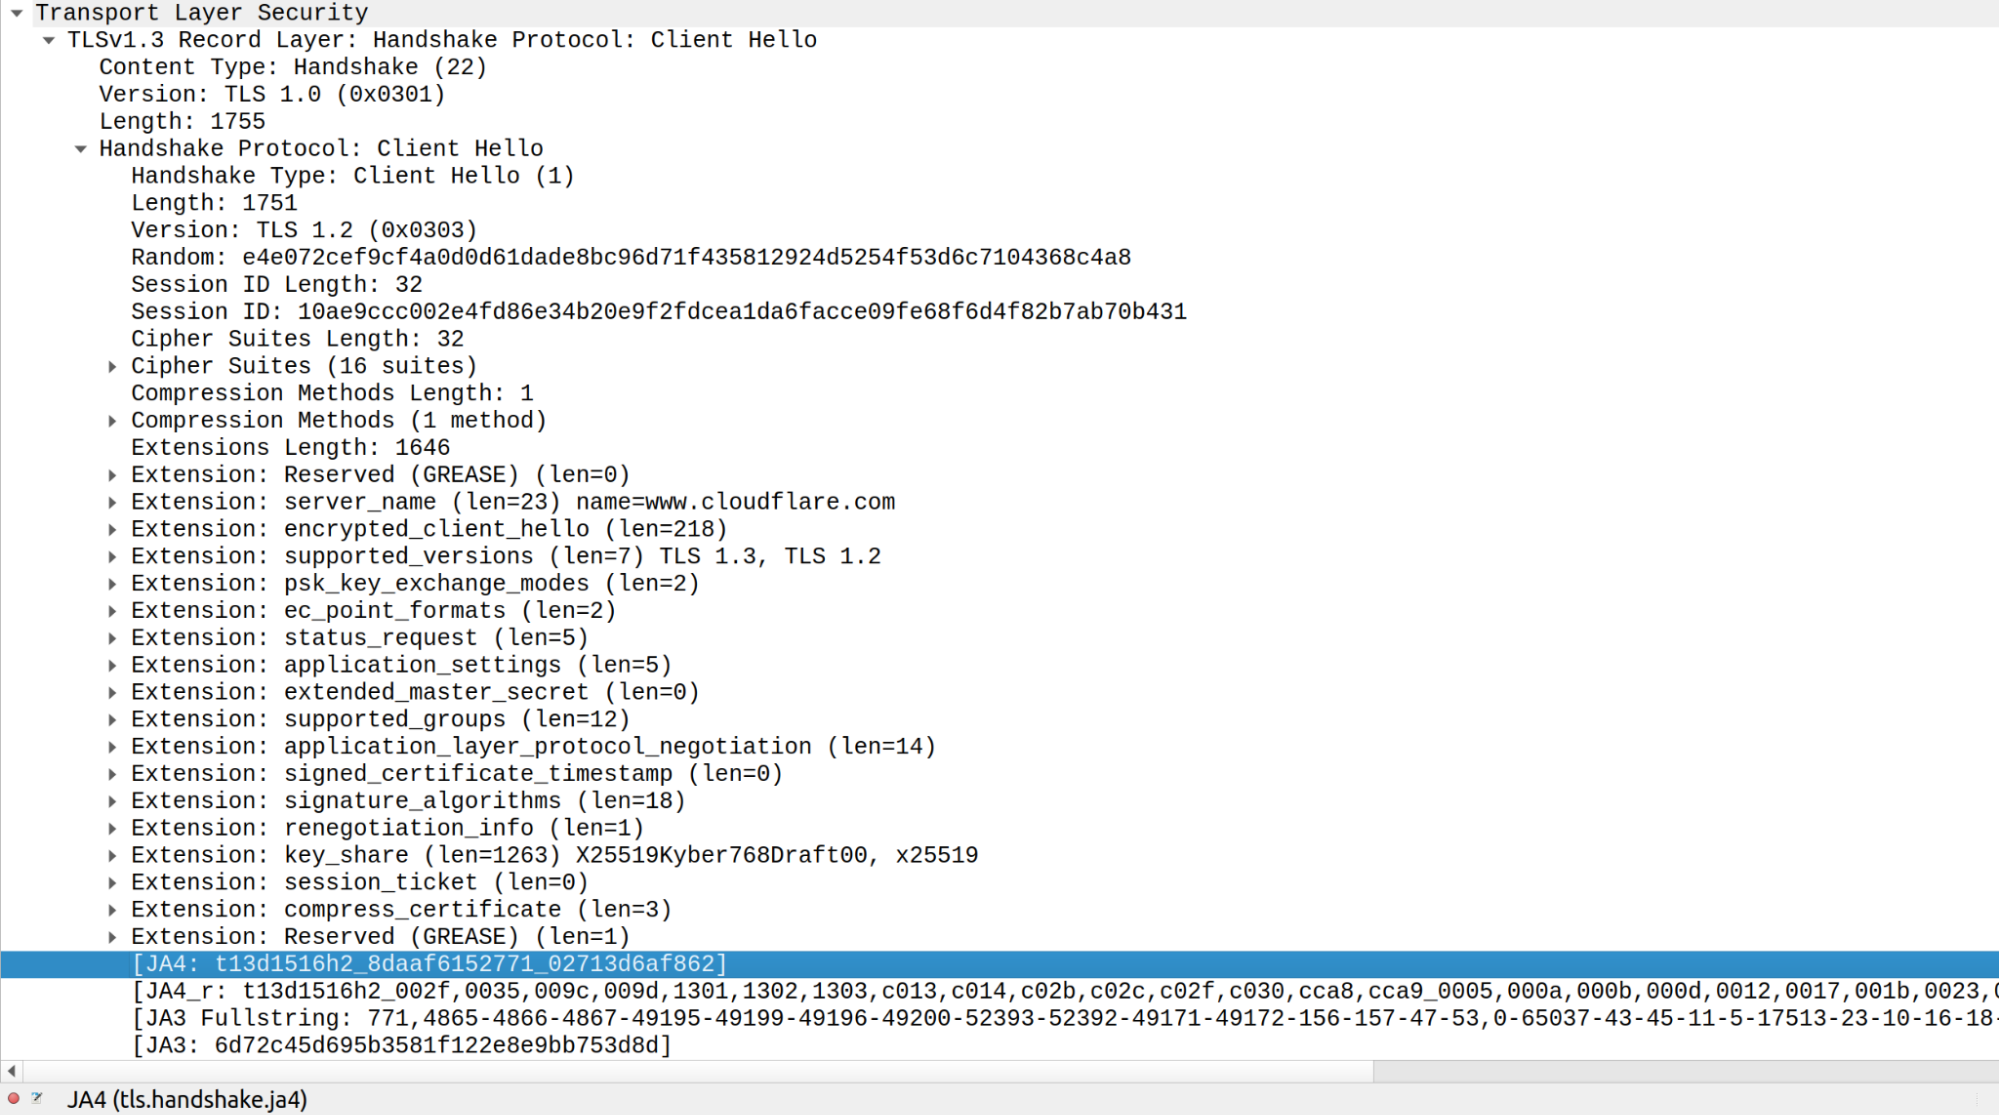
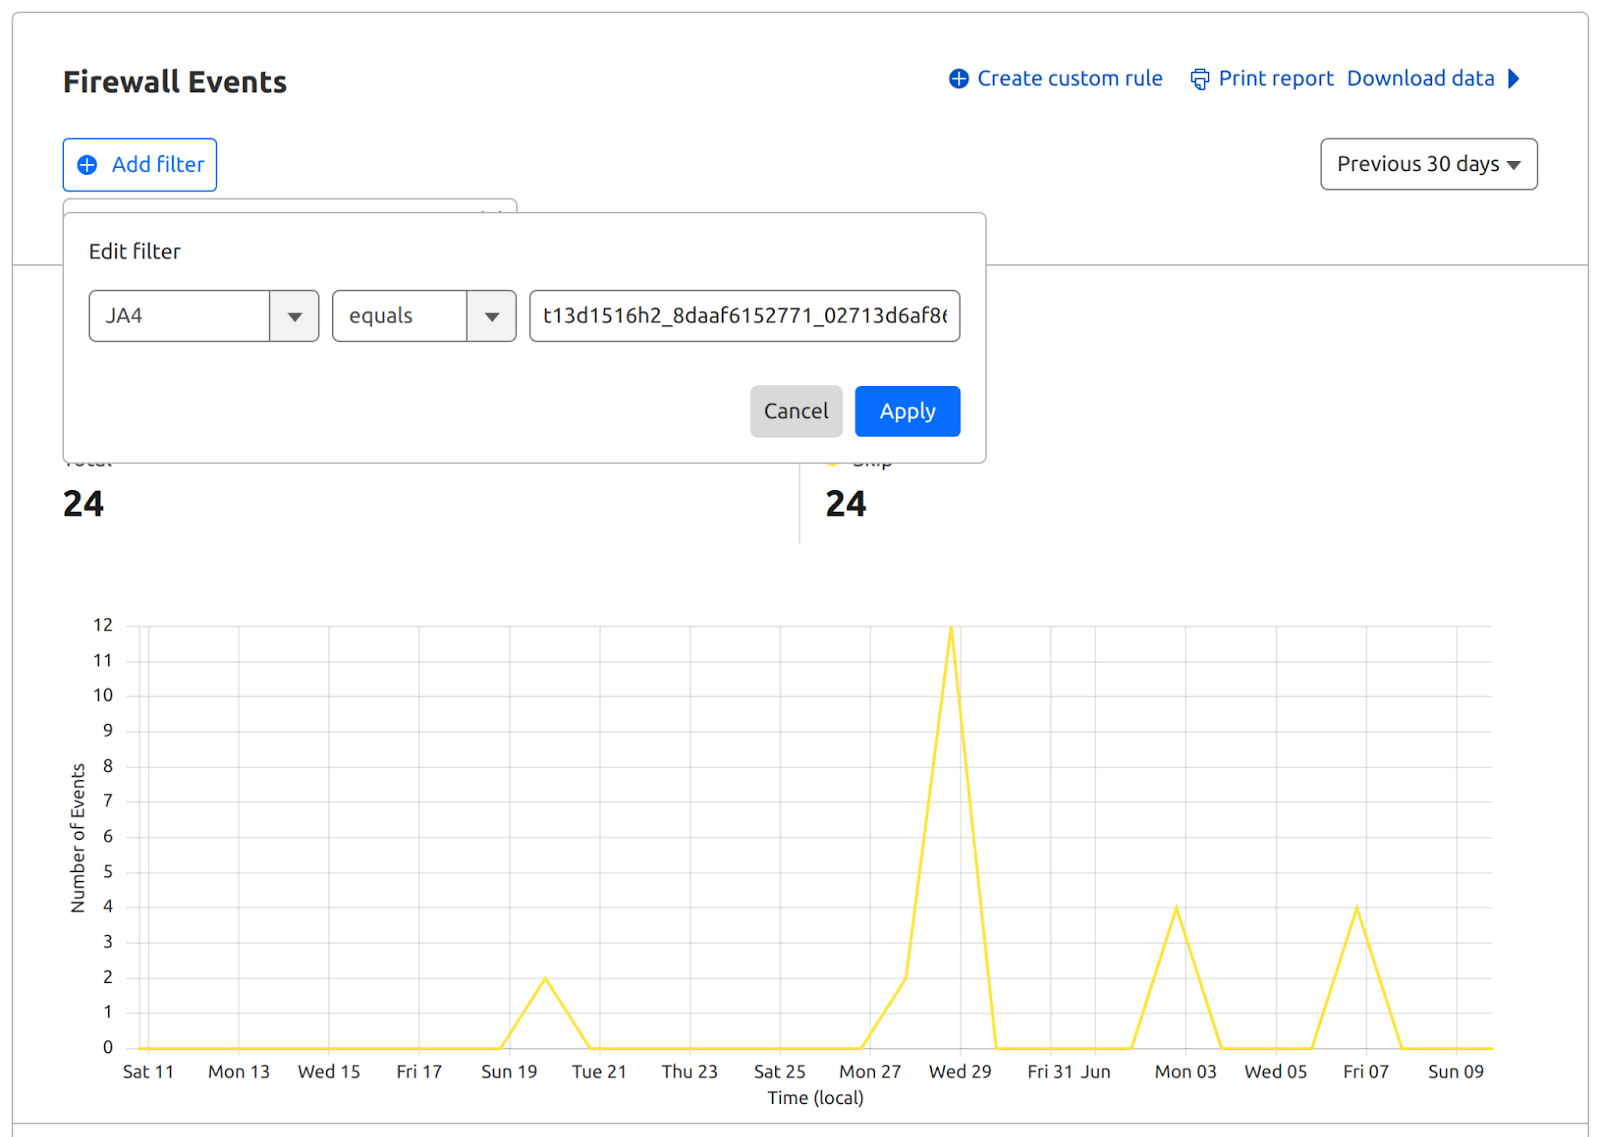
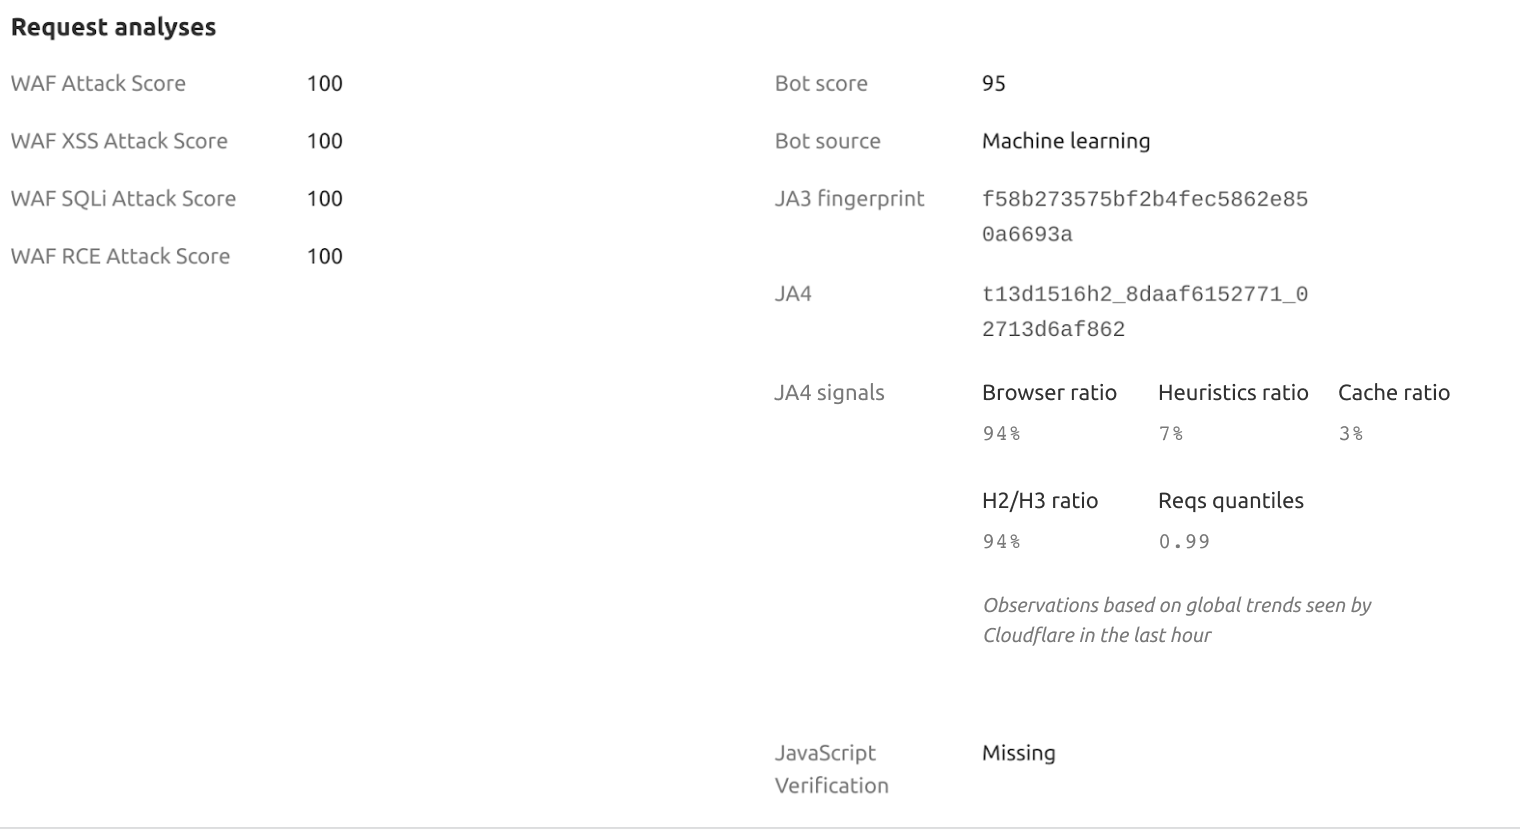


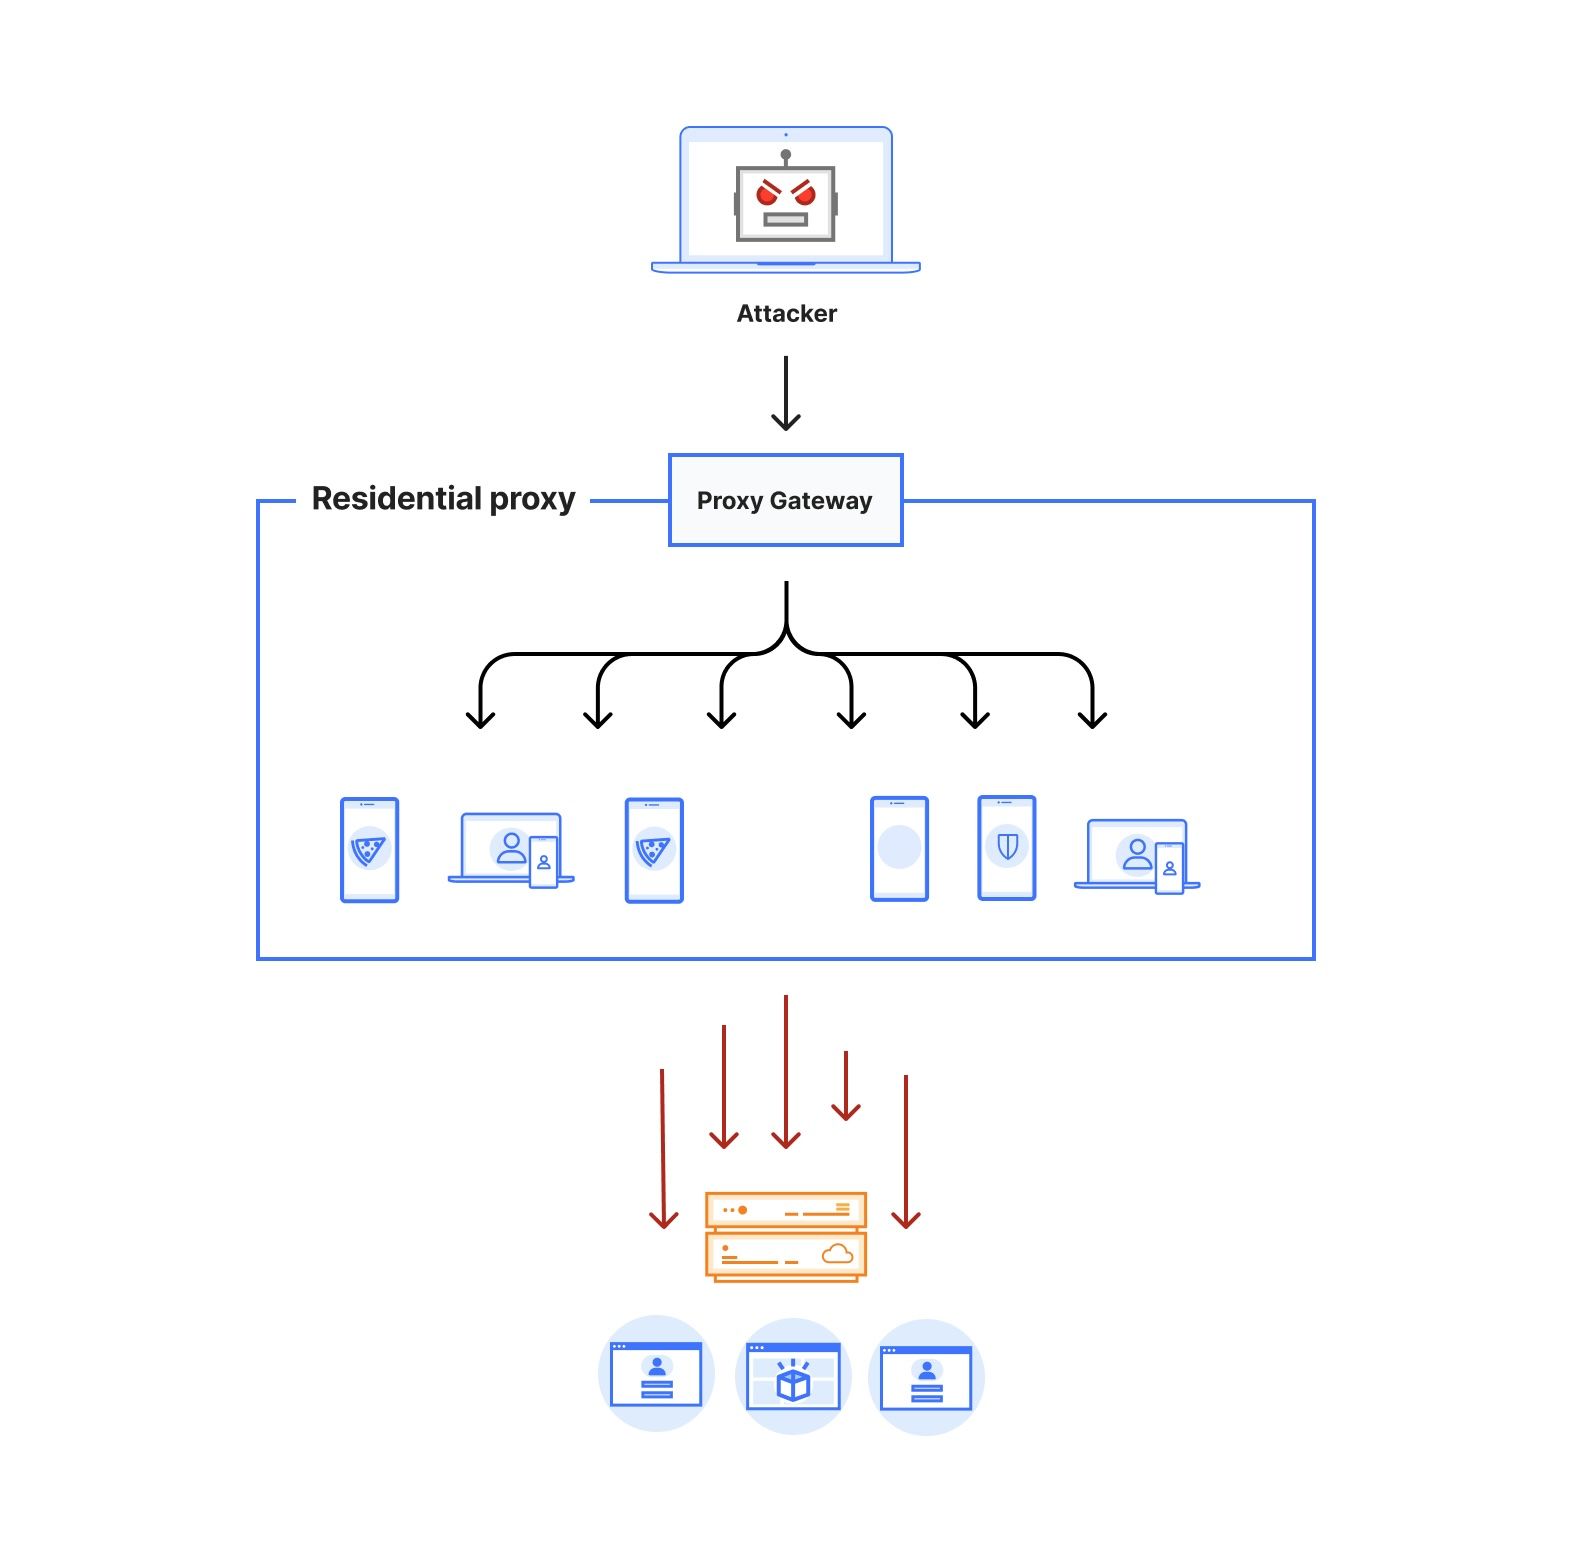
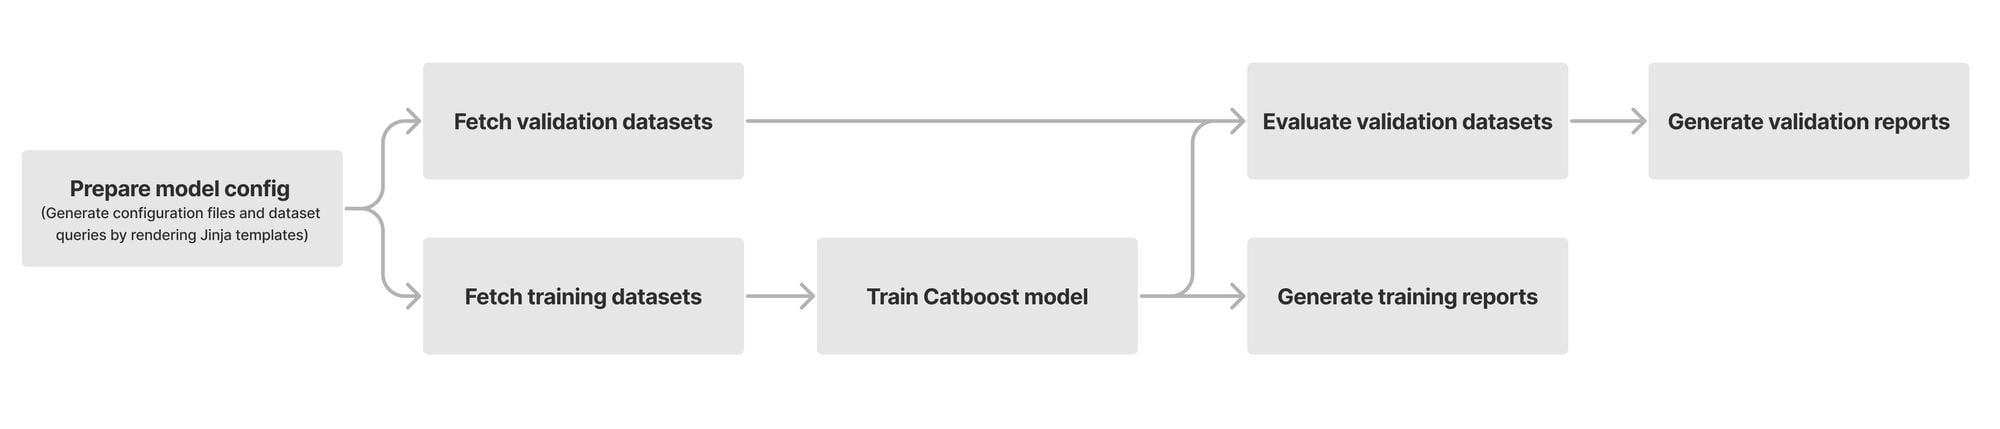
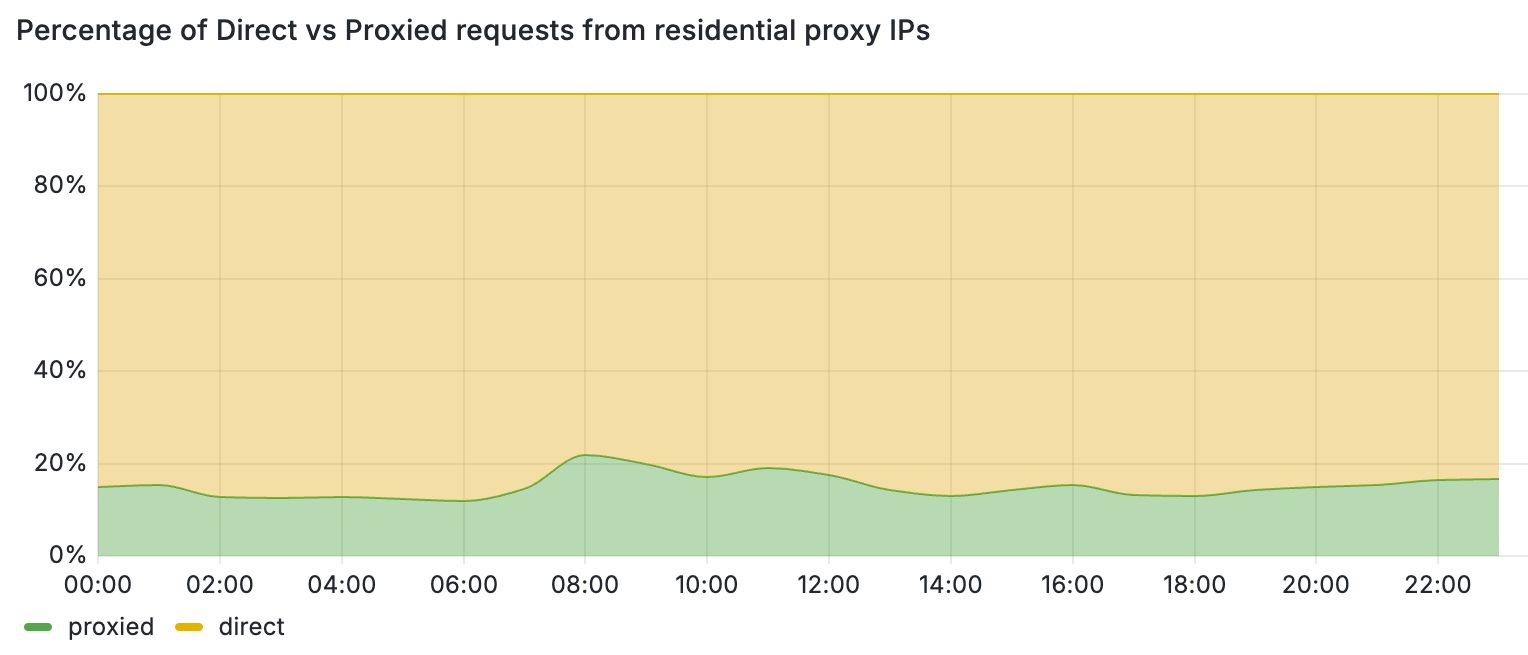
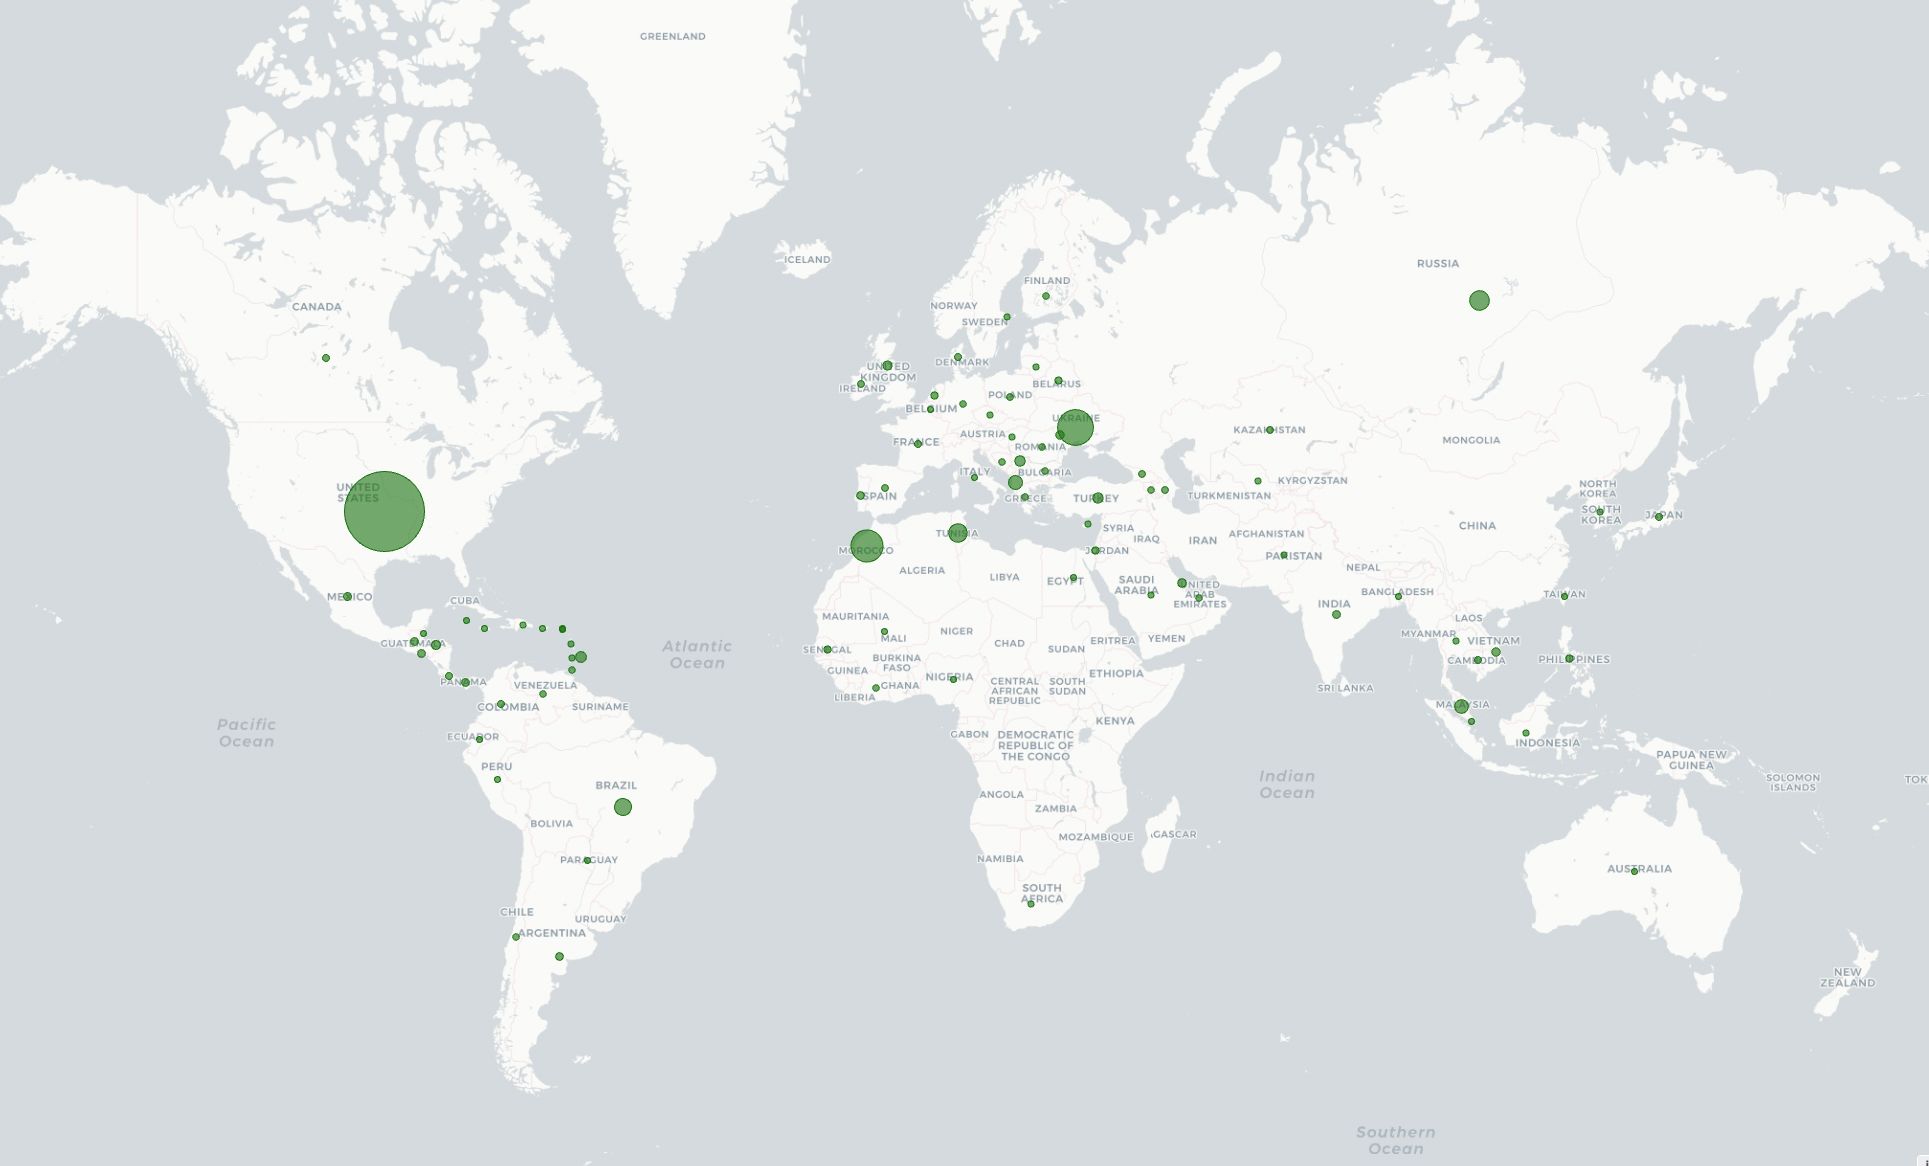
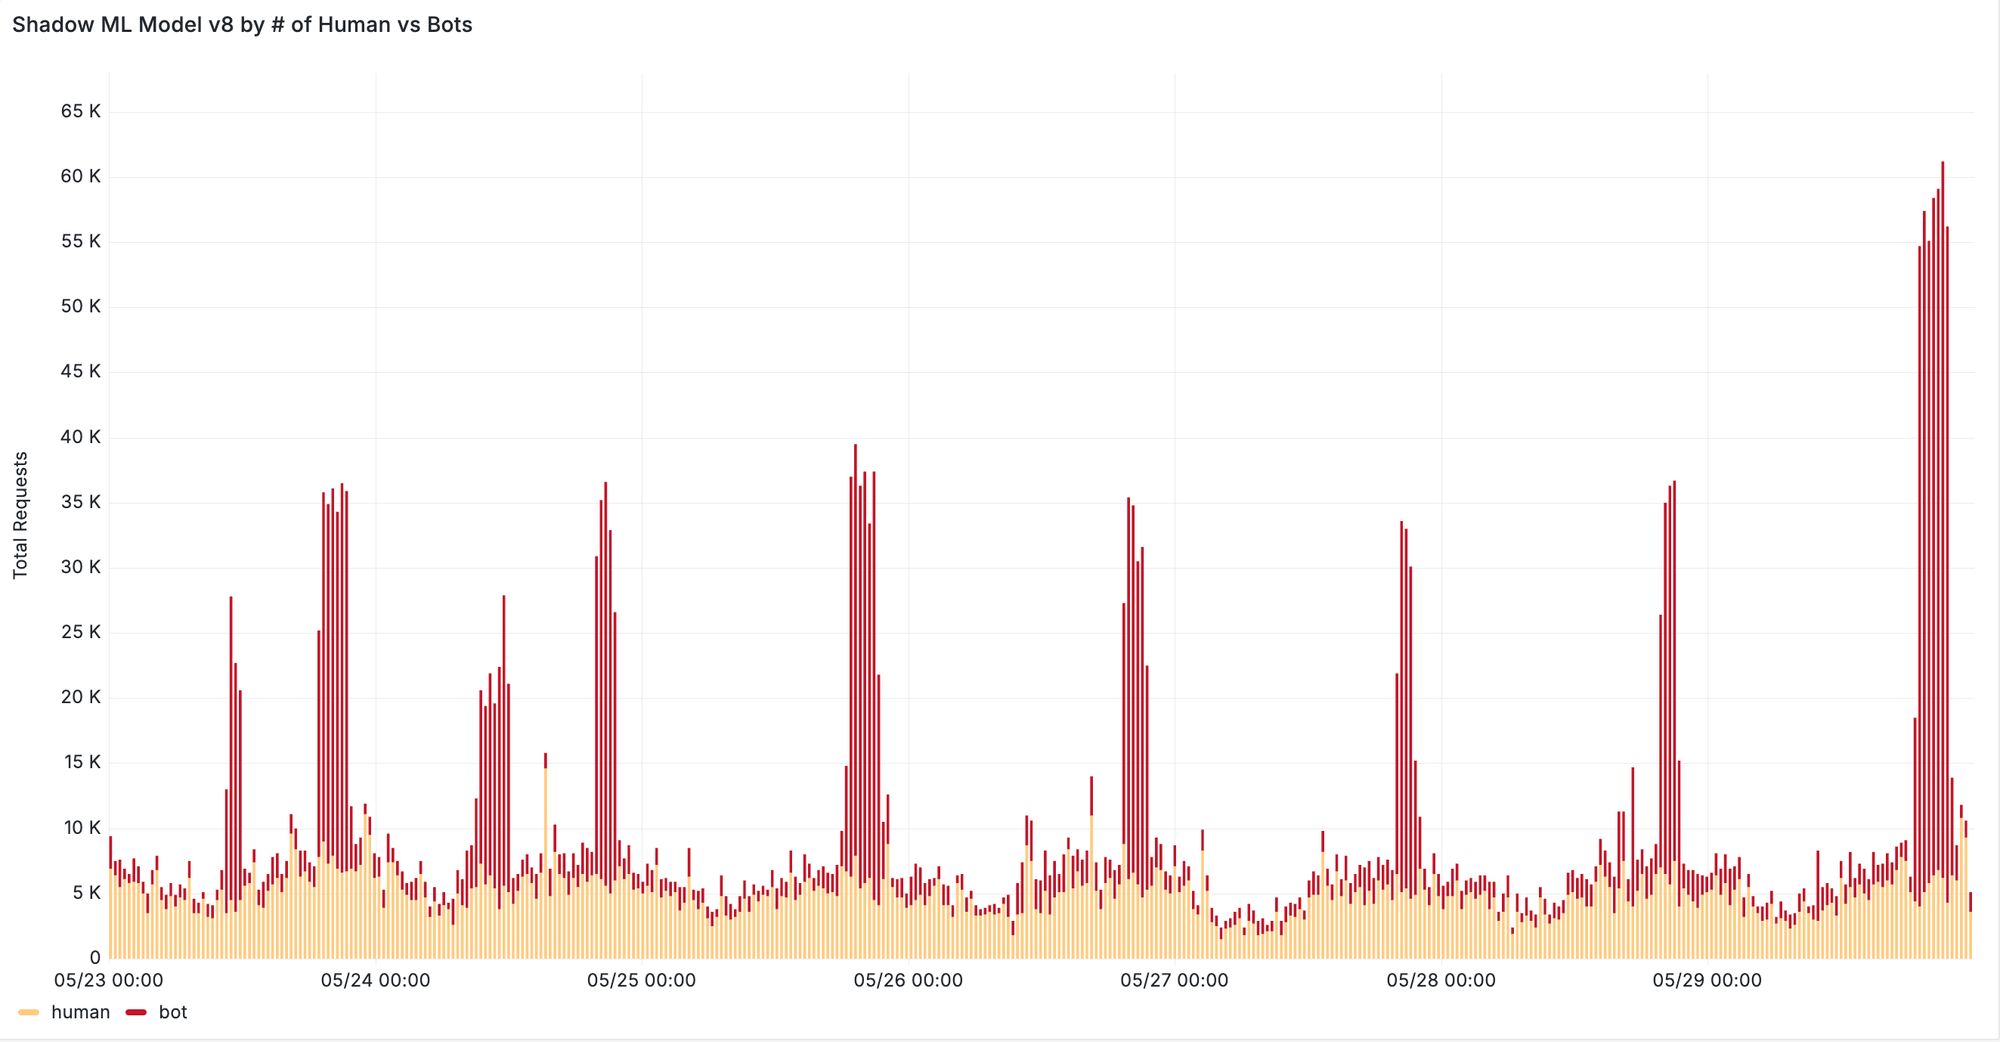

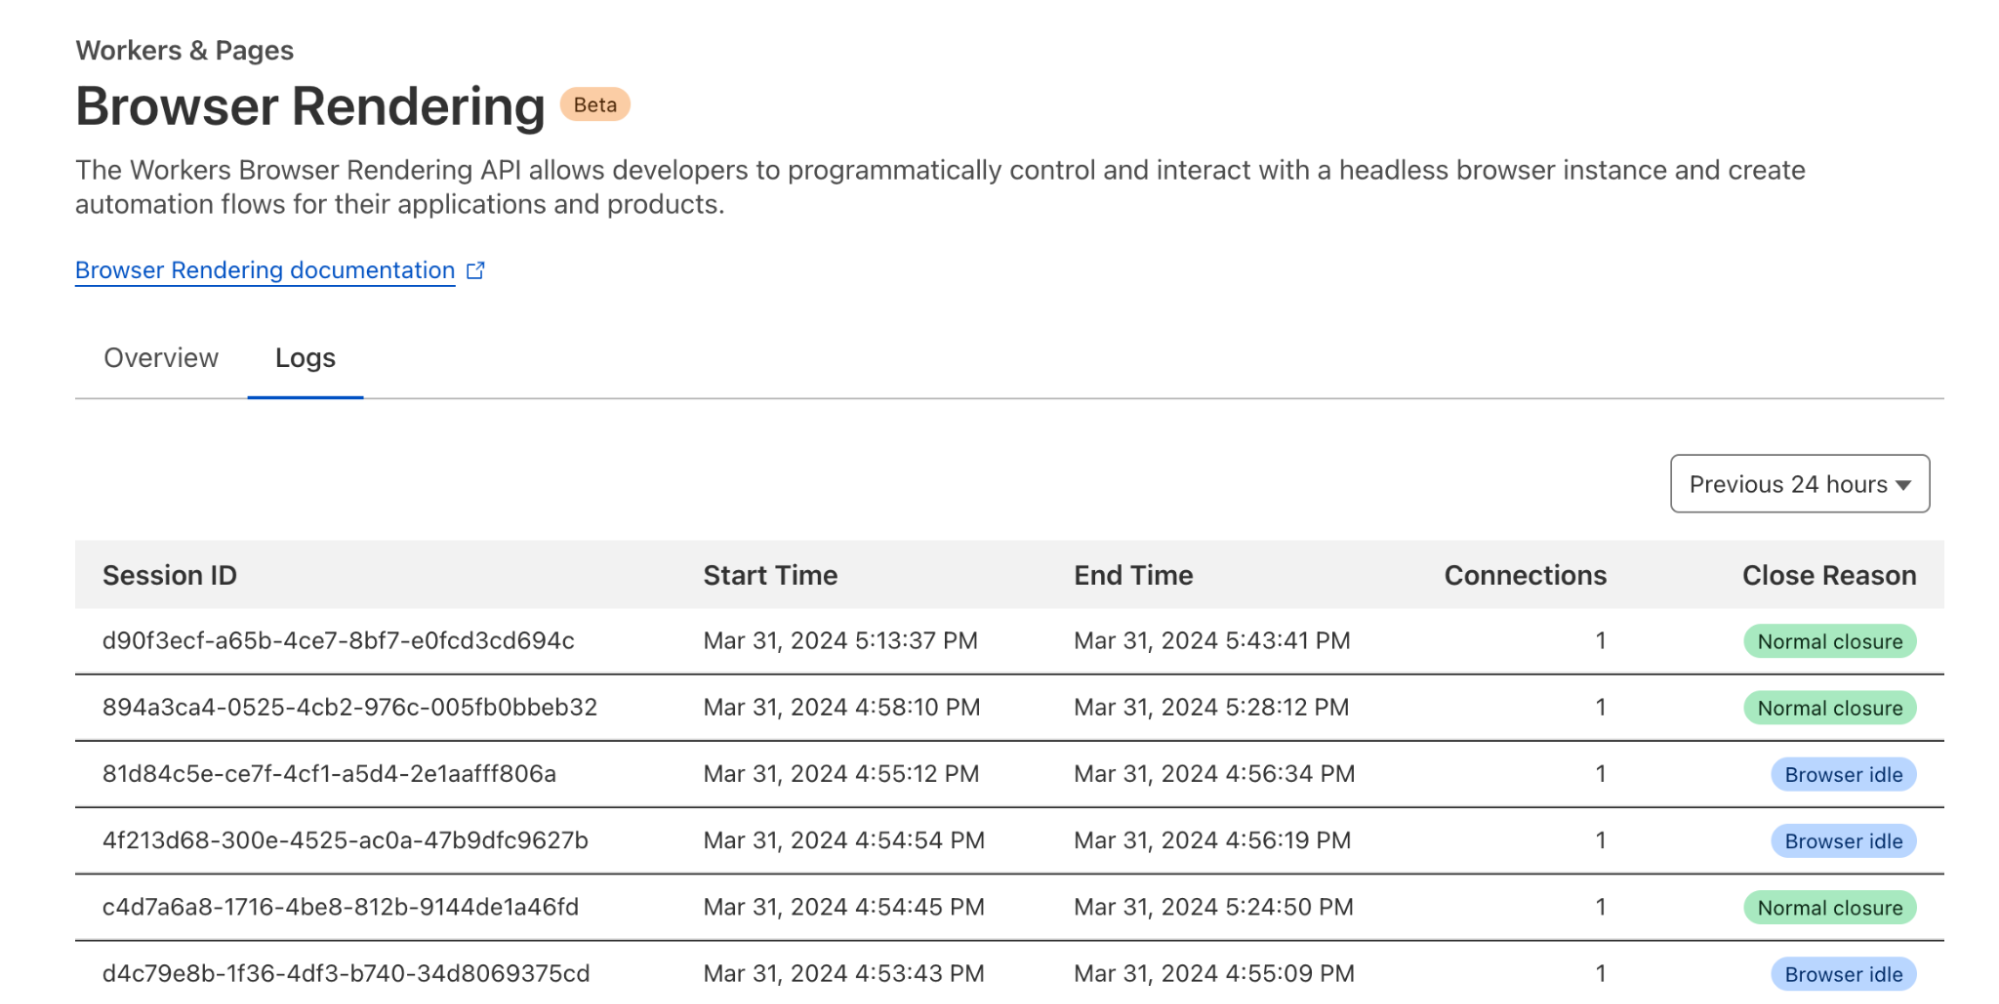
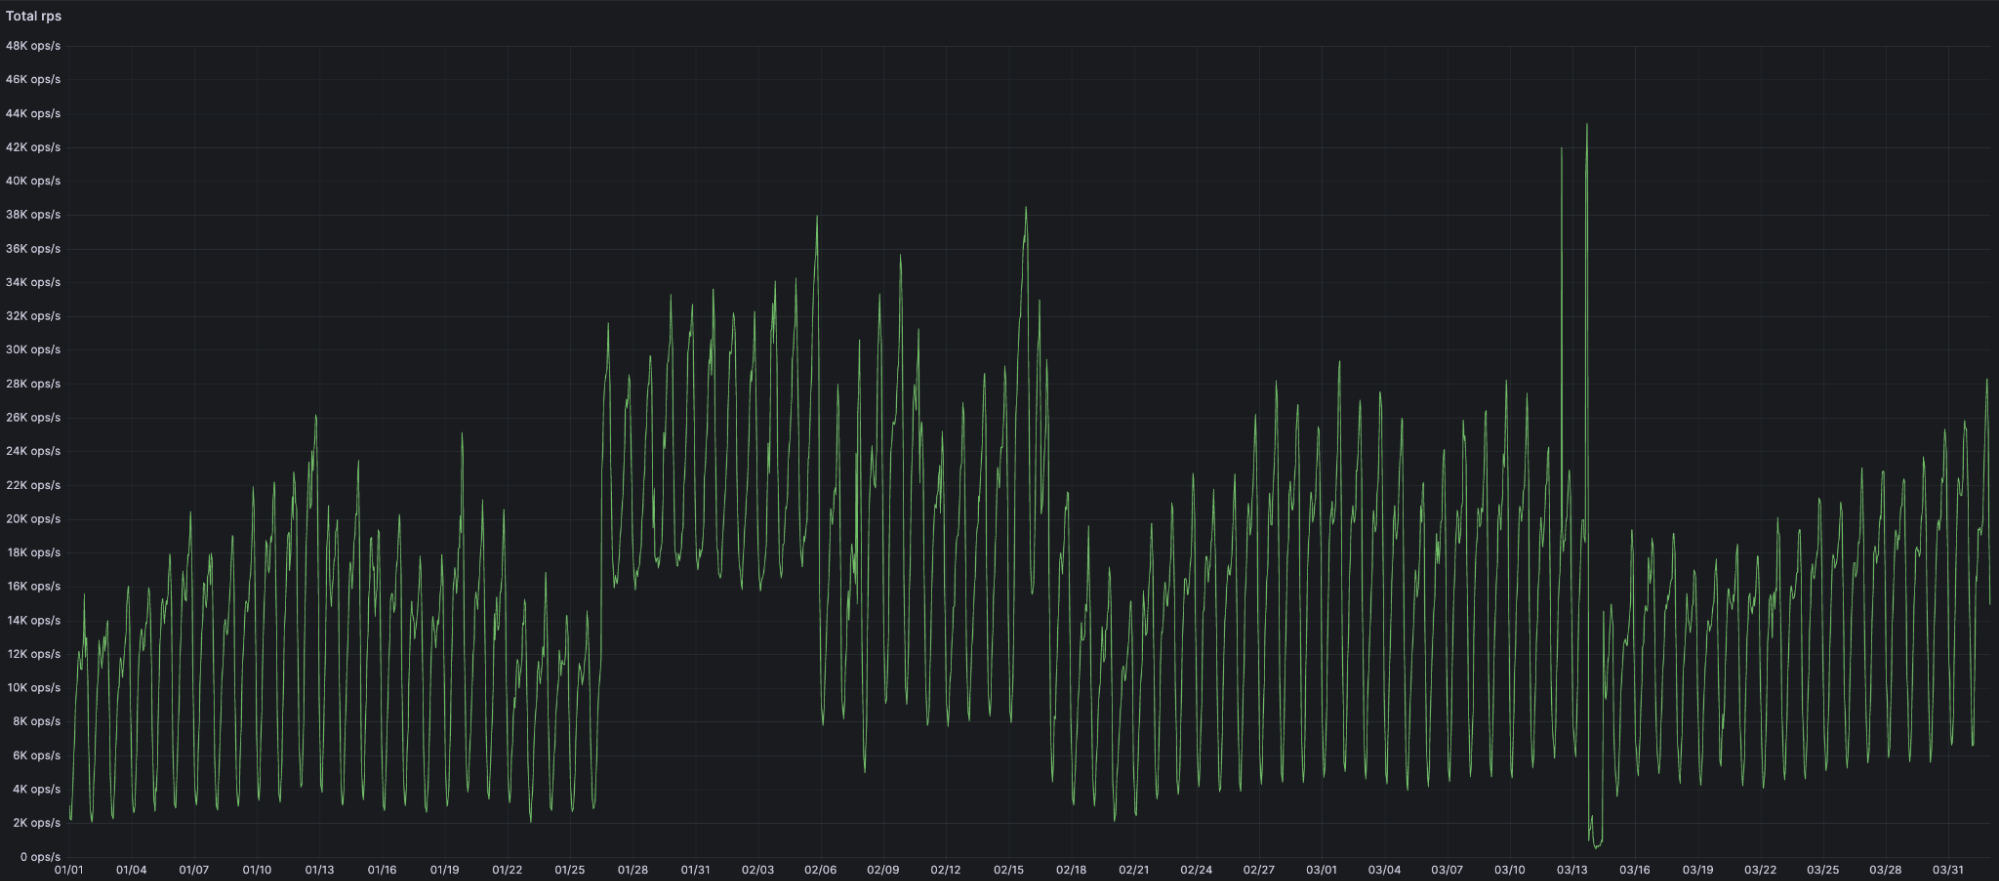
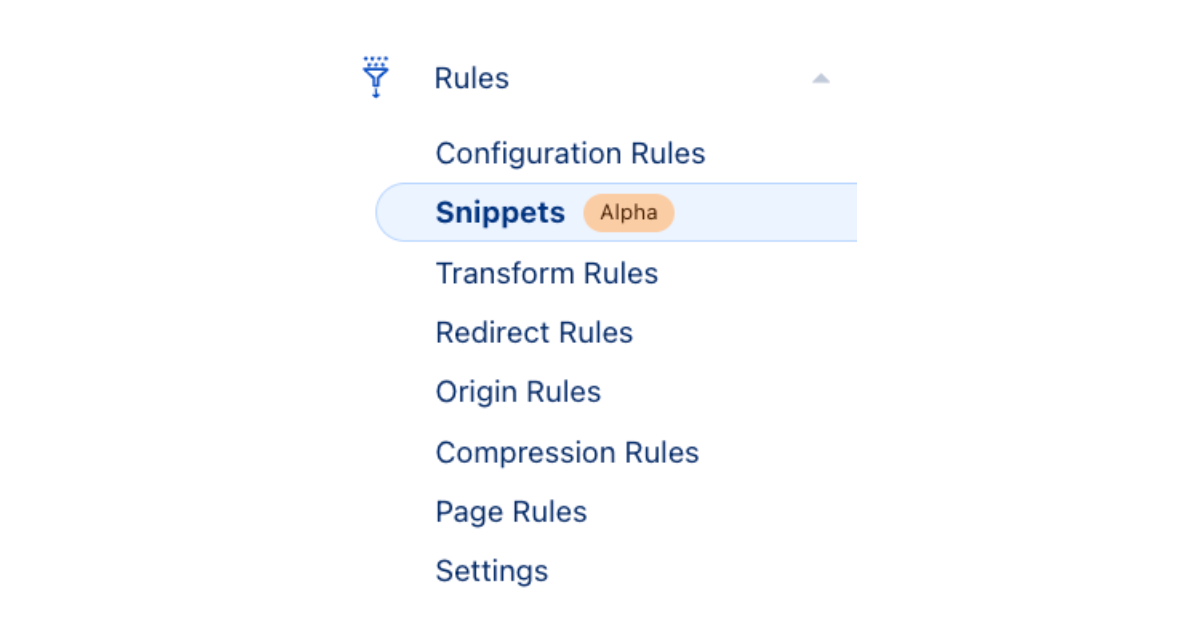

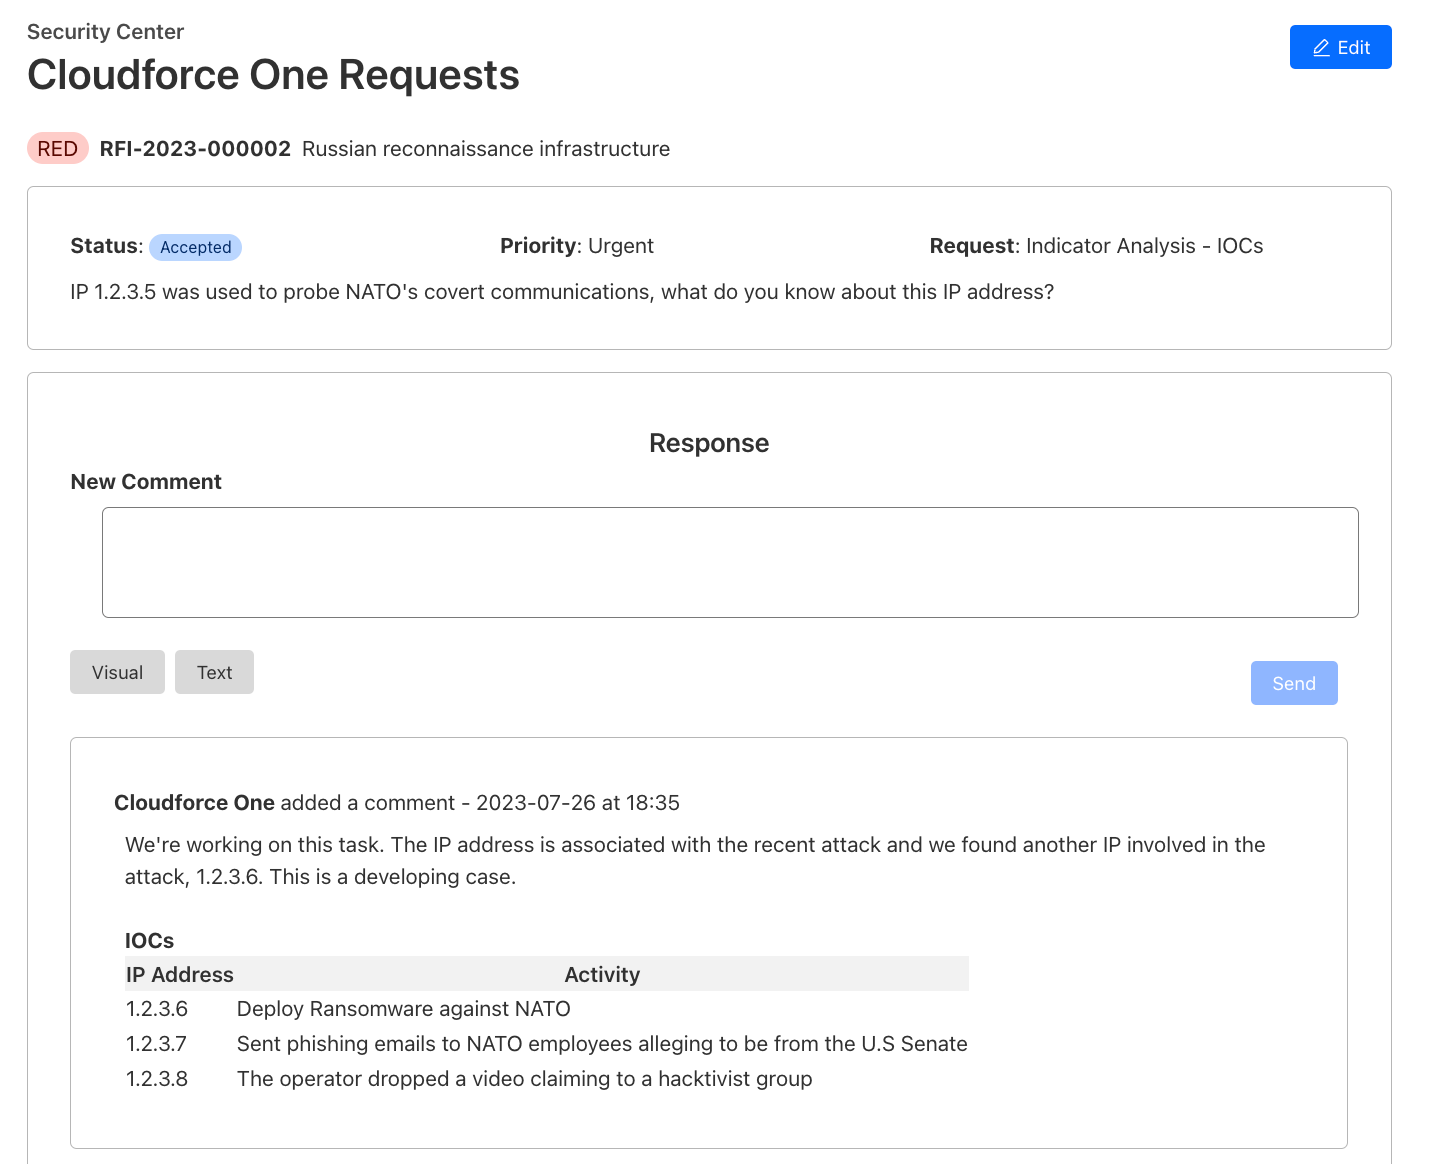
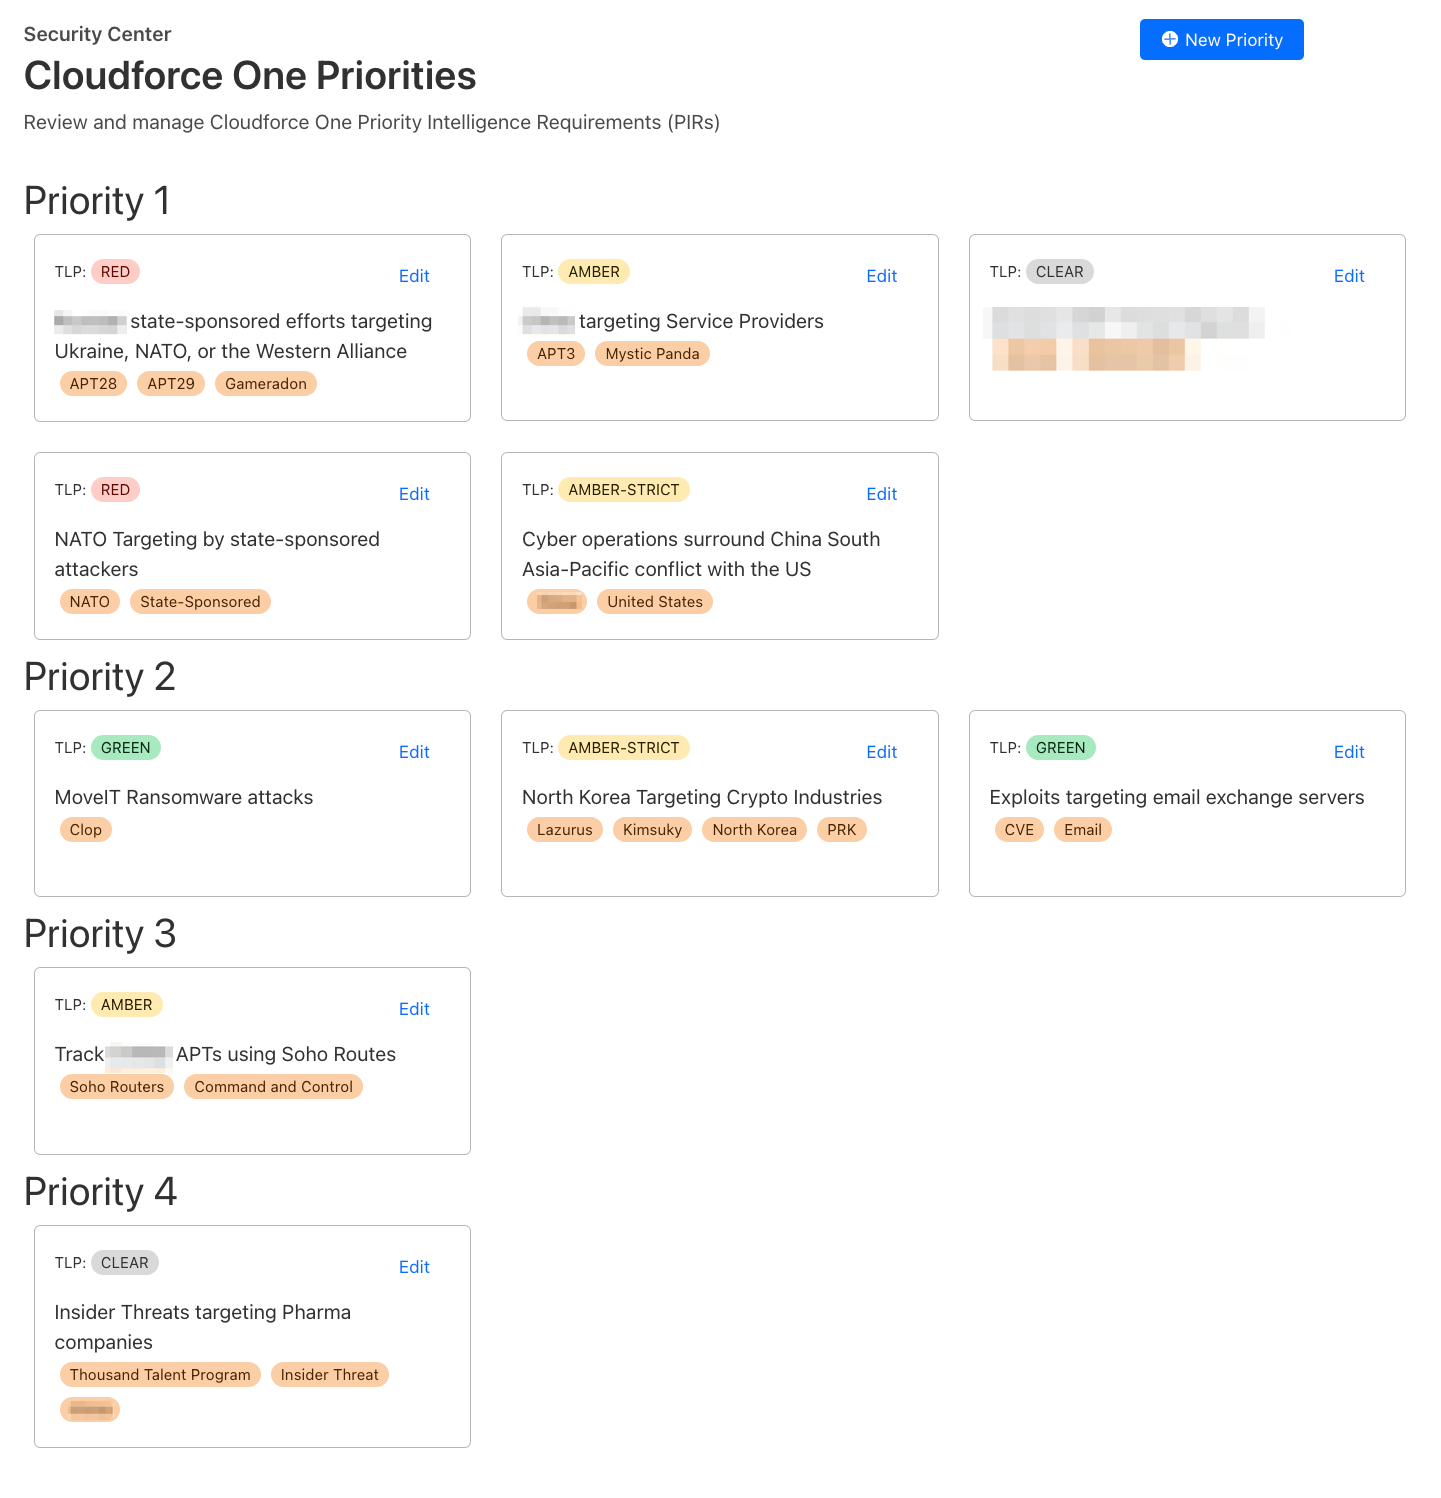
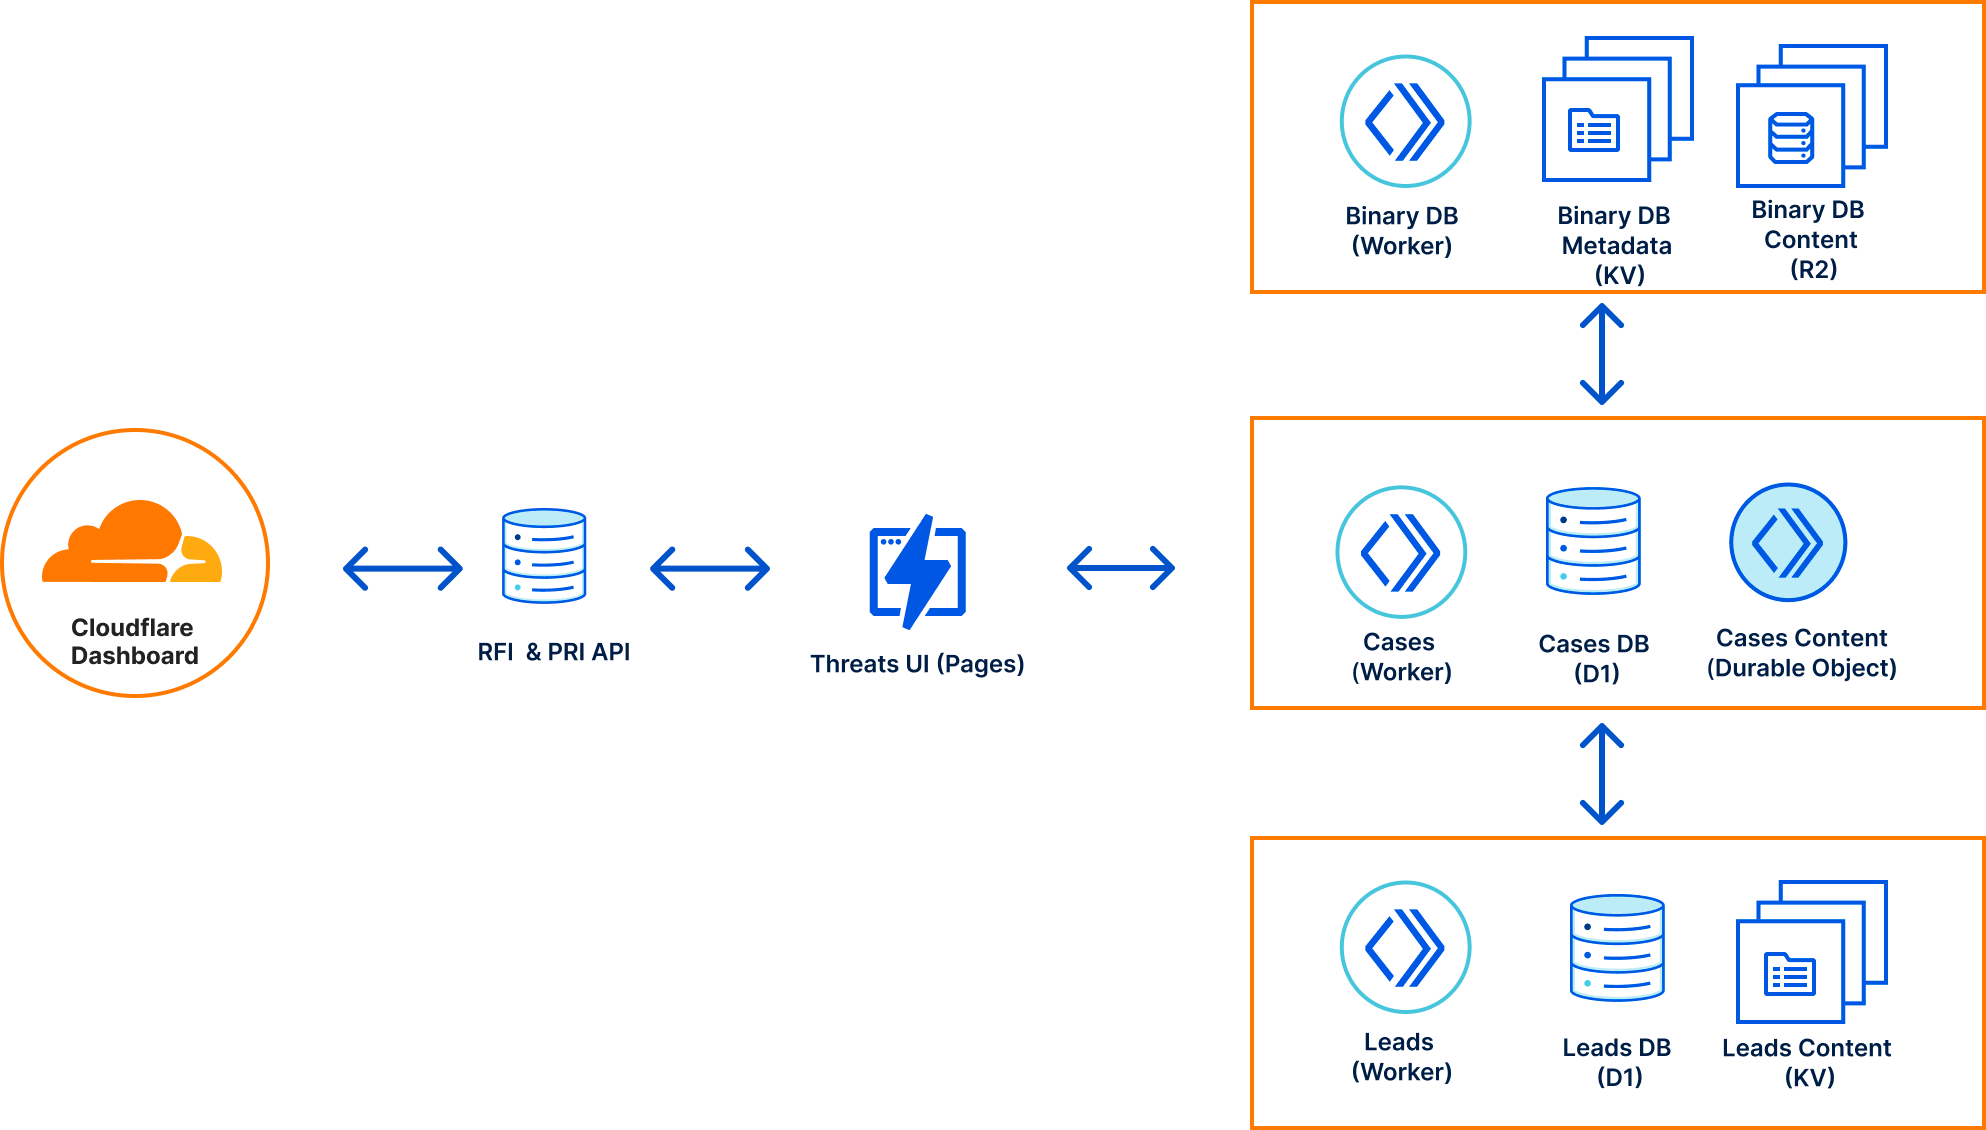
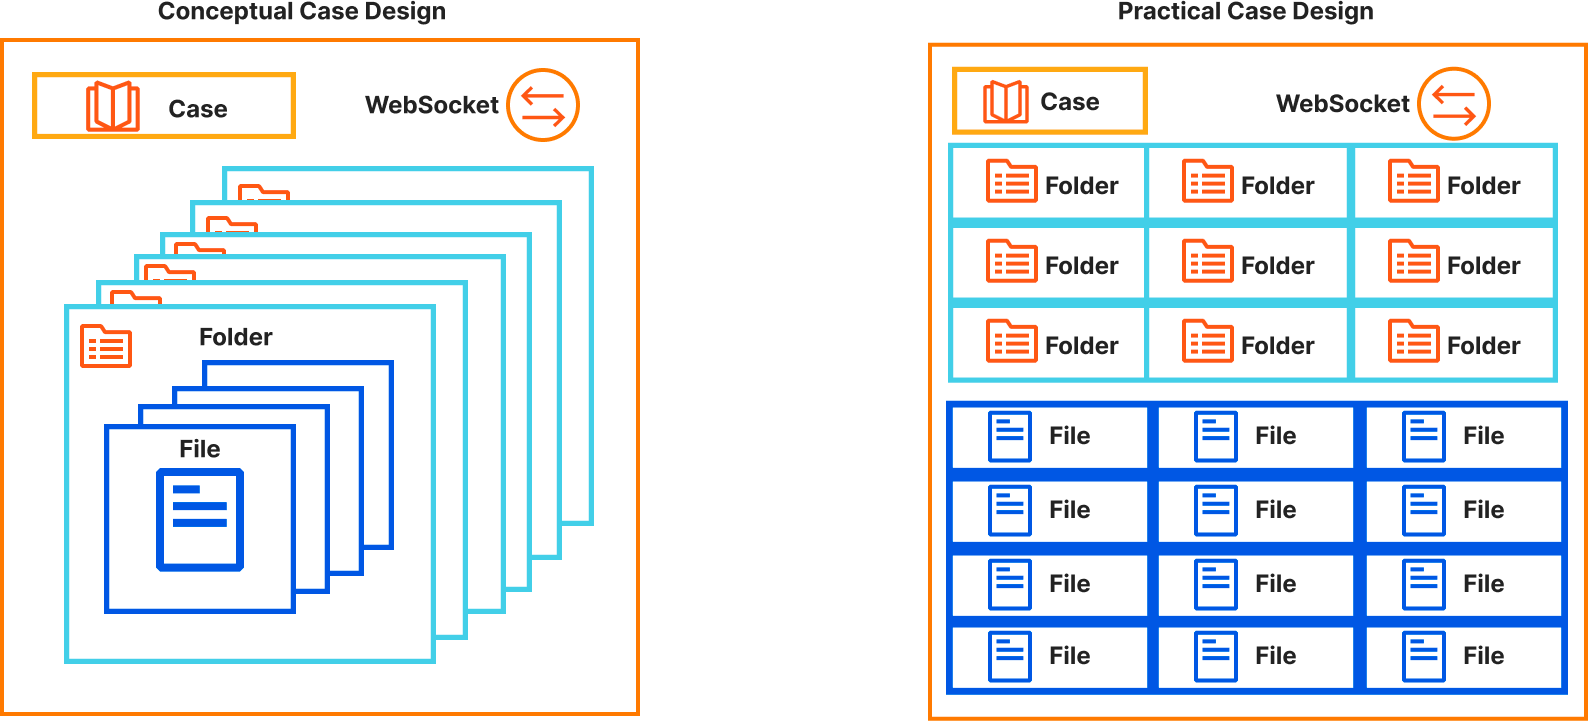
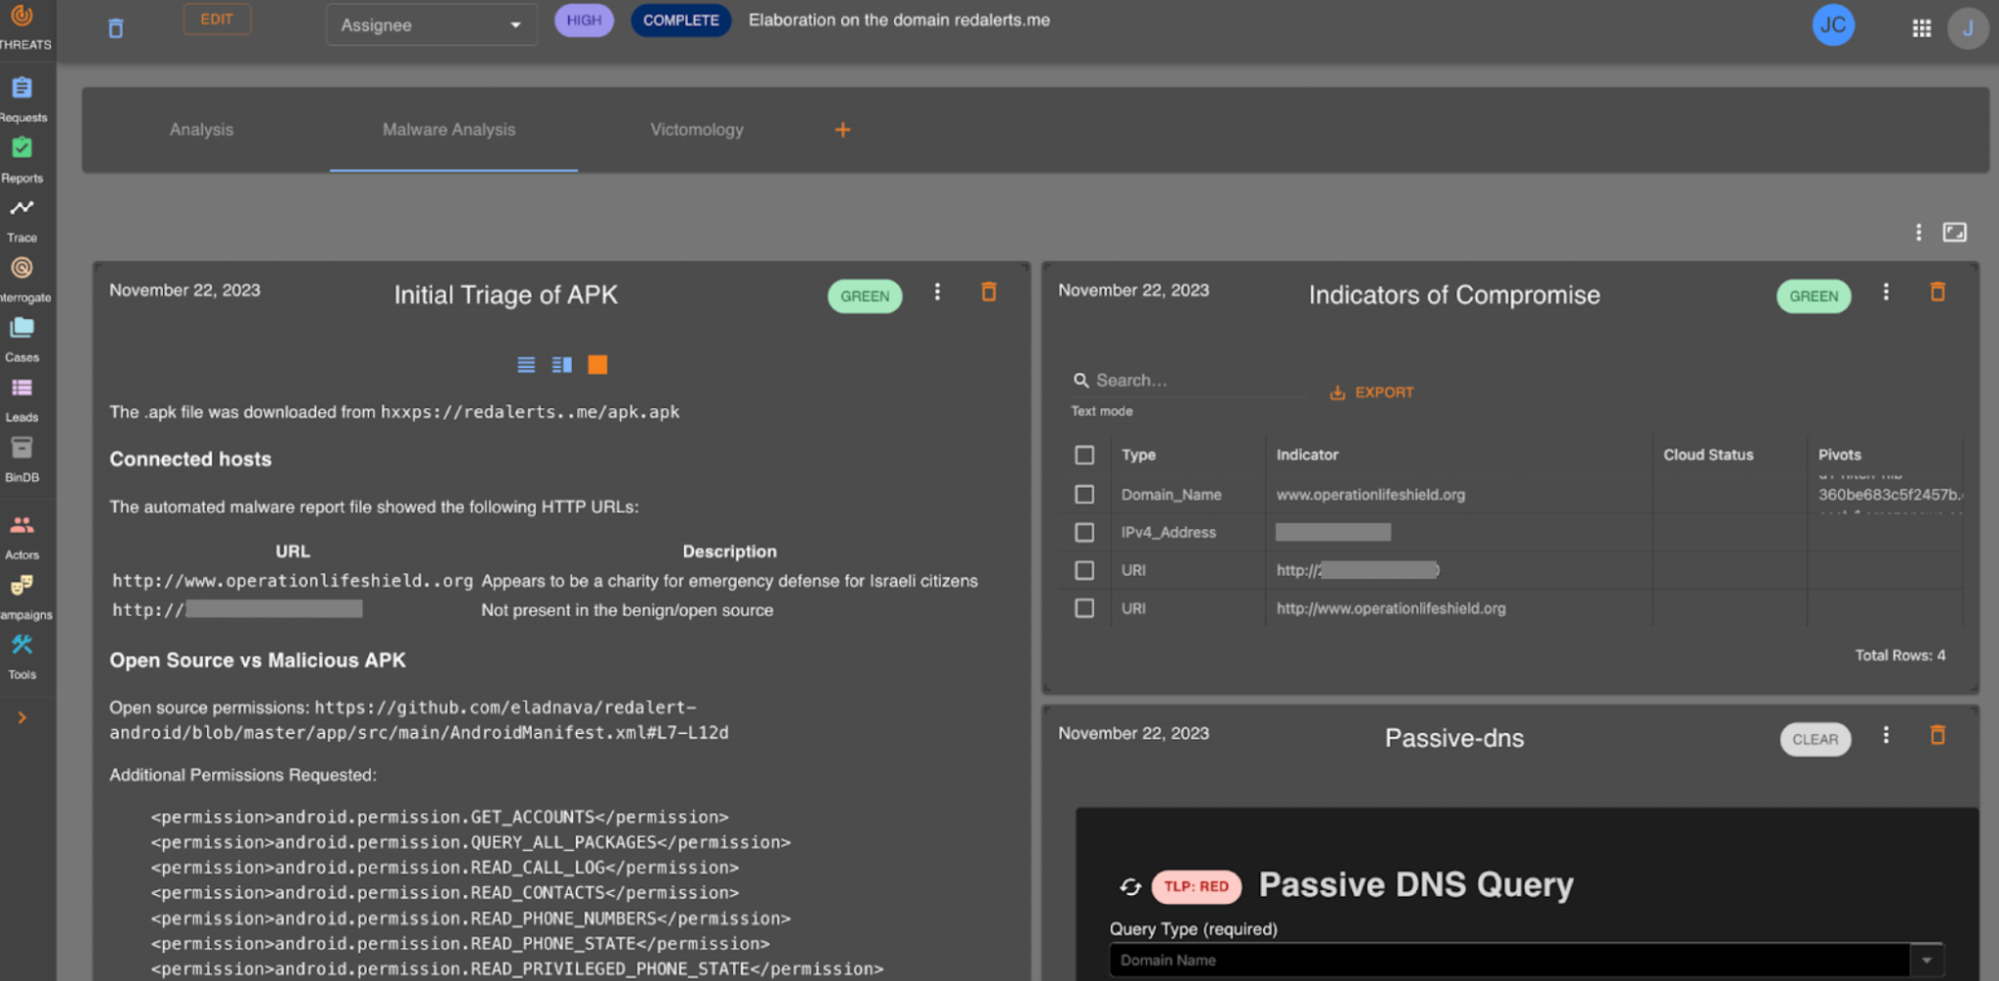
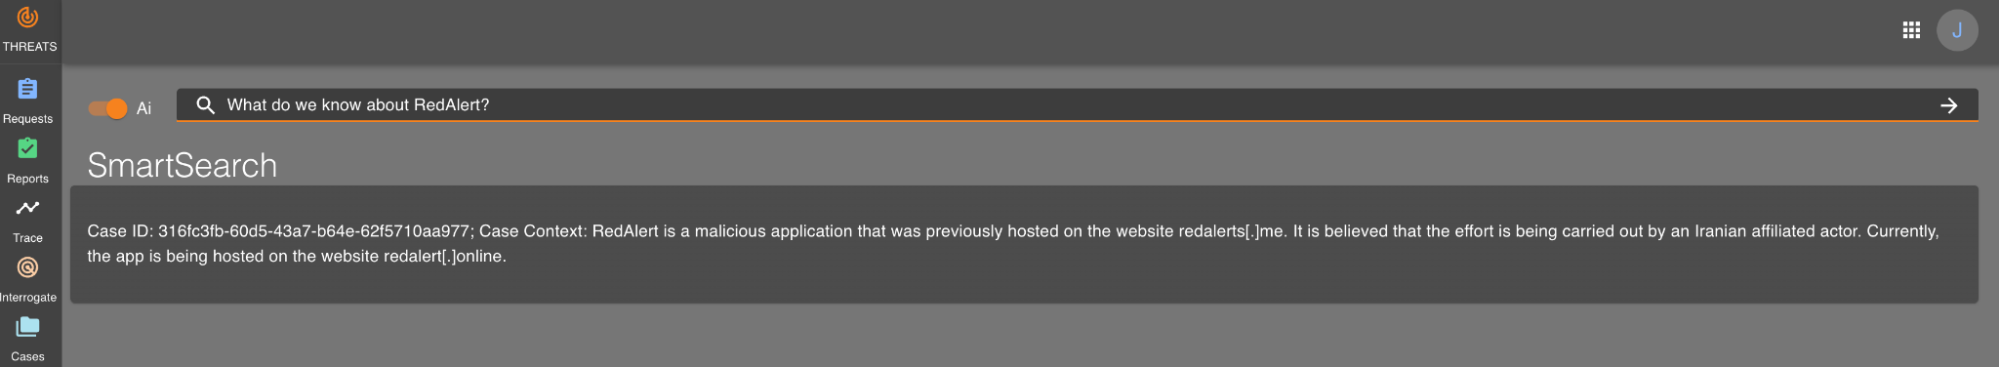
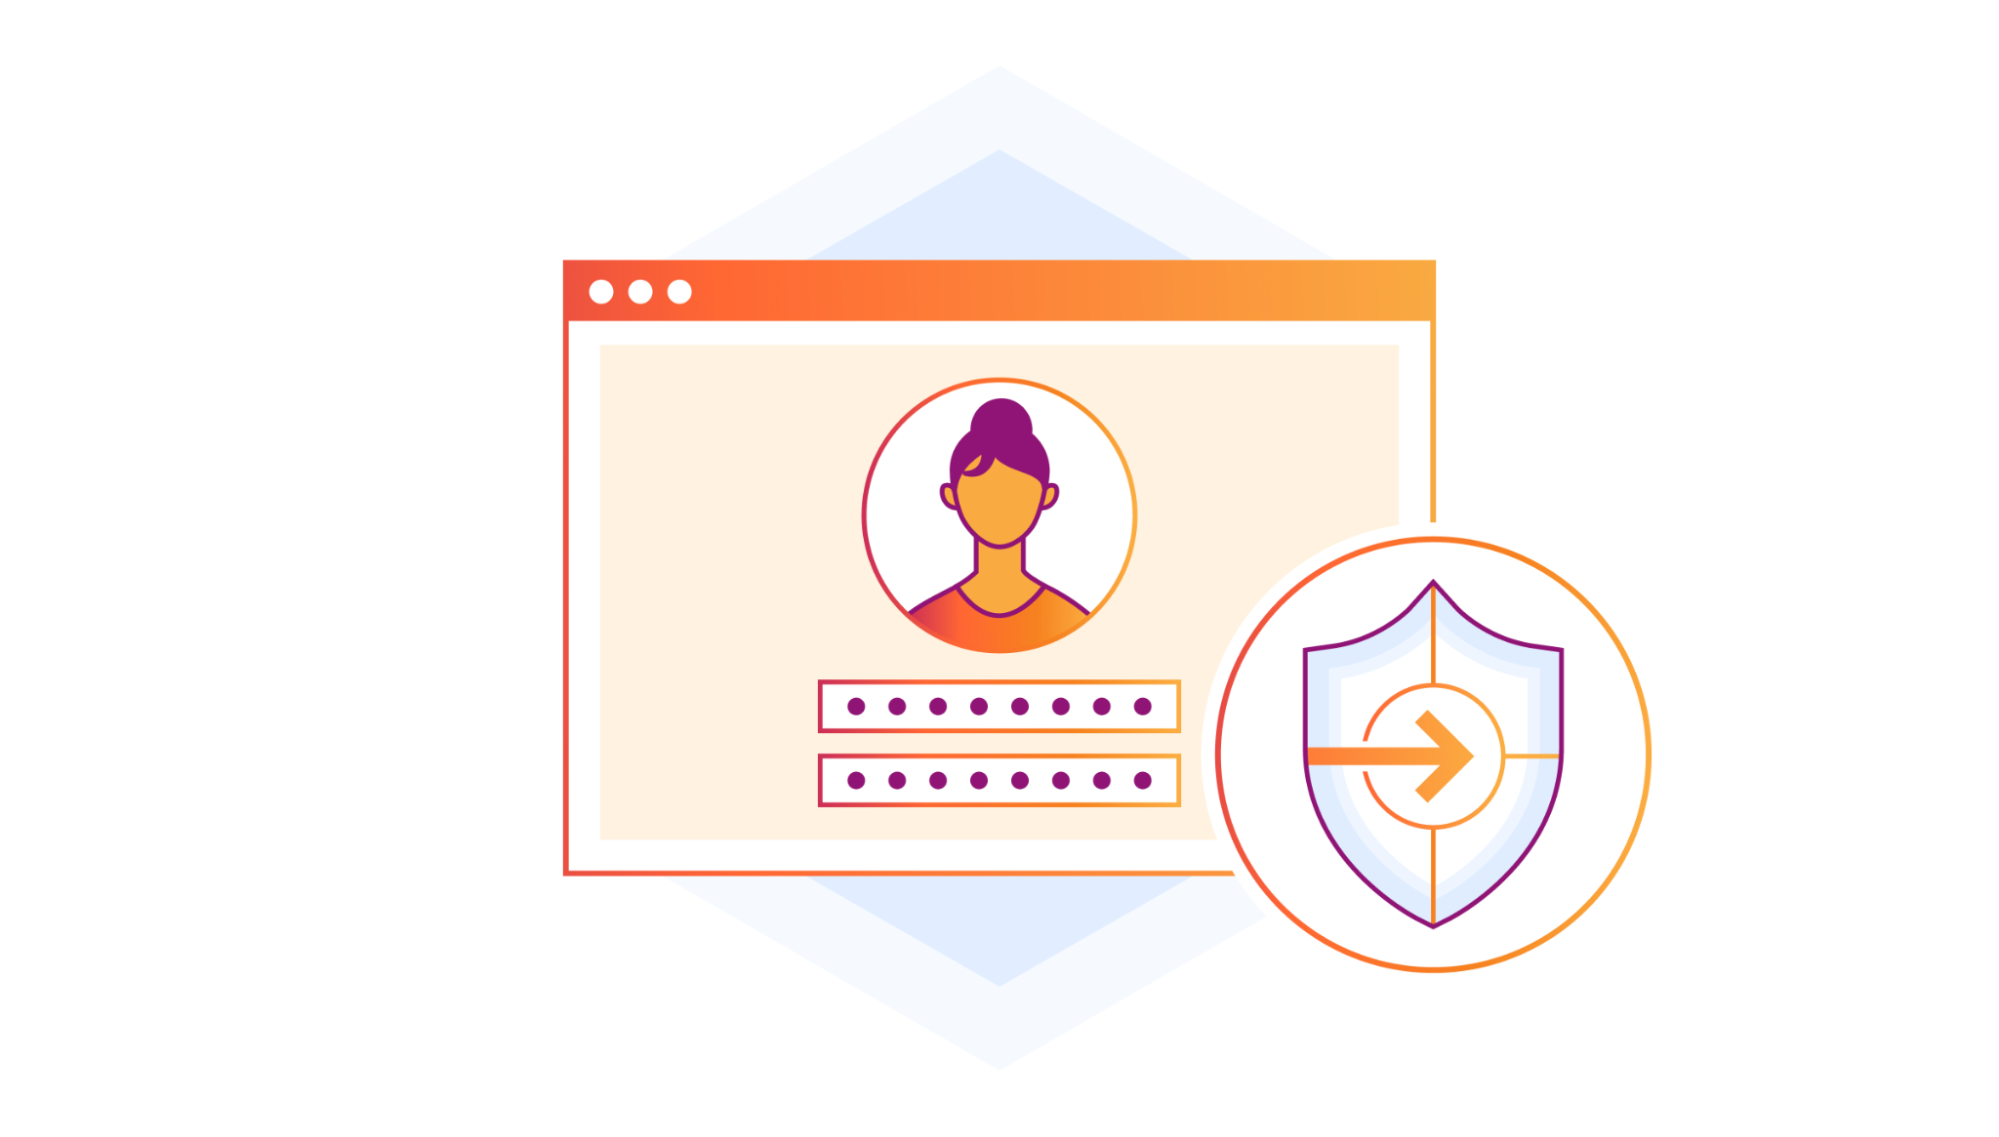
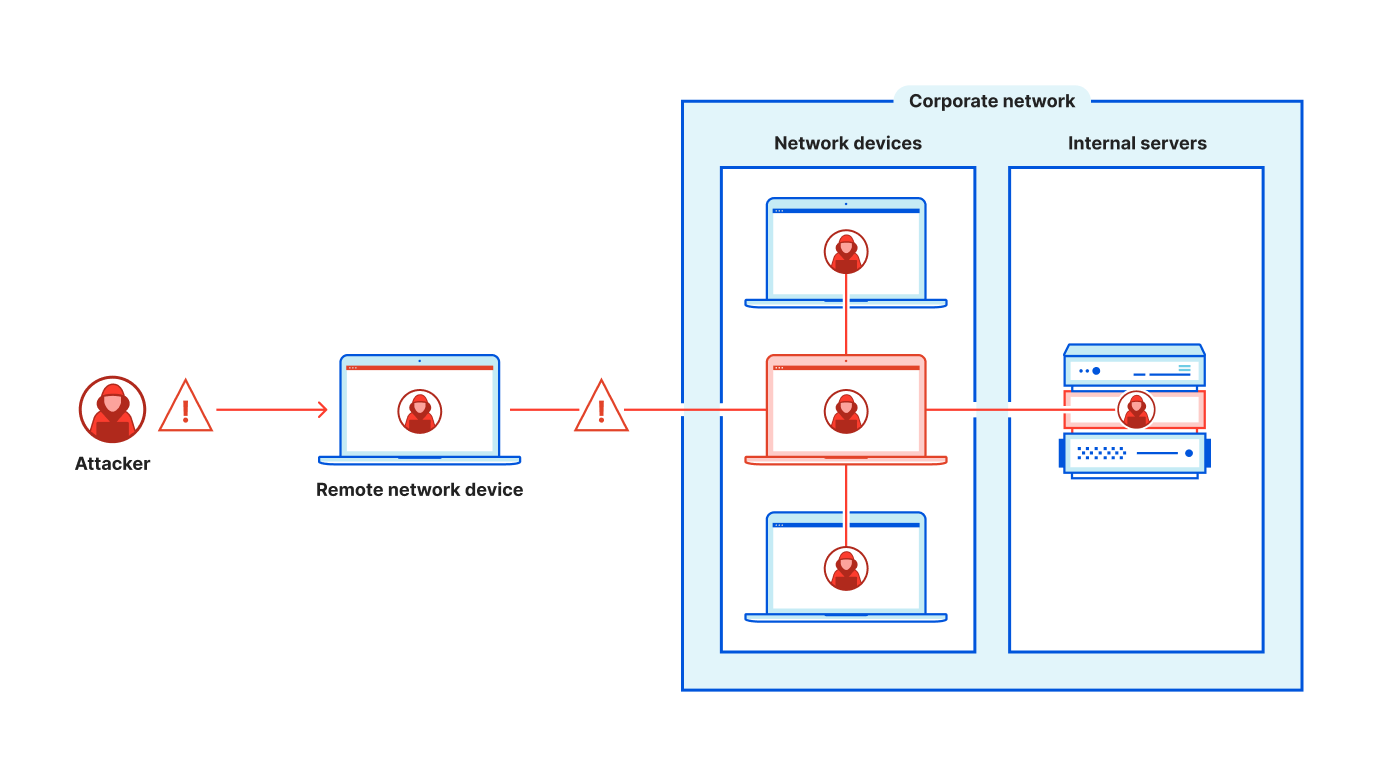