Post Syndicated from Hari Ohm Prasath original https://aws.amazon.com/blogs/big-data/unify-log-aggregation-and-analytics-across-compute-platforms/
Our customers want to make sure their users have the best experience running their application on AWS. To make this happen, you need to monitor and fix software problems as quickly as possible. Doing this gets challenging with the growing volume of data needing to be quickly detected, analyzed, and stored. In this post, we walk you through an automated process to aggregate and monitor logging-application data in near-real time, so you can remediate application issues faster.
This post shows how to unify and centralize logs across different computing platforms. With this solution, you can unify logs from Amazon Elastic Compute Cloud (Amazon EC2), Amazon Elastic Container Service (Amazon ECS), Amazon Elastic Kubernetes Service (Amazon EKS), Amazon Kinesis Data Firehose, and AWS Lambda using agents, log routers, and extensions. We use Amazon OpenSearch Service (successor to Amazon Elasticsearch Service) with OpenSearch Dashboards to visualize and analyze the logs, collected across different computing platforms to get application insights. You can deploy the solution using the AWS Cloud Development Kit (AWS CDK) scripts provided as part of the solution.
Customer benefits
A unified aggregated log system provides the following benefits:
- A single point of access to all the logs across different computing platforms
- Help defining and standardizing the transformations of logs before they get delivered to downstream systems like Amazon Simple Storage Service (Amazon S3), Amazon OpenSearch Service, Amazon Redshift, and other services
- The ability to use Amazon OpenSearch Service to quickly index, and OpenSearch Dashboards to search and visualize logs from its routers, applications, and other devices
Solution overview
In this post, we use the following services to demonstrate log aggregation across different compute platforms:
- Amazon EC2 – A web service that provides secure, resizable compute capacity in the cloud. It’s designed to make web-scale cloud computing easier for developers.
- Amazon ECS – A web service that makes it easy to run, scale, and manage Docker containers on AWS, designed to make the Docker experience easier for developers.
- Amazon EKS – A web service that makes it easy to run, scale, and manage Docker containers on AWS.
- Kinesis Data Firehose – A fully managed service that makes it easy to stream data to Amazon S3, Amazon Redshift, or Amazon OpenSearch Service.
- Lambda – A compute service that lets you run code without provisioning or managing servers. It’s designed to make web-scale cloud computing easier for developers.
- Amazon OpenSearch Service – A fully managed service that makes it easy for you to perform interactive log analytics, real-time application monitoring, website search, and more.
The following diagram shows the architecture of our solution.
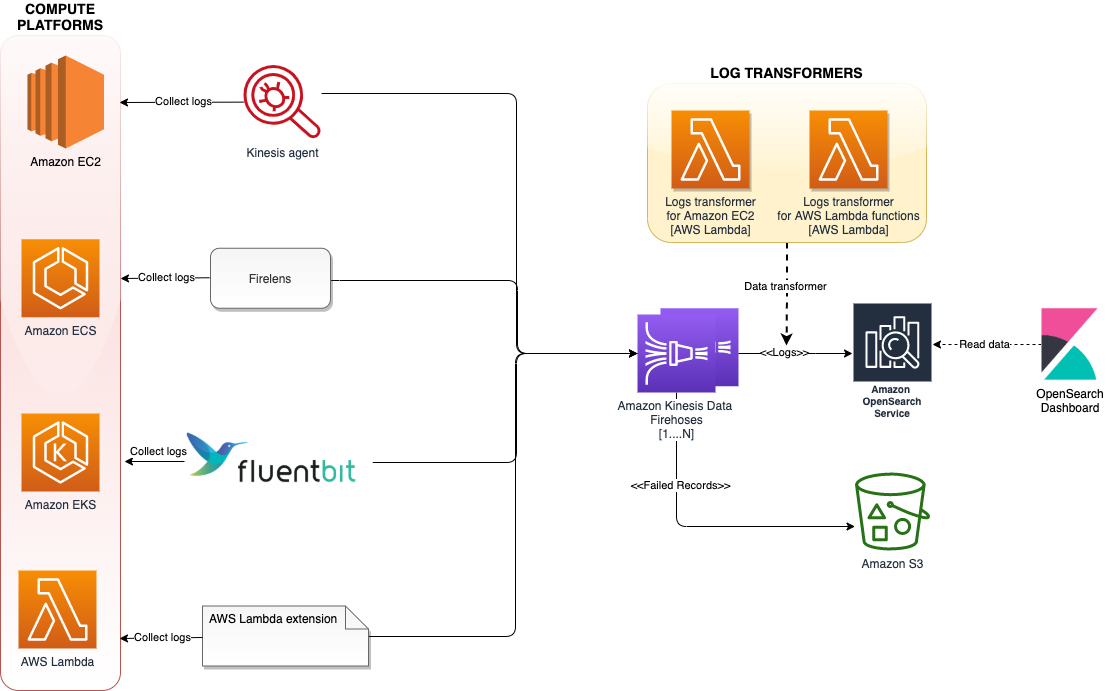
The architecture uses various log aggregation tools such as log agents, log routers, and Lambda extensions to collect logs from multiple compute platforms and deliver them to Kinesis Data Firehose. Kinesis Data Firehose streams the logs to Amazon OpenSearch Service. Log records that fail to get persisted in Amazon OpenSearch service will get written to AWS S3. To scale this architecture, each of these compute platforms streams the logs to a different Firehose delivery stream, added as a separate index, and rotated every 24 hours.
The following sections demonstrate how the solution is implemented on each of these computing platforms.
Amazon EC2
The Kinesis agent collects and streams logs from the applications running on EC2 instances to Kinesis Data Firehose. The agent is a standalone Java software application that offers an easy way to collect and send data to Kinesis Data Firehose. The agent continuously monitors files and sends logs to the Firehose delivery stream.

The AWS CDK script provided as part of this solution deploys a simple PHP application that generates logs under the /etc/httpd/logs directory on the EC2 instance. The Kinesis agent is configured via /etc/aws-kinesis/agent.json to collect data from access_logs and error_logs, and stream them periodically to Kinesis Data Firehose (ec2-logs-delivery-stream).
Because Amazon OpenSearch Service expects data in JSON format, you can add a call to a Lambda function to transform the log data to JSON format within Kinesis Data Firehose before streaming to Amazon OpenSearch Service. The following is a sample input for the data transformer:
The following is our output:
We can enhance the Lambda function to extract the timestamp, HTTP, and browser information from the log data, and store them as separate attributes in the JSON document.
Amazon ECS
In the case of Amazon ECS, we use FireLens to send logs directly to Kinesis Data Firehose. FireLens is a container log router for Amazon ECS and AWS Fargate that gives you the extensibility to use the breadth of services at AWS or partner solutions for log analytics and storage.

The architecture hosts FireLens as a sidecar, which collects logs from the main container running an httpd application and sends them to Kinesis Data Firehose and streams to Amazon OpenSearch Service. The AWS CDK script provided as part of this solution deploys a httpd container hosted behind an Application Load Balancer. The httpd logs are pushed to Kinesis Data Firehose (ecs-logs-delivery-stream) through the FireLens log router.
Amazon EKS
With the recent announcement of Fluent Bit support for Amazon EKS, you no longer need to run a sidecar to route container logs from Amazon EKS pods running on Fargate. With the new built-in logging support, you can select a destination of your choice to send the records to. Amazon EKS on Fargate uses a version of Fluent Bit for AWS, an upstream conformant distribution of Fluent Bit managed by AWS.

The AWS CDK script provided as part of this solution deploys an NGINX container hosted behind an internal Application Load Balancer. The NGINX container logs are pushed to Kinesis Data Firehose (eks-logs-delivery-stream) through the Fluent Bit plugin.
Lambda
For Lambda functions, you can send logs directly to Kinesis Data Firehose using the Lambda extension. You can deny the records being written to Amazon CloudWatch.

After deployment, the workflow is as follows:
- On startup, the extension subscribes to receive logs for the platform and function events. A local HTTP server is started inside the external extension, which receives the logs.
- The extension buffers the log events in a synchronized queue and writes them to Kinesis Data Firehose via PUT records.
- The logs are sent to downstream systems.
- The logs are sent to Amazon OpenSearch Service.
The Firehose delivery stream name gets specified as an environment variable (AWS_KINESIS_STREAM_NAME).
For this solution, because we’re only focusing on collecting the run logs of the Lambda function, the data transformer of the Kinesis Data Firehose delivery stream filters out the records of type function ("type":"function") before sending it to Amazon OpenSearch Service.
The following is a sample input for the data transformer:
Prerequisites
To implement this solution, you need the following prerequisites:
- The AWS Command Line Interface (AWS CLI) installed. The AWS CLI is a unified tool to manage your AWS services.
- The AWS CDK installed on your local laptop.
- Git installed and configured on your machine.
- The Lambda extension for Kinesis Data Firehose, which is packaged as part of this solution.
Build the code
Check out the AWS CDK code by running the following command:
Build the lambda extension by running the following command:
Make sure to replace default AWS region specified under the value of firehose.endpoint attribute inside lib/computes/ec2/ec2-startup.sh.
Build the code by running the following command:
Deploy the code
If you’re running AWS CDK for the first time, run the following command to bootstrap the AWS CDK environment (provide your AWS account ID and AWS Region):
You only need to bootstrap the AWS CDK one time (skip this step if you have already done this).
Run the following command to deploy the code:
You get the following output:
AWS CDK takes care of building the required infrastructure, deploying the sample application, and collecting logs from different sources to Amazon OpenSearch Service.
The following is some of the key information about the stack:
- ec2ipaddress – The public IP address of the EC2 instance, deployed with the sample PHP application
- ecsloadbalancerurl – The URL of the Amazon ECS Load Balancer, deployed with the httpd application
- eksclusterClusterNameCE21A0DB – The Amazon EKS cluster name, deployed with the NGINX application
- samplelambdafunction – The sample Lambda function using the Lambda extension to send logs to Kinesis Data Firehose
- opensearch-domain-arn – The ARN of the Amazon OpenSearch Service domain
Generate logs
To visualize the logs, you first need to generate some sample logs.
- To generate Lambda logs, invoke the function using the following AWS CLI command (run it a few times):
Make sure to replace samplelambdafunction with the actual Lambda function name. The file path needs to be updated based on the underlying operating system.
The function should return "StatusCode": 200, with the following output:
- Run the following command a couple of times to generate Amazon EC2 logs:
Make sure to replace ec2ipaddress with the public IP address of the EC2 instance.
- Run the following command a couple of times to generate Amazon ECS logs:
Make sure to replace ecsloadbalancerurl with the public ARN of the AWS Application Load Balancer.
We deployed the NGINX application with an internal load balancer, so the load balancer hits the health checkpoint of the application, which is sufficient to generate the Amazon EKS access logs.
Visualize the logs
To visualize the logs, complete the following steps:
- On the Amazon OpenSearch Service console, choose the hyperlink provided for the OpenSearch Dashboard 7URL.
- Configure access to the OpenSearch Dashboard.
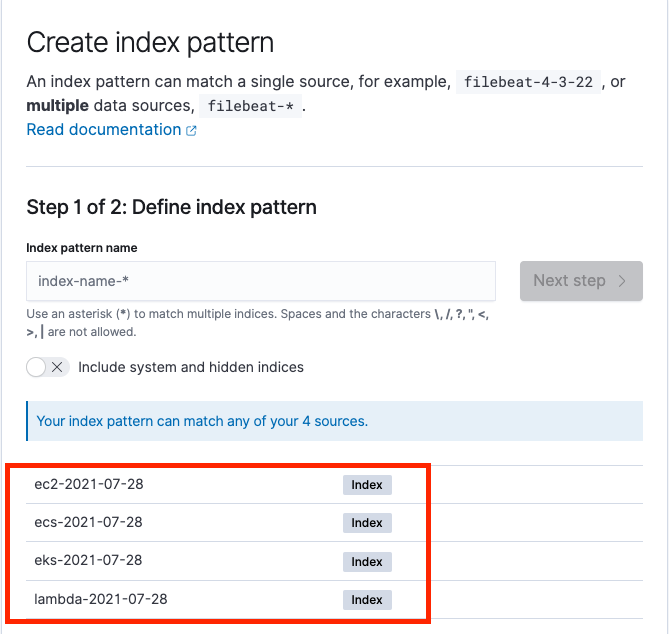
- Under OpenSearch Dashboard, on the Discover menu, start creating a new index pattern for each compute log.
We can see separate indexes for each compute log partitioned by date, as in the following screenshot.
The following screenshot shows the process to create index patterns for Amazon EC2 logs.
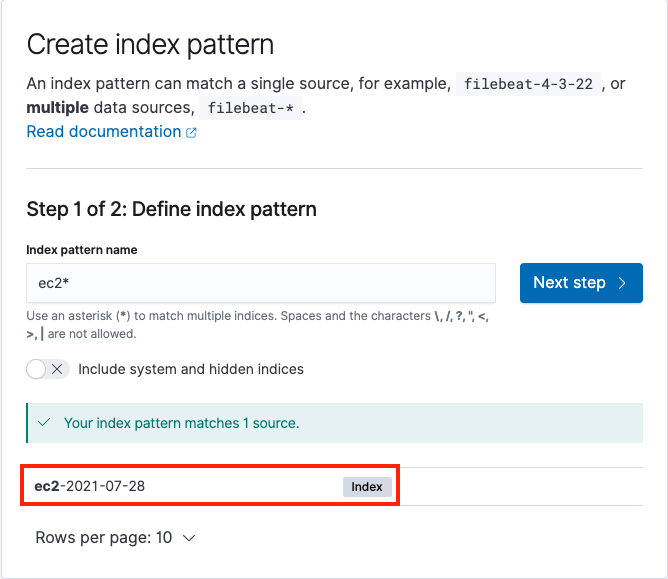
After you create the index pattern, we can start analyzing the logs using the Discover menu under OpenSearch Dashboard in the navigation pane. This tool provides a single searchable and unified interface for all the records with various compute platforms. We can switch between different logs using the Change index pattern submenu.

Clean up
Run the following command from the root directory to delete the stack:
Conclusion
In this post, we showed how to unify and centralize logs across different compute platforms using Kinesis Data Firehose and Amazon OpenSearch Service. This approach allows you to analyze logs quickly and the root cause of failures, using a single platform rather than different platforms for different services.
If you have feedback about this post, submit your comments in the comments section.
Resources
For more information, see the following resources:
- CDK with EKS on Fargate
- Ingest streaming data into Amazon Elasticsearch Service within the privacy of your VPC with Amazon Kinesis Data Firehose
- Using AWS Lambda extensions to send logs to custom destinations
- Custom log routing
About the author
 Hari Ohm Prasath is a Senior Modernization Architect at AWS, helping customers with their modernization journey to become cloud native. Hari loves to code and actively contributes to the open source initiatives. You can find him in Medium, Github & Twitter @hariohmprasath.
 Ballu Singh is a Principal Solutions Architect at AWS. He lives in the San Francisco Bay area and helps customers architect and optimize applications on AWS. In his spare time, he enjoys reading and spending time with his family.