Tag Archives: Amazon Elastic Container Service

AWS Weekly Roundup: Welcome DuckLabs to the team, Agentic Resource Discovery (ARD), and more (August 31, 2026)

Post Syndicated from Daniel Abib original https://aws.amazon.com/blogs/aws/aws-weekly-roundup-welcome-ducklabs-to-the-team-agentic-resource-discovery-ard-and-more-august-31-2026/

The news that interested me the most last week was the DuckLabs acquisition. AWS has signed a definitive agreement to acquire DuckLabs, the Amsterdam-based company behind DuckDB, the popular open source analytical database that runs in-process and executes SQL directly against files like Parquet, CSV, and JSON. DuckDB stays open source under its independent foundation and the MIT license, and over time AWS plans to combine its speed at everyday queries with the enterprise scale of services like Amazon S3, Amazon Redshift, and Amazon Athena.

Co-founded by Hannes Mühleisen and Mark Raasveldt, DuckDB runs locally or on Amazon S3, which makes it remarkably fast for the everyday queries (a terabyte or less) that make up the bulk of real-world analytics. It also happens to pair beautifully with AI agents, which “poke” and experiment their way through data much like humans do. The co-founders will continue leading its technical direction while AWS combines DuckDB’s speed with analytics services like Amazon EMR, AWS Glue, and Amazon SageMaker. For the bigger picture on why this matters, Andy Warfield, Vice President and Distinguished Engineer shared his thoughts on the post DuckDB and the changing physics of analytics on All Things Distributed.

Now, let’s get into this week’s AWS news…

Last week’s launches
Here are some launches and updates from this past week that caught my attention:

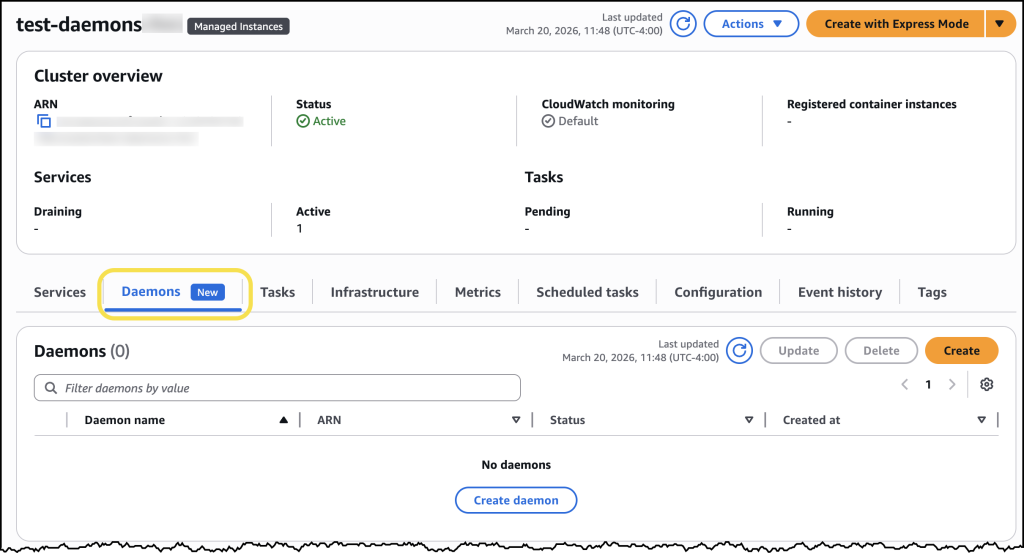
  • Amazon ECS now automatically detects and recovers container instances that lose agent connectivity – Amazon ECS now continuously monitors agent connectivity to the control plane and surfaces a new AGENT_CONNECTIVITY health event across AWS Fargate, Amazon ECS Managed Instances, and Amazon ECS on EC2. On Fargate and Managed Instances, ECS handles recovery automatically, draining tasks, launching replacements, and deregistering the impaired instance. On EC2, you can wire the event into your own workflow. Available at no additional cost in all AWS Commercial and AWS GovCloud (US) Regions.
  • AWS Lambda introduces public preview runtimes, starting with Node.js 26 and Python 3.15 – You can now test upcoming Lambda runtimes before they reach general availability. Preview runtimes use the same identifier as the eventual GA version, so your functions graduate automatically with no action required. Third-party tools and deployment frameworks can also validate compatibility ahead of GA. Not meant for production yet (breaking changes are possible), but a great way to get ahead of your next upgrade. Available in all AWS commercial, AWS GovCloud (US), and China Regions.
  • AWS IoT Core adds a native InfluxDB rule action – You can now route time-series data from your IoT devices straight into InfluxDB (Amazon Timestream-managed or self-hosted) without writing custom code or standing up an intermediate service. IoT Core formats data into InfluxDB’s line protocol and supports device-side and server-side batching. Available in all AWS Regions where Amazon Timestream for InfluxDB is offered.
  • Amazon GameLift Servers now includes enhanced DDoS protection – Your game servers now get automatic protection against network and transport layer (layers 3 and 4) DDoS attacks – UDP reflection, SYN floods, and similar vectors – with nothing to enable or opt into. Built on top of AWS Shield Standard with gaming-optimized traffic shaping, it turns on the moment your servers start running (Server SDK 5) at no extra cost. It’s available in all supported GameLift Servers Regions except China (Beijing) and China (Ningxia).
  • Amazon SageMaker HyperPod expands support for Ray – You can now run Ray workloads on SageMaker HyperPod with built-in observability, resilient training, and accelerated inference. Create and manage Ray clusters from Amazon SageMaker Studio, attach JupyterLab or your local IDE so a multi-node cluster behaves like a local dev environment, and get auto-provisioned Grafana dashboards. Node auto recovery, hung job detection, and tiered checkpointing keep large training runs healthy, while Ray Serve adds a tiered KV cache for inference. Your existing open source Ray code runs unchanged. Available for HyperPod clusters orchestrated by Amazon EKS.

For a full list of AWS announcements, be sure to keep an eye on the What’s New with AWS page.

Other AWS news
Here are some additional posts and resources that you might find interesting:

  • Happy 20th birthday, Amazon EC2! – Amazon EC2 turns 20. Channy Yun looks back at how EC2 grew from a single m1.small instance type in one Region to more than 1,200 instance types across 39 Regions, along with the custom silicon journey from the first Graviton to Graviton5 and Trainium3. A fun and worthwhile read on the service that still underpins so much of AWS – including Amazon ECS, Amazon EKS, AWS Lambda, Amazon SageMaker, and Amazon Bedrock.
  • Agentic Resource Discovery (ARD): an open specification for agent discovery – As organizations scale up agents, tools, and MCP servers, those resources end up scattered across clouds, on-premises infrastructure, and SaaS platforms – each with its own registry and metadata. ARD is a new open specification (Apache 2.0) that defines a common way to describe and discover agentic resources, so publishers “describe once” and consumers “discover everywhere” – think DNS, but for agents. AWS contributed feedback but doesn’t own the spec, and it complements the AWS Agent Registry by letting you federate across catalogs without migrating.
  • Get started with the Agent Toolkit for AWS in the AWS CLI – A single AWS CLI command (aws configure agent-toolkit) now equips AI coding agents like Kiro, Claude Code, Codex, and Cursor with curated, up-to-date AWS knowledge and a secure connection to thousands of AWS APIs through the AWS MCP Server. If you build with an AI coding assistant, this helps it choose the right services, use modern APIs, and follow security best practices – so it gets AWS code right more often the first time.

Upcoming AWS events
Check your calendar and sign up for upcoming AWS events:

  • AWS Summits – Free in-person events where builders come together to learn, connect, and explore the latest in cloud and AI. Upcoming stops include Zurich (September 2), São Paulo (September 3), Tel Aviv (September 10), and Dubai (September 30). Can’t attend in person? You can stream sessions through the Global Livestream and On-Demand Hub. I’ll be presenting two sessions on generative AI and Amazon Bedrock at the São Paulo Summit – if you’re there, come say hello.
  • AWS Community Days – Community-led conferences where content is planned, sourced, and delivered by community leaders. Upcoming events include JAWS SONIC 2026 in Tokyo (September 5) and Warsaw, Poland (September 8).

Join the AWS Builder Center to connect with builders, share solutions, and access content that supports your development. Browse here for upcoming AWS-led in-person and virtual events and developer-focused events.

That’s all for this week. Check back next Monday for another Weekly Roundup!

— Daniel Abib

This post is part of our Weekly Roundup series. Check back each week for a quick roundup of interesting news and announcements from AWS!

Serverless vehicle tracking at scale: Bosch L.OS on AWS

Post Syndicated from Yogish Kutkunje Pai original https://aws.amazon.com/blogs/architecture/serverless-vehicle-tracking-at-scale-bosch-l-os-on-aws/

When Bosch Mobility Platform Solutions set out to unify vehicle tracking across India’s fragmented spot logistics market, they faced a daunting reality: dozens of telematics providers, incompatible data formats, and thousands of concurrent tracking requests — all needing real-time resolution. The result was L.OS, a serverless platform on AWS that standardizes this chaos into a single visibility layer.

In this post, we’ll show you how Bosch Mobility Platform Solutions (MPS) uses AWS services to solve these challenges through their L.OS solution. You’ll learn how Bosch built a scalable, serverless architecture that standardizes and integrates multiple tracking data sources, so you can achieve real-time visibility and data-driven decision-making across complex logistics networks.

Key challenges in logistics visibility

If you manage a modern supply chain, you face several critical challenges:

  1. Data fragmentation and integration complexity.
    • Multiple tracking systems with incompatible data formats.
    • Different communication protocols across providers.
    • Lack of standardization in data exchange.
    • Complex and costly point-to-point integrations.
  2. Operational inefficiencies.
    • Manual coordination between stakeholders.
    • Time-consuming reconciliation of conflicting information.
    • Difficulty in providing accurate ETAs.
    • Limited real-time visibility into shipment status.
  3. Scale and performance issues.
    • High volume of concurrent tracking requests.
    • Variable data quality from different sources.
    • Performance bottlenecks during peak operations.
    • Cost implications of real-time tracking.
  4. Regional complexities.
    • Fragmented spot logistics networks.
    • Multiple intermediaries in the supply chain.
    • Varying levels of technological adoption.
    • Regional compliance requirements (such as AIS140 and FASTag in India).

Introducing L.OS on AWS: A unified visibility solution

To address these challenges, Bosch’s Logistics Operating System (L.OS) on AWS provides a horizontal integration layer that connects previously siloed logistics solutions. The solution features a service catalog where solution providers and consumers can collaborate to solve complex use cases, fostering innovation in the logistics sector. Let’s explore how L.OS enhances vehicle visibility through its core workflows: discovery, tracking, and termination.

Discovery

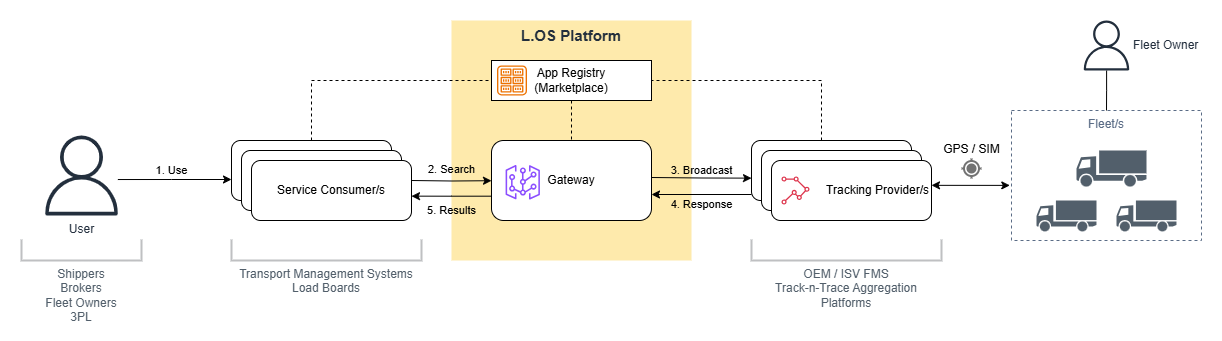
When a client needs to track a vehicle, the service app makes a discovery call to the L.OS gateway. This call includes essential details such as the vehicle number plate or vehicle identification number (VIN). Upon receiving the request, the L.OS solution performs necessary authentication and authorization. L.OS then broadcasts the request and waits for acknowledgment from one or more connected participants. The responses contain information such as the mode, frequency, and reliability of tracking, which can be used for shortlisting and decision-making.

The following diagram illustrates the discovery workflow, showing how a client’s tracking request flows through L.OS to connected participants and back.

Discovery workflow diagram showing how a client’s tracking request flows through L.OS to connected participants

Figure 1 – The discovery flow: the service app sends a discovery call to the L.OS gateway with vehicle identifiers. L.OS broadcasts the request to connected participants, collects acknowledgments containing tracking mode, frequency, and reliability details, and returns them to the consumer for shortlisting.

Tracking

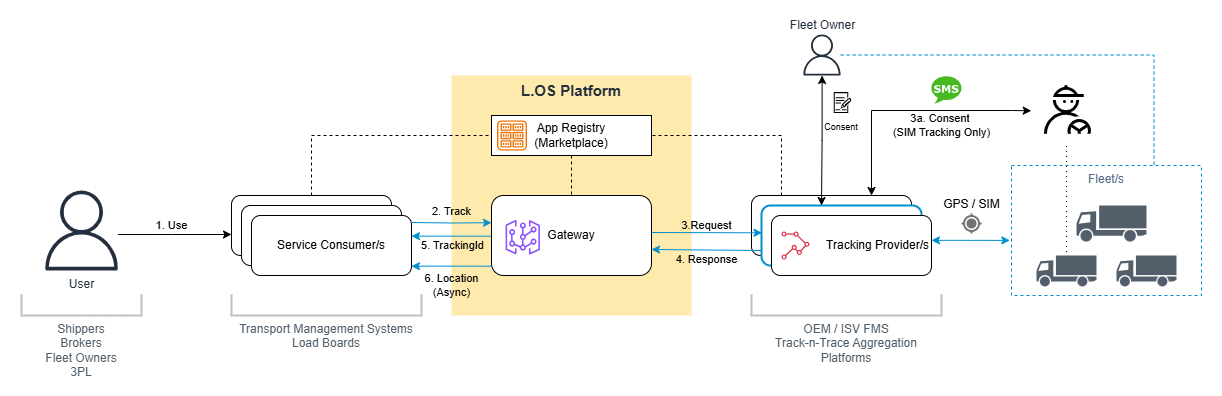
Once the consumer has selected a vehicle and a service provider (if there are multiple options), a request is sent to the L.OS to initiate tracking. This request is relayed to the specific service provider. The tracking mode determines who must grant consent. For SIM tracking, a consent request goes to the driver. For GPS tracking, it goes to the fleet owner. The solution waits for the tracking provider to create the trip. Upon receiving confirmation, L.OS registers the tracking request and provides a unique tracking ID to indicate that tracking has been initiated. From here, the consumer is asynchronously notified of the vehicle’s location at the specified frequency, or the maximum frequency supported by the service provider, whichever is faster. Consumers can also request the live location of the vehicle at any time between the regular reporting intervals.

The following diagram shows the tracking workflow, from initiation through consent, trip creation, and ongoing location updates.

Tracking workflow diagram showing initiation, consent, trip creation, and location updates

Figure 2 – The tracking flow: the consumer sends a tracking request to L.OS, which relays it to the selected service provider. A consent request is issued (to the driver for SIM tracking, or the fleet owner for GPS tracking). Once the provider confirms trip creation, L.OS returns a unique tracking ID and begins delivering asynchronous location updates at the agreed frequency.

Termination

The tracking is automatically terminated when the vehicle enters the destination geo-fence. Alternatively, tracking can be terminated manually by sending an explicit request to L.OS, which is then relayed to the service provider.

Architecture overview

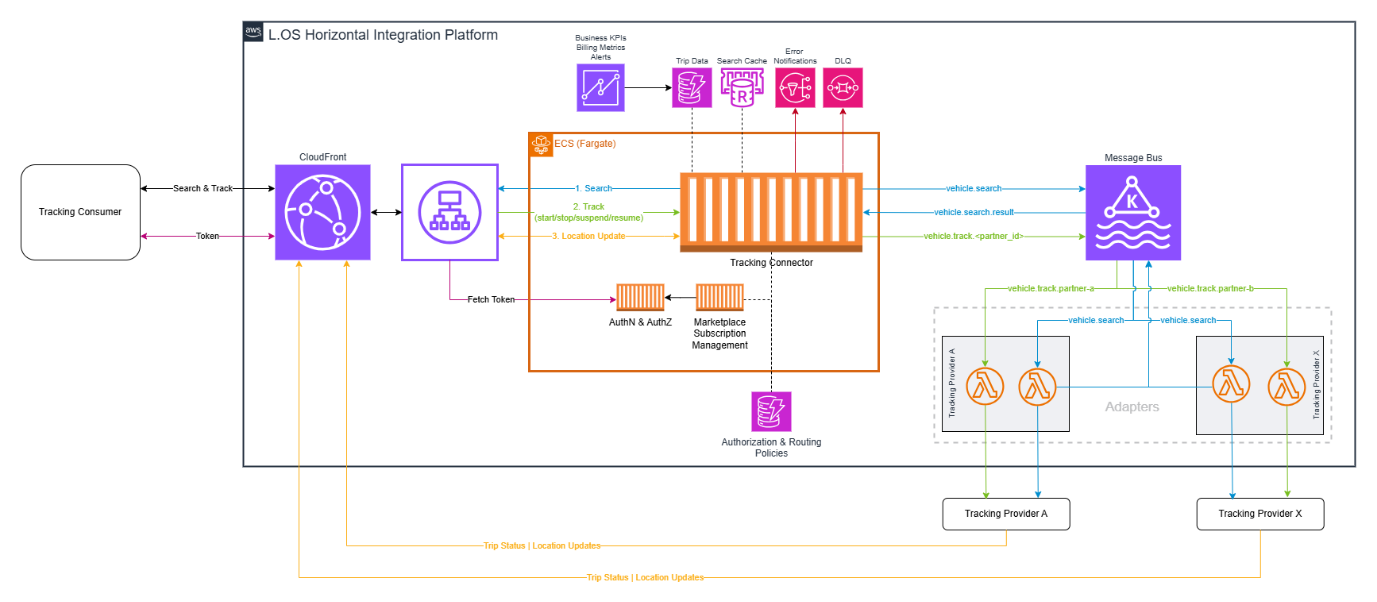
The L.OS solution built on AWS uses various services to create a scalable, secure, and maintainable system. The architecture implements serverless components (AWS Lambda adapters) where appropriate while using containers (Amazon Elastic Container Service (Amazon ECS) with AWS Fargate) for the core connector service. Let’s explore how these AWS managed services work together to create a flexible and scalable integration solution. The following diagram shows the end-to-end architecture, illustrating how requests flow from client applications through the API layer, into the core connector service, and out to individual tracking providers.

L.OS end-to-end architecture on AWS showing client applications, API Gateway, ECS Fargate connector, Lambda adapters, and Amazon MSK

Figure 3 – L.OS architecture on AWS: Client applications connect through Amazon API Gateway to the Tracking Connector running on Amazon ECS Fargate, which handles protocol standardization, routing, and session management. Provider-specific Lambda adapters translate between the standardized connector API and each tracking provider’s API. Amazon MSK serves as the event bus for asynchronous location updates. Amazon ElastiCache provides low-latency caching for frequently accessed data, Amazon DynamoDB stores business rules and security policies, and the Marketplace Subscription Management service (also on Fargate) handles authentication, customer relationships, and provider configurations. Amazon QuickSight delivers real-time monitoring and usage analytics.

Key components

The architecture comprises five core components that work together to deliver reliable, real-time vehicle tracking at scale. Each component handles a distinct responsibility — from protocol translation to event streaming — allowing the system to scale and evolve independently.

Centralized orchestration with Amazon ECS Fargate

The Tracking Connector, running on Amazon ECS Fargate, serves as the central orchestration layer. It handles critical functions including:

  • Protocol standardization across multiple providers.
  • Intelligent request routing.
  • Response aggregation.
  • Session management.
  • Comprehensive error handling.
  • Performance optimization using Amazon ElastiCache.

Serverless provider integration

We use AWS Lambda to implement Tracking Adapters that handle provider-specific transformations. These adapters efficiently translate between our standardized connector API and various provider APIs, allowing for easy onboarding of new providers.

Event-driven communication

Amazon MSK (Managed Streaming for Apache Kafka) powers our message bus, enabling:

  • Standardized topic patterns.
  • Support for multiple domain connectors.
  • Real-time data streaming for tracking, parking, vehicle health, charging, and fleet management.

Subscription and access management

The Marketplace Subscription Management service, deployed on Amazon ECS Fargate, manages:

  • Customer relationships.
  • Service consumer configurations.
  • Provider integrations.
  • Authentication and authorization token claims.

Policy and security enforcement

We use Amazon DynamoDB to store and manage:

  • Business rules.
  • Security policies.
  • Authorization configurations.
  • Routing rules.

Monitoring and analytics

Amazon QuickSight provides:

  • Real-time system performance metrics.
  • Usage analytics.
  • Health monitoring.
  • Anomaly detection.

Benefits

By implementing this serverless architecture on AWS, Bosch L.OS achieved significant improvements in vehicle tracking capabilities:

Operational efficiency

The combination of standardized Lambda adapters and the centralized Tracking Connector on ECS Fargate eliminates the manual coordination that previously slowed provider onboarding. Where ISVs once spent 2–4 weeks on bespoke integration work for each new customer request, the standardized connector API and adapter pattern reduces this to within 3 days. Real-time data validation at the connector layer — before events reach downstream consumers — also improves data accuracy by catching format inconsistencies at ingestion rather than during reconciliation.

Scalability and performance

Because the core connector runs on Fargate with auto-scaling task definitions, and each provider adapter is an independent Lambda function, the system scales horizontally without manual intervention. Bosch’s deployment currently handles 35,000 trips per day — each generating multiple location events — with sub-second response times for 99.9% of tracking queries. As new ISVs are onboarded, additional Lambda adapters are deployed independently, so scaling the provider network does not add load to existing integrations.

Cost optimization

Integrations in fragmented logistics markets often stall because multiple vendors must coordinate through manual processes — handoffs, SIM card provisioning, consent management, and troubleshooting. By automating these workflows within the L.OS connector layer and MSK event bus, Bosch estimates integration costs are reduced by 15–20%. The architecture also removes per-vendor overhead (SIM management, consent flows, provider-specific troubleshooting) that was previously passed on to small transporters. This potentially lowers their total tracking costs by 25–30%.

Enhanced customer experience

The unified API Gateway endpoint and MSK-powered event streaming mean consumers receive location updates from any connected provider through a single interface — regardless of the underlying tracking technology. What previously required hours of manual coordination across providers now surfaces as a consolidated event within approximately 1 minute, according to Bosch. Improved ETA accuracy is a direct result: with standardized, high-frequency location data flowing through ElastiCache, downstream planning systems can compute more reliable arrival predictions.

Compliance and security

DynamoDB-backed policy enforcement ensures that business rules, authorization configurations, and regional compliance requirements (such as India’s AIS140 and FASTag mandates) are evaluated consistently on every request. The built-in security features of AWS — IAM roles, virtual private cloud (VPC) isolation, and encryption at rest and in transit — provide the baseline. Automated audit trails captured through the event bus give organizations a verifiable record of all tracking operations.

L.OS growth

L.OS is currently operational in India with 10 integrated ISVs. The serverless adapter pattern makes geographic expansion straightforward: new region-specific adapters can be deployed as independent Lambda functions without modifying the core connector. Bosch plans to use this approach to expand into Europe for trailer monitoring use cases.

Conclusion

In this post, we showed how Bosch built L.OS, a serverless vehicle tracking platform on AWS that unifies fragmented logistics visibility into a single integration layer. By using AWS services such as Amazon ECS with Fargate for centralized orchestration and AWS Lambda for provider-specific adapters, the architecture standardizes multiple tracking providers into a unified API.

This standardization eliminates the need for maintaining multiple point-to-point integrations, freeing you to focus on core operations instead of managing repetitive integration tasks. Through strategic collaboration with key stakeholders in the visibility solutions space, L.OS is helping businesses achieve measurable outcomes: enhanced customer experience, increased operational agility, reduced operational expenses, and improved profit margins.

What started as a vehicle tracking solution is now evolving into a broader mobility services portfolio, powered by the scalable infrastructure that AWS provides. This evolution positions L.OS to address not only today’s tracking needs, but a broader range of logistics use cases as they emerge.

If you have questions or feedback about this post, leave a comment in the comments section.

For more information about the Bosch L.OS solution and its capabilities, visit Bosch L.OS website.

Contact your AWS account team to learn how we can help you build similar solutions for your logistics operations.


About the authors
How Alight Solutions achieved 55% cost savings with Amazon OpenSearch Service

Post Syndicated from Mark Larson original https://aws.amazon.com/blogs/big-data/how-alight-solutions-achieved-55-cost-savings-with-amazon-opensearch-service/

This is a guest post by Mark Larson, Andrew Kummerow, and Tim Razik at Alight Solutions, in partnership with AWS.

Alight Solutions is a leading cloud-based human capital technology and services provider focused on integrated benefits administration, healthcare navigation, and employee experience solutions. The company serves hundreds of enterprise customers globally, with services that support millions of people worldwide.

Alight’s technology stack generates over 1 billion log records per day across their containerized microservices architecture, with peaks reaching 100,000 records per second during Annual Enrollment periods. Previously, Alight relied on a self-managed Elastic Stack (Elasticsearch, Logstash, Kibana) deployment that had been in production since 2018. As their logging volumes grew and Elasticsearch 7.x approached end of support, the operational burden of maintaining this infrastructure consumed their entire operational budget, leaving no capacity for innovation.

In this post, we share how Alight Solutions migrated from self-managed Elasticsearch to Amazon OpenSearch Service. The migration achieved a 55% cost reduction, alleviated approximately 2,000 hours per year of operational overhead, and gave Alight access to advanced observability features they could not prioritize before.

Challenges with self-managed Elasticsearch

Alight’s self-managed Elastic Stack infrastructure presented compounding technical and operational challenges. Their production environment consisted of 15 Elasticsearch nodes with 168 TB of EBS storage, handling log ingestion from their flagship Alight Worklife system and supporting applications. The infrastructure required an Elastic Platinum subscription, though the team’s operational bandwidth was fully consumed by maintenance, leaving limited capacity to adopt advanced features included in the license.

The operational pain points included:

  • Security vulnerability patching required working over Christmas holidays to address critical fixes, with no flexibility on timing.
  • Elastic upgrades were time-consuming and required depth of knowledge to manage at scale.
  • Logstash using TCP-socket shipping was unreliable, experiencing log loss at high volumes.
  • Backpressure from Logstash caused two P1 incidents over two years, where the logging subsystem directly impacted microservice tasks.
  • Elasticsearch 7.x approaching end of support created urgency to act before the next Annual Enrollment period (September through January).

Alight was spending more than $100,000 per month on self-managed infrastructure and Elastic licensing across all environments. All operational budget was consumed by cluster maintenance, leaving zero capacity for innovation.

Evaluating alternatives

Alight evaluated several alternatives before selecting OpenSearch Service:

  • New Relic and Dynatrace were evaluated for log aggregation but proved prohibitively expensive at Alight’s volume.
  • Amazon CloudWatch was evaluated but did not meet requirements for complex log research at their volume and visualization complexity.

Amazon OpenSearch Service is a managed service that makes it straightforward to deploy, operate, and scale OpenSearch clusters in the AWS Cloud. You can use it for use cases such as log analytics and real-time application monitoring. It provisions cluster resources, automatically detects and replaces failed nodes, and scales with a single API call or a few clicks, reducing the operational overhead associated with self-managed infrastructure. It won the evaluation based on five factors:

  1. Cost: significantly cheaper than self-managed Elastic Stack and competing solutions.
  2. Minimal change management: as a fork of Elasticsearch 7.10, engineers were already familiar with the query syntax and dashboards.
  3. Compliance: using a native AWS service avoided hundreds of hours of vendor compliance, audit, and regulatory work. The team spent a few hours getting approval compared to potentially weeks for an external vendor.
  4. Cloud-native strategy: aligned with Alight’s overarching strategy to use cloud-native services.
  5. Security and data privacy: keeping everything within their AWS landing zone alleviated data egress concerns.

Solution overview

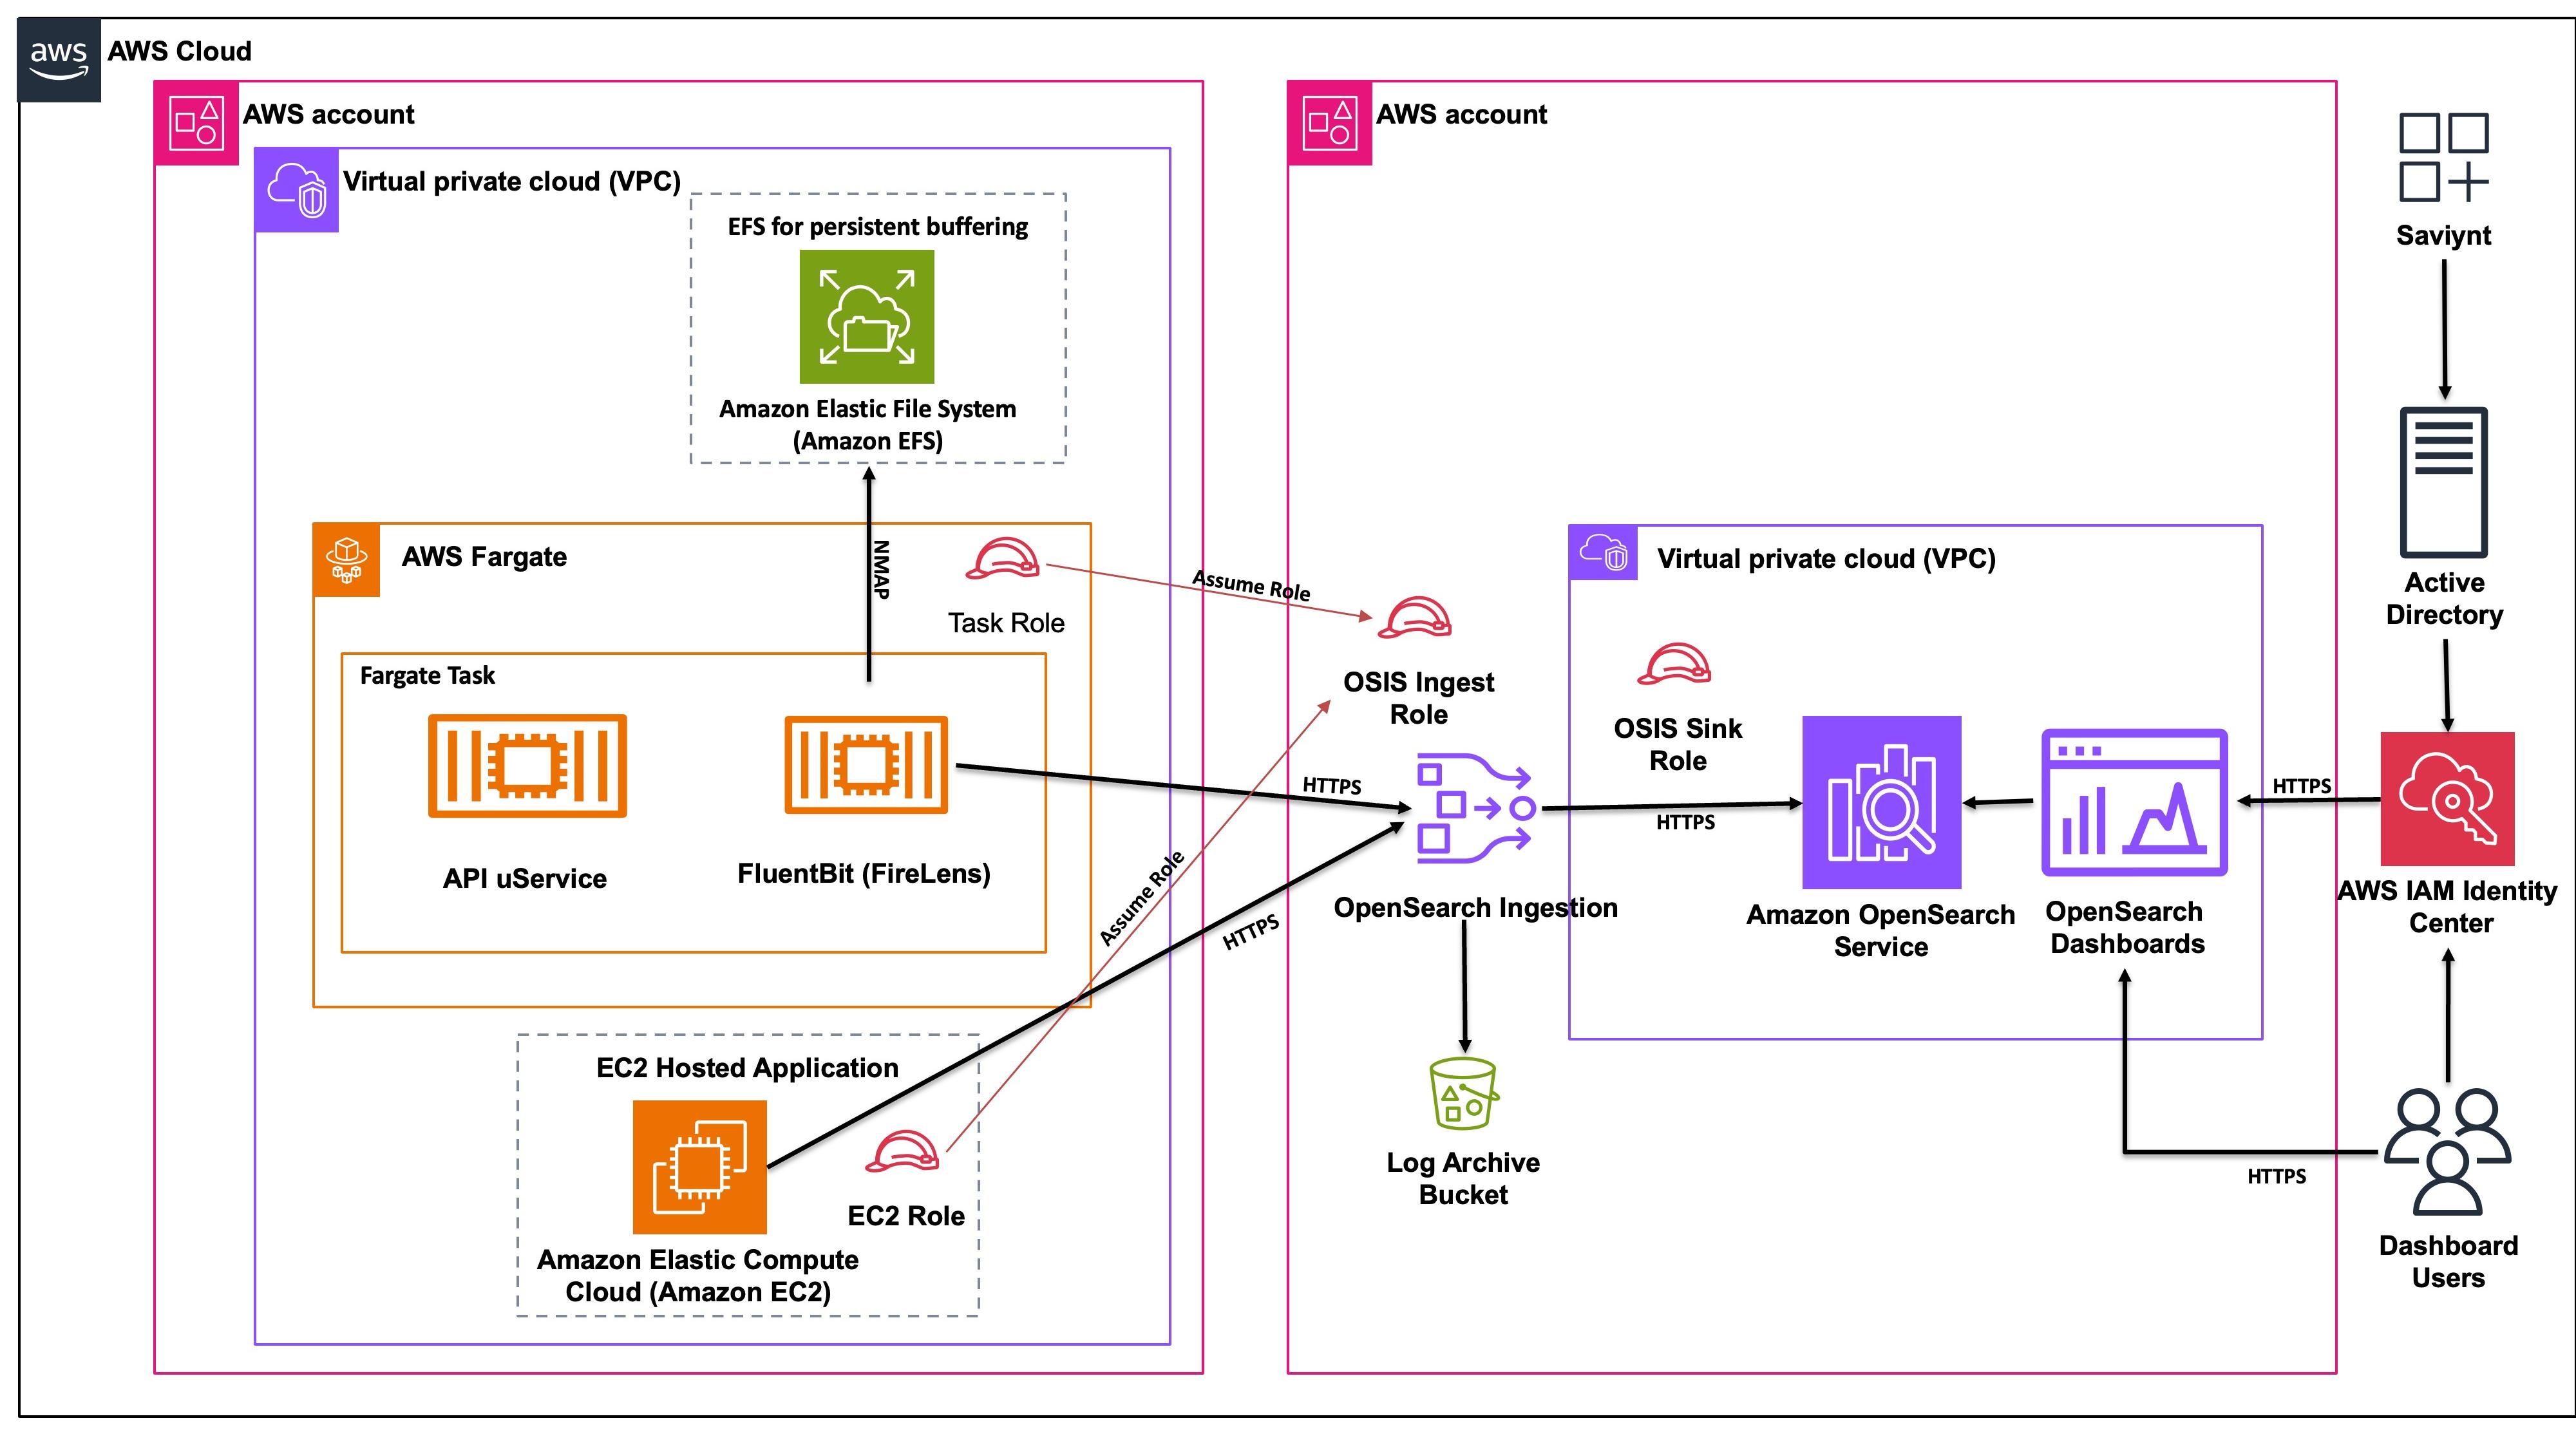
Alight partnered with AWS to design a cloud-native log aggregation architecture that replaced self-managed Elasticsearch and Logstash with Amazon OpenSearch Service and Amazon OpenSearch Ingestion (OSIS), alleviating the operational burden, including the Logstash backpressure that had caused two P1 incidents.

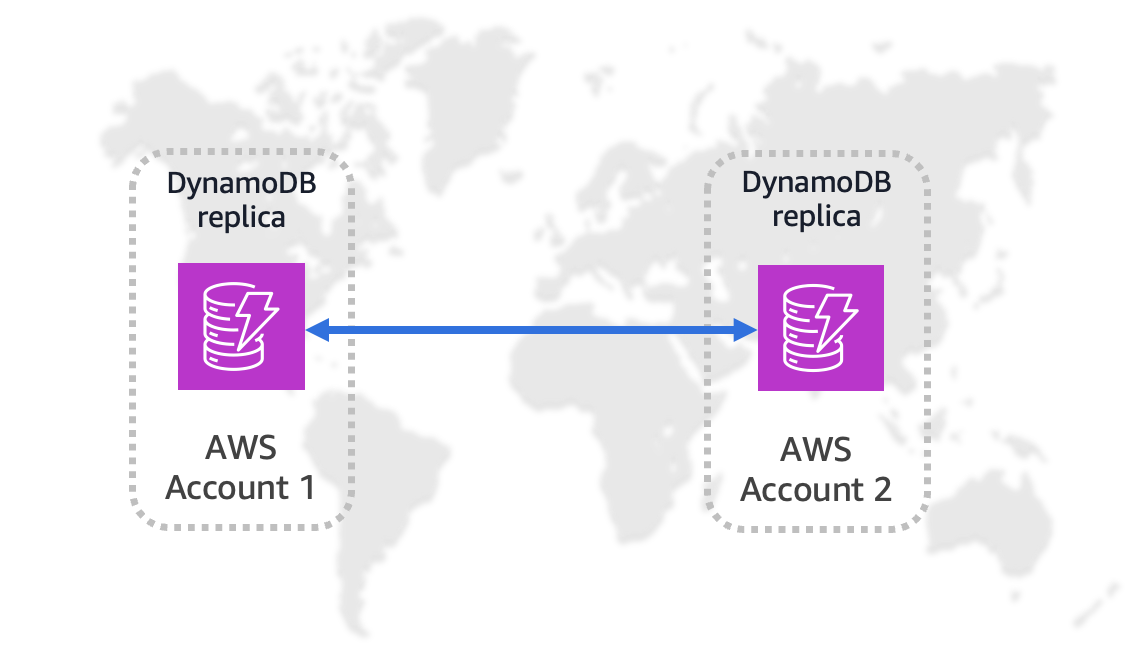
The architecture uses a cross-account model with two primary account types:

The following diagram illustrates the solution architecture.

Cross-account architecture showing Amazon ECS and Amazon EC2 workloads sending logs through OpenSearch Ingestion to Amazon OpenSearch Service

Alight OpenSearch Service architecture showing cross-account log ingestion from Amazon ECS and Amazon EC2 workloads through OpenSearch Ingestion to Amazon OpenSearch Service

Ingestion paths

The solution supports multiple ingestion paths depending on the application hosting model:

  • ECS applications: FireLens/Fluent Bit sidecar containers capture stdout/stderr through the awsfirelens log driver, then ship logs over HTTPS directly to OSIS in the shared services account. ECS task roles assume a cross-account OSIS Ingest Role for authentication.
  • EC2 applications: Open-source Fluent Bit (RPM-based, non-containerized) uses tail input to read log files, then ships to OSIS through an EC2 IAM Role with cross-account trust.
  • S3-based ingestion (planned): Some applications write to Amazon Simple Storage Service (Amazon S3) with Amazon Simple Queue Service (Amazon SQS) notifications triggering OSIS pipelines.

Spring Boot microservices use a custom logging framework built on Logback (not Log4j) that formats logs as JSON and flushes to console, which FireLens picks up.

Security model

Traffic flows over HTTPS. The security model uses role separation with least privilege:

  • OSIS Ingest Role: write-only access to OSIS pipelines, assumed by application account roles via cross-account trust.
  • OSIS Sink Role: used by OSIS to write into the OpenSearch domain, with full index access scoped to the ingestion pipeline.
  • Security groups: restrict OSIS traffic to known CIDRs and VPCs.

Each application has its own indices, and access is governed by application-specific roles.

Persistent buffering

Amazon Elastic File System (Amazon EFS) provides persistent filesystem buffering for the Fluent Bit sidecar, helping prevent log loss during transient failures or backpressure events. This directly addresses the P1 incidents Alight experienced with Logstash. For the next Annual Enrollment period, Alight plans to also enable persistent buffering at the OSIS layer to handle burst ingestion without log loss.

User access

End-user access to OpenSearch Dashboards is managed through AWS IAM Identity Center with System for Cross-domain Identity Management (SCIM) synchronization from Alight’s enterprise Identity Provider. Users navigate to the Applications tab in Identity Center to access OpenSearch Dashboards over SAML/HTTPS.

At Alight, IAM Identity Center and SCIM are configured in the payer account. They use the same synchronization and entitlement request and approval process that governs Alight’s user and entitlement provisioning into AWS. With this setup, the team uses the same single sign-on (SSO) and entitlement workflow for OpenSearch Dashboards access as for the AWS Management Console, in conjunction with fine-grained access control (FGAC) defined within the OpenSearch domains.

OpenSearch domain configuration

For their production workload, Alight deployed:

Component Configuration
Data nodes 18 im4gn.2xlarge.search
UltraWarm nodes 9
Dedicated leader nodes 3
Hot tier storage 25 TB
UltraWarm storage 180 TB
Primary logical data 80 TB
Total with replicas 100-105 TB

Additional environments include a secondary production cluster (12 hot nodes, 3 UltraWarm, 3 dedicated leader nodes), plus client test and engineering clusters with 3 hot nodes each.

Migration process

The migration was completed over seven months (February through August 2025), with five applications migrated including the flagship Alight Worklife application.

Infrastructure as code

The team built new Terraform modules to manage deployment of OSIS pipelines, OpenSearch domains, and FireLens sidecar additions to ECS applications. Onboarding new applications is now templatized, resulting in significant time savings compared to adding new indices in Elasticsearch. Onboarding a new application now takes between 4-8 hours, whereas before we would spend 80-120 hours per application.

Migration timeline

Alight first enabled Amazon OpenSearch Service in production for two smaller applications, to make sure operational processes were up and running before migrating the highest volume log producers. For each application, logging to OpenSearch was enabled while continuing to write logs to the existing logging infrastructure. This parallel run allowed fine-tuning of OSIS pipeline configuration, OpenSearch cluster size and configuration before doing a full cutover. This approach also validated that logs were being ingested properly into OpenSearch. It confirmed that the performance of OpenSearch Dashboards and queries was as good as or better than the existing self-managed Elasticsearch cluster.

For historical data, Alight migrated the most recent 30 days of live data from Elasticsearch into OpenSearch just prior to cutover. They also retained a full archive of older log data in an Amazon S3 bucket, so that data older than 30 days could be loaded into OpenSearch on request if a user needs it.

AWS partnership

Alight engaged the AWS team during the evaluation phase. Through AWS Enterprise Support, their Technical Account Manager (TAM) served as the dedicated point of contact throughout the journey. The TAM coordinated sessions with OpenSearch Service subject matter experts to address specific service capabilities, help with design, troubleshoot issues, and provide performance guidance.

Results

The migration to Amazon OpenSearch Service delivered results across cost, operations, and capability dimensions.

“Alight’s mission critical applications are built on hundreds of interdependent microservices, so effective application logging is critical for analyzing system behaviors, performance tuning, and troubleshooting. Amazon OpenSearch Service provides us with great log analytics, very cost effectively at scale, and integrates seamlessly with our IAM strategy for granular access control and authorization. The ability to reconfigure, resize, and upgrade OpenSearch domains with a few clicks and zero downtime is a game changer for us.”

— Mark Larson, Enterprise Architect

Cost and licensing

Metric Before After Improvement
Monthly infrastructure + licensing cost Self-managed EC2/EBS + Elastic Platinum licensing Fully managed OpenSearch Service, no separate licensing ~55% cost reduction
Licensing model Elastic Platinum (fixed) Zero licensing cost No longer needed

Not all Elasticsearch clusters are decommissioned yet. Once decommissioning is complete, savings will reach approximately 65%. Additionally, more applications have been added to OpenSearch than were originally on Elasticsearch, making the per-application cost even more favorable. Beyond compute and licensing, the migration also reduced data transfer costs previously incurred across the self-managed cross-account architecture, adding further to the overall savings.

Operational improvements

Metric Before After
Engineering hours on cluster management 2,000 hours/year (≈1 FTE) Near zero (managed service)
Security vulnerability patching Manual, including holiday work Handled by AWS
Application onboarding Manual index creation and configuration Templatized via Terraform
P1 incidents from logging subsystem 2 in past 2 years Zero since migration

Performance and scale

Metric Value
Daily log volume 1 billion records
Peak ingestion rate 100,000 records/second
Applications migrated 5 (including Alight Worklife)
Total data under management 100–105 TB with replicas

Lessons learned and best practices

Through their migration journey, Alight gained the following insights:

  • Use your account team relationship to advocate: When Fluent Bit had a blocking issue, the AWS account team relationship helped push for the fix and provided workaround guidance.
  • Separate concerns for data durability: Do not put 100% delivery guarantees on logging infrastructure. Use a separate event stream (such as Amazon SQS) for critical data that cannot tolerate loss.
  • Templatize everything: Terraform modules for OSIS, OpenSearch domains, and FireLens sidecars reduce the time to onboard new applications.
  • Security architecture matters: Separating ingest roles from sync roles (least privilege) and using cross-account trust provides strong security without complexity.
  • Plan around business-critical periods: Pausing the production rollout during Annual Enrollment was the right call. The risk of introducing changes during peak was not worth the schedule pressure.

What’s next

Alight has several initiatives planned to expand their OpenSearch Service usage:

  • Anomaly detection: top priority, a feature they paid for with Elastic Platinum but never had capacity to implement.
  • Amazon OpenSearch Serverless: evaluating for new log sources, particularly interested in zero-OCU baseline for cost optimization.
  • OSIS persistent buffer: planned for next Annual Enrollment to handle burst ingestion without log loss.
  • Amazon Bedrock AgentCore logging: new artificial intelligence (AI) workloads will send logs to OpenSearch.
  • AI-assisted log analytics: adopting the agentic AI capabilities now built into Amazon OpenSearch Service. These include the Investigation Agent for autonomous, hypothesis-driven root cause analysis, which helps site reliability engineering (SRE) and engineering teams gain deeper insights from application logs.
  • Vector database: already using OpenSearch as a vector store for a conversational AI assistant (separate team).
  • Migration progress: All workloads previously logging to Elasticsearch have been migrated to OpenSearch, plus an additional eight applications.
  • Enterprise Logging Service: All new applications will now log to Amazon OpenSearch Service by default using the templatized approach.
  • Decommission: All existing Elasticsearch instances will be decommissioned by July 2026.

Conclusion

Alight’s migration from self-managed Elasticsearch to Amazon OpenSearch Service demonstrates how enterprises can alleviate operational burden while achieving significant cost savings. By using Amazon OpenSearch Ingestion and FireLens, Alight built a scalable log aggregation system that handles 1 billion records per day with zero P1 incidents since deployment.

The 55% cost reduction and approximately 2,000 hours per year of recovered engineering time have freed Alight to pursue advanced observability capabilities like anomaly detection and AI-powered log analytics, features they paid for but could never use under the operational weight of self-managed infrastructure.

To learn more, see the Amazon OpenSearch Service documentation. To get started with ingestion pipelines, see Amazon OpenSearch Ingestion. For migration guidance, see Migrating to Amazon OpenSearch Service.


About the authors
Mark Larson

Mark is an Enterprise Architect at Alight. This team is responsible for translating business and product strategy into secure, scalable, and sustainable technology outcomes through clear architectural guidance, governance, and partnership with business and engineering leaders.

Andrew Kummerow

Andrew is the Head of Enterprise Architecture at Alight, where he leads the EA organization. This team is responsible for translating business and product strategy into secure, scalable, and sustainable technology outcomes through clear architectural guidance, governance, and partnership with business and engineering leaders.

Tim Razik

Tim is a Senior IT Application Architect at Alight with over 25 years of experience in Site Reliability Engineering (SRE) and DevSecOps. He specializes in building scalable, secure, and highly observable cloud platforms, with deep expertise in log and telemetry pipeline design using AWS services such as Amazon OpenSearch. Tim is currently leading observability efforts for AI platforms like Amazon Bedrock, working closely with engineering teams to improve system reliability, operational visibility, and production performance.

Puneeth Ranjan Komaragiri

Puneeth Ranjan Komaragiri

Puneeth is a Principal Technical Account Manager at AWS. He is particularly passionate about monitoring and observability, cloud financial management, and generative AI domains. In his current role, Puneeth enjoys collaborating closely with customers, using his expertise to help them design and architect their cloud workloads for optimal scale and resilience.

Praful Kava

Praful Kava

Praful is a Sr. Specialist Solutions Architect at AWS. He guides customers to design and engineer cloud-scale analytics pipelines on AWS. Outside work, he enjoys traveling with his family and exploring new hiking trails.

Jagadish Kumar (Jag)

Jagadish Kumar (Jag)

Jagadish is a Senior Specialist Solutions Architect at AWS focused on Amazon OpenSearch Service. He is deeply passionate about data architecture and helps customers build analytics solutions at scale on AWS.

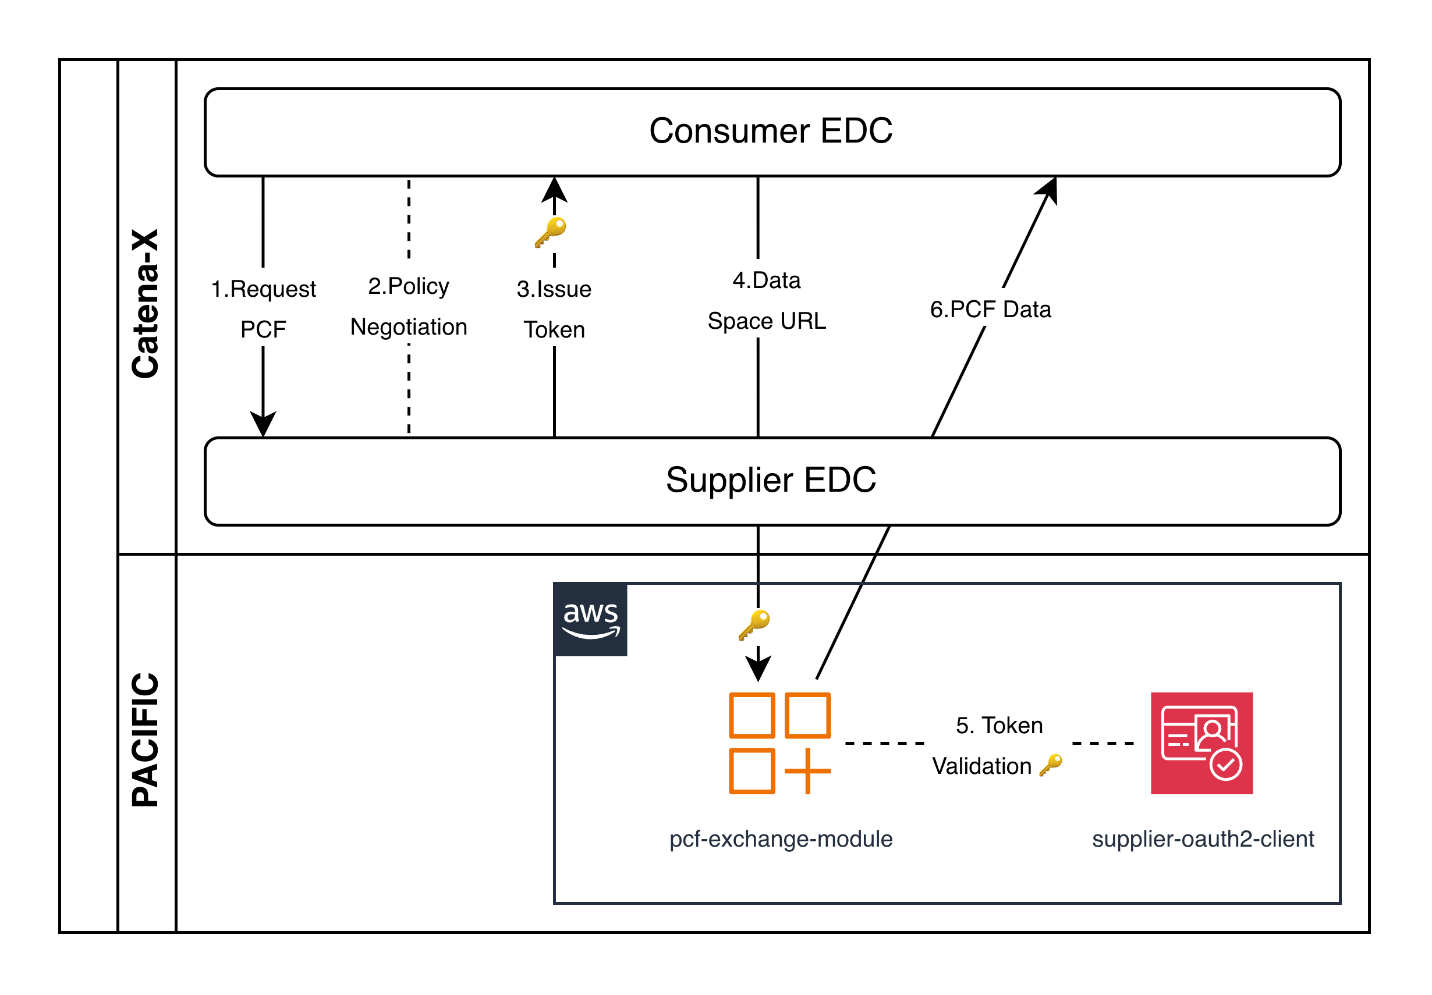
Eclipse Dataspace Components on AWS: Cost optimization strategies

Post Syndicated from Jorge Hernández Suárez original https://aws.amazon.com/blogs/architecture/eclipse-dataspace-components-on-aws-cost-optimization-strategies/

When you deploy Eclipse Dataspace Components (EDC) connectors on AWS, one of the first challenges you face is predicting and controlling the cost of the required infrastructure. Without clear benchmarks, it is difficult to make informed decisions about workload sizing, environment configuration, and long-term investment.

Part 1 of this 3-part blog series covered the fundamentals of data space architectures and the EDC per the International Data Space Association’s (IDSA) standards. Part 2 explored production-ready architecture patterns for deploying EDC connectors on Amazon Web Services (AWS), discussing operational excellence, security, and reliability principles. This final post covers the remaining three AWS Well-Architected Framework pillars: Performance Efficiency, Cost Optimization, and Sustainability.

In this post, you will learn which AWS services drive cost in an EDC connector deployment, how to estimate monthly costs for business-critical and non-critical workloads, and how to apply optimization strategies that can reduce your spending by up to 58%.

Understanding cost drivers in data space deployments

Data spaces are secure and sovereign data environments that enable data sharing across independent organizations. With these architectures, you can collaborate with external organizations while maintaining full control over your data and compliance with data sovereignty principles. Your infrastructure costs can vary significantly. The main factors are your performance and reliability requirements, along with data volume and velocity across the network. It’s also important to distinguish between two types of infrastructure. A Dataspace Governance Authority (DSGA) centrally establishes components such as management, identity, and discovery functions. Participants host other components themselves, including the connector. This blog post focuses only on costs associated with EDC connector deployment on the participant, that is, the data provider and consumer sides.

Fictional usage assumptions

Before diving into the numbers, here are technical and operational assumptions you can use as a baseline for your own estimates.

Technical assumptions

Category Assumption Justification
Data Volume 5 GB per participant Includes 6 months of historical data, and backups
Network Traffic 20 GB/month per participant Data transfers between participants
API Calls 100,000/month per participant Catalog queries, contract negotiations, and data transfers
OAuth Token Requests 1,000/month per participant Machine-to-machine authentication for data plane operations

Table 1: Technical assumptions for EDC connector cost estimation

Operational assumptions

  • Single AWS Region: Spain (eu-south-2)
  • Operating hours: 24/7/365.
  • Growth rate: Not considered in baseline estimates.
  • Disaster recovery: Automated backups only (no cross-region replication)

Deployment architecture and scenarios

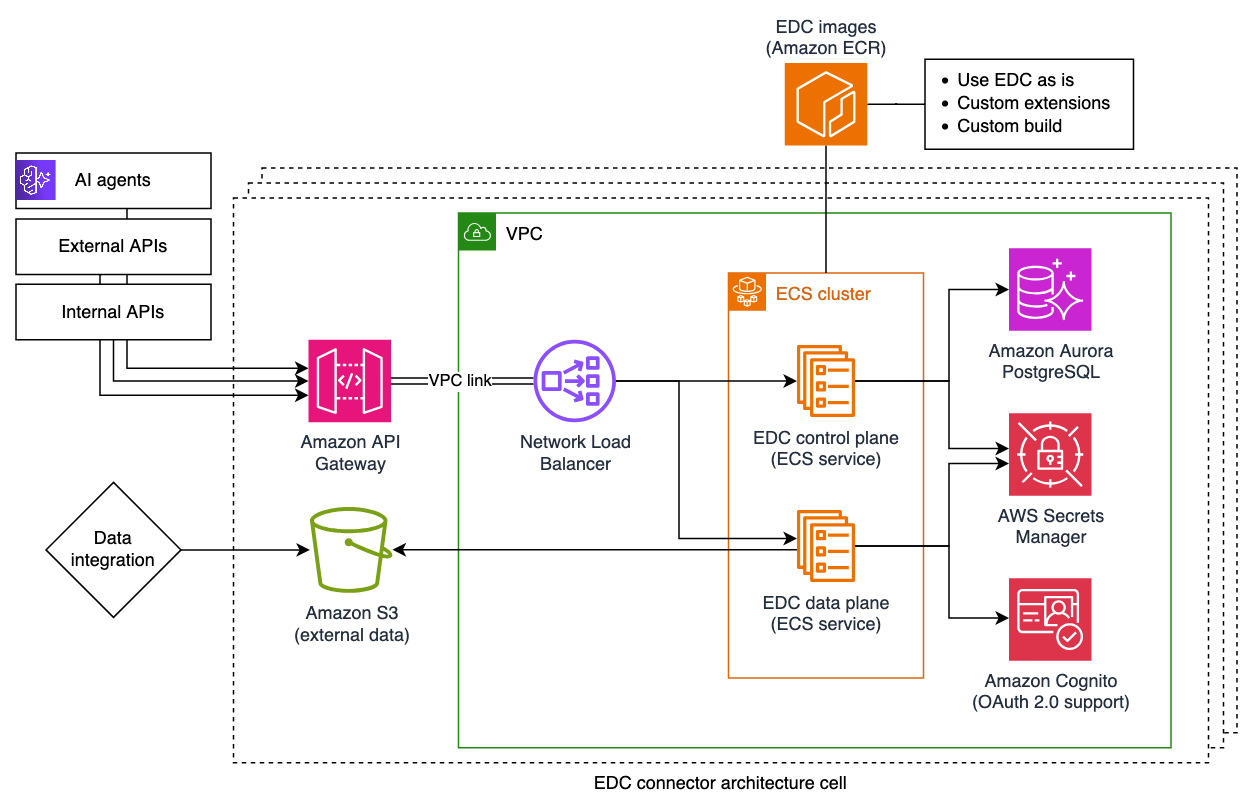
Figure 1 shows the reference architecture for deploying production-ready EDC connectors on AWS, covered in depth in Part 2 of this series.

Production-ready EDC connector deployment architecture diagram showing AWS services including Amazon ECS, Amazon Aurora, Network Load Balancer, and supporting services

Figure 1: Production-ready EDC connector deployment

This post considers two cost scenarios depending on the criticality of the workload:

  • Business-critical workloads: Designed for high availability, performance, and reliability of use cases supporting critical business functions.
  • Non-critical workloads: Designed for use cases that tolerate interruptions, testing environments, or production workloads where brief disruptions are acceptable.

Both scenarios follow the architecture patterns described in Part 2 of this post series, with the primary differences being in sizing of compute and database resources.

Cost estimation: Business-critical workloads

Note: These estimates use the assumptions above and illustrate the relative cost contribution of each service. Your actual costs may vary based on your specific usage patterns, data volumes and regional pricing. This post highlights which components represent the highest cost drivers and therefore come with the highest potential for optimization.

AWS Service Configuration Monthly Cost (USD)
Amazon Aurora PostgreSQL-Compatible Edition db.r6g.large (2 vCPU, 16 GB), 20 GB storage + 10 GB backup 276.00
Amazon Elastic Container Service (Amazon ECS) with AWS Fargate 2 vCPU, 4 GB RAM, always on 83.00
Network Load Balancer 20 GB processed data 20.00
AWS Secrets Manager 10 secrets 4.00
Amazon Cognito 1K machine-to-machine (M2M) token requests 2.25
Amazon Elastic Container Registry (Amazon ECR) 2 GB storage, 10 GB transfer 1.00
Amazon API Gateway 100K REST API calls 0.40
Amazon Simple Storage Service (Amazon S3) 5 GB Standard tier 0.10
Total 387.00

Table 2: Estimated monthly cost for business-critical EDC connector deployment

These estimates help identify where your budget goes and where optimization has the most impact. In the business-critical scenario, the main cost driver is Amazon Aurora PostgreSQL. The db.r6g.large configuration is selected for constant workloads that require reliability and speed with high memory and performance. Amazon ECS with AWS Fargate is the second largest cost contributor as it runs containers continuously to maintain environment availability. Network Load Balancer represents a third notable cost component, while the remaining services contribute only a small portion of the total cost.

Cost estimation: Non-critical workloads

If you are running development, testing, or experimentation environments, you can reduce costs by up to 58% through rightsizing and use of Amazon EC2 Spot capacity.

AWS Service Configuration Monthly Cost (USD)
Amazon Aurora PostgreSQL-Compatible db.t4g.medium (2 vCPU, 4 GB), 20 GB storage + 10 GB backup 110.00
Amazon ECS with AWS Fargate Spot 2 vCPU, 4 GB RAM, always on 26.00
Network Load Balancer 20 GB processed data 20.00
AWS Secrets Manager 10 secrets 4.00
Amazon Cognito 1K M2M token requests 2.25
Amazon ECR 2 GB storage, 10 GB transfer 1.00
Amazon API Gateway 100K REST API calls 0.40
Amazon S3 5 GB Standard tier 0.10
Total 164.00

Table 3: Estimated monthly cost for non-critical EDC connector deployment

These figures show that a non-critical configuration can cut costs significantly while maintaining the same data throughput and API capacity. Costs are reduced through the use of smaller and more flexible resources. Amazon Aurora PostgreSQL remains the main cost driver, but the smaller instance type (db.t4g.medium) reduces cost significantly. From a compute perspective, using Amazon ECS with AWS Fargate Spot capacity cuts costs by almost 70% compared to the business-critical setup. In total, this configuration reduces the monthly cost by approximately 58%, while maintaining identical assumptions for data throughput, API calls, and storage.

Key takeaways on cost optimization

This comparison shows that the primary cost contributors in both scenarios are database, compute and load balancing resources, which represent baseline infrastructure costs rather than usage-based charges. Services like Amazon S3, API Gateway, and data transfer charges contribute marginally to overall costs at these volumes. This cost structure indicates that the architecture scales efficiently with increased usage. As you onboard more use cases and increase data volume and velocity, you get more value from your existing infrastructure investment without proportional cost increases.

Well-Architected pillars: Performance efficiency, cost optimization, and sustainability

Part 2 of this series covered EDC best practices along the Operational Excellence, Security, and Reliability pillars of the AWS Well-Architected Framework. This section covers the remaining three pillars as they apply to EDC deployments.

Performance efficiency

Right-size compute resources: Match your Amazon ECS task definitions to actual workload requirements. Start with smaller configurations and scale up based on observed metrics rather than over-provisioning from the start. Amazon CloudWatch Container Insights provides the visibility needed to make informed sizing decisions.

Use the flexibility of Amazon Aurora: For workloads with variable demand patterns, consider Amazon Aurora Serverless v2 which automatically scales database capacity based on application needs. This eliminates the need to provision for peak capacity while maintaining performance during high-demand periods.

Optimize data transfer patterns: Design your data plane operations to minimize unnecessary data movement. Use Amazon S3 Transfer Acceleration for large transfers across geographic distances and consider data compression where appropriate to reduce both transfer times and costs.

Cost optimization

Reduce compute costs for fault-tolerant workloads: With AWS Fargate Spot, you can save up to 70% for workloads that can tolerate interruptions. Non-critical environments, batch processing, and development workloads are ideal candidates. Implement graceful shutdown handling to manage Spot interruptions effectively.

Lower storage costs over time: Configure Amazon S3 Lifecycle policies to automatically transition infrequently accessed data to lower-cost storage classes such as S3 Intelligent-Tiering or S3 Glacier Instant Retrieval. For EDC connector deployments, historical transfer logs and archived assets are good candidates for tiered storage.

Monitor for unexpected cost increases: Use AWS Cost Explorer and set up AWS Budgets with alerts to help detect unexpected cost increases. Tag EDC-related AWS resources consistently so you can accurately allocate costs and identify optimization opportunities.

Lock in lower rates for predictable workloads: For business-critical connectors with predictable, steady-state usage, Savings Plans for Amazon Aurora and AWS Fargate can provide significant discounts compared to On-Demand pricing.

Sustainability

Optimize resource utilization: Higher utilization of provisioned resources means less waste. Use automatic scaling policies to match capacity with demand and shut down non-production environments outside of business hours when possible.

Select efficient instance types: AWS Graviton-based instances (such as the r6g and t4g families used in our example) deliver better price-performance and energy efficiency compared to equivalent x86 instances. AWS Graviton processors offer improved performance per watt of energy use.

Minimize data movement: Each data transfer consumes energy. Design your data space integrations to avoid redundant transfers, cache frequently accessed catalog data of peers locally using the Federated Catalog, and batch operations where possible to reduce the total number of network round trips.

Summary

By rightsizing AWS infrastructure to match actual compute and database capacity needs, data space participants can achieve significant cost savings without compromising on data security and sovereignty aspects that make data spaces valuable. The comparison between business-critical and non-critical workload configurations demonstrates how AWS services like Amazon Aurora, AWS Fargate Spot, and Amazon S3 can be combined effectively to balance data sovereignty, performance, and cost efficiency.

As data spaces grow in adoption across industries and geographies, understanding these cost dynamics becomes increasingly important as you plan your network participation. The patterns and estimates in this post series offer a foundation for planning your cross-organizational data strategy and data spaces journey on AWS.

To get started, assess your workload criticality to determine whether a business-critical or non-critical configuration fits your needs. Then use the AWS Pricing Calculator to estimate costs for your specific data volumes, regions, and usage patterns. For an end-to-end reference implementation, explore the Dataspace Connector on AWS project which combines Infrastructure-as-Code with custom EDC extensions and AI tooling integration.

References

About the authors
Eclipse Dataspace Components on AWS: Architecture patterns in production

Post Syndicated from Jonas Bürkel original https://aws.amazon.com/blogs/architecture/eclipse-dataspace-components-on-aws-architecture-patterns-in-production/

Running Eclipse Dataspace Components (EDC) connectors in production on AWS requires deliberate architecture decisions around isolation, managed services, and security layering. In Part 1 of this series, we covered the fundamentals of data space architectures and EDC per the International Data Space Association’s (IDSA) standards. If you are new to EDC, we recommend starting there. We showed how connector functionality can be customized to support native integration with Amazon Web Services (AWS) Cloud services. Examples include Amazon Simple Storage Service (Amazon S3) for data storage and AWS Secrets Manager for credentials management. In this post, we dive deeper into the connector deployment architecture on AWS and present patterns and practices for production-grade deployments.

Fundamental architecture building blocks

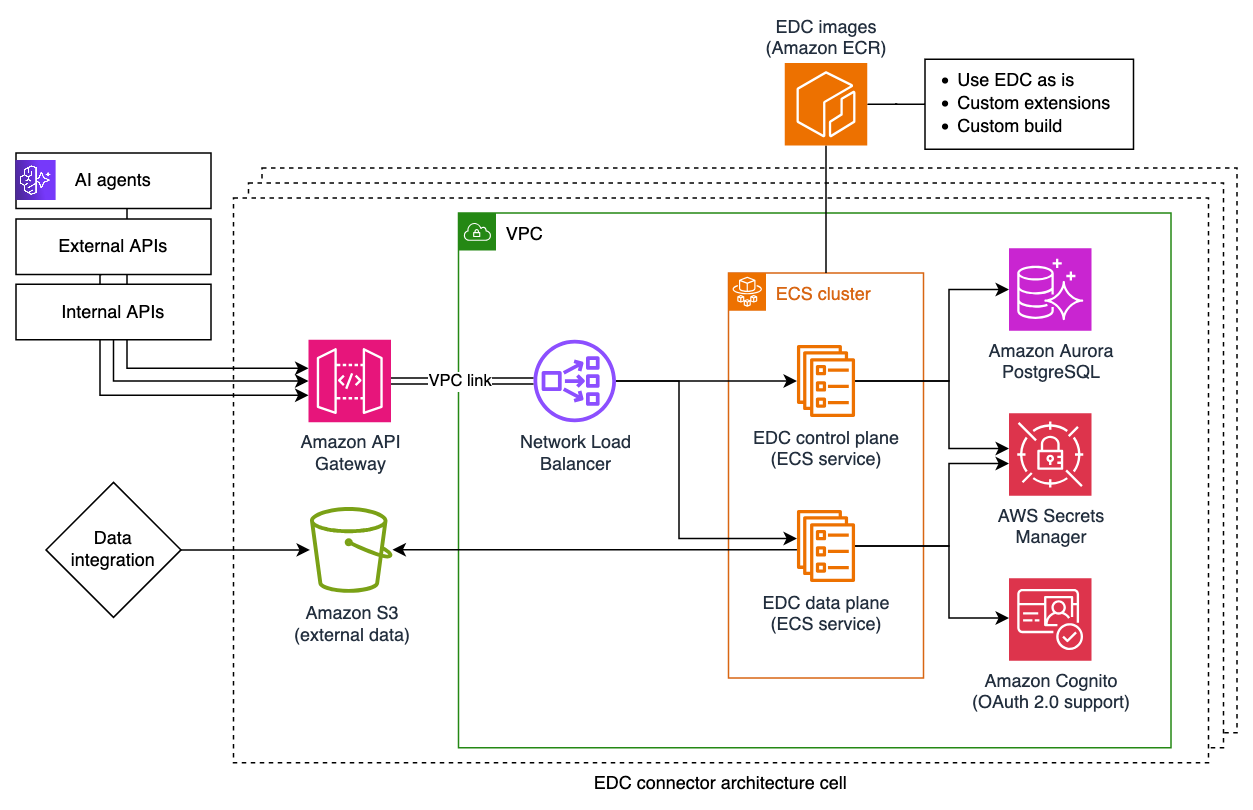
The EDC connector consists of a control plane and a data plane that customers typically ship and deploy as containers. Depending on data integration requirements and support for specific protocols and capabilities, a custom EDC build process may need to be implemented as described in Part 1 of this series. For example, you may need OAuth 2.0 client credentials for the data plane to connect to backend systems. You store the resulting EDC container images in a container registry, such as Amazon Elastic Container Registry (Amazon ECR). Figure 1 shows an example architecture for EDC connector deployments on AWS following best practices for production use.

Architecture diagram showing production-ready EDC connector deployment on AWS with Amazon ECS, Aurora, S3, and API Gateway components

Figure 1: Production-ready EDC connector deployment on AWS

You can split the architecture into four sub-components:

  • Amazon Elastic Container Service (Amazon ECS) and AWS Fargate provide serverless container orchestration. This allows for scalable EDC deployment without managing any of the underlying infrastructure.
  • EDC requires persistence to store secrets and relational control plane data, and a means of vending OAuth 2.0 client credentials. AWS Secrets Manager, Amazon Aurora and Amazon Cognito can provide these capabilities as managed services.
  • Amazon S3 provides durable data storage for handling both inbound and outbound data that is shared and received through the data space.
  • Finally, Amazon API Gateway and Network Load Balancer provide secure, private network connectivity to EDC APIs in an isolated Amazon Virtual Private Cloud (Amazon VPC) using VPC links.

With this approach, all cloud resources belonging to a single EDC connector instance form an isolated architecture cell. You access this cell through the S3 bucket to move in data that is to be shared as part of an EDC asset, or to retrieve data received from a third party as part of an EDC data transfer. Secondly, the API Gateway can be configured to expose selected EDC API resources from its management API, data plane API and Dataspace Protocol (DSP) API. You can protect both means of interacting with the EDC architecture cell using AWS Identity and Access Management (AWS IAM) and the AWS Signature Version 4 (SigV4) protocol.

Larger enterprises participating in data spaces may decide to operate multiple EDCs depending on their requirements on failure isolation, data governance, and separation of shared and received data. A common pattern is to deploy separate connector instances per use case. Infrastructure-as-code such as AWS Cloud Development Kit (CDK) allows for automated, templatized deployment and management of EDC connectors over time while keeping operational effort at bay. Using the Dataspace Connector on AWS reference implementation, a full connector cell deploys from a single CDK command, ready to negotiate contracts and transfer data. Amazon API Gateway also comes with Model Context Protocol (MCP) proxy support. This allows EDC APIs to be consumed by authorized AI agents and MCP clients for autonomous data collection and sharing. Besides integration with agentic systems, customers often follow a workflow-based approach for connecting EDCs with their cloud-based data environments. They interact with both APIs and the peripheral S3 bucket to securely expose and retrieve external information.

Real-world validation of these architecture patterns can be seen in production deployments like the Prometheus-X Data Space Connector, for education sector use cases. This implementation uses the same core architecture we recommend: Amazon ECS with AWS Fargate for container orchestration, S3 for data storage, and event-driven processing with AWS Lambda and Amazon EventBridge. This demonstrates how these patterns work effectively in production environments across different industry sectors.

Key principles for production-readiness

We discuss some of the architecture principles that inform the best practices diagram highlighted in Figure 1 along three of the AWS Well-Architected Framework’s pillars.

Operational Excellence

Infrastructure as Code for Consistency: Define all infrastructure declaratively to support repeatable, version-controlled, and testable deployments. Automated validation, for example using CDK Nag, helps catch misconfigurations and security issues before deployment, shifting security left in the development lifecycle. The code itself serves as living documentation of the architecture.

Observability as a First-Class Concern: Treat monitoring and logging as core infrastructure components. Amazon CloudWatch Container Insights, Amazon CloudWatch Logs, and EDC’s structured health check endpoints provide visibility into system behavior, supporting proactive issue detection and faster troubleshooting. EDC APIs for health checks can be similarly exposed with restricted access through API Gateway and IAM.

Managed Services Over Self-Managed Infrastructure: Use AWS managed services (Aurora, Secrets Manager, Fargate, Cognito) instead of deploying and maintaining compatible self-managed solutions. This shifts undifferentiated heavy lifting to AWS and reduces operational burden. You gain high availability, built-in security best practices, compliance certifications, and automatic updates.

Security

Defense in Depth: Implement security through multiple independent layers rather than relying on a single control. Network isolation (VPC private subnets), security group segmentation (restricting traffic between components), IAM least privilege (scoped permissions per service), and encryption (at rest and in transit) each provide independent controls. These layers work together so that if one layer is bypassed, others continue to provide protection.

Principle of Least Privilege: Every component receives only the minimum permissions required for its specific function. Scope IAM roles to individual services (control plane, data plane) and restrict security groups to necessary ports and sources. The internal-only Network Load Balancer fronted by API Gateway prevents unintended public exposure of EDC APIs and data. This may also support security review and approval of EDC as open-source software, since APIs can be allowlisted and validated individually.

Encryption Everywhere: Encrypt data by default at every stage: at rest (Aurora, S3, Secrets Manager), in transit (TLS enforcement, HTTPS-only egress), and during processing (encrypted environment variables). This provides comprehensive data protection regardless of where information resides in the system.

Reliability

Fail Fast, Recover Automatically: Systems detect failures quickly and recover without manual intervention. ECS circuit breakers can automatically roll back failed deployments, automated health checks remove unhealthy targets, and point-in-time recovery supports rapid database restoration. This minimizes mean time to recovery (MTTR) and reduces the scope of failures, even within a single EDC architecture cell.

Design for Regional Resilience: Cross-zone load balancing distributes traffic across multiple Availability Zones (AZs), Aurora automatically replicates data across AZs, and Fargate tasks can be scheduled in any AZ. The highlighted architecture can tolerate Availability Zone failures in an AWS Region without service disruption. For more information about Availability Zones and Regions, see AWS Global Infrastructure.

Decoupled Components with Clear Boundaries: Deploy the control plane and data plane as independent services with distinct responsibilities, security contexts, and scaling characteristics. This separation enables independent updates, targeted scaling, and failure isolation between coordination logic and data transfer operations.

The remaining three Well-Architected Framework pillars of Performance Efficiency, Cost Optimization, and Sustainability are covered in the third post of this series where we discuss cost optimization strategies for running EDC connectors on AWS.

Conclusion

With the growing popularity of data spaces and EDC as a data space connector, it is important to distinguish between a setup suitable for testing and experimentation and one that is ready for production. Production environments require that business-critical processes depend on timely, successful transmission of confidential information between participants. The architecture defined in this post combines EDC deployment best practices from the community with AWS recommendations to achieve fault tolerance, scalability, and security while keeping operational complexity at a minimum.

In part 3, you will learn about cost optimization strategies to run your production-ready connector efficiently and maximize the value it returns by supporting business use cases for data sharing along your supply network. In the meantime, explore the Dataspace Connector on AWS project and see how the patterns and best practices covered in this post come together in an end-to-end reference implementation.

References

About the authors
Patch perfect: Automating Amazon Redshift patch testing

Post Syndicated from Eva Donaldson original https://aws.amazon.com/blogs/big-data/patch-perfect-automating-amazon-redshift-patch-testing/

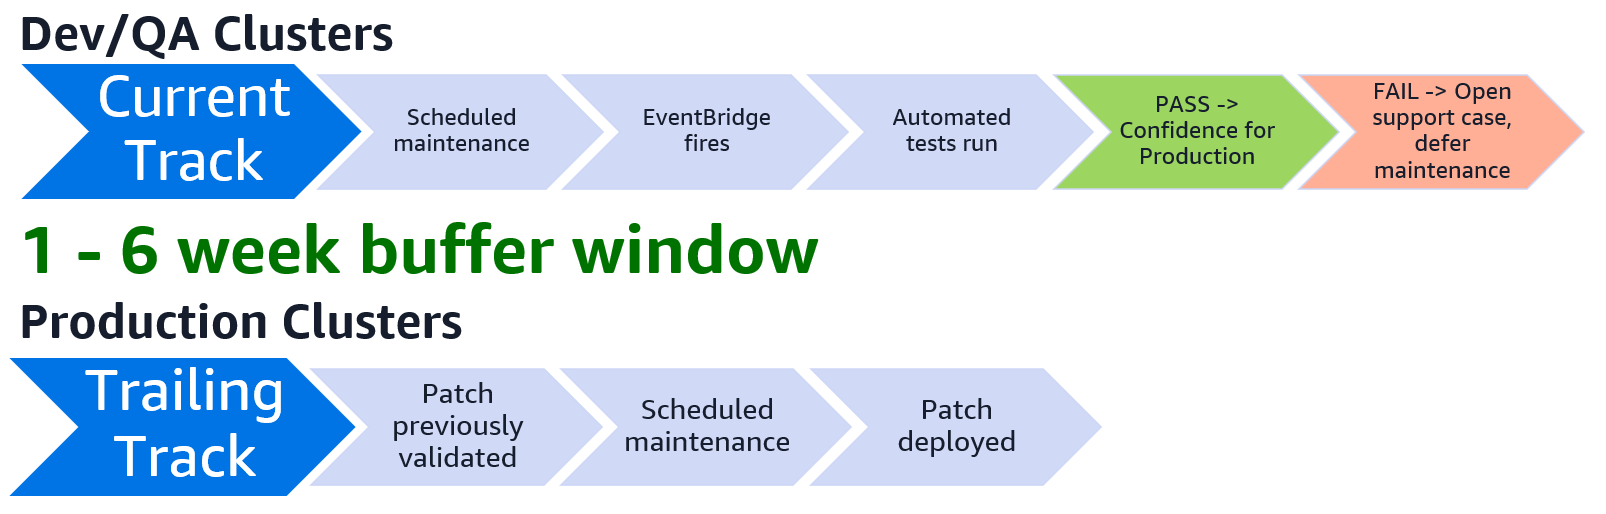
Amazon Redshift continuously innovates to deliver improved performance and advanced features. In some releases, Amazon Redshift patches might introduce behavior changes. Testing patches in a non-production environment confirms that production workloads continue to function and you can maintain your applications’ service level agreements. As a best practice, keep Dev/QA clusters on the Current patch track and Production on the Trailing track. Test on Dev/QA when a patch lands, allowing 1–6 weeks of review before the scheduled production deployment.

In this post, we demonstrate an automated test suite that validates your Amazon Redshift cluster automatically after any patch, reboot, or modification. It uses standard drivers against real workload patterns to provide a verified gate between a patch landing and that patch reaching production.

Architecture

The solution uses native AWS services to create an automated validation pipeline.

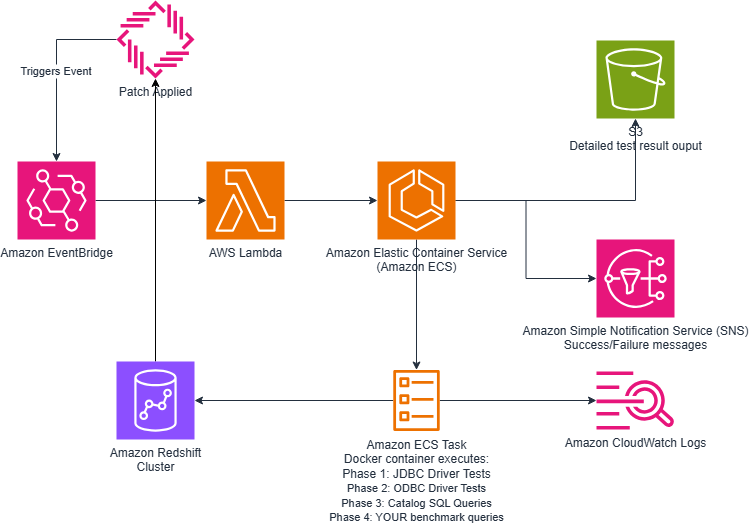
Architecture diagram of the patch testing pipeline: Amazon EventBridge triggers AWS Lambda, which runs an AWS Fargate task that tests the cluster and reports to Amazon S3 and Amazon SNS

Figure 1 — High-level architecture diagram

Process overview showing the four stages: event detection, orchestration, test execution, and reporting

Figure 2 — Process overview

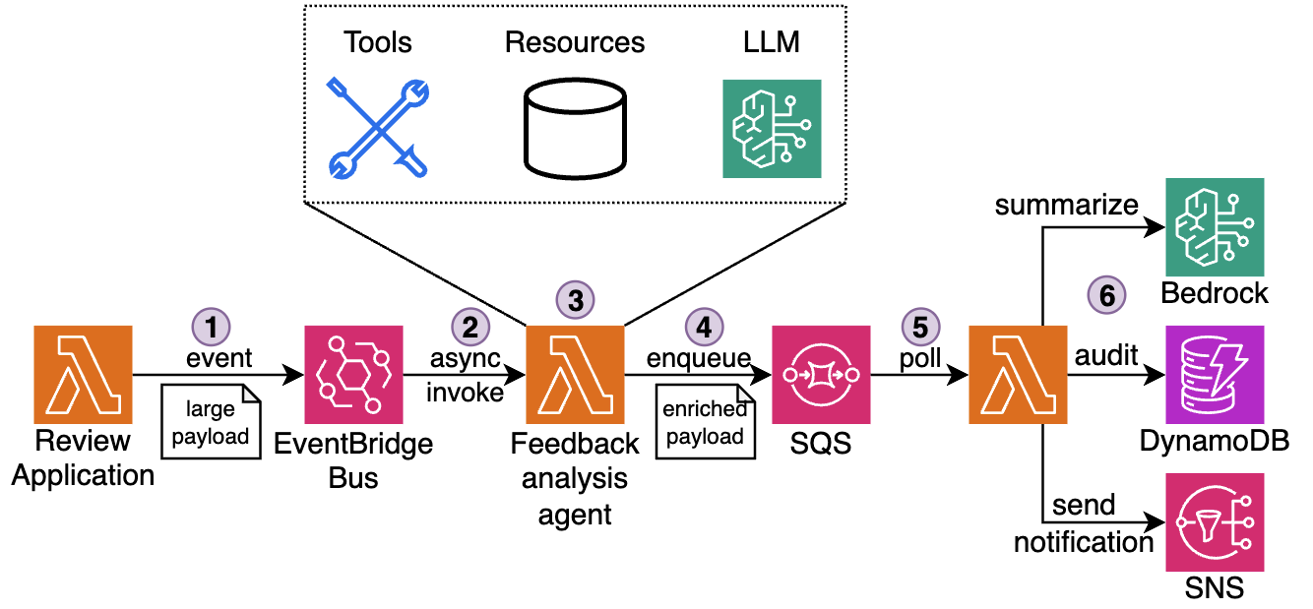
  1. Event Detection: When your Amazon Redshift cluster receives a patch, reboot, or modification, the Amazon Redshift cluster event notifications fire. Amazon EventBridge rules match these events automatically.
  2. Orchestration: A lightweight AWS Lambda function receives the event from the Amazon EventBridge rule and launches an AWS Fargate task. The task runs in a subnet within the same Amazon Virtual Private Cloud (VPC) as your Amazon Redshift cluster, giving the test runner direct network connectivity to the cluster endpoint.
  3. Test Execution: A Docker container runs a comprehensive test suite in four phases:
    • JDBC Driver Tests – Validates the official Amazon Redshift JDBC driver, testing DatabaseMetaData API calls, connection handling, and queries that tools like SQL Workbench/J depend on.
    • ODBC Driver Tests – Validates the PostgreSQL ODBC driver with SQLTables, SQLColumns, and other ODBC API calls that RStudio and similar tools use.
    • Catalog SQL Queries – Runs approximately 35 queries against pg_catalog, information_schema, and svv_* views, organized by client (SQL Workbench, DBeaver, RStudio, JDBC metadata API).
    • Performance Benchmarks – Executes your custom workload queries and compares execution time against known baselines, flagging regressions. For convenience, the solution includes sample queries to be replaced with performance validation queries from your workloads.
  4. Reporting: Detailed JSON results land in Amazon Simple Storage Service (Amazon S3) for historical analysis. An Amazon Simple Notification Service (Amazon SNS) notification sends your team an email immediately with a pass/fail summary. Full JSON results are written to Amazon S3 with timing data for every individual query, row counts, error details, and the Amazon EventBridge event that triggered the run. If tests fail, you have specific, actionable evidence (which queries broke, which drivers failed, which benchmarks regressed) to open a support case requesting a rollback and defer maintenance until the case is resolved. When tests succeed, you can move forward with confidence to production.

For real-time feedback while the tests are running, a quick command tells you the current state:

aws lambda invoke --function-name my-redshift-tests-trigger \
--payload '{}' --cli-binary-format raw-in-base64-out /dev/stdout

What gets tested

The test suite covers two critical areas: client tool compatibility and query performance.

Client compatibility queries

The test suite replicates the connection behavior of popular SQL clients by issuing the same metadata API calls and queries they perform when connecting to your cluster.

Client What’s tested
SQL Workbench/J Connection queries, schema browsing, metadata enumeration
DBeaver Database object discovery, catalog traversal
RStudio (DBI/odbc) ODBC-specific catalog queries, column type mapping
JDBC Metadata API getTables(), getColumns(), getPrimaryKeys(), and other DatabaseMetaData method equivalents

The package contains the exact queries these clients execute upon connection.

Performance regression detection

The benchmark phase of the suite automatically detects whether it has been run before. On the first execution, it captures baseline query execution times as the “known good” state for your pre-patch environment. On every subsequent run, it compares current query timings against the stored baseline and flags any regressions. If a query that previously completed in 2 seconds now takes 15, the report calls it out immediately. This phase is designed to test your most performance-sensitive queries.

Prerequisites

Before deploying, make sure your environment meets the following requirements:

Docker installed. Consider building the image with AWS CloudShell, which comes with Docker pre-installed. You can do this either by uploading the customized repo to Amazon S3 and then downloading it to AWS CloudShell, or by cloning and customizing the repo directly within AWS CloudShell.

Getting started

The full solution is available on GitHub. It includes the AWS CloudFormation template, Docker build scripts, test suite, and documentation.

Clone the GitHub repo, customize it for your workload, deploy it against a Dev/QA cluster.

Detailed instructions are included in the package README.md. Reference those for deployment.

Step 1: Clone the repo

Clone the GitHub repo.

Step 2: Customize the scripts for your environment

The test suite ships with comprehensive default queries. After cloning and before deployment, edit the scripts as described in the following sections for each phase.

Add your performance-critical queries

Edit bundle/run_tests.py and replace the example queries with queries where performance is critical:

BENCHMARK_QUERIES = {
    "daily_patient_summary": """
SELECT department, COUNT(DISTINCT patient_id), AVG(los_days)
FROM clinical.encounters
WHERE admit_date >= CURRENT_DATE - 30
GROUP BY 1
""",
    "revenue_rollup": """
SELECT payer_type, SUM(total_charges)
FROM billing.claims
WHERE service_date >= DATE_TRUNC('month', CURRENT_DATE)
GROUP BY 1
""",
}

Add client-specific catalog queries

If your team uses custom views or schemas, add them to bundle/client_catalog_queries.py:

"custom_view_check": {
    "description": "Verify our reporting view works after patching",
    "sql": "SELECT * FROM analytics.monthly_kpis LIMIT 10",
},

Step 3: Build the Docker image

Execute build-image.sh, which creates an Amazon ECR repository, builds the Docker image (with JDBC and ODBC drivers bundled), and pushes it, outputting the image URI for the next step.

# Upload project to S3, then build in CloudShell
./build-image.sh --stack-name my-redshift-tests

Step 4: Deploy the stack

Use the AWS Command Line Interface (AWS CLI) to deploy the AWS CloudFormation stack with your environment-specific parameters. The stack creates the required components: Amazon Elastic Container Service (Amazon ECS) cluster, AWS Fargate task definition, security groups, VPC endpoints (to keep AWS Secrets Manager and Amazon SNS traffic off the NAT gateway), Amazon S3 bucket, Amazon SNS topic, AWS Lambda trigger, and Amazon EventBridge rules.

aws cloudformation deploy \
--template-file template.yaml \
--stack-name my-redshift-tests \
--parameter-overrides \
RedshiftSecretArn=arn:aws:secretsmanager:... \
RedshiftHost=my-cluster.xxxx.us-east-2.redshift.amazonaws.com \
RedshiftClusterIdentifier=my-cluster \
VpcId=vpc-xxxxxxxx \
VpcSubnetIds=subnet-aaa,subnet-bbb \
RedshiftSecurityGroupId=sg-xxxxxxxx \
EcrImageUri=123456789012.dkr.ecr.us-east-2.amazonaws.com/my-redshift-tests-runner:latest \
[email protected] \
--capabilities CAPABILITY_NAMED_IAM

Key takeaways

Here are the core principles that make automated patch testing effective:

  1. Dev/QA on Current track, Production on Trailing: This separation creates the buffer window between when a patch is available and when it reaches production. Without it, there’s no opportunity to catch regressions before they affect users.
  2. Automate the validation: The track split is most effective if the test suite runs after every patch. Event-driven automation helps confirm no patch goes untested during the buffer window.
  3. Test with real drivers: Simulated queries aren’t sufficient. The test suite exercises the Amazon Redshift JDBC and PostgreSQL ODBC drivers that your SQL clients depend on. This validates the same code paths your tools use in production.
  4. Event-driven, not scheduled: Tests run the moment a patch is applied. They don’t run on a fixed cron schedule. Patch applied, then test executed, then results delivered in minutes.
  5. Low operational overhead, minimal cost: The entire solution is serverless (AWS Lambda and AWS Fargate). There are no instances to manage and no agents to install. The Fargate task spins up only when a patch event fires, runs the test suite, and shuts down. You pay only for the compute each test run consumes.

Clean up

When you no longer need the automated test suite, delete the associated resources so you don’t incur ongoing costs.

  1. Delete any created prerequisites, if not needed.
    1. Amazon Redshift cluster (removes the managed secret).
    2. NAT gateway.
    3. VPC.
  2. Empty the Amazon S3 results bucket (AWS CloudFormation cannot delete non-empty buckets).
  3. Delete the image you installed in the Amazon ECR repository in step 1 of getting started.
  4. Delete the AWS CloudFormation stack to remove the Amazon ECS cluster, AWS Fargate task definition, security groups, VPC endpoints, Amazon S3 bucket, Amazon SNS topic, AWS Lambda function, and Amazon EventBridge rules created by the deployment.
    aws cloudformation delete-stack --stack-name my-redshift-tests

Conclusion

Automated patch testing ensures consistent and predictable performance of your production workloads. By deploying Dev/QA clusters on the Current track with event-driven validation, you gain weeks of advance notice before patches reach production. The solution presented here provides comprehensive testing of JDBC drivers, ODBC drivers, catalog queries, and performance benchmarks. It requires zero manual intervention. Deploy it once, customize it for your workload, and gain confidence that the next Amazon Redshift patch will be validated before it matters.

To learn more about Amazon Redshift, explore the following resources:


About the author

Eva Donaldson

Eva Donaldson

Eva is a Senior Technical Account Manager (TAM) at AWS, specializing in Healthcare & Life Sciences customers. With 20+ years of experience as a data architect, engineer, and team manager, she focuses on designing automated data platforms and solutions that solve real business problems.

AWS Weekly Roundup: AWS Builder Center at 1 year, Network Scanning in Security Hub, Loom for AWS, and more (July 13, 2026)

Post Syndicated from Esra Kayabali original https://aws.amazon.com/blogs/aws/aws-weekly-roundup-aws-builder-center-at-one-year-network-scanning-in-security-hub-loom-for-aws-and-more-july-13-2026/

AWS Builder Center turned one year old last week. Launched on July 9, 2025, the platform has grown from a community hub with Wishlist voting, community profiles, and a toolbox into a full ecosystem with sandbox environments, workshops, Spaces, and a Builders’ Library. To mark the anniversary, Rick Suttles published a full feature timeline covering everything shipped over the past year: AWS Capabilities by Region (1,500+ services across 37 Regions), Spaces for community-created groups, workshops with category and complexity filters, badges and streaks, article series, view counts, saved items, student status, availability notifications, sign-in with GitHub and Amazon, and sandbox environments.

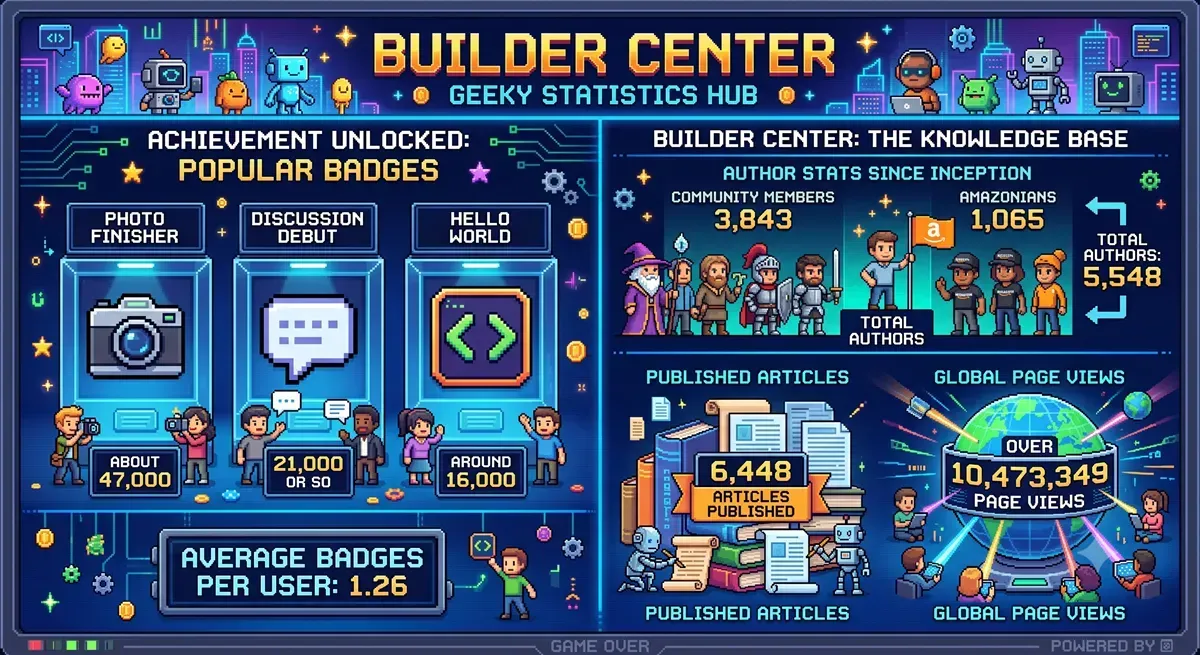
Jeff Barr published a retrospective summarizing Builder Center’s first year. Since launch, 5,548 authors have published 6,448 articles with more than 10.4 million page views combined. Builders have earned 99,226 badges since the badge system launched in March 2026. Community members have submitted 565 wishes, 10 of which have shipped with another 20 on the near-term roadmap.

The top community article Building an AWS Study Buddy with MCP + Strands Agents SDK by Dineshraj Dhanapathy reached 50,000+ views. Chris Miller’s Migrating an EOL Linux Server to AWS in 8 Hours with Kiro followed at 45,000+, and Yash Aggarwal’s AIdeas: NeuroVoice – Multimodal AI for Early Screening of Neurological Diseases article reached 38,000+.

The week’s headline addition is Sandbox Environments by Rick Suttles. Sandboxes give you a free, pre-provisioned AWS account to complete a workshop exercise. Each environment is active for 8 hours, after which the account and all its resources are automatically de-provisioned. You can have one active sandbox at a time and request one per week. No personal AWS account, credit card, or manual cleanup required.

Last week’s launches
Here’s what else happened this week.

  • AWS Security Hub introduces Network Scanning – Security Hub introduced Network Scanning, a capability that identifies resources in your environment that are reachable from the public internet. Network Scanning probes your resources from the internet to detect actual reachability, complementing the existing network reachability findings in Security Hub that identify configurations that could make a resource reachable. It discovers public IP addresses, virtual machines, and load balancers across your AWS and Azure environments, identifies reachable ports, and determines what services are running behind them. Each reachable port generates a Security Hub finding with evidence of the port and service discovered. Security Hub Exposures then automatically correlates these findings with other findings and resource configurations to determine broader risk. Existing customers can enable Network Scanning in individual accounts and Regions, or across an organization through a configuration policy. For new customers, Network Scanning is on by default. It is included with Security Hub Essentials at no additional cost.
  • Security Hub also extends unified security management to Microsoft Azure – Security Hub now monitors Microsoft Azure resources, providing unified posture management, vulnerability management, and security response across both clouds. It automatically discovers Azure VMs, container images, Function Apps, and identities, and evaluates them for misconfigurations, internet exposure, and software vulnerabilities. AWS and Azure findings appear in the same prioritized view with the same formats and automation workflows.
  • Amazon SageMaker Studio integrates with Hugging Face for one-click model deployment and customization – You can now go from discovering a model on Hugging Face to working with it in SageMaker Studio in a single click. Select any supported model on Hugging Face and choose “Customize on SageMaker AI” or “Deploy on SageMaker AI” to land directly on the corresponding workflow page with the model pre-loaded. New customers receive a Studio environment created in seconds with pre-configured permissions for serverless model customization (including fine-tuning with custom reward functions for reinforcement learning), model evaluation, and deployment to SageMaker or Bedrock endpoints. Verified customers receive default GPU access to G5, G6, and G4dn instances without requesting quota increases, and quota utilization is visible directly inside the Studio environment.
  • Amazon EKS Auto Mode and Amazon ECS Managed Instances reduce GPU management fees by up to 60% – Beginning July 1, 2026, EKS Auto Mode and ECS Managed Instances reduce management fees for accelerated instance types: G-series fees are down 35%, and P-series and AWS Trainium fees are down 60%. The reductions apply automatically to existing clusters and require no action from customers. Both services include capabilities built for accelerated workloads. EKS Auto Mode provides automatic parallel image pulling on GPU instances with local NVMe storage and accelerator-aware node repair. ECS Managed Instances provides GPU metrics through Amazon CloudWatch Container Insights and automatic health monitoring for GPU hardware failures.
  • Amazon Aurora DSQL change data capture (CDC) is now generally available – Aurora DSQL CDC streams the results of insert, update, and delete operations as change events to Amazon Kinesis Data Streams. You can use it to synchronize data across microservices, trigger Lambda functions, or deliver changes to S3, Redshift, and OpenSearch Service through Amazon Data Firehose. CDC streaming is designed to have zero impact on database workload performance and requires no infrastructure to manage.

For a full list of AWS announcements, be sure to keep an eye on the What’s New with AWS page.

Other AWS news
Here are some additional posts you may find useful:

  • Building secure AI agents at scale: Introducing Loom for AWS – Loom is an open-source enterprise platform for building agents with AWS Strands Agents and deploying them on Amazon Bedrock AgentCore Runtime. It provides a unified management UI and backend API with identity provider integration, scope-based authorization, multi-persona navigation, and full lifecycle management for agents, memory, MCP servers, and agent-to-agent integrations. Loom enforces automated resource tagging for cost attribution, implements RBAC and ABAC for multi-tenant security, uses paved-path blueprints for agent deployments, manages identity propagation through delegated actor chains, integrates with AWS Agent Registry for discovery and governance, and supports human-in-the-loop review before sensitive actions. The project is available in AWS Labs on GitHub.
  • Introducing Claude apps gateway for AWS – The Claude apps gateway is a self-hosted control plane that gives organizations centralized control over access, cost, and policy for Claude Code and Claude Desktop. It connects to any OIDC-compliant identity provider, enforces managed settings on every request, routes inference to Amazon Bedrock or Claude Platform on AWS, and supports per-user and per-group spend caps. The gateway runs as a stateless container in your private network, backed by a PostgreSQL database for short-lived sign-in state. No long-lived secrets are stored on developer machines. Deploy it through Amazon Bedrock to keep data within the AWS security boundary, or through Claude Platform on AWS for the native Claude platform experience.
  • Introducing OAuth support for AWS MCP Server – You can now connect agents to the AWS MCP Server using browser-based OAuth with the same credentials you use for the AWS Console or CLI. The new sign-in path supports IAM federation, AWS IAM Identity Center, and root or IAM users. AWS Sign-In issues short-lived access tokens and refresh tokens, with automatic token management so developers stay authenticated across restarts. For headless use cases, a non-interactive flow lets applications with existing AWS credentials obtain OAuth access tokens through the create-oauth2-token-with-iam API. New governance controls include OAuth-specific IAM condition keys, token introspection and revocation, dynamic client registration, and CloudTrail audit elements.

For a full list of AWS blog posts, be sure to keep an eye on the AWS Blogs page.

Upcoming AWS events
Check your calendar and sign up for upcoming AWS events:

Visit the AWS Builder Center to meet other builders, contribute solutions, and find resources that help you keep building.

Wishing everyone a restful and enjoyable summer. Whether you’re building, learning, or recharging, I hope you find time for all three. I’ll be heading to Scandinavia for a few weeks to trade the heat for some cooler weather and longer evenings. Come back next week for more news!

— Esra

Why tombola chose Graviton-powered RG instances for Amazon Redshift

Post Syndicated from Prabhu Pandian original https://aws.amazon.com/blogs/big-data/why-tombola-chose-graviton-powered-rg-instances-for-amazon-redshift/

Part of Flutter Entertainment, the world’s largest online sports betting and iGaming operator, tombola is the world’s biggest online bingo community and has been using Amazon Redshift to run its data analytics workloads. Founded in Sunderland, UK, the company traces its roots to the 1950s, when it began printing bingo tickets during the golden age of the game. tombola launched online in 2006 and has since expanded to Italy, Spain, Denmark, and Sweden. The company builds all of its games in-house, holds the most prestigious Safer Gambling award, and recently partnered with Flutter sibling brand Sisal to bring its bingo application to Italian players.

In this post, you learn how tombola followed a strict engineering principle: no changes to production without evidence. That meant a head-to-head comparison of RA3 versus RG on their actual workload. You also see benchmark results on Amazon S3 Tables and the migration from RA3 to RG instances.

Current data architecture

Amazon Redshift sits at the center of tombola’s data architecture. The production cluster runs on RA3 nodes and serves multiple schemas with hundreds of tables, supporting every analytical workload the business runs, from sub-second application lookups to multi-minute extract, transform, load (ETL) transforms. What makes tombola’s Amazon Redshift workload distinctive is the breadth of what flows through it. Amazon Managed Workflows for Apache Airflow (Amazon MWAA) DAGs orchestrate pipelines across over 14 business domains, including segmentation, fraud detection, marketing, finance, and SafePlay responsible-gaming. Configuration-driven ingestion pipelines land data from SQL Server, Amazon DynamoDB, Amazon OpenSearch Service, Postgres, and external APIs into Bronze and Silver layers on Amazon Simple Storage Service (Amazon S3), before loading it into Amazon Redshift. From there, over 250 dbt models running on Amazon Elastic Container Service (Amazon ECS) transform the data into analytical gold layers. Outputs feed multiple downstream consumers: Amazon SageMaker for fraud scoring and churn prediction, Amazon DynamoDB for low-latency APIs, and region-specific pipelines spanning the UK, Italy, Spain, Denmark, and Sweden. As the application grew, with more domains, more DAGs, and more concurrent users, the team began evaluating ways to reduce steady-state query latency and lower compute cost without rearchitecting the system. When AWS made Graviton-powered RG nodes available for Amazon Redshift, the timing was right.

Benchmark performance results

The benchmark infrastructure was fully defined as infrastructure as code (IaC), making sure every test run was reproducible. The team deployed two test benchmark clusters (one RA3 and one RG) in a like-for-like configuration. They mirrored the settings (Amazon Virtual Private Cloud (Amazon VPC), security groups, AWS Key Management Service (AWS KMS), AWS Identity and Access Management (IAM) roles, and parameter groups) from the production environment to remove configuration drift. The benchmark runner was containerized as an Amazon ECS task (python:3.11-slim-bookworm ARM64 base), providing repeatable, isolated execution for each test round. Benchmark workloads were selected by analyzing production cluster logs and metrics, then classified into three tiers:

  • Heavy: ETL queries with multi-table CTE chains, full-table scans, and aggregation windows.
  • Medium: Business intelligence (BI) queries driving reporting and analytics dashboards.
  • Light: Application queries with sub-second response times.

Architecture

Scenarios tested

To validate the performance of Graviton-powered RG instances against the existing RA3 nodes, tombola designed four benchmark scenarios that progressively increase in complexity and realism. Together, these scenarios provide a comprehensive view of performance from isolated query execution through to sustained, real-world analytical workloads.

Scenario 01: Cold-cache, single-stream execution. This scenario isolates raw compute performance by running queries against a cold cache in a single stream, avoiding caching and concurrency as variables.

Per-query speedups ranged from 1.05× (light lookup queries) to 1.68× (heavy ETL transforms). Zero errors on both clusters (28 attempts each).

Weight Class RA3 p50 (ms) RG p50 (ms) Speedup
Heavy (ETL) 210,372 133,855 1.57×
Medium (BI) 2,193 1,642 1.34×
Light (App) 3.20 2.76 1.16×

The following chart shows per-query speedup ratios for the cold-cache scenario. Heavy ETL queries (left) show the largest gains, with speedups of 1.57–1.68×, and lighter queries still benefit at 1.05–1.16×. The pattern is consistent: RG’s advantage scales with query complexity.

Scenario 02: Warm-cache, single-stream execution. This scenario repeats Scenario 01 with the result cache enabled to confirm that RG maintains its latency advantage even when cached results are in play.

Per-query speedups ranged from 1.04× to 1.64×. Zero errors on both clusters (35 attempts each).

Weight Class RA3 p50 (ms) RG p50 (ms) Speedup
Heavy (ETL) 93,636 61,691 1.52×
Medium (BI) 2,189 1,584 1.38×
Light (App) 3.08 2.58 1.19×

With result caching enabled, the speedup pattern holds for non-cached queries. Cache hits on both clusters land in 118–185 ms, confirming the caching subsystem operates identically regardless of node type. The RG advantage appears exclusively on execution paths that bypass the cache.

Scenario 03: Concurrency sweep. This scenario introduces parallel load by sweeping through 1, 5, 10, and 20 concurrent streams, testing how each node type handles contention and queuing under pressure.

Both clusters used the same Concurrency Scaling configuration (max_concurrency_scaling_clusters=1, WLM-only). RG completed 482 more queries in the same wall-clock window.

Metric RA3 RG Improvement
Total queries completed 1,438 1,920 +33% throughput
Light p50 (ms) 3.44 3.04 1.13×
Medium p50 (ms) 20,784 15,055 1.38×
Errors 0 0

Under increasing parallel load (1, 5, 10, and 20 concurrent streams), RG maintained lower latencies and completed 33 percent more queries in the same wall-clock window. Both clusters used the same Concurrency Scaling configuration, so the throughput difference is attributable to per-node compute efficiency.

Scenario 04: Mixed realistic workload. This scenario combines the previous elements into a mixed realistic workload, running 10 streams simultaneously for 30 minutes with a weighted distribution of heavy, medium, and light queries to simulate actual production conditions.

This scenario best simulates production. The headline finding: heavy ETL queries saw speedups of up to 2.27× under concurrent load, and RG completed 46 percent more total queries in the same 30-minute window. Zero errors on both clusters.

Metric RA3 RG Improvement
Total queries completed 405 593 +46% throughput
Heavy p50 (ms) 1,186,572 642,294 1.85×
Medium p50 (ms) 2,319 1,631 1.42×
Light p50 (ms) 3.12 2.90 1.08×
Errors 0 0

The mixed-realistic scenario best simulates production. Under 10 concurrent streams over 30 minutes, heavy ETL queries showed speedups of up to 2.27×. RG’s per-vCPU throughput advantage compounds under contention, exactly the condition where production clusters spend most of their time.

Extended benchmark: Amazon S3 Tables (Iceberg) performance

tombola’s future data architecture will integrate with agents and revolves around Apache Iceberg, backed by Amazon S3 Tables. Amazon S3 Tables offer Amazon S3 storage that is specifically tuned for analytics, with built-in capabilities that keep making queries faster and helping lower storage costs for table data. They’re purpose-built to hold tabular datasets, such as daily purchase logs, streaming sensor readings, or ad impression events. In this model, data is organized into rows and columns, similar to how information is structured in a traditional database table. With that direction in mind, tombola also benchmarked Graviton’s performance querying Iceberg tables directly. The dataset includes player profiles, game session history, and geolocation data: a mix of wide tables and high-cardinality columns that stress both compute and I/O.

To evaluate performance across different scenarios, tombola generated queries at varying levels of complexity. Medium queries involve standard analytical functions like ranking and aggregation, and Medium-High queries introduce multi-step transformations with joins and cumulative calculations. At the High tier, queries combine distinct counting, conditional pivoting, and time-window aggregations. Very High queries are the most demanding: self-joins across the full dataset, multi-signal scoring logic, and advanced statistical functions. This tiered approach captures how each node type performs as computational demands increase.

As with the previous benchmarks, the team kept the test as comparable as possible: a true like-for-like evaluation between RG (powered by Graviton) and RA3 nodes of equivalent size.

Testing was split into two phases:

Phase 1: Concurrency. All queries were submitted simultaneously to measure how well each node type handles concurrent workloads. The goal was to understand throughput differences: how much more work RG nodes can push through under pressure compared to similarly sized RA3 nodes.

All queries were run simultaneously across multiple rounds:

Grouped bar chart showing total execution time across 3 rounds for RA3 vs Graviton

Phase 2: Sequential execution. Each query was run in isolation with full compute resources available. This removed concurrency as a variable and gave a clean read on raw query performance. The results were clear: RG outperformed RA3 across multiple query types, showing consistent gains when given dedicated compute.

In sequential execution, Graviton (RG) delivered consistent performance gains across all query complexity levels: Medium-complexity queries ran 45–73 percent faster (average 58 percent), Medium-High queries improved by 42 percent, High-complexity queries achieved 57–66 percent faster execution (average 62 percent), and Very High-complexity queries saw gains of 60–67 percent (average 63 percent). The results demonstrate that RG’s advantage scales with workload complexity, delivering the largest improvements on the most demanding analytical queries.

tombola’s modernization approach

tombola is modernizing its Amazon Redshift cluster using the Elastic Resize path to change from RA3 to RG node types. The operation snapshots the existing cluster, provisions a new RG cluster from that snapshot, and transfers data in the background. During this transfer period, the source cluster remains available in read-only mode. When the resize nears completion, Amazon Redshift automatically updates the endpoint to point to the new RG cluster and drops connections to the source. The team chose this approach because it aligns with their engineering principle of evidence-based changes: no production cutover without proof. The benchmark results, with zero errors across all scenarios against production-representative workloads, provided the confidence needed to proceed. After the resize is complete, the external tables, schemas, and query syntax remain unchanged. With RG’s integrated data lake query engine, tombola also removes its dependency on Amazon Redshift Spectrum. Data lake queries now run directly on cluster nodes within the Amazon VPC boundary, using existing IAM roles, with zero per-TB scanning charges.

Conclusion

The benchmark results make a compelling case for migrating tombola’s Amazon Redshift infrastructure from RA3 (Intel Xeon) to RG (Graviton4) instances. Across every scenario tested, RG delivered significant and consistent performance gains:

  • Cold-cache performance: 1.57× faster on heavy ETL queries, with per-query speedups up to 1.68×.
  • Warm-cache performance: 1.52× faster on heavy workloads, maintaining advantage even with result caching enabled.
  • Concurrency: 33 percent higher throughput under parallel load, with RG sustaining lower latencies as streams increased from 1 to 20.
  • Mixed realistic workload: 1.85× faster on heavy ETL queries and 46 percent more total queries completed, the scenario closest to production traffic patterns.
  • Amazon S3 Tables (Iceberg): Up to 51 percent faster under concurrent load and 57 percent faster in sequential execution, critical for tombola’s future lakehouse architecture.

Beyond raw performance, RG delivers architectural benefits that align with tombola’s strategic direction. The integrated data lake query engine removes Amazon Redshift Spectrum overhead and per-TB scan charges. The 4:3 node mapping (4 ra3.4xlarge nodes to 3 rg.4xlarge nodes) reduces infrastructure costs by 25 percent.

Based on these results, tombola are modernizing their production Amazon Redshift cluster to Graviton4-based RG instances. The work has already started and similar results as above are noticed.  The existing RA3 features, including concurrency scaling, data sharing, and system views, are fully supported on RG. This positions tombola to handle growing data volumes and user concurrency with better performance, greater cost efficiency, and a predictable pricing model as the application scales.

The results and benefits described in this post are specific to tombola’s workload and environment. Although Amazon Redshift RG instances powered by AWS Graviton4 processors can deliver significant performance improvements, actual results will vary based on factors including workload characteristics, data volumes, cluster configuration, and query complexity. We encourage you to evaluate RG instances with your own workloads to determine the benefits for your environment. To learn more, visit the Amazon Redshift marketing page and the Amazon Redshift documentation, or get started in the Amazon Redshift console.


About the authors

Prabhu Pandian

Prabhu Pandian

Prabhu has over 15 years of experience spanning data engineering, business intelligence, and data analytics. He has built a career on turning complex data challenges into actionable insights across industries including retail, healthcare, logistics, iGaming, and the public sector. He has led high-performing teams at organisations architecting data warehouses, building ETL pipelines processing tens of millions of records daily, and delivering analytics. Currently, as the Data Engineering Lead at tombola, he is focused on harnessing the power of AWS services to build scalable, optimised data platforms that drive real business value. He is passionate about engineering data infrastructure that is not just robust and efficient, but one that empowers teams to make faster, smarter decisions.

Akshay Srinivasan

Akshay Srinivasan

Akshay is a Data Engineer at tombola, where he runs the Data Platform & Reliability pod, shaping the architecture, scalability, and resilience of the company’s core data infrastructure across batch, streaming, and machine learning workloads. He favors open source tooling and composable AWS services, building platforms designed to be flexible and operationally sustainable. Over the past eight years he has built data platforms from the ground up across fintech, gaming, and enterprise environments, standing up greenfield infrastructure, automating complex operational workflows, and engineering systems in domains where data reliability directly affects regulatory and business outcomes. Having worked with Amazon Redshift since 2017, he has seen its evolution first-hand, from early node types through to the modern lakehouse capabilities the platform offers today.

Sidhanth Muralidhar

Sidhanth Muralidhar

Sidhanth is a Principal Technical Account Manager at AWS, where he partners with enterprise customers to design, scale, and optimize cloud-focused systems. He specializes in guiding organizations through complex architectural decisions across cost efficiency, reliability, performance, and operational excellence. His work increasingly sits at the intersection of data systems and AI as well, helping customers operationalize modern data architectures and build intelligent, production-ready systems.

Vlad Siniavin

Vlad Siniavin

Vlad is a Sr. Technical Account Manager at AWS with over 15 years of experience in building innovative solutions, products and services. He is driven by delivering measurable outcomes for his customers – whether that’s reducing operational risk, optimising costs, or accelerating cloud adoption. He believes the best technical guidance starts with deeply understanding what matters most to the customer and acting in their best interest.

AWS Weekly Roundup: NY Summit recap, Local Zone in Hanoi, Grok 4.3 in Bedrock, price reductions, and more (June 22, 2026)

Post Syndicated from Channy Yun (윤석찬) original https://aws.amazon.com/blogs/aws/aws-weekly-roundup-ny-summit-recap-local-zone-in-hanoi-grok-4-3-in-bedrock-price-reductions-and-more-june-22-2026/

Last week AWS Summit New York City brought together thousands of customers, partners, and builders for a free, one-day event showcasing the latest in cloud and AI innovation. Dr. Swami Sivasubramanian, VP of Agentic AI at AWS unveiled a stack of AI launches in his keynote, all built around one thesis: agents that compound value over time.

  • Agents for working – You can launch autonomous agents and access a smarter activity feed with new Amazon Quick features, which now let you create and run multi-step agents directly in the desktop app and consolidates email, Slack, calendar, and tasks into a single prioritized view with personalized rules.
  • Agents for securing – You can shift from reactive to proactive security with AWS Continuum, a new AI-native security service that reasons, validates, and acts at machine speed across the full code vulnerability lifecycle. AWS Security Agent (now part of AWS Continuum) adds new features: threat modeling; pull request code scanning with remediation across major Git platforms; and IDE integrations via Kiro power, Claude Code plugin, and MCP.
  • Agents for building – You can write, ship, and modernize code in one continuous loop with Kiro, AWS DevOps Agent, and AWS Transform. Kiro introduces a native iOS app; AWS DevOps Agent adds release management capabilities to assess code changes before production; and AWS Transform continuous modernization reduces tech debt autonomously.
  • Agents customers create – You can go from agent idea to production in minutes with Amazon Bedrock AgentCore, which now includes a GA harness for infrastructure and orchestration, Web Search, Managed Knowledge Base, policy integrations with Guardrails, and the new AWS Context service for mapping organizational data relationships.

To learn more, visit the Summit recap from our top announcements blog post and Amazon News post.

Last week’s launches
Here are last week’s launches that caught my attention:

  • AWS Local Zone in Hanoi, Vietnam  —This new Local Zone is one of the first AWS Local Zones in the Asia Pacific with support for Amazon S3 and Amazon EBS Local Snapshots, enabling customers to meet data residency requirements by storing and backing up data locally. To get started, enable the Hanoi Local Zone (ap-southeast-1-han-1a) from the Regions and Zones tab in the AWS Global View or by using the ModifyAvailabilityZoneGroup API.
  • AWS Blocks, an open-source TypeScript framework for application developers (preview) — AWS Blocks runs a fully functional local environment with Postgres, authentication, and real-time messaging, no AWS account required. When you’re ready to deploy, the same application code runs on production AWS services with zero changes, and you can drop into AWS CDK at any point for direct resource configuration.
  • Grok 4.3 from xAI in Amazon Bedrock —You can use the Grok 4.3 model on Amazon Bedrock, giving you even more choice as you build generative AI applications across reasoning, agentic, and enterprise workflows. Grok 4.3 runs on a new inference engine in Bedrock designed for price performance, with support for tool calling, structured output, and response streaming.
  • Amazon S3 annotations: attach rich, queryable context directly to your objects — Amazon S3 now lets you attach up to 1 GB of rich, mutable, and queryable context directly to your objects using annotations, purpose-built for AI agents and autonomous workflows that need to discover, understand, and act on data at scale without maintaining separate metadata systems.
  • Amazon ECS announces faster service auto scaling — Amazon ECS service auto scaling now detects and responds to load changes faster with support for high resolution (20-second) metrics and metric publishing optimizations. In AWS benchmarking tests, time to trigger scale-out improved from 363 seconds to 86 seconds (76% faster), and total time to scale and provision new tasks improved from 386 seconds to 109 seconds (72% faster).
  • Amazon EC2 G7 instances accelerated by NVIDIA RTX PRO 4500 Blackwell Server Edition GPUs — AWS is the first major cloud provider to support NVIDIA RTX PRO 4500 Blackwell Server Edition GPUs. G7 instances are accelerated by these GPUs with custom sixth-generation Intel Xeon Scalable processors, delivering up to 4.6x AI inference performance and up to 2.1x graphics performance compared to G6 instances.
  • Strands Agents introduces new capabilities — Strands is an open source toolkit for building production agents. You can now use better context management in Harness SDK, a new isolated execution environment with Strands Shell, and chaos testing and red teaming in Strands Evals.
  • AWS Management Console Private Access – You can access the AWS Console from VPCs without internet connectivity, allowing enterprises to manage their AWS infrastructure through the console while maintaining strict network security controls in air-gapped environments.
  • AWS Marketplace Storefront is now generally available – AWS Partners can create and deploy their own branded catalog of solutions and services on their website or application in hours. Channel Partners and Independent Software Vendors can now simplify how they manage their cloud marketplace business and make it easier for customers to discover and purchase their solutions from AWS Marketplace.
  • Palo Alto Networks (PANW) Advanced DNS Security on Amazon Route 53 Resolver DNS Firewall (preview) – You can now enforce DNS threat protections from Palo Alto Networks directly on Route 53 DNS Firewall rules, without deploying separate firewalls or modifying VPC configurations — by subscribing to PANW from the DNS Firewall console through the embedded AWS Marketplace widget.

For a full list of AWS announcements, be sure to keep an eye on the What’s New with AWS page.

Price reductions 
AWS continues to look for ways to increase performance and lower prices for our customers. I noticed a few such efforts last week, so I’d like to share them:

Learn more about AWS, browse and join upcoming AWS-led in-person and virtual events, startup events, and developer-focused events as well as AWS Summits and AWS Community Days. Join the AWS Builder Center to connect with builders, share solutions, and access content that supports your development.

That’s all for this week. Check back next Monday for another Weekly Roundup!

Channy

Amazon ECS introduces new high-resolution metrics for faster service auto scaling

Post Syndicated from Channy Yun (윤석찬) original https://aws.amazon.com/blogs/aws/amazon-ecs-introduces-new-high-resolution-metrics-for-faster-service-auto-scaling/

Amazon Elastic Container Service (Amazon ECS) service auto scaling automatically adjusts task counts to meet workload demand with comprehensive scaling policies, including predictive scaling for recurring traffic patterns, scheduled scaling for planned events, and target tracking to scale dynamically on real-time metrics.

You can choose proactive scaling by using predictive scaling (automatic) and scheduled scaling (customer-defined), or reactive scaling by using target tracking with just a target to scale on. Amazon ECS service auto scaling adjusts the number of tasks in an ECS service based on Amazon CloudWatch metrics, such as average CPU/Memory usage, request count per target, a custom metric such as queue depth, or demand surges by using advanced machine learning (ML) algorithms.

With today’s launch, Amazon ECS service auto scaling now detects and responds to load changes faster with support for high resolution (20-second) metrics and metric publishing optimizations. In AWS benchmarking tests, time to trigger scale-out improved from 363 seconds to 86 seconds (76% faster, 4.2x), and total time to scale and provision new tasks improved from 386 seconds to 109 seconds (72% faster, 3.5x)

This launch delivers three key benefits for your applications:

  • Improved performance and reliability: Faster scaling means, your application responds faster to demand surges, reducing latencies or failures for end users during demand surges.
  • Right-size without compromise: Depending on the workload, you can reduce baseline task counts because scale-out now happens fast enough to handle traffic spikes without preemptive capacity padding. This directly reduces compute costs while maintaining application performance and availability.
  • Simpler scaling configuration: Target tracking with high-resolution metrics delivers the aggressive scaling behavior that previously required custom scaling configurations, such as usage of step-scaling policies. One configuration change replaces custom engineering work.

How it works
To use ECS faster service auto scaling, first enable high-resolution metrics for your ECS service, and then configure a target tracking scaling policy which uses high-resolution metrics. ECS faster service autoscaling works across all compute options on ECS: AWS Fargate, ECS Managed Instances, and Amazon Elastic Compute Cloud (Amazon EC2). You can enable these metrics when you create or update your ECS service in the Amazon ECS console, or using AWS SDKs and tools, and AWS CloudFormation.

When you create a service in the console, add 20-seconds resolution metrics in the Monitoring configuration section. These metrics incur additional CloudWatch costs while the standard resolution (60-seconds) is free.

In the Service auto scaling section, check Use service auto scaling and choose Target Tracking for the scaling policy type to use real-time data to scale the number of tasks that your service runs based on demand.

Then, choose a Scaling policy type for the target tracking. You can select ECSServiceAverageCPUUtilizationHighResolution or ECSServiceAverageMemoryUtilizationHighResolution as new metrics.

That’s it – your ECS service will use high resolution metrics for auto scaling.

To update an existing ECS service to use faster auto scaling, you first need to configure high resolution metrics via Update Service. Once deployment completes, your service will generate high-resolution metrics. You can then go to the Service and auto scaling tab from your service details to update scaling policy to use higher resolution metrics.

That’s all you need. Your ECS service now evaluates scaling decisions at 20-second intervals.

You can also use the AWS Command Line Interface (AWS CLI) to enable new metrics in your ECS service through Application Auto Scaling. To learn more, visit the faster auto scaling documentation.

Now available
Faster service autoscaling with high-resolution metrics for Amazon ECS is available today. The feature itself has no additional cost, but high-resolution CloudWatch metrics introduce a new pricing dimension. For details, see the CloudWatch pricing page.

Give it a try today and send feedback to AWS re:Post for ECS or through your usual AWS Support contacts.

Channy

AWS Weekly Roundup: BYOM for Amazon RDS for SQL Server, AWS IoT Device SDK for Swift, and more (June 8, 2026)

Post Syndicated from Sébastien Stormacq original https://aws.amazon.com/blogs/aws/aws-weekly-roundup-byom-for-amazon-rds-for-sql-server-aws-iot-device-sdk-for-swift-and-more-june-8-2026/

This week, the AWS IoT Device SDK for Swift reached general availability. As a member of the Swift Server Workgroup (SSWG), this one caught my attention. The SDK brings production-ready MQTT 5 connectivity, Device Shadow, Jobs, and fleet provisioning to Swift developers on macOS, iOS, tvOS, and Linux.

Swift on IoT and Edge devices, an AI generated illustration

I’m curious to see what you will build with it. Swift on the server has matured over the past few years, and now it reaches IoT devices too. This connects to a broader trend of running Swift at the edge. WendyOS, for example, is an open-source operating system for physical AI that offers first-class Swift support for deploying apps to NVIDIA Jetson and Raspberry Pi hardware. Between server-side Swift, IoT, and edge computing, the language is showing up in places that would have surprised most people a few years ago.

Now, let’s get into this week’s AWS news.

Headlines
Amazon RDS for SQL Server supports Bring Your Own Media — Customers who migrate SQL Server applications from on-premises environments can now reuse their existing Microsoft SQL Server licenses, including Software Assurance, through Microsoft’s License Mobility program on Amazon RDS. BYOM is integrated with AWS License Manager for tracking license usage and compliance. Read more.

Amazon Cognito now supports multi-Region replication — You can now synchronize user and machine identity data, including credentials, user pool configurations, and federation setups, to a secondary user pool in a standby Region in near real-time. In the event of a disruption in the primary Region, signed-in users continue accessing their applications without re-authenticating, and registered users can sign in with their existing credentials. Multi-Region replication is available as an add-on for user pools in Essentials or Plus feature tiers across 16 Regions. Read more.

GPT-5.5, GPT-5.4, and Codex from OpenAI are now generally available on Amazon Bedrock — You can now use GPT-5.5 and GPT-5.4 in production workloads on Amazon Bedrock and build with Codex for AI-powered software development, with the same security, governance, and operational controls you already use across AWS. GPT-5.5 is the most capable model from OpenAI, excelling at agentic coding, data analysis, and multi-step autonomous tasks. Codex is available through the Codex App, the Codex CLI, and IDE integrations with Visual Studio Code, JetBrains, and Xcode. Pricing matches OpenAI first-party rates, and usage counts toward existing AWS commitments. Read more.

Last week’s launches
Here are some launches and updates from this past week that caught my attention:

For a full list of AWS announcements, be sure to keep an eye on the What’s New with AWS page.

Upcoming AWS events
Learn more about AWS, browse and join upcoming AWS-led in-person and virtual events, startup events, and developer-focused events as well as AWS Summits and AWS Community Days. Join the AWS Builder Center to connect with builders, share solutions, and access content that supports your development.

That’s all for this week. Check back next Monday for another Weekly Roundup!

— seb

Automating contract intelligence with Doczy.ai™ on AWS

Post Syndicated from Sanket Nasre original https://aws.amazon.com/blogs/architecture/automating-contract-intelligence-with-doczy-ai-on-aws/

Extracting actionable insights from thousands of contracts and legal documents remains a challenge. For organizations, critical business information is locked in unstructured documents such as contracts, legal agreements, provider arrangements, and vendor invoices. Extracting and operationalizing this information has traditionally been a manual, error-prone, and resource-intensive process. This leads to missed savings opportunities, costly delays, and significant inefficiencies across the enterprise.

AArete, a global management and technology consulting firm specializing in healthcare, recognized this challenge and developed Doczy.ai™, an intelligent contract interpretation solution powered by generative AI on Amazon Web Services (AWS).

In this post, we show you how Doczy.ai™ uses generative AI on AWS to automate contract intelligence at scale, transforming unstructured documents into structured, actionable insights, so organizations can automate critical business processes and unlock the full value of their data.

The challenge: Data trapped in documents

For healthcare organizations, managing and interpreting contracts and documents represents a major operational bottleneck. Manual review processes require deploying teams to extract data from thousands of documents. This is an approach that is neither scalable nor sustainable, highly prone to error, and costly. Organizations relying on institutional knowledge face additional risks: critical information resides with a few key individuals, creating knowledge silos and succession planning challenges. Existing Contract Lifecycle Management (CLM) systems often prove inadequate for capturing the nuanced and complex terms unique to each agreement. These legacy systems can only configure predefined fields, missing the rich detail and contextual information that distinguishes contracts. The downstream impact is substantial: in healthcare, reimbursement terms must be manually translated into claims systems—a slow, error-prone process. Similarly, verifying vendor invoices against contract terms often requires manual effort, leading to payment processing delays and missed contractual savings opportunities. These inefficiencies ultimately leave significant value on the table.

This is where Doczy.ai™ provides significant value.

Doczy.ai™: An intelligent contract interpretation solution

Doczy.ai™ directly addresses these challenges using advanced AI and scalability on AWS. Developed by AArete, Doczy.ai™ pushes the boundaries of document intelligence. The solution automatically interprets complex documents and converts them into a structured, queryable information repository that allows organizations to unlock the full value of their data and drive smarter decisions.The evolution of Doczy.ai™ reflects rapid AI advancement. Prior to 2020, document processing required manual effort, with individuals processing approximately 100 documents per week. Between 2020–2023, the firm implemented rules-based contract processing, achieving approximately 55% accuracy. The breakthrough came in 2024 with an AI-based processing built on AWS achieved 99% accuracy—a dramatic improvement over the 55% accuracy of traditional rules-based systems.

Doczy.ai™ architecture

Doczy.ai™ is built on a comprehensive AWS architecture designed to handle the entire document processing lifecycle: from the moment a file enters the system to the moment it generates actionable business intelligence.

Doczy.ai is built on a comprehensive AWS architecture designed to handle the entire document processing lifecycle: from the moment a file enters the system to the moment it generates actionable business intelligence.

Architecture of Doczy.ai™

External users access the platform through a secure Next.js frontend, with Amazon Cognito managing authentication and authorization behind the scenes. After authentication, users upload documents directly to Amazon Simple Storage Service (Amazon S3), where durable, scalable object storage ensures nothing is lost and everything is accessible at scale. From there, the real intelligence begins.

An AWS Lambda function triggers Amazon Textract to extract text and metadata from documents in various formats. What sets Doczy.ai™ apart at this stage is its patented “smart chunking” algorithm, a proprietary approach that goes far beyond pulling words off a page. Rather than treating a document as a flat sequence of text, smart chunking preserves hierarchical structure and one-to-many relationships within documents. It uses a combination of semantic and keyword search to decompose text into meaningful, context-aware chunks, applying dynamic parameters to maintain logical relationships throughout. Sequential identifiers and metadata-driven grouping organize these chunks into field groups, detecting overlaps and removing duplications while keeping the document’s natural flow intact.

After chunking, the document enters the dual clustering engine of Doczy.ai™. This two-lens methodology analyzes every contract simultaneously from both a semantic and a structural perspective. On the semantic side, extracted text is converted into embeddings, numerical representations of meaning, and similar ideas are grouped together even when they’re expressed in different words. On the structural side, pattern-recognition algorithms identify clause types, formatting conventions, table layouts, and hierarchical organization, understanding. For example, that a three-nested-level exhibit carries fundamentally different implications than a straightforward attached schedule.These two analyses don’t operate in isolation. Projection algorithms compare the semantic and structural clusters side by side, synthesizing them into a unified, enriched document model that captures both meaning and context. It’s this convergence that drives the 99% accuracy rate of Doczy.ai™. The system doesn’t just read the words, it understands the contract. Advanced large language models (LLMs) then generate structured output grounded in this dual-clustered intelligence.Before output is finalized, the system determines each document’s file class and generates prompts tailored to the extracted text, cluster classification, and domain context. Through few-shot and multi-shot prompting, the platform continuously edits the prompt on domain-specific examples and based on real outputs, creating a feedback loop that compounds accuracy improvements over time.

The resulting structured data flows into Snowflake, forming a centralized repository that powers intelligent dashboards with actionable insights and visualizations. Throughout the entire pipeline, Amazon CloudWatch monitors performance in real time and proactively surfaces issues before they escalate, while AWS Secrets Manager safeguards sensitive information, ensuring that security is not an afterthought, but a foundational layer woven into every stage of the system.

The transformative impact of Doczy.ai™

The results of this AI-powered approach are transformative and measurable. By automating contract interpretation and document processing, Doczy.ai™ has demonstrated significant impact at scale for multiple organizations across healthcare and financial services. The scale of operations over the last 22 months demonstrates the maturity and production readiness of Doczy.ai™. This solution has processed 2.5 million contract documents (50 million pages) with 137 million API calls to Amazon Bedrock and 442 billion tokens—a level of automation and accuracy previously unattainable through manual or traditional document processing approaches. Over this same period, Doczy.ai™ has helped clients achieve approximately 330 million dollars in cumulative direct and indirect savings.The 99% accuracy rate represents significant improvement over the approximately 55% accuracy of rules-based systems and far exceeds manual processing, which is typically affected by fatigue and human error. The 97% reduction in manual processing time translates directly to cost savings and enables organizations to reallocate human resources to higher-value activities that require judgment and strategic thinking.

A use case in action: Business process automation for health plans

For health plans, Doczy.ai™ provides a powerful solution to automate and improve contract management across the entire lifecycle. It ingests existing contracts in both paper and digital formats, integrates with contract management systems such as Coupa and Icertis, and processes new contracts and amendments as they’re executed. It then creates a centralized metadata repository that feeds directly into downstream systems, enabling end-to-end business process automation.This automation unlocks critical capabilities: Organizations can continuously analyze and improve contract terms, identifying opportunities to improve financial performance and operational efficiency. The architecture feeds accurate, up-to-date contract data directly into claims systems, automating the configuration process that previously required manual translation of reimbursement terms and removing manual data entry, configuration errors, and delays. Additionally, the platform helps maintain claim payment accuracy by assessing payments against contract terms, identifying discrepancies, and flagging potential overpayments or underpayments before they occur.By automating manual processes, health plans can adapt quickly to new contract terms and regulatory requirements. The intelligent dashboards and actionable insights provided by Doczy.ai™ enable decision-makers to understand contract performance, identify trends, and take proactive action to optimize financial outcomes.

Getting started with Doczy.ai™

Organizations interested in using Doczy.ai™ to transform document processing and contract management can engage with AArete to discuss their specific use cases and requirements. AArete offers the platform as a Software as a Service (SaaS) solution, enabling rapid deployment without significant infrastructure investment. AArete’s team of experts will configure this solution for your specific document types, domain terminology, and business processes, supporting maximum value from day one.

Conclusion

The challenge of unlocking data from unstructured documents is a major hurdle for many businesses, particularly in healthcare and financial services where contracts and agreements govern critical operational and financial relationships. By embracing intelligent document intelligence on AWS, organizations can solve this long-standing operational challenge and unlock a new frontier of strategic advantage, turning their data into their most valuable asset.

Built on a sophisticated architecture that orchestrates Amazon Cognito, Amazon S3, AWS Lambda, Amazon Textract, Amazon Elastic Container Service (Amazon ECS), Amazon Bedrock, Amazon CloudWatch, and AWS Secrets Manager, Doczy.ai™ demonstrates how modern cloud services can solve complex document-heavy business problems. Its advanced hybrid smart chunking, dual clustering, and prompt optimization techniques form the core of a patented contract intelligence engine.

Doczy.ai™ delivers tangible impact, processing up to 250,000 contract documents per week with 99% accuracy, reducing manual processing time by 97%, and helping clients unlock roughly 330 million dollars in cumulative savings over 22 months. By embracing this intelligent document processing, organizations can turn contracts into a strategic data asset, improving efficiency, accuracy, and profitability while freeing teams to focus on higher-value work.

To learn more about how AArete and Doczy.ai™ can help your organization transform document processing and unlock the value of your unstructured data, visit the AArete website.


About the authors
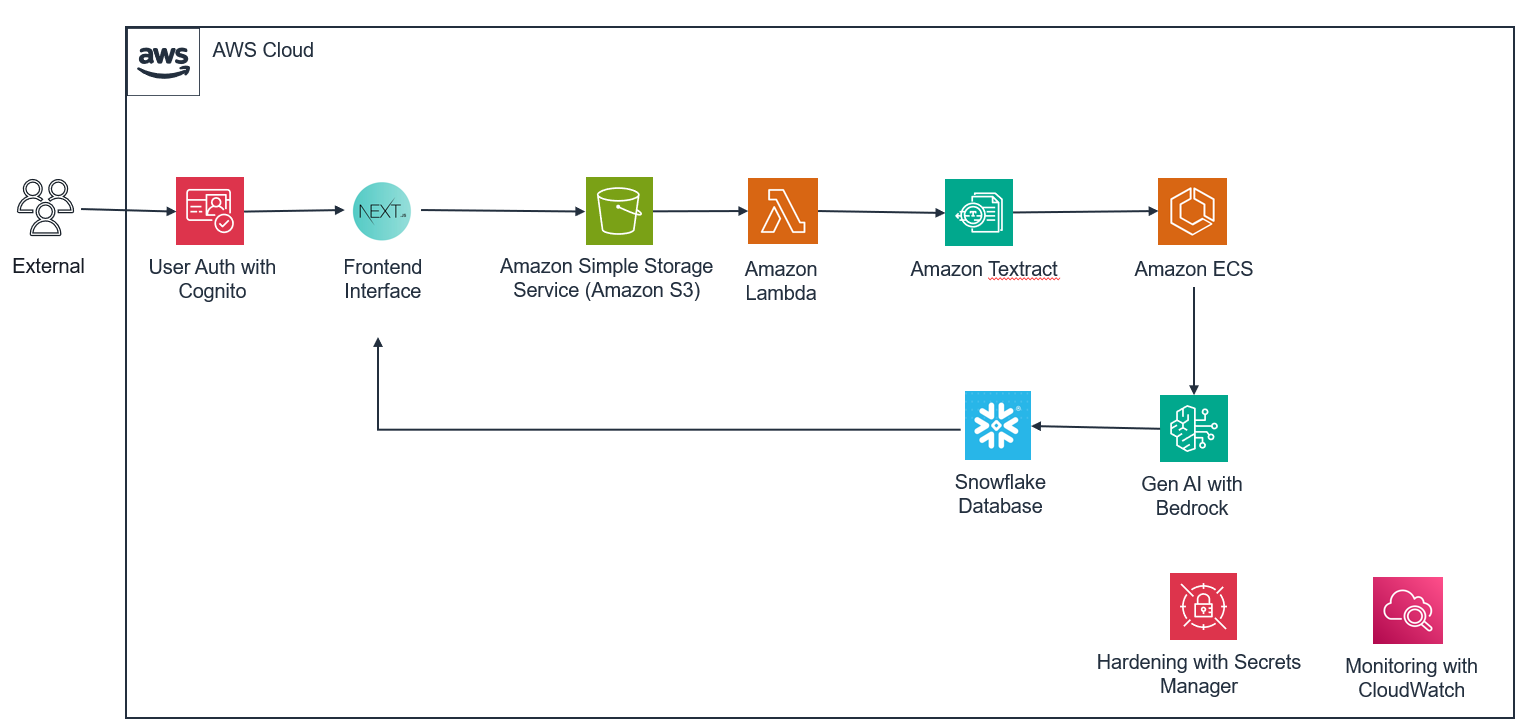
Building hybrid multi-tenant architecture for stateful services on AWS

Post Syndicated from Vasu Raj original https://aws.amazon.com/blogs/architecture/building-hybrid-multi-tenant-architecture-for-stateful-services-on-aws/

Running a large-scale ad-serving infrastructure presents unique challenges when balancing tenant isolation with operational efficiency. Our infrastructure handles millions of requests per second and generates billions of dollars in annual advertising revenue, serving ads across multiple properties and systems.

The cellular architecture problem

Earlier, we had a cellular architecture where we allocated each AWS account with Application Load Balancer (ALB) and Amazon Elastic Container Service (Amazon ECS) to a given tenant. This approach provided accurate isolation but created the following significant operational challenges.

  • The scale problem: Supporting only 18 clients across four AWS Regions requires 181 separate targets. Our team configured dedicated AWS accounts, VPCs, load balancers, AWS Identity and Access Management (IAM) roles, and downstream service connections for each client.
  • The efficiency problem: Our servers spent more than 98 percent of their time waiting and less than 1 percent executing code. Average CPU utilization sat at 3 percent, and memory at 19 percent. We were paying for massive infrastructure that remained idle most of the time.
  • The onboarding problem: Bringing a new client online took approximately 52 days—roughly two weeks for AWS account provisioning, three weeks for VPC and networking setup, one week for IAM role configuration, and two weeks for downstream service integration and testing.
  • The scalability problem: When traffic grows or a new client joined, our only option is to spin up an entirely new cell and migrate to the client. We couldn’t support concurrent tier-1 live events—multiple high-value games couldn’t run simultaneously, forcing us to divert traffic to alternative systems.
  • The noisy neighbor problem: Despite our isolation efforts, we still experienced performance degradation when tenants shared infrastructure, affecting service quality and reliability.

Why we needed dedicated compute

Our ad-serving platform is a stateful service that loads and maintains data in memory for each tenant rather than fetching it from a database on every request. This in-memory state improves performance but creates the noisy neighbor problem when tenants share infrastructure.When two tenants share a cluster, their in-memory data competes for the same heap. A tenant with a large dataset can trigger out-of-memory conditions that affect its neighbors. This made shared-task and shared-cluster approaches challenging our stateful workloads.We needed a solution that maintained cluster-level isolation while dramatically improving operational efficiency.

Solution overview

We designed a hybrid multi-tenant architecture that provides cluster-level isolation within shared accounts. Here’s what we implemented:

  • Pre-integration model: Instead of provisioning VPCs, IAM roles, and downstream service connections for each new tenant, we created a configuration-driven infrastructure where these integrations are established once and reused across tenants.
  • Amazon Route 53 weighted routing: We implemented Route 53 weighted routing to enable gradual traffic migration between clusters without client-side changes. This allowed us to shift tenants between tiers as their traffic patterns evolved.
  • AWS PrivateLink connectivity: We established AWS PrivateLink endpoints that all tenants share, removing the need for us to set up new VPC peering or Transit Gateway connections for each tenant and reducing network configuration overhead by 80 percent.
  • Tier-based architecture: We organized our infrastructure into tiers (High TPS, Standard TPS, Low TPS) with multiple cells per tier, enabling horizontal scaling without the operational burden of per-tenant AWS accounts.
  • Configuration-driven onboarding: New tenant onboarding became a configuration change rather than an infrastructure provisioning exercise, dramatically reducing time and manual effort.

The architecture is organized around three nested levels of hierarchy. A tier is the top-level grouping—a logical classification of tenants that share a common infrastructure footprint. A tier spans one or more cells, where each cell is an AWS account boundary that represents the unit of horizontal scale-out at the account level. Within each cell, one or more infra groups serve as the self-contained infrastructure unit: a VPC, an Application Load Balancer, a set of ECS clusters (one per tenant), IAM roles, and a monitoring stack.

Why three levels? As you scale from 10 to 100 to 1,000 tenants, you will reach different AWS limits at different scales. Application Load Balancer target group limits constrain how many tenants fit in a single load balancer. AWS account limits on Elastic Network Interfaces (ENIs) and VPC endpoints constrain how many load balancers fit in a single account. This three-level hierarchy gives you two independent scaling levers to address each constraint—add infra groups to scale within an account and add cells to scale across accounts. The key design principle is that we pre-wire downstream service dependencies at tier creation, not at tenant onboarding. AWS PrivateLink connections from the tier VPC to each downstream service VPC are established after the tier is provisioned. After onboarding tenants to that tier, they automatically inherit full downstream connectivity. This single architectural decision is the primary reason for the 80 percent reduction in infrastructure setup steps. Route 53 performs weighted DNS routing across Application Load Balancers in multiple infra groups and cell accounts, enabling horizontal scale-out without client-side changes.

The following diagram illustrates the full architecture: Route 53 distributes traffic across ALBs in multiple infra groups within a single cell account, each ALB routes to tenant-specific ECS clusters using listener rules and target groups, and the clusters share tier-level PrivateLink connections to downstream services.

Multi-Tenant Architecture Diagram

Figure 1: Hybrid multi-tenant architecture showing Route 53 weighted routing, Application Load Balancer listener rules, dedicated ECS clusters per tenant, and shared AWS PrivateLink connections to downstream services.

Prerequisites

Before you build this architecture, make sure that you have the following:An AWS account configured with least privileged permissions to create VPCs, Application Load Balancers, ECS clusters, Route 53 hosted zones, and VPC endpoints. You also need the AWS Command Line Interface (AWS CLI) version 2.x or later installed and configured with appropriate credentials. This walkthrough assumes intermediate familiarity with Amazon ECS, Application Load Balancer, and Amazon Route 53—specifically ECS task definitions, Application Load Balancer listener rules, and Route 53 routing policies. You also need at least one downstream service exposing a VPC endpoint service for AWS PrivateLink connectivity.

Estimated time to complete: 2–3 hours.

Walkthrough

This walkthrough shows you how to build the previously described hybrid multi-tenant architecture. You will configure Route 53 weighted routing, deploy an ALB with tenant-specific listener rules, create dedicated ECS clusters per tenant, and establish AWS PrivateLink connectivity to shared downstream services. These will be done in a way that makes future tenant onboarding a configuration-only operation.

Step 1: Configure Route 53 Regional endpoints with weighted routing

Each tier exposes a single Regional DNS endpoint (for example, tier-1.us-east-1.example.com) backed by Route 53 weighted routing records. You can configure Route 53 to use weighted routing to help distribute traffic across ALBs in multiple AWS accounts. When you add a new account to the tier for horizontal scale-out, add a new weighted record. You don’t need to change existing tenant DNS entries.

To configure Route 53 weighted routing for a tier:

  1. Open the Amazon Route 53 console and choose Hosted zones.
  2. Select or create the hosted zone for your tier.
  3. Choose Create record and select Weighted as the routing policy.
  4. Set the record name to your tier endpoint (for example, tier-1.us-east-1.example.com), record type to A, and configure an alias pointing to the ALB in your first AWS account.
  5. Set the Weight to 50 and provide a unique Set ID (for example, account-1).
  6. Enable Evaluate target health so Route 53 helps make sure that it directs traffic to healthy ALBs when you configure health evaluation.
  7. Repeat for each additional AWS account in the tier, using matching weights.

Alternatively, run the following AWS CLI command to create the first weighted record:

aws route53 change-resource-record-sets \
  --hosted-zone-id YOUR_HOSTED_ZONE_ID \
  --change-batch '{
    "Changes": [{
      "Action": "CREATE",
      "ResourceRecordSet": {
        "Name": "tier-1.us-east-1.example.com",
        "Type": "A",
        "SetIdentifier": "account-1",
        "Weight": 50,
        "AliasTarget": {
          "HostedZoneId": "Z35S*****K",
          "DNSName": "your-alb.us-east-1.elb.amazonaws.com",
          "EvaluateTargetHealth": true
        }
      }
    }]
  }'

Note: Replace Z35S****K with the hosted zone ID for your ALB’s AWS Region. For more information, see Elastic Load Balancing endpoints and quotas.

Route 53 supports up to 10,000 weighted records per hosted zone, so this approach scales to thousands of AWS accounts without architectural changes. For more information about weighted routing, see Weighted routing in the Amazon Route 53 Developer Guide.

Step 2: Deploy an Application Load Balancer with tenant-specific listener rules

Each infra group contains one Application Load Balancer. The load balancer inspects incoming requests and forwards them to the correct tenant’s ECS service based on a tenant identifier extracted from the request path or a custom HTTP header.

Two Application Load Balancer quotas shape the capacity of each infra group: a maximum of 100 target groups per load balancer, and a maximum of 5 target groups per listener rule. With 20 listener rules each forwarding to 5 target groups, a single load balancer supports up to 50 tenants per infra group. With up to 5 ECS clusters per tenant, a single infra group can host up to 100 ECS clusters.

To create a tenant-specific listener rule:

  1. Open the Amazon EC2 console and choose Load Balancers in the navigation pane.
  2. Select your Application Load Balancer and choose the Listeners tab.
  3. Choose View/edit rules for the HTTPS listener.
  4. Choose the plus (+) icon to add a new rule.
  5. Add a condition: Path is /tenant-a/* (or HTTP header if you use header-based routing).
  6. Add an action: Forward to the target group for tenant-a.
  7. Set a unique rule priority and save.

To create the target group and listener rule using the AWS CLI:

# Create a target group for the tenant
aws elbv2 create-target-group \
  --name tg-tenant-a \
  --protocol HTTP --port 8080 \
  --vpc-id YOUR_VPC_ID \
  --target-type ip
# Add a listener rule routing /tenant-a/* to the target group
aws elbv2 create-rule \
  --listener-arn YOUR_LISTENER_ARN \
  --conditions '[{"Field":"path-pattern","Values":["/tenant-a/*"]}]' \
  --actions '[{"Type":"forward","TargetGroupArn":"YOUR_TARGET_GROUP_ARN"}]' \
  --priority 10

For more information, see Listener rules for your Application Load Balancer.

Step 3: Create dedicated ECS clusters per tenant

In this step, you create a dedicated ECS cluster for each tenant within your infra group’s VPC. Use a consistent naming convention that encodes the tier, cell, infra group, and tenant identifier (for example, tier-1-cell-1-ig-1-tenant-a) to make ownership clear during operations and incident response.To create a dedicated ECS cluster for a tenant:

  1. Open the Amazon ECS console and choose Clusters.
  2. Choose Create cluster.
  3. Enter a cluster name following your naming convention (for example, tier-1-cell-1-ig-1-tenant-a).
  4. Select EC2 Linux + Networking and configure the instance type and Auto Scaling group settings appropriate for the tenant’s workload.
  5. Select the infra group VPC and subnets.
  6. Choose Create.

To create the cluster using the AWS CLI:

aws ecs create-cluster \
  --cluster-name tier-1-cell-1-ig-1-tenant-a \
  --region us-east-1

In the ECS task definition for this tenant, pass the tenant identifier as an environment variable. The application reads this value at startup to scope its data access — loading only that tenant’s configuration and state from the shared remote cache:

{
  "containerDefinitions": [{
    "name": "app",
    "image": "your-ecr-image:latest",
    "environment": [
      { "name": "TENANT_ID", "value": "tenant-a" },
      { "name": "CACHE_ENDPOINT", "value": "cache.tier-1.internal" }
    ]
  }]
}

Note: Replace your-ecr-image:latest with your Amazon Elastic Container Registry (Amazon ECR) image URI.

Register the ECS service as a target in the ALB target group created in Step 2. Configure ECS service auto-scaling based on central processing unit (CPU) and memory utilization metrics, scoped to the individual service. Because each cluster is single-tenant, the ECS limit of 5,000 tasks per service applies exclusively to that tenant. One tenant’s resource consumption can’t affect another tenant’s cluster. For more information, see Creating a cluster in the Amazon ECS Developer Guide.

Step 4: Establish AWS Private Link connectivity to shared dependencies

This step happens at tier creation, not at tenant onboarding—and that distinction is the architectural heart of the design. For each downstream service your application integrates with, create a VPC interface endpoint in the infra group VPC. The ECS tasks in the tier route traffic to downstream services through these endpoints. Tenants onboarded to that tier can access downstream connectivity through the pre-configured endpoints.

Each VPC interface endpoint costs approximately $7.30/month plus data transfer charges ($0.01/GB). For a tier with 50 tenants sharing one endpoint, this cost is negligible compared to the operational savings. If your downstream services are in the same VPC, consider using VPC peering or AWS Transit Gateway as lower-cost alternatives. Use AWS PrivateLink when you need to connect to services in different AWS accounts or when you require the security and isolation benefits of private connectivity.

To create a VPC interface endpoint for a downstream service:

  1. Open the Amazon VPC console and choose Endpoints in the navigation pane.
  2. Choose Create endpoint.
  3. Select Find service by name and enter the VPC endpoint service name provided by the downstream service owner.
  4. Select the infra group VPC and the subnets used by ECS tasks.
  5. Attach a security group that allows outbound traffic from ECS tasks to the endpoint on the required port.
  6. Choose Create endpoint.

To create the endpoint using the AWS CLI:

aws ec2 create-vpc-endpoint \
  --vpc-id YOUR_VPC_ID \
  --service-name com.amazonaws.vpce.us-east-1.vpce-svc-YOUR_SERVICE_ID \
  --vpc-endpoint-type Interface \
  --subnet-ids subnet-*** subnet-*** \
  --security-group-ids sg-YOUR_SG_ID

Define tier-level IAM roles with the permissions needed to access downstream services and assign these roles to ECS task definitions at the tier level. New tenants can receive the tier-level permissions through the shared IAM roles without per-tenant role creation. For more information, see Access an AWS service using an interface VPC endpoint.

Step 5: Configure tenant isolation, scaling, and observability

This architecture enforces tenant isolation at three layers through customer configuration. At the routing layer, ALB listener rules route traffic exclusively to the correct tenant’s target group based on the tenant identifier. ALB listener rules help route traffic to the correct tenant’s target group based on your configuration. At the compute layer, each tenant has a dedicated ECS cluster, so resource limits apply per cluster and cluster-level isolation is designed to help minimize the impact of one tenant’s resource consumption on another tenant. At the in-memory state layer, because each ECS cluster is single-tenant, in-memory data loaded at startup belongs exclusively to that tenant with no shared heap between tenants.

Scaling strategies

When a single tenant’s traffic grows but you haven’t reached the 50-tenant limit per infra group, use vertical scaling — it’s faster (minutes vs. hours) and doesn’t require Route 53 changes. Increase ECS task CPU and memory reservations in the task definition, or switch to larger EC2 instance types in the Auto Scaling group.

When you’re approaching the 50-tenant limit or when multiple tenants need capacity simultaneously, add a new infra group within the same cell—a new VPC, ALB, and set of ECS clusters. Route 53 weighted routing distributes traffic across infra groups without client-side changes:

aws route53 change-resource-record-sets \
  --hosted-zone-id YOUR_HOSTED_ZONE_ID \
  --change-batch '{
    "Changes": [{
      "Action": "CREATE",
      "ResourceRecordSet": {
        "Name": "tier-1.us-east-1.example.com",
        "Type": "A",
        "SetIdentifier": "cell-1-ig-2",
        "Weight": 50,
        "AliasTarget": {
          "HostedZoneId": "Z3******K",
          "DNSName": "your-alb-ig-2.us-east-1.elb.amazonaws.com",
          "EvaluateTargetHealth": true
        }
      }
    }]
  }'

Use cell-level scaling only when you’re approaching account-level limits—typically after 3–4 infra groups per cell. Each AWS account has hard limits on ENIs, VPC endpoints, and other resources. When a cell approaches these limits, add a new cell by provisioning an identical tier infrastructure stack in a new AWS account and registering its ALBs in Route 53 with weighted records alongside existing cells:

aws route53 change-resource-record-sets \
  --hosted-zone-id YOUR_HOSTED_ZONE_ID \
  --change-batch '{
    "Changes": [{
      "Action": "CREATE",
      "ResourceRecordSet": {
        "Name": "tier-1.us-east-1.example.com",
        "Type": "A",
        "SetIdentifier": "cell-2",
        "Weight": 50,
        "AliasTarget": {
          "HostedZoneId": "Z35SXDOTRQ7X7K",
          "DNSName": "your-alb-cell-2.us-east-1.elb.amazonaws.com",
          "EvaluateTargetHealth": true
        }
      }
    }]
  }'

The tier endpoint (tier-1.us-east-1.example.com) remains stable. Tenants don’t need to update their DNS configuration as the tier grows. The following table summarizes when to use each scaling lever:

Trigger Action Unit added
Application Load Balancer target group limit (~50 tenants per infra group) Add an infra group within the same cell Infra group (VPC + Application Load Balancer + ECS clusters)
AWS account-level limits (ENIs, VPC endpoints) Add a new cell Cell (new AWS account)

Observability

Observability is structured at two levels. Emit tenant-level metrics from each ECS service with the tenant identifier as an Amazon CloudWatch dimension. Key metrics to monitor:

Memory usage per ECS service is the primary signal for in-memory state growth. A sudden spike often indicates a data model change or misconfigured data pipeline. Set CloudWatch alarms at 70 percent (warning) and 85 percent (critical). When memory usage exceeds 70 percent, investigate whether the tenant’s data model has changed or if a data pipeline is misconfigured. At 85 percent, prepare to vertically scale the ECS task definition. TargetResponseTime and request count per ALB target group measure latency and throughput per tenant. Establish a baseline for each tenant during onboarding (typically 100–200 ms for stateful services), then alert when latency exceeds 2x baseline for more than 5 minutes. HTTPCode_Target_5XX_Count per target group tracks error rate per tenant.For tier-level health, monitor ALB ActiveConnectionCount and ProcessedBytes, Route 53 health check status per load balancer, and ECS cluster CPU reservation and memory reservation for capacity planning. Configure Amazon CloudWatch Logs with structured log fields including tenant_id, tier_id, and region in every log entry. Use a single log group per tier with log stream prefixes that encode the tenant identifier. The following CloudWatch Logs Insights query identifies error rates by tenant across the entire tier:

fields @timestamp, tenant_id, @message
| filter @message like /ERROR/
| stats count() as error_count by tenant_id
| sort error_count desc

Step 6: Validate the architecture

Before onboarding production tenants, validate your architecture with the following checks:

  1. Send test requests to your tier endpoint with different tenant identifiers in the path.
  2. Verify that Route 53 distributes traffic across Application Load Balancers: aws route53 test-dns-answer --hosted-zone-id YOUR_ID --record-name tier-1.us-east-1.example.com
  3. Confirm the load balancer routes requests to the correct tenant’s ECS cluster by checking ALB access logs.
  4. Test AWS PrivateLink connectivity by making requests from ECS tasks to downstream services.
  5. Simulate a tenant memory spike by loading a large dataset and confirm that it doesn’t affect other tenants.
  6. Verify that CloudWatch metrics are being emitted with correct tenant_id dimensions.

Results

These results come from implementing this architecture for a stateful ad-serving application. Before this architecture, onboarding a new tenant required 52 days. With this architecture, onboarding dropped to seven days—primarily testing and validation, because infrastructure is pre-provisioned.

Measured improvements:

  • Tenant onboarding time: from 52 days to 7 days (86 percent reduction)
  • Infrastructure setup steps per tenant: 80 percent fewer
  • Engineering effort per onboarding: 80 percent reduction
  • Feature release time: from 2–3 days to 1 day
  • Tenant capacity: up to 100 tenants per AWS account with strong cluster-level isolation

Cleaning up

To avoid incurring future charges, delete the resources in the following order:

  1. Deregister ECS services from target groups, then delete ECS clusters (this might take 5–10 minutes).
  2. Delete Application Load Balancer listener rules, then delete target groups associated with test tenants.
  3. Remove Route 53 weighted routing records for test tier endpoints.
  4. Delete VPC interface endpoints (AWS PrivateLink) created during tier setup.
  5. Terminate EC2 instances in Auto Scaling groups, then delete the Auto Scaling groups.
  6. (Optional) Delete the VPC if no other resources depend on it.

Note: Deleting these resources stops charges immediately. If you plan to reuse this architecture, consider stopping ECS services instead of deleting clusters.

Conclusion

In this post, I showed you how to build a hybrid multi-tenant architecture that provides strong tenant isolation without requiring per-tenant AWS accounts. You learned how to configure Route 53 weighted routing to distribute traffic across multiple accounts, deploy Application Load Balancer listener rules for tenant-specific routing, create dedicated ECS clusters per tenant, and establish AWS PrivateLink connectivity to shared dependencies. This approach reduced tenant onboarding time by 86 percent and infrastructure setup steps by 80 percent.

The most important design decision is decoupling dependency setup from tenant onboarding. Pre-wiring the PrivateLink connections, IAM roles, and remote cache endpoints at tier creation transforms onboarding from a multi-week infrastructure project into a configuration-only operation. The three-level hierarchy (tier, cell, infra group) gives you two independent scaling levers. Add infra groups when an Application Load Balancer approaches its target group limit. Add cells when an AWS account approaches its ENI or VPC endpoint limits. Route 53 weighted routing absorbs both changes transparently.

Next steps

Ready to implement this architecture? Here’s how to get started:

  1. Assess your current tenant distribution and identify candidates for tier consolidation.
  2. Define tier promotion criteria based on your latency and isolation requirements.
  3. Start with a single tier and 2–3 test tenants to validate the architecture.
  4. Gradually migrate existing tenants using a phased approach.
  5. Monitor tenant-level metrics for 2–4 weeks before scaling to additional tiers.

For additional guidance, review the AWS Well-Architected Framework — SaaS Lens and explore the SaaS ECS reference architecture on the GitHub website.

Optional enhancements

After you’ve implemented this architecture, consider these additional improvements: formalized tier migration playbooks with automated tooling to make moving tenants between tiers a predictable, low-risk operation; and bin-packing analysis across tiers to identify tenants whose memory footprints allow co-location on the same EC2 instance without sharing a cluster, reducing EC2 costs while maintaining isolation properties.Have you implemented a similar multi-tenant architecture? Leave a comment or reach out to share your story.

Related resources


About the authors
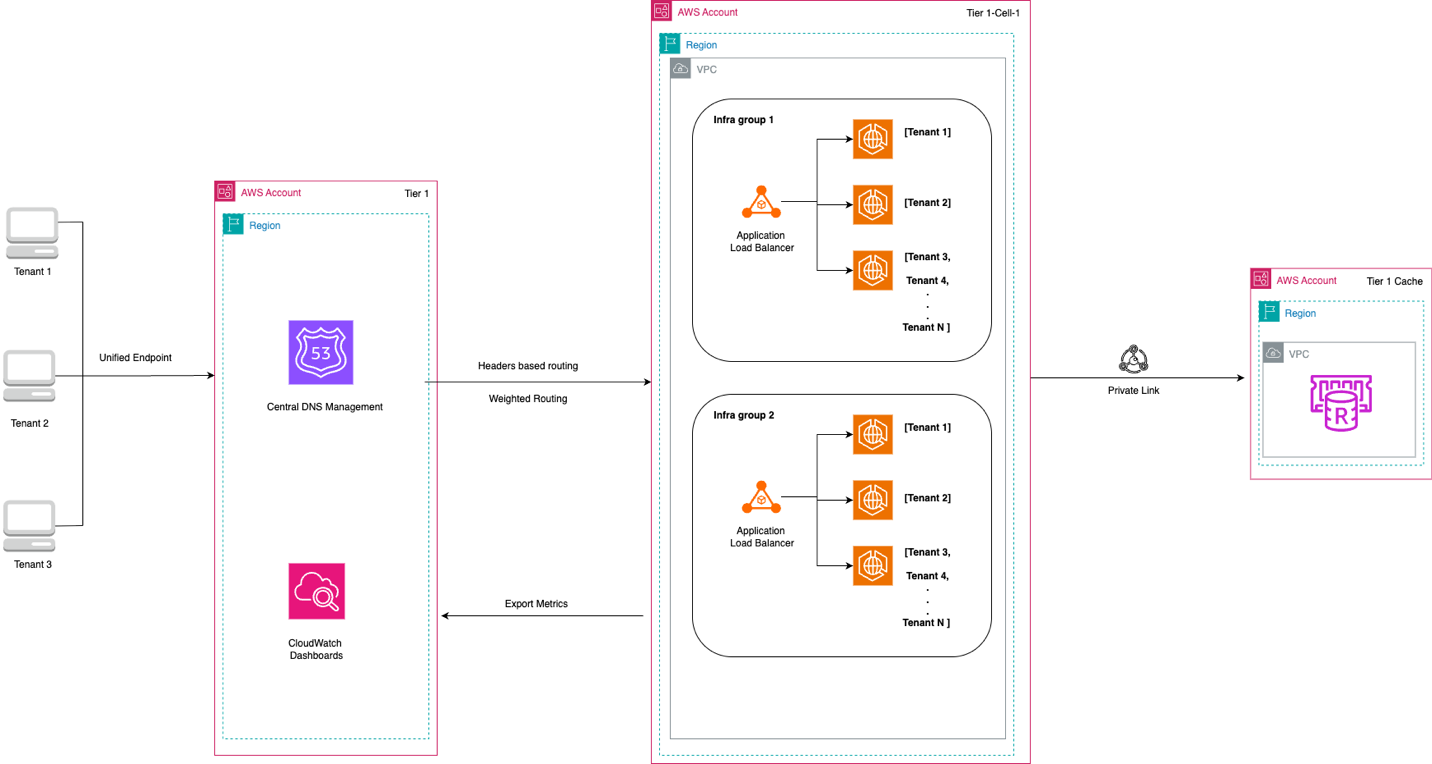
Serverless ICYMI Q1 2026

Post Syndicated from Julian Wood original https://aws.amazon.com/blogs/compute/serverless-icymi-q1-2026/

Stay current with the latest serverless innovations that can improve your applications. In this 32nd quarterly recap, discover the most impactful AWS serverless launches, features, and resources from Q1 2026 that you might have missed.

In case you missed our last ICYMI, check out what happened in Q4 2025.

2026 Q1 calendar

2026 Q1 calendar

Serverless with Mama J


Serverless with Mama J

If you really want to know whether you understand something, try explaining it to your mom!

That’s exactly what Eric Johnson did. His mom, everyone calls her Mama J, wanted to know what serverless actually means and why it matters. So he walked her through it: what servers do, why they’re a headache to manage, and how AWS Lambda lets you skip all that by running code only when it’s needed, scaling automatically, and charging you nothing when nobody’s using it.

Watch the video on the AWS Developers YouTube channel.

Build serverless apps faster with AI

AWS is providing a growing set of AI-powered tools to bring serverless expertise directly into your coding assistants. From Model Context Protocol (MCP) servers and Anthropic Claude plugins to Kiro Powers. These tools provide contextual guidance for architecture decisions, implementation patterns, and deployment automation across the full serverless development lifecycle.

For more information on the tools available, see the resources page.

Serverless Patterns Collection

The open source Serverless Patterns Collection on Serverless Land now provides a direct link to download pattern .zip files. You can also clone the whole repo and explore more patterns.

Serverless Patterns .zip download

Serverless Patterns .zip download

AWS Lambda

Build fault-tolerant, long-running applications using familiar programming patterns using AWS Lambda durable functions. You can use Lambda durable functions to write multi-step workflows in your preferred programming language, using built-in methods that automatically handle progress checkpointing and error recovery. This can improve your architecture so that you can focus on your business logic and optimize costs by charging only for active compute time.

You can build durable functions in Python and TypeScript and there is a durable execution SDK for Java in preview with the code available on GitHub.

Eric Johnson has a new video deep dive showing how to upload videos and scan them with AI. Learn how to coordinate multiple AWS services like Amazon Rekognition and Amazon Transcribe, implement human-in-the-loop approval workflows, and crate a live dashboard for real-time updates.

To find out how durable functions work, see the blog post which also provides testing and best practices guidance. You can also watch the re:Invent Breakout Session video: Deep Dive on AWS Lambda durable functions (CNS380)

Lambda now supports the .NET 10 runtime, including support for file-based apps. Developers can take advantage of the latest .NET 10 performance improvements, new language features, and improved startup times for Lambda functions.

You can now see Availability Zone (AZ) metadata in function execution environments. This allows you to determine the AZ ID (e.g., use1-az1) of the AZ your function is running in. This helps build functions that can make AZ-aware routing decisions, such as preferring same-AZ endpoints for downstream services to reduce cross-AZ latency. Operators can also implement AZ-aware resilience patterns like AZ-specific fault injection testing.

Payload size increase

AWS has increased the maximum payload size from 256 KB to 1 MB for a number of services such as asynchronous Lambda invocations, Amazon SQS, and Amazon EventBridge. This gives you more room to build and maintain context-rich event-driven systems and reduce the need for complex workarounds such as data chunking or external large object storage.

This blog post explores a real-world example using rich event context in agentic event-driven architectures

Payload size increase workflow

Payload size increase workflow

Amazon Bedrock

Amazon Bedrock expanded its model availability with a new set of fully managed open-weight models spanning frontier reasoning and agentic coding. Other model releases include Anthropic Claude Opus 4.6 and Claude Sonnet 4.6, and NVIDIA Nemotron 3 Super. You can invoke them through the unified Amazon Bedrock API without managing any underlying infrastructure, making it straightforward to experiment and swap models as your workload evolves.

Amazon Bedrock AgentCore is the infrastructure layer for securely deploying and operating AI agents. It works with popular open source frameworks, including Strands Agents, LangGraph and CrewAI, giving you the flexibility to build with your preferred tools without vendor lock-in.

AgentCore Gateway now includes semantic tool search, so you can discover the right tool for a task using natural language queries instead of manually browsing a catalogue. It also adds custom KMS encryption, debugging messages, and resource tagging to give you stronger governance over tool integrations.

Policy in Bedrock AgentCore allows you to define precise boundaries on agent actions and run continuous quality monitoring. This helps you maintain predictable, auditable agent behavior in production without embedding guardrail logic inside each individual agent.

AgentCore Runtime now supports stateful MCP server features, allowing agents to maintain session context across tool calls for richer, more coherent multi-step interactions.

Strands Agents

Strands Agents SDK

Strands Agents SDK

Strands Agents is an open source SDK for building and running AI agents in just a few lines of code, working with models available in Amazon Bedrock. Strands Labs is a new dedicated GitHub organization for experimental agent projects, including robotics and code agents. This gives you early access to cutting-edge agentic techniques before they reach production frameworks. See the introduction blog post for more information.

AWS Step Functions

AWS Step Functions introduces an enhanced TestState API that enables API-based testing for validating workflows before deployment. The new API supports testing individual states in isolation or complete workflows end-to-end, making it easier to verify state machine logic without incurring runtime costs.

By integrating TestState API testing into CI/CD pipelines, you can validate workflow logic before deployment, reducing the risk of production issues. Find complete code examples and testing framework in the GitHub repository.

Amazon EventBridge

Amazon EventBridge Scheduler now provides resource count metrics to help you monitor quota usage. These new metrics make it easier to track the number of schedules and schedule groups in your account and proactively manage service quotas.

Amazon DynamoDB

You can replicate Amazon DynamoDB table data across multiple AWS accounts and Regions. This enhances resiliency through account-level isolation, supports tailored security and data-perimeter controls. You can align workloads by business unit or environment and simplify governance requirements.

Amazon DynamoDB global replication

Amazon DynamoDB global replication

Amazon ECS

Amazon ECS Managed Instances can now integrate with Amazon EC2 Capacity Reservations. This allows you to make sure there is capacity availability for your container workloads while benefiting from the management automation of ECS Managed Instances.

ECS also now supports Network Load Balancer (NLB) for linear and canary deployment strategies. This helps you perform gradual traffic shifting using NLBs, providing more flexibility in deployment pipelines for latency-sensitive applications.

Serverless blog posts

January

February

March

Serverless Office Hours

Join our livestream every Tuesday at 11 AM PT for live discussions, Q&A sessions, and deep dives into serverless technologies. Watch episodes on-demand at serverlessland.com/office-hours.

January

February

March

Still looking for more?

The Serverless landing page has overall information about building serverless applications. The Lambda resources page contains case studies, webinars, whitepapers, customer stories, reference architectures, and even more Getting Started tutorials.

You can also follow the Developer Advocacy team to see the latest news, follow conversations, and interact with the team.

And finally, visit Serverless Land  for your serverless needs.

PACIFIC enables multi-tenant, sovereign product carbon footprint exchange on the Catena-X data space using AWS

Post Syndicated from Kevin S. Ridolfi original https://aws.amazon.com/blogs/architecture/pacific-enables-multi-tenant-sovereign-product-carbon-footprint-exchange-on-the-catena-x-data-space-using-aws/

This post is cowritten by Anil Akarsu and Dr. Renè Holschuh from BASF.

BASF is a global chemical industry leader and active member of the Catena-X Automotive Network. It pioneers sustainable solutions that enable automotive organizations to track carbon emissions across complex supply chains. CircularTree transforms sustainability reporting through innovative digital solutions that systematically identify and control Scope 3 greenhouse gas (GHG) emissions across global supply networks. They establish standardized data exchange protocols through participation in forward-thinking associations including PACT, Catena-X, and ESTAINIUM. BASF and CircularTree created PACIFIC, a product powered by AWS that streamlines transparent product carbon footprint (PCF) reporting across the value chain by automating PCF data exchange, reducing manual effort, and ensuring trustworthy data sharing. Through this unique relationship, AWS helps customers integrate software, services, and processes to accelerate business transformation. This post explores how PACIFIC enables multi-tenant, sovereign PCF exchange on the Catena-X data space using Amazon Elastic Container Service (Amazon ECS) on AWS Fargate, Amazon Cognito, and AWS Identity and Access Management (IAM) to deliver measurable environmental impact and competitive advantage in a carbon-conscious marketplace.

Carbon data at scale, across company borders

Sustainability is now an operational requirement, driven by growing regulatory pressure in the European Union and increasing customer expectations for credible and auditable emissions data. For manufacturers in the automotive supply chain, this is especially challenging because emissions data does not live in one place. It is distributed across fragmented tiers of suppliers, different internal systems, and partner-to-partner handoffs that still happen through spreadsheets, emails, and one-off integrations.

At the same time, the industry is converging on shared ways to exchange data, with Catena-X setting expectations for interoperability and trust in cross-company collaboration. PACIFIC was built for this reality as a multi-tenant SaaS product that enables companies to manage and exchange PCFs while maintaining data sovereignty. Its Catena-X certification signals alignment with industry standards, and the partnership with BASF grounds the platform in real supply chain requirements.

Data security, sovereignty, and interoperability

To make PCF exchange work in the real world, PACIFIC needed to solve two problems at the same time: enable frictionless collaboration across companies, while guaranteeing that each company stays in full control of their data and credentials. The platform had to operate as a multi-tenant software as a service (SaaS) for the supply chain, serving organizations on shared infrastructure without introducing any possibility of cross-tenant access.

They had to build an interoperable solution that could communicate with other solution providers on the Catena-X data space, using Eclipse Dataspace Components (EDC) connectors as a standard mechanism for cross-company data exchange. That meant enforcing strict data sovereignty, not only for PCF records but also for sensitive Catena-X integration configuration such as EDC and Digital Twin Registry (DTR) credentials. At the exchange layer, PACIFIC needed end-to-end authorization aligned with Catena-X expectations, where PCF data is shared only after explicit agreement and policy negotiation through EDC. Finally, the solution had to be practical to run and scale, so the following had to happen:

  • Onboard new companies without spinning up separate AWS accounts per tenant
  • Integrate suppliers’ PCF systems like BASF without tight coupling to the exchange workflow
  • Keep the platform secure, auditable, and operable as usage grows

Solution overview

Figure 1 gives a high-level view of how PACIFIC is built and deployed to enable secure, multi-tenant PCF exchange on the Catena-X data space. It shows the main building blocks of the product, how user traffic reaches the application, how tenant-aware identity and authorization are enforced, and how PACIFIC separates core platform features from integrations and exchange endpoints. The diagram also highlights the external connections enabling interoperability, including supplier PCF data sources like BASF services, and EDC and DTR “enablement service providers” for Catena-X based data sharing.

AWS Cloud architecture diagram for the PACIFIC platform showing a multi-layered system. At the top, a PACIFIC Web Client connects to an Identity & Authorization layer containing Amazon Cognito, AWS IAM, and AWS Secrets Manager. Traffic flows through AWS WAF to an Application Load Balancer within a VPC, which distributes requests to Amazon ECS (AWS Fargate) hosting four containerized microservices: core-modules, integration-module, pcf-exchange-module, and edc-dtr-module. These modules connect to Amazon RDS for relational database storage and Amazon S3 for object storage. External integrations at the bottom include BASF Product Carbon Footprint Services, an EDC/DTR Service Provider, and the Catena-X Automotive Network. The diagram illustrates a secure, microservices-based architecture for automotive industry carbon footprint data exchange.

Figure 1: PACIFIC high-level service architecture

Data protection through IAM-based tenant isolation

A core requirement for PACIFIC is maintaining data protection and security. Each company must have exclusive control over their PCF data, EDC connector, and DTR management credentials, without any possibility of cross-tenant access. Rather than provisioning separate AWS accounts per tenant PACIFIC implements a fine-grained IAM-based isolation model built on Amazon Cognito and AWS Secrets Manager. When a company joins the platform, PACIFIC automatically provisions a dedicated IAM role with a scoped policy that permits access only to that company’s secrets in Secrets Manager. Users are assigned to an Amazon Cognito user pool group linked to their company’s IAM role. When a user authenticates, the Amazon Cognito identity pool maps their group membership to the corresponding IAM role, and AWS Security Token Service (AWS STS) issues temporary credentials for that role. This means, a user’s credentials can only retrieve their own company’s EDC secrets and access to other tenants’ configuration is denied at the IAM policy level. This architecture delivers true multi-tenant isolation using native AWS identity services, without the overhead of managing dedicated accounts or Amazon Virtual Private Cloud (Amazon VPC) per customer.

Securing PCF exchange with EDC-issued authorization tokens

Beyond tenant isolation within PACIFIC, CircularTree enforces authorization at the data exchange layer through the pcf-exchange-module, a per-tenant endpoint that serves PCF data to authorized trading partners. When a consumer’s EDC connector requests PCF data from a supplier’s EDC, the two connectors negotiate and agree on usage policies governing how the exchanged information can be used. After this agreement is established, the supplier’s EDC issues a special authorization token to the consumer’s EDC. The token derives from the supplier company’s Cognito app client credentials stored within their EDC and grants access specifically to that supplier’s pcf-exchange-module endpoint in PACIFIC. The consumer’s EDC then uses this token to call the supplier’s dedicated endpoint and retrieve the authorized PCF data. Because each tenant’s pcf-exchange-module is published as an individual endpoint, which only accepts tokens issued through the EDC handshake process, unauthorized access is prevented at multiple levels. One level is through EDC policy negotiation, and the other is through company-scoped OAuth2 token validation. This ensures that PCF data is transmitted only after explicit consent and only to the specific trading partner authorized in the data exchange agreement. Figure 2 gives an overview of the communication flow.

Data flow diagram showing a six-step secure token exchange process between Consumer EDC and Supplier EDC systems via the PACIFIC platform on AWS. The flow proceeds as follows: (1) Consumer EDC sends a Request PCF to Supplier EDC, (2) Policy Negotiation occurs between the two EDCs (shown as a dashed line), (3) a token is issued (marked with a key icon), (4) Supplier EDC provides a Data Space URL to the pcf-exchange-module, (5) Token Validation occurs between the pcf-exchange-module and the supplier-oauth2-client component (marked with a key icon), and (6) PCF Data flows back to the Consumer EDC. The PACIFIC layer at the bottom contains two AWS-hosted components: the pcf-exchange-module (orange icon) and the supplier-oauth2-client (red icon with checkmark), demonstrating OAuth2-based secure authentication for Product Carbon Footprint data exchange.

Figure 2: EDC-to-EDC communication with Cognito Oauth2 Tokens

Integrating supplier PCF systems through the integration module

While the pcf-exchange-module handles secure data exchange between trading partners using the Catena-X data space, PACIFIC also needs to ingest PCF data from suppliers’ internal systems. Running on AWS Fargate, the integration-module provides a flexible, scalable integration layer that connects to proprietary supplier PCF systems, such as BASF’s internal PCF services. Each supplier integration requires handling unique authentication flows. This ranges from OAuth2 client credentials to certificate-based authentication or API key mechanisms, all of which are securely managed through AWS Secrets Manager. The integration-module expects incoming PCF data to already conform to the standardized Catena-X PCF JSON format, ensuring consistency at the point of ingestion. After received, PCF data is stored in Amazon Simple Storage Service (Amazon S3) under company-specific prefixes. This is where IAM policies make sure that only the PCF owner company can access their respective data. By decoupling supplier system integration from the data exchange layer, PACIFIC can onboard new supplier PCF data sources without impacting the downstream Catena-X data sharing workflows. This can be done while the S3-based storage model helps maintain strict data sovereignty, and each company’s PCF data remains isolated and accessible only to its rightful owner.

Conclusion

PACIFIC turns Catena-X PCF exchange from a specification into an interoperable, scalable workflow running on Amazon ECS and AWS Fargate without requiring companies to give up control of their data and credentials. The impact is measurable in both speed and operational scalability. From a business perspective, BASF highlights the most tangible improvement: when a requested PCF dataset is already available, a manual exchange can take up to around seven days, whereas PACIFIC responds in seconds, and can deliver automated updates when PCFs change. This capability delivers up to 75% time savings for both customers and BASF. It also reduces the time-to-data from days to seconds and making emissions information more visible and usable in day-to-day supply chain operations. PACIFIC’s multi-tenant architecture scales onboarding and operations without managing individual AWS accounts per company, while still enforcing strong tenant isolation through IAM-scoped access control and per-tenant exchange endpoints. This scalability translates into faster onboarding, enabling BASF to integrate significantly more partners into the data space. The results are measurable: an 80% increase in newly onboarded companies between 2024 and 2025, and 55% growth in requested products and shared PCFs over the same period. This provides a scalable baseline for expanding the number of onboarded organizations and increasing the volume of PCF data exchanged as adoption grows—without weakening data sovereignty or interoperability. These results underline PACIFIC’s role as a catalyst for accelerating decarbonization across supply chains.

We encourage you to join BASF, CircularTree, and AWS in industry data sharing through emerging data spaces and transparent, trusted PCF exchange across global supply networks. To explore more sustainability solutions and AWS architecture patterns, visit the AWS Architecture Blog and get started with PACIFIC through the Cofinity-X App Marketplace.


About the authors
AWS Weekly Roundup: AWS DevOps Agent & Security Agent GA, Product Lifecycle updates, and more (April 6, 2026)

Post Syndicated from Channy Yun (윤석찬) original https://aws.amazon.com/blogs/aws/aws-weekly-roundup-aws-devops-agent-security-agent-ga-product-lifecycle-updates-and-more-april-6-2026/

Last week, I visited AWS Hong Kong User Group with my team. Hong Kong has a small but strong community, and their energy and passion are high. They recently started a new AI user group, and we hope more people will join. I was able to strengthen my bond with the community through great food and conversation.

This week, I”ll first take a closer look at some of the key launches.

AWS DevOps Agent and Security Agent GA
At the last re:Invent, we introduced the concept of frontier agents that work autonomously across multiple steps to achieve outcomes, operating continuously until the job is done. The first two—AWS DevOps Agent and AWS Security Agent—are now generally available after the preview.
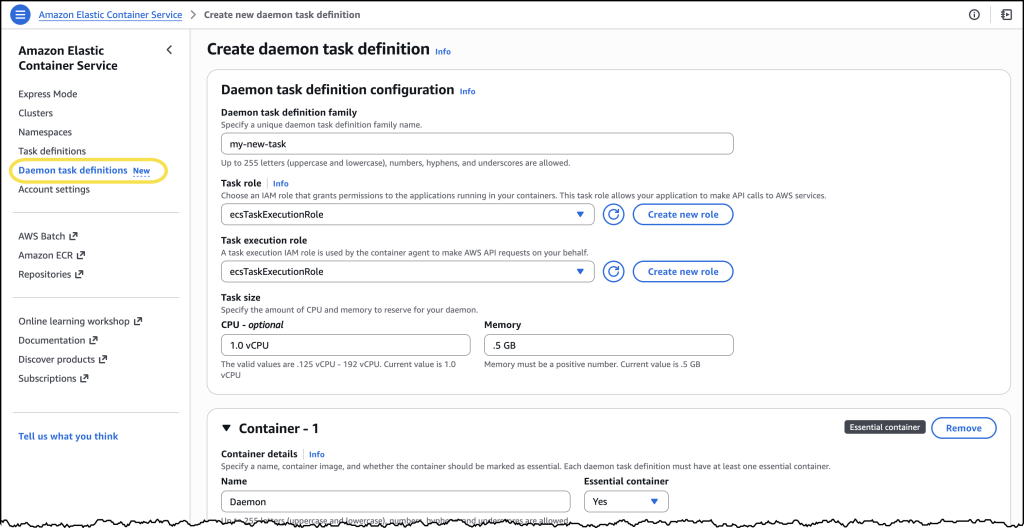
AWS DevOps Agent helps you run cloud operations—investigating incidents, reducing time to resolution, and preventing issues before they happen. Customers like United Airlines, Western Governors University, and T-Mobile are already using DevOps Agent to accelerate incident response and simplify operations at scale. At WGU, resolution time dropped from hours to minutes, and in preview customers report up to 75% lower MTTR and 3 to 5 times faster resolution. Learn more in Sébastien’s preview blog post and GA announcement.

AWS Security Agent brings continuous, context-aware penetration testing into the development lifecycle. This agent operates like a human penetration tester. Customers including LG CNS, HENNGE, and Wayspring are seeing strong results. At LG CNS, teams estimate over 50% faster testing and ~30% lower costs, along with significantly fewer false positives. Learn more in Esra’s preview blog post and GA announcement.

Both are designed to work across AWS cloud, multicloud, and on-prem environments. You can have an always-available teammate that can handle the heavy lifting, so you can focus on what matters most.

AWS Service Availability Updates
When the availability of an AWS service or feature changes, we provide customers guidance in AWS Product Lifecycle Changes on available alternatives and support for migration so that disruptions to your operations are minimized. The following lifecycle changes were updated on March 31, 2026.

We understand that changes in availability can impact your operations. For specific guidance, consult the relevant service documentation or contact AWS Support.

Last week’s launches
Here are last week’s launches that caught my attention:

For a full list of AWS announcements, be sure to keep an eye on the What’s New with AWS page.

Additional updates
Here are some additional news items that you might find interesting:

For a full list of AWS blog posts, be sure to keep an eye on the AWS Blogs page.

Learn more about AWS, browse and join upcoming AWS led in-person and virtual events, startup events, and developer-focused events as well as AWS Summits and AWS Community Days. Join the AWS Builder Center to connect with builders, share solutions, and access content that supports your development.

That’s all for this week. Check back next Monday for another Weekly Roundup!

Channy

Announcing managed daemon support for Amazon ECS Managed Instances

Post Syndicated from Micah Walter original https://aws.amazon.com/blogs/aws/announcing-managed-daemon-support-for-amazon-ecs-managed-instances/

Today, we’re announcing managed daemon support for Amazon Elastic Container Service (Amazon ECS) Managed Instances. This new capability extends the managed instances experience we introduced in September 2025, by giving platform engineers independent control over software agents such as monitoring, logging, and tracing tools, without requiring coordination with application development teams, while also improving reliability by ensuring every instance consistently runs required daemons and enabling comprehensive host-level monitoring.

When running containerized workloads at scale, platform engineers manage a wide range of responsibilities, from scaling and patching infrastructure to keeping applications running reliably and maintaining the operational agents that support those applications. Until now, many of these concerns were tightly coupled. Updating a monitoring agent meant coordinating with application teams, modifying task definitions, and redeploying entire applications, a significant operational burden when you’re managing hundreds or thousands of services.

Decoupled lifecycle management for daemons

Amazon ECS now introduces a dedicated managed daemons construct that enables platform teams to centrally manage operational tooling. This separation of concerns allows platform engineers to independently deploy and update monitoring, logging, and tracing agents to infrastructure, while enforcing consistent use of required tools across all instances, without requiring application teams to redeploy their services. Daemons are guaranteed to start before application tasks and drain last, ensuring that logging, tracing, and monitoring are always available when your application needs them.

Platform engineers can deploy managed daemons across multiple capacity providers, or target specific capacity providers, giving them flexibility in how they roll out agents across their infrastructure. Resource management is also centralized, allowing teams to define daemon CPU and memory parameters separately from application configurations with no need to rebuild AMIs or update task definitions, while optimizing resource utilization since each instance runs exactly one daemon copy shared across multiple application tasks.

Let’s try it out
To take ECS Managed Daemons for a spin, I decided to start with the Amazon CloudWatch Agent as my first managed daemon. I had previously set up an Amazon ECS cluster with a Managed Instance capacity provider using the documentation.

From the Amazon Elastic Container Service console, I noticed a new Daemon task definitions option in the navigation pane, where I can define my managed daemons.

Managed daemons console

I chose Create new daemon task definition to get started. For this example, I configured the CloudWatch Agent with 1 vCPU and 0.5 GB of memory. In the Daemon task definition family field, I entered a name I’d recognize later.

For the Task execution role, I selected ecsTaskExecutionRole from the dropdown. Under the Container section, I gave my container a descriptive name and pasted in the image URI: public.ecr.aws/cloudwatch-agent/cloudwatch-agent:latest along with a few additional details.

After reviewing everything, I chose Create.

Once my daemon task definition was created, I navigated to the Clusters page, selected my previously created cluster and found the new Daemons tab.

Managed daemons 2

Here I can simply click the Create daemon button and complete the form to configure my daemon.

Managed daemons 3

Under Daemon configuration, I selected my newly created daemon task definition family and then assigned my daemon a name. For Environment configuration, I selected the ECS Managed Instances capacity provider I had set up earlier. After confirming my settings, I chose Create.

Now ECS automatically ensures the daemon task launches first on every provisioned ECS managed instance in my selected capacity provider. To see this in action, I deployed a sample nginx web service as a test workload. Once my workload was deployed, I could see in the console that ECS Managed Daemons had automatically deployed the CloudWatch Agent daemon alongside my application, with no manual intervention required.

When I later updated my daemon, ECS handled the rolling deployment automatically by provisioning new instances with the updated daemon, starting the daemon first, then migrating application tasks to the new instances before terminating the old ones. This “start before stop” approach ensures continuous daemon coverage: your logging, monitoring, and tracing agents remain operational throughout the update with no gaps in data collection. The drain percentage I configured controlled the pace of this replacement, giving me complete control over addon updates without any application downtime.

How it works
The managed daemon experience introduces a new daemon task definition that is separate from task definitions, with its own parameters and validation scheme. A new daemon_bridge network mode enables daemons to communicate with application tasks while remaining isolated from application networking configurations.

Managed daemons support advanced host-level access capabilities that are essential for operational tooling. Platform engineers can configure daemon tasks as privileged containers, add additional Linux capabilities, and mount paths from the underlying host filesystem. These capabilities are particularly valuable for monitoring and security agents that require deep visibility into host-level metrics, processes, and system calls.

When a daemon is deployed, ECS launches exactly one daemon process per container instance before placing application tasks. This guarantees that operational tooling is in place before your application starts receiving traffic. ECS also supports rolling deployments with automatic rollbacks, so you can update agents with confidence.

Now available
Managed daemon support for Amazon ECS Managed Instances is available today in all AWS Regions. To get started, visit the Amazon ECS console or review the Amazon ECS documentation. You can also explore the new managed daemons Application Programming Interface (APIs) by visiting this website.

There is no additional cost to use managed daemons. You pay only for the standard compute resources consumed by your daemon tasks.

Choosing between Amazon ECS Blue/Green Native or AWS CodeDeploy in AWS CDK

Post Syndicated from Franco Abregu original https://aws.amazon.com/blogs/devops/choosing-between-amazon-ecs-blue-green-native-or-aws-codedeploy-in-aws-cdk/

Blue/green deployments on Amazon Elastic Container Service (Amazon ECS) have long been a go-to pattern for shipping zero-downtime deployments. Historically, the recommended approach in the AWS Cloud Development Kit (AWS CDK) was to wire ECS to AWS CodeDeploy for traffic shifting, lifecycle hooks, and tight integration with AWS CodePipeline.

In July 2025, Amazon ECS launched built-in blue/green deployments. This allows you to operate directly within the ECS service, without requiring the use of Amazon CodeDeploy.

This post explains what changed, how the new ECS-native blue/green model compares to CodeDeploy, and how to decide which path to take in your CDK projects.

Figure1: Amazon ECS blue/green deployment with AWS CodeDeploy

Figure1: Amazon ECS blue/green deployment with AWS CodeDeploy

Why blue/green on ECS, and what was launched in July 2025

In a blue/green deployment, two production environments are maintained: blue, the current environment, and green, the new environment. This strategy allows you to validate the new version of your environment before it receives production traffic.

The ECS service team saw an opportunity to simplify the deployment process by creating lifecycle hooks, bake time, and managed rollback directly within ECS. With this shift, the complexity of coordinating blue/green deployments through CodeDeploy is consolidated into a single service. This consolidation not only simplifies the deployment pipeline but also reduces the number of moving parts, making it easier to maintain and troubleshoot over time.

Conceptually, ECS-native blue/green provisions a replacement task set registered to a separate target group (blue target group in figure 2) behind your Elastic Load Balancing listener. When you approve the cutover, ECS performs an all-at-once traffic shift to the green revision (green target group in figure 2), then holds both revisions during a configurable bake period before retiring blue or rolling back if alarms or hooks fail.

Figure 2: Amazon ECS Native Blue Green DeploymentFigure 2: Amazon ECS Native Blue Green Deployment
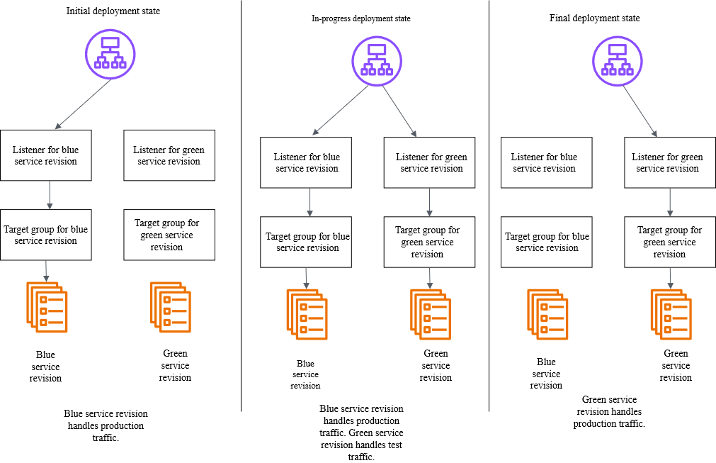
Unlike CodeDeploy, which requires fine-grained configuration of traffic shifting strategies, ECS native deployments are intentionally simpler, designed to cover the most common blue/green use cases without the operational overhead of managing a multi-phase canary.

Two paths in CDK: ECS-native blue/green vs. CodeDeploy blue/green

With CDK, you now have two ways to achieve blue/green on ECS. One is the ECS-native path that keeps deployment configuration on the CDK ECS module and its related load balancer resources. You configure lifecycle hooks that invoke AWS Lambda functions at specific deployment stages, you set a bake time, and you optionally use a test listener or Amazon ECS Service Connect header rules to validate traffic to the green revision before production cutover. The CodeDeploy path creates a CodeDeploy application and deployment group bound to your ECS service and Application Load Balancer (ALB), lets you choose canary, linear, or all-at-once policies, and typically plugs into AWS CodePipeline for orchestration.

A key functional difference is how the traffic shifts. ECS-native blue/green performs an immediate all-at-once switch to green, followed by a bake period; CodeDeploy supports canary and linear shifting in addition to all-at-once. If you require progressive exposure by percentage, CodeDeploy remains the way to go. If you want a simpler, service-centric model with fewer moving parts, ECS-native is now the default choice.

Currently, the AWS CDK includes L2 support for ECS-native blue/green so that you can model these settings directly without custom CloudFormation or escape hatches. If your stack already uses the Deployment Controller Type. CODE_DEPLOY path, you can continue to do so; migration options exist (outlined later in this post).

Figure 3: Amazon CodeDeploy blue/green deployment traffic shift

Figure 3: Amazon CodeDeploy blue/green deployment traffic shift

Decision guide: choosing the right path

AWS CodeDeploy offers more refined functionality for managing deployments through its integration with AWS CodePipeline to support multi-stage workflows across services, regions, and accounts, and provides a clear audit trail for change management. AWS CodeDeploy offers policies that can shift traffic in defined increments (for example, 5% or 10%) with automated metric checks and optional approvals. This deployment pattern supports coordinating multiple environments with formal governance, or teams that want data-driven promotions based on alarms and checkpoints. Because of its integration with AWS CodePipeline, you can have several stages for different services for ECS Blue/Green (CodeDeploy) and coordinate the deployment of multiple dependent services in a single release.

Utilize ECS-native to achieve a compact operational footprint by consolidating deployments and operations into a single service. The ECS service supports zero-downtime deployments through Blue/Green deployment (shifting the traffic all at one time) and enables quick rollbacks with configurable settings for minimumHealthyPercent and maximumPercent. Application Load Balancer (ALB) draining and task health checks ensure a balance between speed and safety. Additionally, the built-in deployment circuit breaker automatically halts and reverts problematic rollouts, minimizing operational issues.

How to implement in ECS native in CDK

To utilize ECS-native blue/green in CDK, start with an Amazon ECS service (Fargate or EC2), an Application Load Balancer, and two target groups managed by ECS during deployments. In your service definition, you’ll opt into the blue/green deployment type, set a bake time, and attach lifecycle hooks. Hooks can run Lambda functions at stages such as before scale-up or after production traffic shift, letting you run synthetic tests, warm caches, or gate on external checks. If you’re using Amazon ECS Service Connect, you can route “dark” test traffic to green by sending requests with a specific header during the pre-cutover phase.

const service = new ecs.FargateService(this, "Service", {
      cluster,
      taskDefinition,
      desiredCount: 3,
      securityGroups: [serviceSG],
      vpcSubnets: {
        subnetType: ec2.SubnetType.PRIVATE_WITH_EGRESS,
      },
      deploymentStrategy: ecs.DeploymentStrategy.BLUE_GREEN,
      bakeTime: Duration.minutes(30),
      propagateTags: ecs.PropagatedTagSource.SERVICE,
      deploymentAlarms: {
        alarmNames: [
          this.stackName + "-Http-500-Blue",
          this.stackName + "-Http-500-Green",
          "Synthetics-Alarm-trivia-game-" + props.stage,
        ],
        behavior: ecs.AlarmBehavior.ROLLBACK_ON_ALARM,
      },
      lifecycleHooks: [
        new ecs.DeploymentLifecycleLambdaTarget(
          preTrafficHook,
          "PreTrafficHook",
          {
            lifecycleStages: [
              ecs.DeploymentLifecycleStage.POST_TEST_TRAFFIC_SHIFT,
            ],
          }
        ),
      ],
      minHealthyPercent: 100,
      maxHealthyPercent: 200,
    });

Code Snipped: Amazon ECS service with AWS Fargate and AWS CodeDeploy

Conclusion

Using ECS-native blue/green deployments is now the recommended default for most teams. This approach provides zero-downtime cutovers, lifecycle hooks, bake time, and rollback capabilities without requiring the management of an additional service.

Choose CodeDeploy only if you need advanced traffic shifting options, such as canary or linear deployments, or if you have other dependencies with AWS CodePipeline workflows.

Bring your ECS deployments to the next level by enabling Blue/Green deployment with the strategy that best fits for your use case. For step-by-step instructions for migrating from CodeDeploy to ECS-Native refer to this migration guide.

Franco Abregu

Franco Abregu is a Sr. Delivery Consultant – DevOps at AWS Professional Services based in Argentina. Franco focuses on transforming customers DevOps culture to improve developer productivity, operations, deployments and process standardization. His expertise includes CI/CD, Infrastructure as Code, software development and organizational adoption of DevOps culture.

Chris Renzo

is a Sr. Solution Architect within the AWS Defense and Aerospace organization. Outside of work, he enjoys a balance of warm weather and traveling.

AWS Weekly Roundup: Claude Opus 4.6 in Amazon Bedrock, AWS Builder ID Sign in with Apple, and more (February 9, 2026)

Post Syndicated from Sébastien Stormacq original https://aws.amazon.com/blogs/aws/aws-weekly-roundup-claude-opus-4-6-in-amazon-bedrock-aws-builder-id-sign-in-with-apple-and-more-february-9-2026/

Here are the notable launches and updates from last week that can help you build, scale, and innovate on AWS.

Last week’s launches
Here are the launches that got my attention this week.

Let’s start with news related to compute and networking infrastructure:

  • Introducing Amazon EC2 C8id, M8id, and R8id instances: These new Amazon EC2 C8id, M8id, and R8id instances are powered by custom Intel Xeon 6 processors. These instances offer up to 43% higher performance and 3.3x more memory bandwidth compared to previous generation instances.
  • AWS Network Firewall announces new price reductions: The service has added the hourly and data processing discounts on NAT Gateways that are service-chained with Network Firewall secondary endpoints. Additionally, AWS Network Firewall has removed additional data processing charges for Advanced Inspection, which enables Transport Layer Security (TLS) inspection of encrypted network traffic.
  • Amazon ECS adds Network Load Balancer support for Linear and Canary deployments: Applications that commonly use NLB, such as those requiring TCP/UDP-based connections, low latency, long-lived connections, or static IP addresses, can take advantage of managed, incremental traffic shifting natively from ECS when rolling out updates.
  • AWS Config now supports 30 new resource types: These range across key services including Amazon EKS, Amazon Q, and AWS IoT. This expansion provides greater coverage over your AWS environment, enabling you to more effectively discover, assess, audit, and remediate an even broader range of resources.
  • Amazon DynamoDB global tables now support replication across multiple AWS accounts: DynamoDB global tables are a fully managed, serverless, multi-Region, and multi-active database. With this new capability, you can replicate tables across AWS accounts and Regions to improve resiliency, isolate workloads at the account level, and apply distinct security and governance controls.
  • Amazon RDS now provides an enhanced console experience to connect to a database: The new console experience provides ready-made code snippets for Java, Python, Node.js, and other programming languages as well as tools like the psql command line utility. These code snippets are automatically adjusted based on your database’s authentication settings. For example, if your cluster uses IAM authentication, the generated code snippets will use token-based authentication to connect to the database. The console experience also includes integrated CloudShell access, offering the ability to connect to your databases directly from within the RDS console.

Then, I noticed three news items related to security and how you authenticate on AWS:

  • AWS Builder ID now supports Sign in with Apple: AWS Builder ID, your profile for accessing AWS applications including AWS Builder Center, AWS Training and Certification, AWS re:Post, AWS Startups, and Kiro, now supports sign-in with Apple as a social login provider. This expansion of sign-in options builds on the existing sign-in with Google capability, providing Apple users with a streamlined way to access AWS resources without managing separate credentials on AWS.
  • AWS STS now supports validation of select identity provider specific claims from Google, GitHub, CircleCI and OCI: You can reference these custom claims as condition keys in IAM role trust policies and resource control policies, expanding your ability to implement fine-grained access control for federated identities and help you establish your data perimeters. This enhancement builds upon IAM’s existing OIDC federation capabilities, which allow you to grant temporary AWS credentials to users authenticated through external OIDC-compatible identity providers.
  • AWS Management Console now displays Account Name on the Navigation bar for easier account identification: You now have an easy way to identify your accounts at a glance. You can now quickly distinguish between accounts visually using the account name that appears in the navigation bar for all authorized users in that account.
  • Amazon CloudFront announces mutual TLS support for origins: Now with origin mTLS support, you can implement a standardized, certificate-based authentication approach that eliminates operational burden. This enables organizations to enforce strict authentication for their proprietary content, ensuring that only verified CloudFront distributions can establish connections to backend infrastructure ranging from AWS origins and on-premises servers to third-party cloud providers and external CDNs.

Finally, there is not a single week without news around AI :

  • Claude Opus 4.6 now available in Amazon Bedrock: Opus 4.6 is Anthropic’s most intelligent model to date and a premier model for coding, enterprise agents, and professional work. Claude Opus 4.6 brings advanced capabilities to Amazon Bedrock customers, including industry-leading performance for agentic tasks, complex coding projects, and enterprise-grade workflows that require deep reasoning and reliability.
  • Structured outputs now available in Amazon Bedrock: Amazon Bedrock now supports structured outputs, a capability that provides consistent, machine-readable responses from foundation models that adhere to your defined JSON schemas. Instead of prompting for valid JSON and adding extra checks in your application, you can specify the format you want and receive responses that match it—making production workflows more predictable and resilient.

Upcoming AWS events
Check your calendars so that you can sign up for this upcoming event:

AWS Community Day Romania (April 23–24, 2026): This community-led AWS event brings together developers, architects, entrepreneurs, and students for more than 10 professional sessions delivered by AWS Heroes, Solutions Architects, and industry experts. Attendees can expect expert-led technical talks, insights from speakers with global conference experience, and opportunities to connect during dedicated networking breaks, all hosted at a premium venue designed to support collaboration and community engagement.

If you’re looking for more ways to stay connected beyond this event, join the AWS Builder Center to learn, build, and connect with builders in the AWS community.

Check back next Monday for another Weekly Roundup.

— seb

Serverless ICYMI Q4 2025

Post Syndicated from Julian Wood original https://aws.amazon.com/blogs/compute/serverless-icymi-q4-2025/

Stay current with the latest serverless innovations that can transform your applications. In this 31st quarterly recap, discover the most impactful AWS serverless launches, features, and resources from Q4 2025 that you might have missed.

In case you missed our last ICYMI, check out what happened in Q3 2025.

2025 Q4 calendar

2025 Q4 calendar

Serverless at re:Invent 2025

This post covers the biggest serverless announcements from re:Invent 2025, highlighting key feature updates that can improve your applications, and shares valuable resources to keep you informed.

AWS re:Invent 2025 had more than 60,000 in-person attendees and more than 2 million online viewers for the keynotes. The event featured 3,500 sessions from 3,000 speakers, which included information on 530 AWS service and feature announcements.

Keynote Igniting the serverless movement

Keynote Igniting the serverless movement

The serverless content consisted of two tracks: Containers and Serverless (CNS) and Application Integration (API). These tracks included 150 unique sessions watched in-person by more than 16,000 attendees. There were developer-focused experiences including a Road to re:Invent Hackathon, AWS Builder Loft, and Builders Arena. Serverlesspresso, the coffee shop powered by serverless technology, operated in two locations during the event: the Expo Hall and the certification lounge.

Serverless and developer community photo

Serverless and developer community photo

Find a curated list of serverless videos on Serverless Land YouTube.

AWS Lambda durable functions

Managing state across multi-step serverless workflows has traditionally required complex external orchestration tools. AWS Lambda durable functions expand how developers can use Lambda. You can now build reliable multi-step applications and AI workflows directly within Lambda.

AWS Lambda durable functions code

AWS Lambda durable functions code

Durable functions automatically checkpoint progress by saving the current state and completed steps at key points during execution. This allows them to suspend execution for up to one year during long-running tasks and recover from failures by resuming from the last checkpoint rather than restarting from the beginning, all without requiring additional infrastructure management.

Developers can now build in Python or TypeScript, wrap calls in steps with automatic retries and checkpointing. You can use waits to suspend execution for minutes, hours, or even up to a year without paying for idle compute. Durable functions use a replay mechanism to maintain state and handle failures gracefully. The replay mechanism works by re-executing your function code from checkpoints when recovering from failures, ensuring state consistency without data loss. This also means you don’t need complex external orchestration tools for many use cases. This can be helpful for AI workflows and multi-step applications where you need reliable state management without managing external infrastructure.

For more information, read the launch blog post and watch the re:Invent Breakout Session video: Deep Dive on AWS Lambda durable functions (CNS380)

AWS Lambda Managed Instances

Lambda now offers Lambda Managed Instances, a new compute option that combines Amazon EC2 flexibility with fully managed infrastructure. AWS automatically handles instance provisioning, scaling, and maintenance while allowing access to the full range of EC2 capabilities, including Graviton4, network-optimized instances, and other specialized compute options.

AWS Lambda Managed Instances configuration

AWS Lambda Managed Instances configuration

Your functions run on dedicated EC2 capacity from your account, in your own Amazon Virtual Private Cloud (Amazon VPC). AWS still manages the operational overhead, including OS patching, load balancing, and auto-scaling. This gives you access to specialized hardware options while maintaining the serverless operational model. You can further improve costs by using EC2 pricing models, including Compute Savings Plans and Reserved Instances for Lambda workloads. Each instance can handle multiple concurrent requests, making this particularly valuable for high-volume, steady-state workloads where predictable pricing and specific hardware requirements matter.

For more information, read the launch blog post and watch the re:Invent Breakout Session video: Lambda Managed Instances: EC2 Power with Serverless Simplicity (CNS382).

Other Lambda announcements

Multi-tenant SaaS applications face challenges like data leakage between tenants and noisy neighbor effects where one tenant’s workload impacts others. They also struggle with implementing custom isolation mechanisms. Tenant isolation mode addresses these by processing function invocations in separate execution environments for each tenant. This manages tenant-level compute environment isolation automatically.

AWS Lambda tenant isolation

AWS Lambda tenant isolation

Lambda adds Provisioned Mode for Amazon SQS event-source mappings, providing predictable performance and reduced cold starts for high-throughput SQS processing workloads.

You can now send up to 1 MB of data in asynchronous Lambda invocations, increased from 256 KB, helping you build more complex data processing scenarios.

Lambda functions now support IPv6 networking, so you don’t need NAT Gateways when accessing the internet or other AWS services from VPC-connected functions.

Lambda internet connectivity through a NAT Gateway (IPv4) and Lambda internet connectivity through an egress-only internet gateway (IPv6).

Lambda internet connectivity through a NAT Gateway (IPv4) and Lambda internet connectivity through an egress-only internet gateway (IPv6).

Lambda Rust support is now generally available, moving from experimental status. This is backed by AWS Support and the Lambda availability SLA.

Lambda has expanded its runtime support by adding Python 3.14, Node.js 24, and Java 25 as both managed runtimes and container base images, providing access to the latest language features and ensuring long-term support.

Amazon ECS

Amazon Elastic Container Service (Amazon ECS) Express Mode streamlines the deployment and management of containerized applications by automating the infrastructure setup that traditionally slows down developers.

Amazon ECS Express Mode deployment

Amazon ECS Express Mode deployment

This means you can focus on building applications while deploying with confidence using AWS best practices. Express Mode lets you deploy production-ready containerized web applications and APIs with a single command. This automatically handles domains, networking, load balancing, AWS Identity and Access Management (IAM) roles, and auto-scaling through simplified APIs. When your applications evolve and require advanced features, you can seamlessly configure and access the full capabilities of the resources, including Amazon ECS. Learn more from the launch blog post.

Amazon ECS announced a public preview of a fully managed MCP server, enabling AI-powered experiences for development and operations. The Model Context Protocol (MCP) server provides enterprise-grade capabilities like automatic updates and patching, centralized security through AWS IAM integration, comprehensive audit logging via AWS CloudTrail, and the proven scalability, reliability, and support of AWS.

Amazon Elastic Container Registry (ECR) managed container image signing enhances your security posture and eliminates the operational overhead of setting up signing. Container image signing allows you to verify that images are from trusted sources. ECR automatically signs images as they are pushed using the identity of the entity pushing the image. Signing operations are logged through CloudTrail for full auditability.

Amazon API Gateway

Amazon API Gateway allows you to improve the responsiveness of your REST APIs by progressively streaming response payloads back to the client. With this new capability, you can use streamed responses to enhance user experience when building LLM-driven applications (such as AI agents and chatbots), improve time-to-first-byte (TTFB) performance for web and mobile applications, stream large files, and perform long-running operations while reporting incremental progress using protocols such as server-sent events (SSE).

Amazon API Gateway streaming

API Gateway introduces private integration with Application Load Balancers (ALBs). You can use this to expose your VPC-based applications securely through REST APIs without exposing your ALBs to the public internet.

You can also now configure enhanced TLS security policies on API endpoints and custom domain names, providing you with greater control over the security posture of your APIs.

Amazon EventBridge

Amazon EventBridge introduced an enhanced visual rule builder that helps developers discover and subscribe to events from custom applications and over 200 AWS services. The console-based interface integrates the EventBridge schema registry with a comprehensive event catalog and intuitive drag-and-drop canvas that simplifies building event-driven applications. Developers can browse and search through events with readily available sample payloads and schemas without having to hunt through individual service documentation. The schema-aware visual builder guides developers through creating event filter patterns and rules, reducing syntax errors and accelerating development time.

EventBridge also allows targeting SQS fair queues.

AWS Step Functions

AWS Step Functions allows for enhanced local testing through the TestState API, providing programmatic access to comprehensive testing capabilities without deploying to AWS. This helps you build automated test suites that validate your workflow definitions locally on your development machines. Test error handling patterns, data transformations, and mock service integrations using your preferred testing frameworks.

There is also a new metrics dashboard, giving you visibility into your workflow operations at both the account and state machine levels.

Other announcements

Savings Plans flexible pricing model extends to AWS managed database services with the launch of Database Savings Plans. This helps reduce database costs by up to 35% when committing to a consistent amount of usage ($/hour) over a 1-year term. Savings automatically apply each hour to eligible usage across supported database services, and additional usage beyond the commitment is billed at on-demand rates.

Amazon DynamoDB now supports multi-attribute composite keys in global secondary indexes. You no longer need to concatenate values into synthetic keys manually, which sometimes results in the need to backfill data before adding new indexes. Instead, you can create primary keys using up to eight existing attributes, making it easier to model diverse access patterns and adapt to new query requirements.

Amazon Bedrock introduced AgentCore with quality evaluations and policy controls for deploying trusted AI agents at scale.

Bedrock also added 18 fully managed open weight models, expanding AI model options for developers.

The Strands Agents SDK is an open source framework that takes a model-driven approach to building and running AI agents in just a few lines of code. TypeScript support is now available in preview so you can choose between Python and TypeScript for building Strands Agents.

Amazon S3 Vectors became generally available. S3 Vectors delivers purpose-built, cost-optimized vector storage for AI agents, inference, Retrieval Augmented Generation (RAG), and semantic search at billion-vector scale.

Serverless blog posts

October

November

Serverless Office Hours

Join our livestream every Tuesday at 11 AM PT for live discussions, Q&A sessions, and deep dives into serverless technologies. Episodes are available on-demand at serverlessland.com/office-hours.

October

November

December

Still looking for more?

The Serverless landing page has overall information about building serverless applications. The Lambda resources page contains case studies, webinars, whitepapers, customer stories, reference architectures, and even more Getting Started tutorials.

You can also follow the Serverless Developer Advocacy team to see the latest news, follow conversations, and interact with the team.

And finally, visit Serverless Land for all your serverless needs.