All posts by Cesar Caceres

When Generative AI Meets Zabbix

Post Syndicated from Cesar Caceres original https://blog.zabbix.com/when-generative-ai-meets-zabbix/30908/

Zabbix has been the backbone of my infrastructure for over ten years, a journey I’ve been on from version 3.2 to 7.4. It’s a robust and reliable tool. However, in the age of intelligent assistants, I posed a question to myself: Why can’t I interact with my monitoring system as naturally as I talk with Maria, my generative AI assistant?

What is MCP?

MCP (Model Context Protocol) is a universal protocol that helps generative AI systems interact with global data securely, reliably, and at scale.
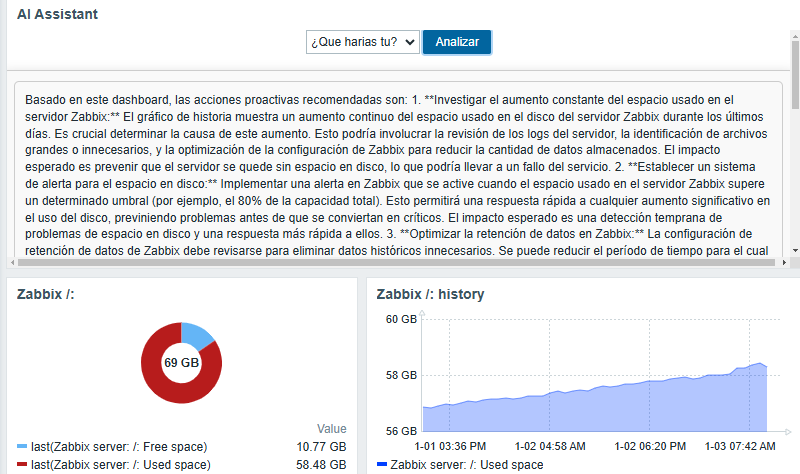
Imagine this: It’s 3 AM, and you receive a critical alert on your phone. Instead of opening multiple dashboards and manually correlating data, you simply type: “What’s happening with the production server?”

You get a response like this:

“The web-prod-01 server is experiencing high memory usage (94%). This started 15 minutes ago, coinciding with a traffic spike. I recommend checking the database connection pool and considering a restart of the Apache service. Would you like me to show you the related logs?”

This is no longer science fiction!

Design principle

The main objective is to enhance Zabbix without altering its core. The solution is based on an architecture that adheres to the following principles:

  • Zabbix intact: The original installation remains unchanged.
  • API-first: All communication is done through Zabbix’s robust JSON-RPC API.
  • Intelligent bridge: An intermediary service is created to translate between human language and Zabbix metrics.
  • Scalability: The design is prepared to grow alongside the infrastructure.

Proposed architecture:

  • Zabbix server: Debian 12, Zabbix 7.4.0, PostgreSQL 15.13
  • AI server (MCP): Rocky Linux 9, Gemini AI, Express.js, Winston (Logging), Gemini CLI, Redis, Nginx, PM2

Webhooks

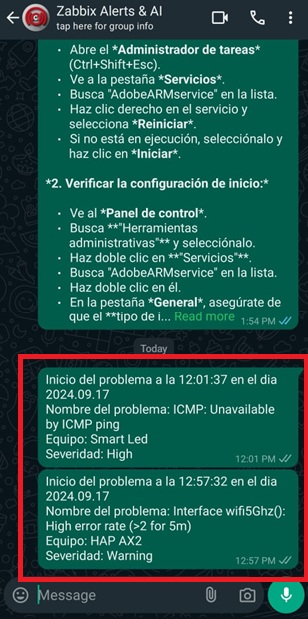
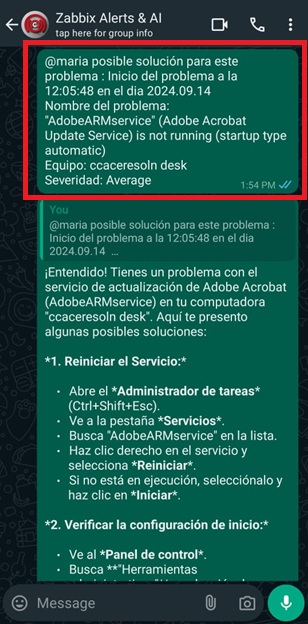
We process Zabbix alerts through a webhook that sends the data to our generative AI service.

#!/usr/bin/env python3
# -*- coding: utf-8 -*-
import json
import requests
import sys
from datetime import datetime

def send_to_mcp(args):
""" Sends alerts to MCP server"""
# SETTINGS - EDIT ACCORDING TO YOUR ENVIRONMENT
mcp_endpoint = "http://TU_IP_MCP_SERVER:3001/alerts" # Change to the MCP server IP
mcp_token = "TU_MCP_AUTH_TOKEN" # Exchange for your MCP authentication token
zabbix_server_ip = "TU_IP_ZABBIX_SERVER" # Change to the Zabbix server IP

headers = {
'Content-Type': 'application/json',
'Authorization': f'Bearer {mcp_token}'
}

# Extracting arguments from the Zabbix webhook
eventid = args[0] if len(args) > 0 else "unknown"
severity = args[1] if len(args) > 1 else "0"
message = args[2] if len(args) > 2 else "No message"
host = args[3] if len(args) > 3 else "unknown"
value = args[4] if len(args) > 4 else ""

payload = {
"timestamp": datetime.now().isoformat(),
"source": "zabbix",
"eventid": eventid,
"severity": severity,
"message": message,
"host": host,
"value": value,
"zabbix_server": zabbix_server_ip
}

try:
print(f"Sending alert to MCP: {mcp_endpoint}")
print(f"Payload: {json.dumps(payload, indent=2)}")

response = requests.post(mcp_endpoint, json=payload, headers=headers, timeout=15)
response.raise_for_status()

print(f"Alert sent successfully: HTTP {response.status_code}")
print(f"Response: {response.text}")
return True

except requests.exceptions.Timeout:
print("? Error: Timeout connecting to MCP server", file=sys.stderr)
return False
except requests.exceptions.ConnectionError:
print("? Error: Cannot connect to MCP server", file=sys.stderr)
return False
except requests.exceptions.HTTPError as e:
print(f"? HTTP Error: {e}", file=sys.stderr)
print(f"Response: {response.text}", file=sys.stderr)
return False
except Exception as e:
print(f"? Unexpected error: {e}", file=sys.stderr)
return False

if __name__ == "__main__":
# The arguments come from Zabbix
args = sys.argv[1:]
print(f"Script called with args: {args}")

success = send_to_mcp(args)
sys.exit(0 if success else 1)

Use cases

Scenario 1: Monday morning

Cesar: Good morning, how is the infrastructure looking?

Gemini CLI: Good morning! Everything is calm. 14 active hosts, 0 critical problems. There was a scheduled reboot on ‘proxmox-desarrollo’ over the weekend which completed successfully. The average CPU usage is at 23%. Do you need details on any specific system?

Scenario 2: Proactive planning

Cesar: What worrying trends are you seeing this week?

Gemini CLI: I’ve noticed three patterns that require attention:

1. storage-01: Growth of 2GB/day in /var/log.

    • Projection: 90% capacity in 12 days.
    • Recommendation: Configure a more aggressive log rotate.

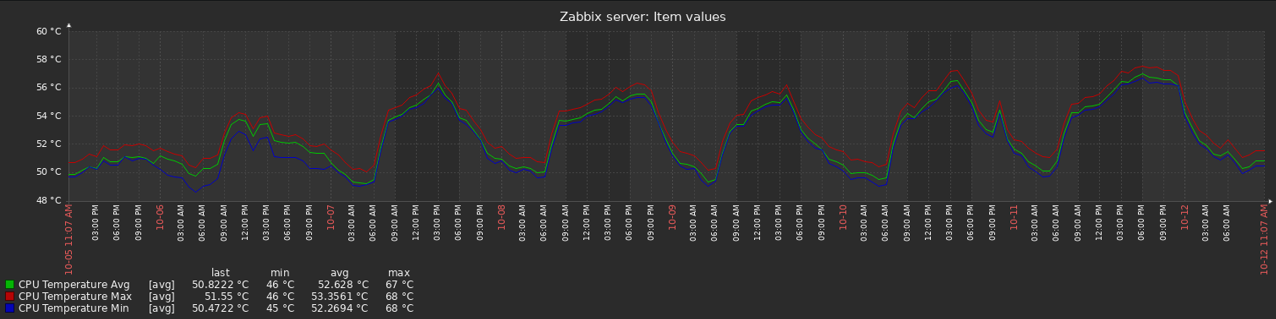
2. mikrotik: Gradually increasing temperature (+3°C over the last 7 days).

    • Recommendation: Check ventilation.

3. base-datos-01: Slow queries increasing by 15%.

    • Recommendation: Review indexes and optimize frequent queries.

MCP implementation

Server (Rocky Linux 9)
bash
#create the project
mkdir /opt/mcp-zabbix
cd /opt/mcp-zabbix

#Install dependencies
sudo dnf install -y nodejs npm redis nginx
sudo npm install -g pm2

#Set up the project
npm init -y
npm install express axios @google/generative-ai winston helmet cors dotenv

Configuration (.env)

bash
#Environment variables
ZABBIX_URL=http://tu-zabbix-server/zabbix/api_jsonrpc.php
ZABBIX_API_TOKEN=tu_token_de_zabbix_aqui
GEMINI_API_KEY=tu_api_key_de_gemini
MCP_AUTH_TOKEN=genera_un_token_seguro
PORT=3001
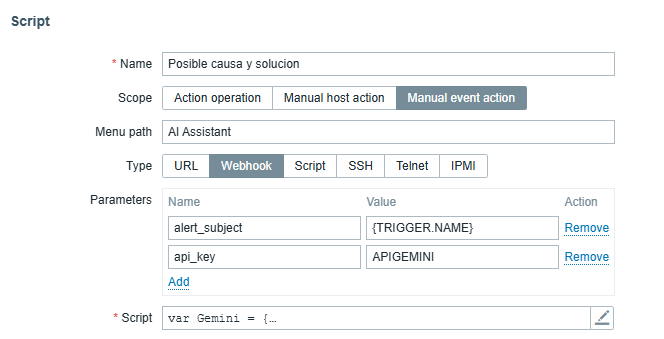
Webhook in Zabbix

1. Alerts → Media Types → Create
2. Script name: mcp_webhook.py
3. Parameters: {EVENT.ID} {EVENT.NSEVERITY} {ALERT.MESSAGE} {HOST.NAME} {ITEM.VALUE}

Test it

#Start the MCP server
pm2 start ecosystem.config.js

#Test curl 
curl -H "Authorization: Bearer TU_TOKEN" \
-H "Content-Type: application/json" \
-d '{"prompt":"¿How many host fo I have?"}' \
http://localhost:3001/ask-zabbix

The future

Dashboard conversations

Cesar: Show me a dashboard of the critical servers.

Gemini CLI: Creating custom dashboard with:

  • CPU/memory of your 3 production servers
  • Network latency of web services
  • Database disk space
  • Nightly backup status

Generated dashboard: http://zabbix.local/dashboard/generated-123

Errors to avoid

  • Don’t ignore security: Tokens, firewall, rate limiting from day 1
  • Don’t forget documentation: Code explains itself, workflows don’t

Resources to get started

  • Complete installation: Scripts for Rocky Linux and Debian
  • Zabbix configuration: Media types and actions
  • API reference: Endpoints and examples

Use cases

Basic monitoring: Hosts, items, triggers

  • Intelligent alerts: Automatic analysis
  • Ad-hoc queries: Quick investigation
  • Automated reports: Periodic summaries

Future integrations

The goal is to develop an application that allows natural interaction with an AI assistant called “Maria.” The idea is that based on what’s happening, Maria suggests actions and executes them proactively.

To achieve this, the assistant will integrate with Gemini’s command-line interface (CLI) and establish an additional secure communication channel. The recommended architecture will consist of several servers capable of understanding each other, including a Zabbix Server, the MCP (Model Context Protocol), and the personal assistant.You can follow the development of the base integration in this repository.

Conclusion

Zabbix will continue to be the reliable engine we all know. The difference is that it now becomes more intuitive and conversational. The goal is not to replace human experience, but to empower it. AI will allow us to create solutions that were previously unthinkable.

To fully leverage this potential, it is essential that we, as experts, continue to train and deepen our knowledge of the tool. This way, we will not only depend on what the AI suggests, but we will be able to validate and authorize its actions with our own judgment.

The post When Generative AI Meets Zabbix appeared first on Zabbix Blog.

Creating a Personal Assistant in Zabbix with Artificial Intelligence

Post Syndicated from Cesar Caceres original https://blog.zabbix.com/creating-a-personal-assistant-in-zabbix-with-artificial-intelligence/29596/

Zabbix is dedicated to monitoring IT infrastructures based on predetermined thresholds, such as servers, networks, and applications. Incorporating artificial intelligence (AI) into Zabbix as a complement allows a user to mitigate alerts based on these predetermined thresholds, offering possible causes and solutions to problems. This can help a user resolve incidents more efficiently.

In this article, we will explain how to integrate Zabbix and Google’s AI tool Gemini by using the API provided as well as a custom widget alternative.

First steps towards integration

You can find the repository in GitHub based on the Google Gemini model. You’ll need to create an account in Google AI Studio to obtain the required API.

Script configuration in Zabbix

From Zabbix version 7.0, access:

“Alerts” > “Scripts” > “Create Script.”

For this functionality, we designated the name as “Possible cause and solution.” Next, we can configure the parameters with the trigger event and the API generated in AI Studio. We then copy and get the script from the repository mentioned in the «Script» field, as in the following image:

Application in the problem panel

After configuration, we access the alerts panel and select a specific alert. We click on “AI Assistant” and access the functionality that was previously named as “Possible cause and solution.”

The following images present an example of an agent installed on a notebook.

Possible cause:

Possible solution:

The AI ​​will be able to provide a precise solution for each problem presented, allowing us to progressively optimize the predetermined thresholds. 

Using the custom widget “What are you working on?”

Creating accurate personalized dashboards for the user is essential. With this in mind, we propose the creation of an AI-based widget called “What are you working on?” (¿Qué harías tu? in Spanish), which analyzes the current state of the problem presented in Zabbix.

This concept integrates all the functionalities present in the widget (including Summary, Perspectives, Diagnosis, Comparison, and Forecast), since the used prompt can indicate whether it is necessary to make adjustments to the strategic plan or predict future trends based on the panel data built.

To exemplify how the “What are you working?” widget works, let’s consider the analysis of disk usage on our Zabbix Server.

The creation of personalized widgets from the official Zabbix page.

Once we have knowledge for the project, on the backend of our Zabbix Server we locate the route:

/usr/share/zabbix/widgets/

Then, we create a carpet called “insights” and copy the following repository. It is necessary to place the Gemini API in the file «assets/js/class.widget.php.js» in the field “YOUR_API_KEY.”

On the frontend, we go to “Administration” > “General” > “Modules.”

In the upper right corner,  we click on “Scan Directory.” We have our widget to use:

After performing the scan, it is necessary to enable the widget, as it is disabled by default.

The importance of using AI in Zabbix

Let’s imagine a scenario with 100 monitored servers. Performance thresholds, Windows services, or other specific services can generate up to 50 weekly alerts. With the help of AI, it’s possible to reduce this number to a bare minimum, thanks to the weekly collection of possible causes and solutions.

This ground-level approach allows users to solve problems faster, but also improves overall health by minimizing necessary adjustments to the Zabbix server.

Implementing AI locally

Using a dedicated server with open source AI models like HuggingFace, it’s possible to implement the AI ​​locally and create a database collecting the possible causes and solutions of the events.

The AI ​​will learn from repetitive events, offering more accurate answers in the future. The analysis of possible trends can be based on the generated alerts. In this way, we can optimize our alerts and put artificial intelligence to work understanding and solving our problems.

Conclusion

The model we use is project-oriented. We are constantly evolving artificial intelligence, and we must use the model we know best. language is distinct due to the orientation of the prompts used for the answers and the learning we can provide, either by making requests to specific artificial intelligence platforms or by using it locally.

The post Creating a Personal Assistant in Zabbix with Artificial Intelligence appeared first on Zabbix Blog.

Monitoring My Home Network with Zabbix

Post Syndicated from Cesar Caceres original https://blog.zabbix.com/monitoring-my-home-network-with-zabbix/28921/

Recently, we reached out to the members of our global community with an invitation to share their dashboards and give us a quick tour of what they do with our product. The response was so incredible that we have decided to highlight a few of the most interesting submissions here on our blog.

First up is Cesar Caceres, an independent IT consultant with nearly 10 years of experience in critical system monitoring within the banking sector. Cesar enjoys being alerted to changes within his home network so much that he composed a custom song to let him know when a new alert arrives!

My environment

My environment includes ping monitoring for multiple devices (Google Nest, Smart LEDs, Smart Lights, and TV). I also track home network devices: one personal MikroTik router and two belonging to my colleague Alejandro Velasquez, along with the temperature of these devices. Additionally, I monitor WAN consumption from my internet provider, as well as the bandwidth consumption of a connected client, my colleague, and the VPN.

I have a MikroTik and TP-Link router. When I connect the TP-Link to a port on the MikroTik, I can capture information about any devices connected to my home network. Using SNMP v2, I can then retrieve detailed information from these devices. From the WinBox console of the MikroTik router, I can navigate to IP > DHCP Server to locate the active hostnames to monitor.

In WinBox, I navigate to IP > SNMP Settings. Here, assign a community name for identification, select SNMP version 2, and enter the IP address of the MikroTik device.

Once configured, I verify from the Zabbix server that communication has been successfully established through the SNMP v2 protocol.

On the Zabbix server, I verify the host name of the device to make sure it’s visible. Since version 6.0, Zabbix includes a template specifically for the RB4011GS device, which simplifies the monitoring process.

Temperature monitoring for my location (Maracaibo, Venezuela) is integrated with OpenWeatherMap. I also monitor my phone using an agent from the Android Play Store. The template for this is available on this GitHub repository, but customization will always depend on individual needs.

The temperature of my Zabbix Server is monitored using a repository available on GitHub. It’s important to know the operating temperature of the Zabbix server.

If possible, I adjust the default parameters to suit the specific environment.

I also monitor the performance of our Zabbix server and database using the MySQL integration with the Zabbix agent, focusing on key elements like buffer usage.

I track the behavior of my portfolio (ccaceresoln.com) with web scenarios , including certificate monitoring. When querying SSL for my portfolio, I make a folder in the Zabbix server and create a script called checkssl.sh inside it. Then, I grant execution permissions chmod +x to the checkssl.sh script.

In the configuration of these items, the call will be made to the URL. Each hosting provider may automatically generate a new SSL certificate periodically. In my case, I don’t use a trigger for certificate renewal.

On the right side, there is a new widget for navigating based on alerts, which allows me to view more details about these issues.

Alerts

Alerts are delivered through WhatsApp, using a repository available on GitHub. This repository is based on the WhatsApp Web + Multi-Device API library. It’s important to ensure that the Mudslide libraries are up-to-date. Step-by-step instructions can be found in the Zabbix forums.

The assistant is based on a custom GitHub repository, customizing the language model using the Gemini 1.5 API. I chose this because it’s free to use and doesn’t require installation on the server. With the emergence of artificial intelligence, I’m hopeful that this could act as a proof of concept and an idea to help people understand how to resolve such alerts and learn from them. It’s more than just having everything in one place! Why MARIA? MARIA stands for:
M: Machine
A: Assistant
R: Reasoning
I: Intelligence
A: Artificial

Additional features

I had the idea to create a Zabbix song in order to have a sound that greets me every morning. Just a reminder that it’s a new day and Zabbix is here for alerts.
Song with sunoai:

Conclusion

Having a home network monitoring environment offers advantages such as receiving alerts about device status or specific equipment behavior even when you’re away from home. This allows for continuous supervision and proactive issue resolution.

The post Monitoring My Home Network with Zabbix appeared first on Zabbix Blog.