All posts by Emily Music

Network performance update: Developer Week 2025

Post Syndicated from Emily Music original https://blog.cloudflare.com/network-performance-update-developer-week-2025/

As the Internet has become enmeshed in our everyday lives, so has our need for speed. No one wants to wait when adding shoes to our shopping carts, or accessing corporate assets from across the globe. And as the Internet supports more and more of our critical infrastructure, speed becomes more than just a measure of how quickly we can place a takeout order. It becomes the connective tissue between the systems that keep us safe, healthy, and organized. Governments, financial institutions, healthcare ecosystems, transit — they increasingly rely on the Internet. This is why at Cloudflare, building the fastest network is our north star. 

We’re happy to announce that we are the fastest network in 48% of the top 1000 networks by 95th percentile TCP connection time between November 2024, and March 2025, up from 44% in September 2024.

In this post, we’re going to share with you how our network performance has changed since our last post in September 2024, and talk about what makes us faster than other networks.  But first, let’s talk a little bit about how we get this data.

How does Cloudflare get this data?

It’s happened to all of us — you casually click on a site, and suddenly you’ve reached a Cloudflare-branded error page. While you are shaking your fist at the sky, something interesting is happening on the back end. Cloudflare is using Real User Monitoring (RUM) to collect the data used to compare our performance against other networks. The monitoring we do is slightly different than the RUM Cloudflare offers to customers. When the error page loads, a 100 KB file is fetched and loaded. This file is hosted on networks like Cloudflare, Akamai, Amazon CloudFront, Fastly, and Google Cloud CDN. Your browser processes the performance data, and sends it to Cloudflare, where we use it to get a clear view of how these different networks stack up in terms of speed. 

We’ve been collecting and refining this data since June 2021.  You can read more about how we collect that data here, and we regularly track our performance during Innovation Weeks to hold ourselves accountable to you that we are always in pursuit of being the fastest network in the world.

How are we doing?

In order to evaluate Cloudflare’s speed relative to others, we measure performance across the top 1000 “eyeball” networks using the list provided by the Asia Pacific Network Information Centre (APNIC). So-called “eyeball” networks are those with a large concentration of subscribers/end users.  This information is important, because it gives us signals for where we can expand our presence or peering, or optimize our traffic engineering. When benchmarking, we assess the 95th percentile TCP connection time. This is the time it takes a user to establish a TCP connection to the server they are trying to reach. This metric helps us illustrate how Cloudflare’s network makes your traffic faster by serving your customers as locally as possible. 

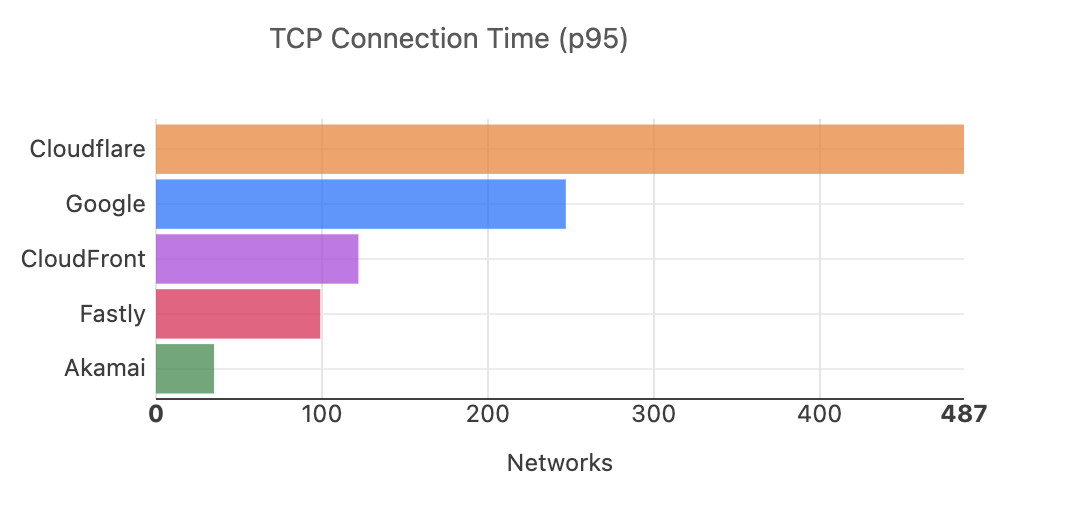
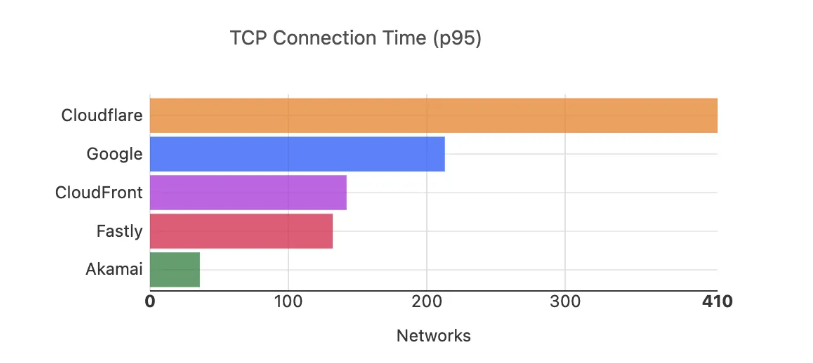
When we look at Cloudflare’s performance across the top 1000 networks, we can see that we’re fastest in 487, or over 48%, of these networks, between November 2024 and March 2025:


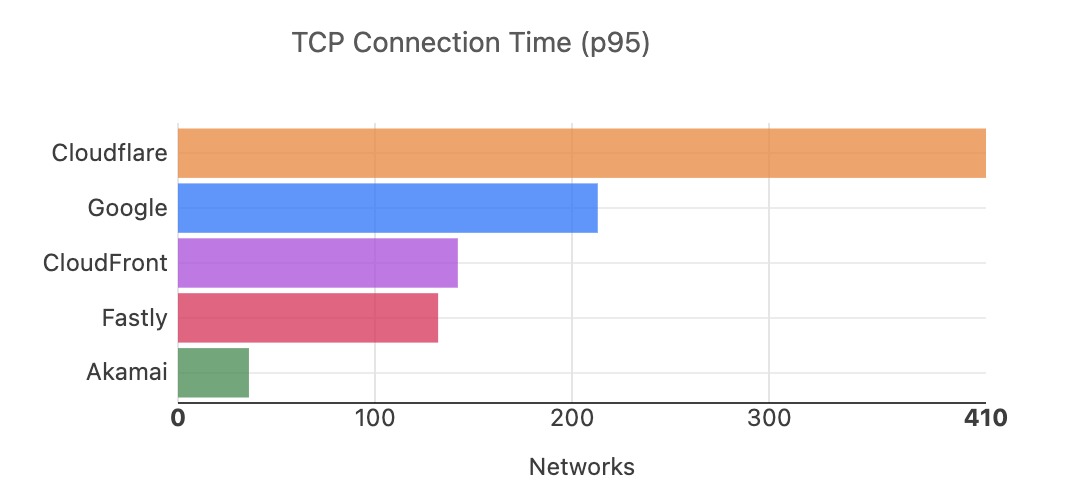
In September 2024, we ranked #1 in 44% of these networks:


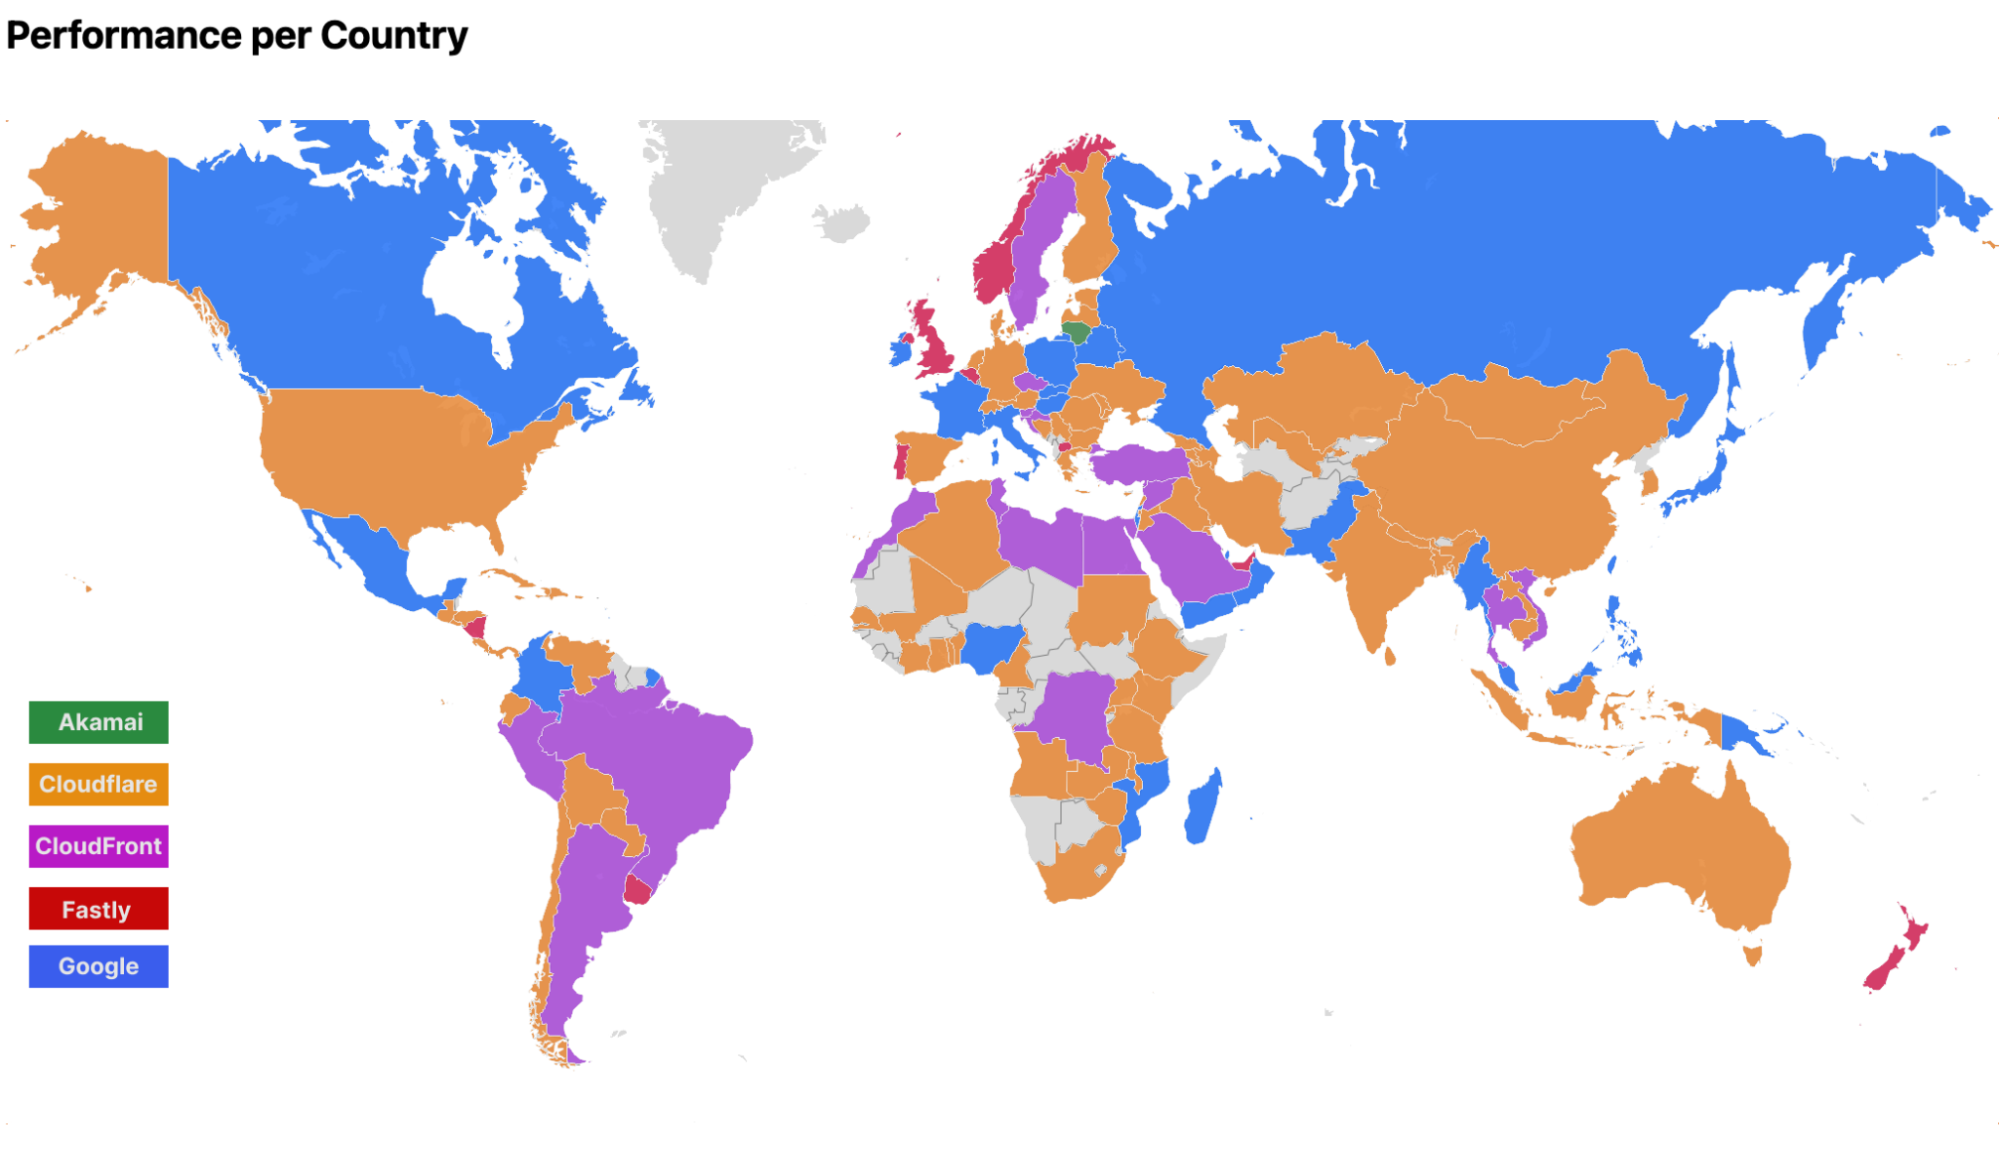
So why did we jump?  To get a better understanding of why, let’s take a look at the countries where we improved, which will give us a better sense of where to dive in.  This is what our network map looked like in September 2024 (grey countries mean we do not have enough data or users to derive insights):
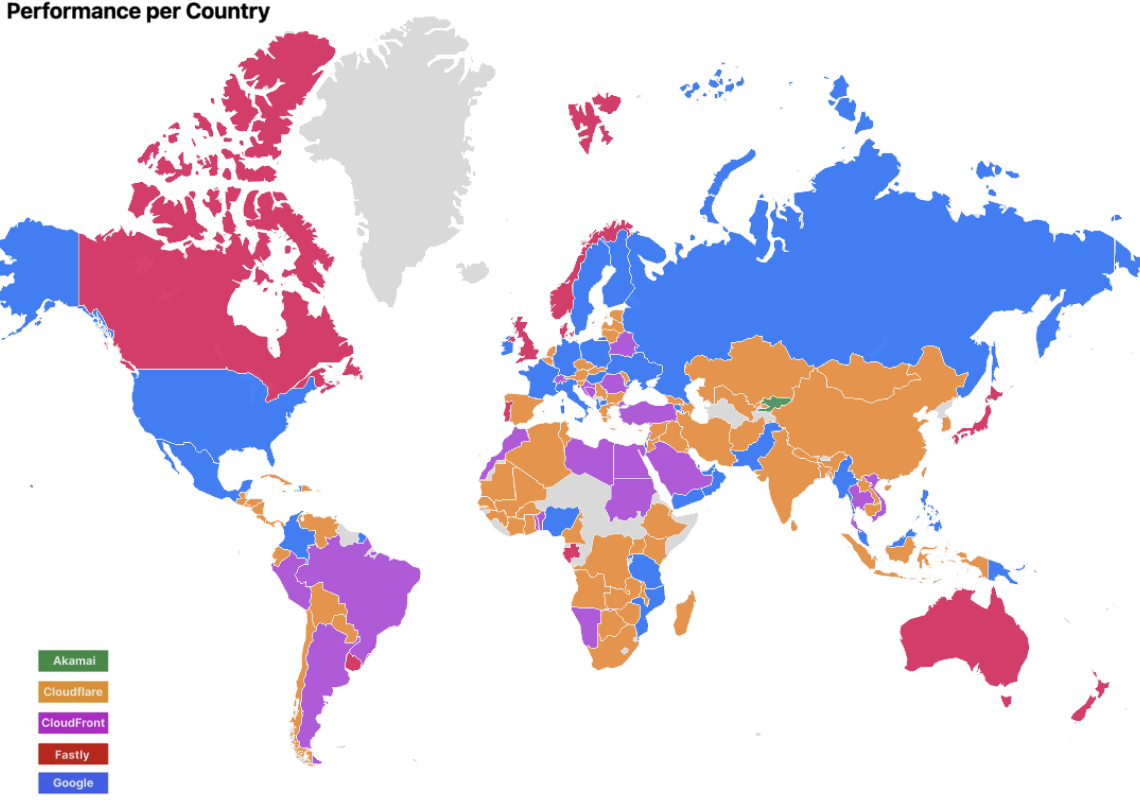

(September 2024)

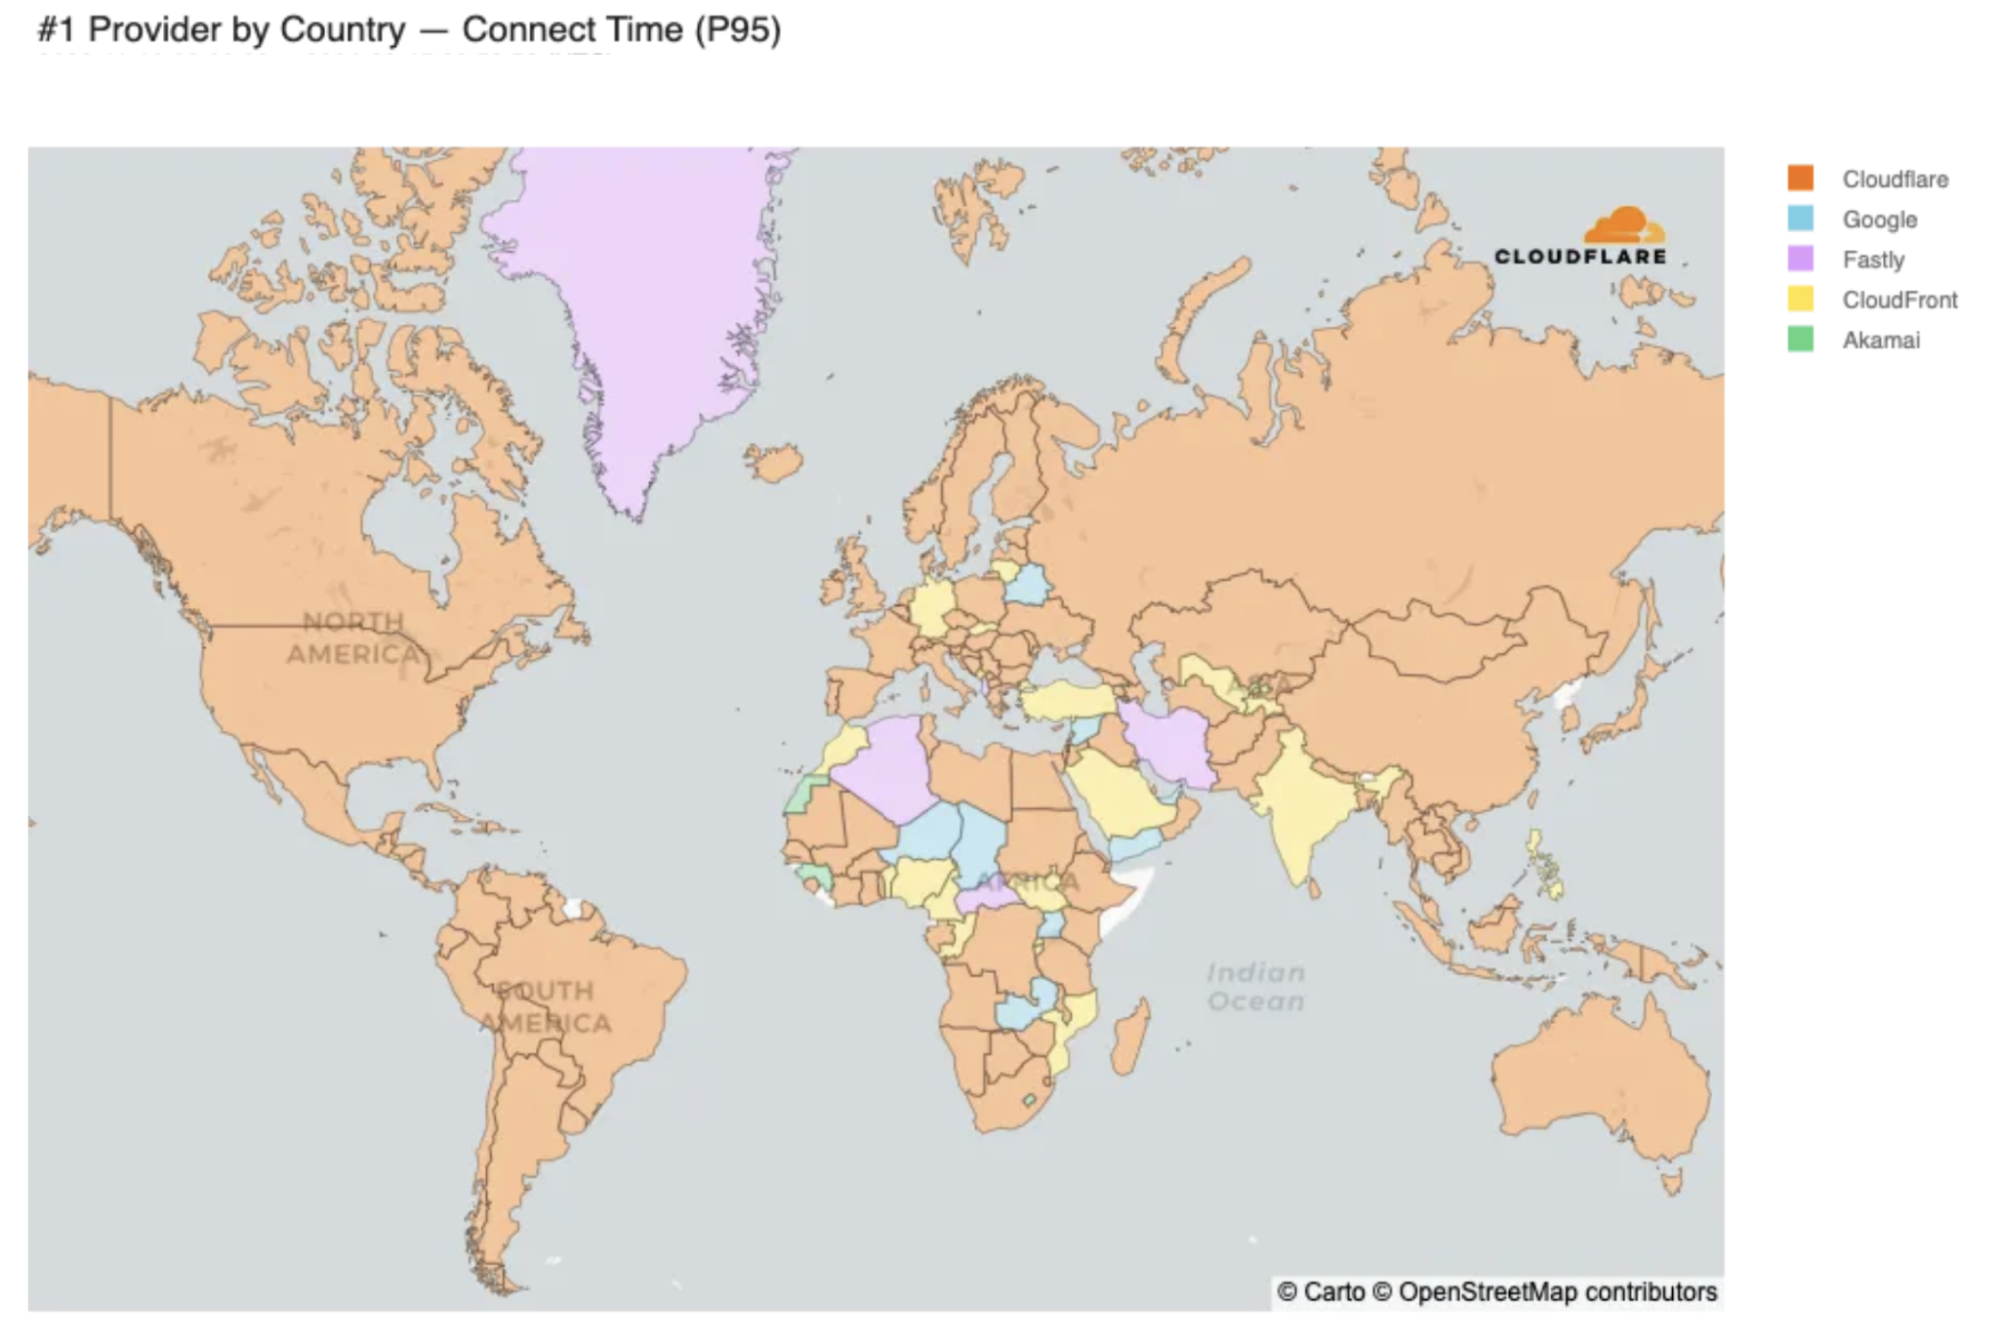
Today, using those same 95th percentile TCP connect times, we rank #1 in 48% of networks and the network map looks like this:
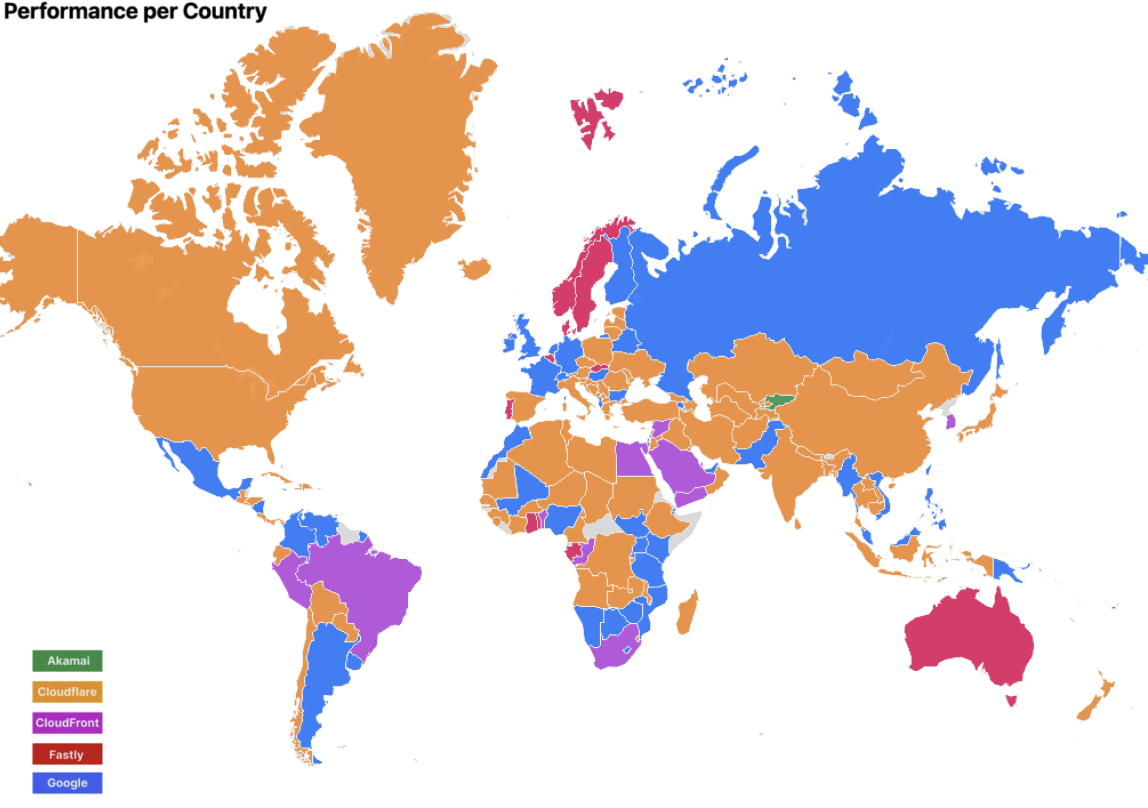

(March 2025)

We made most of our gains in Africa, where countries that previously didn’t have enough samples saw an increase in samples, and Cloudflare pulled ahead. This could mean that there was either an increase in Cloudflare users, or an increase in error pages shown. These countries got faster almost exclusively due to the presence of our Edge Partner deployments, which are Cloudflare locations embedded in last mile networks.  In next-generation markets like many African countries, these locations are crucial towards being faster as connectivity to end users tends to fall back to places like South Africa or London if in-country peering does not exist.

But let’s take a look at a couple of other places and see why we got faster.

In Canada, we were not the fastest in September 2024, but we are the fastest today. Today, we are the fastest in 40% of networks, which is the most out of all of our competitors:


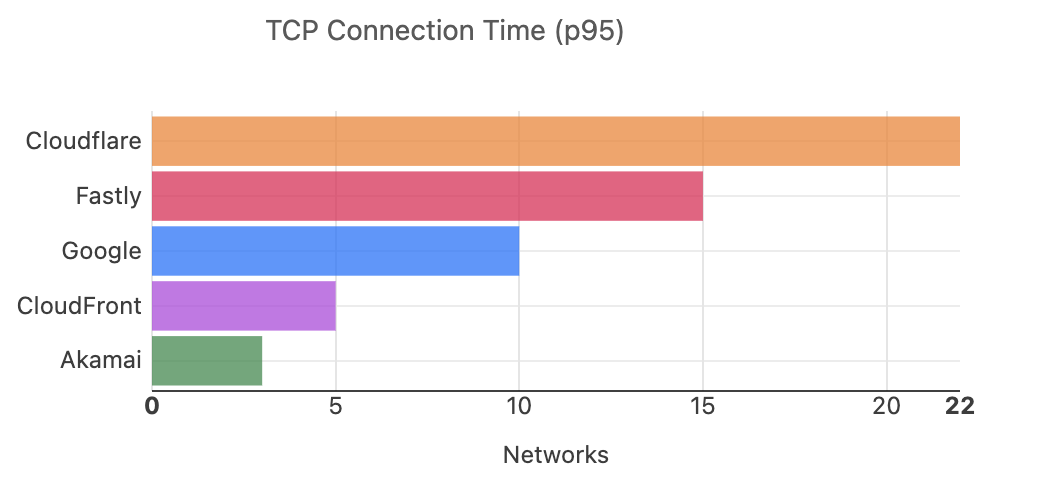
But when you look at the overall country numbers, we see that the race for the fastest network is quite close:

Canada 95th Percentile TCP Connect Time by Provider

Rank

Entity

Connect Time (P95)

#1 Diff

1

Cloudflare

179 ms

2

Fastly

180 ms

+0.48% (+0.87 ms)

3

Google

180 ms

+0.74% (+1.32 ms)

4

CloudFront

182 ms

+1.74% (+3.11 ms)

5

Akamai

215 ms 

+20% (+36 ms)

The difference between Cloudflare and the third-fastest network is a little over a millisecond!  As we’ve pointed out previously, such fluctuations are quite common, especially at higher percentiles.  But there is still a significant difference between us and the slowest network; we’re around 20% faster.

However, looking at a place like Japan where were not the fastest in September 2024 but are now the fastest, there is a significant difference between Cloudflare and the number two network:

Japan 95th Percentile TCP Connect Time by Provider

Rank

Entity

Connect Time (P95)

#1 Diff

1

Cloudflare

116 ms

2

Fastly

122 ms

+5.23% (+6.08 ms)

3

Google

124 ms

+6.21% (+7.22 ms)

4

CloudFront

127 ms

+8.91% (+10 ms)

5

Akamai

153 ms 

+32% (+37 ms)

Why is this? We are in more locations in Japan than our competitors and added more Edge Partner deployments in these locations, bringing us even closer to end-users. Edge Partner deployments are collaborations with ISPs, where we take space in their data centers, and peer with them directly. 

Why?

Why do we track our network performance like this? The answer is simple: to improve user experience. This data allows us to track a key performance metric for Cloudflare and the other networks. When we see that we’re lagging in a region, it serves as a signal to dig deeper into our network. 

This data is a gold mine for the teams tasked with improving Cloudflare’s network. When there are countries where Cloudflare is behind, it gives us signals for where we should expand or investigate. If we’re slow, we may need to invest in additional peering. If a region we have invested in heavily is slower, we may need to investigate our hardware.  The example from Japan shows exactly how this can benefit: we took a location where we were previously on par with our competitors, added peering in new locations, and we pulled ahead. 

On top of this map, we have autonomous system (ASN) level granularity on how we are performing on each one of the top 1000 eyeball networks, and we continuously optimize our traffic flow with each of them.  This allows us to track individual networks that may lag and improve the customer experience in those networks through turning up peering, or even adding new deployments in those regions. 

What’s next?

We’re sharing our updates on our journey to become #1 everywhere so that you can see what goes into running the fastest network in the world. From here, our plan is the same as always: identify where we’re slower, fix it, and then tell you how we’ve gotten faster.

Network performance update: Birthday Week 2024

Post Syndicated from Emily Music original https://blog.cloudflare.com/network-performance-update-birthday-week-2024

When it comes to the Internet, everyone wants to be the fastest. At Cloudflare, we’re no different. We want to be the fastest network in the world, and are constantly working towards that goal. Since June 2021, we’ve been measuring and ranking our network performance against the top global networks. We use this data to improve our performance, and to share the results of those initiatives. 

In this post, we’re going to share with you how our network performance has changed since our last post in March 2024, and discuss the tools and processes we are using to assess network performance. 

Digging into the data

Cloudflare has been measuring network performance across these top networks from the top 1,000 ISPs by estimated population (according to the Asia Pacific Network Information Centre (APNIC)), and optimizing our network for ISPs and countries where we see opportunities to improve. For performance benchmarking, we look at TCP connection time. This is the time it takes an end user to connect to the website or endpoint they are trying to reach. We chose this metric to show how our network helps make your websites faster by serving your traffic where your customers are. Back in June 2021, Cloudflare was ranked #1 in 33% of the networks.

As of September 2024, examining 95th percentile (p95) TCP connect times measured from September 4 to September 19, Cloudflare is the #1 provider in 44% of the top 1000 networks:


This graph shows that we are fastest in 410 networks, but that would only make us the fastest in 41% of the top 1,000. To make sure we’re looking at the networks that eyeballs connect from, we exclude networks like transit networks that aren’t last-mile ISPs. That brings the number of measured networks to 932, which makes us fastest in 44% of ISPs.

Now let’s take a look at the fastest provider by country. The map below shows the top network by 95th percentile TCP connection time, and Cloudflare is fastest in many countries. For those where we weren’t, we were within a few milliseconds of our closest competitor.


This color coding is generated by grouping all the measurements we generate by which country the measurement originates from, and then looking at the 95th percentile measurements for each provider to see who is the fastest. This is in contrast to how we measure who is fastest in individual networks, which involves grouping the measurements by ISP and measuring which provider is fastest. Cloudflare is still the fastest provider in 44% of the measured networks, which is consistent with our March report. Cloudflare is also the fastest in many countries, but the map is less orange than it was when we published our measurements from March 2024:


This can be explained by the fact that the fastest provider in a country is often determined by latency differences so small it is often less than 5% faster than the second-fastest provider. As an example, let’s take a look at India, a country where we are now the fastest:

India performance by provider

Rank

Entity

95th percentile TCP Connect (ms)

Difference from #1

1

Cloudflare

290 ms

2

Google

291 ms

+0.28% (+0.81 ms)

3

CloudFront

304 ms

+4.61% (+13 ms)

4

Fastly

325 ms

+12% (+35 ms)

5

Akamai

373 ms

+29% (+83 ms)

In India, we are the fastest network, but we are beating the runner-up by less than a millisecond, which shakes out to less than 1% difference between us and the number two! The competition for the number one spot in many countries is fierce and sometimes can be determined by what days you’re looking at the data, because variance in connectivity or last-mile outages can materially impact this data.

For example, on September 17, there was an outage on a major network in India, which impacted many users’ ability to access the Internet. People using this network were significantly impacted in their ability to connect to Cloudflare, and you can actually see that impact in the data. Here’s what the data looked like on the day of the outage, as we dropped from the number one spot that day:

India performance by provider

Rank

Entity

95th percentile TCP Connect (ms)

Difference from #1

1

Google

219 ms

2

CloudFront

230 ms

+5% (+11 ms)

3

Cloudflare

236 ms

+7.47% (+16 ms)

4

Fastly

261 ms

+19% (+41 ms)

5

Akamai

286 ms

+30% (+67 ms)

We were impacted more than other providers here because our automated traffic management systems detected the high packet loss as a result of the outage and aggressively moved all of our traffic away from the impacted provider. After review internally, we have identified opportunities to improve our traffic management to be more fine-grained in our approach to outages of this type, which would help us continue to be fast despite changes in the surrounding ecosystem. These unplanned occurrences can happen to any network, but these events also provide us opportunities to improve and mitigate the randomness we see on the Internet.

The phenomenon of providers having fluctuating latencies can also work against us. Consider Poland, a country where we were the fastest provider in March, but are no longer the fastest provider today. Digging into the data a bit more, we can see that even though we are no longer the fastest, we’re slower by less than a millisecond, giving us confidence that our architecture is optimized for performance in the region:

Poland performance by provider

Rank

Entity

95th percentile TCP Connect (ms)

Difference from #1

1

Google

246 ms

2

Cloudflare

246 ms

+0.15% (+0.36 ms)

3

CloudFront

250 ms

+1.7% (+4.17 ms)

4

Akamai

272 ms

+11% (+26 ms)

5

Fastly

295 ms

+20% (+50 ms)

These nuances in the data can make us look slower in more countries than we actually are. From a numbers’ perspective we’re neck-and-neck with our competitors and still fastest in the most networks around the world. Going forward, we’re going to take a longer look at how we’re visualizing our network performance to paint a clearer picture for you around performance. But let’s go into more about how we actually get the underlying data we use to measure ourselves.

How we measure performance

When you see a Cloudflare-branded error page, something interesting happens behind the scenes. Every time one of these error pages is displayed, Cloudflare gathers Real User Measurements (RUM) by fetching a tiny file from various networks, including Cloudflare, Akamai, Amazon CloudFront, Fastly, and Google Cloud CDN. Your browser sends back performance data from the end-user’s perspective, helping us get a clear view of how these different networks stack up in terms of speed. The main goal? Figure out where we’re fast, and more importantly, where we can make Cloudflare even faster. If you’re curious about the details, the original Speed Week blog post dives deeper into the methodology.

Using this RUM data, we track key performance metrics such as TCP Connection Time, Time to First Byte (TTFB), and Time to Last Byte (TTLB) for Cloudflare and the other networks. 

Starting from March, we fixed the list of networks we look at to be the top 1000 networks by estimated population as determined by APNIC, and we removed networks that weren’t last-mile ISPs. This change makes our measurements and reporting more consistent because we look at the same set of networks for every reporting cycle.

How does Cloudflare use this data?

Cloudflare uses this data to improve our network performance in lagging regions. For example, in 2022 we recognized that performance on a network in Finland was not as fast as some comparable regions. Users were taking 300+ ms to connect to Cloudflare at the 95th percentile:

Performance for Finland network

Rank

Entity

95th percentile TCP Connect (ms)

Difference from #1

1

Fastly

15 ms

2

CloudFront

19 ms

+19% (+3 ms)

3

Akamai

20 ms

+28% (+4.3 ms)

4

Google

72 ms

+363% (+56 ms)

5

Cloudflare

368 ms

+2378% (+353 ms)

After investigating, we recognized that one major network in Finland was seeing high latency due to issues resulting from congestion. Simply put, we were using all the capacity we had. We immediately planned an expansion, and within two weeks of that expansion completion, our latency decreased, and we became the fastest provider in the region, as you can see in the map above.

We are constantly improving our network and infrastructure to better serve our customers. Data like this helps us identify where we can be most impactful, and improve service for our customers. 

What’s next 

We’re sharing our updates on our journey to become as fast as we can be everywhere so that you can see what goes into running the fastest network in the world. From here, our plan is the same as always: identify where we’re slower, fix it, and then tell you how we’ve gotten faster.