Post Syndicated from Lai Yi Ohlsen original https://blog.cloudflare.com/network-performance-update-birthday-week-2025/
We are committed to being the fastest network in the world because improvements in our performance translate to improvements for the own end users of your application. We are excited to share that Cloudflare continues to be the fastest network for the most peered networks in the world.
We relentlessly measure our own performance and our performance against peers. We publish those results routinely, starting with our first update in June 2021 and most recently with our last post in September 2024.
Today’s update breaks down where we have improved since our update last year and what our priorities are going into the next year. While we are excited to be the fastest in the greatest number of last-mile ISPs, we are never done improving and have more work to do.
We measure network performance by attempting to capture what the experience is like for Internet users across the globe. To do that we need to simulate what their connection is like from their last-mile ISP to our networks.
We start by taking the 1,000 largest networks in the world based on estimated population. We use that to give ourselves a representation of real users in nearly every geography.
We then measure performance itself with TCP connection time. TCP connection time is the time it takes for an end user to connect to the website or endpoint they are trying to reach. We chose this metric because we believe this most closely approximates what users perceive to be Internet speed, as opposed to other metrics which are either too scientific (ignoring real world challenges like congestion or distance) or too broad.
We take the trimean measurement of TCP connection times to calculate our metric. The trimean is a weighted average of three statistical values: the first quartile, the median, and the third quartile. This approach allows us to reduce some of the noise and outliers and get a comprehensive picture of quality.
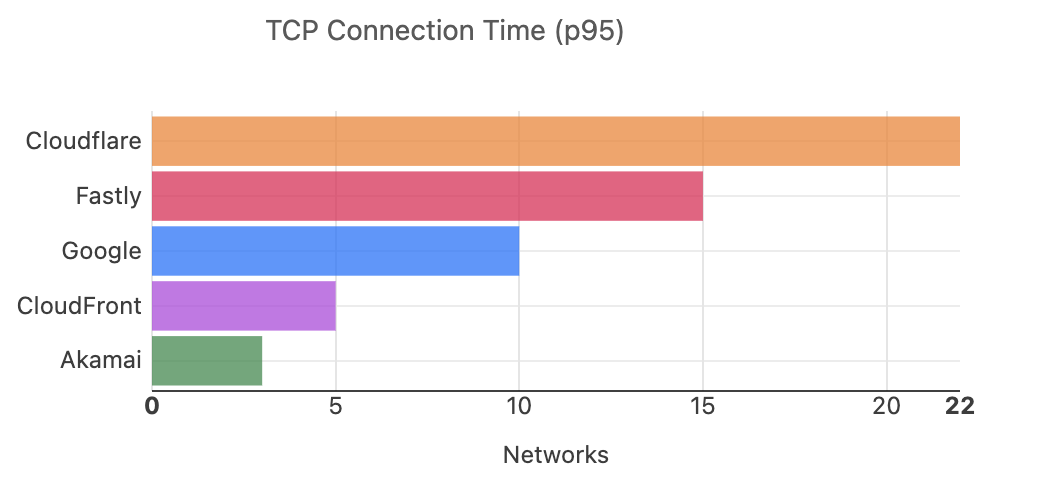
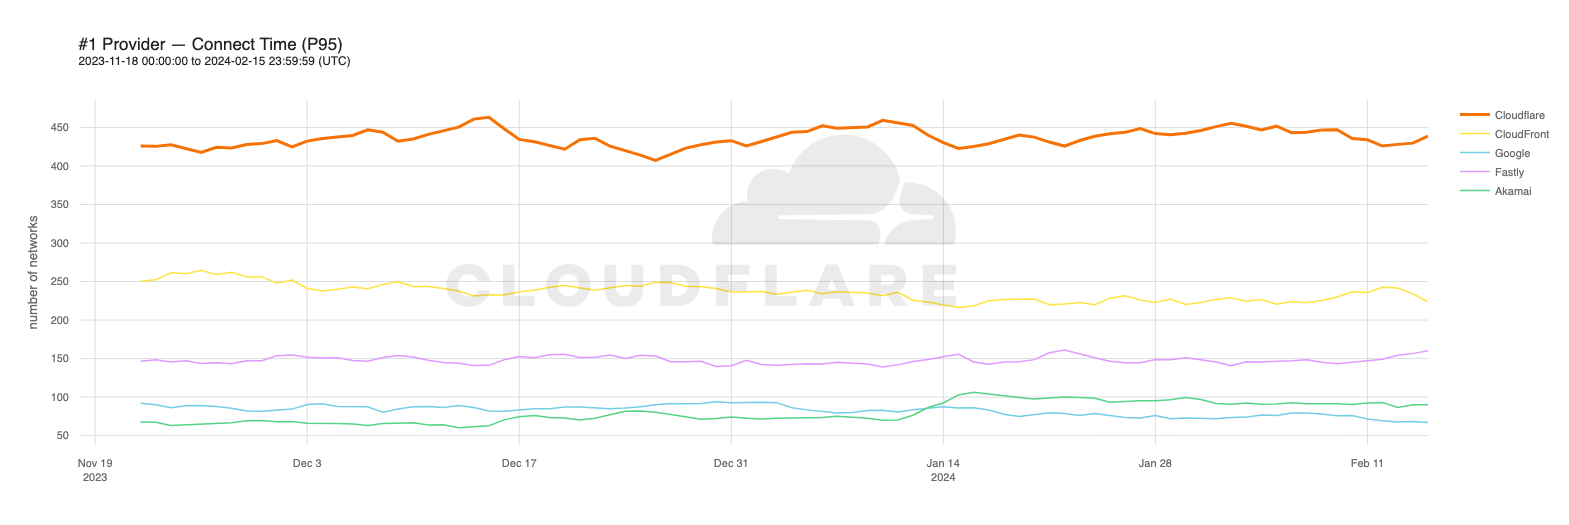
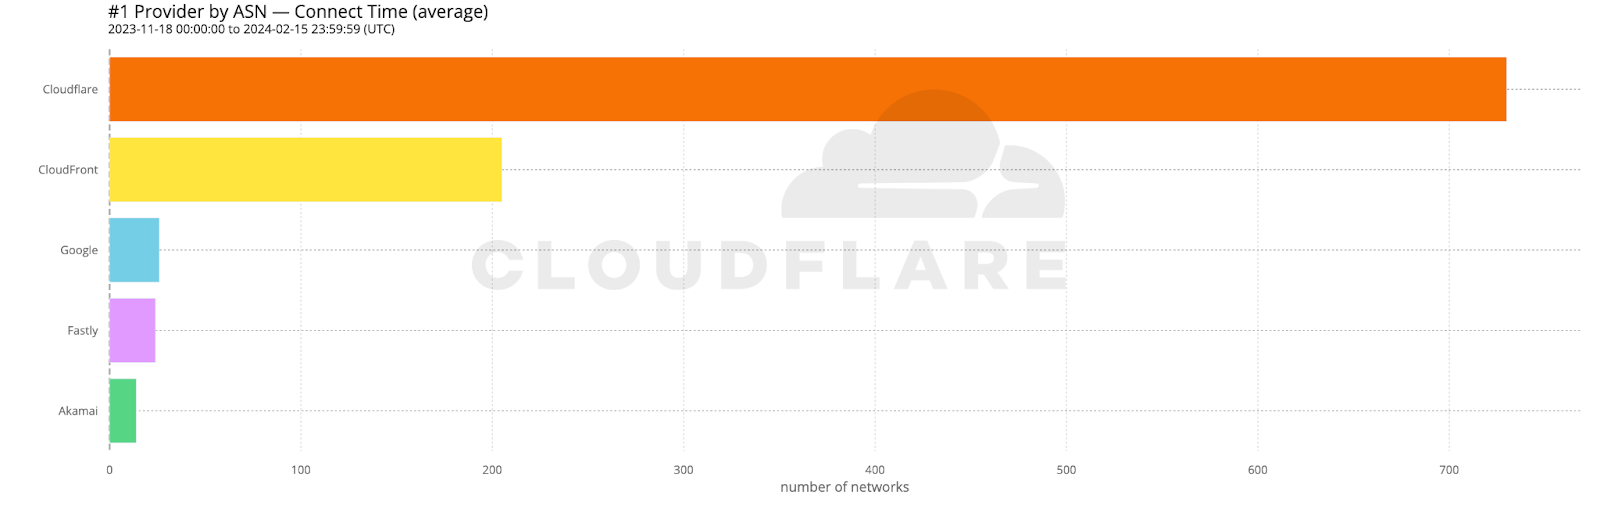
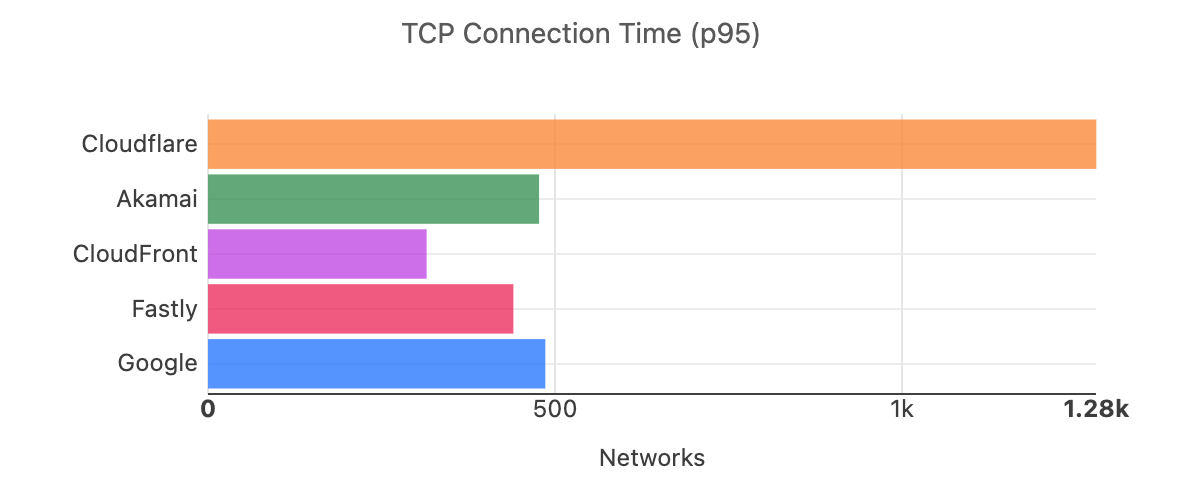
For this year’s update, we examined the trimean of TCP connection times measured from August 6 to September 4, Cloudflare is the #1 provider in 40% of the top 1000 networks. In our September 2024 update, we shared that we were the #1 provider in 44% of the top 1000 networks.

The TCP Connection Time (Trimean) graph shows that we are the fastest TCP connection time in 383 networks, but that would make us the fastest in 38% of the top 1,000. We exclude networks that aren’t last-mile ISPs, such as transit networks, since they don’t reflect the end user experience, which brings the number of measured networks to 964 and makes Cloudflare the fastest in 40% of measured ISPs and the fastest across the top networks.
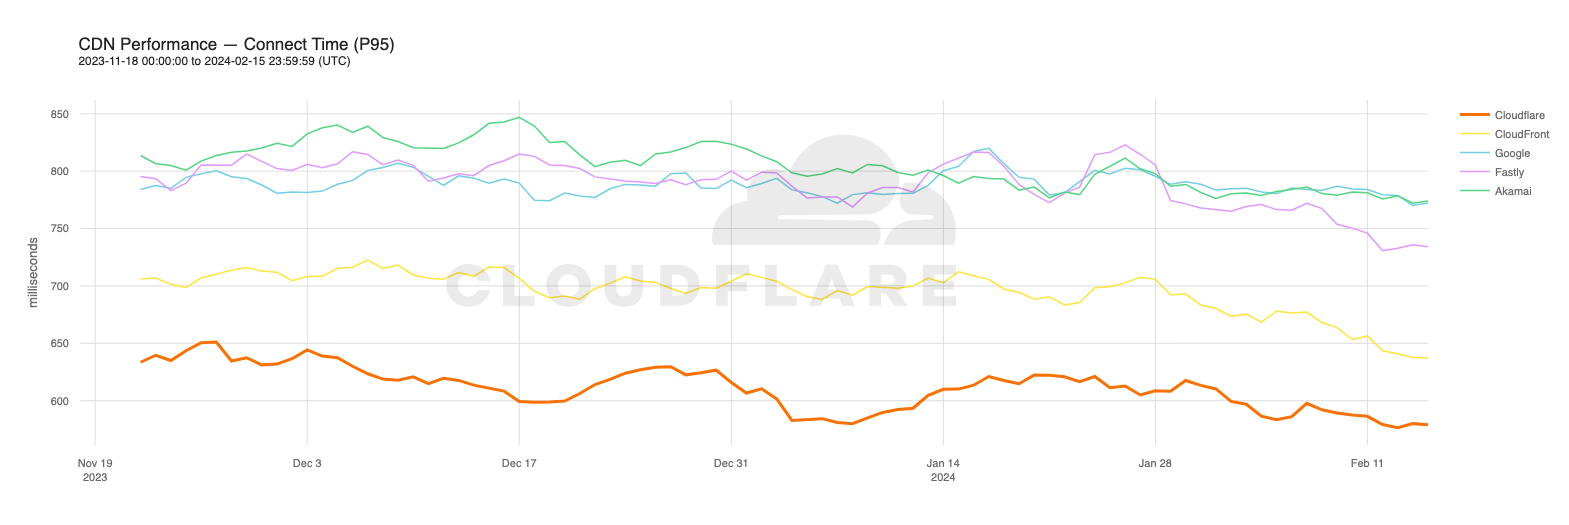
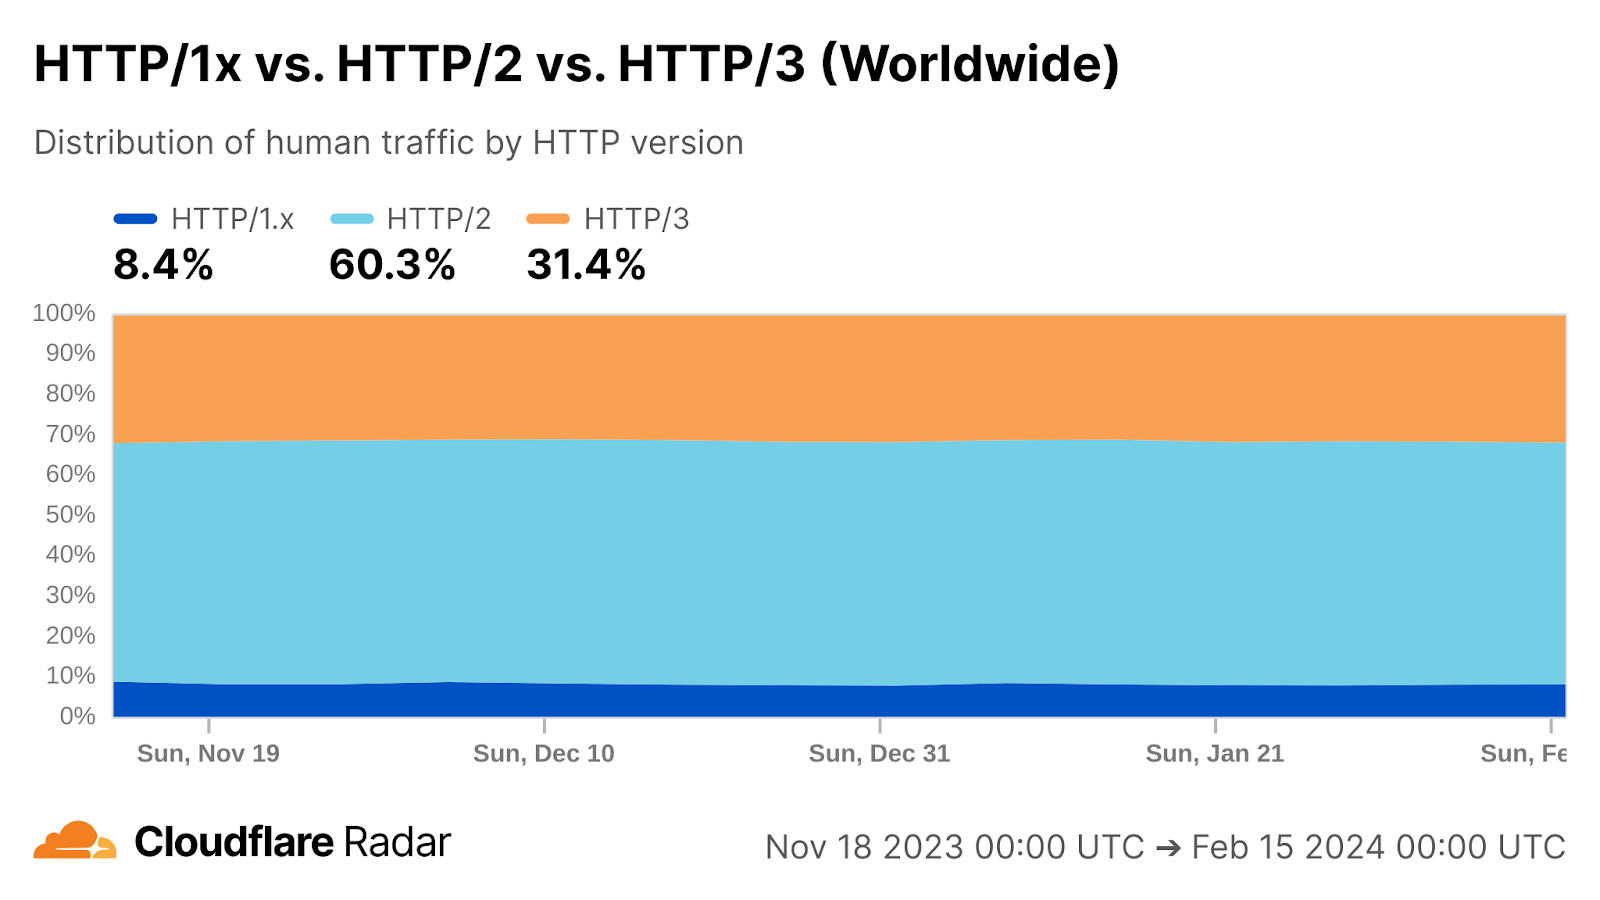
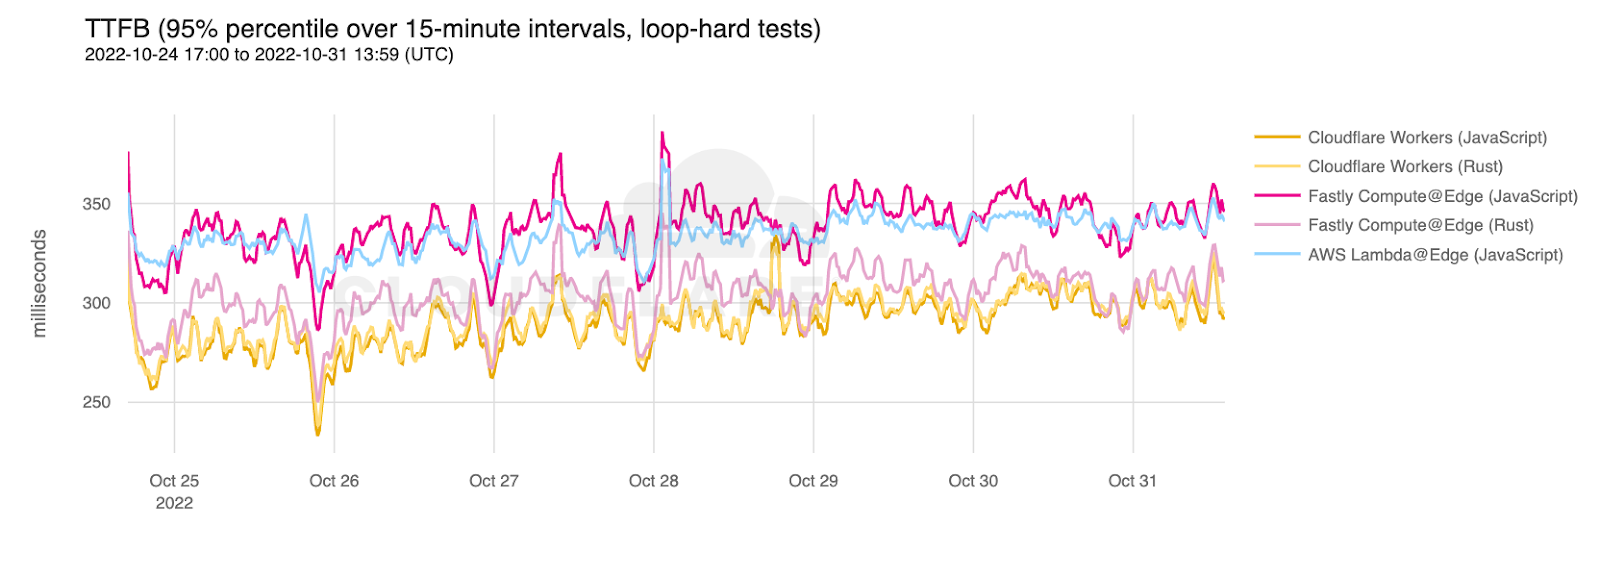
A Cloudflare-branded error page does more than just display an error; it kicks off a real-world speed test. Behind the scenes, on a selection of our error pages, we use Real User Measurements (RUM), which involves a browser retrieving a small file from multiple networks, including Cloudflare, Amazon CloudFront, Google, Fastly and Akamai.
Running these tests lets us gather performance data directly from the user’s perspective, providing a genuine comparison of different network speeds. We do this to understand where our network is fastest and, more importantly, where we can make further improvements. For a deeper dive into the technical details, the Speed Week blog post covers the full methodology.
By using RUM data, we track key metrics like TCP Connection Time, Time to First Byte (TTFB), and Time to Last Byte (TTLB). These are widely recognized, industry-standard metrics that allow us to objectively measure how quickly and efficiently a website loads for actual users. By monitoring these benchmarks, we can objectively compare our performance against other networks.
We specifically chose the top 1000 networks by estimated population from APNIC, excluding those that aren’t last-mile ISPs. Consistency is key: by analyzing the same group of networks in every cycle, we ensure our measurements and reporting remain reliable and directly comparable over time.
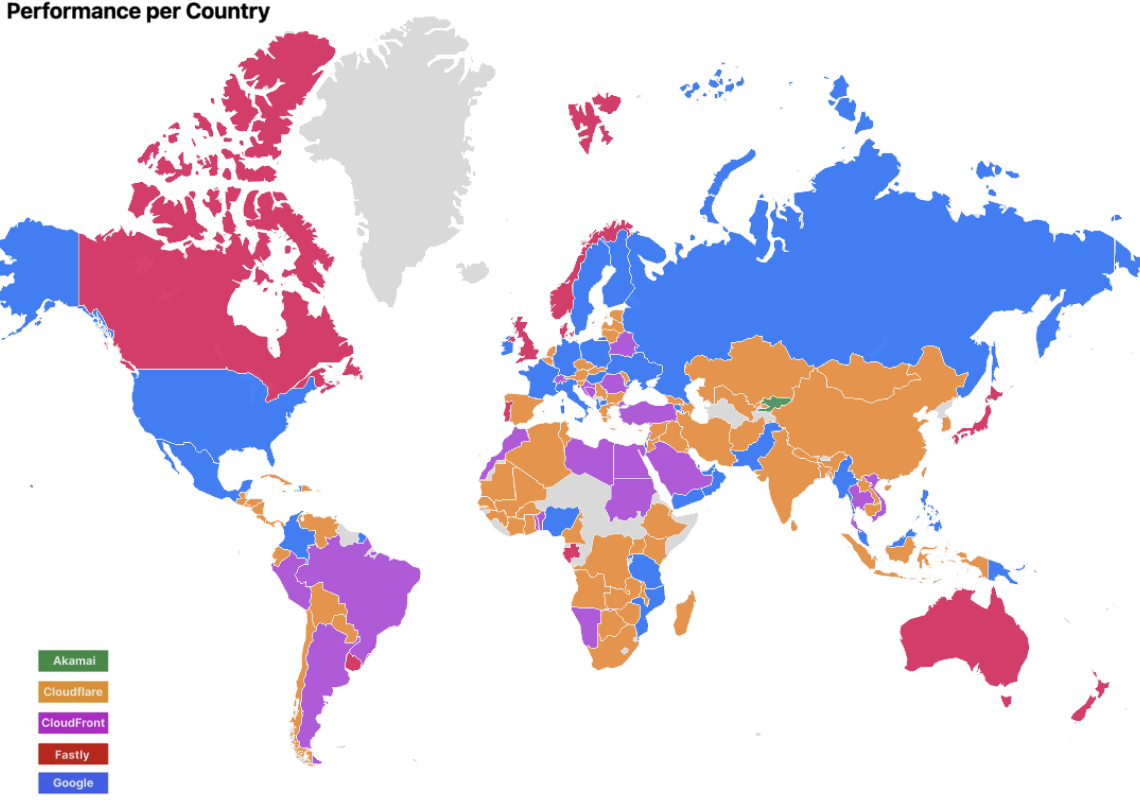
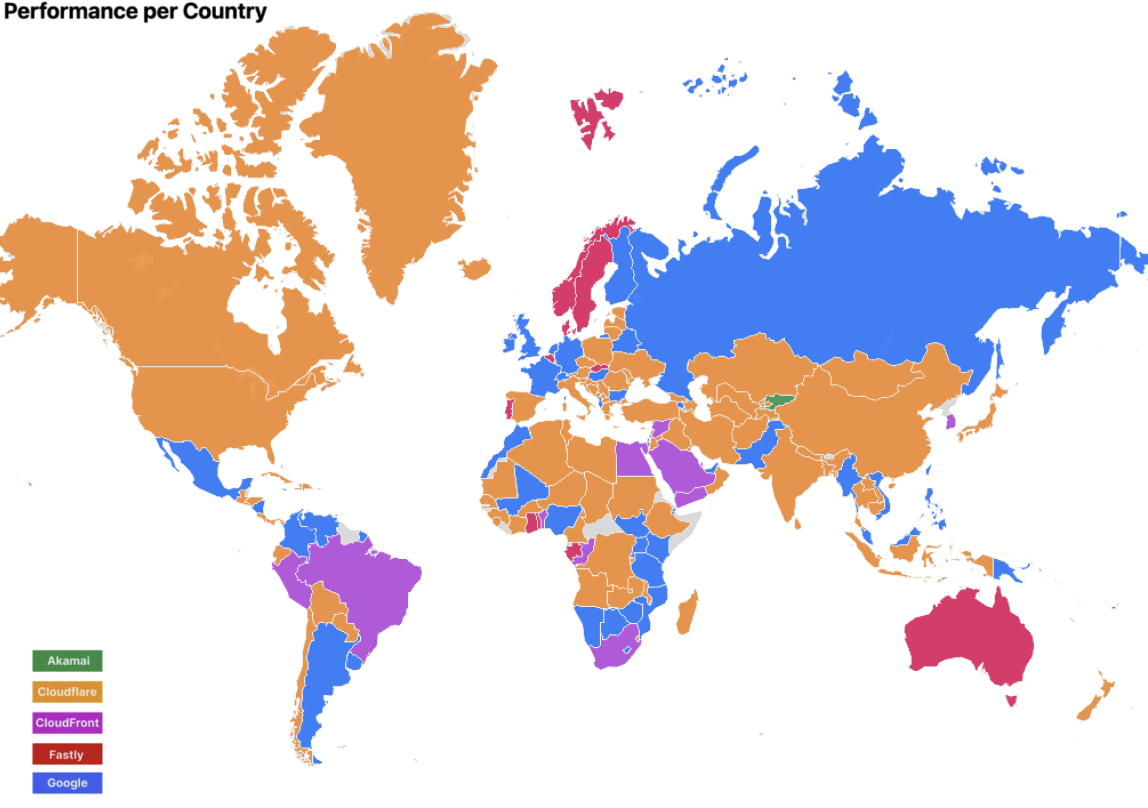
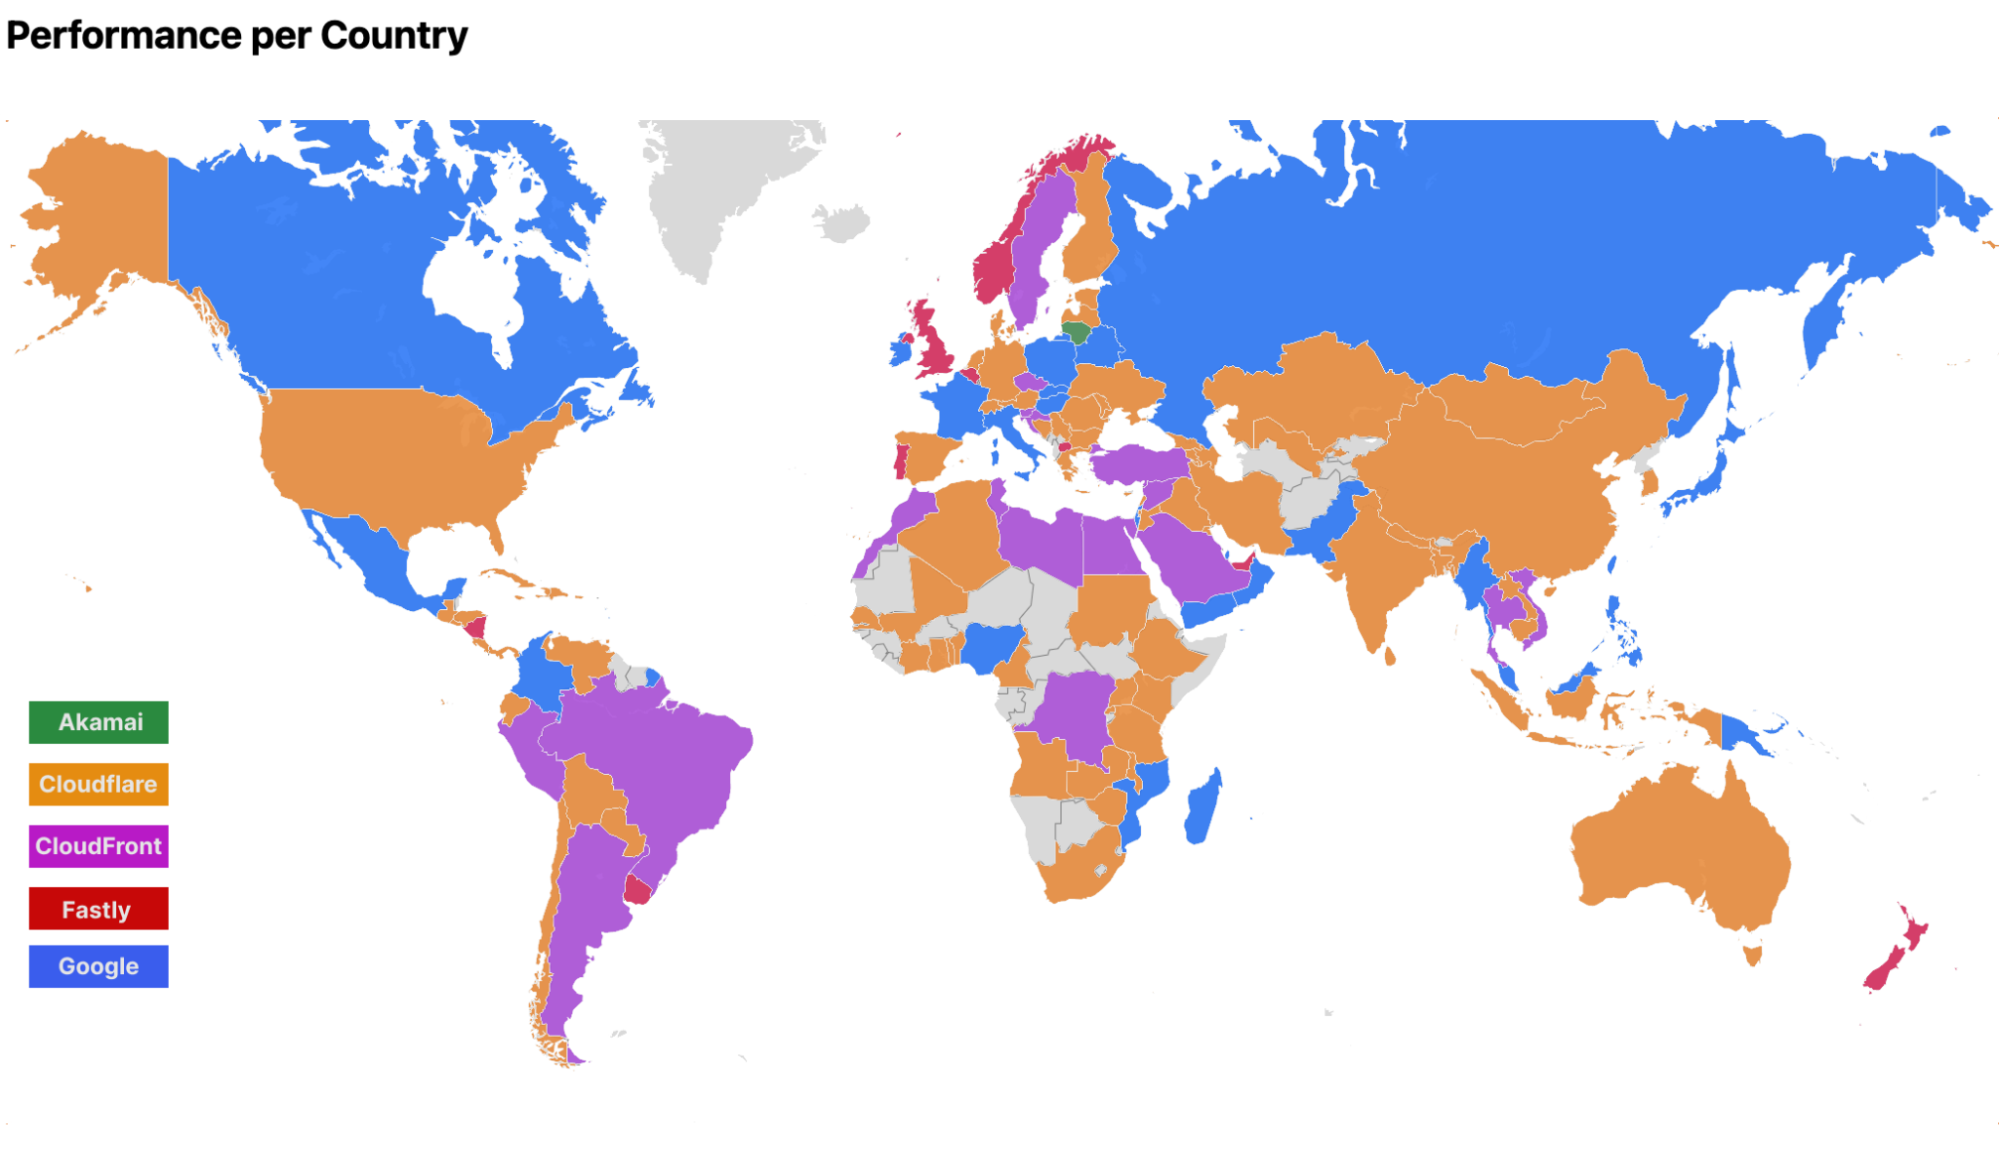
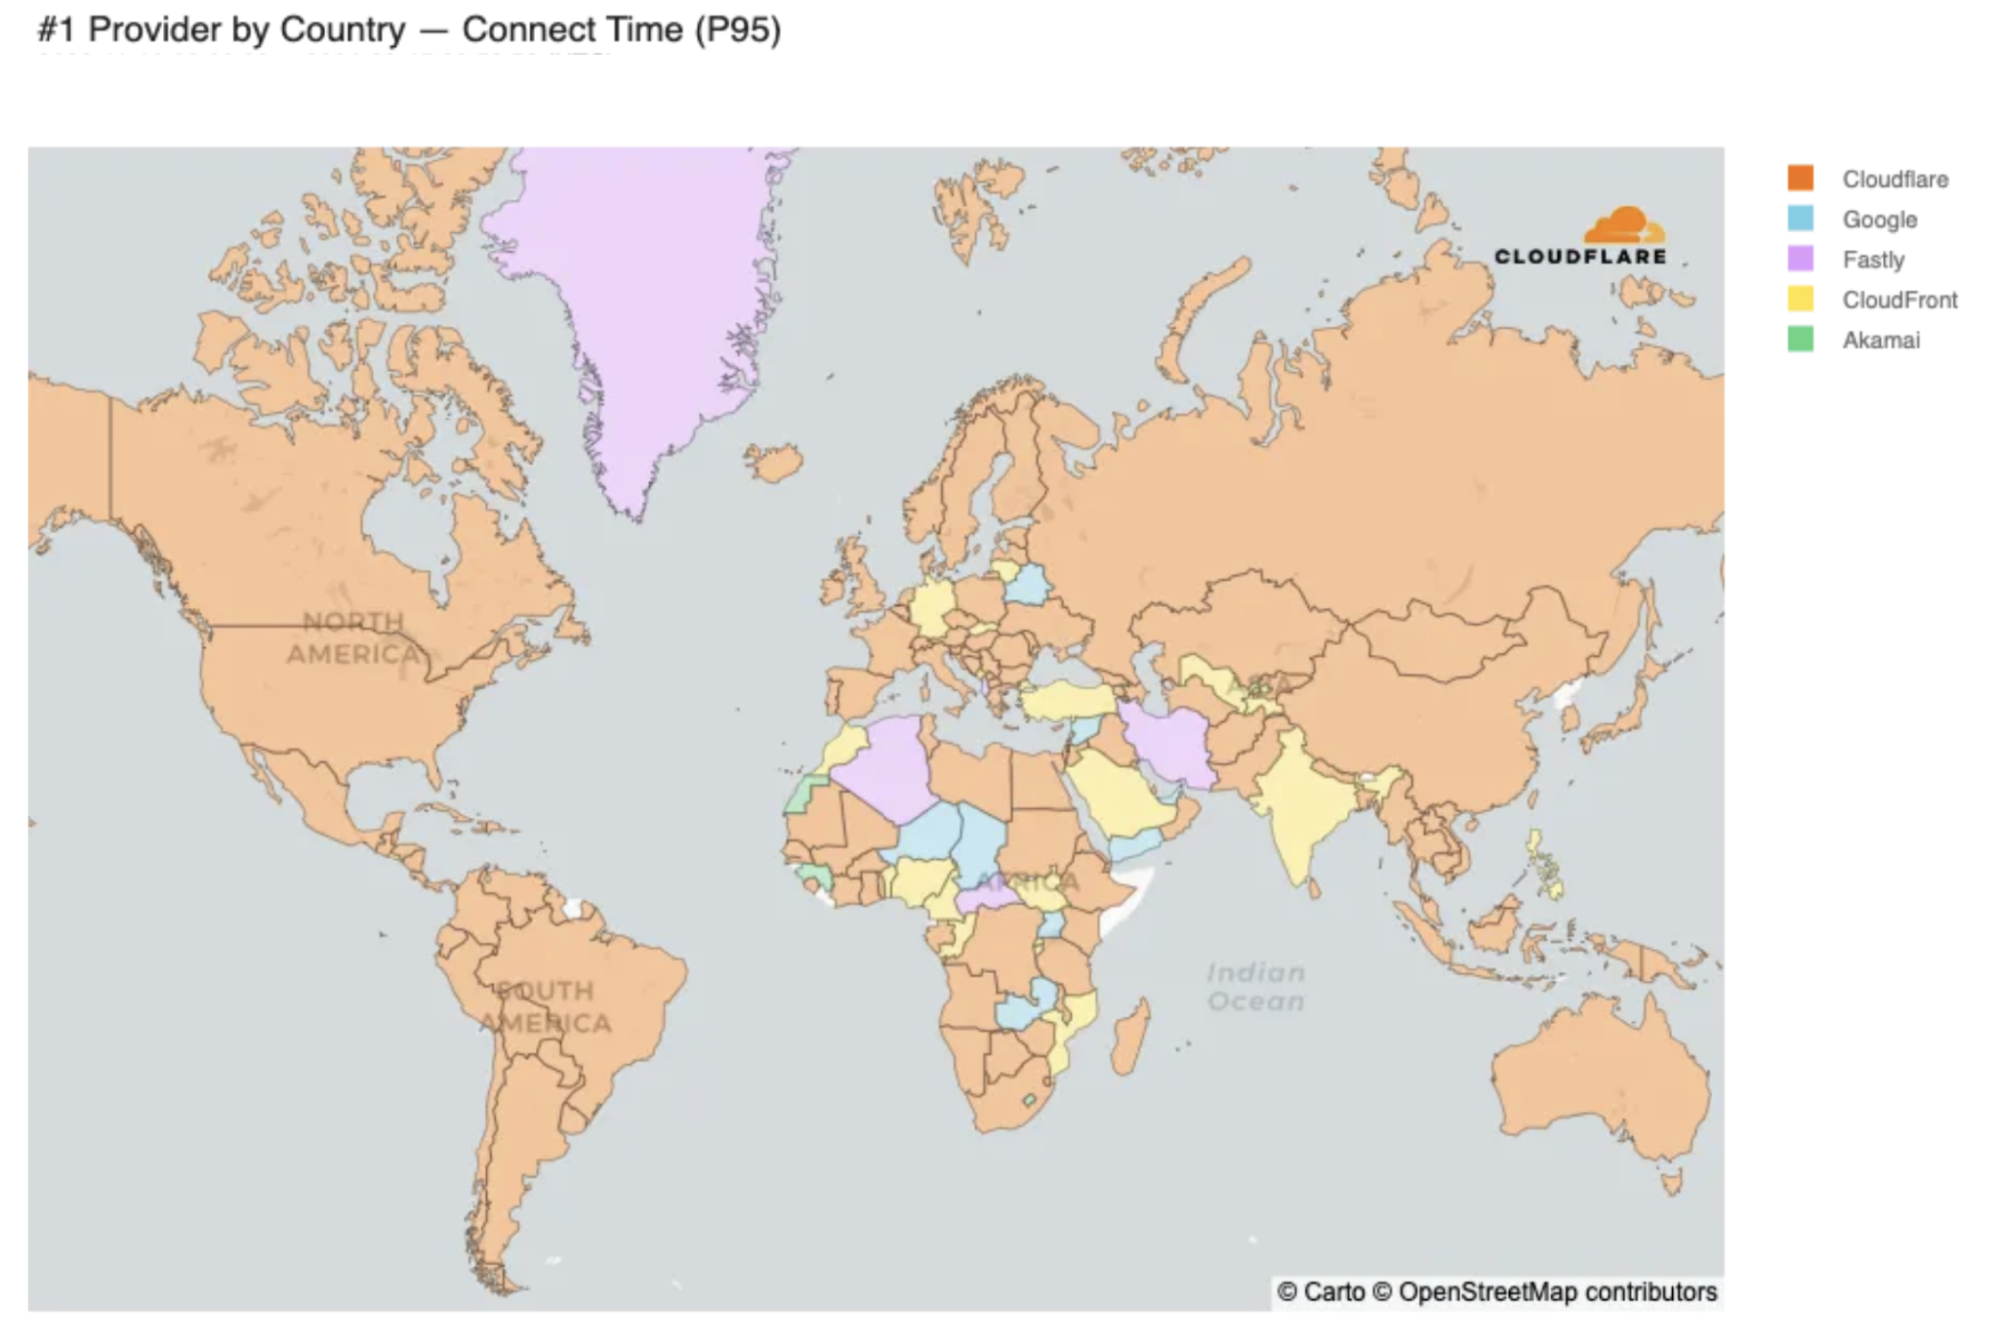
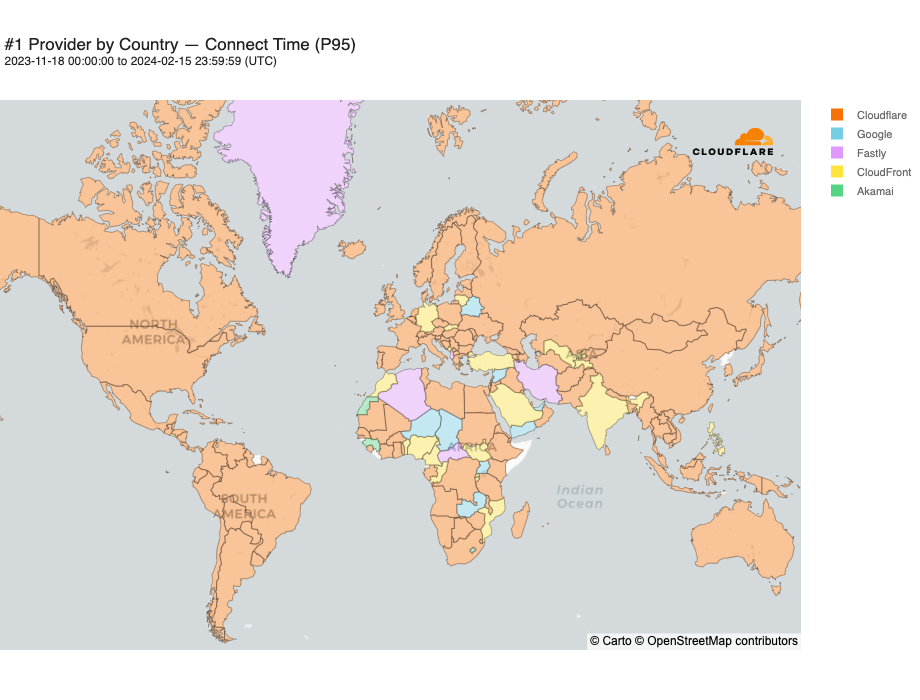
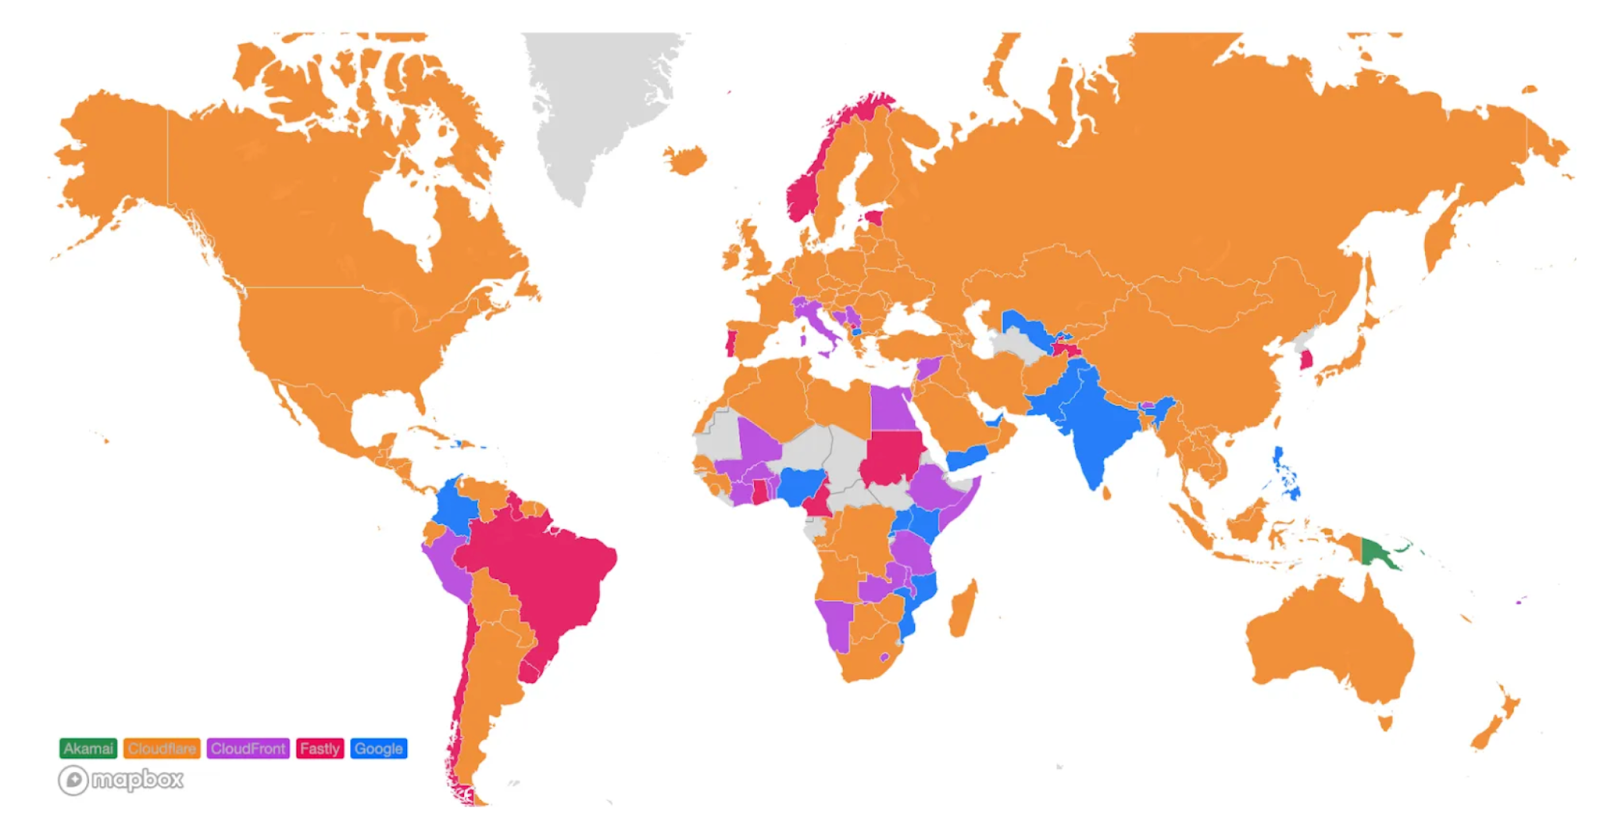
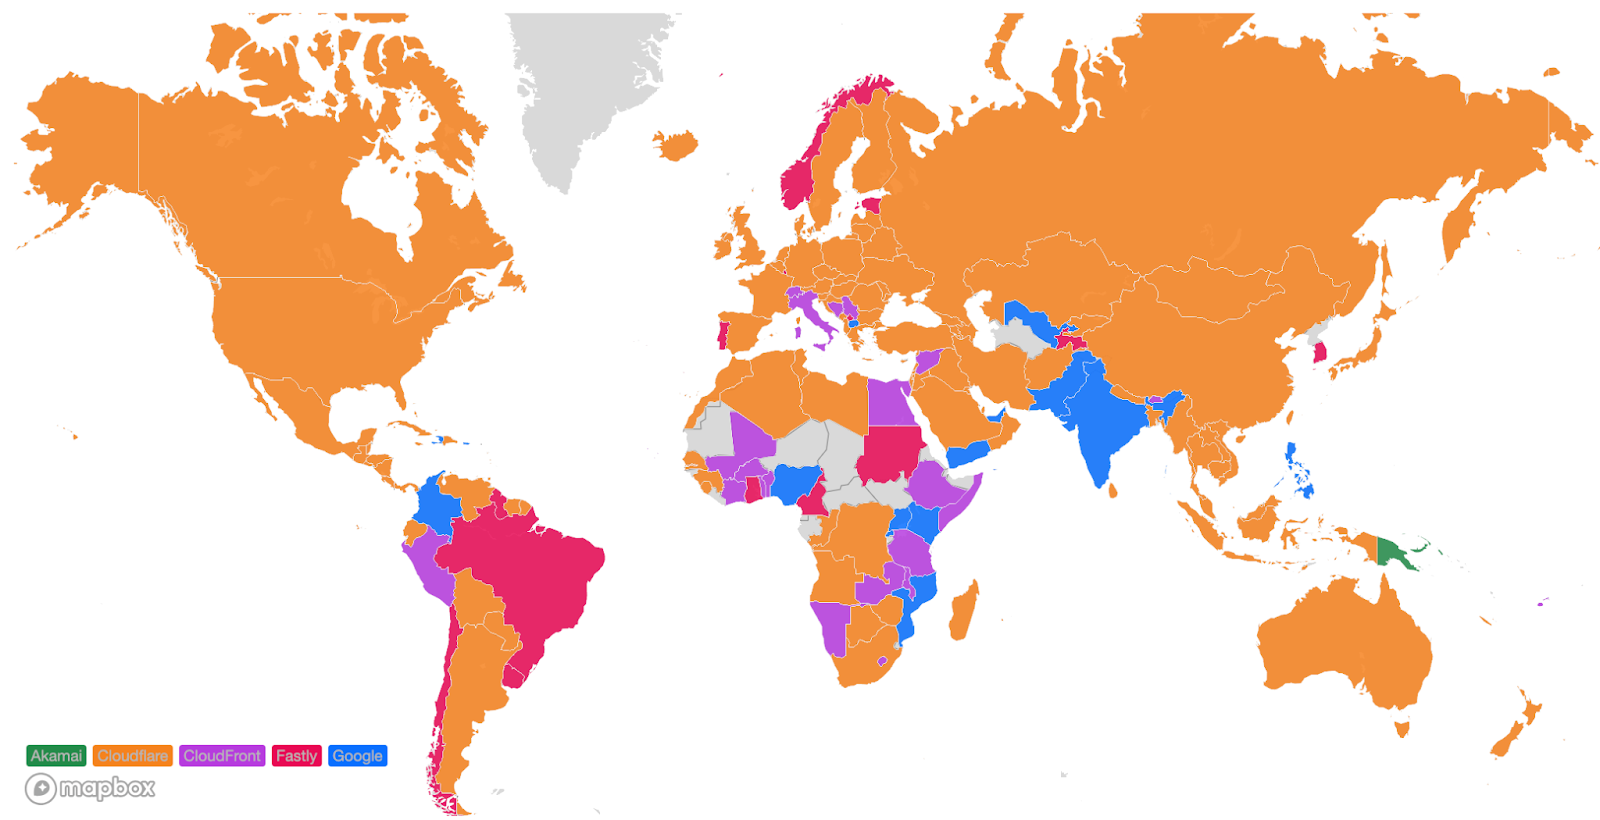
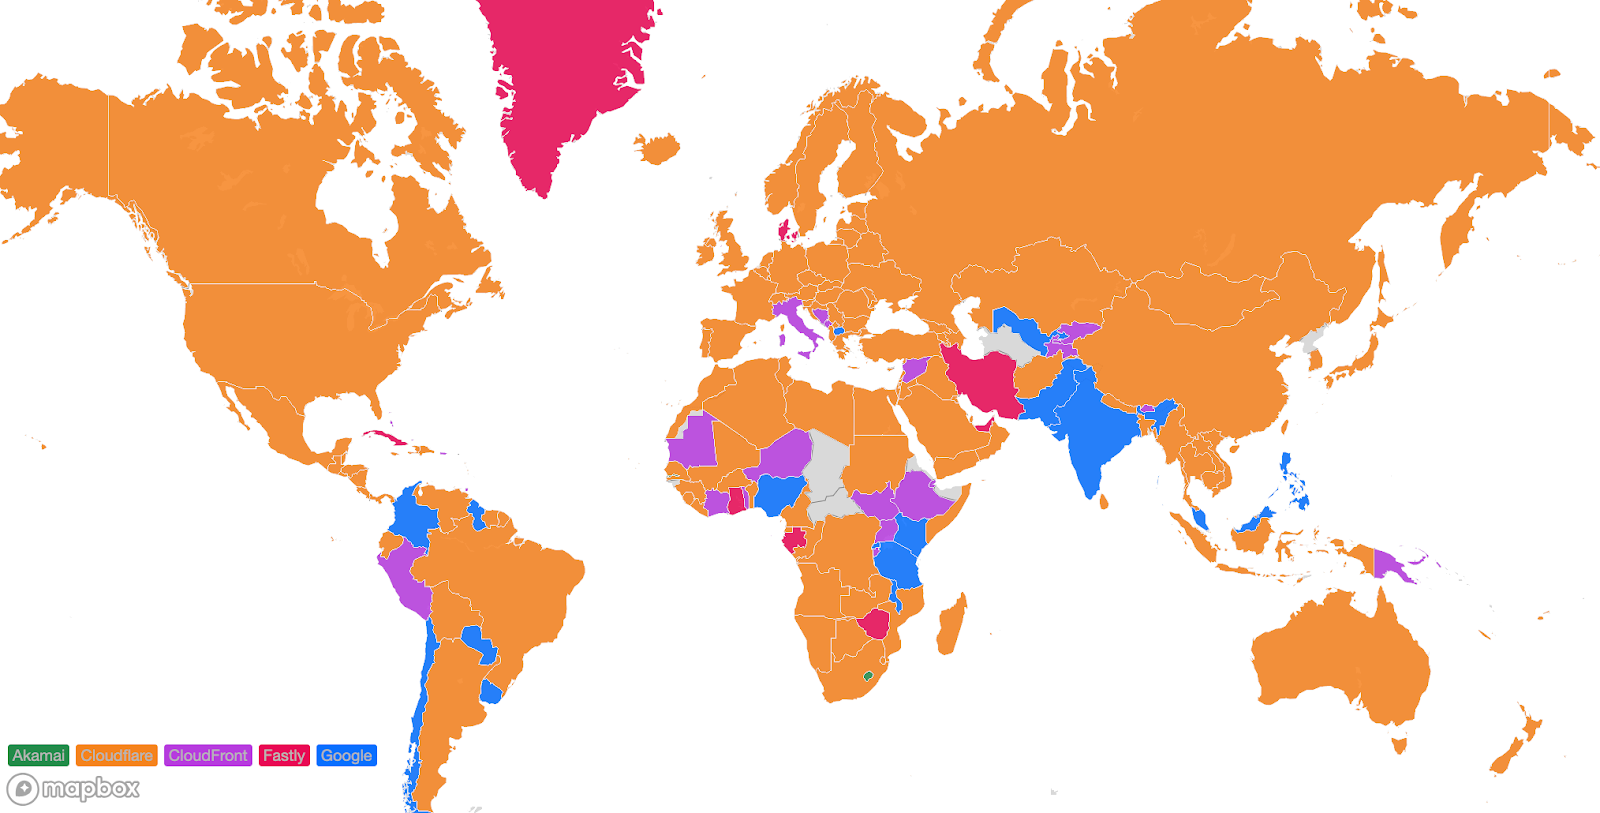
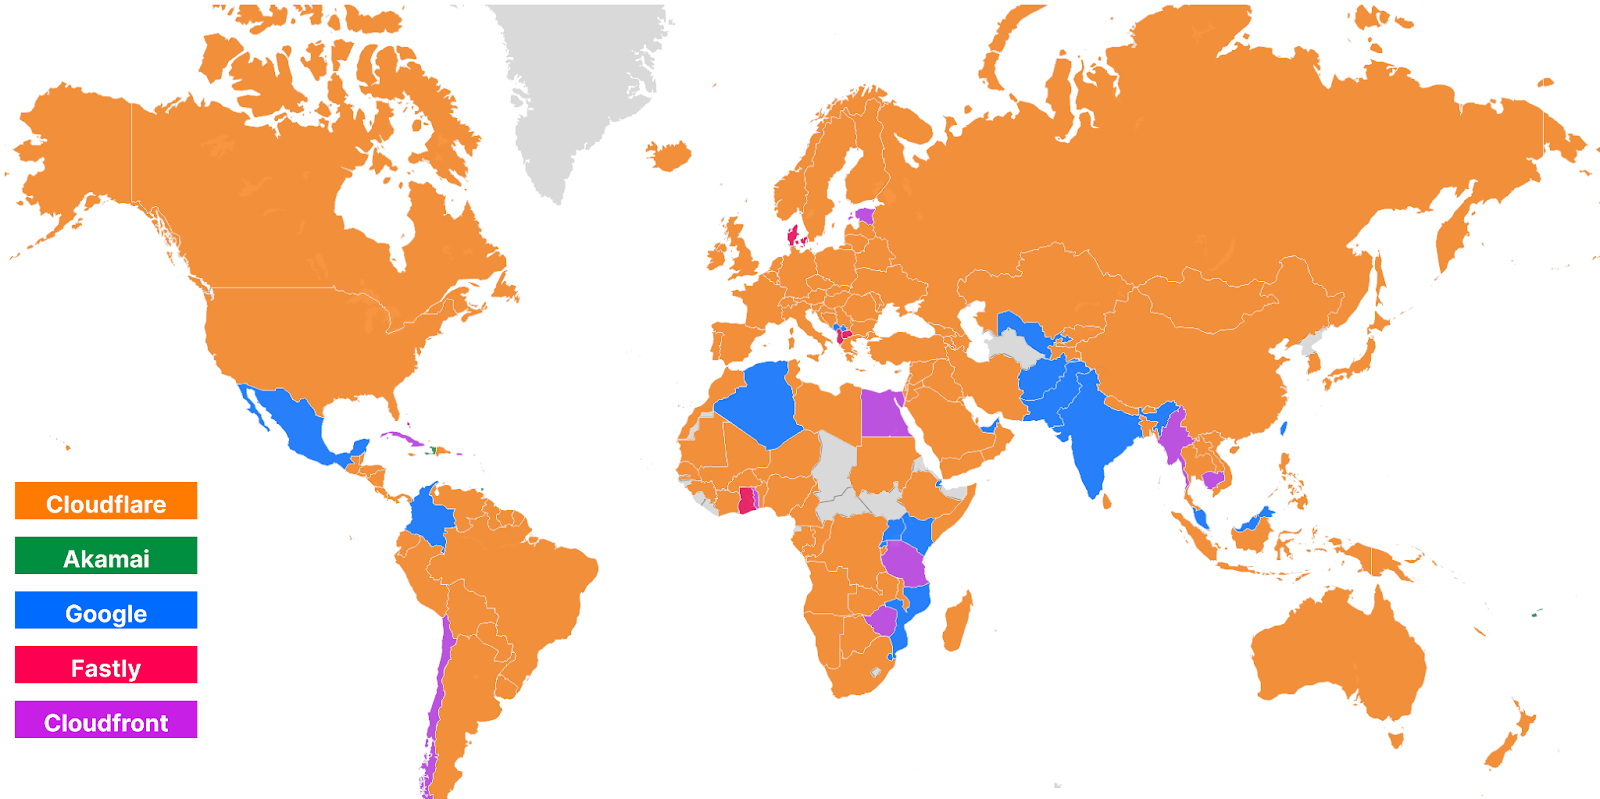
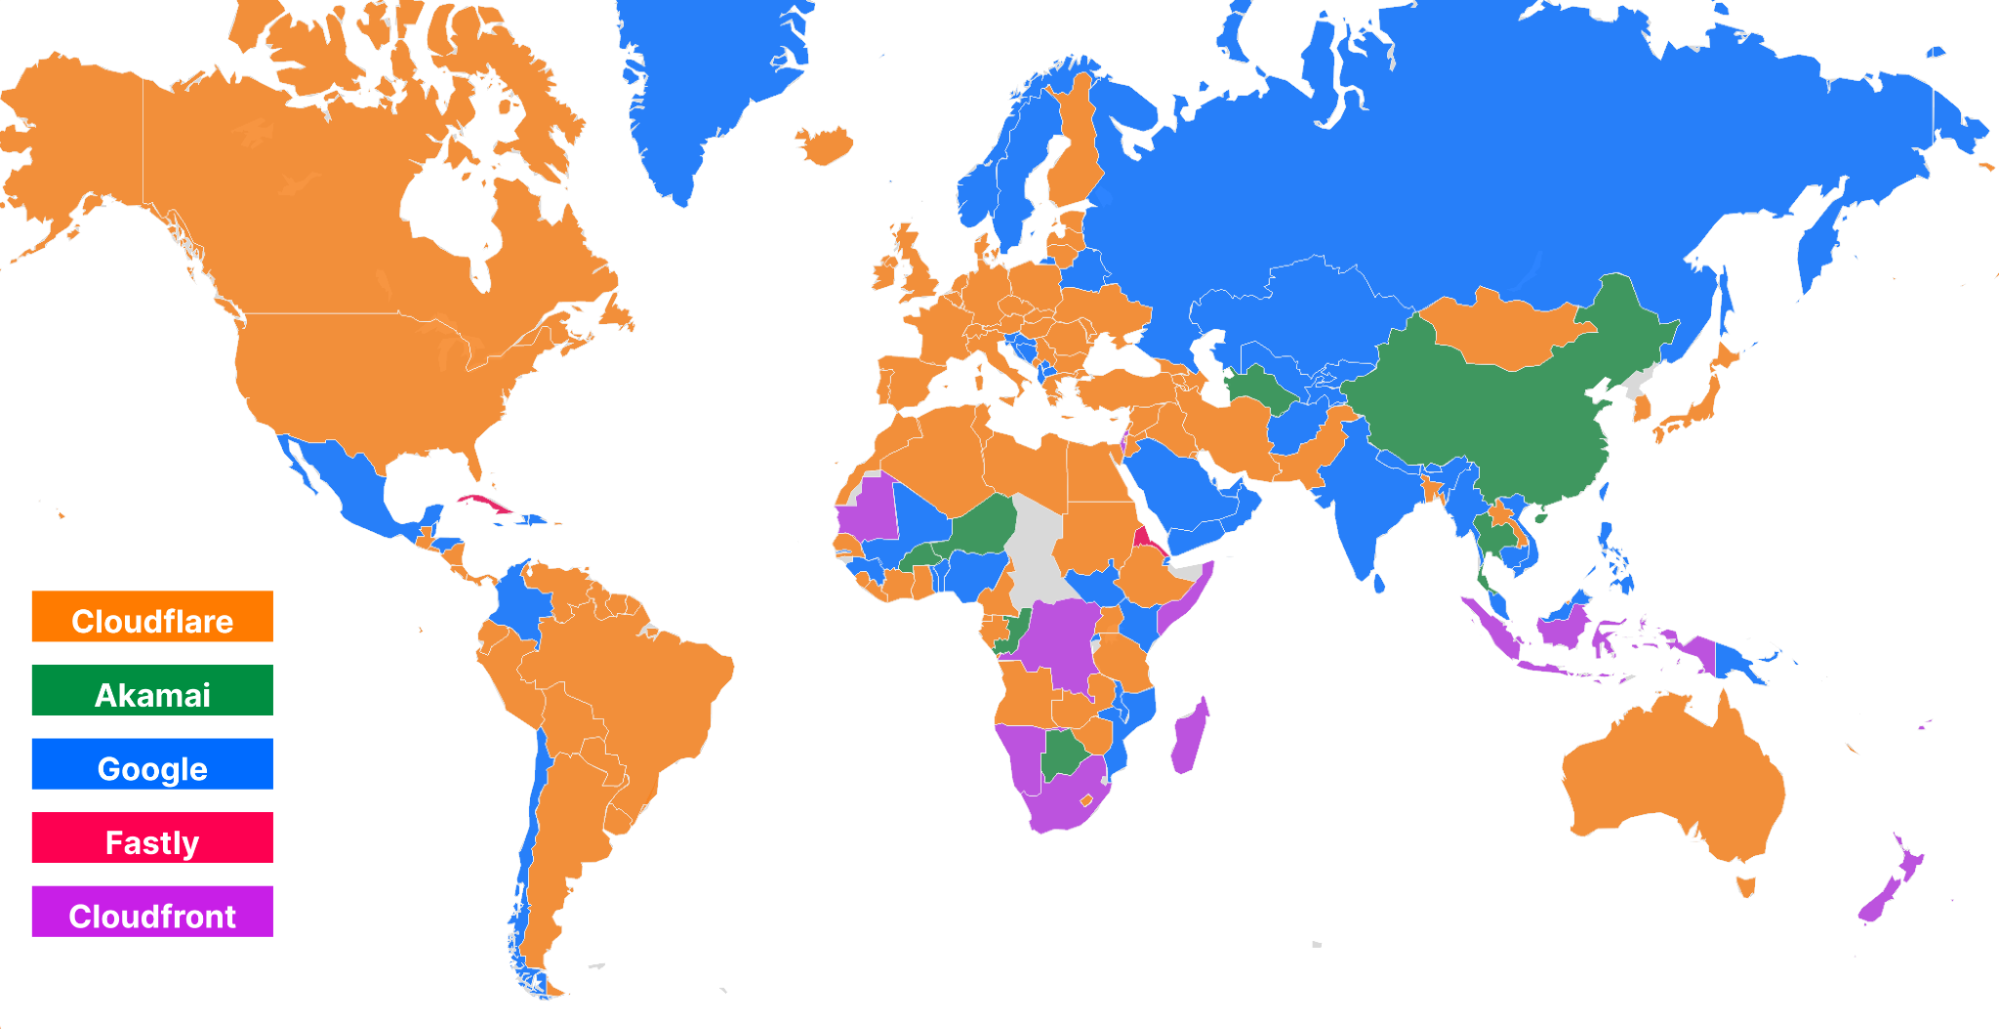
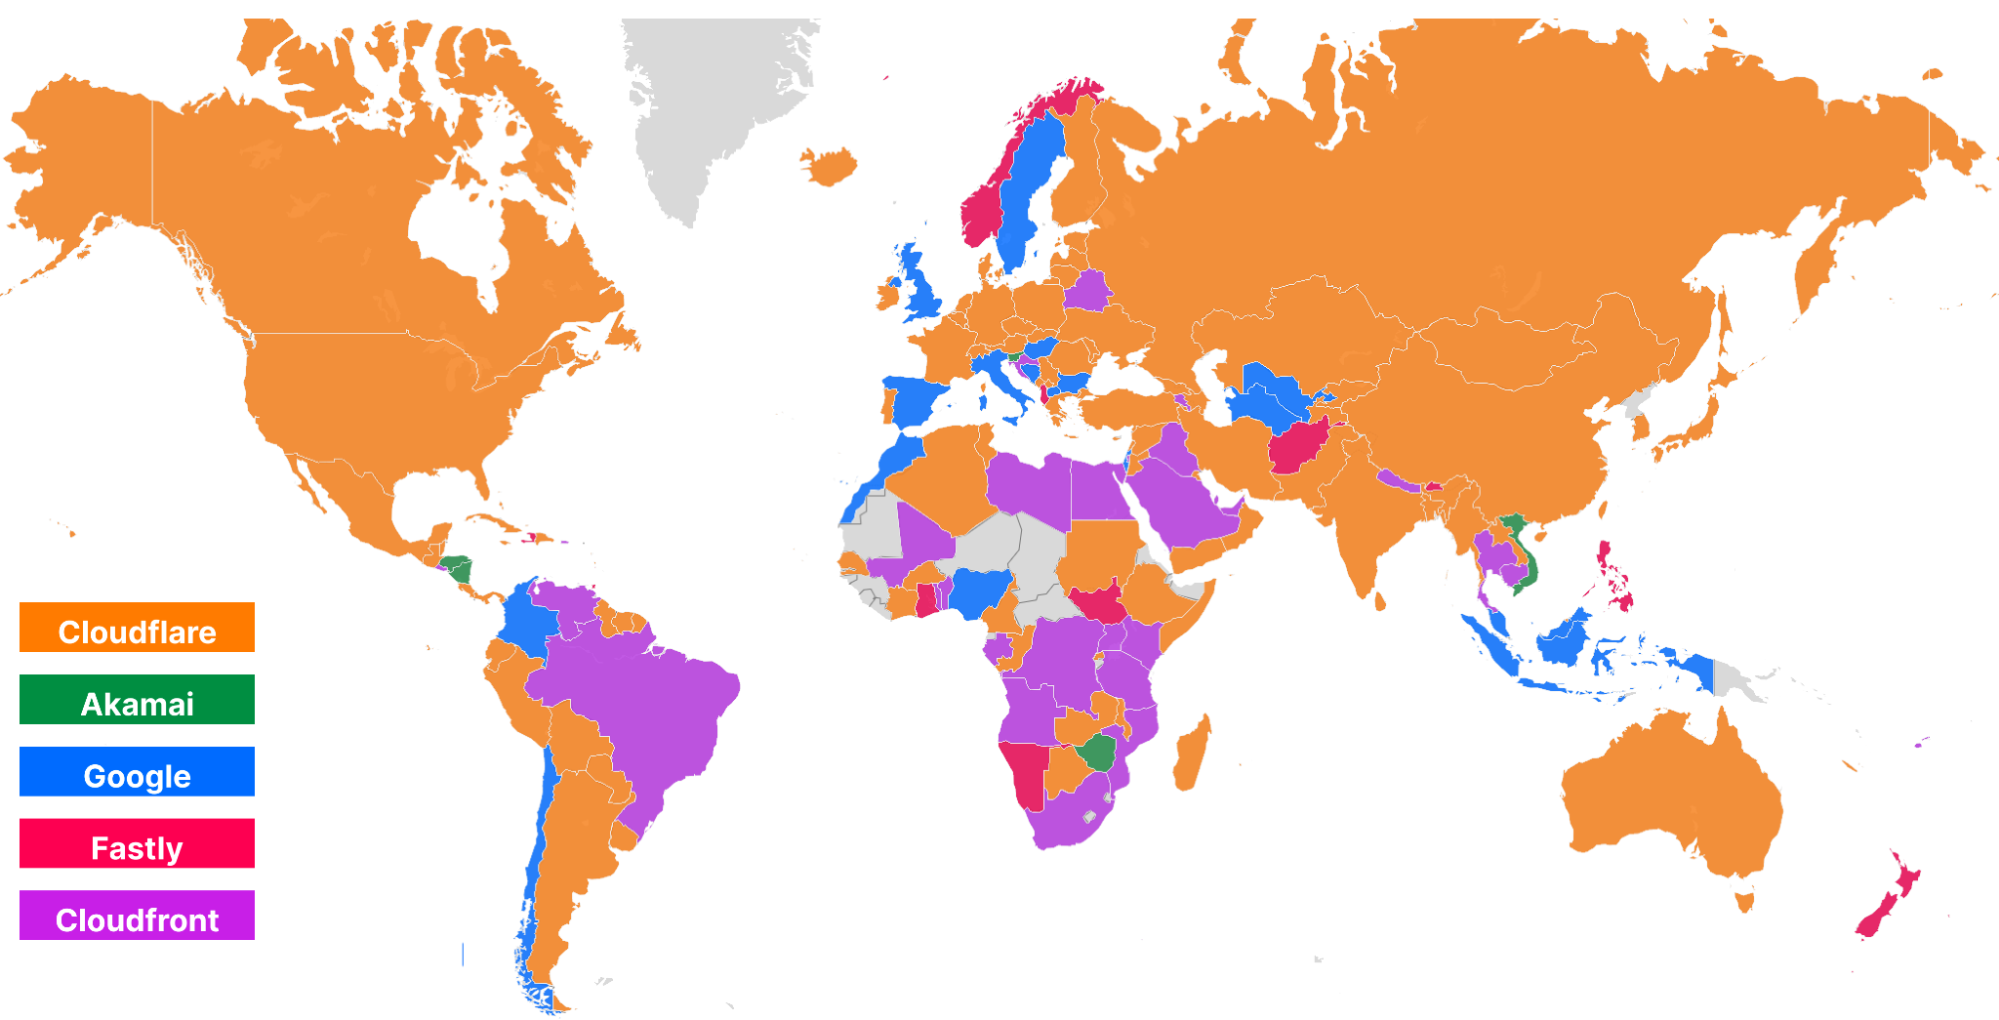
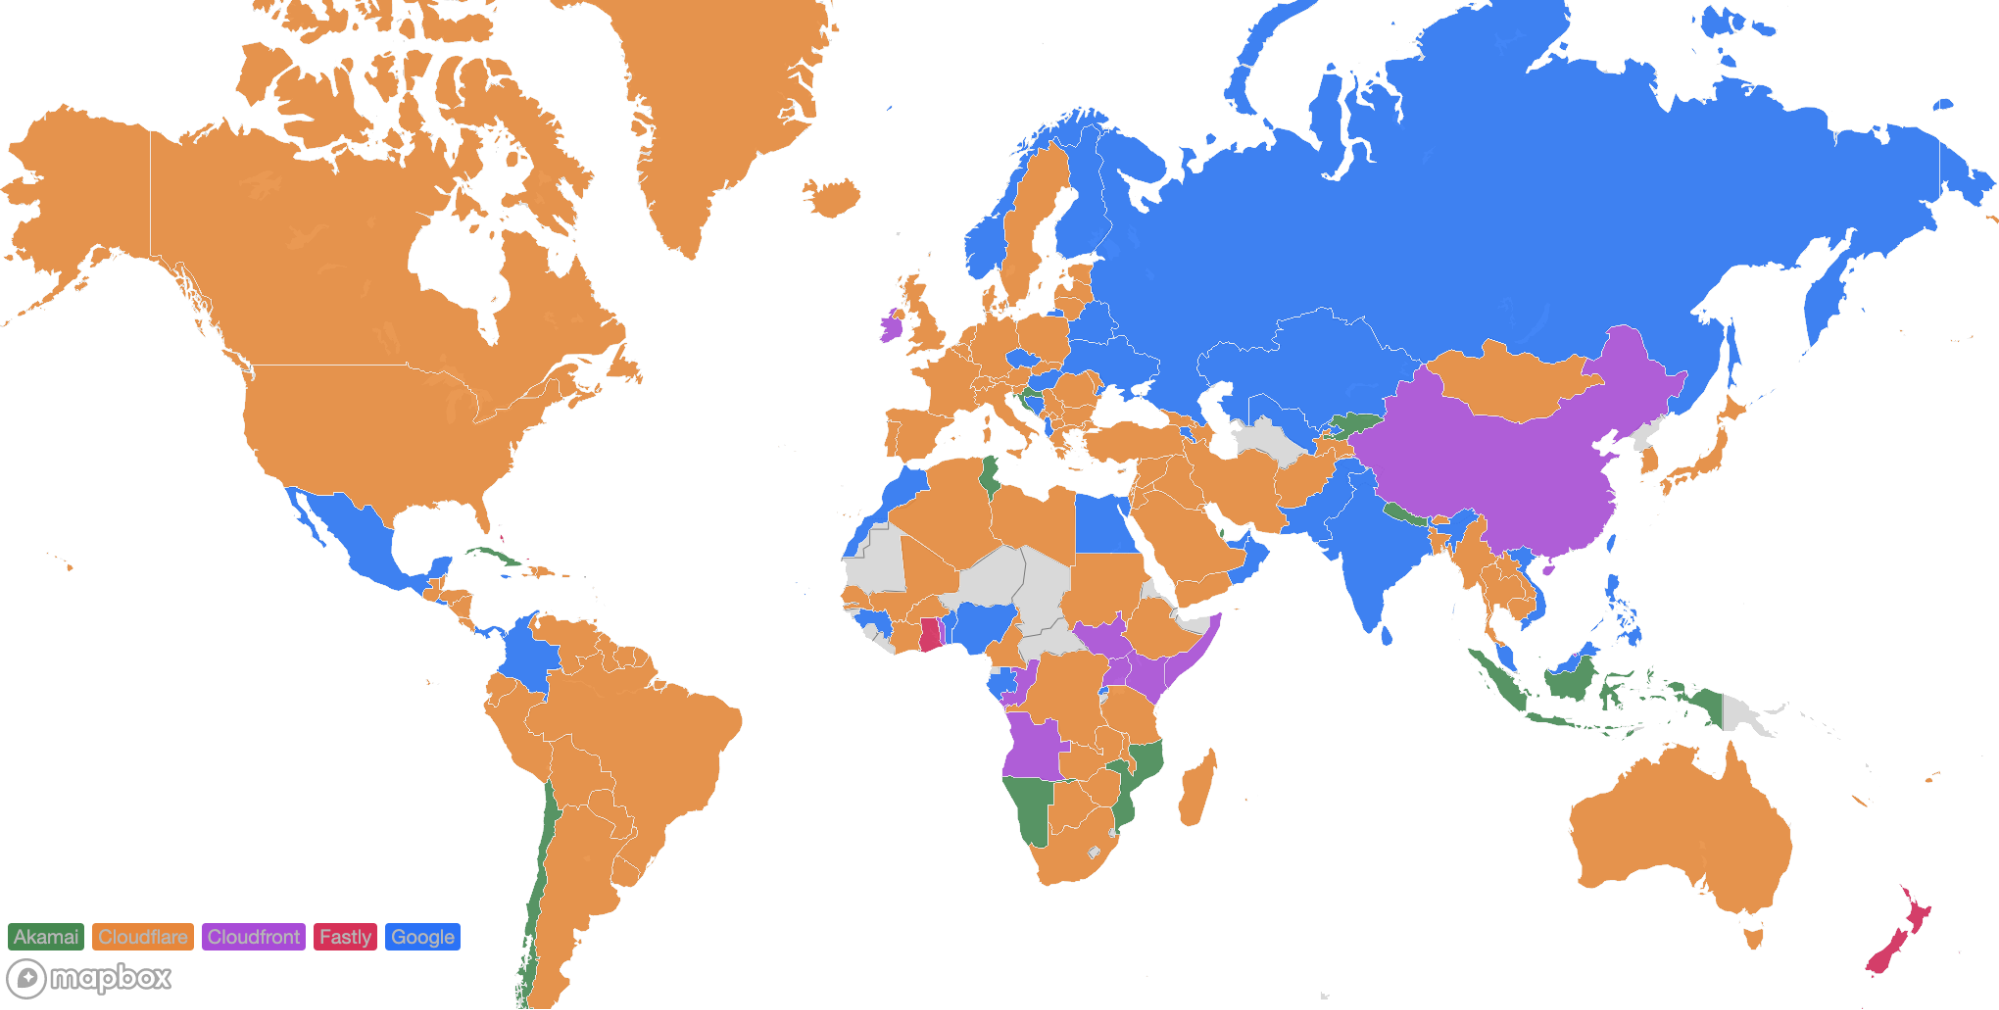
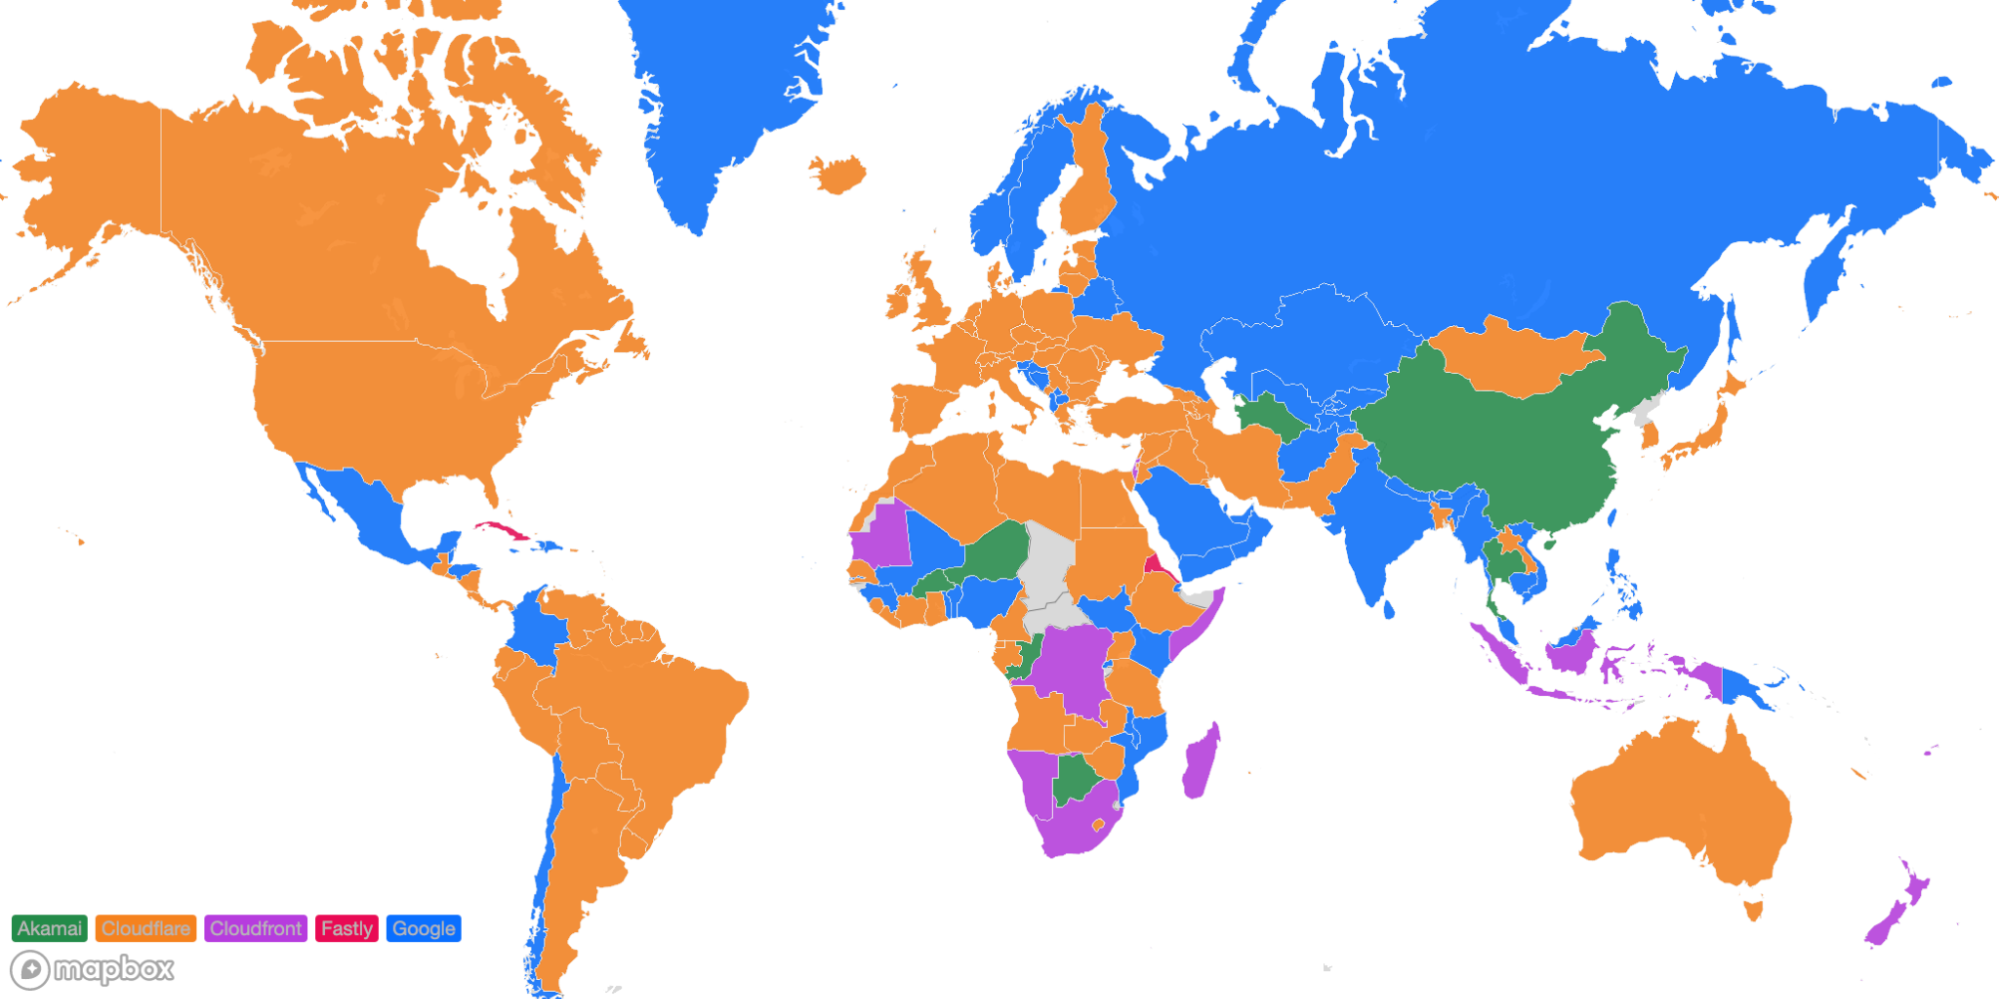
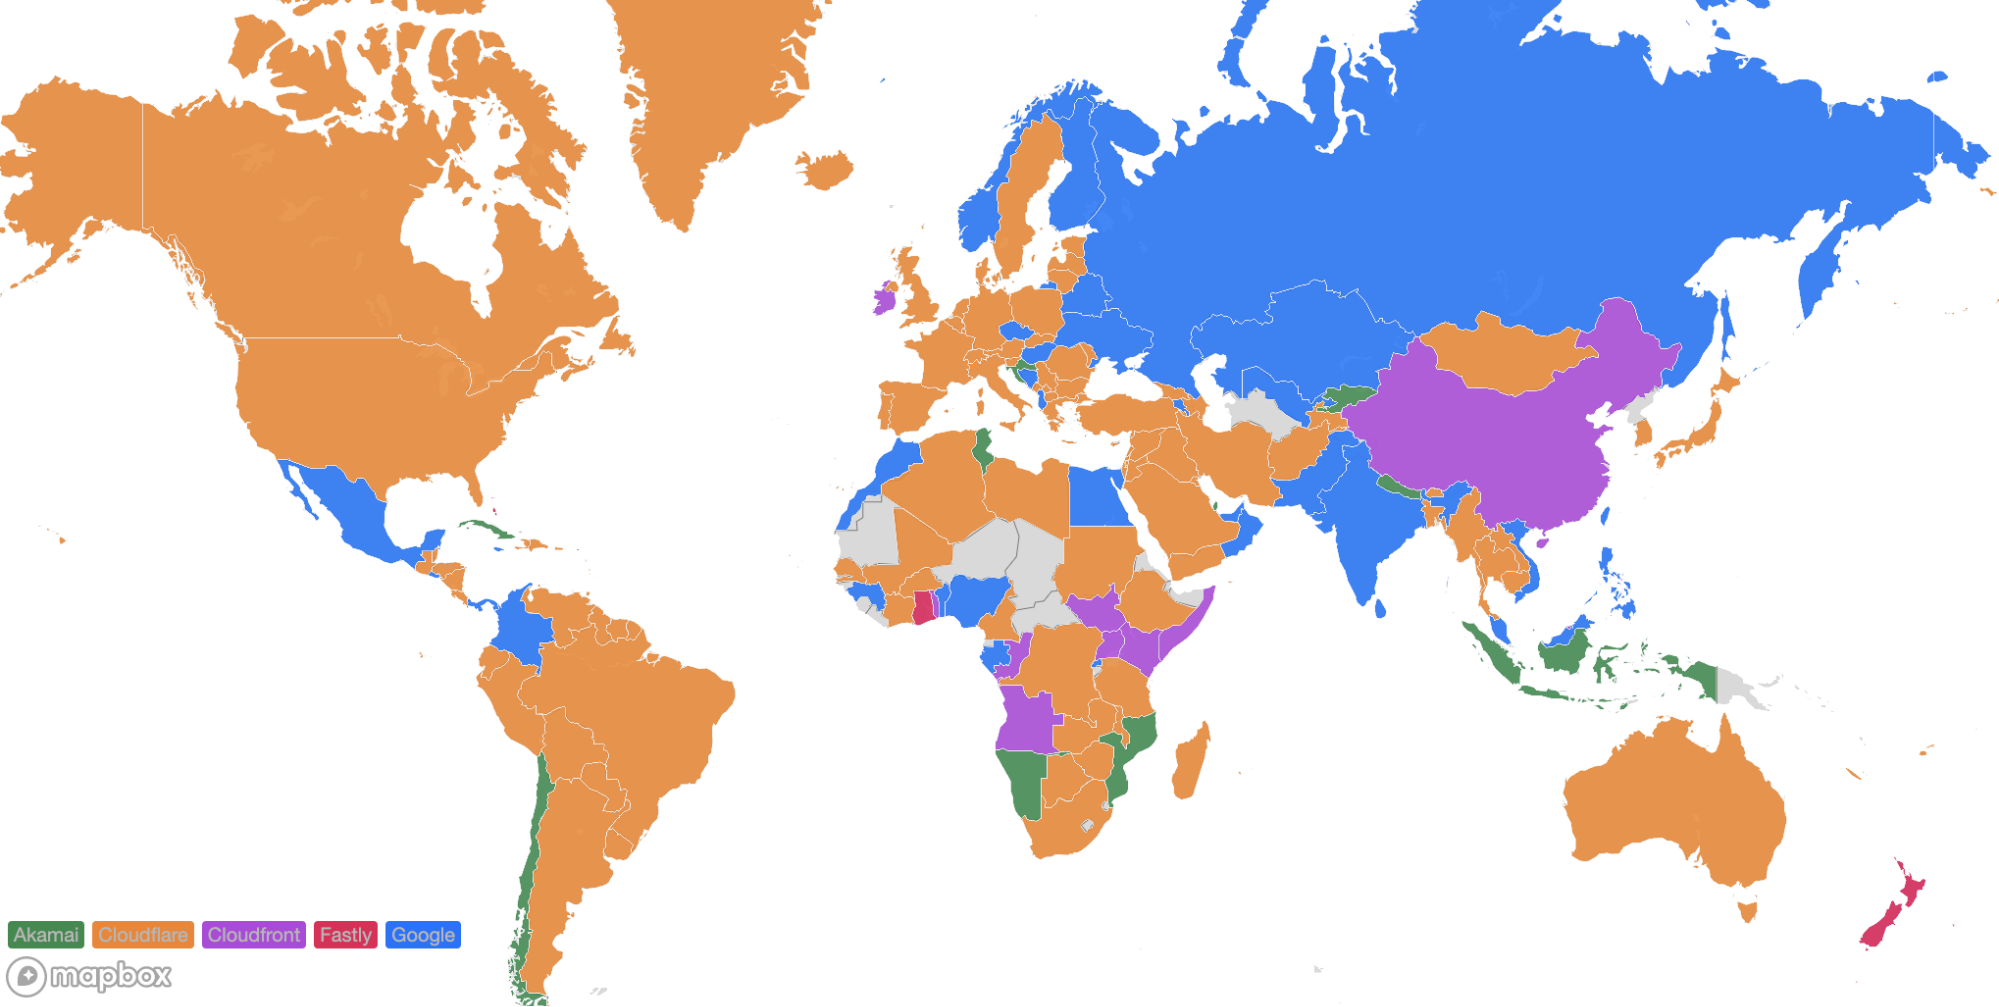
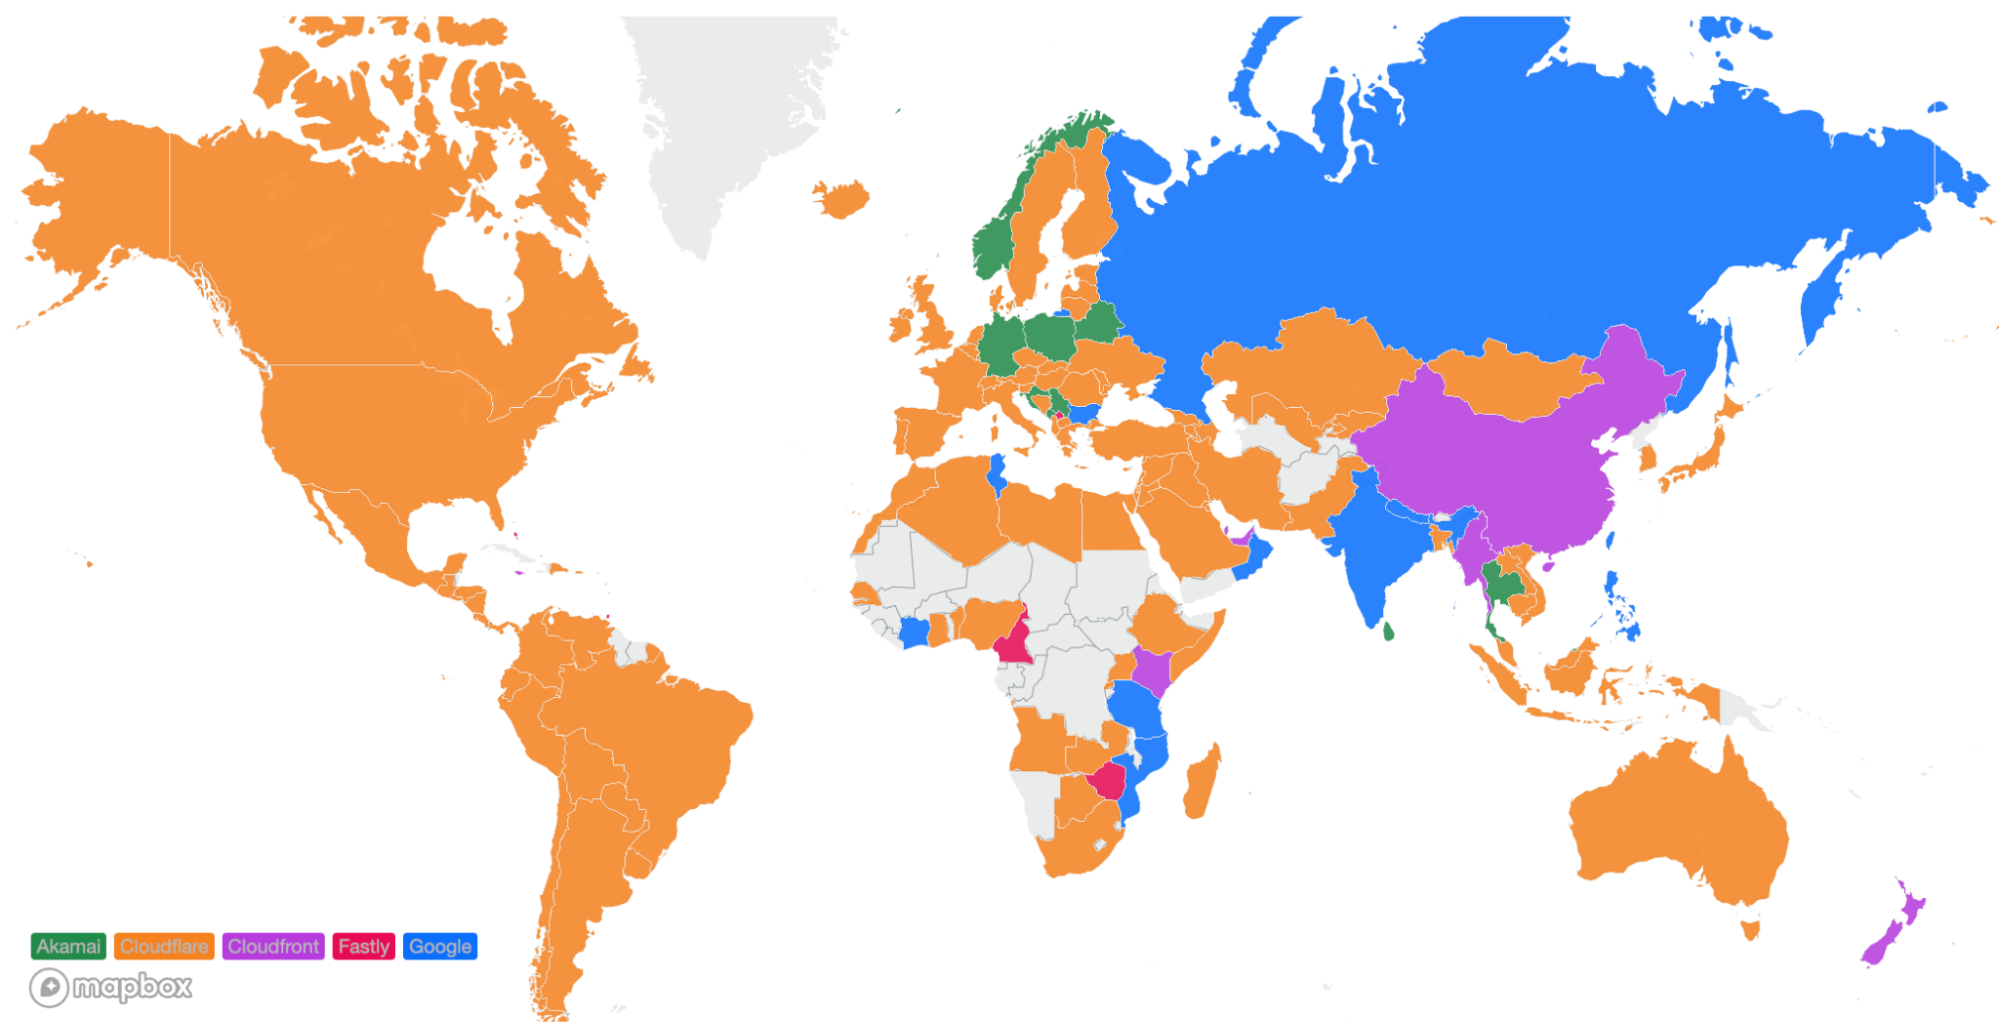
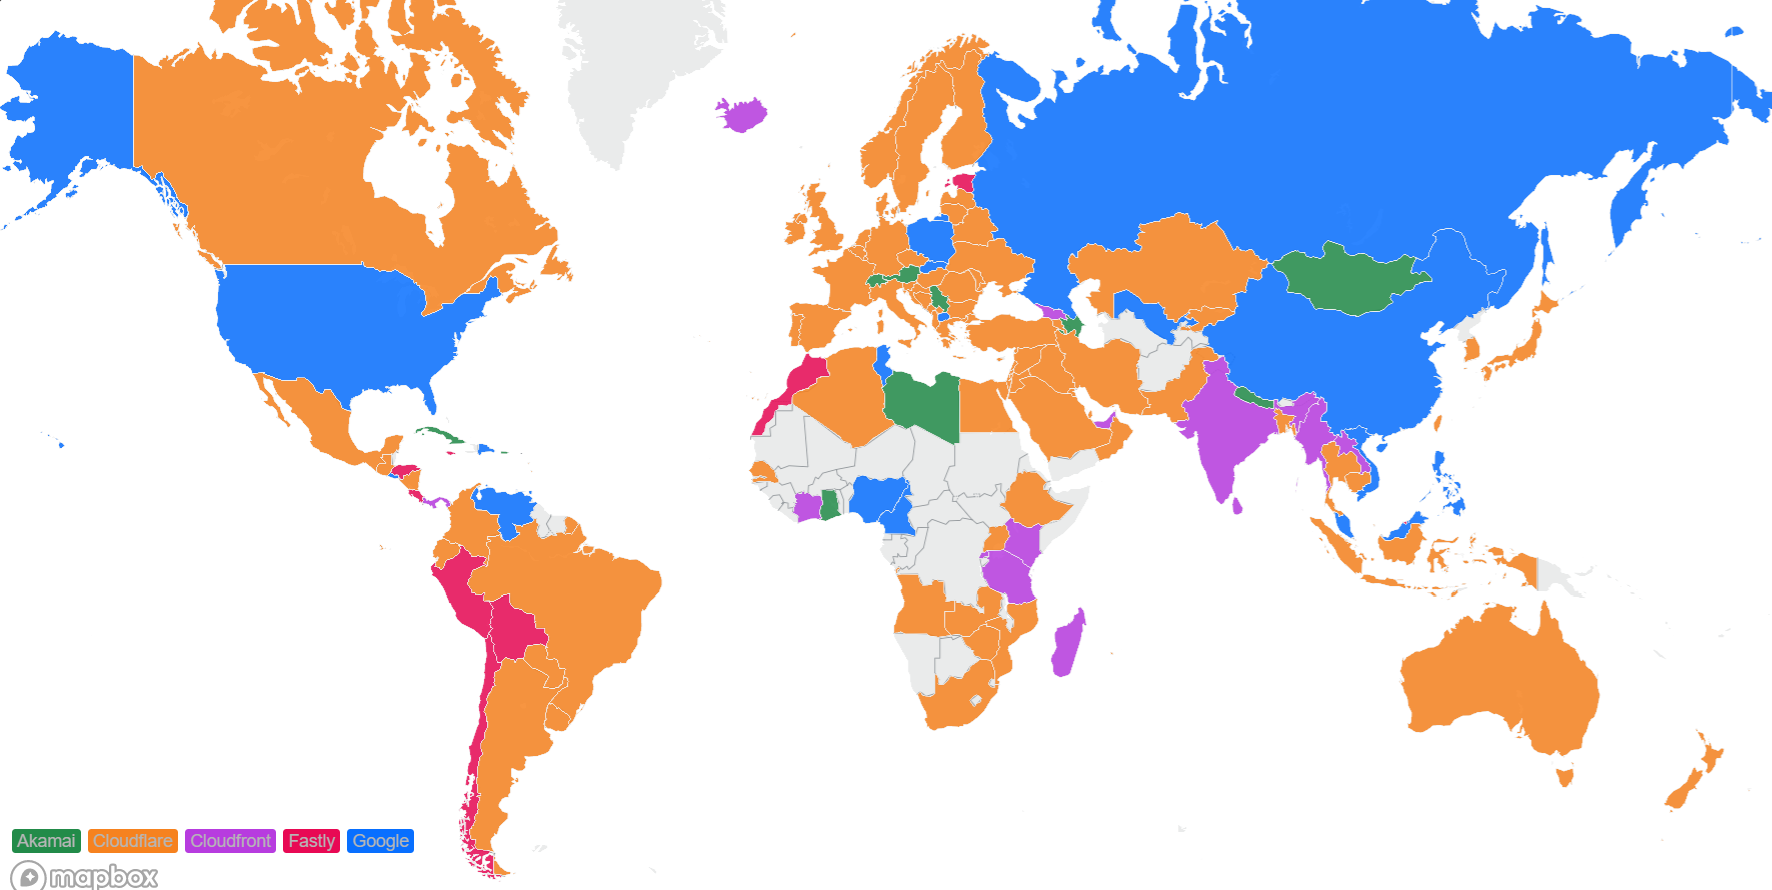
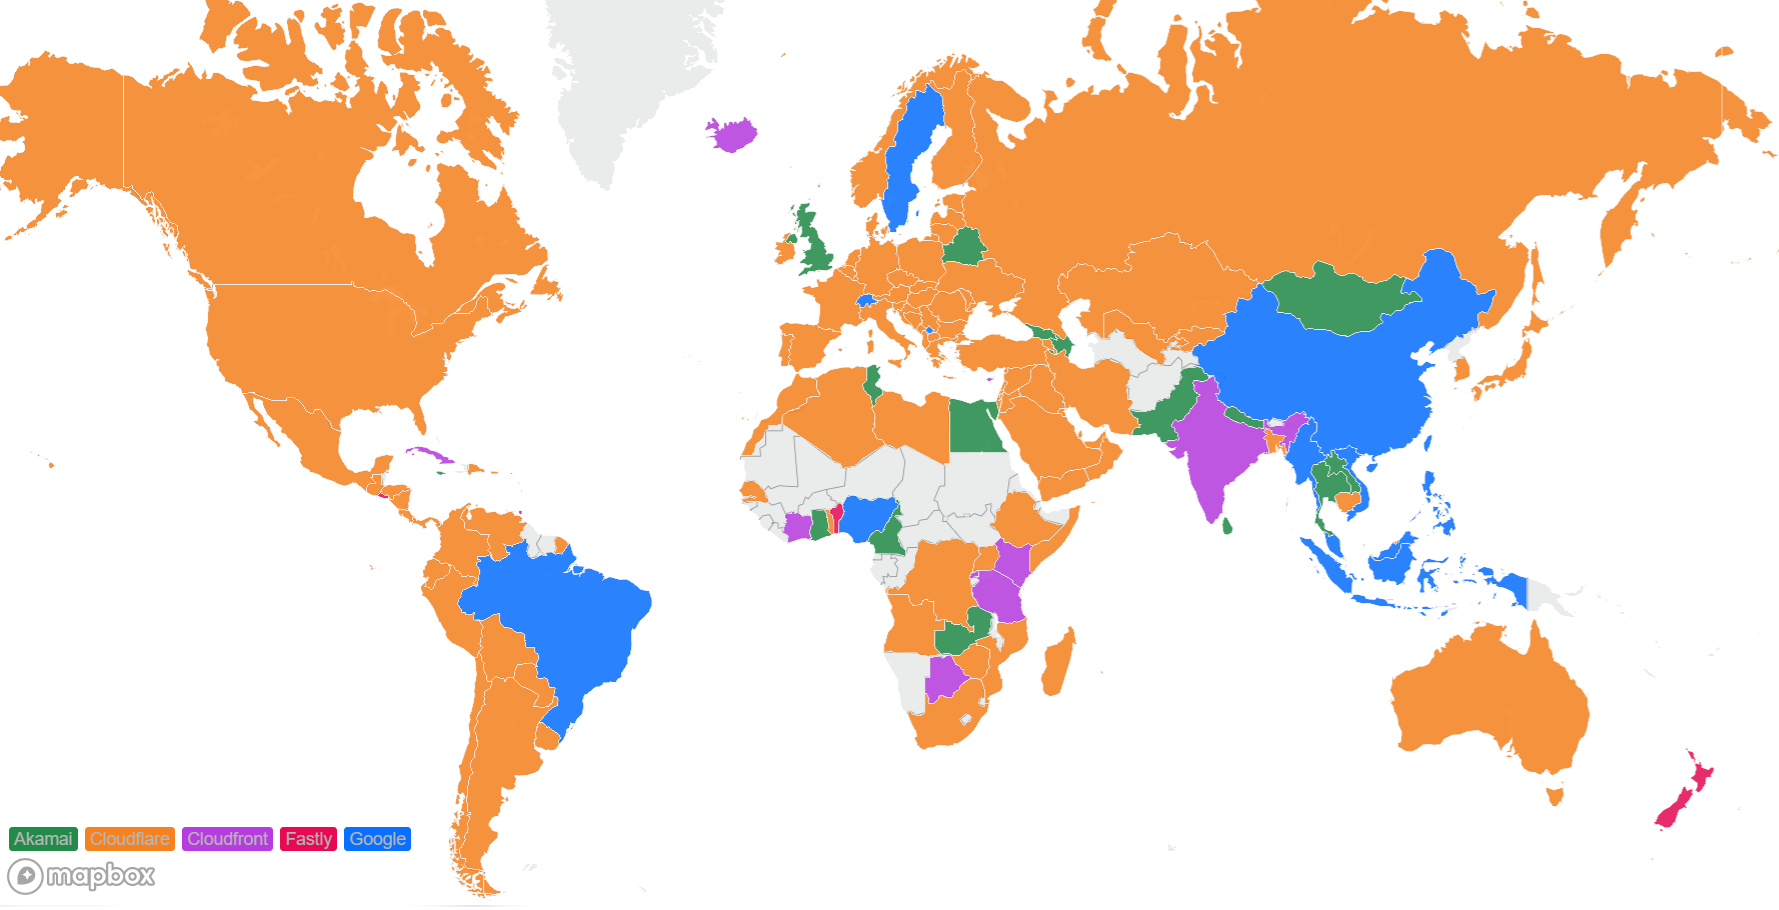
The map below shows the fastest providers per country and Cloudflare is fastest in dozens of countries.

The color coding is generated by grouping all the measurements we generate by which country the measurement originates from. Then we look at the trimean measurements for each provider to identify who is the fastest… Akamai was measured as well, but providers are only represented in the map if they ranked first in a country which Akamai does not anywhere in the world.
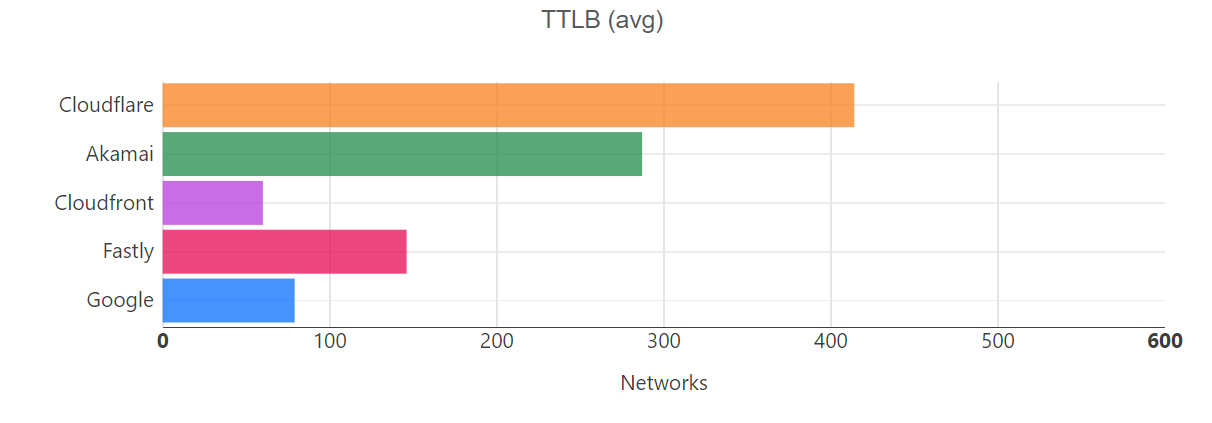
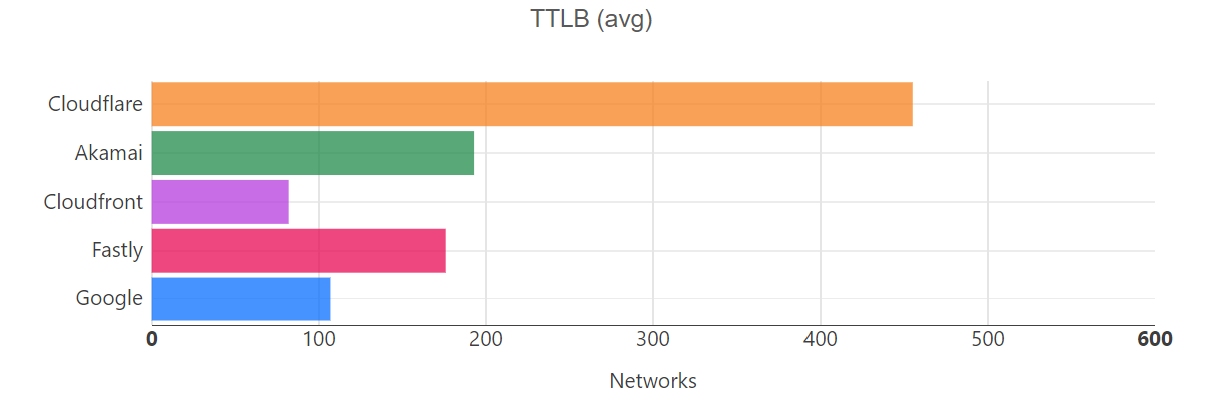
These slim margins mean that the fastest provider in a country is often determined by latency differences so small that the fastest provider is often only faster by less than 5%. As an example, let’s look at India, a country where we are currently the second-fastest provider.
|
India (IN) |
|||
|
Rank |
Entity |
Connect Time (Trimean) |
#1 Diff |
|
#1 |
CloudFront |
107 ms |
– |
|
#2 |
Cloudflare |
113 ms |
+4.81% (+5.16 ms) |
|
#3 |
|
117 ms |
+8.74% (+9.39 ms) |
|
#4 |
Fastly |
133 ms |
+24% (+26 ms) |
|
#5 |
Akamai |
144 ms |
+34% (+37 ms) |
In India, Cloudflare is 5ms behind Cloudfront, the #1 provider (To put milliseconds into perspective, the average human eye blink lasts between 100ms and 400ms). The competition for the number one spot in many countries is fierce and often shifts day by day. For example, in Mexico on Tuesday, August 5th, Cloudflare was the second-fastest provider by 0.73 ms but then on Tuesday, August 12th, Cloudflare was the fastest provider by 3.72 ms.
|
Mexico (MX) |
||||
|
Date |
Rank |
Entity |
Connect Time (Trimean) |
#1 Diff |
|
August 5, 2025 |
#1 |
CloudFront |
116 ms |
– |
|
#2 |
Cloudflare |
116 ms |
+0.63% (+0.73 ms) |
|
|
August 12, 2025 |
#1 |
Cloudflare |
106 ms |
– |
|
#2 |
CloudFront |
109 ms |
+3.52% (+3.72 ms) |
Because ranking reorderings are common, we also review country and network level rankings to evaluate and benchmark our performance.
As mentioned above, in September 2024, Cloudflare was fastest in 44% of measured ISPs. These values can shift as providers constantly make improvements to their networks. One way we focus in on how we are prioritizing improving is to not just observe where we are not the fastest but to measure how far we are from the leader.
In these locations we tend to pace extremely close to the fastest provider, giving us an opportunity to capture the spot as we relentlessly improve. In networks where Cloudflare is 2nd, over 50% of those networks have a less than 5% difference (10ms or less) with the top provider.
|
Country |
ASN |
#1 |
Cloudflare Rank |
#1 Diff (ms) |
#1 Diff (%) |
|
US |
AS36352 |
|
2 |
25 ms |
32% |
|
US |
AS46475 |
|
2 |
35 ms |
29% |
|
US |
AS29802 |
|
2 |
8.03 ms |
21% |
|
US |
AS20473 |
|
2 |
15 ms |
13% |
|
US |
AS7018 |
CloudFront |
2 |
23 ms |
13% |
|
US |
AS4181 |
CloudFront |
2 |
8.19 ms |
11% |
|
US |
AS62240 |
|
2 |
18 ms |
9.77% |
|
US |
AS22773 |
CloudFront |
2 |
12 ms |
9.48% |
|
US |
AS6167 |
CloudFront |
2 |
13 ms |
7.55% |
|
US |
AS11427 |
|
2 |
9.33 ms |
5.27% |
|
US |
AS6614 |
CloudFront |
2 |
6.68 ms |
4.12% |
|
US |
AS4922 |
|
2 |
3.38 ms |
3.86% |
|
US |
AS11492 |
Fastly |
2 |
3.73 ms |
3.33% |
|
US |
AS11351 |
|
2 |
5.14 ms |
3.04% |
|
US |
AS396356 |
|
2 |
4.12 ms |
2.23% |
|
US |
AS212238 |
|
2 |
3.42 ms |
1.35% |
|
US |
AS20055 |
Fastly |
2 |
1.22 ms |
1.33% |
|
US |
AS40021 |
CloudFront |
2 |
2.06 ms |
0.91% |
|
US |
AS12271 |
Fastly |
2 |
1.26 ms |
0.89% |
|
US |
AS141039 |
CloudFront |
2 |
1.26 ms |
0.88% |
In networks where Cloudflare is 3rd, 50% of those networks are less than a 10% difference with the top provider (10ms or less). Margins are small and suggest that in instances where Cloudflare isn’t number one across networks, we’re extremely close to our competitors and the top networks change day over day.
|
Country |
ASN |
#1 |
Cloudflare Rank |
#1 Diff (ms) |
#1 Diff (%) |
|
US |
AS6461 |
|
3 |
33 ms |
39% |
|
US |
AS81 |
Fastly |
3 |
43 ms |
35% |
|
US |
AS14615 |
|
3 |
24 ms |
24% |
|
US |
AS13977 |
CloudFront |
3 |
21 ms |
19% |
|
US |
AS33363 |
|
3 |
29 ms |
18% |
|
US |
AS63949 |
|
3 |
9.56 ms |
14% |
|
US |
AS14593 |
Fastly |
3 |
17 ms |
13% |
|
US |
AS23089 |
CloudFront |
3 |
7.4 ms |
11% |
|
US |
AS16509 |
Fastly |
3 |
10 ms |
9.48% |
|
US |
AS209 |
CloudFront |
3 |
9.69 ms |
6.87% |
|
US |
AS27364 |
CloudFront |
3 |
8.76 ms |
6.61% |
|
US |
AS11404 |
CloudFront |
3 |
6.11 ms |
6.16% |
|
US |
AS46690 |
CloudFront |
3 |
5.91 ms |
5.43% |
|
US |
AS136787 |
CloudFront |
3 |
8.23 ms |
5.18% |
|
US |
AS6079 |
Fastly |
3 |
5.45 ms |
4.49% |
|
US |
AS5650 |
|
3 |
3.91 ms |
3.35% |
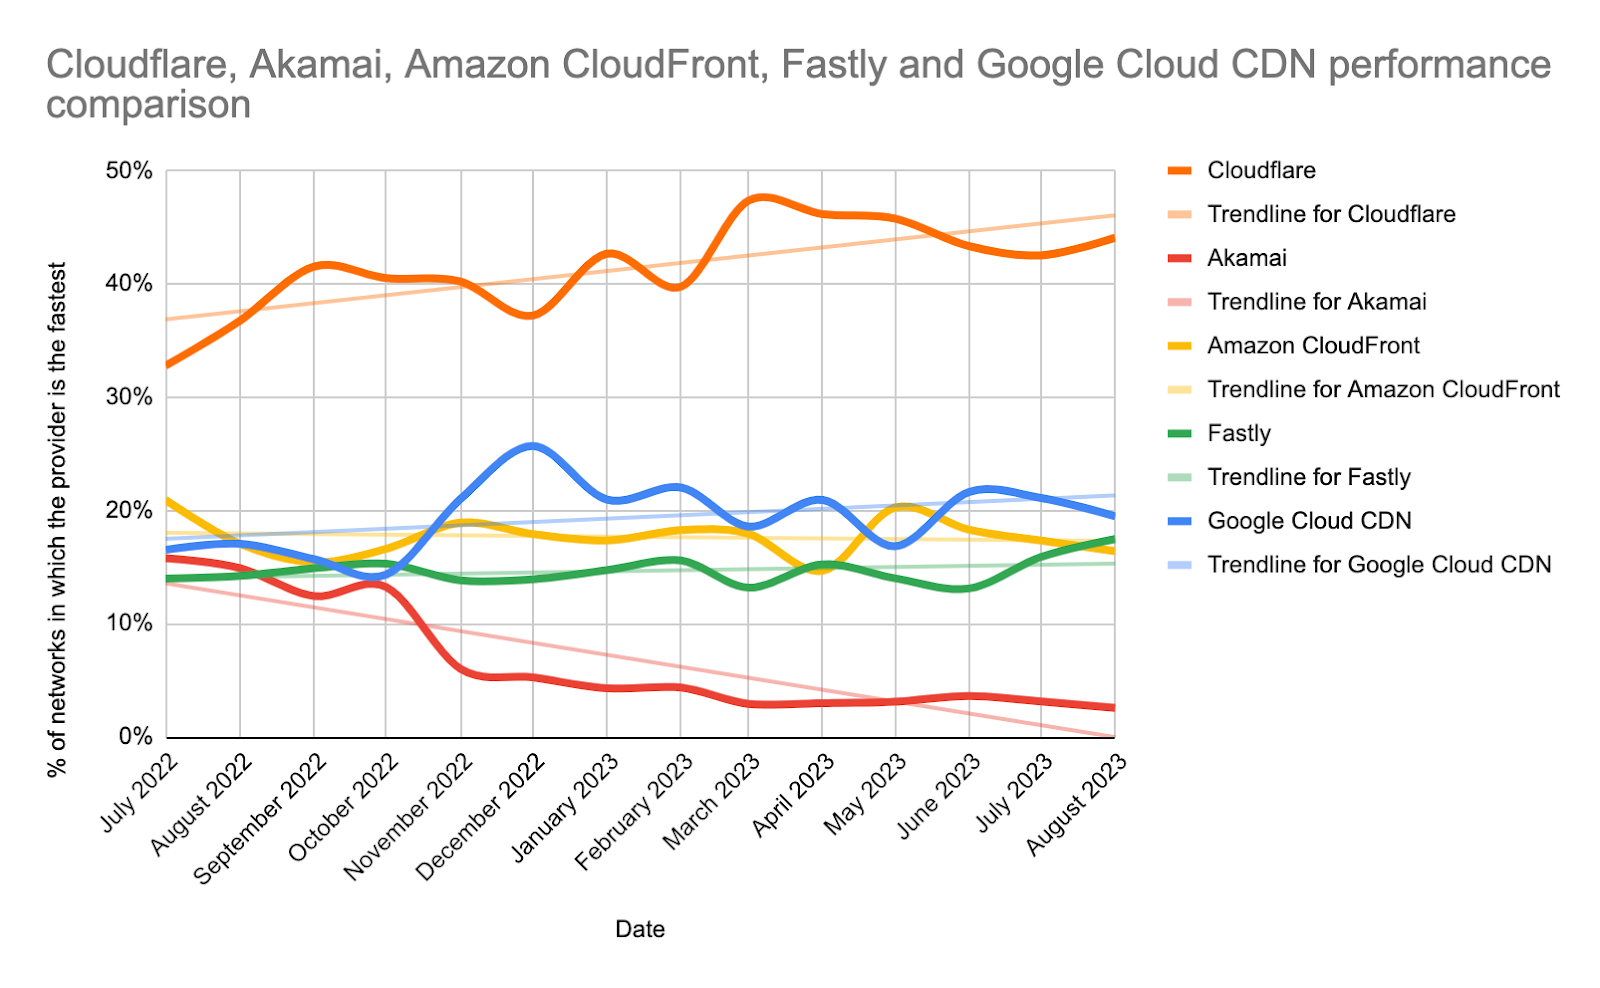
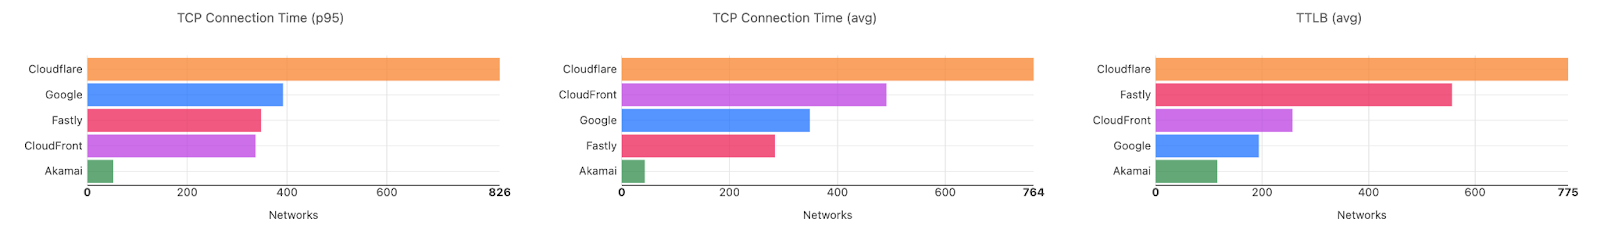
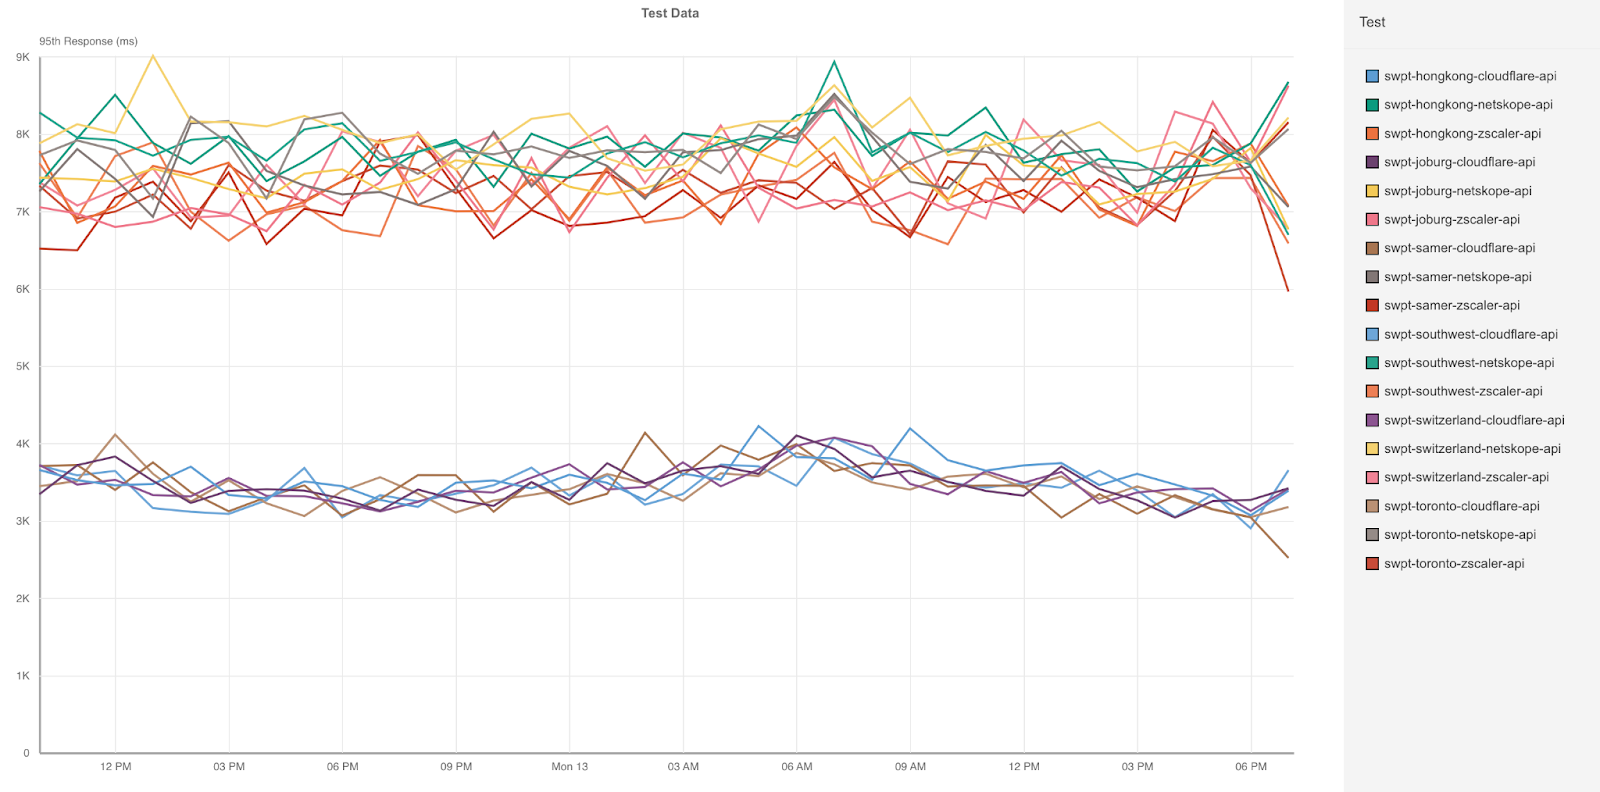
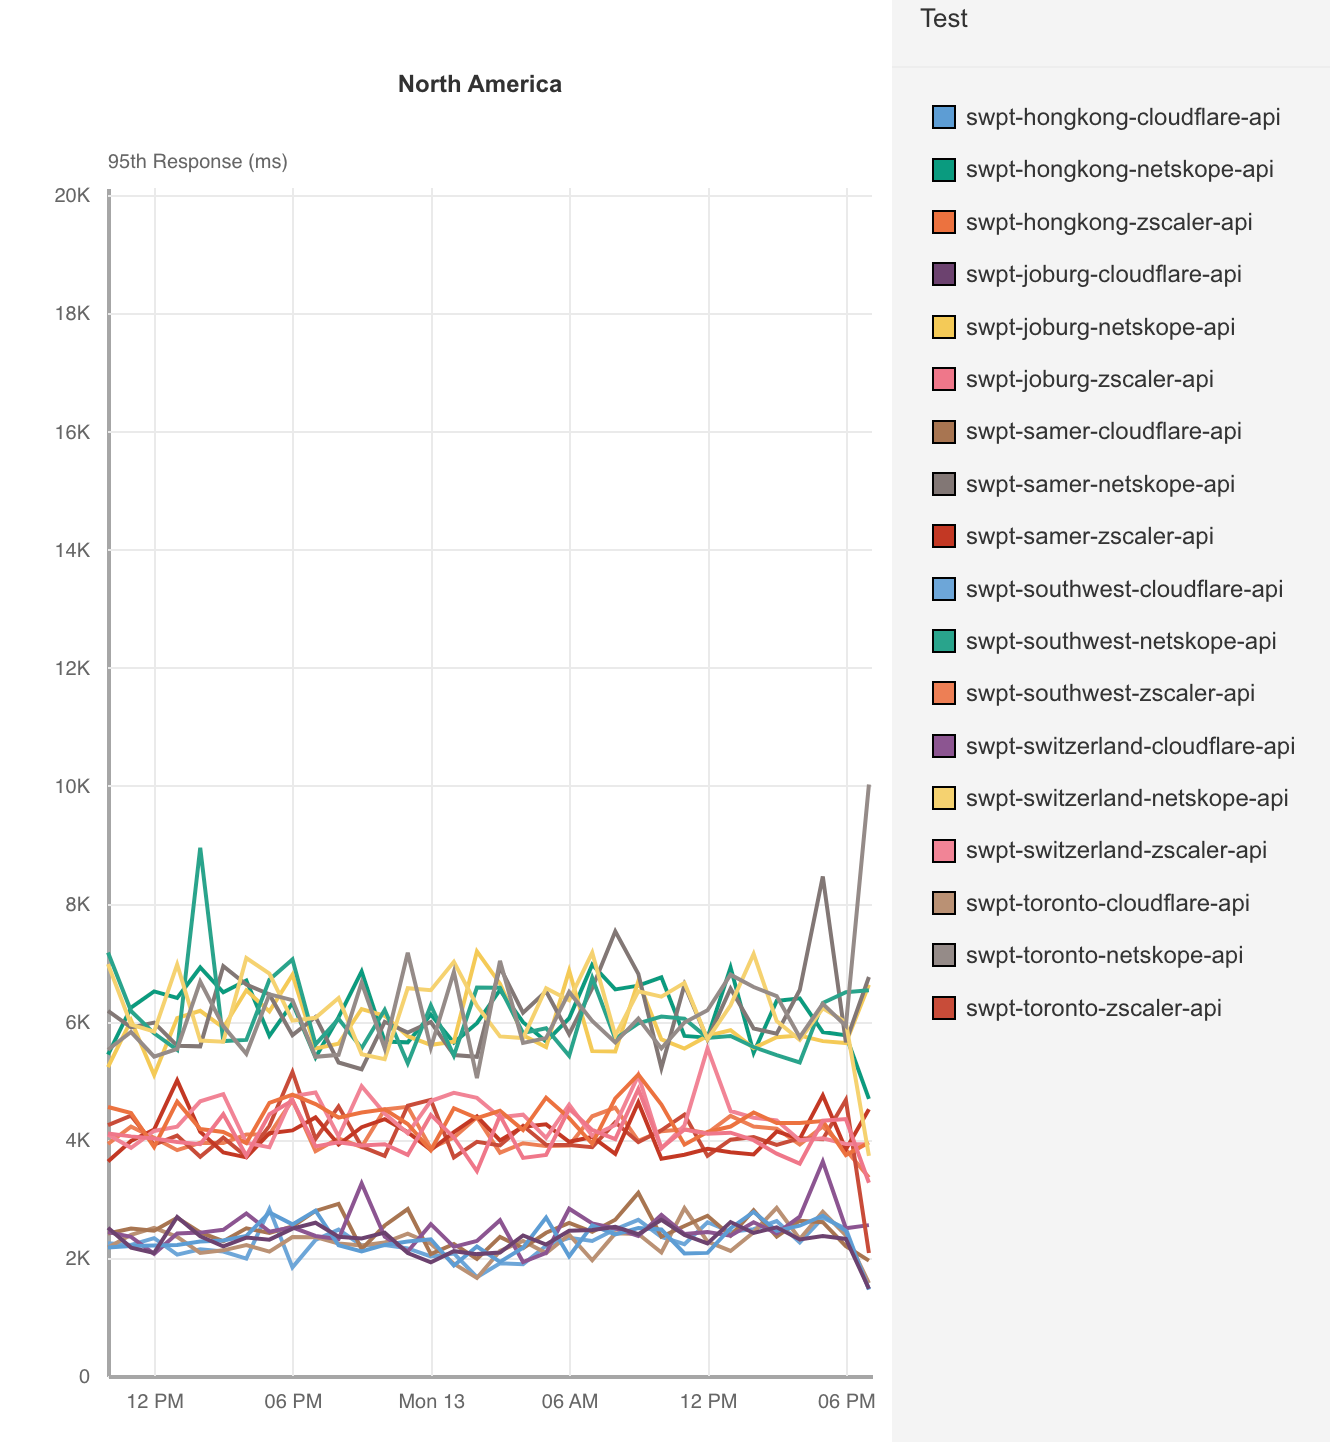
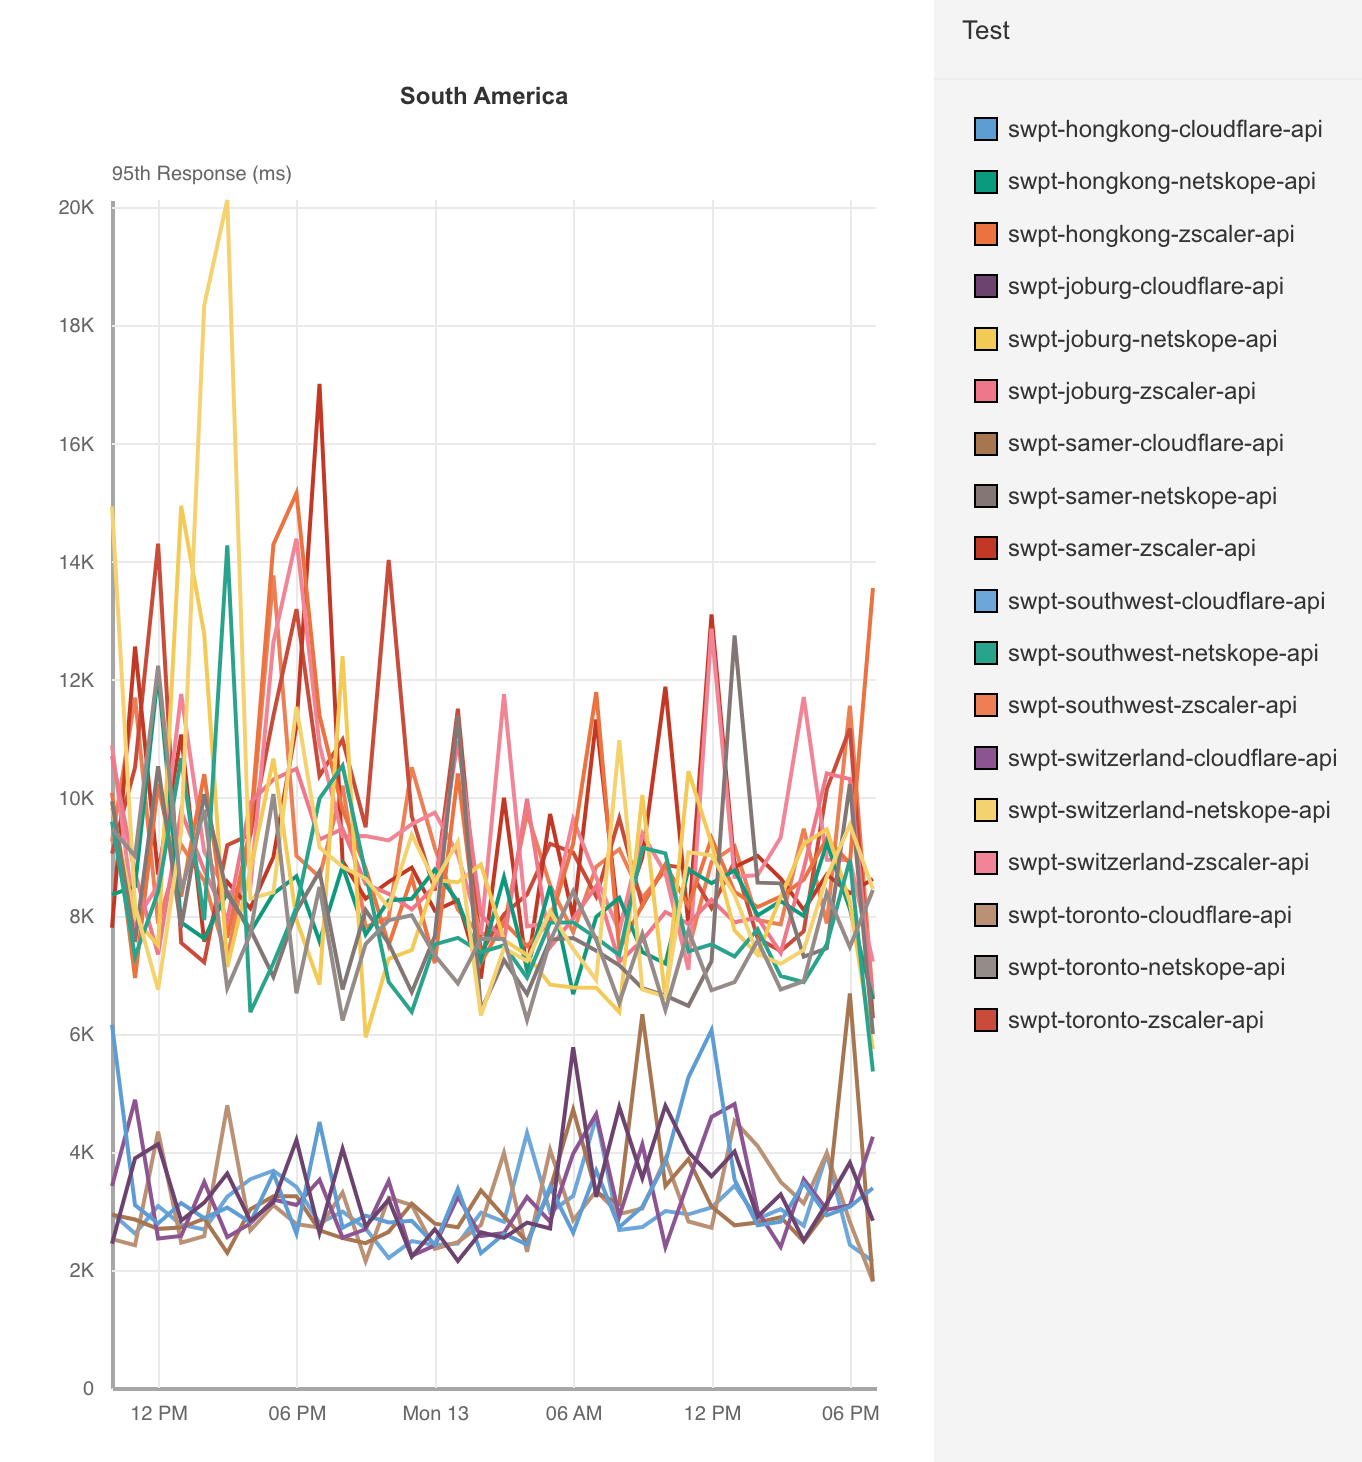
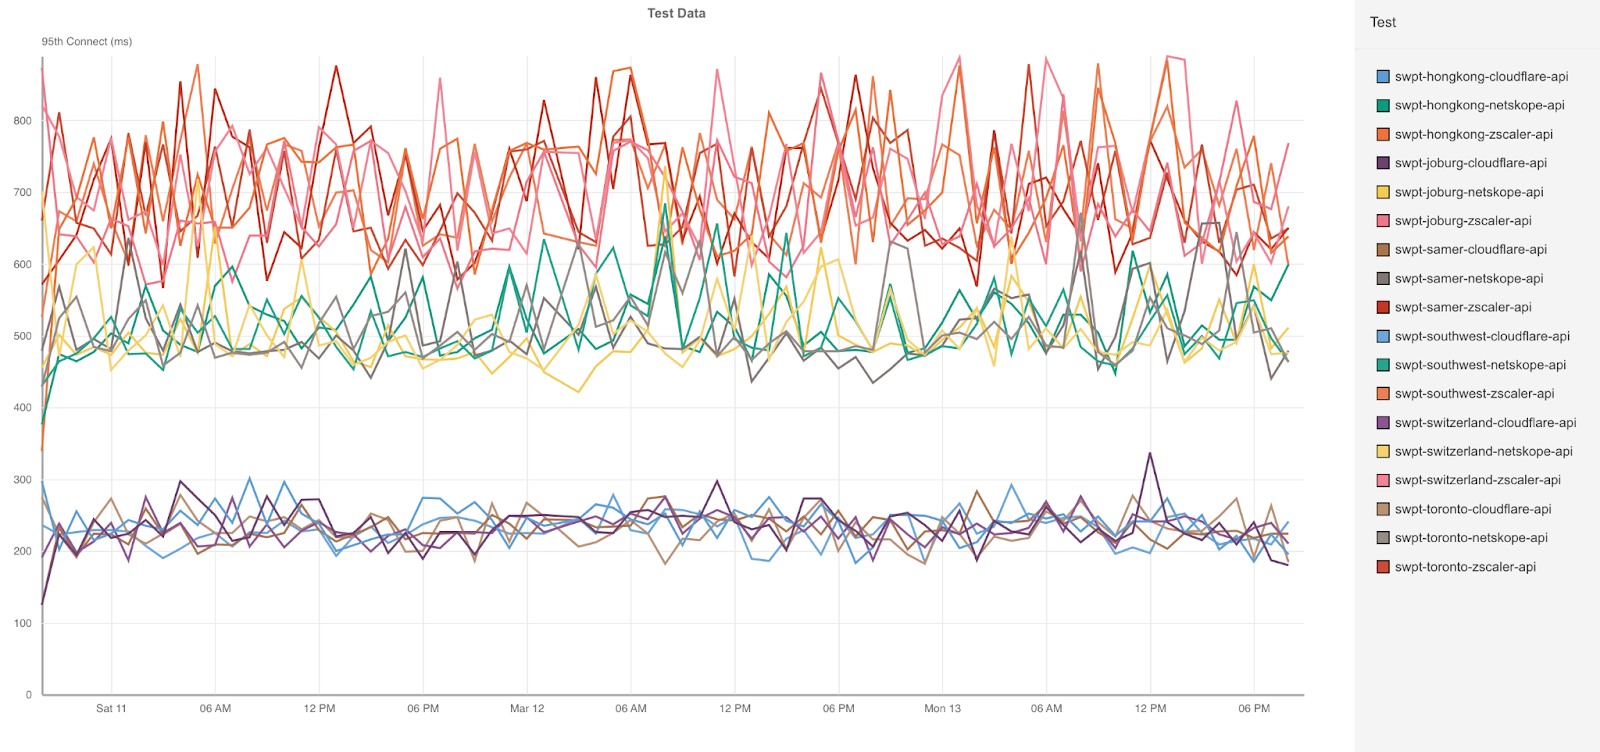
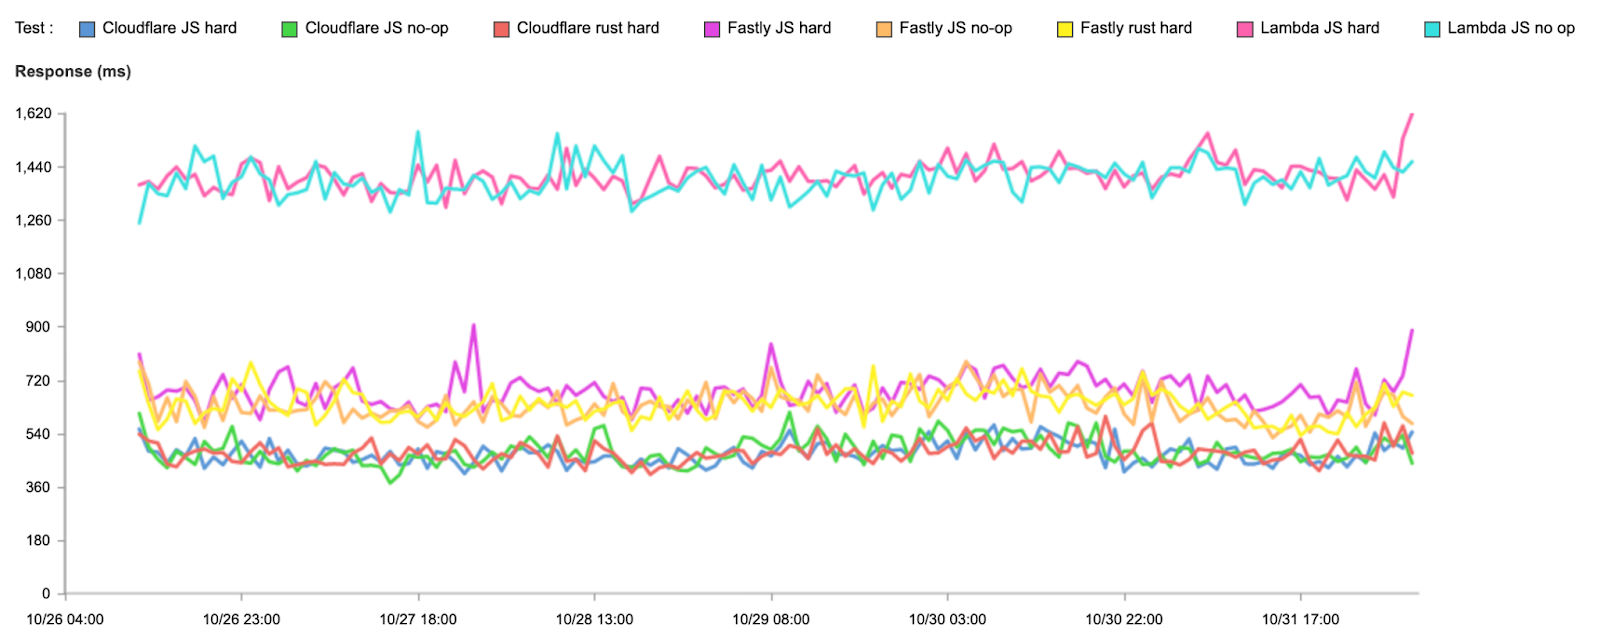
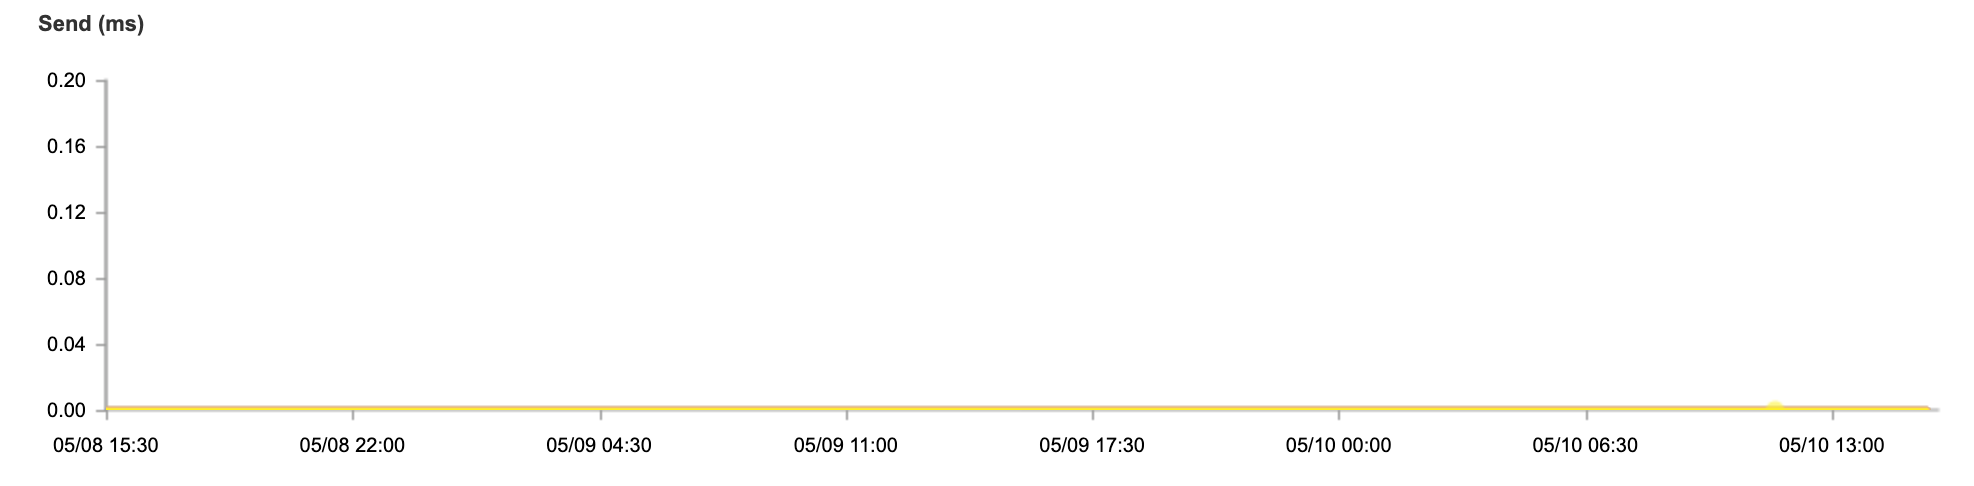
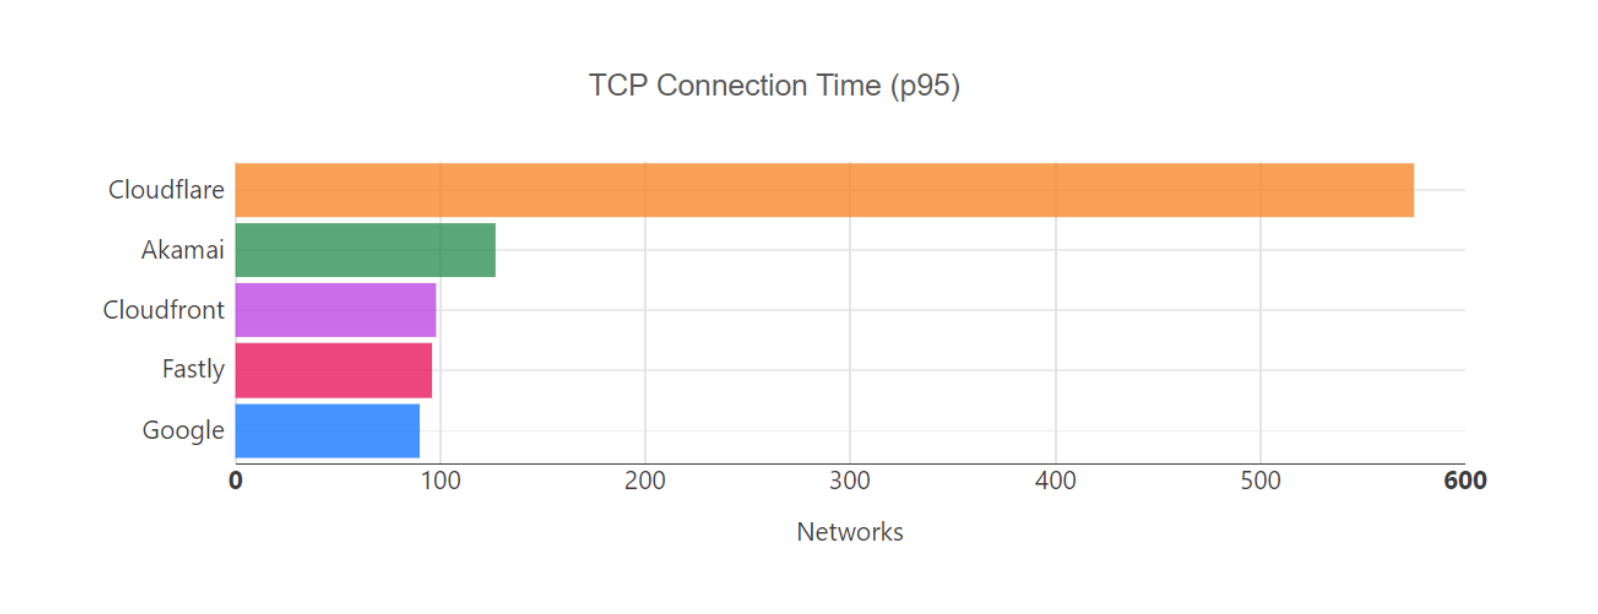
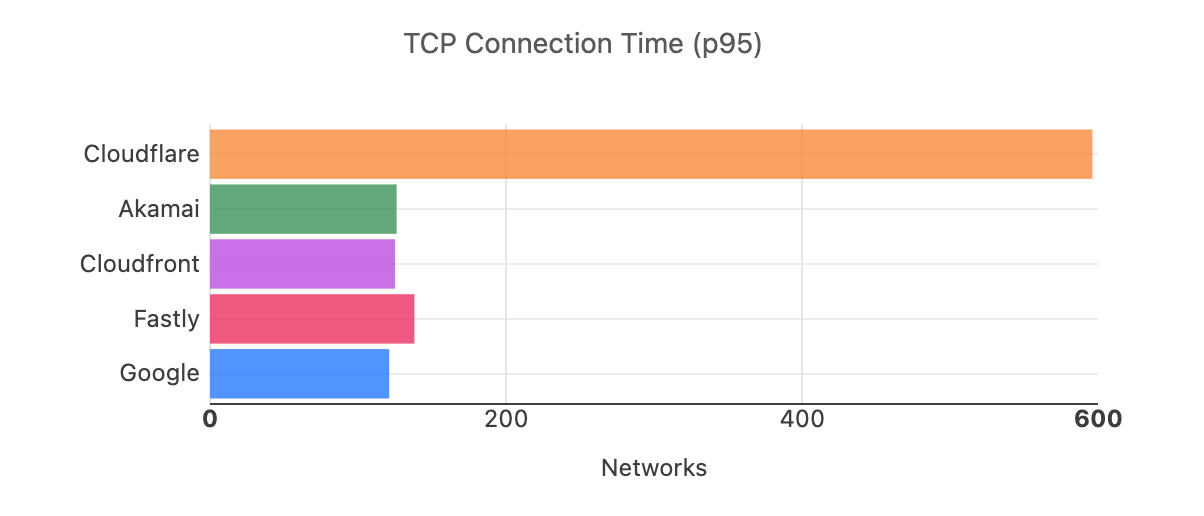
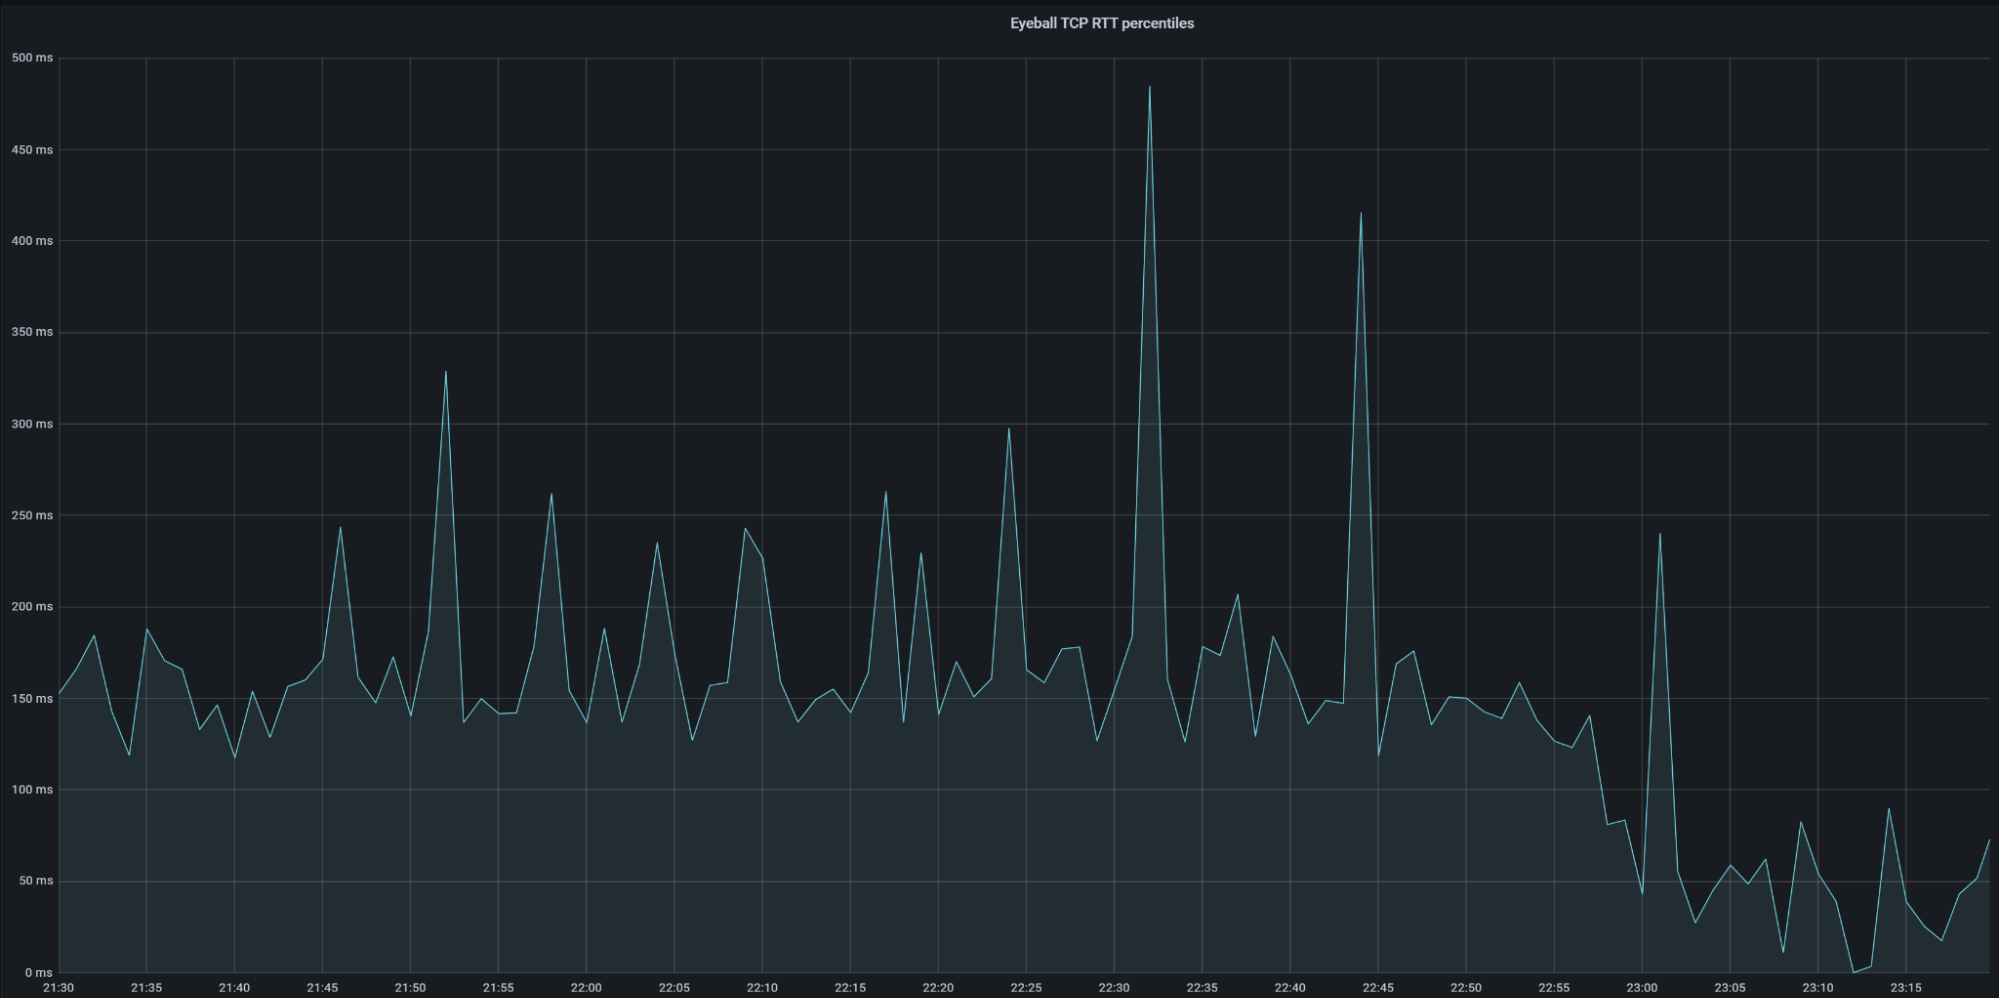
Countries with an abundance of networks, like the United States, have a lot of noise we need to calibrate against. For example, the graph below represents the performance of all providers for a major ISP like AS701 (Verizon Business).
AS701 (Verizon Business) Connect Time (P95) between 2025-08-09 and 2025-09-09

In this chart, the “P95” value, or 95th percentile, refers to one point of a percentile distribution. The P95 shows the value below which 95% of the data points fall and is specifically good at helping identify the slowest or worst-case user experiences, such as those on poor networks or older devices. Additionally, we review the other numbers lower on the percentile chain in the table below, which tell us how performance varies across the full range of data. When we do so, the picture becomes more nuanced.
|
AS701 (Verizon Business) Provider Rankings for Connect Time at P95, P75 and P50 |
||||
|
Rank |
Entity |
Connect Time (P95) |
Connect Time (P75) |
Connect Time (P50) |
|
#1 |
Fastly |
128 ms |
66 ms |
48 ms |
|
#2 |
|
134 ms |
72 ms |
54 ms |
|
#3 |
CloudFront |
139 ms |
67 ms |
47 ms |
|
#4 |
Cloudflare |
141 ms |
68 ms |
49 ms |
|
#5 |
Akamai |
160 ms |
84 ms |
61 ms |
At the 95th percentile for AS701, Cloudflare ranks 4th but at the 75th and 50th, Cloudflare is only 2 milliseconds slower than the fastest provider. In other words, when reviewing more than one point along the distribution at the network level, Cloudflare is keeping up with the top providers for the less extreme samples. To capture these details, it’s important to look at the range of outcomes, not just one percentile.
To better reflect the full spectrum of user experiences, we started using the trimean in July 2025 to rank providers. This metric combines values from across the distribution of data – specifically the 75th, 50th and 25th percentiles – which gives a more balanced representation of overall performance, rather than only focusing on the extremes. Summarizing user experience with a single number is always challenging, but the trimean helps us compare providers in a way that better reflects how users actually experience the Internet.
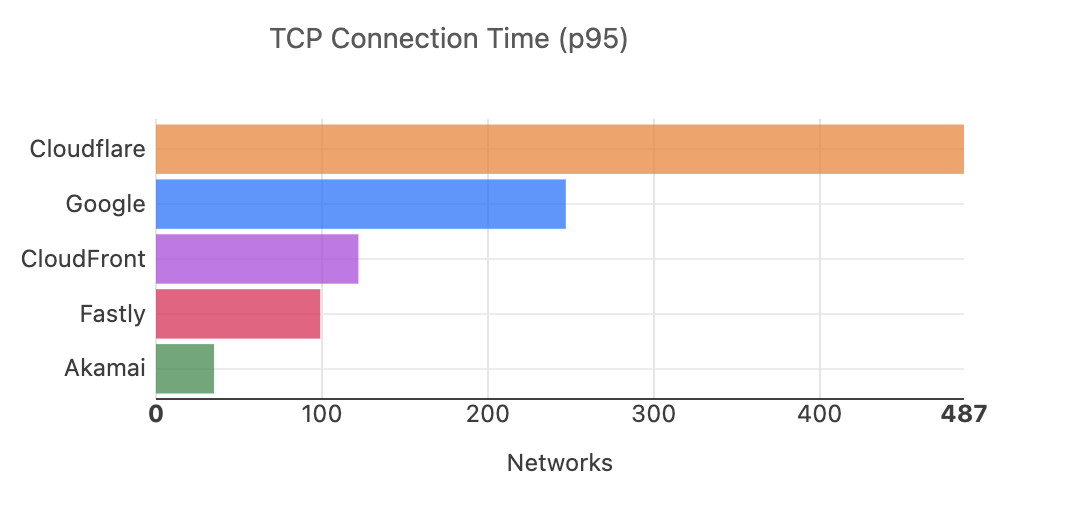
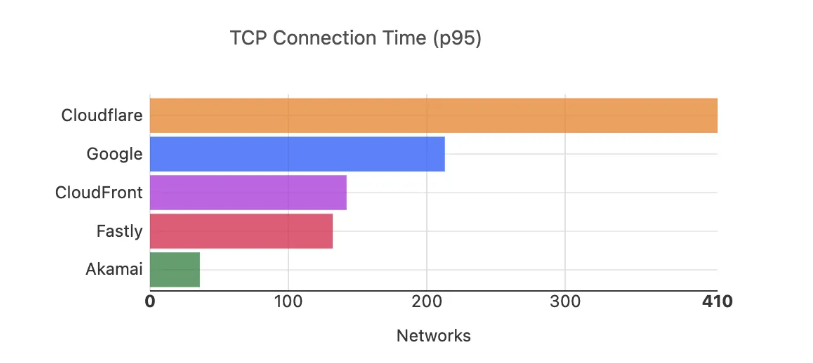
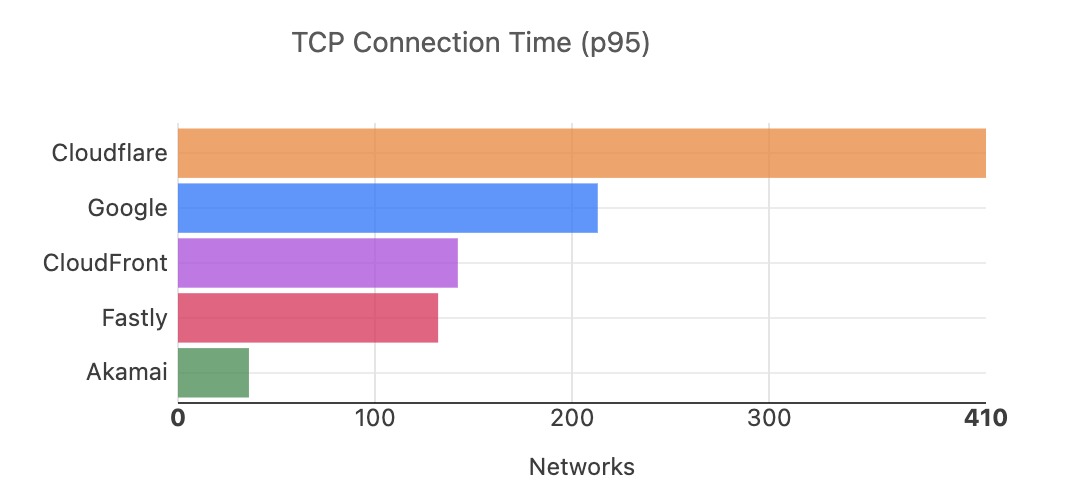
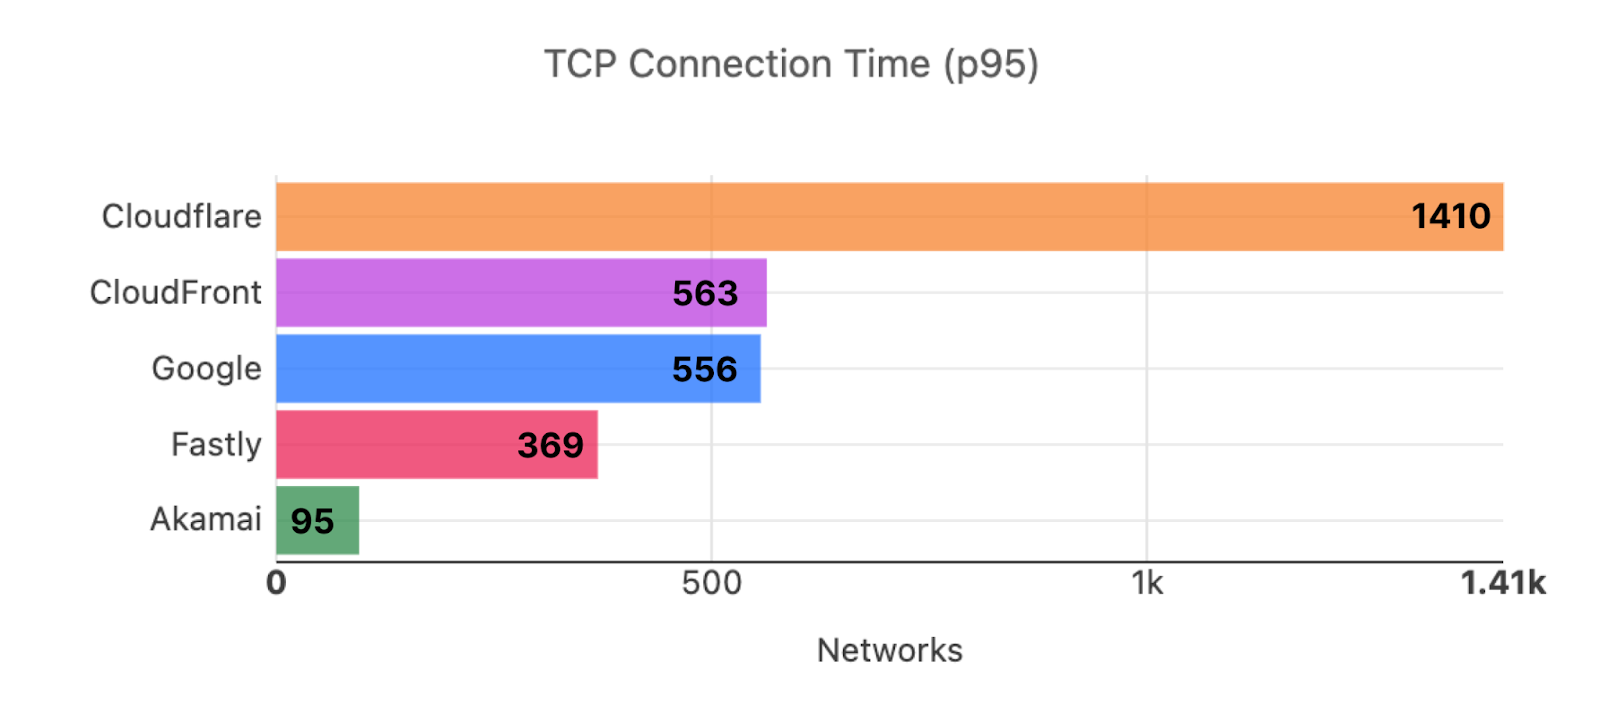
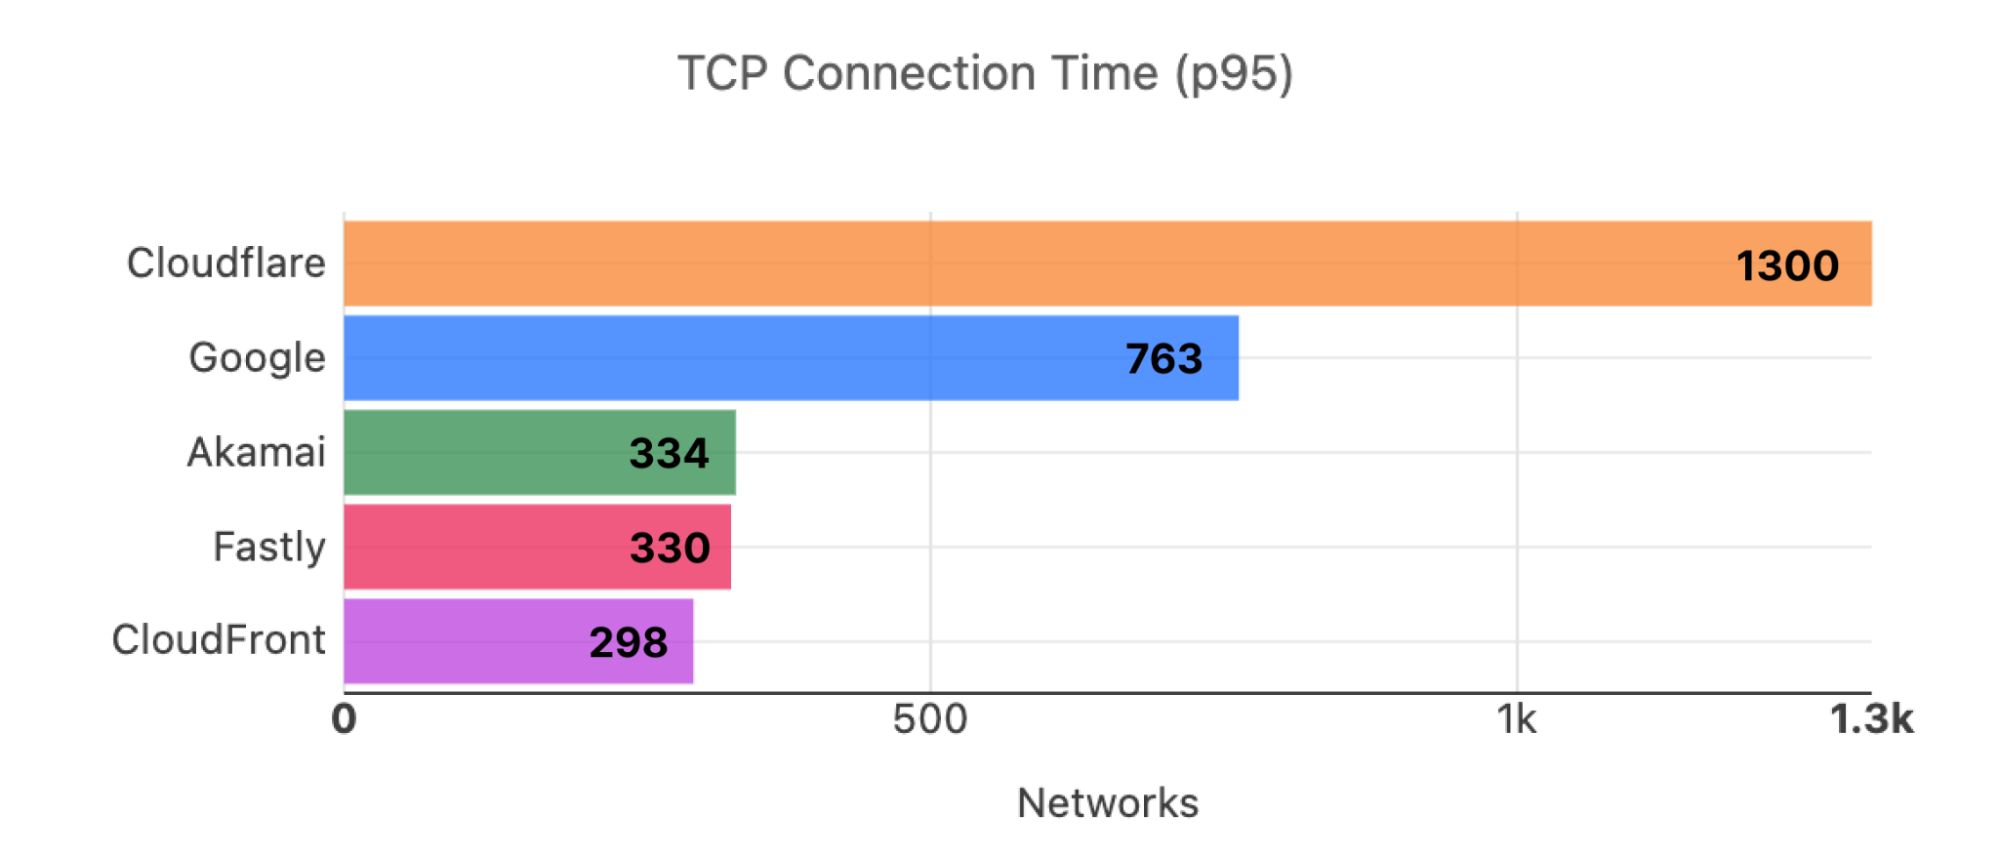
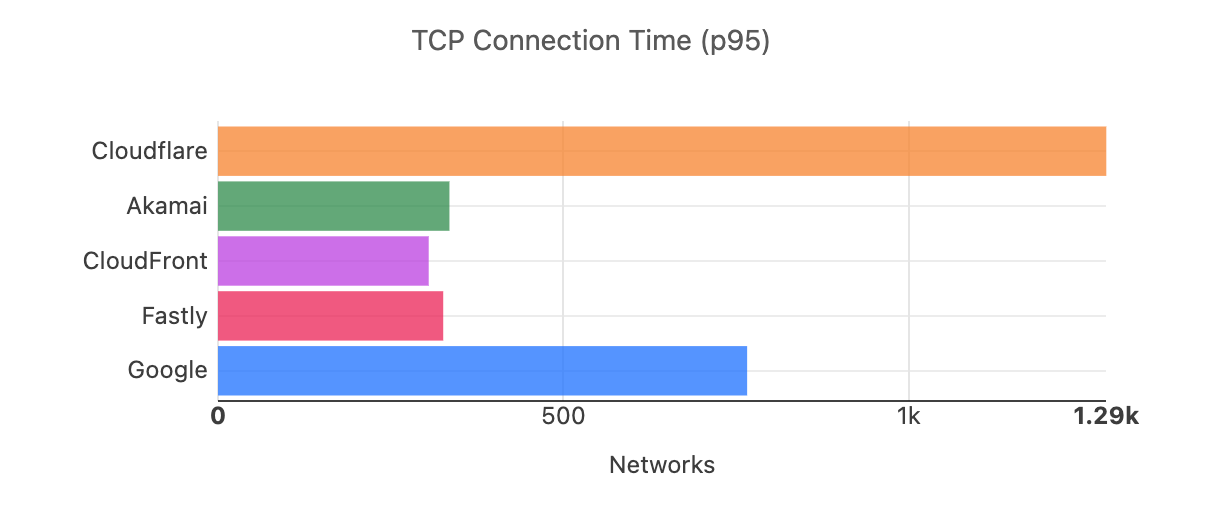
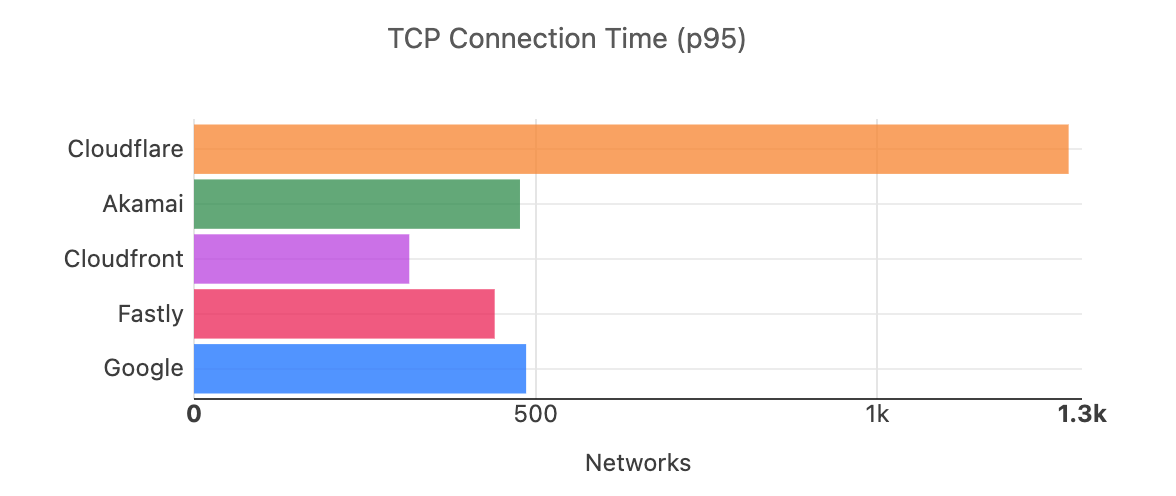
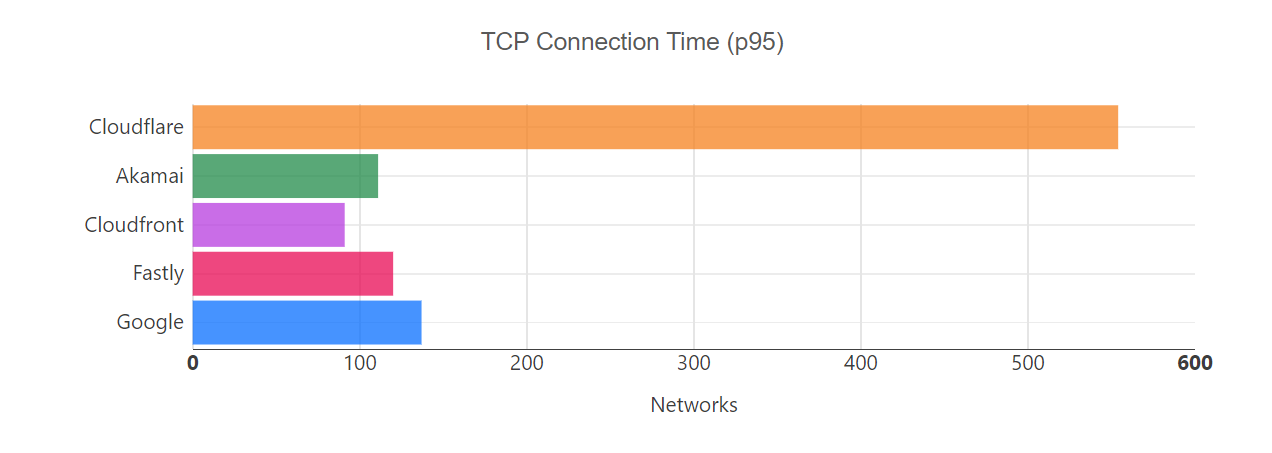
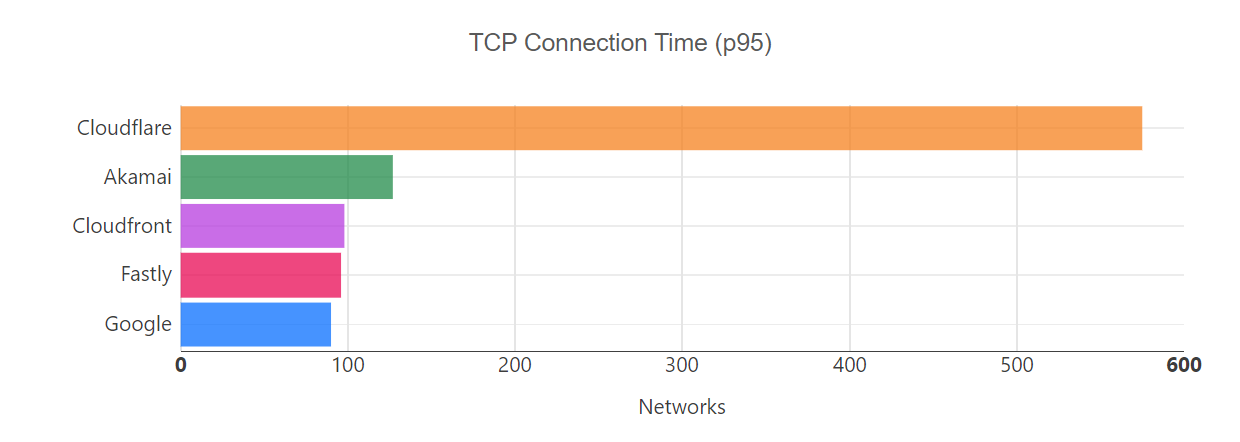
Cloudflare is the fastest provider in 40% of networks in the majority of real-world conditions, not just in worst-case scenarios. Still, the 95th percentile remains key to understanding how performance holds up in challenging conditions and where other providers might fall behind in performance. When we review the 95th percentile across the same date range for all the networks, not just AS701, Cloudflare is fastest across roughly the same amount of networks but by 103 more networks than the next fastest provider. Being faster in such a wide margin of networks tells us that Cloudflare is particularly strong in the challenging, long-tail cases that other providers struggle with.

Our performance data shows that even when we are not the top-ranked provider, we remain exceptionally competitive, often trailing the leader by a mere handful of percentage points. Our strength at the 95th percentile also highlights our superior performance in the most challenging scenarios. Cloudflare’s ability to outperform other providers, in the worst-case, is a testament to the resilience and efficiency of our network.
Moving forward, we’ll continue to share multiple metrics and continue to make improvements to our network —and we’ll use this data to do it! Let’s talk about how.
Cloudflare applies this data to identify regions and networks that need prioritization. If we are consistently slower than other providers in a network, we want to know why, so we can fix it.
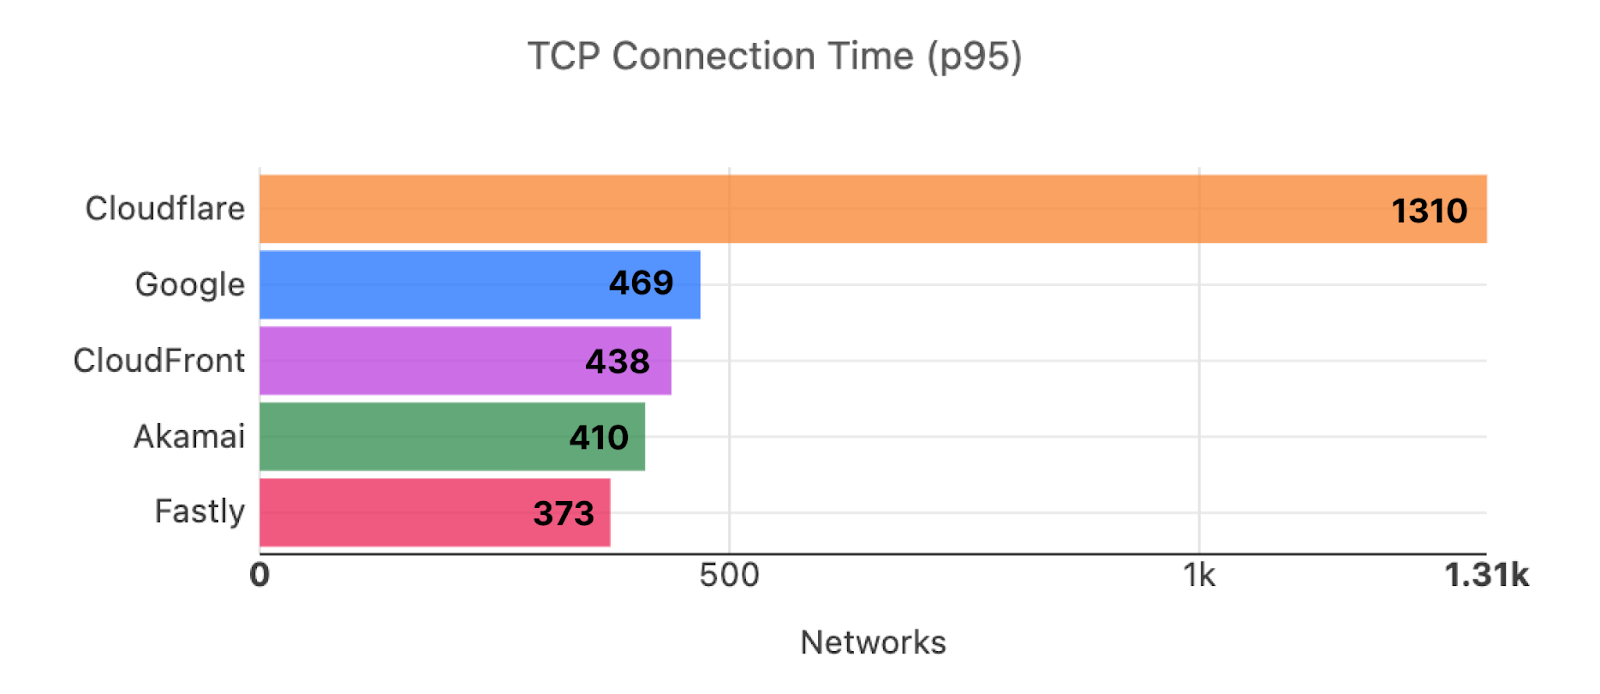
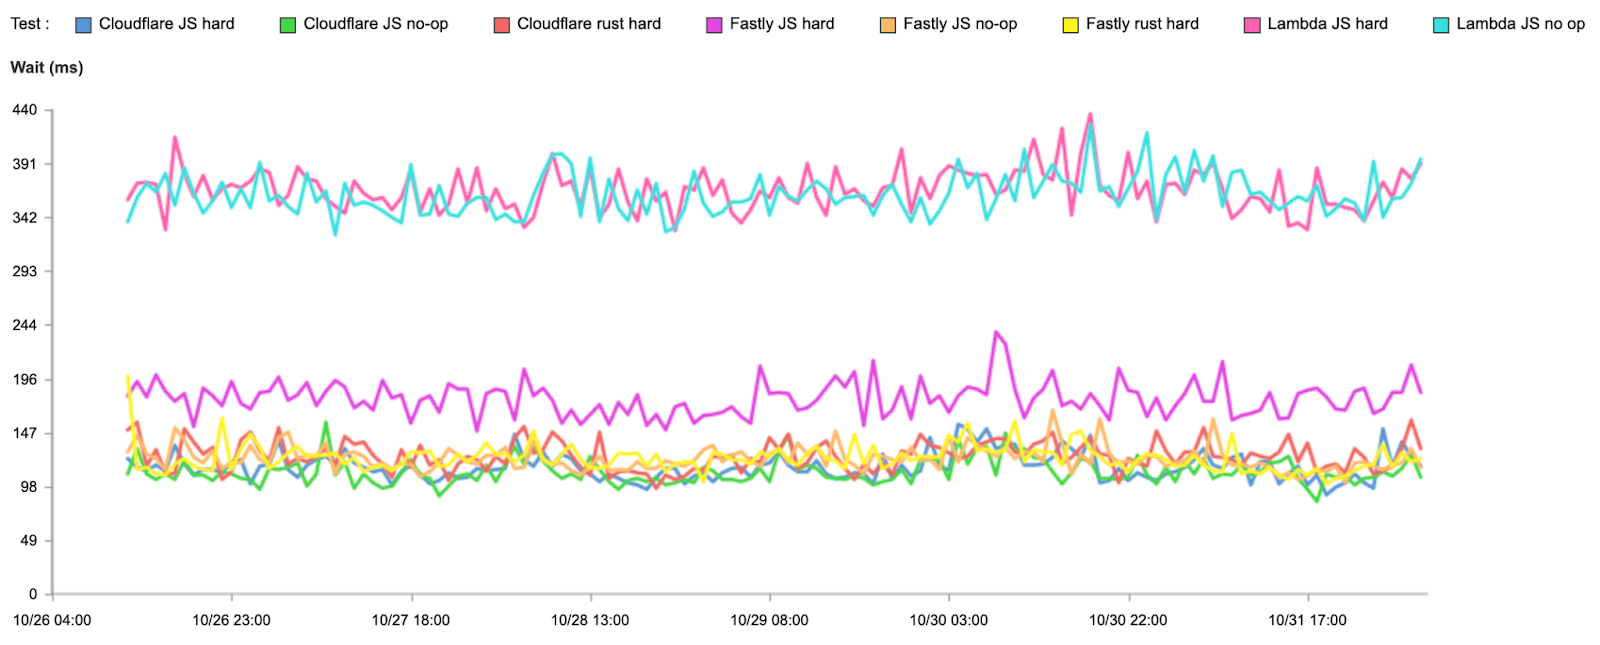
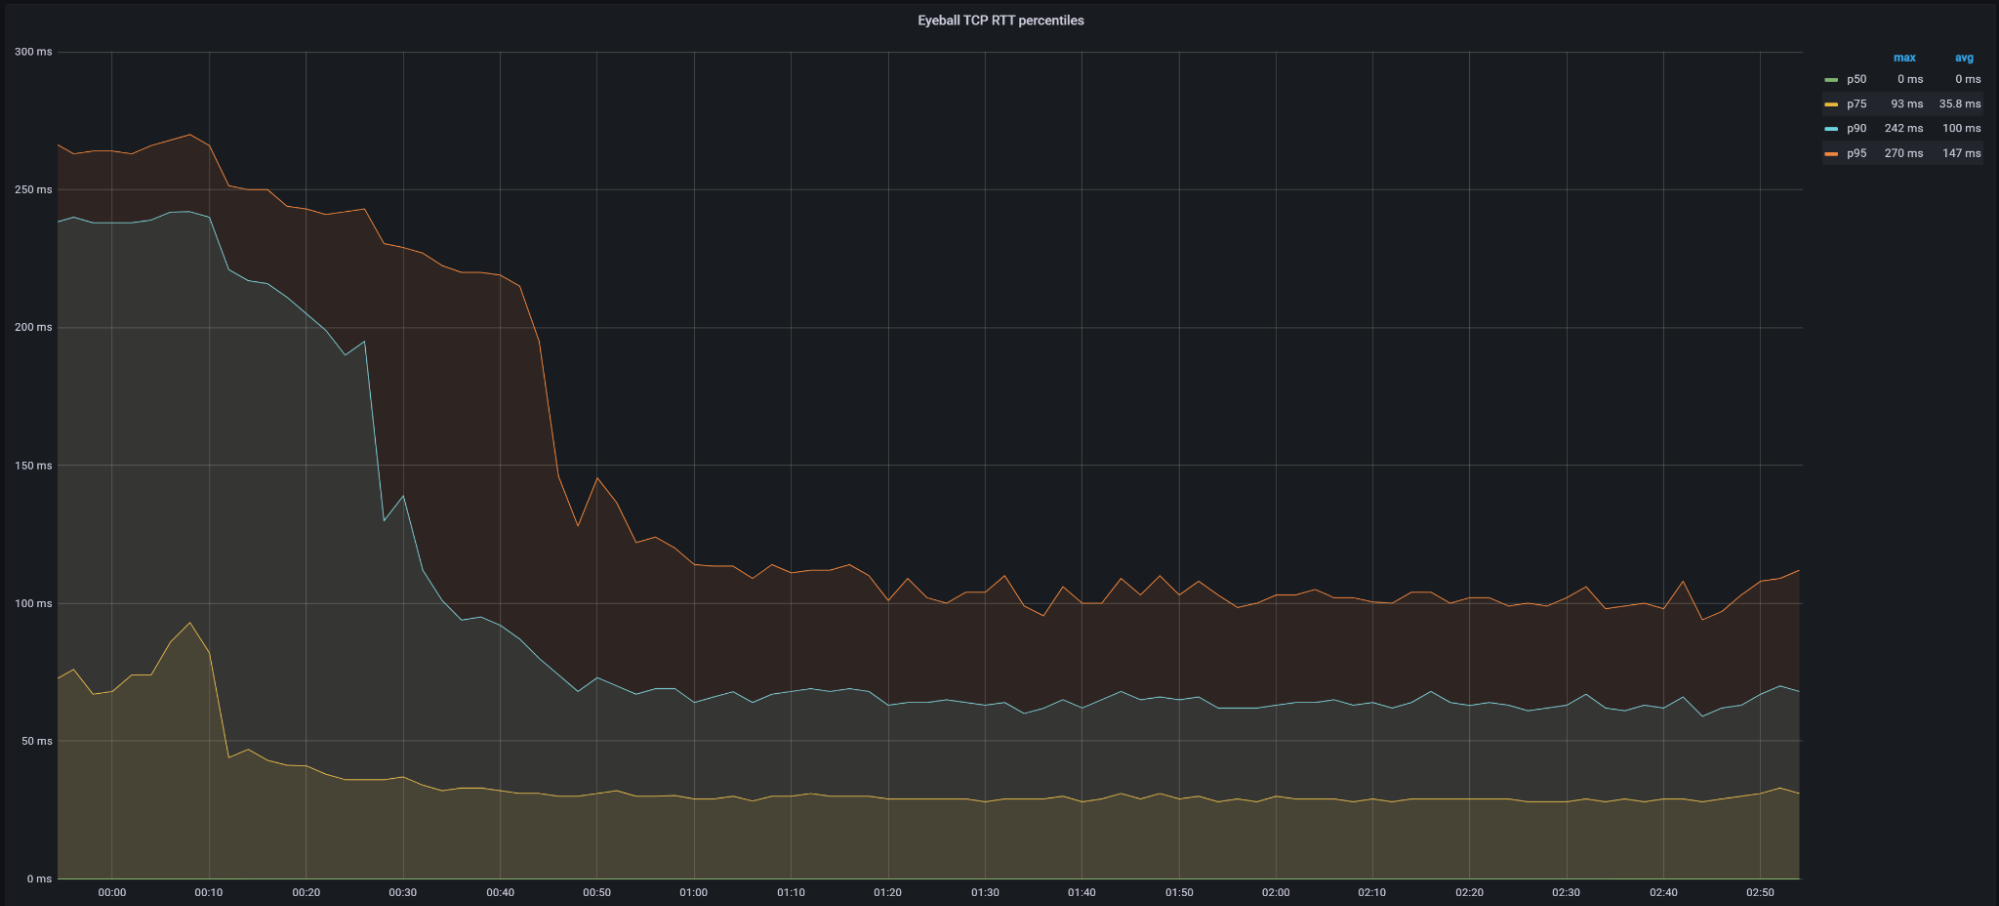
For example, the graph below shows the 95th percentile of Connect Time for AS8966. Prior to June 13, 2025, our performance was suffering, and we were the slowest provider for the network. By referencing our own measurement data, we prioritized partner data centers in the region and almost immediately performance improved for users connecting through AS8966.
Cloudflare’s partner data centers consist of collaborations with local service providers who host Cloudflare’s equipment within their own facilities. This allows us to expand our network to new locations and get closer to users more quickly. In the case of AS8966, adding a new partner data center took us from being ranked last to ranked first and improved latency by roughly 150ms in one day. By using a data-driven approach, we made our network faster and most importantly, improved the end user experience.
TCP Connect Time (P95) for AS8966

We are always working to build a faster network and will continue sharing our process as we go. Our approach is straightforward: identify performance bottlenecks, implement fixes, and report the results. We believe in being transparent about our methods and are committed to a continuous cycle of improvement to achieve the best possible performance. Follow our blog for the latest performance updates as we continue to optimize our network and share our progress.