All posts by João Tomé

Typo traps: analyzing traffic to exmaple.com (or is it example.com?)

Post Syndicated from João Tomé original http://blog.cloudflare.com/typo-traps-analyzing-traffic-to-exmaple-com-or-is-it-example-com/

Typo traps: analyzing traffic to exmaple.com (or is it example.com?)

Typo traps: analyzing traffic to exmaple.com (or is it example.com?)

A typo is one of those common mistakes with unpredictable results when it comes to the Internet’s domain names (DNS). In this blog post we’re going to analyze traffic for exmaple.com, and see how a very simple human error ends up creating unintentional traffic on the Internet.

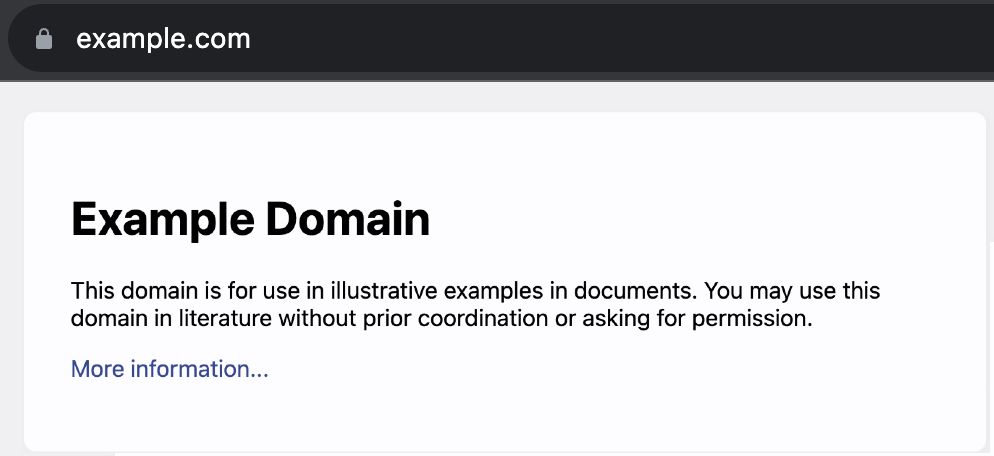
Cloudflare has owned exmaple.com for a few years now, but don’t confuse it with example.com! example.com is a reserved domain name set by the Internet Assigned Numbers Authority (IANA), under the direction of the Internet Engineering Task Force (IETF). It has been used since 1999 as a placeholder, or example, in documentation, tutorials, sample network configurations, or to prevent accidental references to real websites. We use it extensively on this blog.

As I’m writing it, the autocorrect system transforms exmaple.com into example.com, every time, assuming I must have misspelled it. But in situations where there’s no automatic spelling correction (for example, while editing a configuration file) it’s easy for example to become exmaple.

And so, lots of traffic goes to exmaple.com by mistake — whether it was a typoed attempt to reach example.com or due to other random reasons. Fake email accounts in marketing forms are among these reasons (more details below). This phenomenon of "typosquatting" is used by attackers hoping someone misspells the name of a known brand, as we saw in March in our blog “Top 50 most impersonated brands in phishing attacks and new tools you can use to protect your employees from them”. Random typos that cause networks (big or small) problems have also been around for a while.

Here is what the example.com web page shows to a user who goes directly to that domain name:

Typo traps: analyzing traffic to exmaple.com (or is it example.com?)

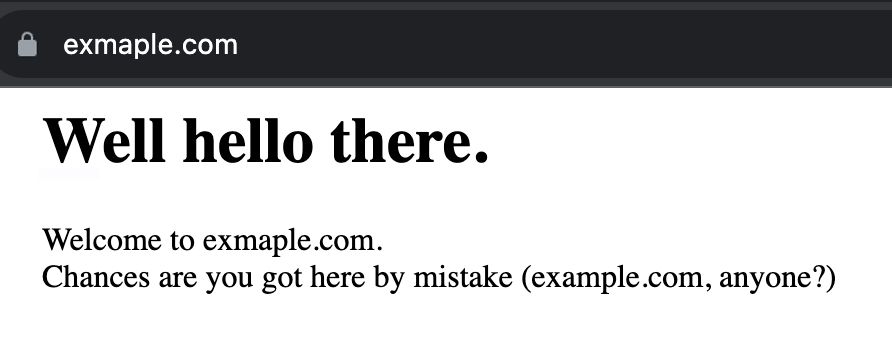
And this is what exmaple.com looks like:

Typo traps: analyzing traffic to exmaple.com (or is it example.com?)

A bit of exmaple.com history

exmaple.com came to us a few years ago from a customer. He registered the domain to prevent malicious exploitation, but got tired of dealing with more traffic than expected — it’s not the first time that this has happened (icanhazip.com was another similar example). Too much traffic does come at a financial cost. So, why would a domain name like exmaple.com, that is not promoted anywhere, have traffic? It shows how unintentional traffic is a real thing with the right domain name. It could also be a result of a typo in network configurations or a misconfigured router, as we’re going to see next.

Let’s explore, then, what traffic goes to exmaple.com by answering some questions.

How much traffic does it get?

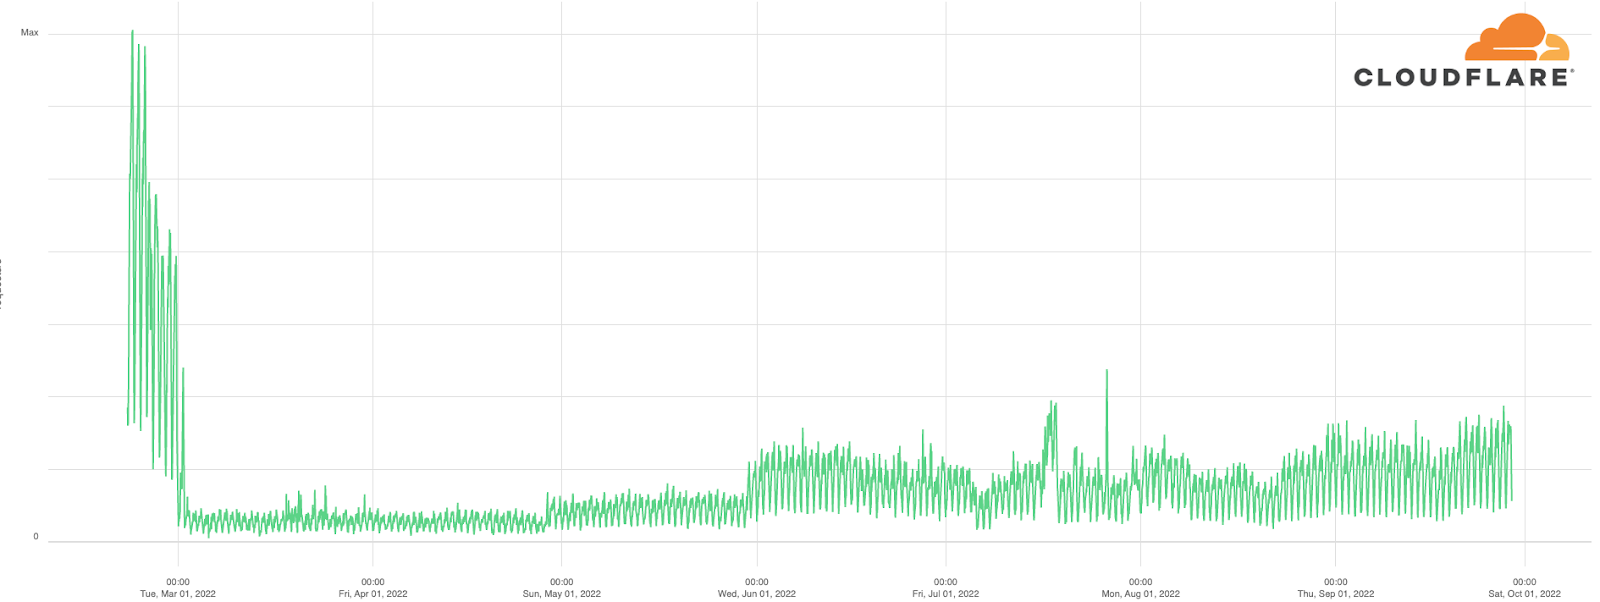
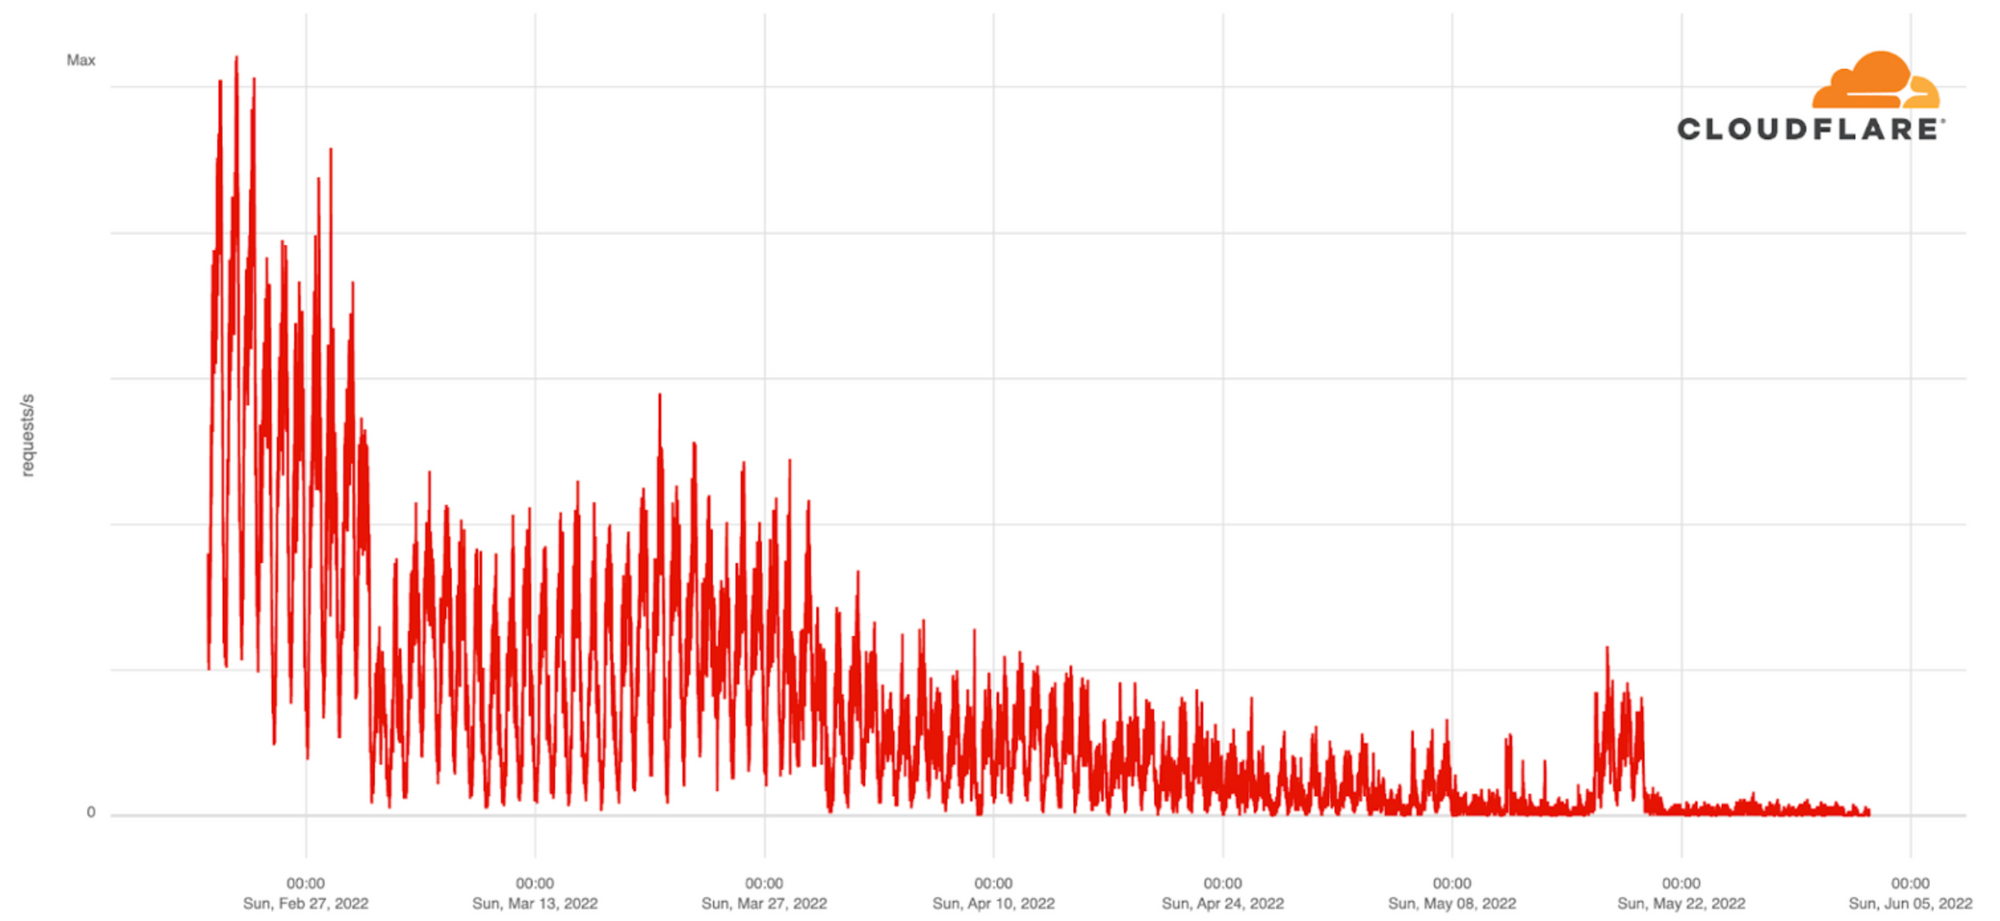
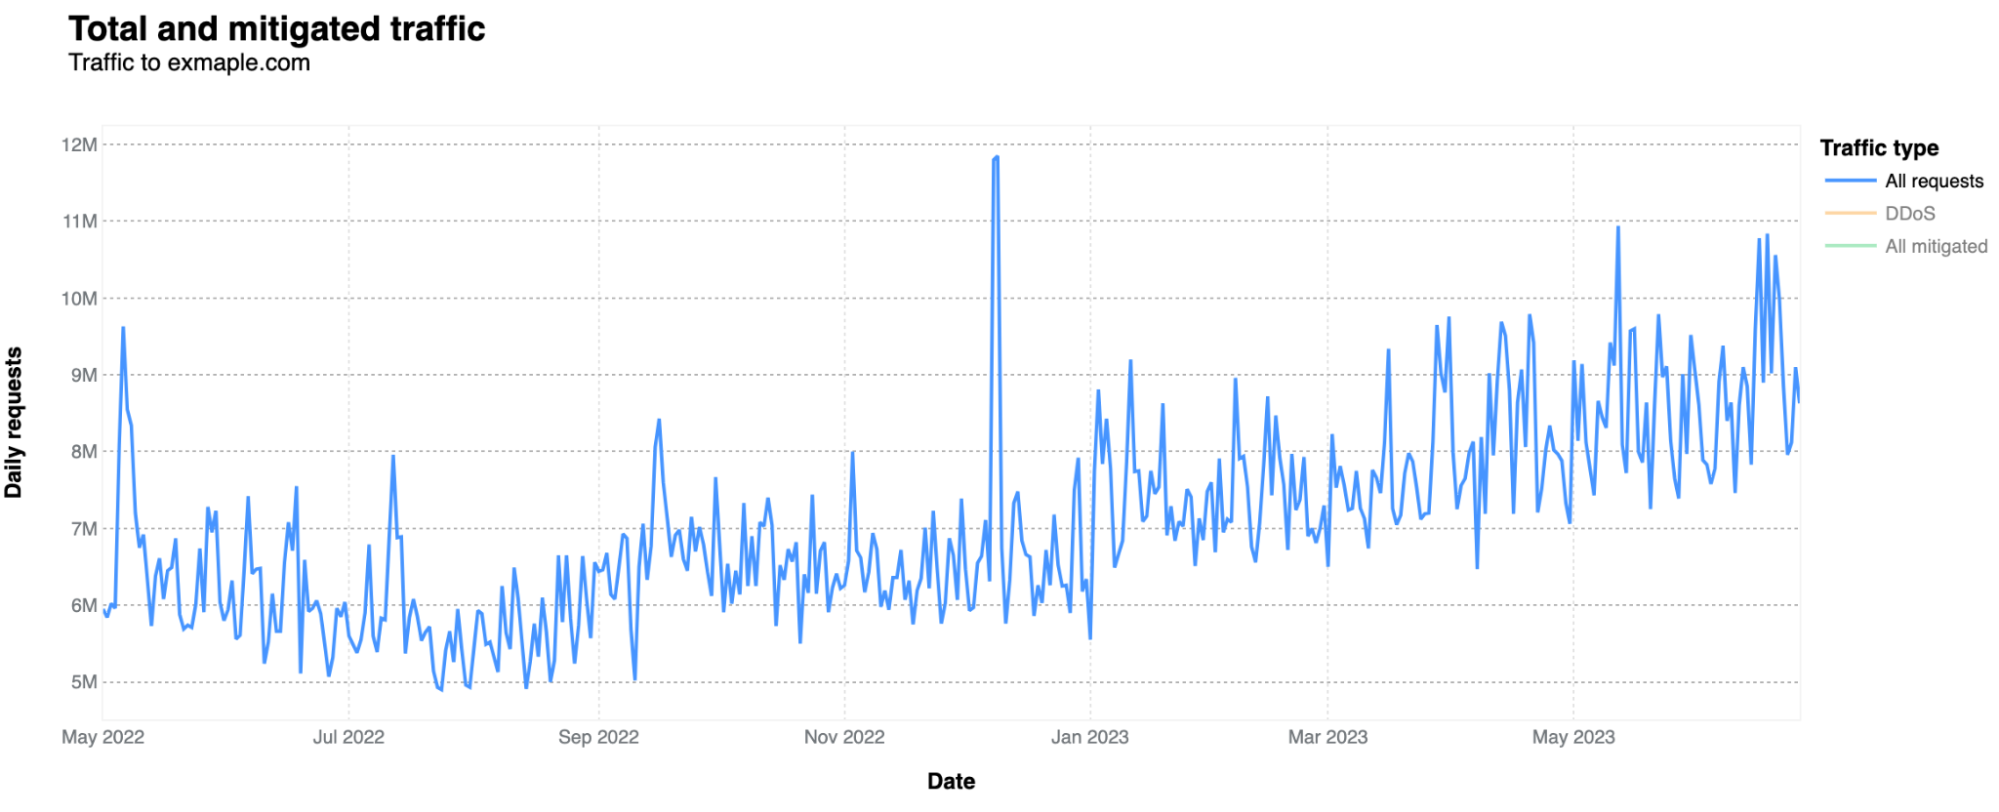
It gets much more traffic than one would expect in terms of HTTP requests, given that it is mostly used because someone or a system/router set by someone, misspelled example.com. In terms of bytes, the numbers are minimal, as this is a very simple site with only a short text sentence, as shown above. Usually, on a daily basis, it doesn’t go over 1 Mbps. In a 12-month period (May 2022-June 2023), it had 2.48 billion HTTP requests, but it has been increasing over recent months. In April 2023, it was 243 million requests, an 8.13 million daily average, against a 6.07 million daily average in June 2022.

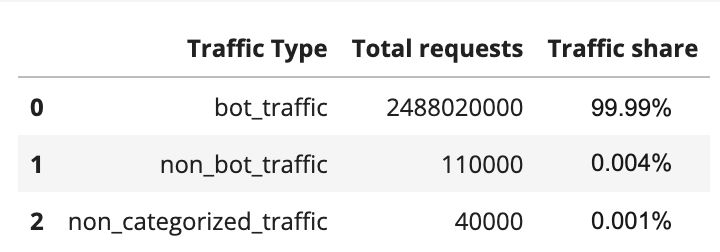
What type of traffic is it? Almost all HTTP traffic that goes to exmaple.com is categorized as bot-related. That’s around 99.99%: 2.48 billion requests were from bots, 110,000 were not from bots, and 40,000 we weren’t able to categorize. This already gives us some information, showing that the majority of traffic is not a typical user simply adding exmaple.com by mistake to some documentation or tutorial. This is mostly automated traffic (more on that below).

Typo traps: analyzing traffic to exmaple.com (or is it example.com?)

There are also a few peaks worth mentioning. There’s a clear spike in bot traffic on December 8 and 9, 2022 (11.8 and 11.85 million requests, respectively), the week after Cyber Monday week.

Typo traps: analyzing traffic to exmaple.com (or is it example.com?)

From which countries are requests coming from? The top countries include France, Japan, Germany, and the US. Below, we’re going to check why this happens by looking at the autonomous system (ASNs) perspective. Never forgetting that connected networks or AS’s make up the Internet.

How about HTTP protocols?

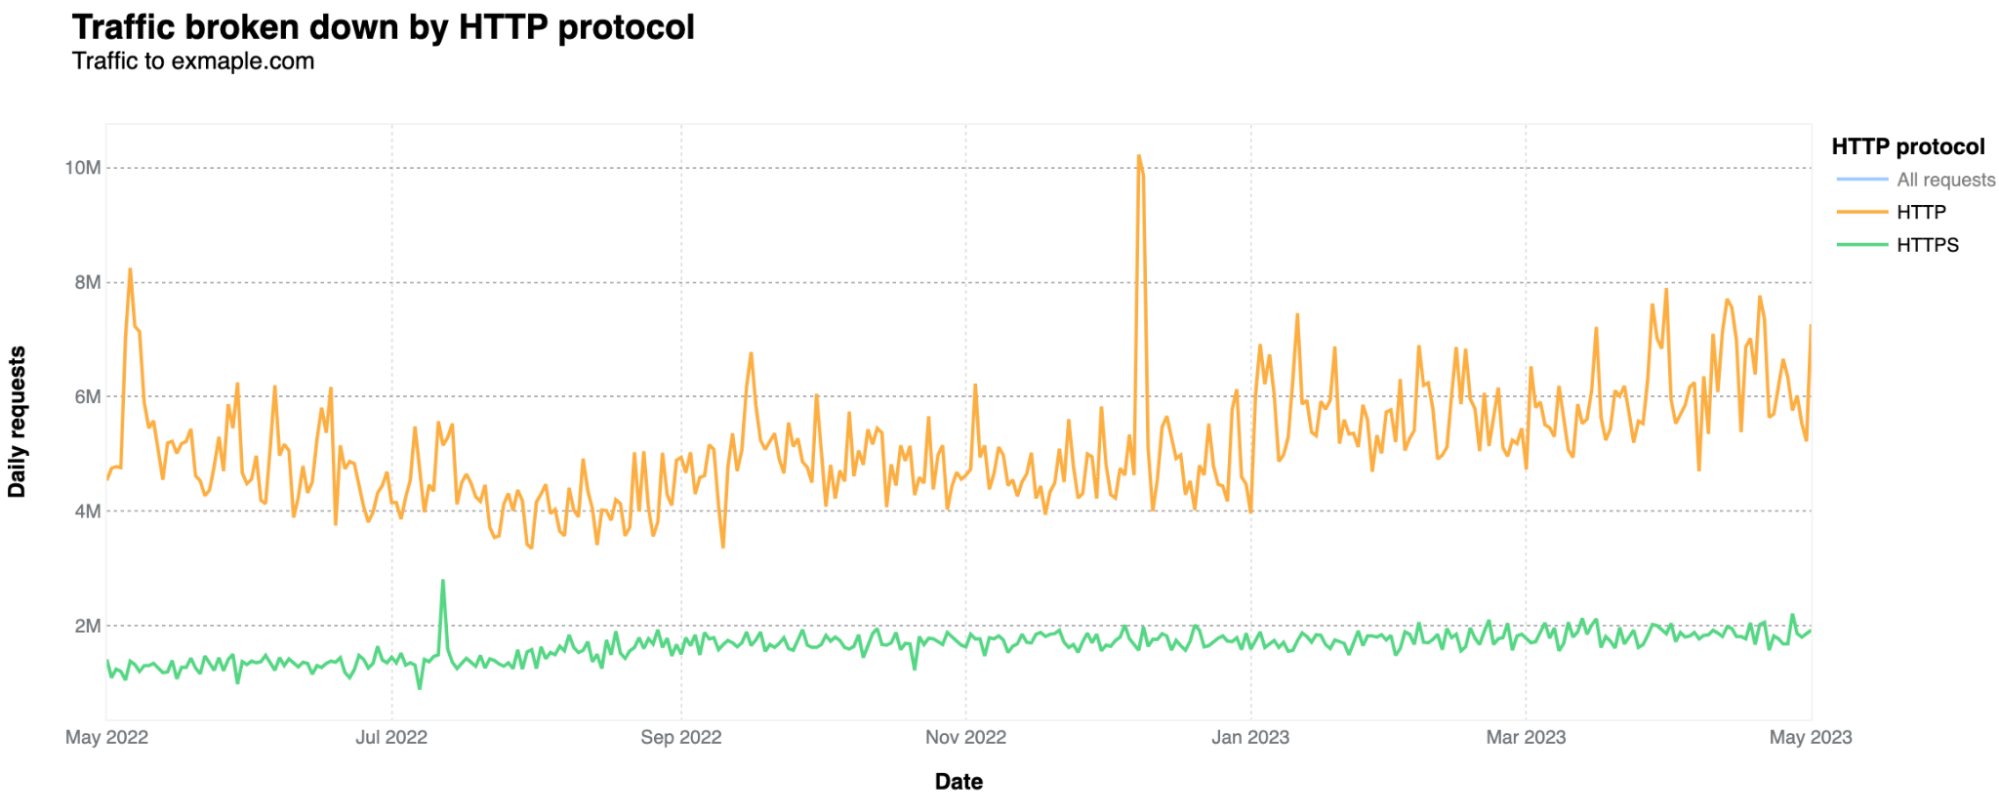
In terms of the HTTP protocols, the majority uses unencrypted HTTP only, accounting for 76% of all requests, while HTTPS represents 24%. That is actually unusual in the modern day Internet. As Cloudflare Radar data shows, excluding bots, HTTPS represents 99.3% of all requests in a general Cloudflare perspective, and its 80.8% of HTTPS for bots-only traffic. HTTPS adds a layer of security (SSL/TLS encryption), ensuring data remains confidential.

HTTP is definitely more used by automated traffic, given that HTTPS is more used for human consumption, as browsers tend to prioritize HTTPS. Only 6% of human-related requests use HTTP (the rest is HTTPS). That HTTP percentage jumps to 76%, when considering automated requests-only.

Typo traps: analyzing traffic to exmaple.com (or is it example.com?)

Is exmaple.com the target of cyber attacks?

The short answer is yes. But it’s a very low percentage of requests that are mitigated. The biggest spike in application layer attacks was on December 9, 2022, with 560k HTTP daily requests categorized as DDoS attacks. Nothing of large scale, but that said, small attacks can also take down under-protected sites. WAF mitigations had a 10k spike on November 2, 2022.

Generating the most traffic: a French ISP

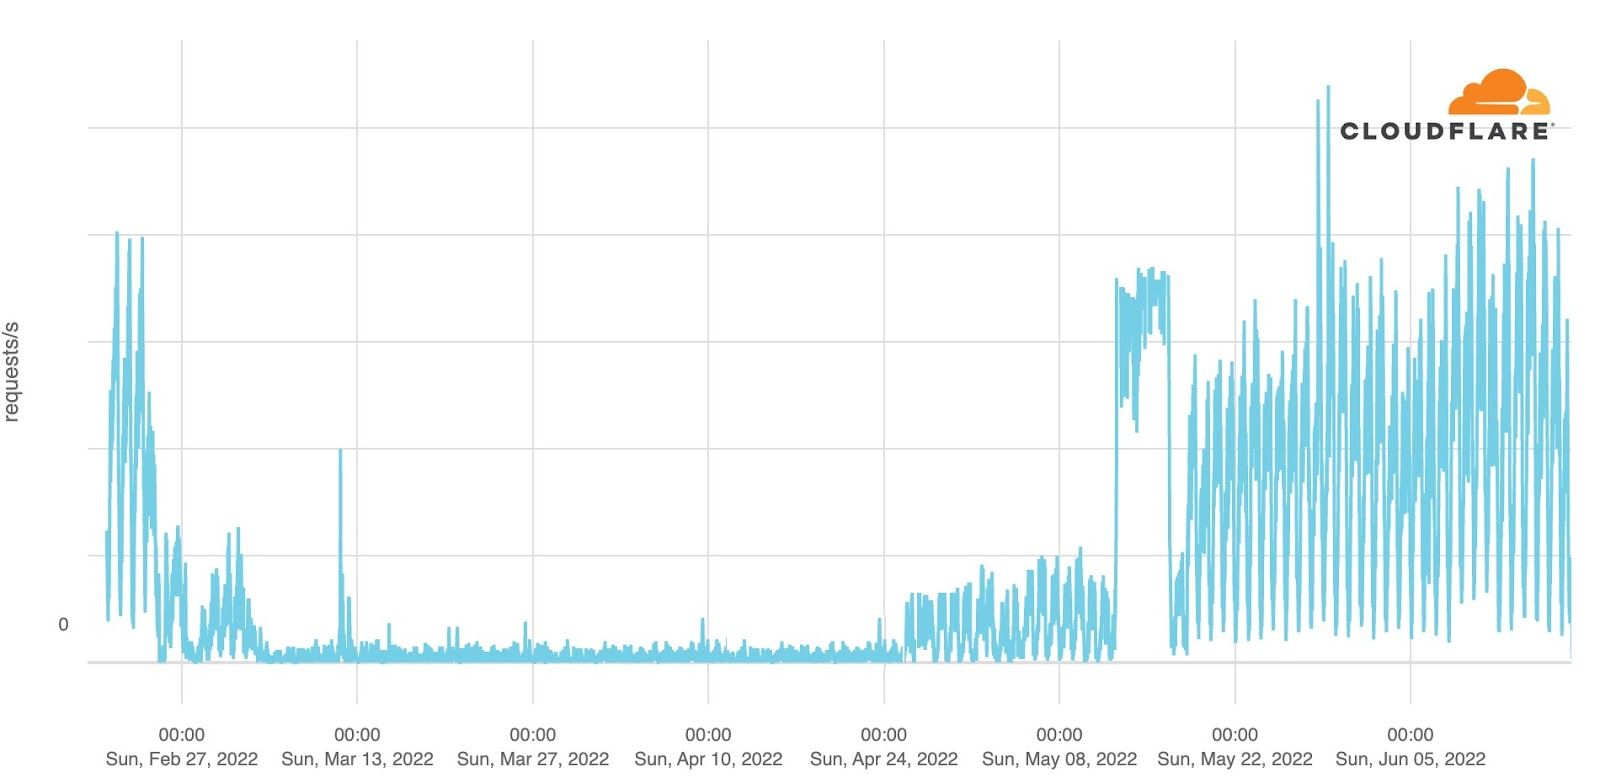
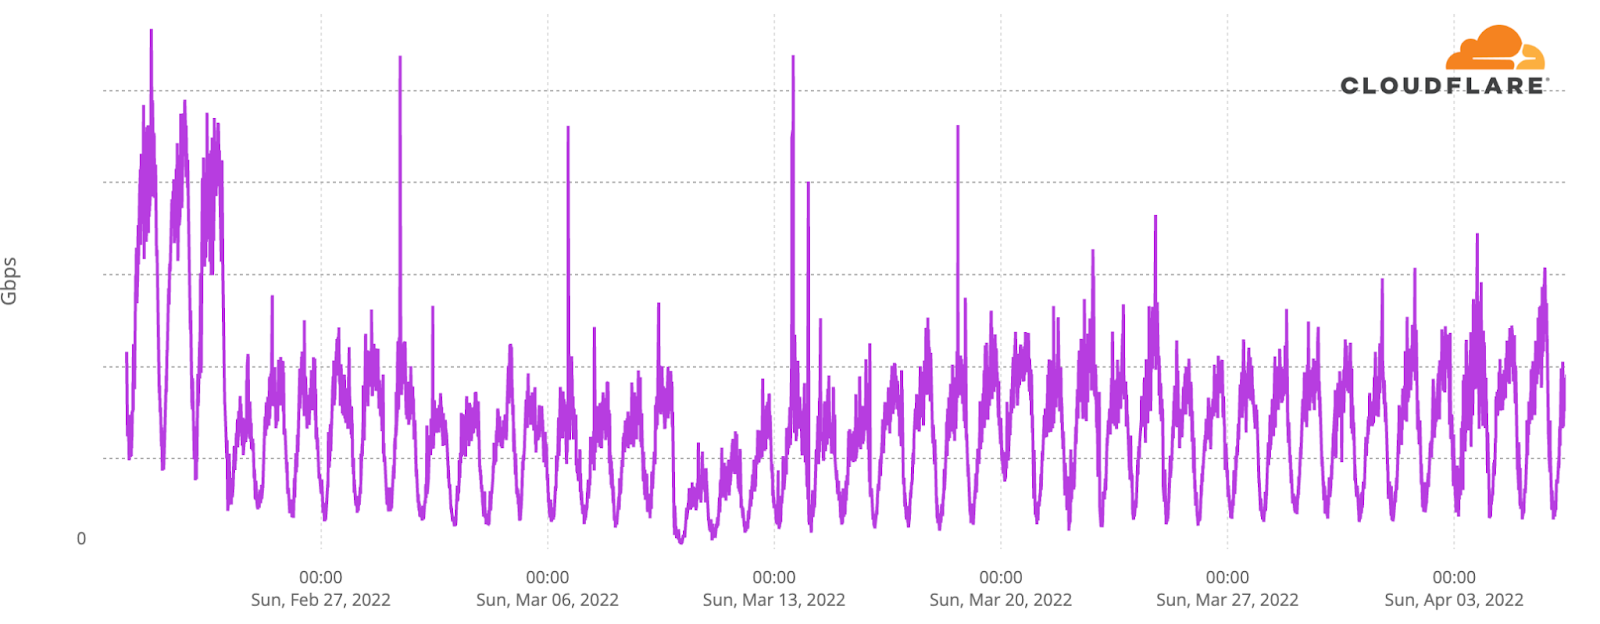
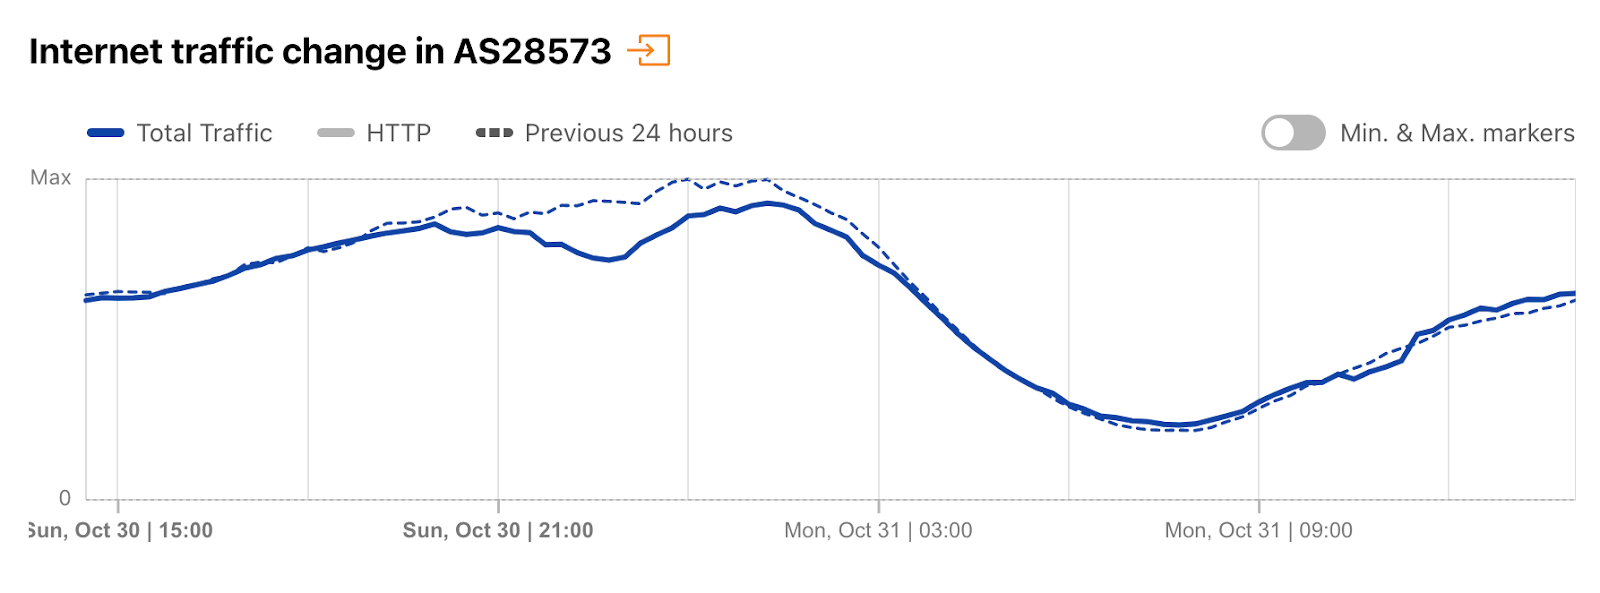
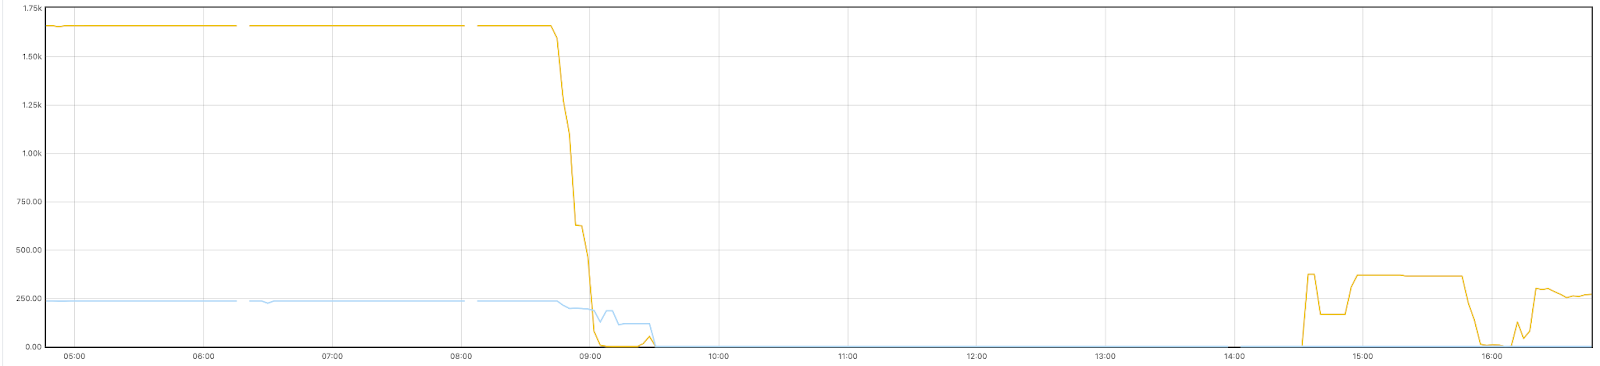
What drives most of the traffic are very specific ASNs. In this case, the dominant one is one of France's main Internet operators, Bouygues Telecom. Its AS5410 is generating the most traffic to exmaple.com, followed by Google Cloud, in Japan. Bouygues Telecom traffic to exmaple.com means more than three million daily requests at least since February 2023. Here’s the AS5410 over time traffic:

Typo traps: analyzing traffic to exmaple.com (or is it example.com?)

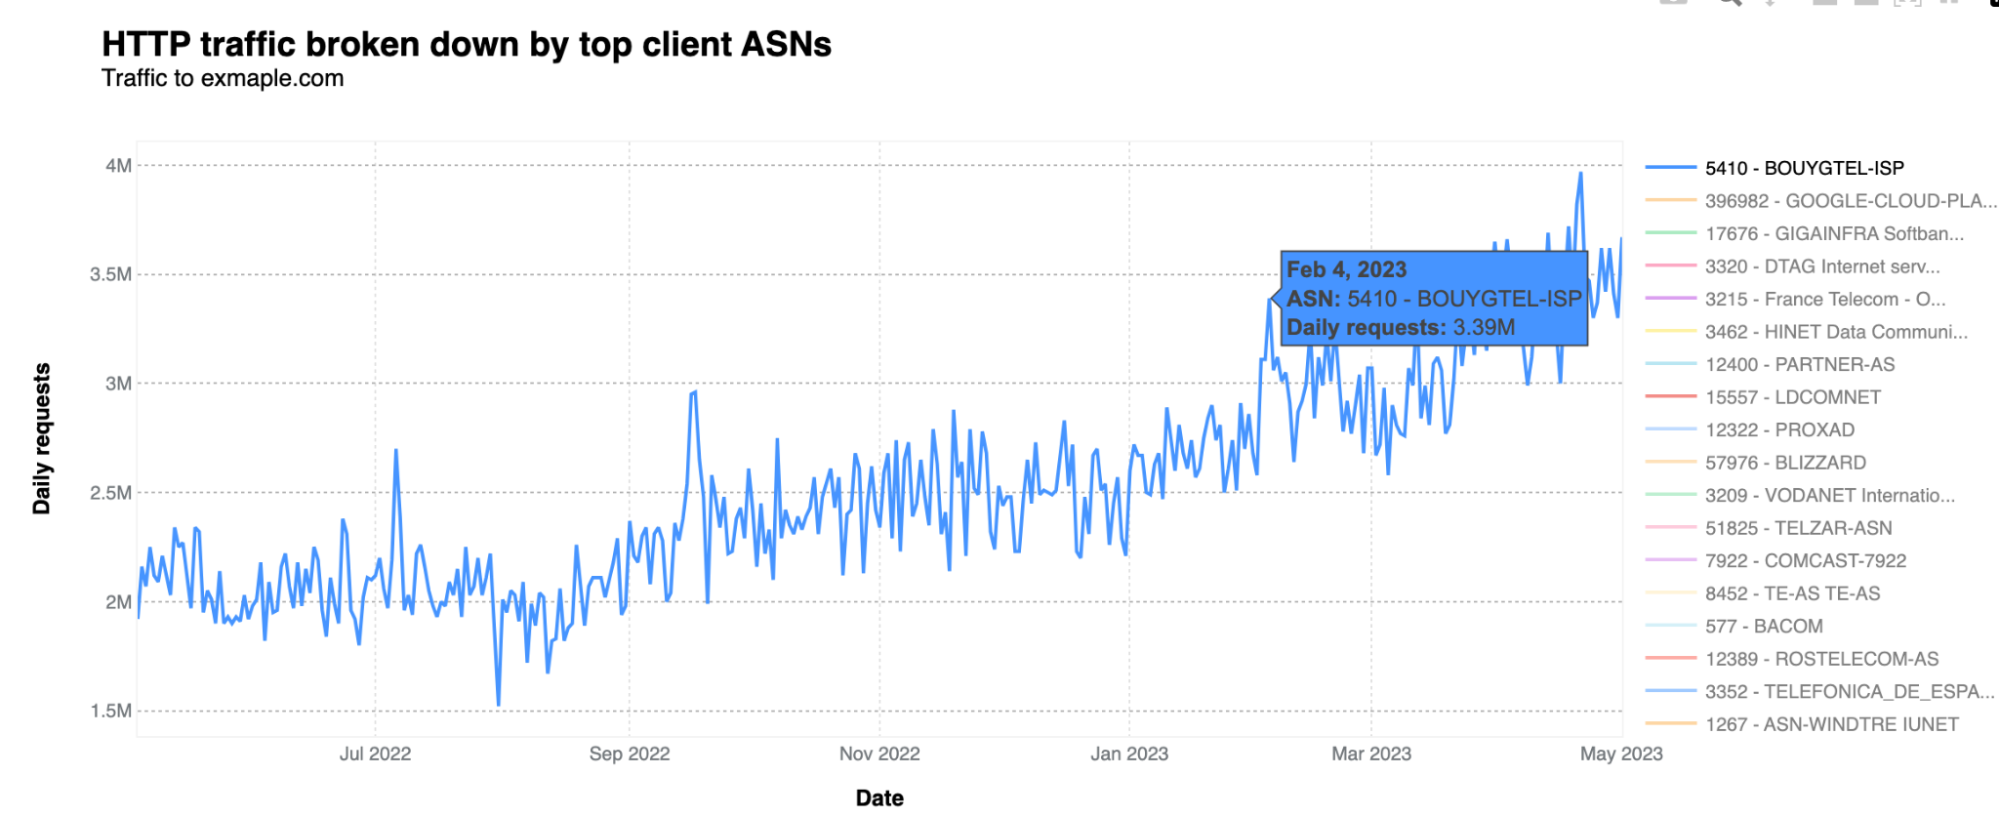
We contacted Bouygues Telecom to let them know a couple of weeks ago, and shared information about where we were seeing traffic from. So far, they haven’t found the needle in the haystack sending traffic to exmaple.com, potentially related to some erroneous configuration.

And since, exmaple.com is not a malicious site, so there’s no harm, no foul. However, one could wonder what might happen if this were a malicious domain. Identifying and resolving misconfigurations is important for network administrators to ensure efficient and secure network operations.

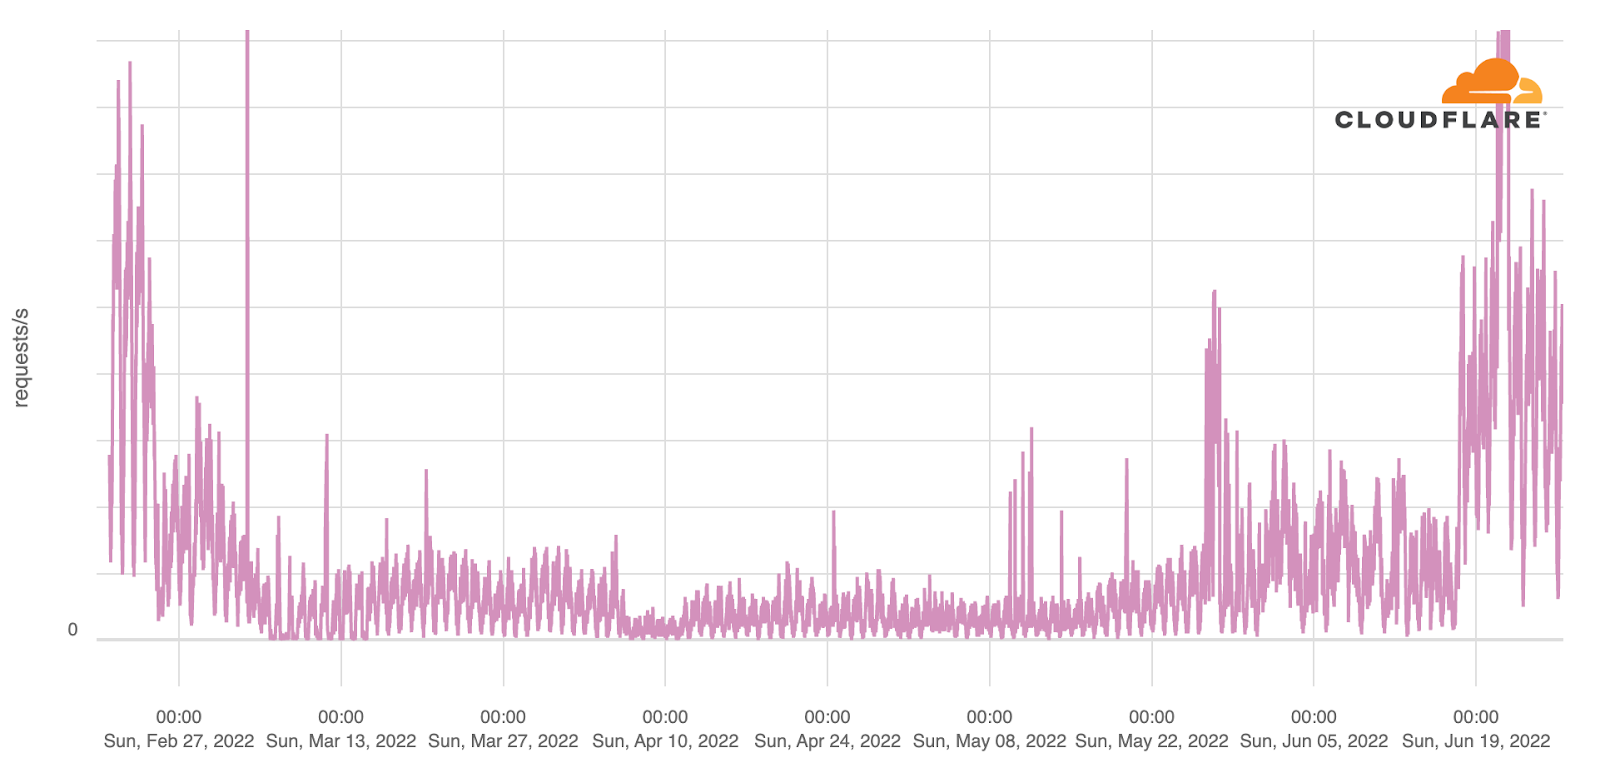
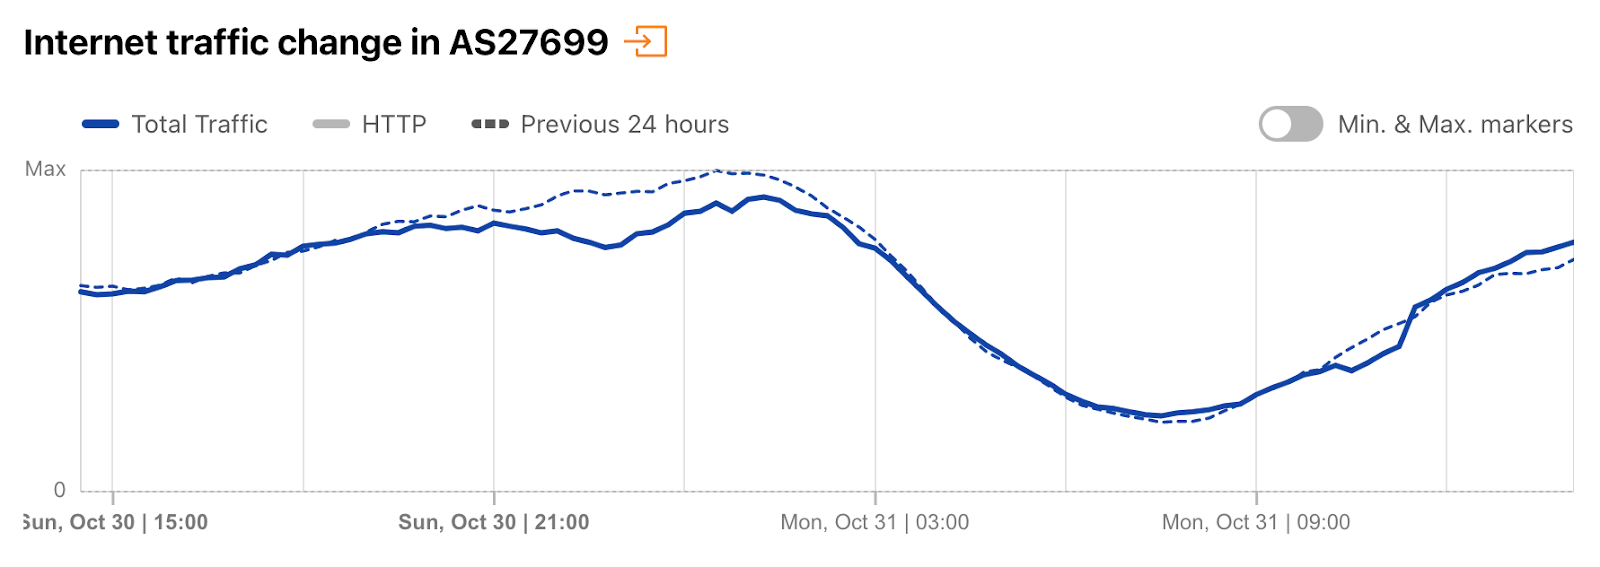
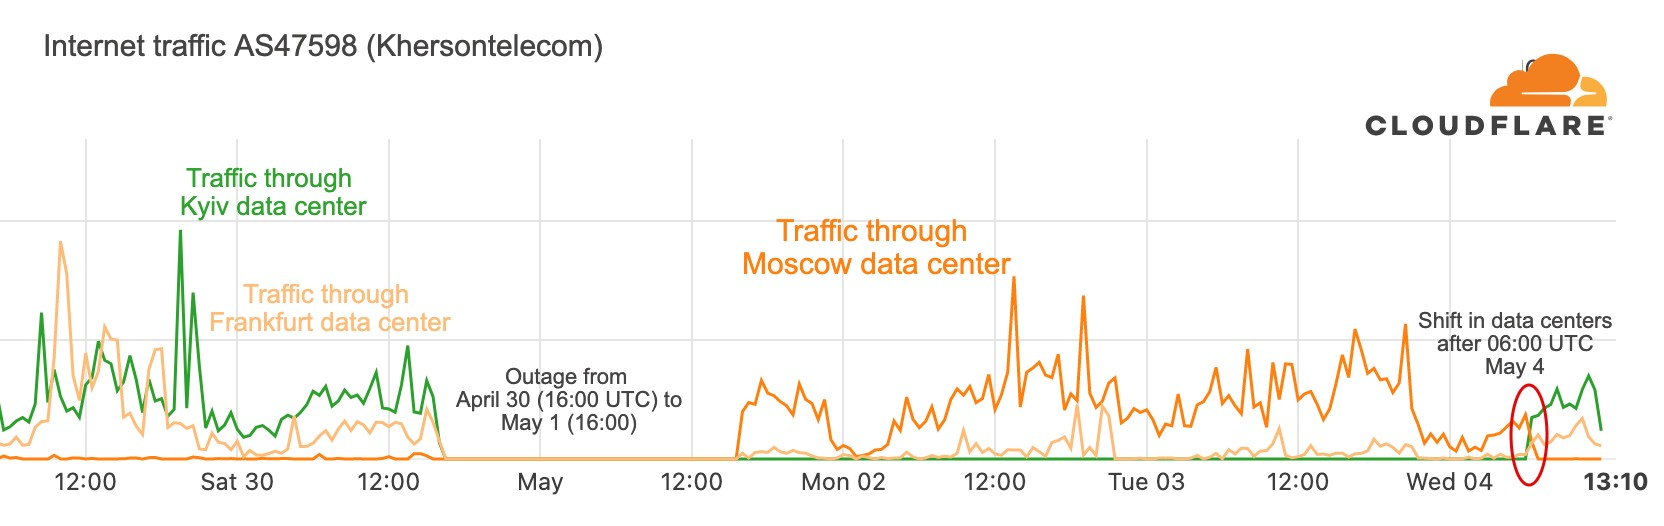
There are a few other ASN-related oddities. A major spike in traffic on December 8, 2022, with 5.84 million HTTP requests on a single day, came from the Netherlands-based AS49981, Worldstream (an Infrastructure-as-a-Service provider). And on March 28-29, 2023, it was Russian Rostelecom AS12389, with a double spike of around 1.8 million requests per day. On June 18, 2022, it was German Deutsche Telekom AS3320, and on May 6, 2022, there was a 2.31 million HTTP requests daily spike from Bell Canada’s ISP, AS577, just to mention those with clearer spikes.

Here is the list that associates countries with the ASNs that are generating more traffic to exmaple.com:

Typo traps: analyzing traffic to exmaple.com (or is it example.com?)

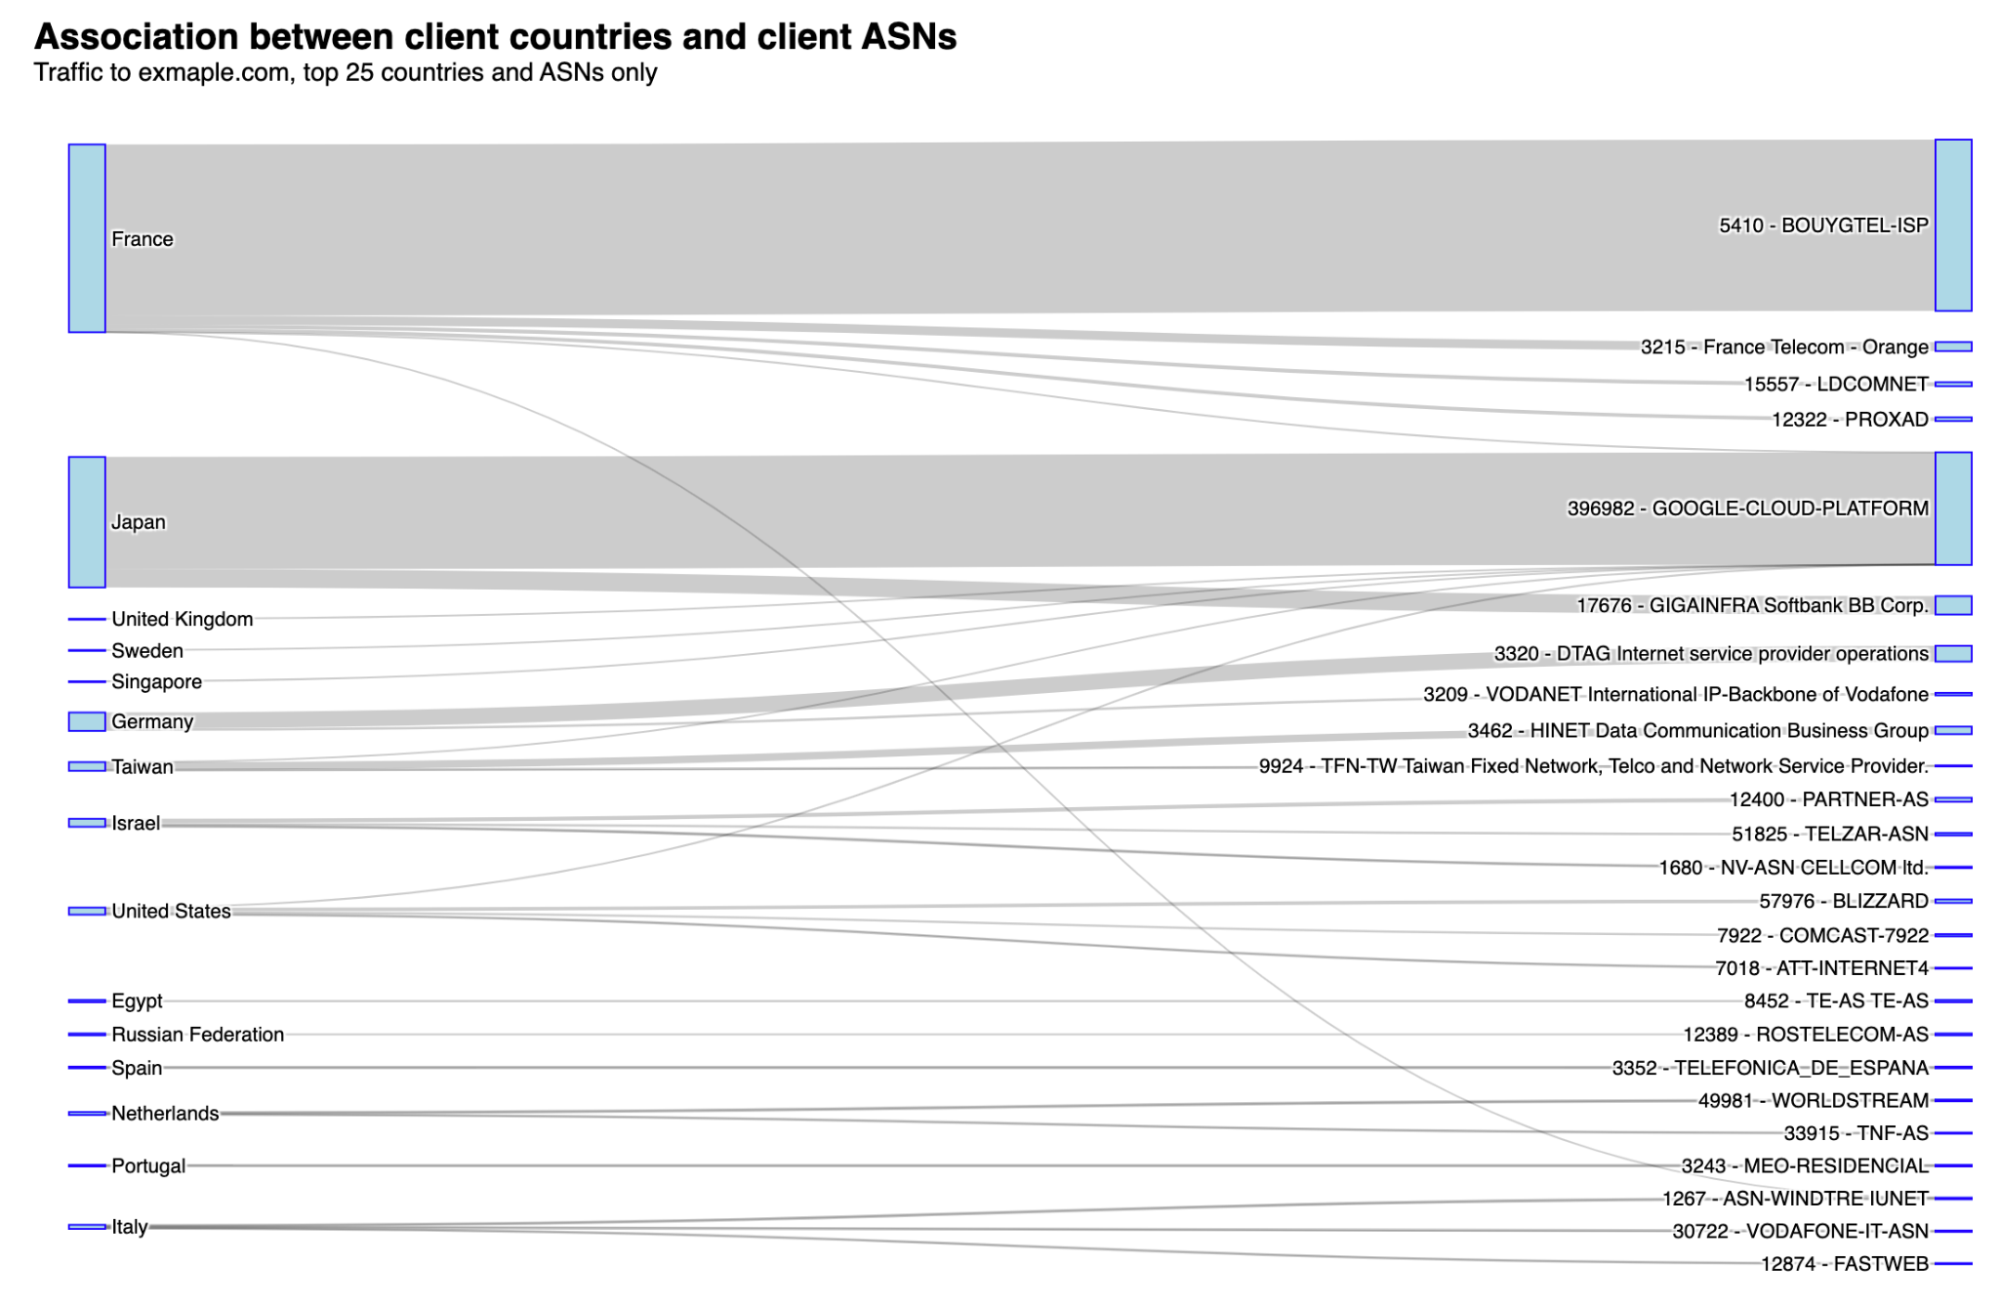
Why does this happen in specific ASNs in different regions of the world, you may ask? Even without a definitive answer, the amount of daily traffic from those ASNs, and the prevalence of bot traffic, seems to indicate that most traffic is related to a possible misconfiguration in a router, software or network setting, intended to go to example.com.

As we observed previously, example.com is used for testing, educational, or illustrative purposes, including in routers from specific networks. It could be for network troubleshooting and testing, training, simulations, or it also could be in the documentation or guides for configuring routers, as examples to illustrate how to set up DNS configurations, route advertisement, or other networking settings.

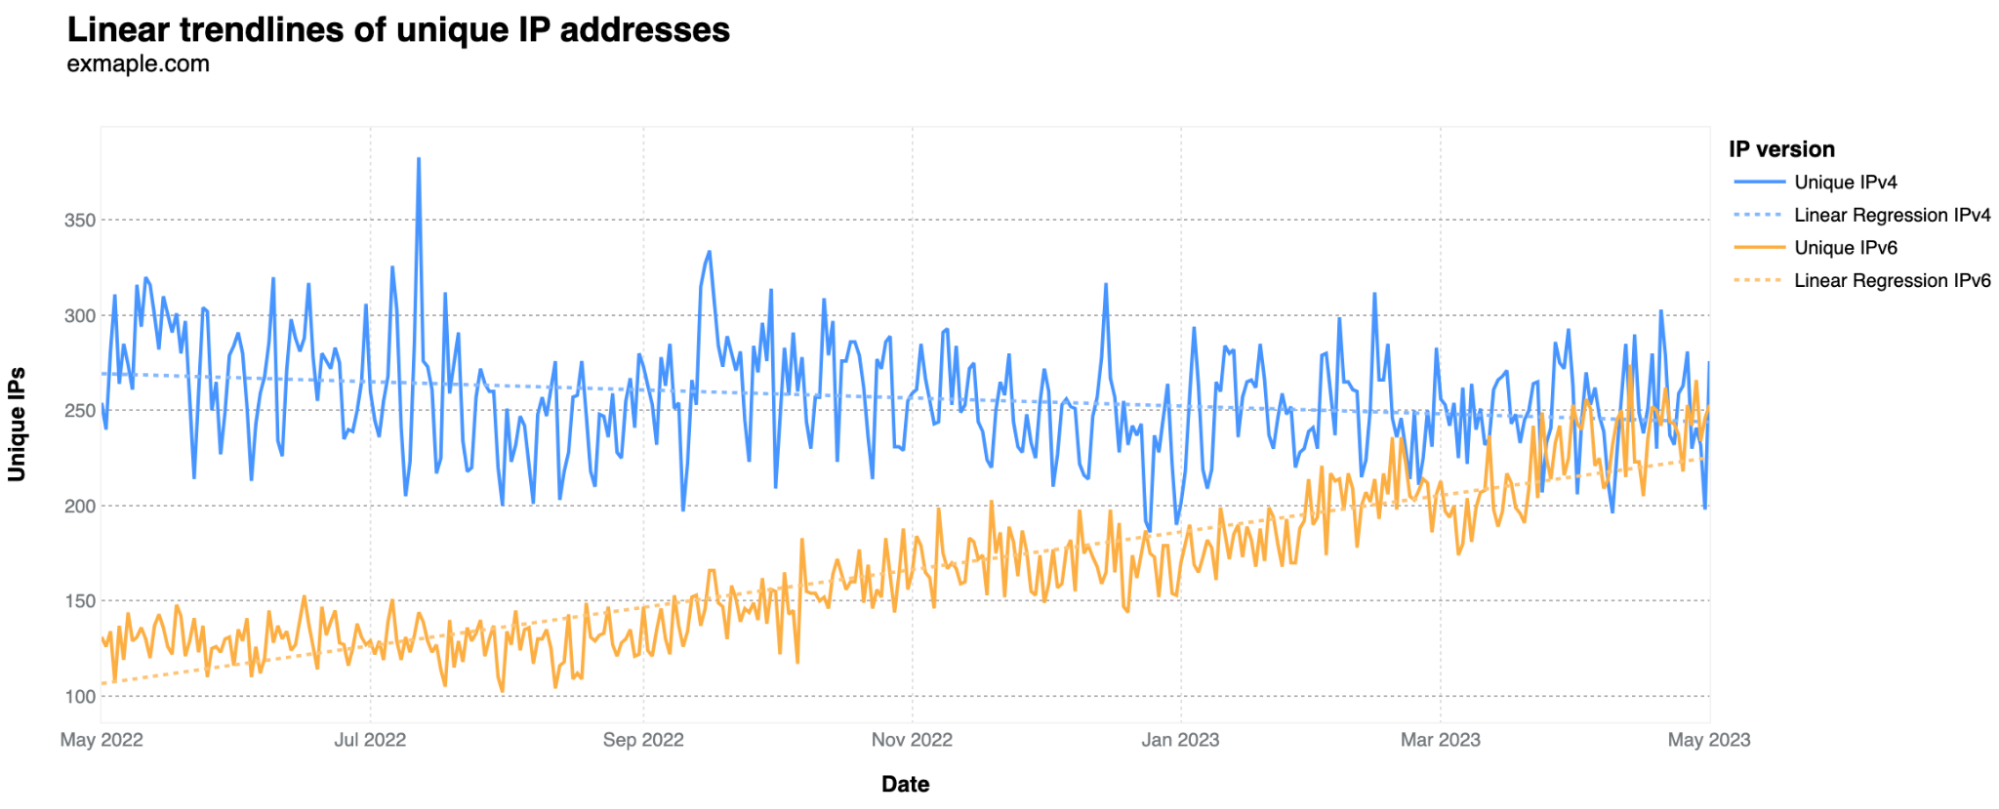
What are the main IP versions and browsers?

Regarding IP versions, they can be IPv4 or IPv6 — v6 emerged as a solution when the initial v4 wasn't prepared for the Internet's growth. For exmaple.com unique visitors, looking at the daily number of unique IPs where requests originate, IPv6 has been rising in comparison to IPv4. This suggests that IPv6 is now more frequently used by the services and bots generating most of this traffic. It started in May at 30% IPv6 usage and is now around 50%.

Typo traps: analyzing traffic to exmaple.com (or is it example.com?)

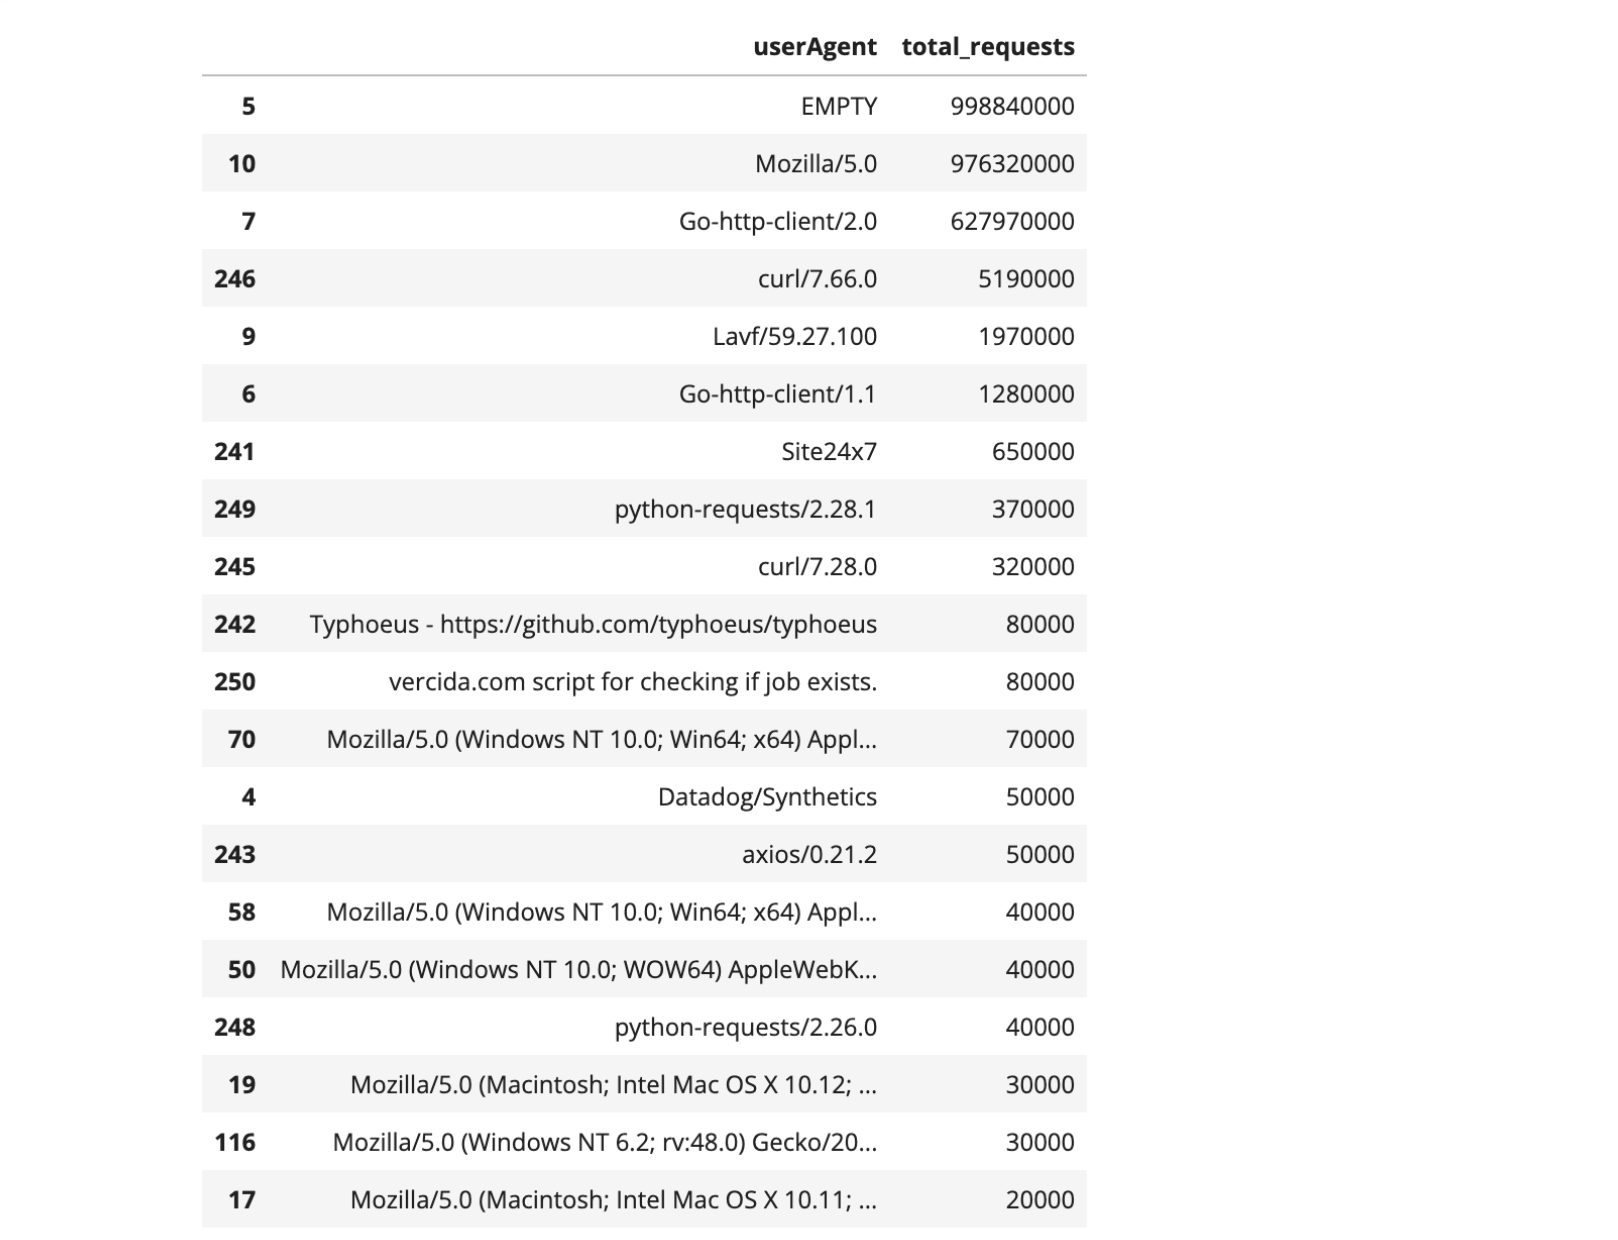
The user-agent header sent by the visitor's web browser in the HTTP request typically contains information about the used browser, operating system, and sometimes even the device. But in this case, the user-agent information doesn’t give us much detail, even of there’s some odd ones. “Empty” (when user agents are absent) comes first, followed by “Mozilla/5.0” and “Go-http-client/2.0”. What do those user-agents mean?

  • The user agent string "Mozilla/5.0" is widely used by a variety of web browsers, both mainstream and niche, including Mozilla Firefox, Google Chrome, Safari, and Opera. Therefore, it is challenging to attribute the usage of "Mozilla/5.0" specifically to a single browser or user category. While "Mozilla/5.0" is associated with legitimate browsers, it's worth noting that user agent strings can be easily manipulated or forged by bots and malicious actors.
  • “Go-http-client/2.0” indicates that the request is coming from a program or application written in the Go programming language (often referred to as Golang).

There are also a few others represented with known meanings, such as “curl/7.66.0” (the numbers correspond to the specific version being used). This user agent string indicates that the HTTP request was made using the cURL command-line tool, a popular tool used for tasks like downloading files, automated testing, debugging, or server monitoring. There’s also “Lavf/59.27.100”, a less common user agent tied to FFmpeg's Lavf library for multimedia tasks, and “python-requests/2.28.1”, that indicates the use of the Python Requests library, popular for sending HTTP requests and interacting with web services.

In the camp of more unusual user agents, with a few thousand requests, are instances like a specific GitHub page (a software library called Typhoeus) or a possible “script for checking if job exists” for the job searching site vercida.com.

Typo traps: analyzing traffic to exmaple.com (or is it example.com?)

From where did the users access the website? Let's examine the distribution of HTTP referrers. Note that the term "referer" is based on a misspelling in the original specification that has persisted (it should be "referrer header" instead) in HTTP — in the original HTTP proposal Tim Berners-Lee spells it “referrer” as well. The referer or referrer header is an optional field that provides information about the URL of the web page from which a particular request originated.

The predominant “referer” used is “empty”, which occurs when a user agent isn’t provided, also possibly meaning direct access or by bookmark. Next is exmaple.com itself (an unusual pattern, given there are no links on exmaple.com), with a peak of 160,000 requests on February 6, 2023. Following that is a curious spike of 10,000 requests from "reddit.com" on January 30, 2023, possibly due to a misspelling of example.com in a Reddit post that got popular.

We didn’t find a specific Reddit post from January 30 mentioning exmaple.com, but there were a few there over the years, clearly aiming to show example.com. Some of those are as recent as one year or even 10 months, like this Reddit post on the AWS subreddit, or this one from January 31, 2023, related to SEO.

On that note, regarding human misuse of misconfigurations impacting the Internet, in 2018, a member of the Cloudflare team gave a presentation about “Internet Noise” during a RIPE event that can be consulted here. It’s about unwanted traffic due to misconfigurations and misuse of proxies and internal use situations.
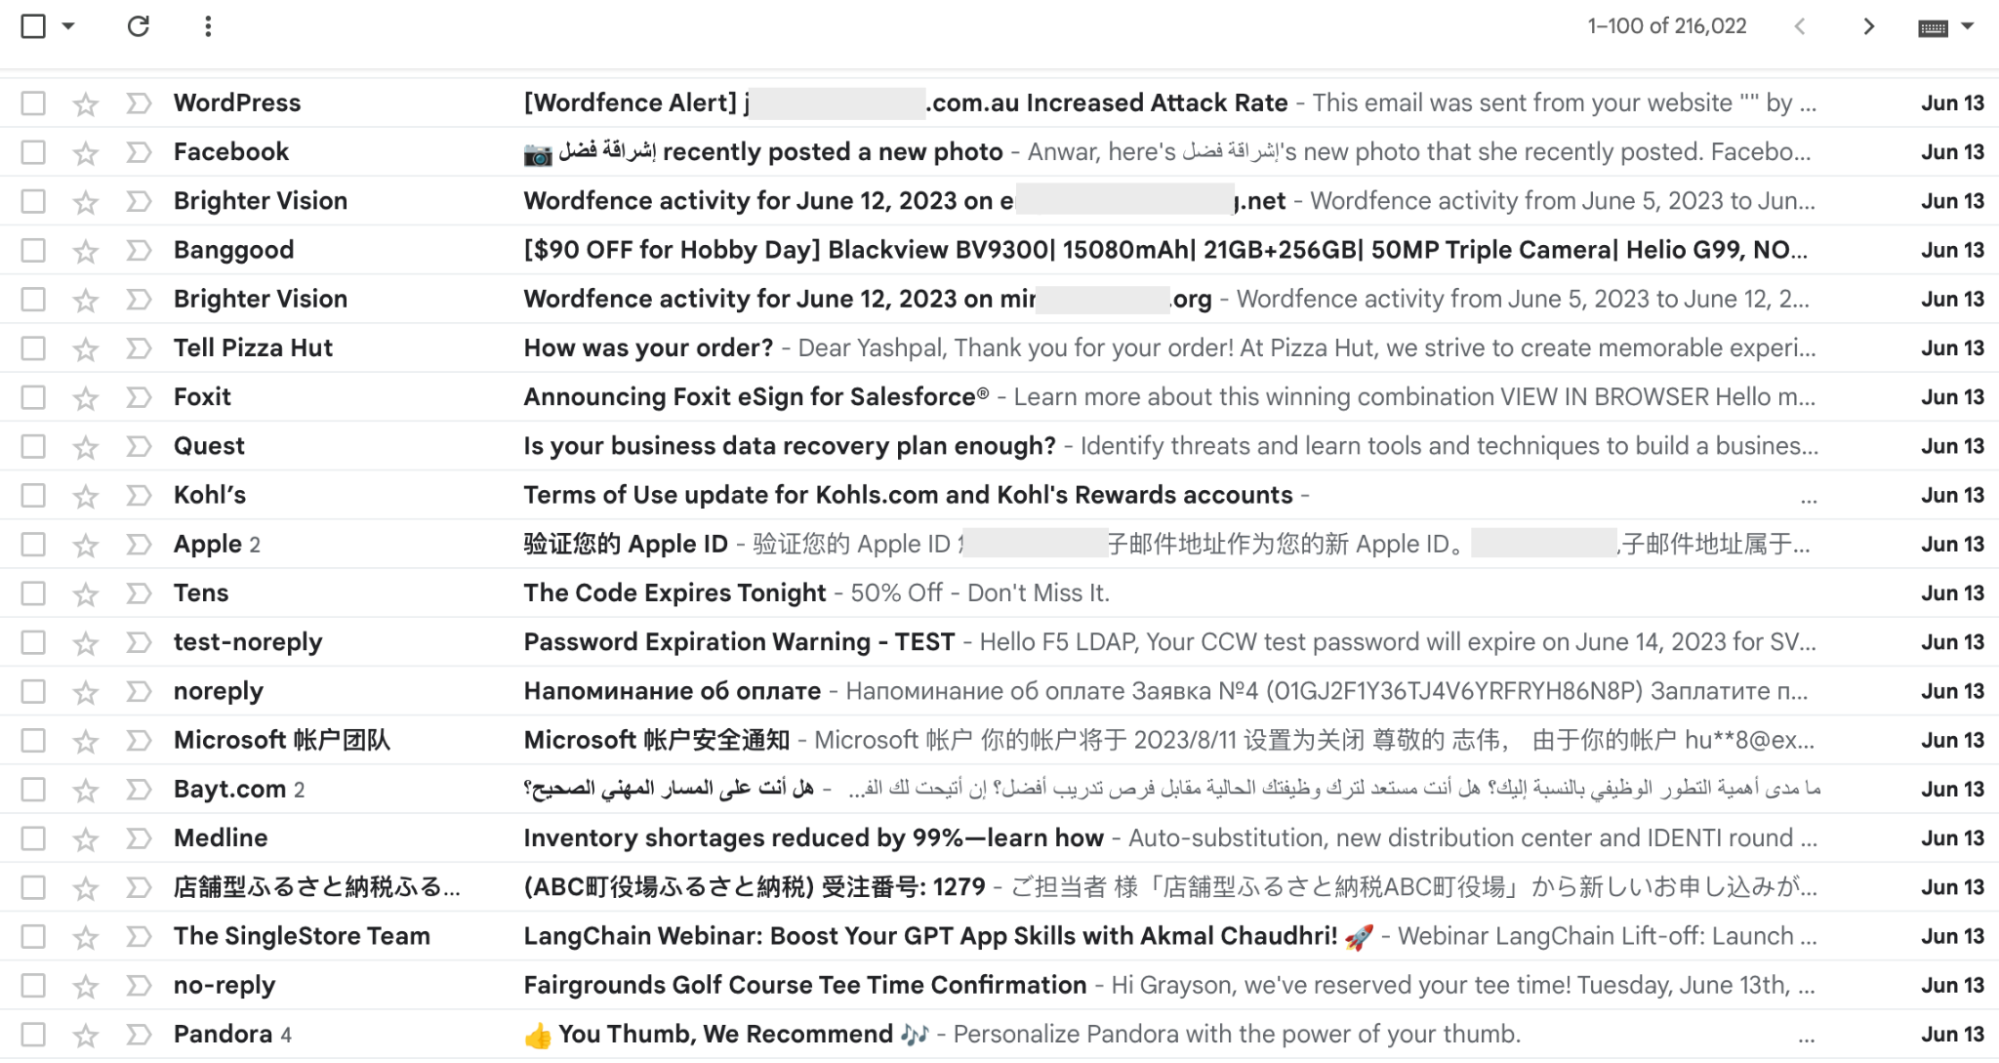
Although no email address online intentionally targets exmaple.com, that address still gets some email attention. We configured a Gmail account to monitor these random emails in early 2022. Within 16 months, the 15 GB email capacity was fully used, containing 216,000 emails — an average of 432 daily emails. These emails reflect various scenarios: some are marketing-related, others appear to be network tests, and some are from individuals who, by error or to avoid spam, ended up at “@exmaple.com”. Among these use cases, we noticed accounts linked to PlayStation, Apple devices, Pandora music, Facebook, and more.

Typo traps: analyzing traffic to exmaple.com (or is it example.com?)
What the exmaple.com Inbox typically looks like.

Examining a 30-day span of emails (late July to late August), we noticed that certain types of emails are more common than others. This is notably seen in tests conducted by computer software applications that monitor systems, networks, and infrastructure. The main example of this is Nagios.

Since late July, nearly 83% of almost 4,000 emails were from Nagios. The sender used a “local domain” from Nagios, and the email address was “[email protected]”—where example.com was likely the intended recipient. The subjects alternated between “PROBLEM Service Alert: [Name of company] ATM/PING is WARNING” and “RECOVERY Service Alert: [Name of company]_Backup/PING is OK”, indicating service tests.

Analyzing the regions where most emails originate (based on our data centers), it's evident that North America and Southeast Asia are the primary sources, along with Europe. Regarding languages, English dominates, but some emails are in German, Spanish, Chinese, Japanese, Thai, and Russian.

Microsoft (56 emails), Apple (30), and Google (20 emails) are in the mix. Surprisingly, emails from various golf courses (31 emails from eight different golf courses) were also present, along with emails from cruise ship companies. Additionally, there are emails from well-known brands such as Call of Duty, PlayStation, HP, Uber (related to Uber Eats), McAfee, and even the U.S. Patent and Trademark Office (in newsletter subscription emails) that were observed (in this case, from the actual brands and not spam look alike). While Facebook-related emails were present in previous months, they haven't been seen recently.

Some emails clearly reveal their "fake" email intent, like “[email protected]”, sent by a virtual learning platform, likely when someone provided a randomly false email address. There are also repeated instances of people’s names like Mike or others, including surnames, before “@exmaple.com”. This suggests that people use the same fictitious email address when asked for their email by companies.

Here are some of the most creatively formed or interesting email addresses provided between July and August 2023, organized by us based on types of chosen email addresses (we included the number of emails in the most frequently used ones):

[email protected] — our favorite [email protected] — 35 emails
[email protected] — 20 [email protected] — 25
[email protected] — 17 [email protected]
[email protected] [email protected]
[email protected] [email protected]
[email protected] [email protected] — (we removed two letters for obvious reasons)
[email protected] — 3200 (used by a software company) [email protected]
[email protected] [email protected] — 11
[email protected] [email protected]
[email protected] [email protected]
[email protected] [email protected]
[email protected] [email protected] — 5
[email protected] [email protected]
[email protected] [email protected]
[email protected] [email protected]
[email protected] [email protected]
[email protected] [email protected]
[email protected] [email protected]
[email protected] [email protected]
[email protected] [email protected] — 20
[email protected] [email protected]
[email protected] — 14 [email protected]
[email protected] [email protected]
[email protected] [email protected]
[email protected] — 15 [email protected]
[email protected] [email protected]
[email protected] [email protected] — 10
[email protected] [email protected]
[email protected] [email protected]
[email protected] [email protected]
[email protected] [email protected]
[email protected] [email protected]
[email protected] [email protected] — (“daufrecht” means upright in German)
[email protected] [email protected]
[email protected]

Email authentication. DMARC and friends

In the realm of email, DMARC (that stands for "Domain-based Message Authentication, Reporting, and Conformance") is a security protocol that helps prevent email spoofing and phishing attacks by providing a framework. It is used by email senders to authenticate their messages and receivers to verify their authenticity. DMARC is based on both SPF (verifies if an email was sent by an authorized sender) and DKIM (the receiving server will check the DKIM-Signature header), and the domains used by those two protocols. So, DMARC requires that SPF or DKIM “pass”.

The implementation of DMARC signals that an email sender is taking measures to improve email security and protect their domain's reputation. With this context, let’s delve into DMARC validation. How did these random email senders to “@exmaple.com”? Only 11% (433) of all emails (3890) from the past 30 days passed the DMARC authentication successfully, most of those were from recognized senders like Apple, Uber, or Microsoft.

This is also because a significant 83% (3252) of emails originated from what appear to be tests conducted by computer software applications that monitor systems, networks, and infrastructure — specifically, Nagios. All of these emails are categorized as "none" in terms of DMARC policies, indicating that the sender is not using a DMARC policy. This approach is frequently adopted as an initial phase to gauge the impact of DMARC policies before adopting more robust measures. Just 1% of all emails "failed" DMARC authentication, implying that these emails didn't align with the sender's designated policies.

In such instances, domain owners can instruct email providers to take actions such as quarantining the email or outright rejection, thus shielding recipients from potentially malicious messages. This was evident in domains like amazon.co.jp or sanmateo.flester.com (where "Undelivered Mail Returned to Sender" messages originated from the Mail Delivery System).

Our email perspective could have been even more comprehensive if this “@exmaple.com” email account had Cloudflare Area 1 — our cloud-native email security service that detects and thwarts attacks before they reach user inboxes. Perhaps in a future geeky venture, we will also incorporate that viewpoint, complete with percentages for spam, malicious content, and threat categories.

Where is example.com on our domain popularity ranking? What about exmaple.com?

Last but not least, we also have insight into example.com itself. Looking at our most popular domains list (using data from our 1.1.1.1 resolver), example.com or “example.org” are no strangers to our popular domains ranking. Those two are usual “guests” of our top 500 domains ranking, both worldwide and in specific countries, which also is an expression of its popularity and usage for all the use cases we already discussed. example.com usually sits higher, in the top 300. Since July, it has even appeared in our top 100 for the first time in 2023.

Typo traps: analyzing traffic to exmaple.com (or is it example.com?)

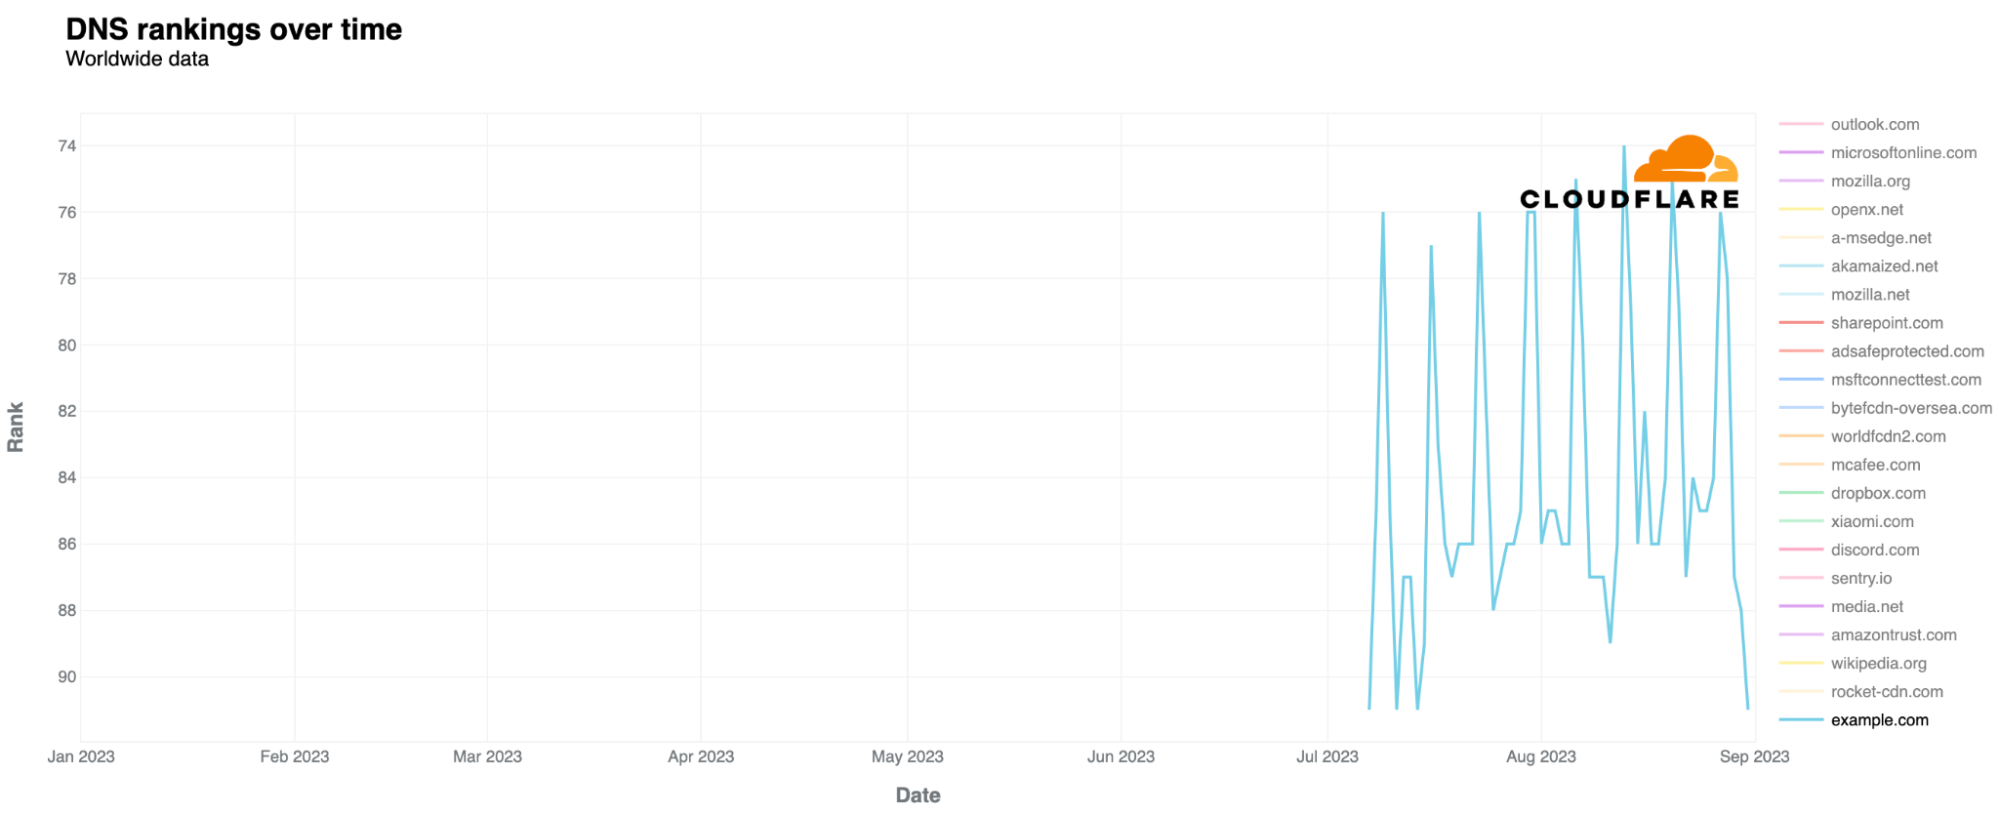
exmaple.com, on the other hand, is not in our top 100 list, and only appears in our top 100k top domains list. You can find our domains lists, including a top 100, and unordered CSV lists up to Top 1 million domains, on Cloudflare Radar and through our API.

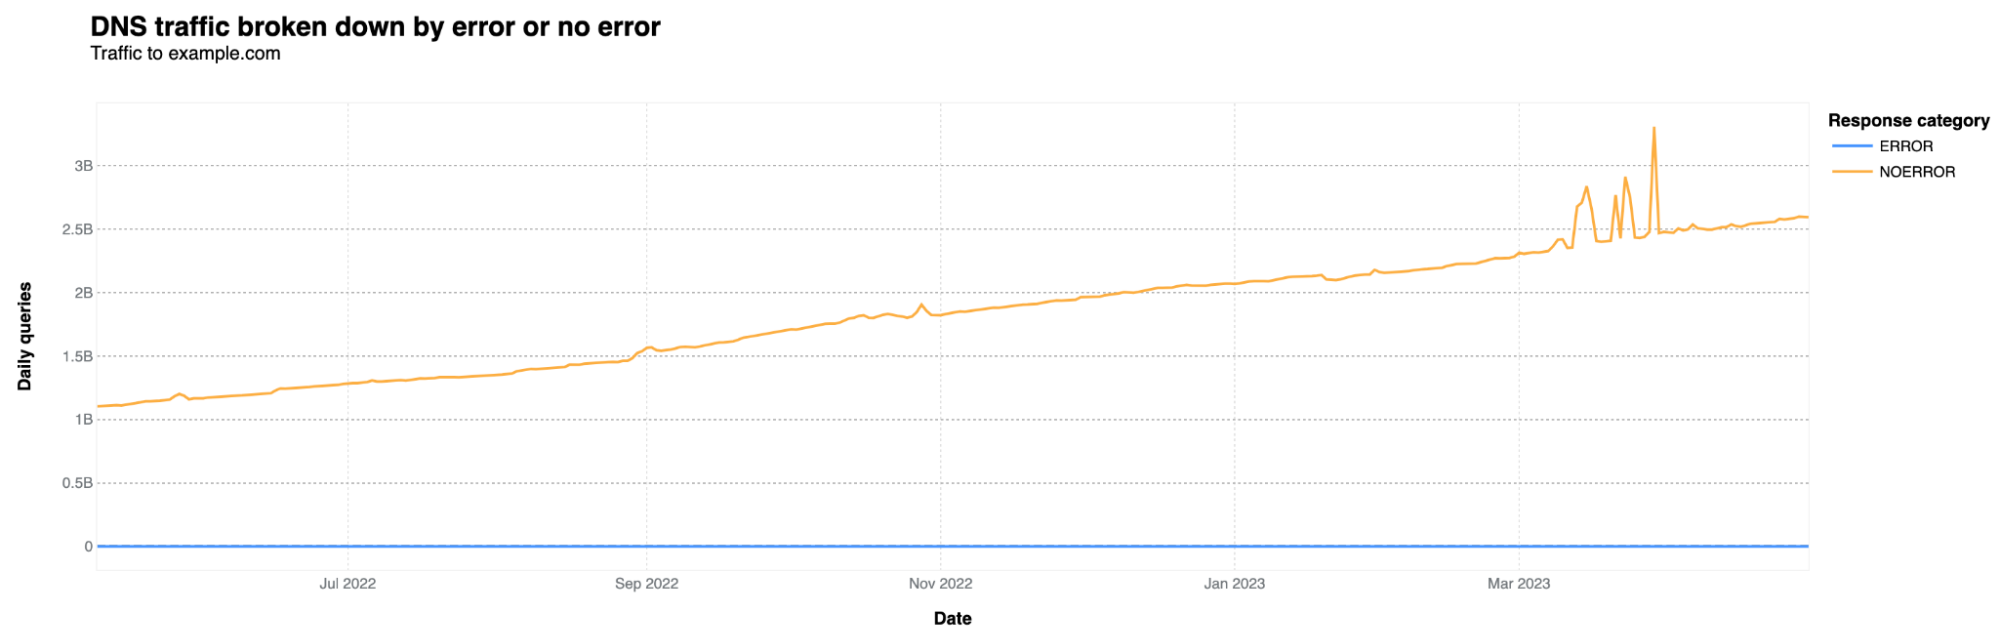
Just by checking DNS data from those who use our resolver, the original example.com gets around 2.6 billion DNS queries every day. This number has been consistently increasing since 2022, more than doubling. Here's the chart to show it:

Typo traps: analyzing traffic to exmaple.com (or is it example.com?)

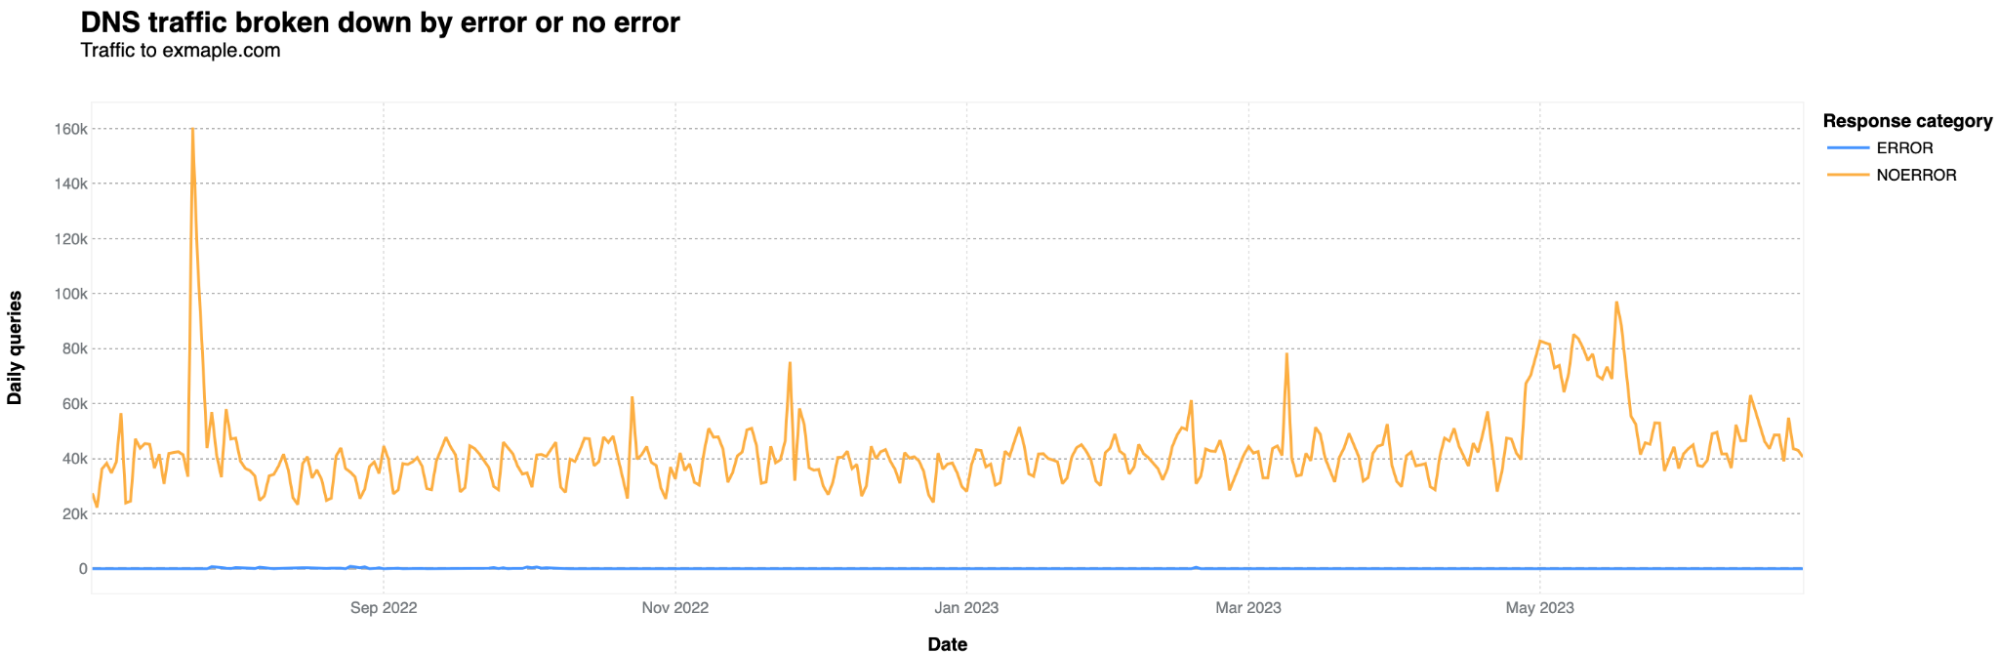
What about exmaple.com? DNS queries are significantly lower by an order of magnitude. On average, it receives around 40,000 DNS queries per day, with occasional spikes reaching 80,000 to 90,000 — there’s one 160k July 23, 2022, spike. It's also noteworthy that there are more DNS queries on weekdays and fewer on weekends, which is not the case for example.com.

Typo traps: analyzing traffic to exmaple.com (or is it example.com?)

Conclusion: Errare humanum est

“Some of the worst problems that happen on the Internet are not because somebody deliberately caused the problem. It’s because somebody made a mistake. We’ve lost half the networks ability to transport traffic or route it to the right destinations because somebody made a configuration mistake”.
Vint Cerf, American Internet pioneer, in a 2016’s article: Vinton G. Cerf: Human error, not hackers threaten Net.

Even if traffic to exmaple.com arrives without consequences, a typo from a technician in a device for the wrong and malicious domain, could definitely have a negative impact if protections are not put in place. The typical Internet user is also susceptible to sending emails to the wrong address due to typos or could be tricked by domains resembling popular brands, but with errors.

Stoic philosopher of Ancient Rome Lucius Seneca stated two thousand years ago, Errare humanum est or in plain English: to err is human. This held true for humans in the year AD 30 and remains so for humans in 2023. And the Internet, the complex network of networks that has grown larger than even its human inventors anticipated, is no stranger of these human errors, and its consequences. Quoting once again from Vint Cerf, “we need to have much better tools for writing software to avoid some of those stupid mistakes that cause problems in the Internet”.

After all this geeky analysis, my autocorrect finally recognizes "exmaple.com" and doesn't change it to "example.com". Success.

(Thanks to Jorge Pacheco, Sofia Cardita, Jérôme Fleury, and Marek Majkowski for their contributions to this blog post.)

Cloudflare Radar’s 2023 overview of new tools and insights

Post Syndicated from João Tomé original http://blog.cloudflare.com/cloudflare-radars-2023-overview-of-new-tools-and-insights/

Cloudflare Radar’s 2023 overview of new tools and insights

Cloudflare Radar’s 2023 overview of new tools and insights

Cloudflare Radar was launched in September 2020, almost three years ago, when the pandemic was affecting Internet traffic usage. It is a free tool to show Internet usage patterns from both human and automated systems, as well as attack trends, top domains, and adoption and usage of browsers and protocols. As Cloudflare has been publishing data-driven insights related to the general Internet for more than 10 years now, Cloudflare Radar is a natural evolution.

This year, we have introduced several new features to Radar, also available through our public API, that enables deeper data exploration. We’ve also launched an Internet Quality section, a Trending Domains section, a URL Scanner tool, and a Routing section to track network interconnection, routing security, and observed routing anomalies.

In this reading list, we want to highlight some of those new additions, as well as some of the Internet disruptions and trends we’ve observed and published posts about during this year, including the war in Ukraine, the impact of Easter, and exam-related shutdowns in Iraq and Algeria.

We also encourage everyone to explore Cloudflare Radar and its new features, and to give you a partial review of the year, in terms of Internet insights — our 2023 Year in Review is coming later this year.

New additions to Cloudflare Radar

In 2022, Cloudflare Radar 2.0 was released last September, refreshing the look & feel and building on a new platform that allows us to easily add new features in the future. At that time, we added two new sections:

Cloudflare Radar’s 2022 Year in Review and the related blog were published at the end of the year.

Without further ado, here are some of the new features launched in 2023.

Analyze any URL safely using the Cloudflare Radar URL Scanner (✍️)

If you're invited to click on a link and if you're unsure about its safety, or if you simply want to verify technical details about a particular site, URL Scanner is here to assist. Provide us with a URL, and our scanner will compile a report containing a myriad of technical details: risk assessment, SSL certificate data, HTTP request and response data, page performance data, DNS records, associated cookies, what technologies and libraries the page uses, and more.

Introducing the Cloudflare Radar Internet Quality Page (✍️)

In June 2023, the new Internet Quality page was introduced to Cloudflare Radar, offering both country and network (autonomous system) level insight. This provides information on Internet connection performance (bandwidth) and quality (latency, jitter) over time based on benchmark test data as well as speed.cloudflare.com test results.

You can also see in a world map how the different countries compare with each other in different metrics from bandwidth to latency and jitter. Autonomous systems (AS) or networks are presented on individual pages, including Starlink’s AS14593. Latency is the metric that gives a better perspective on quality and improved Internet experience. Here’s the most recent global view on latency-based connection quality (lower is better):

Cloudflare Radar’s 2023 overview of new tools and insights

Starting July 2023, our Domain Rankings page received enhancements through the inclusion of specific Trending Domains lists. While the top 100 list is typically dominated by the big names such as Google, Facebook, and Apple, there are trending domains that also tell interesting and even more local stories.

The Trending Domains lists highlight surges in interest from the previous day and previous week. For instance, we captured how nba.com was trending in 28 locations during the NBA Draft 2023, and how rt.com (a Russian-based news site) gained attention in multiple countries during the Wagner group mutiny in Russia. More recently, on the same subject, after the death of Wagner’s leader, Yevgeny Prigozhin, in a plane crash, flightradar24.com was trending in our daily list both in Russia and Ukraine.

Routing information now on Cloudflare Radar (✍️)

The Internet is a vast, sprawling collection of networks (autonomous systems) that connect to each other, and routing is one of the most critical operations of the Internet. Launched in late July 2023, the new Cloudflare Radar Routing page examines the routing status of the Internet, including secure routing protocol deployment for a country and routing changes and anomalies. Included are routing security statistics, and also announced prefixes and connectivity insights. Why is that important? Routing decides how and where the Internet traffic should flow from the source to the destination, and deviations or anomalies can indicate potential issues that lead to connectivity disruptions.

Border Gateway Protocol (BGP), is considered the postal service of the Internet, but as a routing protocol suffers from a number of security weaknesses. Within the Routing page, we also present BGP route leaks and BGP hijack detection results, highlighting relevant events detected for any given network or globally. Notably, BGP origin hijacks allow attackers to intercept, monitor, redirect, or drop traffic destined for the victim's networks. In this related blog post, we also explain how Cloudflare built its BGP hijack detection system (including notifications), from its design and implementation to its integration: Cloudflare Radar's new BGP origin hijack detection system.

Cloudflare Radar’s 2023 overview of new tools and insights

General Internet insights from 2023

This blog post details Internet insights during the war in Europe and discusses how Ukraine's Internet remained resilient in spite of dozens of attacks and disruptions in three different stages of the conflict.

Cloudflare observed multiple Internet disruptions in the first weeks of the war (Internet infrastructure was damaged, and Internet access was limited in besieged areas, like Mariupol), as well as airstrikes on Ukrainian energy infrastructure. We also emphasize how application-layer cyber attacks in Ukraine rose 1,300% in early March 2022 as compared to pre-war levels, the country’s Internet resilience during the war, and major growth in Starlink traffic from the country.

Cloudflare’s view of the Virgin Media outage in the UK (✍️)

At times, major Internet operators experience significant outages due to technical issues. In 2022, it was Canada’s Rogers that experienced a 17-hour disruption impacting millions of users, and in early April 2023, a similar incident occurred with the United Kingdom’s Virgin Media. In this case, there were two clear outages for a few hours during April 4, 2023.

The post examines the impact on Internet traffic, the availability of Virgin Media web properties, and how BGP activity offered insights into the root cause.

National holidays celebrated in various countries can influence local Internet traffic trends. That was the case during Easter, celebrated between April 7-10, 2023. In countries including Italy, Poland, Germany, France, Spain, Portugal, the United States, Mexico, and Australia, the Easter long weekend led to the lowest traffic levels of 2023 up to that point—over 100 days into the year. Traffic dipped most significantly on Easter Sunday, compared to the previous Sunday, in Poland (22% lower), Italy (18% lower), France (16% lower).

The post also illustrates Orthodox Easter trends, with Greece being most impacted. It examines Ramadan-related changes, where eating rituals impacted Internet patterns in several countries with significant Muslim populations, and Passover trends, showing how Israel’s Internet traffic dropped as much as 24%.

Effects of the conflict in Sudan on Internet patterns (✍️)

We’ve been monitoring changes and disruptions in Internet patterns linked to military interventions. In this Sudan-related blog post, we analyze the impact of the armed conflict between rival factions of the military government that began on April 15, 2023. Cloudflare observed varying disruptions in Internet traffic after that day, with a mix of clear outages and general decrease in traffic.

The country’s Internet continues to be impacted ever since, as our 12-month traffic graph illustrates, with the relevant Sudatel, Mobitel, and MTN autonomous systems from local ISPs remaining the most affected.

The most recent Internet pattern change linked to military intervention is the ongoing coup in Niger. This particular event caused a distinct traffic drop, likely tied to shifts in human Internet usage, given the absence of signs of consistent connectivity disruption.

How the coronation of King Charles III affected Internet traffic (✍️)

As the coronation ceremony of King Charles III unfolded in London on May 6, 2023, distinct spikes and dips in Internet traffic were observed, each coinciding with key moments of the event. Also, on Sunday during the Coronation Big Lunch event, and Prince William’s speech at night, both instances led to a clear traffic drop of up to 18% compared with the previous Sunday. The accompanying chart displays this trend.

Cloudflare Radar’s 2023 overview of new tools and insights

During the coronation weekend, Canada and Australia also exhibited shifts in Internet traffic patterns. And within this coronation post, there’s also analysis on Internet traffic pattern changes when Queen Elizabeth II passed away on September 8, 2022.

Cloudflare’s view of Internet disruptions in Pakistan (✍️)

Following the arrest of ex-PM Imran Khan, violent protests led the Pakistani government to order the shutdown of mobile Internet services and blocking of social media platforms. Mobile network shutdowns in the country lasted for several days.

We examined the impact of these shutdowns on Internet traffic in Pakistan and traffic to Cloudflare’s 1.1.1.1 DNS resolver and how Pakistanis appeared to be using it in an attempt to maintain access to the open Internet.

Nine years of Project Galileo and how the last year has changed it (✍️)

For the ninth anniversary of our Project Galileo in June 2023, the focus turned towards providing access to affordable cybersecurity tools and sharing our learnings from protecting the most vulnerable communities. We also published a ninth anniversary Project Galileo report.

One of the highlights of the report was a clear DDoS attack targeting an organization related to international law. This incident occurred on the same day an international arrest warrant was issued for Russian President Vladimir Putin and Russian official Maria Lvova-Belova, on March 17, 2023. Another standout observation involved the spikes in traffic experienced by Ukrainian emergency and humanitarian services, coinciding with bombings within the country.

Since early June 2023, we’ve seen Iraq implementing a series of multi-hour shutdowns that continued through July and into August, as documented in our Outage Center. Algeria took similar actions, but using a content blocking-based approach, instead of the wide-scale Internet shutdowns, to prevent cheating on baccalaureate exams. This summer, these exam-related shutdowns were also  implemented in Syria.

Cloudflare has previously observed and reported on similar occurrences in 2022 and also in 2021, in Syria and Sudan.

Cloudflare Radar’s 2023 overview of new tools and insights
2023 has been a busy year for different types of Internet disruptions and outages, from government-directed shutdowns to natural incidents.

Reports: DDoS, Internet disruptions, and application security

Within Cloudflare Radar’s reports section, you will find a diverse array of perspectives on the Internet. From the Project Galileo 9th Anniversary — focused on aiding significant yet vulnerable online voices — to the more recent Q2 2023 Browsers and Search Engines reports. Some reports, such as the DDoS attack trends one, are also blog posts. Others are only available as blog posts, like the Internet disruptions summary, expanding on entries in the Outage Center, and the Application Security report.

Q2 2023 Internet disruption summary (✍️)

This post delves into Internet disruptions observed by Cloudflare during the second quarter of 2023. Since 2022, we have been consistently offering these quarterly overviews of disruptions, and Q2 proved to be a busy quarter, with different types of disruptions:

  • There were several government directed shutdowns, including the ones related to “exam season” in several Middle Eastern and African countries, that continue through August.
  • Severe weather also played a role with a “Super Typhoon”-related disruption on the US territory of Guam.
  • Cable damage was behind disruptions in Bolivia, the Gambia and the Philippines.
  • Power outage-related Internet disruptions were observed in Curaçao, Portugal, and Botswana.
  • More generic technical problems impacted SpaceX Starlink’s satellite service, and Virgin Media in the United Kingdom.
  • Cyberattacks played a role in disruptions in both Russia and Ukraine.
  • Military action-related outages were observed in Chad and Sudan.
  • There were also maintenance related outages that affected Togo, Republic of Congo (Brazzaville), and Burkina Faso.

The Internet disruptions overview for Q1 2023 included another cause, a massive earthquake. The early February 7.8 magnitude earthquake in Turkey, which also affected Syria, caused widespread damage and tens of thousands of fatalities, and resulted in significant disruptions to Internet connectivity in multiple regions for several weeks.

DDoS threat report for 2023 Q2 (✍️)

Since 2020, our DDoS reports/blog posts have been focused on uncovering new attack trends, identifying the most affected countries, and showing targeted industries. Our Q2 2023 DDoS threats blog post highlights an unprecedented escalation in DDoS attack sophistication. Pro-Russian hacktivists REvil, Killnet, and Anonymous Sudan joined forces to attack Western sites. Exploits related to the zero-day vulnerability known as TP240PhoneHome surged by a whopping 532%, and attacks on crypto rocketed up by 600%.

An associated interactive version of this report is available on Cloudflare Radar. Furthermore, we’ve also added a new interactive component to Radar’s security section that allows you to dive deeper into attack activity in each country or region.

Our previous 2023 Q1 DDoS threat report highlighted a record-breaking hyper volumetric 71 million requests per second (rps) attack.

Application Security Report: Q2 2023  (✍️)

Our Application Security report has been around since 2022. The latest one highlights new attack trends and insights visible through Cloudflare’s global network. Some highlights include:

  • Daily mitigated HTTP requests decreased by 2 percentage points to 6% on average from 2021 to 2022, but days with larger than usual malicious activity were clearly seen across the network.
  • Application owners are increasingly relying on geo location blocks.
  • Old CVEs (Common Vulnerabilities and Exposures) are still exploited en masse. In that regard, also in August 2023, we also published a “Unmasking the top exploited vulnerabilities of 2022” analysis.
  • On average, more than 10% of non-verified bot traffic is mitigated. Compared to the last report, non-verified bot HTTP traffic mitigation is currently on a downward trend (down 6 percentage points).
  • 65% of global API traffic is generated by browsers.
  • HTTP Anomalies are the most common attack vector on API endpoints, with 64%, followed by SQLi injection attacks (11%) and XSS attacks (9%).

For a comprehensive overview of online attacks and security in 2023, you can also explore the post titled “An August reading list about online security and 2023 attacks landscape”.

Wrap up

The network of networks, also known as the Internet, is both complex and already seen as a human basic right—enabling work, leisure, communication, knowledge acquisition, and the pursuit of opportunities.

In 2023, Cloudflare Radar introduced new capabilities that facilitate the exploration of a broader array of insights and trends showing the Internet's various facets. These include Internet quality, insights into trending domains, and pertinent routing changes. There’s also no lack of general Internet insights and reports that try to offer different perspectives on 2023 events and occurrences and their impact. And already in August 2023, we’ve launched the “date picker” functionality, allowing any user to go back in time by selecting arbitrary date ranges. It looks like this:

Cloudflare Radar’s 2023 overview of new tools and insights

Visit Cloudflare Radar for additional insights around (Internet disruptions, routing issues, Internet traffic trends, attacks, Internet quality, etc.). Follow us on social media at @CloudflareRadar (Twitter), cloudflare.social/@radar (Mastodon), and radar.cloudflare.com (Bluesky), or contact us via e-mail.

An August reading list about online security and 2023 attacks landscape

Post Syndicated from João Tomé original http://blog.cloudflare.com/an-august-reading-list-about-online-security-and-2023-attacks-landscape/

An August reading list about online security and 2023 attacks landscape

An August reading list about online security and 2023 attacks landscape

In 2023, cybersecurity continues to be in most cases a need-to-have for those who don’t want to take chances on getting caught in a cyberattack and its consequences. Attacks have gotten more sophisticated, while conflicts (online and offline, and at the same time) continue, including in Ukraine. Governments have heightened their cyber warnings and put together strategies, including around critical infrastructure (including health and education). All of this, at a time when there were never so many online risks, but also people online — over five billion in July 2023, 64.5% of the now eight billion that are the world’s total population.

Here we take a look at what we’ve been discussing in 2023, so far, in our Cloudflare blog related to attacks and online security in general, with several August reading list suggestions. From new trends, products, initiatives or partnerships, including AI service safety, to record-breaking blocked cyberattacks. On that note, our AI hub (ai.cloudflare.com) was just launched.

Throughout the year, Cloudflare has continued to onboard customers while they were being attacked, and we have provided protection to many others, including once.net, responsible for the 2023 Eurovision Song Contest online voting system — the European event reached 162 million people.

Our global network — a.k.a. Supercloud — gives us a unique vantage point. Cloudflare’s extensive scale also helps enhance security, with preventive services powered by machine learning, like our recent WAF attack scoring system to stop attacks before they become known or even malware.

Recently, we announced our presence in more than 300 cities across over 100 countries, with interconnections to over 12,000 networks and still growing. We provide services for around 20% of websites online and to millions of Internet properties.

Attacks increasing. A readiness and trust game

Let’s start with providing some context. There are all sorts of attacks, but they have been, generally speaking, increasing. In Q2 2023, Cloudflare blocked an average of 140 billion cyber threats per day. One year ago, when we wrote a similar blog post, it was 124 billion, a 13% increase year over year. Attackers are not holding back, with more sophisticated attacks rising, and sectors such as education or healthcare as the target.

Artificial intelligence (AI), like machine learning, is not new, but it has been trending in 2023, and certain capabilities are more generally available. This has raised concerns about the quality of deception and even AI hackers.

This year, governments have also continued to release reports and warnings. In 2022, the US Cybersecurity and Infrastructure Security Agency (CISA) created the Shields Up initiative in response to Russia's invasion of Ukraine. In March 2023, the Biden-Harris Administration released the National Cybersecurity Strategy aimed at securing the Internet.

The UK’s Cyber Strategy was launched at the end of 2022, and in March of this year, a strategy was released to specifically protect its National Health Service (NHS) from cyber attacks — in May it was time for the UK’s Ministry of Defence to do the same. In Germany, the new Digital Strategy is from 2022, but the Security Strategy arrived in June. A similar scenario is seen in Japan, Australia, and others.

That said, here are the reading suggestions related to more general country related attacks, but also policy and trust cybersecurity:

This blog post reports on Internet insights during the war in Europe, and discusses how Ukraine's Internet remained resilient in spite of dozens of attacks, and disruptions in three different stages of the conflict.

An August reading list about online security and 2023 attacks landscape
Application-layer cyber attacks in Ukraine rose 1,300% in early March 2022 compared to pre-war levels.

The White House’s National Cybersecurity Strategy asks the private sector to step up to fight cyber attacks. Cloudflare is ready (✍️)

The White House released in March 2023 the National Cybersecurity Strategy aimed at preserving and extending the open, free, global, interoperable, reliable, and securing the Internet. Cloudflare welcomed the Strategy, and the much-needed policy initiative, highlighting the need of defending critical infrastructure, where Zero Trust plays a big role. In the same month, Cloudflare announced its commitment to the 2023 Summit for Democracy. Also related to these initiatives, in March 2022, we launched our very own Critical Infrastructure Defense Project (CIDP), and in December 2022, Cloudflare launched Project Safekeeping, offering Zero Trust solutions to certain eligible entities in Australia, Japan, Germany, Portugal and the United Kingdom.

Secure by default: recommendations from the CISA’s newest guide, and how Cloudflare follows these principles to keep you secure (✍️)

In this April 2023 post we reviewed the “default secure” posture, and recommendations that were the focus of a recently published guide jointly authored by several international agencies. It had US, UK, Australia, Canada, Germany, Netherlands, and New Zealand contributions. Long story short, using all sorts of tools, machine learning and a secure-by-default and by-design approach, and a few principles, will make all the difference.

Nine years of Project Galileo and how the last year has changed it (✍️) + Project Galileo Report (✍️)

For the ninth anniversary of our Project Galileo in June 2023, the focus turned towards providing access to affordable cybersecurity tools and sharing our learnings from protecting the most vulnerable communities. There are also Project Galileo case studies and how it has made a difference, including to those in education and health, cultural, veterans’ services, Internet archives, and investigative journalism. A Cloudflare Radar Project Galileo report was also disclosed, with some highlights worth mentioning:

  • Between July 1, 2022, and May 5, 2023, Cloudflare mitigated 20 billion attacks against organizations protected under Project Galileo. This is an average of nearly 67.7 million cyber attacks per day over the last 10 months.
  • For LGBTQ+ organizations, we saw an average of 790,000 attacks mitigated per day over the last 10 months, with a majority of those classified as DDoS attacks.
  • Attacks targeting civil society organizations are generally increasing. We have broken down an attack aimed at a prominent organization, with the request volume climbing as high as 667,000 requests per second. Before and after this time the organization saw little to no traffic.
  • In Ukraine, spikes in traffic to organizations that provide emergency response and disaster relief coincide with bombings of the country over the 10-month period.

Project Cybersafe Schools: bringing security tools for free to small K-12 school districts in the US (✍️)

Already in August 2023, Cloudflare introduced an initiative aimed at small K-12 public school districts: Project Cybersafe Schools. Announced as part of the Back to School Safely: K-12 Cybersecurity Summit at the White House on August 7, Project Cybersafe Schools will support eligible K-12 public school districts with a package of Zero Trust cybersecurity solutions — for free, and with no time limit. In Q2 2023, Cloudflare blocked an average of 70 million cyber threats each day targeting the U.S. education sector, and a 47%  increase in DDoS attacks quarter-over-quarter.

Privacy concerns also go hand in hand with security online, and we’ve provided further details on this topic earlier this year in relation to our investment in security to protect data privacy. Cloudflare also achieved a new EU Cloud Code of Conduct privacy validation.

An August reading list about online security and 2023 attacks landscape
This is what a record-breaking DDoS attack (exceeding 71 million requests per second) looks like.

1. DDoS attacks & solutions

DDoS threat report for 2023 Q2 (✍️)

DDoS attacks (distributed denial-of-service) are not new, but they’re still one of the main tools used by attackers. In Q2 2023, Cloudflare witnessed an unprecedented escalation in DDoS attack sophistication, and our report delves into this phenomenon. Pro-Russian hacktivists REvil, Killnet and Anonymous Sudan joined forces to attack Western sites. Mitel vulnerability exploits surged by a whopping 532%, and attacks on crypto rocketed up by 600%. Also, more broadly, attacks exceeding three hours have increased by 103% quarter-over-quarter.

This blog post and the corresponding Cloudflare Radar report shed light on some of these trends. On the other hand, in our Q1 2023 DDoS threat report, a surge in hyper-volumetric attacks that leverage a new generation of botnets that are comprised of Virtual Private Servers (VPS) was observed.

Killnet and AnonymousSudan DDoS attack Australian university websites, and threaten more attacks — here’s what to do about it  (✍️)

In late March 2023, Cloudflare observed HTTP DDoS attacks targeting university websites in Australia. Universities were the first of several groups publicly targeted by the pro-Russian hacker group Killnet and their affiliate AnonymousSudan. This post not only shows a trend with these organized groups targeted attacks but also provides specific recommendations.

In January 2023, something similar was seen with increased cyberattacks to Holocaust educational websites protected by Cloudflare’s Project Galileo.

Uptick in healthcare organizations experiencing targeted DDoS attacks (✍️)

In early February 2023, Cloudflare, as well as other sources, observed an uptick in healthcare organizations targeted by a pro-Russian hacktivist group claiming to be Killnet. There was an increase in the number of these organizations seeking our help to defend against such attacks. Additionally, healthcare organizations that were already protected by Cloudflare experienced mitigated HTTP DDoS attacks.

Cloudflare mitigates record-breaking 71 million request-per-second DDoS attack (✍️)

Also in early February, Cloudflare detected and mitigated dozens of hyper-volumetric DDoS attacks, one of those that became a record-breaking one. The majority of attacks peaked in the ballpark of 50-70 million requests per second (rps) with the largest exceeding 71Mrps. This was the largest reported HTTP DDoS attack on record to date, more than 54% higher than the previous reported record of 46M rps in June 2022.

SLP: a new DDoS amplification vector in the wild (✍️)

This blog post from April 2023 highlights how researchers have published the discovery of a new DDoS reflection/amplification attack vector leveraging the SLP protocol (Service Location Protocol). The prevalence of SLP-based DDoS attacks is also expected to rise, but our automated DDoS protection system keeps Cloudflare customers safe.

Additionally, this year, also in April, a new and improved Network Analytics dashboard was introduced, providing security professionals insights into their DDoS attack and traffic landscape.

2. Application level attacks & WAF

The state of application security in 2023 (✍️)

For the second year in a row we published our Application Security Report. There’s a lot to unpack here, in a year when, according to Netcraft, Cloudflare became the most commonly used web server vendor within the top million sites (it has now a 22% market share). Here are some highlights:

  • 6% of daily HTTP requests (proxied by the Cloudflare network) are mitigated on average. It’s down two percentage points compared to last year.
  • DDoS mitigation accounts for more than 50% of all mitigated traffic, so it’s still the largest contributor to mitigated layer 7 (application layer) HTTP requests.
  • Compared to last year, however, mitigation by the Cloudflare WAF (Web Application Firewall) has grown significantly, and now accounts for nearly 41% of mitigated requests.
  • HTTP Anomaly (examples include malformed method names, null byte characters in headers, etc.) is the most frequent layer 7 attack vectors mitigated by the WAF.
  • 30% of HTTP traffic is automated (bot traffic). 55% of dynamic (non cacheable) traffic is API related. 65% of global API traffic is generated by browsers.
  • 16% of non-verified bot HTTP traffic is mitigated.
  • HTTP Anomaly surpasses SQLi (code injection technique used to attack data-driven applications) as the most common attack vector on API endpoints. Brute force account takeover attacks are increasing. Also, Microsoft Exchange is attacked more than WordPress.

How Cloudflare can help stop malware before it reaches your app (✍️)

In April 2023, we made the job of application security teams easier, by providing a content scanning engine integrated with our Web Application Firewall (WAF), so that malicious files being uploaded by end users, never reach origin servers in the first place. Since September 2022, our Cloudflare WAF became smarter in helping stop attacks before they are known.

Announcing WAF Attack Score Lite and Security Analytics for business customers  (✍️)

In March 2023, we announced that our machine learning empowered WAF and Security analytics view were made available to our Business plan customers, to help detect and stop attacks before they are known. In a nutshell: Early detection + Powerful mitigation = Safer Internet. Or:

early_detection = True
powerful_mitigation = True
safer_internet = early_detection and powerful_mitigation

An August reading list about online security and 2023 attacks landscape

3. Phishing (Area 1 and Zero Trust)

Phishing remains the primary way to breach organizations. According to CISA, 90% of cyber attacks begin with it. The FBI has been publishing Internet Crime Reports, and in the most recent, phishing continues to be ranked #1 in the top five Internet crime types. Reported phishing crimes and victim losses increased by 1038% since 2018, reaching 300,497 incidents in 2022. The FBI also referred to Business Email Compromise as the $43 billion problem facing organizations, with complaints increasing by 127% in 2022, resulting in $3.31 billion in related losses, compared to 2021.

In 2022, Cloudflare Area 1 kept 2.3 billion unwanted messages out of customer inboxes. This year, that number will be easily surpassed.

Introducing Cloudflare's 2023 phishing threats report (✍️)

In August 2023, Cloudflare published its first phishing threats report — fully available here. The report explores key phishing trends and related recommendations, based on email security data from May 2022 to May 2023.

Some takeaways include how attackers using deceptive links was the #1 phishing tactic — and how they are evolving how they get you to click and when they weaponize the link. Also, identity deception takes multiple forms (including business email compromise (BEC) and brand impersonation), and can easily bypass email authentication standards.

Cloudflare Area 1 earns SOC 2 report (✍️)

More than one year ago, Cloudflare acquired Area 1 Security, and with that we added to our Cloudflare Zero Trust platform an essential cloud-native email security service that identifies and blocks attacks before they hit user inboxes. This year, we’ve obtained one of the best ways to provide customers assurance that the sensitive information they send to us can be kept safe: a SOC 2 Type II report.

Back in January, during our CIO Week, Email Link Isolation was made generally available to all our customers. What is it? A safety net for the suspicious links that end up in inboxes and that users may click — anyone can click on the wrong link by mistake. This added protection turns Cloudflare Area 1 into the most comprehensive email security solution when it comes to protecting against malware, phishing attacks, etc. Also, in true Cloudflare fashion, it’s a one-click deployment.

Additionally, from the same week, Cloudflare combined capabilities from Area 1 Email Security and Data Loss Prevention (DLP) to provide complete data protection for corporate email, and also partnered with KnowBe4 to equip organizations with real-time security coaching to avoid phishing attacks.

How to stay safe from phishing (✍️)

Phishing attacks come in all sorts of ways to fool people. This high level “phish” guide, goes over the different types — while email is definitely the most common, there are others —, and provides some tips to help you catch these scams before you fall for them.

Top 50 most impersonated brands in phishing attacks and new tools you can use to protect your employees from them (✍️)

Here we go over arguably one of the hardest challenges any security team is constantly facing, detecting, blocking, and mitigating the risks of phishing attacks. During our Security Week in March, a Top 50 list of the most impersonated brands in phishing attacks was presented (spoiler alert: AT&T Inc., PayPal, and Microsoft are on the podium).

Additionally, it was also announced the expansion of the phishing protections available to Cloudflare One customers by automatically identifying — and blocking — so-called “confusable” domains. What is Cloudflare One? It’s our suite of products that provides a customizable, and integrated with what a company already uses, Zero Trust network-as-a-service platform. It’s built for that already mentioned ease of mind and fearless online use. Cloudflare One, along with the use of physical security keys, was what thwarted the sophisticated “Oktapus” phishing attack targeting Cloudflare employees last summer.

On the Zero Trust front, you can also find our recent PDF guide titled “Cloudflare Zero Trust: A roadmap for highrisk organizations”.

An August reading list about online security and 2023 attacks landscape

4. AI/Malware/Ransomware & other risks

We have shown in previous years the role of our Cloudflare Security Center to investigate threats, and the relevance of different types of risks, such as these two 2022 and 2021 examples: “Anatomy of a Targeted Ransomware Attack” and “Ransom DDoS attacks target a Fortune Global 500 company”. However, there are new risks in the 2023 horizon.

How to secure Generative AI applications (✍️)

Groundbreaking technology brings groundbreaking challenges. Cloudflare has experience protecting some of the largest AI applications in the world, and in this blog post there are some tips and best practices for securing generative AI applications. Success in consumer-facing applications inherently expose the underlying AI systems to millions of users, vastly increasing the potential attack surface.

Using the power of Cloudflare’s global network to detect malicious domains using machine learning  (✍️)

Taking into account the objective of preventing threats before they create havoc, here we go over that Cloudflare recently developed proprietary models leveraging machine learning and other advanced analytical techniques. These are able to detect security threats that take advantage of the domain name system (DNS), known as the phonebook of the Internet.

How sophisticated scammers and phishers are preying on customers of Silicon Valley Bank (✍️)

In order to breach trust and trick unsuspecting victims, threat actors overwhelmingly use topical events as lures. The news about what happened at Silicon Valley Bank earlier this year was one of the latest events to watch out for and stay vigilant against opportunistic phishing campaigns using SVB as the lure. At that time, Cloudforce One (Cloudflare’s threat operations and research team) significantly increased our brand monitoring focused on SVB’s digital presence.

How Cloudflare can help stop malware before it reaches your app (✍️)

In April 2023, Cloudflare launched a tool to make the job of application security teams easier, by providing a content scanning engine integrated with our Web Application Firewall (WAF), so that malicious files being uploaded by end users, never reach origin servers in the first place.

Analyze any URL safely using the Cloudflare Radar URL Scanner  (✍️)

Cloudflare Radar is our free platform for Internet insights. In March, our URL Scanner was launched, allowing anyone to analyze a URL safely. The report that it creates contains a myriad of technical details, including a phishing scan. Many users have been using it for security reasons, but others are just exploring what’s under-the-hood look at any webpage.

Unmasking the top exploited vulnerabilities of 2022 (✍️)

Last, but not least, already from August 2023, this blog post focuses on the most commonly exploited vulnerabilities, according to the Cybersecurity and Infrastructure Security Agency (CISA). Given Cloudflare’s role as a reverse proxy to a large portion of the Internet, we delve into how the Common Vulnerabilities and Exposures (CVEs) mentioned by CISA are being exploited on the Internet, and a bit of what has been learned.

If you want to learn about making a website more secure (and faster) while loading third-party tools like Google Analytics 4, Facebook CAPI, TikTok, and others, you can get to know our Cloudflare Zaraz solution. It reached general availability in July 2023.

Wrap up

“The Internet was not built for what it has become”.

This is how one of Cloudflare’s S-1 document sections begins. It is also commonly referenced in our blog to show how this remarkable experiment, the network of networks, wasn’t designed for the role it now plays in our daily lives and work. Security, performance and privacy are crucial in a time when anyone can be the target of an attack, threat, or vulnerability. While AI can aid in mitigating attacks, it also adds complexity to attackers' tactics.

With that in mind, as we've highlighted in this 2023 reading list suggestions/online attacks guide, prioritizing the prevention of detrimental attack outcomes remains the optimal strategy. Hopefully, it will make some of the attacks on your company go unnoticed or be consequences-free, or even transform them into interesting stories to share when you access your security dashboard.

If you're interested in exploring specific examples, you can delve into case studies within our hub, where you’ll find security related stories from different institutions. From a technology company like Sage, to the State of Arizona, or the Republic of Estonia Information Security Authority, and even Cybernews, a cybersecurity news media outlet.

And because the future of a private and secure Internet is also in our minds, it's worth mentioning that in March 2022, Cloudflare enabled post-quantum cryptography support for all our customers. The topic of post-quantum cryptography, designed to be secure against the threat of quantum computers, is quite interesting and worth some delving into, but even without knowing what it is, it’s good to know that protection is already here.

If you want to try some security features mentioned, the Cloudflare Security Center is a good place to start (free plans included). The same applies to our Zero Trust ecosystem (or Cloudflare One as our SASE, Secure Access Service Edge) that is available as self-serve, and also includes a free plan. This vendor-agnostic roadmap shows the general advantages of the Zero Trust architecture, and as we’ve seen, there’s also one focused on high risk organizations.

Be cautious. Be prepared. Be safe.

How the coronation of King Charles III affected Internet traffic

Post Syndicated from João Tomé original http://blog.cloudflare.com/how-the-coronation-of-king-charles-iii-affected-internet-traffic/

How the coronation of King Charles III affected Internet traffic

How the coronation of King Charles III affected Internet traffic

When major events in a country happen Internet traffic patterns are often impacted, depending on the type of event. But what about the coronation of a king or queen? There’s no similar precedent, with a worldwide impact, in the Internet age, except maybe the coronation of the king of Thailand, in 2019. The last time it happened in the United Kingdom was 70 years ago (June 2, 1953), with Queen Elizabeth II; it was the first British coronation to be fully televised. Neither the Internet nor ARPANET were around at the time.

Imagine a grand royal event (if you saw the broadcast or the news, there’s no need), filled with pomp and pageantry, that's so captivating it impacts Internet traffic. That's what happened during the coronation of Charles III and Camilla, the newly crowned king and queen of the United Kingdom and other Commonwealth realms. As the coronation ceremony unfolded, on Saturday morning, May 6, 2023, there were clear spikes and dips in traffic, each coinciding with key moments of the ceremony.

Then came Sunday, and with it, the Coronation Big Lunch event. As the nation sat down to enjoy a communal meal throughout the country, Internet traffic took a significant nosedive, dropping by as much as 18%. The Sunday trends didn't stop there. As night fell and Prince William took to the stage to deliver a speech during the Coronation Concert, there was a clear drop in Internet traffic. Monday, May 8, was a bank holiday in the UK in honor of the coronation, and after a weekend of outdoor coronation events, Internet traffic was buzzing, noticeably higher than usual.

In the past, we’ve seen Internet traffic drop when a national televised event is happening — last year, we saw it, including in the UK, during the Eurovision, although traffic does increase when results are in. Different types of events and broadcasts yield different Internet patterns.

How the coronation of King Charles III affected Internet traffic

Coronation day: a rollercoaster of Internet traffic

Let's take a closer look at coronation day, May 6, 2023, when Internet traffic in the UK had its own peaks and valleys. There were moments when the digital realm seemed to hold its breath, with traffic dipping to its lowest points. The arrival of the royals and their guests marked one such moment. As the anticipation built and all eyes turned to the grand entrances, Internet traffic dipped to a notable 7% lower than the previous week.

Here's a play-by-play of the day's traffic trends, compared to the previous week. We’re using a 15-minute granularity, and aligning with key events as reported live by the BBC:

Traffic decreases (Saturday, May 6, 2023)

Rank by drop (compared with previous week) Coronation events (from the BBC)
#1 — 10:45-11:00 local time (-7% in traffic) When the royals and guests were arriving at Westminster Abbey. The King and Queen arrived at 11:00.
#2 — 12:00 (-2%) When King Charles III (12:02) was crowned.
#3 — 13:00 (-3%) When King Charles and Queen Camilla left Westminster Abbey. The Coronation Procession started.

On Saturday, May 6, 2023, a downward trend in traffic began after 06:15, with traffic 5% lower than the previous week. This trend shifted to a traffic increase after 11:15 (+6%), coinciding with the ongoing ceremony. The exceptions were the previously mentioned traffic dips. The following table illustrates clear traffic spikes after significant moments, some of which are represented in the previous table. Here's a list of periods with higher growth:

Traffic increases (Saturday, May 6, 2023)

Rank by increase (compared with previous week) Coronation events (from the BBC)
#1 — 14:45 local time (+14% in traffic) This happened after the military flypast (14:35), when the royals were on the balcony of Buckingham Palace.
#2 — 12:30 (+13.7%) After King Charles III was crowned at 12:02 (at which time traffic dropped 2%) and after Queen Camilla (12:16) was crowned, when a choir was singing Agnus Dei (12:30).
#3 — 15:30-16:15 (+13%) During the highlights of the event and reactions from royal fans.
#4 — 14:00 (+13%). When the UK’s national anthem was played in the gardens of Buckingham Palace.
#5 — 11:30 (+11%). Just after the coronation oath and during the choir’s singing.

As guests and royals arrived and during moments like the king's crowning, Internet traffic noticeably dropped. However, during parts of the ceremony such as the choir singing, Internet traffic seemed to increase. That was also clear after the military flypast, over the Buckingham Palace balcony.

The following chart illustrates UK Internet traffic during the weekend, with the purple dotted line representing the previous weekend.

How the coronation of King Charles III affected Internet traffic

On a daily basis, daily traffic was 4% higher on Saturday, May 6, compared to the previous Saturday.

The Big Lunch and Prince William’s speech

Another trend from the coronation weekend relates to the events that took place on Sunday, May 7. Internet trends here align with what we observed almost a year ago during Queen Elizabeth II's Platinum Jubilee. Sunday was a day of celebration with both the Coronation Big Lunch (where neighbors and communities were invited to share food and fun together across the country) and the Coronation Concert taking place.

Next, we present the percentages of increase/decrease in requests during this past weekend, compared with the previous week (a slightly different perspective from the previous chart):

How the coronation of King Charles III affected Internet traffic

On Sunday, May 7, it's clear that UK traffic was lower than usual right after 07:00 local time (-2% in traffic), but it dropped the most after 12:00 (-5%), compared to the previous week. The moment with the biggest drop in traffic, compared to the previous week, was between 14:15 and 15:30, when traffic was around 18% lower. That was still Big Lunch time, given that it’s a multiple hour event full of “food and fun” — there were more than 65,000 Coronation Big Lunch events around the UK. During last year's Queen Elizabeth II's Platinum Jubilee, traffic dropped as much as 25% on Sunday, June 5, 2022, at 15:00.

At night, the Coronation Concert took center stage, broadcast live from Windsor Castle on the BBC after 20:00. The lineup included musical guests such as Take That, Lionel Richie, Katy Perry, and Andrea Bocelli. However, the star of the event, at least in terms of when Internet traffic was at its lowest that evening, was William, Prince of Wales. Cloudflare observed another significant drop in traffic, compared to the previous week, around 21:15-21:30, when traffic was 7% lower than the previous week. At that time, Lionel Richie had just performed, and Prince William was on stage for a special address to the king.

In terms of daily traffic, if on Coronation Saturday we saw an increase (4%), on Coronation Sunday there was a 6% drop compared to the previous week. On Monday, the coronation bank holiday, there weren't any major coronation events, and traffic was 4% higher than the previous week (May 1, also a bank holiday in the UK).

Coronation, a mobile devices day

Zooming in on the distribution of traffic from mobile devices, we find that Saturday, May 6, stands out in 2023. On this day, mobile traffic accounted for 61% of total traffic, a figure only matched by April 15 and January 1, 2023. Similarly, Sunday, May 7, was one of the Sundays with the highest percentage of mobile traffic, at 60%. This percentage was only surpassed by Easter Sunday, April 9 (60.4%), and, unsurprisingly, January 1, 2023 (61%).

How the coronation of King Charles III affected Internet traffic

Wales sees the largest Sunday drop in Internet traffic

Which UK countries were more impacted? Looking at both coronation weekend days, we saw a similar pattern (growth in traffic at around the time of the coronation ceremony on Saturday, and decrease on Sunday) in all of them. Looking at the Sunday drop, England had as much as 16% in traffic at 15:30; Scotland had as much as a 17% drop at around 13:30; Wales had as much as a 19% drop at around 15:00; and Northern Ireland had as much as an 18% drop in traffic, compared to the previous week, at the same time. Wales had the biggest drop.

How the coronation of King Charles III affected Internet traffic

From Canada to Australia

Last year, in early June, we observed the impact of Queen Elizabeth II’s Platinum Jubilee on the Internet in the UK. This event, which celebrated the first British monarch to reach a 70th anniversary on the throne, caused a significant drop in traffic, as much as 25% (on Sunday, June 5, 2022). This trend was also noticeable in other Commonwealth countries.

Several Commonwealth countries also held notable events to celebrate both the Queen’s Platinum Jubilee and the recent coronation. In Canada, events and activities related to the coronation mirrored those for the Queen’s Platinum Jubilee. Whether related or not, we observed on Saturday, May 6, as much as an ~8% drop in Internet traffic compared to the previous week, between 09:30 and 16:30 Toronto time. On Sunday, the drop was even larger, with about 10% less traffic between 10:30 and 12:00.

How the coronation of King Charles III affected Internet traffic

In Australia, the difference in traffic wasn't as pronounced as in Canada. However, traffic was 7% lower than the previous week at 20:00 Sydney time (10:00 UTC), when the coronation ceremony began on May 6. This was the only period over the past weekend when traffic was lower than the previous one.

And what about the impact on DNS traffic to our 1.1.1.1 resolver from UK users? Social media apps certainly felt the ripple. Domains linked to social media platforms, which typically surge in popularity during major events, such as Twitter, experienced a notable uptick. We saw a 33% increase in DNS traffic in those around 14:00 local time on Saturday, May 6, compared to the previous week. By 18:00 on May 7, traffic had soared to 64% higher, and it remained elevated during the Coronation Concert: at 22:00, it was 36% higher.

Meanwhile, video-centric social media platforms, like TikTok, hit their peak at around 20:00 on May 7, when the Coronation Concert was starting, with a whopping 57% surge in DNS traffic.

How the coronation of King Charles III affected Internet traffic

During the coronation weekend, the peak period for DNS traffic to domains related to the royal family fell between 11:00 and 12:00 local time. In this hour, traffic was an impressive forty times higher than the same time the previous weekend (that growth is higher, more than 40x, when using a May 2022 baseline, as is seen in the next chart).

How the coronation of King Charles III affected Internet traffic

If we broaden our view to the past 12 months, we see that the domains associated with the royal family hit their highest point on the day Queen Elizabeth II passed away, September 8. Around 18:00 local time, DNS traffic was 12x higher than the previous week. This was followed by the day of Her Majesty's funeral, September 19, when around 11:00, DNS traffic was 6x higher than usual.

How the coronation of King Charles III affected Internet traffic

A similar impact was seen, related to the Queen's death, on British news organizations, in the past 12 months. September 8, around 18:00, was the peak of the whole year in terms of DNS traffic to news organizations, according to our data. At that time, DNS traffic was 263% higher than at the same time in the previous week. During the September 19 funeral, at 11:00, DNS traffic was 24% higher than before.

How the coronation of King Charles III affected Internet traffic

During the recent coronation weekend, DNS traffic to UK news organizations on Saturday, May 6, was higher than usual during the morning by as much as 47%, at 11:00, and continued higher than before mostly during that day.

September 8, 2022: The end of a 70-year reign

We already mentioned domain trends related to when Queen Elizabeth II passed away on September 8, 2022. But what about the impact on Internet traffic? We saw a 7% decrease in Internet traffic in the UK on that day at around 18:30 local time compared to the previous week, coinciding with the announcement of her death.

The following weekend, on Saturday, September 10, 2022, traffic was as much as 17% lower at 15:00. This was the day Charles was proclaimed the new king and people flocked to the royal palaces to pay their respects — Prince William and Kate, and Prince Harry and Meghan, paused outside Windsor Castle to read messages left by mourners.

How the coronation of King Charles III affected Internet traffic

Internet traffic dropped even further compared to the previous week during Queen Elizabeth II’s funeral: on September 19, 2022, traffic was 27% lower at 10:45. According to Wikipedia, this was when the Queen's coffin was transported from Westminster Hall to Westminster Abbey on the State Gun Carriage of the Royal Navy.

How the coronation of King Charles III affected Internet traffic

Old traditions in a recent medium

In this blog post, we've seen how a very old tradition, like the British coronation, can impact a very recent innovation, the Internet. Almost 70 years ago, Queen Elizabeth II's coronation was the first ever to be televised, at a time when television in the UK was less than 20 years old. The event, which took place at Westminster Abbey in London (the site of coronations since 1066), was watched by 27 million people in the UK alone and millions more around the world.

This time around, King Charles III's coronation could be viewed through that now old medium called television, or online, via streaming services. The Internet is much younger than Britain’s former monarch's reign or even Sir Tim Berners-Lee (born in 1955), and it was only 30 years ago that the World Wide Web protocol and code were made available royalty-free, enabling the web's widespread use.

Streaming media events online, on the other hand, at least on a large scale, are a more recent development — YouTube was launched in 2005. Looking at video platforms trends in the UK, we could see how DNS traffic was 13% higher at around 12:00, during the coronation ceremony, on May 6 — it was broadcast on YouTube.

How the coronation of King Charles III affected Internet traffic

British broadcasters, such as the BBC, also included a streaming version of the event. There, the increase in DNS traffic was even higher. Between 11:00 and 12:00, on May 6, DNS traffic was 197% higher than in the previous week.

How the coronation of King Charles III affected Internet traffic

The difference in DNS traffic to UK's streaming services was even more pronounced when Queen Elizabeth II passed away on September 8, with a 470% increase in DNS traffic around 18:00 compared to the previous week. During the Queen's funeral on September 19, DNS traffic was 150% higher around 11:00 compared to the previous week.

You can check Internet trends related to events such as Easter, Ramadan, an ongoing civil war or a relevant UK outage here in our blog. You can also monitor changes in Internet patterns as they occur on Cloudflare Radar or using the Radar API. On social media, we’re at @CloudflareRadar on Twitter or cloudflare.social/@radar on Mastodon.

Effects of the conflict in Sudan on Internet patterns

Post Syndicated from João Tomé original http://blog.cloudflare.com/sudan-armed-conflict-impact-on-the-internet-since-april-15-2023/

Effects of the conflict in Sudan on Internet patterns

Effects of the conflict in Sudan on Internet patterns

On Saturday, April 15, 2023, an armed conflict between rival factions of the military government of Sudan began. Cloudflare observed a disruption in Internet traffic on that Saturday, starting at 08:00 UTC, which deepened on Sunday. Since then, the conflict has continued, and different ISPs have been affected, in some cases with a 90% drop in traffic. On May 2, Internet traffic is still ~30% lower than pre-conflict levels. This blog post will show what we’ve been seeing in terms of Internet disruption there.

On the day that clashes broke out, our data shows that traffic in the country dropped as much as 60% on Saturday, after 08:00 UTC, with a partial recovery on Sunday around 14:00, but it has consistently been lower than before. Although we saw outages and disruptions on major local Internet providers, the general drop in traffic could also be related to different human usage patterns because of the conflict, with people trying to leave the country. In Ukraine, we saw a clear drop in traffic, not always related to ISP outages, after the war started, when people were leaving the country.

Here’s the hourly perspective of Sudan’s Internet traffic over the past weeks as seen on Cloudflare Radar, with the orange shading highlighting the disruption since April 15.

Effects of the conflict in Sudan on Internet patterns

The next chart of daily traffic in Sudan (that is dominated by mobile device traffic — more on that below) clearly shows a daily drop in traffic after April 15. On that Saturday, traffic was 27% lower than on the previous Saturday, and it was a 43% decrease on Sunday, April 16, compared to the previous week.

Effects of the conflict in Sudan on Internet patterns

Frequent outages on different ISPs

On April 23 and 24, there was a more significant outage affecting multiple ISPs (and their ASNs or autonomous systems) that brought Internet traffic in the country, as the previous chart clearly shows, even lower. There was no official reason given for those major disruptions that had a nationwide impact. That said, the disruptions were also felt in neighbor country Chad in several ISPs, given that Sudan’s Sudatel (AS15706) seems to be an upstream provider.

Cloudflare saw a 74% decrease in traffic on Sunday, April 23, compared to Sunday, April 9, before the conflict, and a 70% drop on Monday, April 24, compared with Monday, April 10. In some ISPs, the impact was bigger.

In the news, ISP MTN (AS36972) reportedly blocked Internet services on April 16, and, according to Reuters, was told by the authorities to restore it a few hours after. We saw a clear outage in that ASN, an almost 90% drop in traffic compared with previous weeks for about 10 hours, after 00:00 UTC on April 16, and it mostly recovered after 10:00 UTC.

Effects of the conflict in Sudan on Internet patterns

The most impacted ISPs were Sudatel (AS15706), Zain (AS36998), and Canar (AS33788) with almost complete outages. Canar was the outage that lasted the longest, with 83 hours, from April 21 to 25. Next, it was the main ISP in the country, Sudatel, with 40 hours of almost complete Internet blackout, followed by Zain, with 10 hours on April 24.

The return of traffic coincided with the time a nationwide ceasefire of 72 hours was agreed upon on April 24.

BGP or Border Gateway Protocol is a mechanism to exchange routing information between networks on the Internet, and a crucial part that enables the existence of the network of networks (the Internet). BGP announcements or updates can signal disruption in connectivity or outages, as we saw in Canada in 2022 with Rogers ISP or in the UK in 2023 with Virgin Media, for example. In this case, highlighted in the next chart, BGP updates biggest spikes from Sudatel (AS15706) are consistent with both the start of the outage, and the return to traffic.

Effects of the conflict in Sudan on Internet patterns

Mobile device traffic percentage grew after April 15

Sudan is typically one of the countries with the highest percentage of mobile device traffic in the world. We’ve written about this in the past (see the 2021 mobile device traffic blog post), and at the time the average was 83%. Observing data from the past week, as seen on our Cloudflare Radar traffic worldwide page, Sudan leads our ranking with 88% of traffic coming from mobile devices.

Effects of the conflict in Sudan on Internet patterns

Looking at the past few weeks, we can see mobile device traffic growing as a percentage of all Internet traffic in Sudan. The April 3 week showed a lower percentage than it is now, with 77% (23% was desktop traffic percentage). In the April 10 week, which includes April 15 and 16, mobile device traffic rose to 80%. In the week of April 17, it was 85%, and the week of April 24, it’s 88%.

Effects of the conflict in Sudan on Internet patterns

How is Internet traffic holding up more recently in Sudan? Looking at a week-over-week hourly comparison, traffic last Friday was still around 55% lower than before April 15, and on May 2, traffic is still around 30% lower than pre-conflict levels (April 11).

Effects of the conflict in Sudan on Internet patterns

In the previous chart, there’s a regular drop in traffic observed at around 16:00 UTC, ~18:00 local time. It’s more evident before April 15, but it generally continues after that. That drop in traffic is consistent with Ramadan trends we discussed recently in a blog post. It is related to the Iftar, the first meal after sunset that breaks the fast and often serves as a family or community event — sunset in Khartoum, Sudan, is at 18:07.

As of this Tuesday, Internet traffic data (from a linear perspective) shows that traffic continues to be much lower than before, and this morning at 08:00 UTC it is ~30% lower than it was three weeks ago (pre-conflict), at the same time, showing some recovery in the past couple of days.

Effects of the conflict in Sudan on Internet patterns

According to the BBC, reporting from Sudan, the Internet continues to be impacted, an observation that is consistent with our data.

Looking more closely at Sudan’s capital, Khartoum, where most people live and the conflict began, traffic was impacted after April 15 (the blue line in the next chart). On April 27, Internet traffic was around 76% lower than it was on the same pre-conflict weekday (April 13). The next chart also shows the typical drop around 18:00, for Ramadan’s Iftar, the first meal after sunset.

Effects of the conflict in Sudan on Internet patterns

Looking at DNS queries (from Cloudflare’s resolver) to websites or domains in Sudan, we saw a clear shift from the use of WhatsApp-related domains for messaging to Signal ones after April 15 — the drop in DNS traffic to WhatsApp was similar to the increase in DNS traffic to Signal domains.

Social media platforms such as LinkedIn, but also TikTok or YouTube, had a clear decrease since April 15. On the other hand, Facebook and Twitter saw an increase, especially on April 15 and 16, with some disruptions (possibly related to Internet access), but with bigger spikes than before, usually at night, since then. Here’s the aggregated view to social media platforms:

Effects of the conflict in Sudan on Internet patterns

Conclusion: ongoing impact

The conflict in Sudan continues, and so does its Internet traffic impact. We will continue to monitor the Internet situation on Cloudflare Radar, where you can check Sudan’s country page and the Outage Center.

On social media, we’re at @CloudflareRadar on Twitter or cloudflare.social/@radar on Mastodon.

How to stay safe from phishing

Post Syndicated from João Tomé original https://blog.cloudflare.com/stay-safe-phishing-attacks/

How to stay safe from phishing

How to stay safe from phishing

As you wake up in the morning feeling sleepy and preoccupied, you receive an urgent email from a seemingly familiar source, and without much thought, you click on a link that you shouldn’t have. Sometimes it’s that simple, and this more than 30-year-old phishing method means chaos breaks loose – whether it’s your personal bank account or social media, where an attacker also begins to trick your family and friends; or at your company, with what could mean systems and data being compromised, services being disrupted, and all other subsequent consequences. Following up on our “Top 50 Most Impersonated Brands in phishing attacks” post, here are some tips to catch these scams before you fall for them.

We’re all human, and responding to or interacting with a malicious email remains the primary way to breach organizations. According to CISA, 90% of cyber attacks begin with a phishing email, and losses from a similar type of phishing attack, known as business email compromise (BEC), are a $43 billion problem facing organizations. One thing is for sure, phishing attacks are getting more sophisticated every day thanks to emerging tools like AI chatbots and the expanded usage of various communication apps (Teams, Google Chat, Slack, LinkedIn, etc.).

What is phishing? Where it starts (the hacker’s foot in the door)

Seems simple, but it is always good to remind everyone in simple terms. Email phishing is a deceptive technique where the attacker uses various types of bait, such as a convincing email or link, to trick victims into providing sensitive information or downloading malware. If the bait works — the attacker only needs it to work once — and the victim clicks on that link, the attacker now has a foot in the door to carry out further attacks with potentially devastating consequences. Anyone can be fooled by a general “phish” — but these attacks can also be focused on a single target, with specific information about the victim, called spear phishing.

Recent examples of phishing include Reddit as a target, Twilio, and also Cloudflare in a similar attack around the same time — we explain here “The mechanics of a sophisticated phishing scam and how we stopped it” thanks to our own use of Cloudflare One products. In some cases, a home computer of an employee as a target can be the door opening for hackers in what is a few weeks later a major breach.

Some alerts to bear in mind include the UK’s National Cyber Security Centre (NCSC), that phishing attacks are targeting individuals and organizations in a range of sectors. The White House National Cybersecurity Strategy (Cloudflare is ready for that) also highlights those risks. Germany, Japan or Australia are working on a similar approach.

Without further ado, here are some tips to protect yourself from phishing attacks.

Tips for Staying Safe Online: How to Avoid Being Reeled in By Phishing Scams

  • Don’t click strategy. If you get an email from your bank or government agencies like the IRS, instead of clicking on a link in the email, go directly to the website itself.
  • Look out for misspellings or strange characters in the sender’s email address. Phishing attempts often rely on look-alike domains or ‘from’ emails to encourage clicks. Common tactics are extra or switched letters (microsogft[.]com), omissions (microsft[.]com) or characters that look alike (the letter o and 0, or micr0soft[.]com).

Here’s a classic brand impersonation phish, using Chase as the trusted lure:

How to stay safe from phishing
The link in the text body appears to be a Chase domain, but when clicked, it actually opens a SendGrid URL (a known email delivery platform). It then redirects the user to a phishing site impersonating Chase.
  • Think before clicking links to “unlock account” or “update payment details.” Technology services were one of the top industries to be used in phishing campaigns, due to the personal information that can be found in our email, online storage, and social media accounts. Hover over a link and confirm it’s a URL you’re familiar with before clicking.
  • Be wary of financial-related messages. Financial institutions are the most likely industry to be phished, so pause and assess any messages asking to accept or make a payment.
  • Look out for messages that create a sense of urgency. Emails or text messages that warn of a final chance to pick up a package, or last chance to confirm an account, are likely fake. The rise in online shopping during the pandemic has made retail and logistics/shipping companies a hot target for these types of phishing attempts.

    Both financial and package delivery scams typically use the SMS phishing attack, or smishing, and are related to the attacker’s use of SMS messages to lure the victims. Cloudflare was the target of this type of phishing a few months ago (it was stopped). Next, we show you an example of a text message from that thwarted attack:

How to stay safe from phishing
  • If things sound too good to be true, they probably are. Beware of “limited time offers” for free gifts, exclusive services, or great deals on trips to Hawaii or the Maldives. Phishing emails target our senses of satisfaction, pleasure, and excitement to compel us to make split second decisions without thinking things through. These types of tactics are lures for a user to click on a link or provide sensitive information. Pause, even if it’s for a few seconds, and quickly look up the offer online to see if others have received similar offers.
  • Very important message from a very important… Phishing emails sometimes mimic high-ranking individuals, urging urgent action such as money transfers or credential sharing. Scrutinize emails with such requests, and verify their authenticity. Contact your manager if the sender is a CEO. For unfamiliar politicians, assess the request’s feasibility before responding.
  • The message body is full of errors (but beware of AI tools). Poor grammar, spelling, and sentence structure may indicate that an email is not from a reputable source. That said, recent AI text tools have made it easier for hackers or bad actors to create convincing and error-free copies.
  • Romance scam emails. These are emails where scammers adopt a fake online identity to gain a victim’s affection and trust. They may also send an email that appears to have been sent in error, prompting the recipient to respond and initiating a conversation with the fraudster. This tactic is used to lure victims.
  • Use a password manager. Password managers will verify if the domain name matches what you expect, and will warn you if you try to fill in your password on the wrong domain name.

If you want to apply even greater scrutiny to a potential phishing email, you can check out our learning center to understand what happens when an email does not pass standard authentication methods like SPF, DKIM, or DMARC.

A few more Cloudflare related trends, besides the Top 50 Most Impersonated Brands, comes from Cloudflare Area 1. In 2022, our services focused on email protection identified and kept 2.3 billion unwanted messages out of customer inboxes. On average, we blocked 6.3 million messages per day. That’s almost 44,000 every 10 minutes, which is the time it takes to read a blog post like this one.

Typically, the type of email threats most used (looking at our Area 1 January 2023 data) are: identity deception, malicious links, brand impersonation, malicious attachments, scam, extortion, account compromise. And there’s also voice phishing.

Voice phishing, also known as vishing, is another common threat and is related to the practice of tricking people into sharing sensitive information through telephone calls. Victims are led to believe they are talking to a trusted entity, such as the tax authority, their employer, or an airline they use. Here, you can learn more about protecting yourself or your company from voice phishing.

Another type of attack is the watering hole attack, where hackers identify websites frequented by users within a targeted organization and then compromise those websites to distribute malware. Those are often times associated with supply chain exploitation.

Next, we show a phishing email example that was received from a real vendor that got an email account hacked in what is called vendor invoice fraud:

How to stay safe from phishing

Last but not least in our list of examples, there’s also Calendar phishing, where a fraudster could potentially use a cloud email account to inject fake invites into target employee calendars. Those are detected and avoided with products in our Cloudflare Zero Trust product.

As we wrote recently for CIO Week, there’s also a possible safety net, even if the best trained user mistakes a good link from a bad link. Leveraging the Cloudflare Browser Isolation service, Email Link Isolation turns Cloudflare’s cloud email security into the most comprehensive solution when it comes to protecting against phishing attacks that go beyond just email. It rewrites and isolates links that could be exploited, keeps users vigilant by alerting them of the uncertainty around the website they’re about to visit, and protects against malware and vulnerabilities. Also, in true Cloudflare fashion, it’s a one-click deployment. Check the related blog post to learn more.

That said, not all malicious links come from emails. If you’re concerned about malicious links that may come through Instant Messaging or other communication tools (Slack, iMessage, Facebook, Instagram, WhatsApp, etc), Zero Trust and Remote Browser Isolation are an effective way to go.

Conclusion: better safe than sorry

As we saw, email is one of the most ubiquitous and also most exploited tools that businesses use every single day. Baiting users into clicking malicious links within an email has been a particularly long-standing tactic for the vast majority of bad actors, from the most sophisticated criminal organizations to the least experienced attackers. So, remember, when online:

Be cautious. Be prepared. Be safe.

If you want to learn more about email security, you can visit our Learning Center or reach out for a complimentary phishing risk assessment for your organization.

One year of war in Ukraine: Internet trends, attacks, and resilience

Post Syndicated from João Tomé original https://blog.cloudflare.com/one-year-of-war-in-ukraine/

One year of war in Ukraine: Internet trends, attacks, and resilience

One year of war in Ukraine: Internet trends, attacks, and resilience

The Internet has become a significant factor in geopolitical conflicts, such as the ongoing war in Ukraine. Tomorrow marks one year since the Russian invasion of that country. This post reports on Internet insights and discusses how Ukraine’s Internet remained resilient in spite of dozens of disruptions in three different stages of the conflict.

Key takeaways:

  • Internet traffic shifts in Ukraine are clearly visible from east to west as Ukrainians fled the war, with country-wide traffic dropping as much as 33% after February 24, 2022.
  • Air strikes on energy infrastructure starting in October led to widespread Internet disruptions that continue in 2023.
  • Application-layer cyber attacks in Ukraine rose 1,300% in early March 2022 compared to pre-war levels.
  • Government administration, financial services, and the media saw the most attacks targeting Ukraine.
  • Traffic from a number of networks in Kherson was re-routed through Russia between June and October, subjecting traffic to Russia’s restrictions and limitations, including content filtering. Even after traffic ceased to reroute through Russia, those Ukrainian networks saw major outages through at least the end of the year, while two networks remain offline.
  • Through efforts on the ground to repair damaged fiber optics and restore electrical power, Ukraine’s networks have remained resilient from both an infrastructure and routing perspective. This is partly due to Ukraine’s widespread connectivity to networks outside the country and large number of IXPs.
  • Starlink traffic in Ukraine grew over 500% between mid-March and mid-May, and continued to grow from mid-May through mid-November, increasing nearly 300% over that six-month period. For the full period from mid-March (two weeks after it was made available) to mid-December, it was over a 1,600% increase, dropping a bit after that.

Internet changes and disruptions

An Internet shock after February 24, 2022

In Ukraine, human Internet traffic dropped as much as 33% in the weeks following February 24. The following chart shows Cloudflare’s perspective on daily traffic (by number of requests).

One year of war in Ukraine: Internet trends, attacks, and resilience

Internet traffic levels recovered over the next few months, including strong growth seen in September and October, when many Ukrainian refugees returned to the country. That said, there were also country-wide outages, mostly after October, that are discussed below.

14% of total traffic from Ukraine (including traffic from Crimea and other occupied regions) was mitigated as potential attacks, while 10% of total traffic to Ukraine was mitigated as potential attacks in the last 12 months.

Before February 24, 2022, typical weekday Internet traffic in Ukraine initially peaked after lunch, around 15:00 local time, dropped between 17:00 and 18:00 (consistent with people leaving work), and reached the biggest peak of the day at around 21:00 (possibly after dinner for mobile and streaming use).

After the invasion started, we observed less variation during the day in a clear change in the usual pattern given the reported disruption and “exodus” from the country​. During the first few days after the invasion began, peak traffic occurred around 19:00, at a time when nights for many in cities such as Kyiv were spent in improvised underground bunkers. By late March, the 21:00 peak had returned, but the early evening drop in traffic did not return until May.

When looking at Ukraine Internet requests by type of traffic in the chart below (from February 10, 2022, through February 2023), we observe that while traffic from both mobile and desktop devices dropped after the invasion, request volume from mobile devices has remained higher over the past year. Pre-war, mobile devices accounted for around 53% of traffic, and grew to around 60% during the first weeks of the invasion. By late April, it had returned to typical pre-war levels, falling back to around 54% of traffic. There’s also a noticeable December drop/outage that we’ll go over below.

One year of war in Ukraine: Internet trends, attacks, and resilience

Millions moving from east to west in Ukraine

The invasion brought attacks and failing infrastructure across a number of cities, but the target in the early days wasn’t the country’s energy infrastructure, as it was in October 2022. In the first weeks of the war, Internet traffic changes were largely driven by people evacuating conflict zones with their families. Over eight million Ukrainians left the country in the first three months, and many more relocated internally to safer cities, although many returned during the summer of 2022. The Internet played a critical role during this refugee crisis, supporting communications and access to real-time information that could save lives, as well as apps providing services, among others.

There was also an increase in traffic in the western part of Ukraine, in areas such as Lviv (further away from the conflict areas), and a decrease in the east, in areas like Kharkiv, where the Russian military was arriving and attacks were a constant threat. The figure below provides a view of how Internet traffic across Ukraine changed in the week after the war began (a darker pink means a drop in traffic — as much as 60% — while a darker green indicates an increase in Internet traffic — as much as 50%).

One year of war in Ukraine: Internet trends, attacks, and resilience
Source: https://datawrapper.dwcdn.net/dsUSJ/2/

The biggest drops in Internet traffic observed in Ukraine in the first days of the war were in Kharkiv Oblast in the east, and Chernihiv in the north, both with a 60% decrease, followed by Kyiv Oblast, with traffic 40% lower on March 2, 2022, as compared with February 23.

In western Ukraine, traffic surged. The regions with the highest observed traffic growth included Rivne (50%), Volyn (30%), Lviv (28%), Chernivtsi (25%), and Zakarpattia (15%).

At the city level, analysis of Internet traffic in Ukraine gives us some insight into usage of the Internet and availability of Internet access in those first weeks, with noticeable outages in places where direct conflict was going on or that was already occupied by Russian soldiers.

North of Kyiv, the city of Chernihiv had a significant drop in traffic the first week of the war and residual traffic by mid-March, with traffic picking up only after the Russians retreated in early April.

One year of war in Ukraine: Internet trends, attacks, and resilience

In the capital city of Kyiv, there is a clear disruption in Internet traffic right after the war started, possibly caused by people leaving, attacks and use of underground shelters.

One year of war in Ukraine: Internet trends, attacks, and resilience

Near Kyiv, we observed a clear outage in early March in Bucha. After April 1, when the Russians withdrew, Internet traffic started to come back a few weeks later.

One year of war in Ukraine: Internet trends, attacks, and resilience

In Irpin, just outside Kyiv, close to the Hostomel airport and Bucha, a similar outage pattern to Bucha was observed. Traffic only began to come back more clearly in late May.

One year of war in Ukraine: Internet trends, attacks, and resilience

In the east, in the city of Kharkiv, traffic dropped 50% on March 3, with a similar scenario seen not far away in Sumy. The disruption was related to people leaving and also by power outages affecting some networks.

One year of war in Ukraine: Internet trends, attacks, and resilience

Other cities in the south of Ukraine, like Berdyansk, had outages. This graph shows Enerhodar, the small city where Europe’s largest nuclear plant, Zaporizhzhya NPP, is located, with residual traffic compared to before.

One year of war in Ukraine: Internet trends, attacks, and resilience

In the cities located in the south of Ukraine, there were clear Internet disruptions. The Russians laid siege to Mariupol on February 24. Energy infrastructure strikes and shutdowns had an impact on local networks and Internet traffic, which fell to minimal levels by March 1. Estimates indicate that 95% of the buildings in the city were destroyed, and by mid-May, the city was fully under Russian control. While there was some increase in traffic by the end of April, it reached only ~22% of what it was before the war’s start.

One year of war in Ukraine: Internet trends, attacks, and resilience

When looking at Ukrainian Internet Service Providers (ISPs) or the autonomous systems (ASNs) they use, we observed more localized disruptions in certain regions during the first months of the war, but recovery was almost always swift. AS6849 (Ukrtel) experienced problems with very short-term outages in mid-March. AS13188 (Triolan), which services Kyiv, Chernihiv, and Kharkiv, was another provider experiencing problems (they reported a cyberattack on March 9), as could be observed in the next chart:

One year of war in Ukraine: Internet trends, attacks, and resilience

We did not observe a clear national outage in Ukraine’s main ISP, AS15895 (Kyivstar) until the October-November attacks on energy infrastructure, which also shows some early resilience of Ukrainian networks.

Ukraine’s counteroffensive and its Internet impact

As Russian troops retreated from the northern front in Ukraine, they shifted their efforts to gain ground in the east (Battle of Donbas) and south (occupation of the Kherson region) after late April. This resulted in Internet disruptions and traffic shifts, which are discussed in more detail in a section below. However, Internet traffic in the Kherson region was intermittent and included outages after May, given the battle for Internet control. News reports in June revealed that ISP workers damaged their own equipment to thwart Russia’s efforts to control the Ukrainian Internet.

Before the September Ukrainian counteroffensive, another example of the war’s impact on a city’s Internet traffic occurred during the summer, when Russian troops seized Lysychansk in eastern Ukraine in early July after what became known as the Battle of Lysychansk. Internet traffic in Lysychansk clearly decreased after the war started. That slide continues during the intense fighting that took place after April, which led to most of the city’s population leaving. By May, traffic was almost residual (with a mid-May few days short term increase).

One year of war in Ukraine: Internet trends, attacks, and resilience

In early September the Ukrainian counteroffensive took off in the east, although the media initially reported a south offensive in Kherson Oblast that was a “deception” move. The Kherson offensive only came to fruition in late October and early November. Ukraine was able to retake in September over 500 settlements and 12,000 square kilometers of territory in the Kharkiv region. At that time, there were Internet outages in several of those settlements.

In response to the successful Ukrainian counteroffensive, Russian airstrikes caused power outages and Internet disruptions in the region. That was the case in Kharkiv on September 11, 12, and 13. The figure below shows a 12-hour near-complete outage on September 11, followed by two other periods of drop in traffic.

One year of war in Ukraine: Internet trends, attacks, and resilience

When nuclear inspectors arrive, so do Internet outages

In the Zaporizhzhia region, there were also outages. On September 1, 2022, the day the International Atomic Energy Agency (IAEA) inspectors arrived at the Russian-controlled Zaporizhzhia nuclear power plant in Enerhodar, there were Internet outages in two local ASNs that service the area: AS199560 (Engrup) and AS197002 (OOO Tenor). Those outages lasted until September 10, as shown in the charts below.

One year of war in Ukraine: Internet trends, attacks, and resilience

One year of war in Ukraine: Internet trends, attacks, and resilience

More broadly, the city of Enerhodar, where the nuclear power plant is located, experienced a four-day outage after September 6.

Mid-September traffic drop in Crimea

In mid-September, following Ukraine’s counteroffensive, there were questions as to when Crimea might be targeted by Ukrainian forces, with news reports indicating that there was an evacuation of the Russian population from Crimea around September 13. We saw a clear drop in traffic on that Tuesday, compared with the previous day, as seen in the map of Crimea below (red is decrease in traffic, green is increase).

One year of war in Ukraine: Internet trends, attacks, and resilience

October brings energy infrastructure attacks and country-wide disruptions

As we have seen, the Russian air strikes targeting critical energy infrastructure began in September as a retaliation to Ukraine’s counteroffensive. The following month, the Crimean Bridge explosion on Saturday, October 8 (when a truck-borne bomb destroyed part of the bridge) led to more air strikes that affected networks and Internet traffic across Ukraine.

On Monday, October 10, Ukraine woke up to air strikes on energy infrastructure and experienced severe electricity and Internet outages. At 07:35 UTC, traffic in the country was 35% below its usual level compared with the previous week and only fully recovered more than 24 hours later. The impact was particularly significant in regions like Kharkiv, where traffic was down by around 80%, and Lviv, where it dropped by about 60%. The graph below shows how new air strikes in Lviv Oblast the following day affected Internet traffic.

One year of war in Ukraine: Internet trends, attacks, and resilience

There were clear disruptions in Internet connectivity in several regions on October 17, but also on October 20, when the destruction of several power stations in Kyiv resulted in a 25% drop in Internet traffic from Kyiv City as compared to the two previous weeks. It lasted 12 hours, and was followed the next day by a shorter partial outage as seen in the graph below.

One year of war in Ukraine: Internet trends, attacks, and resilience

In late October, according to Ukrainian officials, 30% of Ukraine’s power stations were destroyed. Self-imposed power limitations because of this destruction resulted in drops in Internet traffic observed in places like Kyiv and the surrounding region.

The start of a multi-week Internet disruption in Kherson Oblast can be seen in the graph below, showing ~70% lower traffic than in previous weeks. The disruption began on Saturday, October 22, when Ukrainians were gaining ground in the Kherson region.

One year of war in Ukraine: Internet trends, attacks, and resilience

Traffic began to return after Ukrainian forces took Kherson city on November 11, 2022. The graph below shows a week-over-week comparison for Kherson Oblast for the weeks of November 7, November 28, and December 19 for better visualization in the chart while showing the evolution through a seven-week period.

One year of war in Ukraine: Internet trends, attacks, and resilience

Ongoing strikes and Internet disruptions

Throughout the rest of the year and into 2023, Ukraine has continued to face intermittent Internet disruptions. On November 23, 2022, the country experienced widespread power outages after Russian strikes, causing a nearly 50% decrease in Internet traffic in Ukraine. This disruption lasted for almost a day and a half, further emphasizing the ongoing impact of the conflict on Ukraine’s infrastructure.

One year of war in Ukraine: Internet trends, attacks, and resilience

Although there was a recovery after that late November outage, only a few days later traffic seemed closer to normal levels. Below is a chart of the week-over-week evolution of Internet traffic in Ukraine at both a national and local level during that time:

One year of war in Ukraine: Internet trends, attacks, and resilience

In Kyiv Oblast:

One year of war in Ukraine: Internet trends, attacks, and resilience

In the Odessa region:

One year of war in Ukraine: Internet trends, attacks, and resilience

And Kharkiv (where a December 16 outage is also clear — in the green line):

One year of war in Ukraine: Internet trends, attacks, and resilience

On December 16, there was another country-level Internet disruption caused by air strikes targeting energy infrastructure. Traffic at a national level dropped as much as 13% compared with the previous week, but Ukrainian networks were even more affected. AS13188 (Triolan) had a 70% drop in traffic, and AS15895 (Kyivstar) a 40% drop, both shown in the figures below.

One year of war in Ukraine: Internet trends, attacks, and resilience

One year of war in Ukraine: Internet trends, attacks, and resilience

In January 2023, air strikes caused additional Internet disruptions. One such recent event was in Odessa, where traffic dropped as low as 54% compared with the previous week during an 18-hour disruption.

A cyber war with global impact

“Shields Up” on cyber attacks

The US government and the FBI issued warnings in March to all citizens, businesses, and organizations in the country, as well as allies and partners, to be aware of the need to “enhance cybersecurity.” The US Cybersecurity and Infrastructure Security Agency (CISA) launched the Shields Up initiative, noting that “Russia’s invasion of Ukraine could impact organizations both within and beyond the region.” The UK and Japan, among others, also issued warnings.

Below, we discuss Web Application Firewall (WAF) mitigations and DDoS attacks. A WAF helps protect web applications by filtering and monitoring HTTP traffic between a web application and the Internet. A WAF is a protocol layer 7 defense (in the OSI model), and is not designed to defend against all types of attacks. Distributed Denial of Service (DDoS) attacks are cyber attacks that aim to take down Internet properties and make them unavailable for users.

Cyber attacks rose 1,300% in Ukraine by early March

The charts below are based on normalized data, and show threats mitigated by our WAF.

Mitigated application-layer threats blocked by our WAF skyrocketed after the war started on February 24. Mitigated requests were 105% higher on Monday, February 28 than in the previous (pre-war) Monday, and peaked on March 8, reaching 1,300% higher than pre-war levels.

Between February 2022 and February 2023, an average of 10% of all traffic to Ukraine was mitigations of potential attacks.

The graph below shows the daily percentage of application layer traffic to Ukraine that Cloudflare mitigated as potential attacks. In early March, 30% of all traffic was mitigated. This fell in April, and remained low for several months, but it picked up in early September around the time of the Ukrainian counteroffensive in east and south Ukraine. The peak was reached on October 29 when DDoS attack traffic constituted 39% of total traffic to Cloudflare’s Ukrainian customer websites.

One year of war in Ukraine: Internet trends, attacks, and resilience

This trend is more evident when looking at all traffic to sites on the “.ua” top-level domain (from Cloudflare’s perspective). The chart below shows that DDoS attack traffic accounted for over 80% of all traffic by early March 2022. The first clear spikes occurred on February 16 and 19, with around 25% of traffic mitigated. There was no moment of rest after the war started, except towards the end of November and December, but the attacks resumed just before Christmas. An average of 13% of all traffic to “.ua”, between February 2022 and February 2023 was mitigations of potential attacks. The following graph provides a comprehensive view of DDoS application layer attacks on “.ua” sites:

One year of war in Ukraine: Internet trends, attacks, and resilience

Moving on to types of mitigations of product groups that were used (related to “.ua” sites), as seen in the next chart, around 57% were done by the ruleset which automatically detects and mitigates HTTP DDoS attacks (DDoS Mitigation), 31% were being mitigated by firewall rules put in place (WAF), and 10% were blocking requests based on our IP threat reputation database (IP Reputation).

One year of war in Ukraine: Internet trends, attacks, and resilience

It’s important to note that WAF rules in the graph above are also associated with custom firewall rules created by customers to provide a more tailored protection. “DDoS Mitigation” (application layer DDoS protection) and “Access Rules” (rate limiting) are specifically used for DDoS protection.

In contrast to the first graph shown in this section, which looked at mitigated attack traffic targeting Ukraine, we can also look at mitigated attack traffic originating in Ukraine. The graph below also shows that the share of mitigated traffic from Ukraine also increased considerably after the invasion started.

One year of war in Ukraine: Internet trends, attacks, and resilience

Top attacked industries: from government to news media

The industries sectors that had a higher share of WAF mitigations were government administration, financial services, and the media, representing almost half of all WAF mitigations targeting Ukraine during 2022.

Looking at DDoS attacks, there was a surge in attacks on media and publishing companies during 2022 in Ukraine. Entities targeting Ukrainian companies appeared to be focused on information-related websites. The top five most attacked industries in the Ukraine in the first two quarters of 2022 were all in broadcasting, Internet, online media, and publishing, accounting for almost 80% of all DDoS attacks targeting Ukraine.

In a more focused look at the type of websites Cloudflare has protected throughout the war, the next two graphs provide a view of mitigated application layer attacks by the type of “.ua” sites we helped to protect. In the first days of the war, mitigation spikes were observed at a news service, a TV channel, a government website, and a bank.

One year of war in Ukraine: Internet trends, attacks, and resilience

In July, spikes in mitigations we observed across other types of “.ua” websites, including food delivery, e-commerce, auto parts, news, and government.

One year of war in Ukraine: Internet trends, attacks, and resilience

More recently, in February 2023, the spikes in mitigations were somewhat similar to what we saw one year ago, including electronics, e-commerce, IT, and education websites.

One year of war in Ukraine: Internet trends, attacks, and resilience

12.6% of network-layer traffic was DDoS activity in Q1 2022

Network-layer (layer 3 and 4) traffic is harder to attribute to a specific domain or target because IP addresses are shared across different customers. Looking at network-level DDoS traffic hitting our Kyiv data center, we saw peaks of DDoS traffic higher than before the war in early March, but they were much higher in June and August.

One year of war in Ukraine: Internet trends, attacks, and resilience

In our Q1 2022 DDoS report, we also noted that 12.6% of Ukraine’s traffic was DDoS activity, compared with 1% in the previous quarter, a 1,160% quarter-over-quarter increase.

Several of our quarterly DDoS reports from 2022 include attack trends related to the war in Ukraine, with quarter over quarter interactive comparisons.

Network re-routing in Kherson

On February 24, 2022, Russian forces invaded Ukraine’s Kherson Oblast region. The city of Kherson was captured on March 2, as the first major city and only regional capital to be captured by Russian forces during the initial invasion. The Russian occupation of Kherson Oblast continued until Ukrainian forces resumed control on November 11, after launching a counteroffensive at the end of August.

On May 4, 2022, we published Tracking shifts in Internet connectivity in Kherson, Ukraine, a blog post that explored a re-routing event that impacted AS47598 (Khersontelecom), a telecommunications provider in Kherson Oblast. Below, we summarize this event, and explore similar activity across other providers in Kherson that has taken place since then.

On May 1, 2022, we observed a shift in routing for the IPv4 prefix announced by Ukrainian network AS47598 (Khersontelecom). During April, it reached the Internet through several other Ukrainian network providers, including AS12883 (Vega Telecom) and AS3326 (Datagroup). However, after the shift, its routing path now showed a Russian network, AS201776 (Miranda-Media), as the sole upstream provider. With traffic from KhersonTelecom passing through a Russian network, it was subject to the restrictions and limitations imposed on any traffic transiting Russian networks, including content filtering.

The flow of traffic from Khersontelecom before and after May 1, with rerouting through Russian network provider Miranda-Media, is illustrated in the chart below. This particular re-routing event was short-lived, as a routing update for AS47598 on May 4 saw it return to reaching the Internet through other Ukrainian providers.

One year of war in Ukraine: Internet trends, attacks, and resilience

As a basis for our analysis, we started with a list of 15 Autonomous System Numbers (ASNs) belonging to networks in Kherson Oblast. Using that list, we analyzed routing information collected by route-views2 over the past year, from February 1, 2022, to February 15, 2023. route-views2 is a BGP route collector run by the University of Oregon Route Views Project. Note that with respect to the discussions of ASNs in this and the following section, we are treating them equally, and have not specifically factored estimated user population into these analyses.

The figure below illustrates the result of this analysis, showing that re-routing of Kherson network providers (listed along the y-axis) through Russian upstream networks was fairly widespread, and for some networks, has continued into 2023. During the analysis time frame, there were three primary Russian networks that appeared as upstream providers: AS201776 (Miranda-Media), AS52091 (Level-MSK Ltd.), and AS8492 (OBIT Ltd.).

Within the graph, black bars indicate periods when the ASN effectively disappeared from the Internet; white segments indicate the ASN was dependent on other Ukraine networks as immediate upstreams; and red indicates the presence of Russian networks in the set of upstream providers. The intensity of the red shading corresponds to the percentage of announced prefixes for which a Russian network provider is present in the routing path as observed from networks outside Ukraine. Bright red shading, equivalent to “1” in the legend, indicates the presence of a Russian provider in all routing paths for announced prefixes.

One year of war in Ukraine: Internet trends, attacks, and resilience

In the blog post linked above, we referenced an outage that began on April 30. This is clearly visible in the figure as a black bar that runs for several days across all the listed ASNs. In this instance, AS47598 (KhersonTelecom) recovered a day later, but was sending traffic through AS201776 (Miranda-Media), a Russian provider, as discussed above.

Another Ukrainian network, AS49168 (Brok-X), recovered from the outage on May 2, and was also sending traffic through Miranda-Media. By May 4, most of the other Kherson networks recovered from the outage, and both AS47598 and AS49168 returned to using Ukrainian networks as immediate upstream providers. Routing remained “normal” until May 30. Then, a more widespread shift to routing traffic through Russian providers began, although it appears that this shift was preceded by a brief outage for a few networks. For the most part, this re-routing lasted through the summer and into October. Some networks saw a brief outage on October 17, but most stopped routing directly through Russia by October 22.

However, this shift away from Russia was followed by periods of extended outages. KhersonTelecom suffered such an outage, and has remained offline since October, except for the first week of November when all of its traffic routed through Russia. Many other networks rejoined the Internet in early December, relying mostly on other Ukrainian providers for Internet connectivity. However, since early December, AS204485 (PE Berislav Cable Television), AS56359 (CHP Melnikov Roman Sergeevich), and AS49465 (Teleradiocompany RubinTelecom Ltd.) have continued to use Miranda-Media as an upstream provider, in addition to experiencing several brief outages. In addition, over the last several months, AS25082 (Viner Telecom) has used both a Ukrainian network and Miranda-Media as upstream providers.

Internet resilience in Ukraine

In the context of the Internet, “resilience” refers to the ability of a network to operate continuously in a manner that is highly resistant to disruption. This includes the ability of a network to: (1) operate in a degraded mode if damaged, (2) rapidly recover if failure does occur, and (3) scale to meet rapid or unpredictable demands. Throughout the Russia-Ukraine conflict, media coverage (VICE, Bloomberg, Washington Post) has highlighted the work done in Ukraine to repair damaged fiber-optic cables and mobile network infrastructure to keep the country online. This work has been critically important to maintaining the resilience of Ukrainian Internet infrastructure.

According to PeeringDB, as of February 2023, there are 25 Internet Exchange Points (IXPs) in Ukraine and 50 interconnection facilities. (An IXP may span multiple physical facilities.) Within this set of IXPs, Autonomous Systems (ASes) belonging to international providers are currently present in over half of them. The number of facilities, IXPs, and international ASes present in Ukraine points to a resilient interconnection fabric, with multiple locations for both domestic and international providers to exchange traffic.

To better understand these international interconnections, we first analyze the connectivity of ASes in Ukraine, and we classify the links to domestic networks (links where both ASes are registered in Ukraine) and international networks (links between ASes in Ukraine and ASes outside Ukraine). To determine which ASes are domestic in Ukraine, we can use information from the extended delegation reports from the Réseaux IP Européens Network Coordination Centre (RIPE NCC), the Regional Internet Registry that covers Ukraine. We also parsed collected BGP data to extract the AS-level links between Ukrainian ASes and ASes registered in a different country, and we consider these the international connectivity of the domestic ASes.

A March 2022 article in The Economist noted that “For one thing, Ukraine boasts an unusually large number of internet-service providers—by one reckoning the country has the world’s fourth-least-concentrated Internet market. This means the network has few choke points, so is hard to disable.” As of the writing of this blog post, there are 2,190 ASes registered in Ukraine (UA ASes), and 1,574 of those ASes appear in the BGP routing table as active. These counts support the article’s characterization, and below we discuss several additional observations that reinforce Ukraine’s Internet resilience.

One year of war in Ukraine: Internet trends, attacks, and resilience

The figure above is a cumulative distribution function showing the fraction of domestic Ukrainian ASes that have direct connections to international networks. In February 2023, approximately 50% had more than one (100) international link, while approximately 10% had more than 10, and approximately 2% had 100 or more. Although these numbers have dropped slightly over the last year, they underscore the lack of centralized choke points in the Ukrainian Internet.

For the networks with international connectivity, we can also look at the distribution of “next-hop” countries – countries with which those international networks are associated. (Note that some networks may have a global footprint, and for these, the associated country is the one recorded in their autonomous system registration.) Comparing the choropleth maps below illustrates how this set of countries, and their fraction of international paths, have changed between February 2022 and February 2023. The data underlying these maps shows that international connectivity from Ukraine is distributed across 18 countries — unsurprisingly, mostly in Europe.

One year of war in Ukraine: Internet trends, attacks, and resilience

In February 2022, these countries/locations accounted for 77% of Ukraine’s next-hop international paths. The top four all had 7.8% each. However, in February 2023, the top 10 next-hop countries/locations dropped slightly to 76% of international paths. While just a slight change from the previous year, the set of countries/locations and many of their respective fractions saw considerable change.

February 2022 February 2023
1 Germany 7.85% Russia 11.62%
2 Netherlands 7.85% Germany 11.43%
3 United Kingdom 7.83% Hong Kong 8.38%
4 Hong Kong 7.81% Poland 7.93%
5 Sweden 7.77% Italy 7.75%
6 Romania 7.72% Turkey 6.86%
7 Russia 7.67% Bulgaria 6.20%
8 Italy 7.64% Netherlands 5.31%
9 Poland 7.60% United Kingdom 5.30%
10 Hungary 7.54% Sweden 5.26%

Russia’s share grew by 50% year to 11.6%, giving it the biggest share of next-hop ASes. Germany also grew to account for more than 11% of paths.

One year of war in Ukraine: Internet trends, attacks, and resilience

Satellite Internet connectivity

Cloudflare observed a rapid growth in Starlink’s ASN (AS14593) traffic to Ukraine during 2022 and into 2023. Between mid-March and mid-May, Starlink’s traffic in the country grew over 530%, and continued to grow from mid-May up until mid-November, increasing nearly 300% over that six-month period — from mid-March to mid-December the growth percentage was over 1600%. After that, traffic stabilized and even dropped a bit during January 2023.

One year of war in Ukraine: Internet trends, attacks, and resilience

Our data shows that between November and December 2022, Starlink represented between 0.22% and 0.3% of traffic from Ukraine, but that number is now lower than 0.2%.

One year of war in Ukraine: Internet trends, attacks, and resilience

Conclusion

One year in, the war in Ukraine has taken an unimaginable humanitarian toll. The Internet in Ukraine has also become a battleground, suffering attacks, re-routing, and disruptions. But it has proven to be exceptionally resilient, recovering time and time again from each setback.

We know that the need for a secure and reliable Internet there is more critical than ever. At Cloudflare, we’re committed to continue providing tools that protect Internet services from cyber attack, improve security for those operating in the region, and share information about Internet connectivity and routing inside Ukraine.

An early look at Thanksgiving 2022 Internet trends

Post Syndicated from João Tomé original https://blog.cloudflare.com/an-early-look-at-thanksgiving-2022-internet-trends/

An early look at Thanksgiving 2022 Internet trends

“The more you practice the art of thankfulness, the more you have to be thankful for.”

— Norman Vincent Peale, American author  

The turkey. The sweet potatoes. The stuffing. The pumpkin pie. Yesterday, November 24, 2022, was Thanksgiving Day in the US. A time for families and loved ones to be together and thankful, according to the tradition. Last year, we saw how the US paused shopping (and browsing) for Thanksgiving. So, how was it this year? Not only did we see Internet traffic go down (by 13%) during Thanksgiving dinner, but it was much higher than usual the day before and the day after (the Black Friday effect… so far). There was also a clear, but short, Thanksgiving day effect on e-commerce DNS trends.

We’ll have to wait to see what Black Friday looks like.

Let’s start with Internet traffic at the time of Thanksgiving dinner. Although every family is different, a 2018 survey of US consumers showed that for 42% early afternoon (between 13:00 and 15:00 is the preferred time to sit at the table and start to dig in). But 16:00 seems to be the “correct time” — The Atlantic explains why.

That said, Cloudflare Radar shows that between 21:00 and 01:00 UTC (we use that as the standard timezone in Radar) there was a clear drop in Internet traffic, mostly between 21:00 and 22:00 UTC, when traffic dropped 13%, compared with the week before. That time period is “translated” for the East Coast to between 16:00 and 20:00 EST and for the West Coast the time between 13:00 to 17:00 PST. Similar to what we saw last year.

An early look at Thanksgiving 2022 Internet trends

Radar also allows anyone to focus on the last 24 hours and check the traffic volume change compared with the previous period. The more granular view in the next graph shows not only the 13% drop during Thanksgiving dinner, but also the clear increase after. At around 01:00 EST (22:00 PST), traffic was 15% higher than the day before, and today, November 25, Black Friday morning (08:00 EST, 05:00 PST), was growing ~16% more in traffic at 09:00 EST (06:00 PST).

An early look at Thanksgiving 2022 Internet trends

It’s a similar perspective when we look at the last seven days, a filter that also shows the night before Thanksgiving in the US, traffic was 15% higher than the week before at around 01:00-03:00 EST (22:00-00:00 PST). And there’s a general increase in traffic this week, probably related to the fact it is also “Black Friday Week” (more on e-commerce trends at the end).

An early look at Thanksgiving 2022 Internet trends

In terms of Internet traffic growth (made by humans, not bots) in November, there’s a clear increase throughout the month, but mostly this week. The next chart aggregates traffic by day. So far, Tuesday, November 22, 2022, was the day of the month with most traffic in the US — +13% than what we saw on Tuesday, November 1.

An early look at Thanksgiving 2022 Internet trends

It’s also clear in the previous graph that weekends in the US have less traffic, especially Saturdays, but that Thanksgiving Day was the one with less traffic of the past two weeks — 10% less traffic than the same day the week before.

We’ve been focused on human Internet traffic. Bots, on the other hand, are not that interested in the Thanksgiving and Black Friday, and there was actually more bot traffic in the US last week than in this one. So far.

To wrap up this Internet traffic section, let’s look at mobile device trends. In the last four weeks, we saw an average of 48% of Internet traffic in the US coming from mobile devices. But on Thanksgiving Day that average was 55%. That was actually the day in November when people in the US were most online using their mobile devices.

An early look at Thanksgiving 2022 Internet trends

Here’s the view that shows the mobile percentage difference from the past two weeks, with an up to 9% increase (compared with the previous week) in mobile devices’ predominance in Internet traffic, between 10:00 and 16:00 EST (07:00-13:00 PST).

An early look at Thanksgiving 2022 Internet trends

E-commerce interest: growing (but with a Thanksgiving dip)

Now, let’s look at DNS query trends (from our globally used 1.1.1.1 DNS resolver) to e-commerce websites in the US. First, the Thanksgiving Day effect.

Aggregating several e-commerce domains, we can see not only that there are several spikes in the last two weeks, but that during Thanksgiving, there was a clear dip in DNS traffic between 15:00 and 17:00 EST (12:00-14:00 PST). How much? At 17:00 EST, Thanksgiving Day, there was 13% less DNS traffic than in the previous week.

An early look at Thanksgiving 2022 Internet trends

We have been following e-commerce trends this week on our Cloudflare Radar Twitter account. And, so far, November 14, 21 and 22, were the days that generated most interest.

An early look at Thanksgiving 2022 Internet trends

Using a smoothed seven day rolling average to those e-commerce domains (only in the US), the growth trend for the past 30 days is even more clear in the past two weeks (after a clear dip in early November). From November 13 to November 22, the rolling average grew ~5%.

An early look at Thanksgiving 2022 Internet trends

Last year, Cyber Monday was the biggest day for online shopping, in terms of DNS queries that we saw. Next week, we’ll see how it was this year.

Japan: A different kind of Thanksgiving

Also this week, Japan had its Labor Thanksgiving, an annual public holiday that was celebrated on Wednesday, November 23, 2022. And there was also a clear impact, but because, in Japan, this is a day full of events held throughout the country, there was an increase in traffic during the day. How much?

The peak was at around 01:00 UTC (10:00 in local time), when Internet traffic was 60% higher than in the previous week (and it continued to remain high during Labor Thanksgiving Day).

An early look at Thanksgiving 2022 Internet trends

You can check Cloudflare Radar, but also our Twitter account where we continue to see country patterns related to the FIFA World Cup in Qatar (Internet traffic does shift, depending on the country, when national teams are playing), but also e-commerce DNS trends.

How the Brazilian Presidential elections affected Internet traffic

Post Syndicated from João Tomé original https://blog.cloudflare.com/how-the-brazilian-presidential-elections-affected-internet-traffic/

How the Brazilian Presidential elections affected Internet traffic

Brasil, sei lá
Ou o meu coração se engana
Ou uma terra igual não há
— From Tom Jobim’s song, Brasil Nativo

How the Brazilian Presidential elections affected Internet traffic

Brazil’s recent presidential election got significant attention from both global and national media outlets, not only because of the size of the country, but also because of premature allegations of electoral fraud. The first round of the Brazilian 2022 general election was held on October 2, and the runoff was held on Sunday, October 30. With 124 million votes counted, former president Lula da Silva (2003-2010) won with 50.9% of the votes, beating incumbent Jair Bolsonaro, who had 49.1% of the votes.

How the Brazilian Presidential elections affected Internet traffic
The final results of the elections as published by the official Tribunal Super Eleitoral, with more than 124 million votes counted.)

Using Cloudflare’s data, we can explore the impact that this election had on Internet traffic patterns in Brazil, as well as interest in content from election-related websites, news organizations, social media platforms, and video platforms.

Here are a few highlights: while the runoff generated much more interest to election related websites (we actually have a view to DNS queries, a proxy to websites), the first round showed bigger increases in traffic to news organizations.

For the candidate’s domains, Lula’s win had the higher impact.

Also: official results came earlier on the runoff than the first round, and spikes in traffic were higher earlier that day (October 30).

(Note: we’re using local times — that means UTC-3, that is related to the more populated regions of Brazil — in this blog, although some charts have x-axis UTC).

Let’s start by looking at general Internet traffic in Brazil.

On election days, traffic goes down (during the day)

Using Cloudflare Radar, we can see something that has also been observed in other countries that hold Sunday elections: when most people are getting outside to vote, Internet traffic goes down (in comparison with previous Sundays). We saw this in the two rounds of the Presidential elections in France back in April 2022, in Portugal’s legislative elections in January 2022 and now, in Brazil.

How the Brazilian Presidential elections affected Internet traffic

We can also compare Sundays in October. There were five weekends. The two that had elections show the same pattern of lower traffic during the day, as seen in the previous chart. Comparing the two election days, there was a bigger drop in traffic on October 30 (down 21% at around 18:00 local time), than on October 2 (down 10% at around 20:00). Related or not, there was a bigger turnout on the runoff (124 million votes) than on the first round (123 million). Here’s the view on October 30:

How the Brazilian Presidential elections affected Internet traffic

And here’s October 2:

How the Brazilian Presidential elections affected Internet traffic

A more clear view in comparing the October weekends, and where you can see how the October 2 and 30 Sundays have the same pattern and different from the others three of the month, is this one (bear in mind that the x-axis is showing UTC time, it’s -3 hours in Brazil):

How the Brazilian Presidential elections affected Internet traffic

If we look at the main network providers (ASNs) in Brazil, the trend is the same. Claro (AS28573) also shows the drop in traffic on October 30, as does Telefonica (AS27699):

How the Brazilian Presidential elections affected Internet traffic

Here’s Telefonica:

How the Brazilian Presidential elections affected Internet traffic

We observed a similar impact from the October 30 runoff election to traffic from different states in Brazil, including São Paulo, Rio de Janeiro, Rio Grande do Norte, Minas Gerais, and Bahia.

Mobile device usage greater on weekends (and on election days)

When we look at the share of Brazil’s Internet traffic from mobile devices during October, we find that the highest percentages were on October 2 (first round of the elections, 66.3%), October 9 (66.4%) and October 30 (runoff election, 65%). We’ve seen this in other elections, an increase in mobile device traffice, so this seems to follow the same trend.

How the Brazilian Presidential elections affected Internet traffic

This chart also shows how mobile device usage in Brazil is at its highest on the weekends (all the main spikes for percentage of mobile devices are over the weekend, and more on Sundays).

Now, let’s look at anonymized and aggregated DNS traffic data from our 1.1.1.1 resolver. This data provides a proxy for traffic to, and thus interest in, different categories of sites from users in Brazil around the election.

Brazil has government websites related to elections, but also its own Tribunal Superior Eleitoral (Electoral Superior Court) that includes a website and app with live updates on the results of the elections for everyone to check. Looking at those related domains and using mean hourly traffic in September as a baseline, we can see that the October 2 first round spiked to 16x more DNS queries at 20:00 local time. However, DNS query traffic during the runoff election peaked at 18:00 local time on October 30 with 17.4x more DNS traffic as compared to the September baseline.

How the Brazilian Presidential elections affected Internet traffic

We can look more closely at each one of those two election days. On October 2, traffic had its first significant increase at around 17:00 local time, reaching 15x more requests to election-related domains as compared to the September baseline. This initial peak occurred at the same time the polling stations were closing. However, the peak that day, at 16x above baseline, was reached at 20:00 local time, as seen in the figure below.

How the Brazilian Presidential elections affected Internet traffic

On Sunday, October 30, 2022, the pattern is similar, although the peak was reached earlier, given that results started to arrive earlier than on the first round. The peak was reached at around 18:00 local time, with request traffic 17.4x above baseline.

How the Brazilian Presidential elections affected Internet traffic

As seen in the figure below, Lula first led in the official results at 18:45 local time, with votes from 67% of the polling stations counted at that time. Around 20:00 Lula was considered the winner (the peak seen in the previous chart was at that time).

How the Brazilian Presidential elections affected Internet traffic

Candidate websites: in the end, winner takes all?

For Lula-related domains, there are clear spikes around the first round of elections on October 2. A 13x spike was observed on October 1 at around 21:00 local time. Two notable spikes were observed on October 2 — one at 16.7x above baseline at 09:00 local time, and the other at 10.7x above baseline at 21:00 local time. During the October 30 runoff election, only one clear spike was observed. The spike, at 16.7x above baseline, occurred at around 20:00, coincident with the time Lula was being announced as the winner.

How the Brazilian Presidential elections affected Internet traffic

For Bolsonaro-related domains, we observed a different pattern. Increased traffic as compared to the baseline is visible in the days leading up to the first round election, reaching 10x on September 30. On October 2, a 8x spike above baseline was seen at 18:00 local time. However, the two most significant spikes seen over the course of the month were observed on October 16, at 20x above baseline, a few hours after the first Lula-Bolsonaro television debate, and on October 25, at around 20:00, at 22x above baseline. That was the last week of campaigning before the October 30 runoff and when several polling predictions were announced. The second and last Bolsonaro-Lula debate was on October 28, and there’s a spike at 22:00 to Lula’s websites, and a smaller but also clear one at 21:00 to Bolsonaro’s websites).

How the Brazilian Presidential elections affected Internet traffic

News websites: more interest in the first round

With official election results being available more rapidly, DNS traffic for Brazilian news organization websites peaked much earlier in the evening than what we saw in France, for example, where more definitive election results arrived much later on election day. But another interesting trend here is how the first round, on October 2, had 9.1x more DNS traffic (compared with the September baseline), than what we saw during the runoff on October 30 (6.1x).

How the Brazilian Presidential elections affected Internet traffic

The way the results arrived faster also had an impact on the time of the peak, occurring at around 19:00 local time on October 30, as compared to around 20:00 on October 2.

At 19:45 local time on October 30, Lula was already the winner with more than 98% of the votes counted. After 20:00 there was a clear drop in DNS traffic to news organizations.

How the Brazilian Presidential elections affected Internet traffic

On October 2, it was only around 22:00 that it became official that there would be a runoff between Lula and Bolsonaro. Peak request volume was reached at 20:00 (9x), but traffic remained high (8x) at around 21:00 and until 22:00, like the following chart shows:

How the Brazilian Presidential elections affected Internet traffic

Conclusion: Real world events impact the Internet

Cloudflare Radar, our tool for Internet insights, can provide a unique perspective on how major global or national events impact the Internet. It is interesting to not only see that a real world event can impact Internet traffic (and different types of websites) for a whole country, but also see how much that impact is represented at specific times. It’s all about human behavior at relevant moments in time, like elections as a collective event is.

Past examples of this include important presidential elections, the Super Bowl, the Oscars, Eurovision, never before seen views of the universe from a telescope , the holiday shopping season, or religious events such as Ramadan.

You can keep an eye on these trends using Cloudflare Radar.

How to enable Private Access Tokens in iOS 16 and stop seeing CAPTCHAs

Post Syndicated from João Tomé original https://blog.cloudflare.com/how-to-enable-private-access-tokens-in-ios-16-and-stop-seeing-captchas/

How to enable Private Access Tokens in iOS 16 and stop seeing CAPTCHAs

How to enable Private Access Tokens in iOS 16 and stop seeing CAPTCHAs

You go to a website or service, but before access is granted, there’s a visual challenge that forces you to select bikes, buses or traffic lights in a set of images. That can be an exasperating experience. Now, if you have iOS 16 on your iPhone, those days could be over and are just a one-time toggle enabled away.

CAPTCHA = “Completely Automated Public Turing test to tell Computers and Humans Apart”

In 2021, we took direct steps to end the madness that wastes humanity about 500 years per day called CAPTCHAs, that have been making sure you’re human and not a bot. In August 2022, we announced Private Access Tokens. With that, we’re able to eliminate CAPTCHAs on iPhones, iPads and Macs (and more to come) with open privacy-preserving standards.

On September 12, iOS 16 became generally available (iPad 16 and macOS 13 should arrive in October) and on the settings of your device there’s a toggle that can enable the Private Access Token (PAT) technology that will eliminate the need for those CAPTCHAs, and automatically validate that you are a real human visiting a site. If you already have iOS 16, here’s what you should do to confirm that the toggle is “on” (usually it is):

Settings > Apple ID > Password & Security > Automatic Verification (should be enabled)

How to enable Private Access Tokens in iOS 16 and stop seeing CAPTCHAs

What will you get? A completely invisible, private way to validate yourself, and for a website, a way to automatically verify that real users are visiting the site without the horrible CAPTCHA user experience.

Visitors using operating systems that support these tokens, including the upcoming versions of iPad and macOS, can now prove they’re human without completing a CAPTCHA or giving up personal data.

Let’s recap from our August 2022 announcement blog post what this means for different users:

If you’re an Internet user:

  • We’re helping make your mobile web experience more pleasant and more private.
  • You won’t see a CAPTCHA on a supported iOS or Mac device (other devices coming soon!) accessing the Cloudflare network.

If you’re a web or application developer:

  • You’ll know your users are humans coming from an authentic device and signed application, verified by the device vendor directly.
  • And you’ll validate users without maintaining a cumbersome SDK.

If you’re a Cloudflare customer:

  • You don’t have to do anything! Cloudflare will automatically ask for and use Private Access Tokens when using Managed Challenge.
  • Your visitors won’t see a CAPTCHA.

It’s all about simplicity, without compromising on privacy. The work done over a year was a collaboration between Cloudflare and Apple, Google, and other industry leaders to extend the Privacy Pass protocol with support for a new cryptographic token.

These tokens simplify application security for developers and security teams, and obsolete legacy, third-party SDK-based approaches for determining if a human is using a device. They work for browsers, APIs called by browsers, and APIs called within apps. After Apple announced in August that PATs would be incorporated into iOS 16, iPad 16, and macOS 13, the process of ending CAPTCHAs got a big boost. And we expect additional vendors to announce support in the near future.

Cloudflare has already incorporated PATs into our Managed Challenge platform, so any customer using this feature will automatically take advantage of this new technology to improve the browsing experience for supported devices.

In our August in-depth blog post about PATs, you can learn more about how CAPTCHAs don’t work in mobile environments and PATs remove the need for them, and how when sites can’t challenge a visitor with a CAPTCHA, they collect private data.

Improved privacy

In that blog post, we also explain how Private Access Tokens vastly improve privacy by validating without fingerprinting. So, by partnering with third parties like device manufacturers, who already have the data that would help us validate a device, we are able to abstract portions of the validation process, and confirm data without actually collecting, touching, or storing that data ourselves. Rather than interrogating a device directly, we ask the device vendor to do it for us.

Most customers won’t have to do anything to utilize Private Access Tokens. Why? To take advantage of PATs, all you have to do is choose Managed Challenge rather than Legacy CAPTCHA as a response option in a Firewall rule. More than 65% of Cloudflare customers are already doing this.

Now, if you have iOS 16 on your iPhone, it’s your turn.

Deep dives & how the Internet works

Post Syndicated from João Tomé original https://blog.cloudflare.com/deep-dives-how-the-internet-works/

Deep dives & how the Internet works

Deep dives & how the Internet works

When August comes, for many, at least in the Northern Hemisphere, it’s time to enjoy summer and/or vacations. Here are some deep dive reading suggestions from our Cloudflare Blog for any time, weather or time of the year. There’s also some reading material on how the Internet works, and a glimpse into our history.

To create the list (that goes beyond 2022), initially we asked inside the company for favorite blog posts. Many explained how a particular blog post made them want to work at Cloudflare (including some of those who have been at the company for many years). And then, we also heard from readers by asking the question on our Twitter account: “What’s your favorite blog post from the Cloudflare Blog and why?”

In early July (thinking of the July 4 US holiday) we did a sum up where some of the more recent blog posts were referenced. We’ve added a few to that list:

  • Eliminating CAPTCHAs on iPhones and Macs (✍️)
    How it works using open standards. On this topic, you can also read the detailed blog post from our research team, from 2021: Humanity wastes about 500 years per day on CAPTCHAs. It’s time to end this madness.
  • Optimizing TCP for high WAN throughput while preserving low latency (✍️)
    If you like networks, this is an in depth look of how we tune TCP parameters for low latency and high throughput.
  • Live-patching the Linux kernel (✍️)
    A detail focused blog focused on using eBPF. Code, Makefiles and more within.
  • Early Hints in the real world (✍️)  
    In depth data about it where we show how much faster the web is with it (in a Cloudflare, Google, and Shopify partnership).
  • Internet Explorer, we hardly knew ye (✍️)
    A look at the demise of Internet Explorer and the rise of the Edge browser (after Microsoft announced the end-of-life for IE).
  • When the window is not fully open, your TCP stack is doing more than you think (✍️)
    A recent deep dive shows how Linux manages TCP receive buffers and windows, and how to tune the TCP connection for the best speed. Similar blogs are: How to stop running out of ephemeral ports and start to love long-lived connections; Everything you ever wanted to know about UDP sockets but were afraid to ask.
  • How Ramadan shows up in Internet trends (✍️)
    What happens to the Internet traffic in countries where many observe Ramadan? Depending on the country, there are clear shifts and changing patterns in Internet use, particularly before dawn and after sunset. This is all coming from our Radar platform. We can see many human trends, from a relevant outage in a country (here’s the list of Q2 2022 disruptions), to events like elections, the Eurovision, the ‘Jubilee’ celebration or the James Webb Telescope pictures revelation.

2022, research focused

  • Hertzbleed attack (✍️)  
    A deep explainer where we compare a runner in a long distance race with how CPU frequency scaling leads to a nasty side channel affecting cryptographic algorithms. Don’t be confused with the older and impactful Heartbleed.
  • Future-proofing SaltStack (✍️)  
    A chronicle of our path of making the SaltStack system quantum-secure. In an extra post-quantum blog post, we highlight how we are preparing the Internet and our infrastructure for the arrival of quantum computers.
  • Unlocking QUIC’s proxying potential with MASQUE (✍️)
    A deep dive into QUIC transport protocol and a good up to date way to know more about it (related: HTTP usage trends).
  • HPKE: Standardizing public-key encryption (finally!) (✍️)  
    Two research groups have finally published the next reusable, and future-proof generation of (hybrid) public-key encryption (PKE) for Internet protocols and applications: Hybrid Public Key Encryption (HPKE).
  • Sizing Up Post-Quantum Signatures (✍️)  
    This blog (followed by this deep dive one that includes quotes from Ancient Greece) was highlighted by a reader as “life changing”. It shows the peculiar relationship between PQC (post-quantum cryptography) signatures and TLS (Transport Layer Security) size and connection quality. It’s research about how quantum computers could unlock the next age of innovation, and will break the majority of the cryptography used to protect our web browsing (more on that below). But it is also about how to make a website really fast.

If you like Twitter threads, here is a recent one from our Head of Cloudflare Research, Nick Sullivan, that explains in simple terms the way privacy on the Internet works and challenges in protecting it now and for the future.

This month we also did a full reading list/guide with our blog posts about all sorts of attacks (from DDoS to phishing, malware or ransomware) and how to stay protected in 2022.

How does it (the Internet) work

  • Cloudflare’s view of the Rogers Communications outage in Canada (✍️ 2022)
    One of the largest ISPs in Canada, Rogers Communications, had a huge outage on July 8, 2022, that lasted for more than 17 hours. From our view of the Internet, we show why we concluded it seemed caused by an internal error and how the Internet, being a network of networks, all bound together by BGP, was related to the disruption.
  • Understanding how Facebook disappeared from the Internet (✍️ 2021).
    “Facebook can’t be down, can it?”, we thought, for a second, on October 4, 2021. It was, and we had a deep dive about it, where BGP was also ‘king’.

Albert Einstein’s special theory of relativity famously dictates that no known object can travel faster than the speed of light in vacuum, which is 299,792 km/s.

  • Welcome to Speed Week and a Waitless Internet (✍️ 2021).
    There’s no object, as far as we, humans, know, that is faster than the speed of light. In this blog post you’ll get a sense of the physical limits of Internet speeds (“the speed of light is really slow”). How it all works through electrons through wires, lasers blasting data down fiber optic cables, and how building a waitless Internet is hard.
    We go on to explain the factors that go into building our fast global network: bandwidth, latency, reliability, caching, cryptography, DNS, preloading, cold starts, and more; and how Cloudflare zeroes in on the most powerful number there is: zero. And here’s a challenge, there are a few movies, books, board game references hidden in the post for you to find.

“People ask me to predict the future, when all I want to do is prevent it. Better yet, build it. Predicting the future is much too easy, anyway. You look at the people around you, the street you stand on, the visible air you breathe, and predict more of the same. To hell with more. I want better.”
Ray Bradbury, from Beyond 1984: The People Machines

  • Securing the post-quantum world (✍️ 2020).
    This one is more about the future of the Internet. We have many post-quantum related posts, including the recent standardization one (‘NIST’s pleasant post-quantum surprise’), but here you have an easy-to-understand explanation of a complex but crucial for the future of the Internet topic. More on those challenges and opportunities in 2022 here.
    The sum up is: “Quantum computers are coming that will have the ability to break the cryptographic mechanisms we rely on to secure modern communications, but there is hope”. For a quantum computing starting point, check: The Quantum Menace.
  • SAD DNS Explained (✍️ 2020).
    A 2020 attack against the Domain Name System (DNS) called SAD DNS (Side channel AttackeD DNS) leveraged features of the networking stack in modern operating systems. It’s a good excuse to explain how the DNS protocol and spoofing work, and how the industry can prevent it — another post expands on improving DNS privacy with Oblivious DoH in 1.1.1.1.
  • Privacy needs to be built into the Internet (✍️ 2020)
    A bit of history is always interesting and of value (at least for me). To launch one of our Privacy Weeks, in 2020, here’s a general view to the three different phases of the Internet. Until the 1990s the race was for connectivity. With the introduction of SSL in 1994, the Internet moved to a second phase where security became paramount (it helped create the dotcom rush and the secure, online world we live in today). Now, it’s all about the Phase 3 of the Internet we’re helping to build: always on, always secure, always private.
  • 50 Years of The Internet. Work in Progress to a Better Internet (✍️ 2019)
    In 2019, we were celebrating 50 years from when the very first network packet took flight from the Los Angeles campus at UCLA to the Stanford Research Institute (SRI) building in Palo Alto. Those two California sites had kicked-off the world of packet networking, on the ARPANET, and of the modern Internet as we use and know it today. Here we go through some Internet history.
    This reminds me of this December 2021 conversation about how the Web began, 30 years earlier. Cloudflare CTO John Graham-Cumming meets Dr. Ben Segal, early Internet pioneer and CERN’s first official TCP/IP Coordinator, and Francois Fluckiger, director of the CERN School of Computing. Here, we learn how the World Wide Web became an open source project.
  • Welcome to Crypto Week (✍️ 2018).
    If you want to know why cryptography is so important for the Internet, here’s a good place to start. The Internet, with all of its marvels in connecting people and ideas, needs an upgrade, and one of the tools that can make things better is cryptography. There’s also a more mathematical privacy pass protocol related perspective (that is the basis of the work to eliminate CAPTCHAs).
  • Why TLS 1.3 isn’t in browsers yet (✍️ 2017).
    It’s all about: “Upgrading a security protocol in an ecosystem as complex as the Internet is difficult. You need to update clients and servers and make sure everything in between continues to work correctly. The Internet is in the middle of such an upgrade right now.” More on that from 2021 here: Handshake Encryption: Endgame (an ECH update).
  • How to build your own public key infrastructure (✍️ 2015).
    A way of getting to know how a major part of securing a network as geographically diverse as Cloudflare’s is protecting data as it travels between datacenters. “Great security architecture requires a defense system with multiple layers of protection”. From the same year, here’s something about digital signatures being the bedrock of trust.
  • A (Relatively Easy To Understand) Primer on Elliptic Curve Cryptography (✍️ 2013).
    Also thinking of how the Internet will continue to work for years to come, here’s a very complex topic made simple about one of the most powerful but least understood types of cryptography in wide use.
  • Why Google Went Offline Today and a Bit about How the Internet Works (✍️ 2012).
    We had several similar blog posts over the years, but this 10-year old one from Tom Paseka set the tone on how we could give a good technical explanation for something that was impacting so many. Here ​​Internet routing, route leakages are discussed and it all ends on a relevant note: “Just another day in our ongoing efforts to #savetheweb.” Quoting from someone in the company for nine years: “This blog was the one that first got me interested in Cloudflare”.

Again, if you like Twitter threads, this recent Nick Sullivan one starts with an announcement (Cloudflare now allows experiments with post-quantum cryptography) and goes on explaining what some of the more relevant Internet acronyms mean. Example: TLS, or Transport Layer Security, it’s the ubiquitous encryption and authentication protocol that protects web requests online.

Blast from the past (some history)

A few also recently referenced blog posts from the past, some more technical than others.

  • Introducing DNS Resolver, 1.1.1.1 (not a joke) (✍️ 2018).
    The first consumer-focused service Cloudflare has ever released, our DNS resolver, 1.1.1.1 — a recursive DNS service — was launched on April 1, 2018, and this is the technical explanation. With this offering, we started fixing the foundation of the Internet by building a faster, more secure and privacy-centric public DNS resolver. And, just this month, we’ve added privacy proofed features (a geolocation accuracy “pizza test” included).
  • Cloudflare goes InterPlanetary – Introducing Cloudflare’s IPFS Gateway (✍️ 2018).
    We introduced Cloudflare’s IPFS Gateway, an easy way to access content from the InterPlanetary File System (IPFS). This served as the platform for many new, at the time, highly-reliable and security-enhanced web applications. It was the first product to be released as part of our Distributed Web Gateway project and is a different perspective from the traditional web.
    IPFS is a peer-to-peer file system composed of thousands of computers around the world, each of which stores files on behalf of the network. And, yes, it can be used as a method for a possible Mars (Moon, etc.) Internet in the future. About that, the same goes for code that will need to be running on Mars, something we mention about Workers here.
  • LavaRand in Production: The Nitty-Gritty Technical Details (✍️ 2017).
    Our lava lamps wall in the San Francisco office is much more than a wall of lava lamps (the YouTuber Tom Scott did a 2017 video about it) and in this blog we explain the in-depth look at the technical details (there’s a less technical one on how randomness in cryptography works).
  • Introducing Cloudflare Workers (✍️ 2017).
    There are several announcements each year, but this blog (associated with the explanation, Code Everywhere: Why We Built Cloudflare Workers) was referenced this week by some as one of those with a clear impact. It was when we started making Cloudflare’s network programmable. In 2018, Workers was available to everyone and, in 2019, we registered the trademark for The Network is the Computer®, to encompass how Cloudflare is using its network to pave the way for the future of the Internet.
  • What’s the story behind the names of CloudFlare’s name servers? (✍️ 2013)
    Another one referenced this week is the answer to the question we got often back in 2013: what the names of our nameservers mean. Here’s the story — there’s even an Apple co-founder Steve Wozniak tribute.

2022 attacks! An August reading list to go “Shields Up”

Post Syndicated from João Tomé original https://blog.cloudflare.com/2022-attacks-an-august-reading-list-to-go-shields-up/

2022 attacks! An August reading list to go “Shields Up”

2022 attacks! An August reading list to go “Shields Up”

In 2022, cybersecurity is a must-have for those who don’t want to take chances on getting caught in a cyberattack with difficult to deal consequences. And with a war in Europe (Ukraine) still going on, cyberwar also doesn’t show signs of stopping in a time when there never were so many people online, 4.95 billion in early 2022, 62.5% of the world’s total population (estimates say it grew around 4% during 2021 and 7.3% in 2020).

Throughout the year we, at Cloudflare, have been making new announcements of products, solutions and initiatives that highlight the way we have been preventing, mitigating and constantly learning, over the years, with several thousands of small and big cyberattacks. Right now, we block an average of 124 billion cyber threats per day. The more we deal with attacks, the more we know how to stop them, and the easier it gets to find and deal with new threats — and for customers to forget we’re there, protecting them.

In 2022, we have been onboarding many customers while they’re being attacked, something we know well from the past (Wikimedia/Wikipedia or Eurovision are just two case-studies of many, and last year there was a Fortune Global 500 company example we wrote about). Recently, we dealt and did a rundown about an SMS phishing attack.

Providing services for almost 20% of websites online and to millions of Internet properties and customers using our global network in more than 270 cities (recently we arrived to Guam) also plays a big role. For example, in Q1’22 Cloudflare blocked an average of 117 billion cyber threats each day (much more than in previous quarters).

Now that August is here, and many in the Northern Hemisphere are enjoying the summer and vacations, let’s do a reading list that is also a sum up focused on cyberattacks that also gives, by itself, some 2022 guide on this more than ever relevant area.

War & Cyberwar: Attacks increasing

But first, some context. There are all sorts of attacks, but they have been generally speaking increasing and just to give some of our data regarding DDoS attacks in 2022 Q2: ​​application-layer attacks increased by 72% YoY (Year over Year) and network-layer DDoS attacks increased by 109% YoY.

The US government gave “warnings” back in March, after the war in Ukraine started, to all in the country but also allies and partners to be aware of the need to “enhance cybersecurity”. The US Cybersecurity and Infrastructure Security Agency (CISA) created the Shields Up initiative, given how the “Russia’s invasion of Ukraine could impact organizations both within and beyond the region”. The UK and Japan, among others, also issued warnings.

That said, here are the two first and more general about attacks reading list suggestions:

Shields up: free Cloudflare services to improve your cyber readiness (✍️)
After the war started and governments released warnings, we did this free Cloudflare services cyber readiness sum up blog post. If you’re a seasoned IT professional or a novice website operator, you can see a variety of services for websites, apps, or APIs, including DDoS mitigation and protection of teams or even personal devices (from phones to routers). If this resonates with you, this announcement of collaboration to simplify the adoption of Zero Trust for IT and security teams could also be useful: CrowdStrike’s endpoint security meets Cloudflare’s Zero Trust Services.

In Ukraine and beyond, what it takes to keep vulnerable groups online (✍️)
This blog post is focused on the eighth anniversary of our Project Galileo, that has been helping human-rights, journalism and non-profits public interest organizations or groups. We highlight the trends of the past year, including the dozens of organizations related to Ukraine that were onboarded (many while being attacked) since the war started. Between July 2021 and May 2022, we’ve blocked an average of nearly 57.9 million cyberattacks per day, an increase of nearly 10% over last year in a total of 18 billion attacks.

In terms of attack methods to Galileo protected organizations, the largest fraction (28%) of mitigated requests were classified as “HTTP Anomaly”, with 20% of mitigated requests tagged as SQL injection or SQLi attempts (to target databases) and nearly 13% as attempts to exploit specific CVEs (publicly disclosed cybersecurity vulnerabilities) — you can find more insights about those here, including the Spring4Shell vulnerability, the Log4j or the Atlassian one.

And now, without further ado, here’s the full reading list/attacks guide where we highlight some blog posts around four main topics:

1. DDoS attacks & solutions

2022 attacks! An August reading list to go “Shields Up”
The most powerful botnet to date, Mantis.

Cloudflare mitigates 26 million request per second DDoS attack (✍️)
Distributed Denial of Service (DDoS) are the bread and butter of state-based attacks, and we’ve been automatically detecting and mitigating them. Regardless of which country initiates them, bots are all around the world and in this blog post you can see a specific example on how big those attacks can be (in this case the attack targeted a customer website using Cloudflare’s Free plan). We’ve named this most powerful botnet to date, Mantis.

That said, we also explain that although most of the attacks are small, e.g. cyber vandalism, even small attacks can severely impact unprotected Internet properties.

DDoS attack trends for 2022 Q2 (✍️)
We already mentioned how application (72%) and network-layer (109%) attacks have been growing year over year — in the latter, attacks of 100 Gbps and larger increased by 8% QoQ, and attacks lasting more than 3 hours increased by 12% QoQ. Here you can also find interesting trends, like how Broadcast Media companies in Ukraine were the most targeted in Q2 2022 by DDoS attacks. In fact, all the top five most attacked industries are all in online/Internet media, publishing, and broadcasting.

Cloudflare customers on Free plans can now also get real-time DDoS alerts (✍️)
A DDoS is cyber-attack that attempts to disrupt your online business and can be used in any type of Internet property, server, or network (whether it relies on VoIP servers, UDP-based gaming servers, or HTTP servers). That said, our Free plan can now get real-time alerts about HTTP DDoS attacks that were automatically detected and mitigated by us.

One of the benefits of Cloudflare is that all of our services and features can work together to protect your website and also improve its performance. Here’s our specialist, Omer Yoachimik, top 3 tips to leverage a Cloudflare free account (and put your settings more efficient to deal with DDoS attacks):

  1. Put Cloudflare in front of your website:

  2. Leverage Cloudflare’s free security features

    • DDoS Protection: it’s enabled by default, and if needed you can also override the action to Block for rules that have a different default value.
    • Security Level: this feature will automatically issue challenges to requests that originate from IP addresses with low IP reputation. Ensure it’s set to Medium at least.
    • Block bad bots – Cloudflare’s free tier of bot protection can help ward off simple bots (from cloud ASNs) and headless browsers by issuing a computationally expensive challenge.
    • Firewall rules: you can create up to five free custom firewall rules to block or challenge traffic that you never want to receive.
    • Managed Ruleset: in addition to your custom rule, enable Cloudflare’s Free Managed Ruleset to protect against high and wide impacting vulnerabilities
  3. Move your content to the cloud

    • Cache as much of your content as possible on the Cloudflare network. The fewer requests that hit your origin, the better — including unwanted traffic.

2. Application level attacks & WAF

Application security: Cloudflare’s view (✍️)
Did you know that around 8% of all Cloudflare HTTP traffic is mitigated? That is something we explain in this application’s general trends March 2022 blog post. That means that overall, ~2.5 million requests per second are mitigated by our global network and never reach our caches or the origin servers, ensuring our customers’ bandwidth and compute power is only used for clean traffic.

You can also have a sense here of what the top mitigated traffic sources are — Layer 7 DDoS and Custom WAF (Web Application Firewall) rules are at the top — and what are the most common attacks. Other highlights include that at that time 38% of HTTP traffic we see is automated (right the number is actually lower, 31% — current trends can be seen on Radar), and the already mentioned (about Galileo) SQLi is the most common attack vector on API endpoints.

WAF for everyone: protecting the web from high severity vulnerabilities (✍️)
This blog post shares a relevant announcement that goes hand in hand with Cloudflare mission of “help build a better Internet” and that also includes giving some level of protection even without costs (something that also help us be better in preventing and mitigating attacks). So, since March we are providing a Cloudflare WAF Managed Ruleset that is running by default on all FREE zones, free of charge.

On this topic, there has also been a growing client side security number of threats that concerns CIOs and security professionals that we mention when we gave, in December, all paid plans access to Page Shield features (last month we made Page Shield malicious code alerts more actionable. Another example is how we detect Magecart-Style attacks that have impacted large organizations like British Airways and Ticketmaster, resulting in substantial GDPR fines in both cases.

3. Phishing (Area 1)

Why we are acquiring Area 1 (✍️)
Phishing remains the primary way to breach organizations. According to CISA, 90% of cyber attacks begin with it. And, in a recent report, the FBI referred to Business Email Compromise as the $43 Billion problem facing organizations.

It was in late February that it was announced that Cloudflare had agreed to acquire Area 1 Security to help organizations combat advanced email attacks and phishing campaigns. Our blog post explains that “Area 1’s team has built exceptional cloud-native technology to protect businesses from email-based security threats”. So, all that technology and expertise has been integrated since then with our global network to give customers the most complete Zero Trust security platform available.

The mechanics of a sophisticated phishing scam and how we stopped it (✍️)
What’s in a message? Possibly a sophisticated attack targeting employees and systems. On August 8, 2022, Twilio shared that they’d been compromised by a targeted SMS phishing attack. We saw an attack with very similar characteristics also targeting Cloudflare’s employees. Here, we do a rundown on how we were able to thwart the attack that could have breached most organizations, by using our Cloudflare One products, and physical security keys. And how others can do the same. No Cloudflare systems were compromised.

Our Cloudforce One threat intelligence team dissected the attack and assisted in tracking down the attacker.

2022 attacks! An August reading list to go “Shields Up”

Introducing browser isolation for email links to stop modern phishing threats (✍️)
Why do humans still click on malicious links? It seems that it’s easier to do it than most people think (“human error is human”). Here we explain how an organization nowadays can’t truly have a Zero Trust security posture without securing email; an application that end users implicitly trust and threat actors take advantage of that inherent trust.

As part of our journey to integrate Area 1 into our broader Zero Trust suite, Cloudflare Gateway customers can enable Remote Browser Isolation for email links. With that, we now give unmatched level of protection from modern multi-channel email-based attacks. While we’re at it, you can also learn how to replace your email gateway with Cloudflare Area 1.

About account takeovers, we explained back in March 2021 how we prevent account takeovers on our own applications (on the phishing side we were already using, as a customer, at the time, Area 1).

Also from last year, here’s our research in password security (and the problem of password reuse) — it gets technical. There’s a new password related protocol called OPAQUE (we added a new demo about it on January 2022) that could help better store secrets that our research team is excited about.

4. Malware/Ransomware & other risks

How Cloudflare Security does Zero Trust (✍️)
Security is more than ever part of an ecosystem that the more robust, the more efficient in avoiding or mitigating attacks. In this blog post written for our Cloudflare One week, we explain how that ecosystem, in this case inside our Zero Trust services, can give protection from malware, ransomware, phishing, command & control, shadow IT, and other Internet risks over all ports and protocols.

Since 2020, we launched Cloudflare Gateway focused on malware detection and prevention directly from the Cloudflare edge. Recently, we also include our new CASB product (to secure workplace tools, personalize access, secure sensitive data).

2022 attacks! An August reading list to go “Shields Up”

Anatomy of a Targeted Ransomware Attack (✍️)
What a ransomware attack looks like for the victim:

“Imagine your most critical systems suddenly stop operating. And then someone demands a ransom to get your systems working again. Or someone launches a DDoS against you and demands a ransom to make it stop. That’s the world of ransomware and ransom DDoS.”

Ransomware attacks continue to be on the rise and there’s no sign of them slowing down in the near future. That was true more than a year ago, when this blog post was written and is still ongoing, up 105% YoY according to a Senate Committee March 2022 report. And the nature of ransomware attacks is changing. Here, we highlight how Ransom DDoS (RDDoS) attacks work, how Cloudflare onboarded and protected a Fortune 500 customer from a targeted one, and how that Gateway with antivirus we mentioned before helps with just that.

We also show that with ransomware as a service (RaaS) models, it’s even easier for inexperienced threat actors to get their hands on them today (“RaaS is essentially a franchise that allows criminals to rent ransomware from malware authors”). We also include some general recommendations to help you and your organization stay secure. Don’t want to click the link? Here they are:

  • Use 2FA everywhere, especially on your remote access entry points. This is where Cloudflare Access really helps.
  • Maintain multiple redundant backups of critical systems and data, both onsite and offsite
  • Monitor and block malicious domains using Cloudflare Gateway + AV
  • Sandbox web browsing activity using Cloudflare RBI to isolate threats at the browser
2022 attacks! An August reading list to go “Shields Up”

Investigating threats using the Cloudflare Security Center (✍️)
Here, first we announce our new threat investigations portal, Investigate, right in the Cloudflare Security Center, that allows all customers to query directly our intelligence to streamline security workflows and tighten feedback loops.

That’s only possible because we have a global and in-depth view, given that we protect millions of Internet properties from attacks (the free plans help us to have that insight). And the data we glean from these attacks trains our machine learning models and improves the efficacy of our network and application security products.

Steps we’ve taken around Cloudflare’s services in Ukraine, Belarus, and Russia (✍️)
There’s an emergence of the known as wiper malware attacks (intended to erase the computer it infects) and in this blog post, among other things, we explain how when a wiper malware was identified in Ukraine (it took offline government agencies and a major bank), we successfully adapted our Zero Trust products to make sure our customers were protected. Those protections include many Ukrainian organizations, under our Project Galileo that is having a busy year, and they were automatically put available to all our customers. More recently, the satellite provider Viasat was affected.

Zaraz use Workers to make third-party tools secure and fast (✍️)
Cloudflare announced it acquired Zaraz in December 2021 to help us enable cloud loading of third-party tools. Seems unrelated to attacks? Think again (this takes us back to the secure ecosystem I already mentioned). Among other things, here you can learn how Zaraz can make your website more secure (and faster) by offloading third-party scripts.

That allows to avoid problems and attacks. Which? From code tampering to lose control over the data sent to third-parties. My colleague Yo’av Moshe elaborates on what this solution prevents: “the third-party script can intentionally or unintentionally (due to being hacked) collect information it shouldn’t collect, like credit card numbers, Personal Identifiers Information (PIIs), etc.”. You should definitely avoid those.

Introducing Cloudforce One: our new threat operations and research team (✍️)
Meet our new threat operations and research team: Cloudforce One. While this team will publish research, that’s not its reason for being. Its primary objective: track and disrupt threat actors. It’s all about being protected against a great flow of threats with minimal to no involvement.

Wrap up

The expression “if it ain’t broke, don’t fix it” doesn’t seem to apply to the fast pacing Internet industry, where attacks are also in the fast track. If you or your company and services aren’t properly protected, attackers (human or bots) will probably find you sooner than later (maybe they already did).

To end on a popular quote used in books, movies and in life: “You keep knocking on the devil’s door long enough and sooner or later someone’s going to answer you”. Although we have been onboarding many organizations while attacks are happening, that’s not the less hurtful solution — preventing and mitigating effectively and forget the protection is even there.

If you want to try some security features mentioned, the Cloudflare Security Center is a good place to start (free plans included). The same with our Zero Trust ecosystem (or Cloudflare One as our SASE, Secure Access Service Edge) that is available as self-serve, and also includes a free plan (this vendor-agnostic roadmap shows the general advantages of the Zero Trust architecture).

If trends are more your thing, Cloudflare Radar has a near real-time dedicated area about attacks, and you can browse and interact with our DDoS attack trends for 2022 Q2 report.

How the James Webb Telescope’s cosmic pictures impacted the Internet

Post Syndicated from João Tomé original https://blog.cloudflare.com/how-the-james-webb-telescopes-cosmic-pictures-impacted-the-internet/

How the James Webb Telescope's cosmic pictures impacted the Internet
The James Webb Telescope reveals emerging stellar nurseries and individual stars in the Carina Nebula that were previously obscured. Credits: NASA, ESA, CSA, and STScI. Full image here.

“Somewhere, something incredible is waiting to be known.” Carl Sagan

How the James Webb Telescope's cosmic pictures impacted the Internet

In the past few years, space technology and travel have been trending with increased  attention and endeavors (including private ones). In our 2021 Year in Review we showed how NASA and SpaceX flew higher, at least in terms of interest on the Internet.

This week, NASA in collaboration with the European Space Agency (ESA) and the Canadian Space Agency (CSA), released the first images from the James Webb Telescope (JWST) which conducts infrared astronomy to “reveal the unseen universe”.

How the James Webb Telescope's cosmic pictures impacted the Internet
Webb’s First Deep Field is the first operational image taken by the James Webb Space Telescope, depicting a galaxy cluster with a distance of 5.12 billion light-years from Earth. Revealed to the public on 11 July 2022. Credits: NASA, ESA, CSA, and STScI. Full image here.

So, let’s dig into something we really like here at Cloudflare, checking how real life and human interest has an impact on the Internet. In terms of general Internet traffic in the US, Radar shows us that there was an increase both on July 11 and July 12, compared to the previous week (bear in mind that July 4, the previous Monday, was the Independence Day holiday in the US).

How the James Webb Telescope's cosmic pictures impacted the Internet

Next, we look at DNS request trends to get a sense of traffic to Internet properties (and using from this point on EST time in all the charts). Let’s start with the cornucopia of NASA, ESA and other websites (there are many, some dedicated just to the James Webb Telescope findings).

There are two clear spikes in the next chart. The first was around the time the first galaxy cluster infrared image was announced by Joe Biden, on Monday, July 11, 2022 (at 17:00), with traffic rising 13x higher than in the previous week. There was also a 5x spike at 01:00 EST that evening. The second spike was higher and longer and happened during Tuesday, July 12, 2022, when more images were revealed. Tuesday’s peak was at 10:00, with traffic being 19x higher than in the previous week — traffic was higher than 10x between 09:00 and 13:00.

How the James Webb Telescope's cosmic pictures impacted the Internet

The first image was presented by US president at around 17:00 on July 11. DNS traffic was 1.5x higher to White House-related websites than any time in the preceding month.

How the James Webb Telescope's cosmic pictures impacted the Internet

Conclusion: space, the final frontier

As we saw in 2021, space projects and announcements continue to have a clear impact on the Internet, in this case in our DNS request view of Internet traffic. So far, what the James Webb Telescope images are showing us is a glimpse of a never-before-seen picture of parts of the universe (there’s no lack of excitement in Cloudflare’s internal chat groups).

You can keep an eye on these and other trends using Cloudflare Radar and follow @CloudflareRadar on Twitter — recently we covered extensively Canada’s Internet outage.

Cloudflare’s view of the Rogers Communications outage in Canada

Post Syndicated from João Tomé original https://blog.cloudflare.com/cloudflares-view-of-the-rogers-communications-outage-in-canada/

Cloudflare’s view of the Rogers Communications outage in Canada

Cloudflare’s view of the Rogers Communications outage in Canada

An outage at one of the largest ISPs in Canada, Rogers Communications, started earlier today, July 8, 2022, and is ongoing (eight hours and counting), and is impacting businesses and consumers. At the time of writing, we are seeing a very small amount of traffic from Rogers, but we are only seeing residual traffic, and nothing close to a full recovery to normal traffic levels.

Based on what we’re seeing and similar incidents in the past, we believe this is likely to be an internal error, not a cyber attack.

Cloudflare Radar shows a near complete loss of traffic from Roger’s ASN, AS812, that started around 08:45 UTC (all times in this blog are UTC).

Cloudflare’s view of the Rogers Communications outage in Canada

What happened?

Cloudflare data shows that there was a clear spike in BGP (Border Gateway Protocol) updates after 08:15, reaching its peak at 08:45.

Cloudflare’s view of the Rogers Communications outage in Canada

BGP is a mechanism to exchange routing information between networks on the Internet. The big routers that make the Internet work have huge, constantly updated lists of the possible routes that can be used to deliver each network packet to its final destination. Without BGP, the Internet routers wouldn’t know what to do, and the Internet wouldn’t exist.

The Internet is literally a network of networks, or for the maths fans, a graph, with each individual network a node in it, and the edges representing the interconnections. All of this is bound together by BGP. BGP allows one network (say Rogers) to advertise its presence to other networks that form the Internet. Rogers is not advertising its presence, so other networks can’t find Roger’s network and so it is unavailable.

A BGP update message informs a router of changes made to a prefix (a group of IP addresses) advertisement or entirely withdraws the prefix. In this next chart, we can see that at 08:45 there was a withdrawal of prefixes from Roger’s ASN.

Cloudflare’s view of the Rogers Communications outage in Canada

Since then, at 14:30, attempts seem to be made to advertise their prefixes again. This maps to us seeing a slow increase in traffic again from Rogers’ end users.

Cloudflare’s view of the Rogers Communications outage in Canada

The graph below, which shows the prefixes we were receiving from Rogers in Toronto, clearly shows the withdrawal of prefixes around 08:45, and the slow start in recovery at 14:30, with another round of withdraws at around 15:45.

Cloudflare’s view of the Rogers Communications outage in Canada

Outages happen more regularly than people think. This week we did an Internet disruptions overview for Q2 2022 where you can get a better sense of that, and on how collaborative and interconnected the Internet (the network of networks) is. And not so long ago Facebook had an hours long outage where BGP updates showed Facebook itself disappearing from the Internet.

Follow @CloudflareRadar on Twitter for updates on Internet disruptions as they occur, and find up-to-date information on Internet trends using Cloudflare Radar.

How Queen Elizabeth II’s Platinum Jubilee had an impact on the Internet

Post Syndicated from João Tomé original https://blog.cloudflare.com/queens-platinum-jubilee/

How Queen Elizabeth II’s Platinum Jubilee had an impact on the Internet

“I declare before you all that my whole life, whether it be long or short, shall be devoted to your service and the service of our great imperial family to which we all belong.”
Queen Elizabeth II birthday speech, April 21, 1947

How Queen Elizabeth II’s Platinum Jubilee had an impact on the Internet

The rising and setting of the sun has an impact on human behaviour and on Internet trends, and events like this weekend’s celebration of Queen Elizabeth II’s Platinum Jubilee also show up in Internet trends.

When Elizabeth II’s reign started, on February 6, 1952 (the coronation was on June 2, 1953), the Turing machine had already been proposed (1936), and with that the basis for computer science. ARPANET, which became the technical foundation of the Internet, was still a dream that came to fruition in the late 60s — the World Wide Web is from 1989 and in 2014 we celebrated its Silver Jubilee. So, with that in mind, let’s answer the question: did the 2022 celebrations of the first British monarch with a 70th anniversary on the throne have an impact on the UK’s Internet traffic?

First, some details about the Platinum Jubilee. There was a four-day bank holiday (June 2-5) in the UK for the celebration that included parades and pageants, and several ceremonies. There was a Big Jubilee Lunch in many communities on Sunday, June 5, and more than 16,000 street parties (pubs and bars were also allowed to stay open for extra two hours). In events like these, not only there’s a lot to do outside, but also to see on the television and that impacts the Internet — we saw it during the Eurovision 2022 final.

Looking at Cloudflare Radar’s data from the UK, we can see that this past weekend clearly had less Internet traffic compared to recent weekends, so people were less online during the daytime, when the Jubilee was being celebrated. Here’s the chart with the previous four weekends of the UK’s Internet traffic:

How Queen Elizabeth II’s Platinum Jubilee had an impact on the Internet

That lower traffic trend is most clear on Saturday, June 4, at 20:00 local time, when traffic was 23% lower than on the previous Saturday, and on Sunday, June 5, at 15:00, when traffic was 25% lower than on the previous Sunday. The weather was actually sunnier on the previous weekend, May 28-29, but people did seem to have many reasons (related to the Jubilee) to go outside or at least be less online.

Looking at the full picture of when the four-day bank holiday started, Thursday, June 2, 2022, until Sunday, June 5, there’s a clear trend of less traffic through all of those days, which is not unusual, at least for Thursday and Friday, considering that holidays usually have traffic more similar to weekends than weekdays.

How Queen Elizabeth II’s Platinum Jubilee had an impact on the Internet

No surprise, when there’s a holiday, or it’s the weekend people tend to use their mobile devices more to access the Internet, and that was clearly what we saw in the UK since Thursday, June 2, mobile traffic (green line) was always prevalent compared to desktop traffic (blue line) since then.

How Queen Elizabeth II’s Platinum Jubilee had an impact on the Internet

On the weekdays before June 2, we can see that Internet traffic by mobile devices only stands out after 18:00 (before that, with people working, desktop took the lead).

From Canada to New Zealand

There are several other commonwealth countries that also had relevant events to celebrate since June 2 and through the past weekend for the Queen’s Platinum Jubilee. Canada is one with several activities throughout the country, including free admission to museums and historic sites, park parties and concerts.

Related to the Jubilee celebrations or not, Internet traffic in Canada was lower this past weekend than in the previous one. Saturday, June 4, at 22:00 in Toronto traffic was 13% lower than in the previous period, and throughout the day that was also the case. On Sunday, traffic was only lower during daytime, especially around 12:00 in Toronto, when it was 15% lower than in the previous Sunday. That was the time of the Jubilee Pageant, in central London (in the next charts, times are in UTC).​​

How Queen Elizabeth II’s Platinum Jubilee had an impact on the Internet

Something similar can be seen in terms of lower traffic this weekend in Australia:

How Queen Elizabeth II’s Platinum Jubilee had an impact on the Internet

And also New Zealand:

How Queen Elizabeth II’s Platinum Jubilee had an impact on the Internet

Royal family and news websites (Boris Johnson’s no confidence vote included)

Here we’re looking at DNS request trends to get a sense of traffic to Internet properties. First, we can see that websites concerning the UK Royal family and the Jubilee were clearly seeing more traffic after Wednesday, June 1 (the day before the four-day bank holiday). The three biggest spikes were: Wednesday evening, when traffic was 777% higher at 22:00 (compared to the previous week); the next morning (08:00), when it rose 1060%; and on Saturday evening (21:00) it got 1043% more traffic.

How Queen Elizabeth II’s Platinum Jubilee had an impact on the Internet

UK-based news websites (TV broadcasters and newspapers) also covered Queen Elizabeth II’s Platinum Jubilee extensively over the extended weekend. And there are three big highlights/spikes from the past few days regarding media outlets’ websites, but only two seem to be related to the Jubilee or the bank holidays.

How Queen Elizabeth II’s Platinum Jubilee had an impact on the Internet

We can see that the biggest spike in traffic (75% more than the previous period) was the night before the Jubilee four-day bank holiday started. Then, Sunday afternoon when the London Jubilee Pageant was ending, there was another spike (25% higher).

But the day with more sustained traffic from the last 14 days was actually Monday, June 6. That was the day that Boris Johnson, the British prime minister, won a no confidence vote in the UK’s Parliament. There was a clear first spike at around 08:00, when the news that a vote of no confidence would take place on that day broke, and a much bigger one at 21:00 (68% higher), when the final result of the vote was announced.

Social media trends show a similar pattern to Internet traffic in general, but it’s interesting to see that Thursday, June 2, the first day of the extended weekend, was the one of the full 14 days we’re looking at with less DNS traffic to those platforms.

How Queen Elizabeth II’s Platinum Jubilee had an impact on the Internet

Messaging, on the other hand, had consistently much lower traffic during the four-day bank holiday, even compared to the previous weekend. Saturday, June 4, was the day with less messaging DNS traffic, at least of the two weeks period we’re observing. At 11:00 Saturday, traffic was 18% lower than in the previous period, the same level of lower DNS requests at 15:00 and through most of the day.

How Queen Elizabeth II’s Platinum Jubilee had an impact on the Internet

Conclusion: celebrations and events ‘move’ the Internet

When there’s a big country-wide celebration going on, especially one that has a lot of outdoor events and activities, Internet patterns do change. That happens, in this case, for a monarch whose reign began in 1952, when there wasn’t any Internet (it took more than 40 years for the network of networks that can connect us all on Earth to reach its more popular global form).

We have seen something similar, but to a smaller degree, when there are elections going on, like the ones in France, in April, or when deeply impactful events like the war in Ukraine shifted the country’s Internet patterns.

You can keep an eye on these and other trends using Cloudflare Radar.

Eurovision 2022, the Internet effect version

Post Syndicated from João Tomé original https://blog.cloudflare.com/eurovision-2022-internet-trends/

Eurovision 2022, the Internet effect version

Eurovision 2022, the Internet effect version

There’s only one song contest that is more than six decades old and not only presents many new songs (ABBA, Celine Dion, Julio Iglesias and Domenico Modugno shined there), but also has a global stage that involves 40 countries — performers represent those countries and the public votes. The 66th edition of the Eurovision Song Contest, in Turin, Italy, had two semi-finals (May 10 and 12) and a final (May 14), all of them with highlights, including Ukraine’s victory. The Internet was impacted in more than one way, from whole countries to the fan and official broadcasters sites, but also video platforms.

On our Eurovision dedicated page, it was possible to see the level of Internet traffic in the 40 participant countries, and we tweeted some highlights during the final.


First, some technicalities. The baseline for the values we use in the following charts is the average of the preceding week, except for the more granular minute by minute view that uses the traffic average of May 9 and 10 as baseline. To estimate the traffic to the several types of websites from the 40 participating countries, we use DNS name resolution data. In this blog post, we’re using CEST, Central European Summer Time.

It’s not often that an entertainment event has an impact on a country’s Internet. So, was there an impact on Eurovision nights?

Let’s start with aggregate Internet traffic to the 40 participant countries (Australia included). In the first May 10 semi-final, there seems to be a slight decrease in traffic during the contest — it makes sense if we think that most people were probably watching the broadcast on national TV (and not on YouTube, that was also transmitting live the event). Traffic was lower than in the previous period between 21:00 and 23:00 (the event was between 21:00 to 23:14), but it was back to normal at 23:00.

Eurovision 2022, the Internet effect version

For the second semi-final that trend is less clear. But the May 14 final (that lasted from 21:00 CEST to 01:10) told a different story. Traffic was 6% lower than on the previous Saturday after 21:00, mostly around 22:00, and after 23:15 it was actually higher (between 4% and 6%) than before and continued that way until 02:00.

What happened at that 23:15 time in Eurovision? The last of the 25 songs at the contest was Estonia’s “Hope”, by Stefan, and it ended at 23:14 (also in this blog post we will also see how 23:16 was the highest spike in terms of DNS traffic to fan websites during the final). This is the Internet traffic in the participating countries on May 14 chart:

Eurovision 2022, the Internet effect version

There were several countries that showed similar impact in terms of traffic change during at least the final. France, UK, Germany, Iceland, Greece and Switzerland are examples.

Eurovision & the UK

The UK was one of the countries where there seems to be more impact during the time of the grand final — last year, according to the ratings, eight million were watching the BBC transmission with the commentator Graham Norton. Traffic started to drop to lower levels than usual at 20:30 (a few minutes before the final) and was 20% lower at 22:00, starting to go closer to normal levels after 23:00, when the set of 25 finalists’ songs came to an end.

Here’s the UK’s Internet traffic trend during the Eurovision May 14 final:

Eurovision 2022, the Internet effect version

Fan sites: what a difference a winner makes

The most obvious thing to check in terms of impact are the fan websites. Eurovision has many, some general (there’s the OGAE, General Organisation of Eurovision Fans), others more local. And DNS traffic to them was clearly impacted.

The first semi-final, on May 10, had 33x more traffic than in the average of the previous week, with a clear 22:00 CEST spike. But the second semi-final, May 12, topped that, with 42x more traffic at the same time. The final, with the 25 finalists, clearly surpassed that and at 22:00 traffic was already 70x. But because the final was much longer (in the semi-finals it was around 23:00 that the finalists were announced), the peak was reached at 23:00, with 86x more traffic than usual.

Eurovision 2022, the Internet effect version

“We have a winner. The winner of the Eurovision Song Contest 2022 is… Ukraine!”.
Alessandro Cattelan, Laura Pausini and Mika at 01:01 CEST, May 15, 2022.

Saturday’s final was more than four hours long (the semi-finals took little over two hours), and it finished a few minutes after 01:00 CEST. DNS traffic to fan websites dropped from 86x to 45x at midnight, but it went up again to 49x more traffic when it was already 01:00 CEST in most of Europe and Ukraine was announced the winner of Eurovision 2022. This next chart shows Saturday’s May 14 final traffic change to fan sites:

Eurovision 2022, the Internet effect version

We can also clearly see that on Sunday morning, at 09:00, there was a 20x peak to fan sites, and also at 11:00 (17%).

Now, let’s go deeper by looking at a minute by minute view (the previous charts show hourly data) of DNS traffic to fan sites. In the two semi-finals it’s easy to see that the moment the finalists were announced, and the event was ending, around 23:12, was when traffic was higher. Here’s what the May 10 (yellow) and May 12 (green) two semi-finals fan sites growth looked like:

Eurovision 2022, the Internet effect version

We can also spot some highlights in fan sites during the semi-final besides the finalists’ announcement, which we saw were definitely the most popular moments of the two nights. First, on May 10 there was more traffic before the event (21:00) than on May 12, so people seem to have greater expectations of the first Eurovision 2022 event of the week. In terms of spikes (before the winners’ announcements), we created a list of moments in time with more interest to the fan websites and connected them to the events that were taking place at that time in Eurovision (ordered by impact):

First semi-final, May 10
#1. 22:47 Sum up of all the songs.
#2. 22:25 Norway’s song (Subwoolfer, “Give That Wolf a Banana”).
#3. 21:42 Bulgaria’s song (Intelligent Music Project, “Intention”).
#4. 21:51 Moldova’s song (Zdob și Zdub and Advahov Brothers, “Trenulețul”).
#5. 22:20 Greece’s song (Amanda Georgiadi Tenfjord, “Die Together”).

Second semi-final, May 12
#1. 21:22 Between Serbia (Konstrakta, “In corpore sano”) and Azerbaijan (Nadir Rustamli, “Fade to Black”).
#2. 22:48 Voting period starts.
#3. 22:30 Czech Republic’s song (We Are Domi, “Lights Off”).
#4. 22:38 Laura Pausini & Mika performing (“Fragile” Sting cover song).
#5. 22:21 Belgium’s song (Jérémie Makiese, “Miss You”).

How about the May 14 final? This chart (followed by a ranking list) shows DNS traffic spikes in fan sites on Saturday’s final:

Eurovision 2022, the Internet effect version

Final, May 14
#1. 23:11 Between Serbia (Konstrakta, “In corpore sano”) and Estonia (Stefan, “Hope”).
#2. 23:33 Sum up of all the songs.
#3. 23:57 Voting ended.
#4. 23:19 Sum up of all the songs.
#5. 23:01 Ending of the United Kingdom’s song (Sam Ryder, “Space Man”).


(UK’s performer and representative Sam Ryder with Graham Norton, the BBC commentator of Eurovision since 2009 — the BBC broadcasts the event since 1956.)

The broadcasters show

How about official national broadcaster websites? Around 23:00 CEST traffic to the aggregate of 40 broadcasters was generally higher on the semi-finals and final nights (represented in grey on the next chart). That’s more clear on the final at 23:00, when DNS traffic was 18% higher than in the previous Saturday (and 50% compared to the previous day). During the semi-finals the difference is more subtle, but at 23:00 traffic in both May 10 and 12 traffic was ~6% higher than in previous days.

Eurovision 2022, the Internet effect version

When we focus on the minute by minute view also on the broadcaster sites but on the three Eurovision evenings, the highest growth in traffic is also during the final (like we saw in the fan sites), mainly after 23:00, which seems normal, considering that the final was much longer in time than the semi-finals that ended around that time.

Eurovision 2022, the Internet effect version

During the final (represented in pink in the previous chart), there were some clear spikes. We’ve added them to a ranking that also shows what was happening in the event at that time.

Broadcaster site spikes. Final, May 14
#1. 21:52 Best moments clip of the two semi-finals
#2. 21:00 Contest starts
#3. 00:24 Sam Ryder, the UK representative (with the song “Space Man”) being interviewed after reaching the #1 in the voting process.
#4. 01:09 Ukraine’s (Kalush Orchestra, “Stefania”) performance as the winner
#5. 01:02 Ukraine was announced as the Eurovision 2022 winner.

Video platforms: the post-final growth

Eurovision uses video platforms like YouTube and TikTok to share all the songs, clips of the events and performers and there was also a live transmission on YouTube of the three nights. Given that, we looked at DNS traffic to the video platforms in an aggregate for the 40 participating countries. So, was there an impact to this well known and high performing social and video platforms? The short answer is: yes.

The final was also the most evident example, especially after 23:15, when all the 25 finalists songs already performed and the event had two more hours of non-participant performances, video clips that summarize the songs and the voting process — the famous moment in Europe to find out who will get from each of the 40 participant countries the maximum of 12 points.

In this comparison between the semi-finals and final day, we can see how on May 10, the day of the first semi-final, video platform traffic had more growth before the contest started, which is not that surprising given that it was the first Eurovision 2022 event and there was perhaps curiosity to check who were the other contestants (by then Eurovision had videos of them all on YouTube).

Eurovision 2022, the Internet effect version

But the May 14 final shows more DNS traffic growth than the other Eurovision days after 23:16 (as we saw before, that was the time when all the finalists’ songs had already been performed). The difference in traffic compared to the semi-finals was higher at 1:11 CEST. That was the moment that the final came to an end on Saturday night, and at that time it reached 31% more traffic to video platforms than on May 10, and 38% than on May 12.

Australia’s impact (with an eight hours difference)

Australia was one of the 40 participants, and it had a major time difference (there’s an eight-hour difference to CEST). Continuing to look at video platforms, DNS traffic in Australia was 22% higher at 23:00 CEST (07:00 local time) than it was in the previous Saturday and continued high around 17% of increase a few hours after. Before the 23:00 peak, traffic was 20% higher at 22:00 and 17% at 21:00, when the event was beginning.

Eurovision 2022, the Internet effect version

The winners & social media

Social media in general in the 40 participating countries wasn’t as impacted, but there was a 01:00 CEST spike during the final at around the time the decision to choose the winner was between Ukraine and the UK — at 01:01 Ukraine was announced the winner of Eurovision 2022.

Eurovision 2022, the Internet effect version

We can also see an impact on social media in Ukraine, when Kalush Orchestra’s “Stefania” song was announced the winner at Saturday’s, May 14, final (it was already after midnight, May 15). The usual traffic slowing down night trend that is seen in other days was clearly interrupted after 01:02 CEST (02:02 local time in Ukraine).

Eurovision 2022, the Internet effect version

Conclusion: the Eurovision effect

When an event like Eurovision happens, there are different patterns on the Internet in the participating countries, usually all in Europe (although this year Australia was also there). Fan and broadcaster websites have specific impact because of the event, but in such a multimedia event, there are also some changes in video platforms’ DNS traffic.

And that trend goes as far as the Internet traffic of the participating countries at a more general level, something that seems to indicate that people, at least for some parts of Eurovision and in some countries, were more focused on their national TV broadcast.

The Internet is definitely a human-centric place, as we saw before in different moments like the 2022 Oscars, the Super Bowl, French elections, Ramadan or even the war on Ukraine and the impact on the open Internet in Russia.

How Ramadan shows up in Internet trends

Post Syndicated from João Tomé original https://blog.cloudflare.com/how-ramadan-shows-up-in-internet-trends/

How Ramadan shows up in Internet trends

How Ramadan shows up in Internet trends

What happens to the Internet traffic in countries where many observe Ramadan? Depending on the country, there are clear shifts and changing patterns in Internet use, particularly before dawn and after sunset.

This year, Ramadan started on April 2, and it continued until May 1, 2022, (dates vary and are dependent on the appearance of the crescent moon). For Muslims, it is a period of introspection, communal prayer and also of fasting every day from dawn to sunset. That means that people only eat at night (Iftar is the first meal after sunset that breaks the fast and often also a family or community event), and also before sunrise (Suhur).

In some countries, the impact is so big that we can see in our Internet traffic charts when the sun sets. Sunrise is more difficult to check in the charts, but in the countries more impacted, people wake up much earlier than usual and were using the Internet in the early morning because of that.

Cloudflare Radar data shows that Internet traffic was impacted in several countries by Ramadan, with a clear increase in traffic before sunrise, and a bigger than usual decrease after sunset. All times in this blog post are local. The data in the charts is bucketed into hours. So, for example, when we show an increase in traffic at 0400 we are showing that an increase occurred between 0400 and 0459 local time.

Indonesia is a clear example of that, showing trends that continued until the end of Ramadan:

How Ramadan shows up in Internet trends

In the next table, we show a country ranking by order of impact. Here, we include traffic changes before dawn and after sunset. In the last column, you can also see the change in traffic after Ramadan ended, right after sunset. In this case, we’re looking at Wednesday, May 4, right after the Eid al-fitr — the May 2-3, 2022 holiday of breaking the fast, in a comparison with the previous Wednesday at the same time (when Ramadan was ongoing):

Internet traffic: Ramadan’s impact Before sunrise After sunset Post-Ramadan, May 4 (after sunset)
Afghanistan +203% -28% +20%
Pakistan +119% -39% +13%
Indonesia +98% -13%
Morocco +90% -36% +44%
Libya +81% -27% +48%
Turkey +78% -19% +22%
Bangladesh +62% -40% +12%
Saudi Arabia +55% -45% -5%
United Arab Emirates +52% -13% +4%
Bahrain +44% -31% +21%
Malaysia +41% -8% -9%
Qatar +35% -23% +5%
Egypt +31% -32% +56%
Tunisia +25% -43% +101%
Iran +24% +10% -12%
Singapore +8% -5% +4%
India -15%

Afghanistan, Pakistan, Indonesia, Morocco, Libya and Turkey had the biggest impact in an increase in traffic before sunrise. After sunset, it was (by order of impact) Saudi Arabia, Tunisia, Bangladesh, Pakistan that showed a more clear decrease in traffic after sunset.

Here’s the impact of the start of Ramadan on Bangladesh, with more highlights inside the next chart:

How Ramadan shows up in Internet trends

Waking up earlier

There’s a clear pattern in most of the countries, Internet traffic was much higher than usual between 04:00 to 04:59 local time (where usually it’s the time with the lowest traffic).

The same early spike is seen in Turkey and the United Arab Emirates. In the case of the United Arab Emirates, the time before sunrise for the Suhur meal had more mobile usage than usual (so people were using their mobile devices to access the Internet more than usual at that time).

That’s also the case for Pakistan, where traffic is 119% higher on the 04:00 to 04:59 hour on April 3, than on the previous Sunday, but also in Qatar (sunrise at 05:25 and a spike of 35%) or Afghanistan. In the latter, the spike is 203% higher:

How Ramadan shows up in Internet trends

We also saw the same trend in Indonesia, sunrise was at 05:55 local time at the beginning of April, and there’s a clear spike in traffic in the 04:00 to 04:59 hour with a 98% growth in requests.

Northern African countries like Egypt, Tunisia, Morocco or Libya (sunrise at 06:54), show the same 04:00 to 04:59 hour spike. In Libya, traffic was 81% higher on Sunday, April 3, than it was the previous Sunday at the same time. Usually, the 04:00 to 04:59 hour is the lowest point in traffic in the country, but on April 3 and the following days it was at 08:00.

Saudi Arabia shows a similar pattern in terms of Internet traffic on Sunday, April 3, 2022, sunrise was at 05:44, and there was 55% more Internet use than at the same time on the previous Sunday, before Ramadan.

How Ramadan shows up in Internet trends

Does daily total Internet traffic go up or down?

The short answer is: depends on the country, given that there are examples of a  general increase and decrease in traffic in the most impacted countries. We see similar trends for the sunset and sunrise times of day, but it’s a different story throughout the 30 days of Ramadan.

Iran, in general, shows an increase in traffic after Ramadan started on April 2, and a decrease after it ended on May 3 (of around 15%).

How Ramadan shows up in Internet trends

Something similar is seen in Pakistan, that had a general decrease in traffic the week after Ramadan ended, but during the 18:00 to 18:59 hour, May 4, had 13% more traffic than at the same time on the previous Wednesday, when Ramadan was being observed and the iftar meal would have happened during the 18:00 to 18:59 hour.

How Ramadan shows up in Internet trends

The opposite happens in Libya, where traffic, generally speaking, declined during Ramadan and picked up after — comparing Wednesday, May 4, 2022, with the previous one during the 19:00 to 19:59 hour, traffic grew around 48%. The same trend is seen in another North African country: Morocco (growth of 44% after Ramadan ended).

How Ramadan shows up in Internet trends

After Ramadan, sunsets ‘bring’ more Internet traffic

Another pattern, unsurprisingly, that our chart at the beginning of this blog post shows is how the sunset period changes when Ramadan (and the holiday that follows) ends, in most cases clearly increasing traffic at around 18:00 or 19:00.

Of the 16 countries with a bigger Ramadan impact, only four had a decrease in traffic after sunset on May 4: Iran, Indonesia, Saudi Arabia and Malaysia. All of these countries had an increase (or sustained traffic) in daily traffic during Ramadan and lost daily Internet usage after it ended (in May).

Here’s the example of Indonesia through the Ramadan period that includes April and May:

How Ramadan shows up in Internet trends

And a zoomed-in Indonesia chart after Ramadan ended (May 1, but bear in mind that May 2-3 is the holiday Eid al-fitr) that shows not only the general decrease in traffic, but also how the sunset period doesn’t have a clear drop in requests as seen in the Ramadan period:

How Ramadan shows up in Internet trends

Conclusion: a human impact

Ramadan has a clear impact on Internet traffic patterns as humans change their habits.

The Internet may be the network of networks, where there are many bots (friendly and less friendly), but it continues to be a human-powered network, made by humans for humans.

Follow our Internet trends (including details about ASNs) on Cloudflare Radar, and also on Radar’s Twitter account.

Watching Eurovision 2022 on Cloudflare Radar

Post Syndicated from João Tomé original https://blog.cloudflare.com/watching-eurovision-2022-on-cloudflare-radar/

Watching Eurovision 2022 on Cloudflare Radar

Watching Eurovision 2022 on Cloudflare Radar

The Eurovision Song Contest has a history that goes back to 1956, so it’s even older than the European Union and one of its highlights over the years was being the first global stage for the Swedish group ABBA — Waterloo won the 1974 edition). This year, for the 66th edition, we have a dedicated page for Eurovision fans, journalists or anyone interested in following Internet trends related to the event taking place in Turin, Italy.

The contest consists of two semi-finals and a final. The first semi-final is today, May 10, at 21:00 CEST, the second is Thursday, May 12, at 21:00 CEST. And the final is on Saturday, May 14, at 21:00 CEST. We are using Central European Summer Time and not our usual (on Radar) UTC because that’s the timezone of most of the 40 countries that will take part in the contest. There will be 17 countries in the first semi-final, 18 in the second, and 25 in the final (the full list is here).

From countries to fan sites.

First, you can see the Internet traffic aggregate in all the 40 countries that are participating in Eurovision 2022. There’s also a toggle to choose each of the 40 countries regarding Internet traffic. If you pass the mouse over the traffic line, the traffic level hour by hour is also highlighted.

Watching Eurovision 2022 on Cloudflare Radar

Then, we use DNS name resolution data to estimate traffic from the 40 participating countries to several types of websites. We have a video platforms chart as Eurovision has content on major video platforms. The baseline for the values we use is the average of the previous week, represented in the charts.

Watching Eurovision 2022 on Cloudflare Radar

We also show social media trends in the participating countries, by hour, to see if the Eurovision semi-finals and final cause a change.

The contest has a large base of fan websites (there’s even the OGAE, General Organisation of Eurovision Fans), and we also have a chart for Eurovision fan sites. In this chart, yesterday at 20:00 CEST, traffic was already at its highest since May 1, with 6.22x more than the average of the previous week (that’s the baseline here).

Watching Eurovision 2022 on Cloudflare Radar

Last, but not least, we also show the impact on national official broadcasters’ websites from the participating countries. For all the charts, there’s a download button to save the image file like this:

Watching Eurovision 2022 on Cloudflare Radar

For this evening’s first semi-final, Portugal is participating and since we’re writing this blog post from our Lisbon office, I asked everyone’s favorite songs for the 2022 Eurovision edition. Norway’s song from Subwoolfer, Give That Wolf A Banana, was one of the favorites, followed by Portugal’s song from MARO, Saudade, Saudade.

The UK’s song from Sam Ryder, SPACE MAN, is automatically in Saturday’s final and was also praised at the Lisbon office, the same with France’s song from Alvan & Ahez, called Fulenn, where the group sings in their native language, Breton (from the French region of Brittany).

Besides our dedicated Eurovision page, radar.cloudflare.com/eurovision-2022, we will also be checking this week for some trends on Cloudflare Radar’s Twitter account. Let the songs (and the Internet trends) begin.

Tracking shifts in Internet connectivity in Kherson, Ukraine

Post Syndicated from João Tomé original https://blog.cloudflare.com/tracking-shifts-in-internet-connectivity-in-kherson-ukraine/

Tracking shifts in Internet connectivity in Kherson, Ukraine

The Internet is not only a human right according to the United Nations, and a way to get information, but it has also become an important element in geopolitical conflicts, like the war going on in Ukraine. We have previously written about Ukrainians moving westward to escape the war and Internet outages in the country, but also about the importance of the open Internet in Russia.

Over this past week, we observed an outage in the occupied city of Kherson, south Ukraine, coupled with an apparent shift in who controls the Internet within the region. First, let’s give some context and show what we saw.

The Russian-occupied Kherson (a city of 280,000 people) experienced an Internet outage on Saturday, April 30, 2022, that began just after 16:00 UTC. The outage lasted until Wednesday, May 4, with traffic starting to return around 04:30 UTC traffic.

Tracking shifts in Internet connectivity in Kherson, Ukraine

In the chart below, we can see that there was a 43% decrease in traffic from Kherson from February 23 to 24, after the war started. However, this weekend’s outage is the most significant disruption to Internet traffic in Kherson since the start of the war.

Tracking shifts in Internet connectivity in Kherson, Ukraine

According to Ukraine’s vice Prime-Minister, Mykhailo Fedorov, and also the State Service of Special Communications and Information Protection, on Wednesday morning, May 4, “the communication cut off by the occupiers in Kherson and Kherson region was restored” using “backup power channels”. The reasons presented for the lack of communication “were interruptions of fiber-optic trunk lines and disconnection from the power supply of equipment of operators in the region”.

Yuriy Shchyhol, head of the organization, also said during a briefing that the occupiers had connected Ukrainian Internet users to the Russian network by switching fiber-optic lines and communication stations. “This is a gross violation of international law. We have already appealed to the International Telecommunication Union to impose sanctions on the Russian Federation”, he explained.

Shift in routing

Around the time that the outage referenced above began, we also observed a shift in routing for the IPv4 prefix announced by AS47598 (Khersontelecom). As shown in the table below, prior to the outage, it reached the Internet through several other Ukrainian network providers, including AS12883, AS3326, and AS35213. However, a day later, its routing path now showed a Russian network, AS201776 (Miranda) as the upstream provider. The path through Miranda also includes AS12389 (Rostelecom), which bills itself as “the largest digital services provider in Russia”. This aligns with the claims noted above about connecting Ukrainian Internet users to the Russian network.

Peer AS Last Update AS Path
AS1299 (TWELVE99 Arelion, fka Telia Carrier) 5/1/2022 16:02:26 1299 12389 201776 47598
AS6777 (AMS-IX-RS) 4/28/2022 11:23:33 12883 47598

Because Cloudflare uses Anycast to route content requests to data centers on our network, routing changes such as this one can impact data center selection. This is clearly evident in the graph below. Prior to the outage, when Khersontelecom reached the Internet through other Ukrainian providers, requests from the network were handled by Cloudflare data centers in Kyiv, Ukraine and Frankfurt, Germany. On May 1, after the Russian network began to route traffic for Khersontelecom, requests were sent to our Moscow data center.

Tracking shifts in Internet connectivity in Kherson, Ukraine

These requests continued to be handled by our Moscow data center for approximately three days. However, the graph also shows that traffic started being handled again by the Kyiv and Frankfurt data centers, with the Moscow data center no longer in the mix, around 06:00 UTC on May 4. This aligns with the observed update to the routing path for AS47598 shown in the table below – it no longer had Russian networks as upstream providers, but instead returned to reaching the Internet through other Ukrainian networks.

Peer AS Last Update AS Path
AS174 (COGENT-174) 5/4/2022 05:56:27 174 3326 3326 3326 47598
AS1273 (CW Vodafone Group PLC) 5/4/2022 03:11:25 1273 12389 201776 47598

Conclusion

As we saw, not only was there an Internet outage in the Kherson region, but there was also a shift in routing at least in one Kherson network that, for a few days, left traffic passing through Russian networks (along with all the restrictions and limitations, such as content blocking, such an arrangement could potentially have).

Availability of and control over physical resources have always been a key focus of war, but it is now clear that Internet resources now hold similar importance during times of conflict. This is also demonstrated by what happened to the Internet in Crimea after the annexation of 2014, as explained in-depth in this 2020 study.

You can follow Internet trends (including details about ASNs) on Cloudflare Radar, and also on Radar’s Twitter account.