The 2024 Summer Olympics, or Paris 2024, is set from July 26 to August 11 in France. The opening ceremony, scheduled for Friday, July 26 at 17:30, will take place for the first time not in a stadium but in the open space of the Jardins du Trocadéro by the Seine River in Paris. We’ll monitor relevant Internet insights throughout the event, but here we analyze some pre-event trends, from the popularity of Olympic websites by country to the increase in Olympics-related spam and malicious emails.
This year’s Olympics will host 329 events across 32 sports, featuring the debut of breakdancing as an Olympic event and the return of skateboarding, sport climbing, and surfing from 2020. Similar to our 2024 elections coverage, we will maintain a Paris 2024 Olympics report on Cloudflare Radar, updating it as significant Internet trends related to the event emerge.
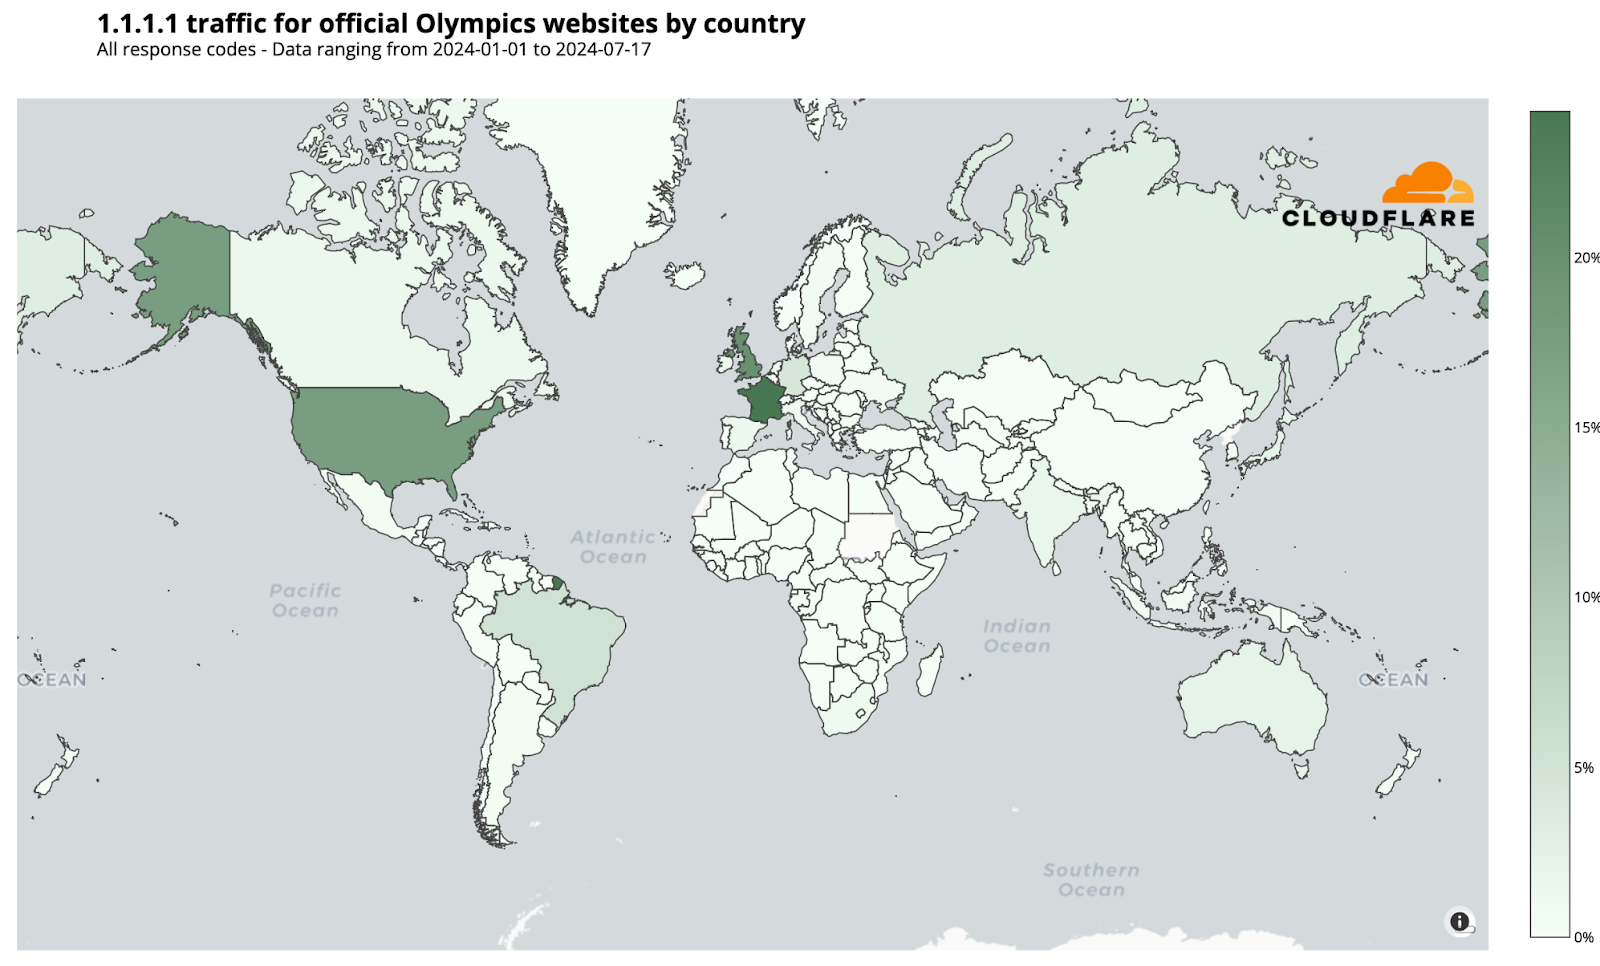
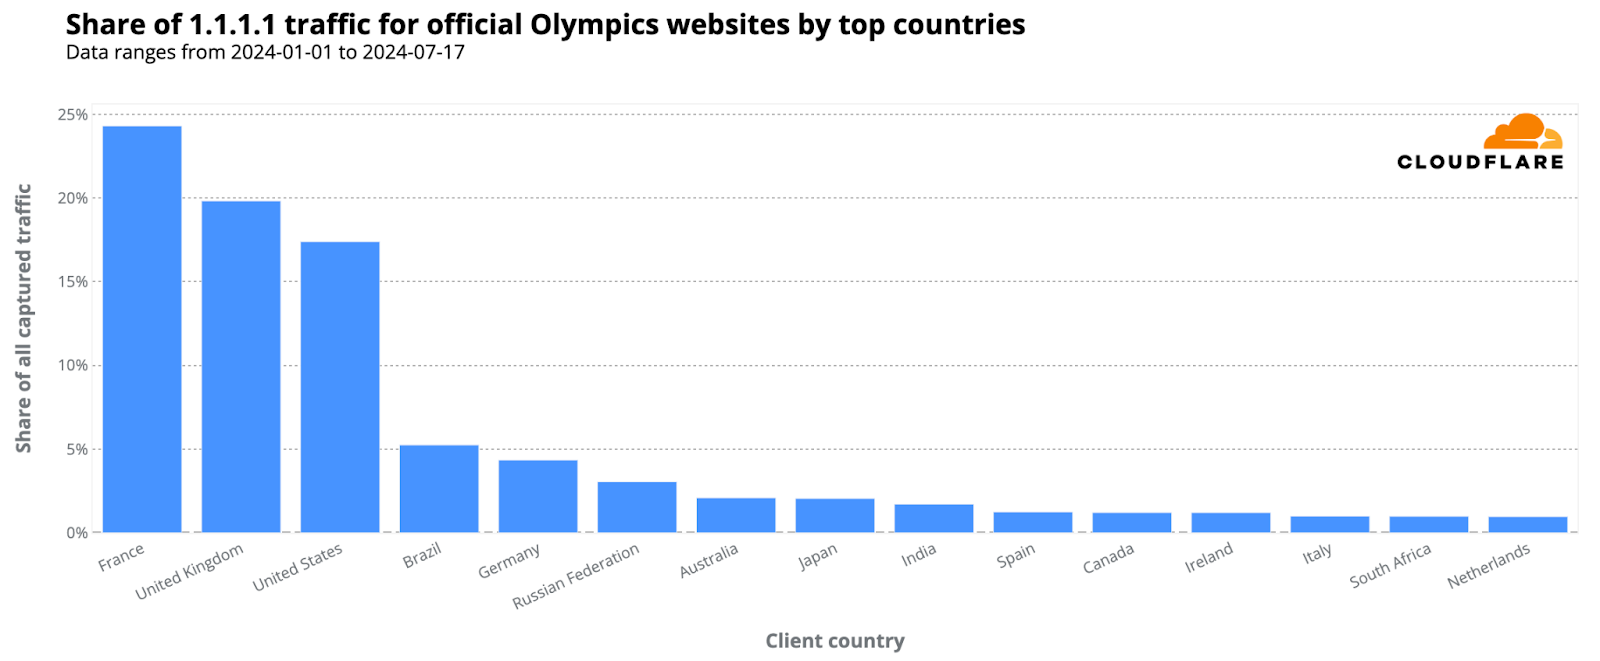
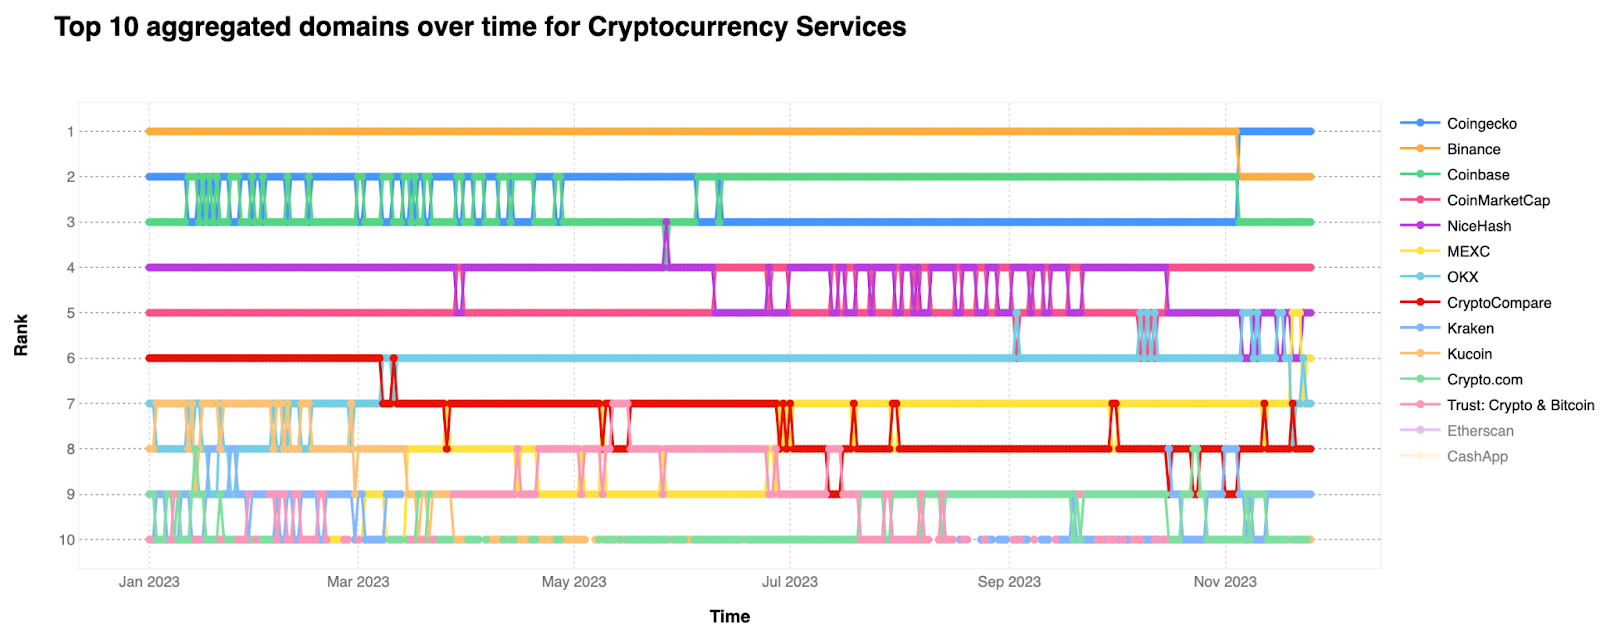
From our 1.1.1.1 resolver, DNS trends show heightened interest in the Olympics, especially from France. 24% of DNS requests for official Olympic-related websites came from the host country, followed by the United Kingdom and the United States, with 20% and 17% respectively.
Here’s the breakdown of countries responsible for at least 1% of 1.1.1.1. traffic for Olympic sites (percentages rounded):
France: 24%
United Kingdom: 20%
United States: 17%
Brazil: 5%
Germany: 4%
Russia: 3%
Australia: 2%
Japan: 2%
India: 2%
Spain: 1%
Ireland: 1%
Canada: 1%
South Africa: 1%
Netherlands: 1%
Italy: 1%
Days with the highest “Olympic” spikes
Analyzing the evolution of DNS traffic to official Olympic websites since January 2024, we’ve noted multiple spikes associated with specific Olympic events or ticket sales. The following ranking offers a global perspective via our 1.1.1.1 resolver, illustrating that as the event draws near and Paris readies itself, more recent dates are emerging prominently in the data.
Top 5 days with higher DNS traffic to Olympic official sites in 2024:
January 31: Eve of the 2024 Winter Youth Olympics closing ceremony in Gangwon, South Korea.
April 17: Over 250,000 new tickets for Olympic Games Paris 2024 went on sale – one of the last opportunities to get tickets to the main events.
January 19: Opening ceremony of the 2024 Winter Youth Olympics (South Korea).
June 26: One month before the opening ceremony; the Paris 2024 Main Operations Center starts full games operation; in Paris, areas like the Champ-de-Mars became full occupied by the Olympics; in the US, tickets for NBC’s Opening Ceremony coverage for the Paris 2024 in IMAX theaters went on sale.
July 1: Preparations in Paris with street and bridges closures and road signs added indicating fast track routes for Olympic related vehicles.
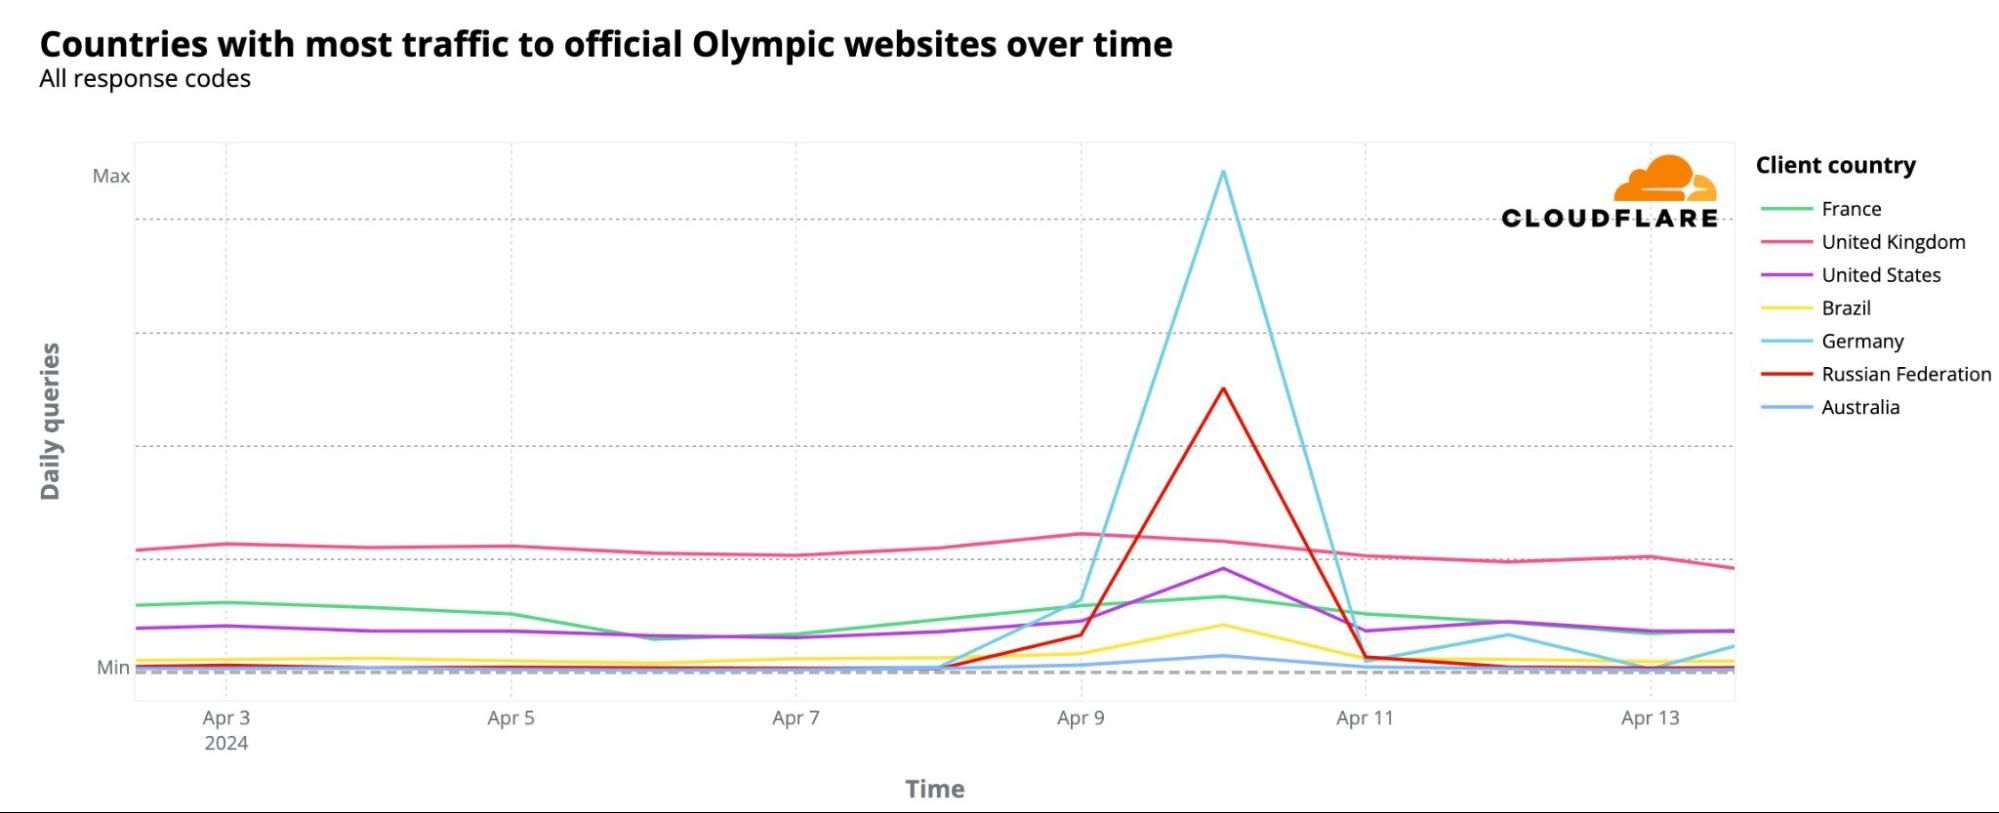
April 10 spikes in Germany, Russia and the US
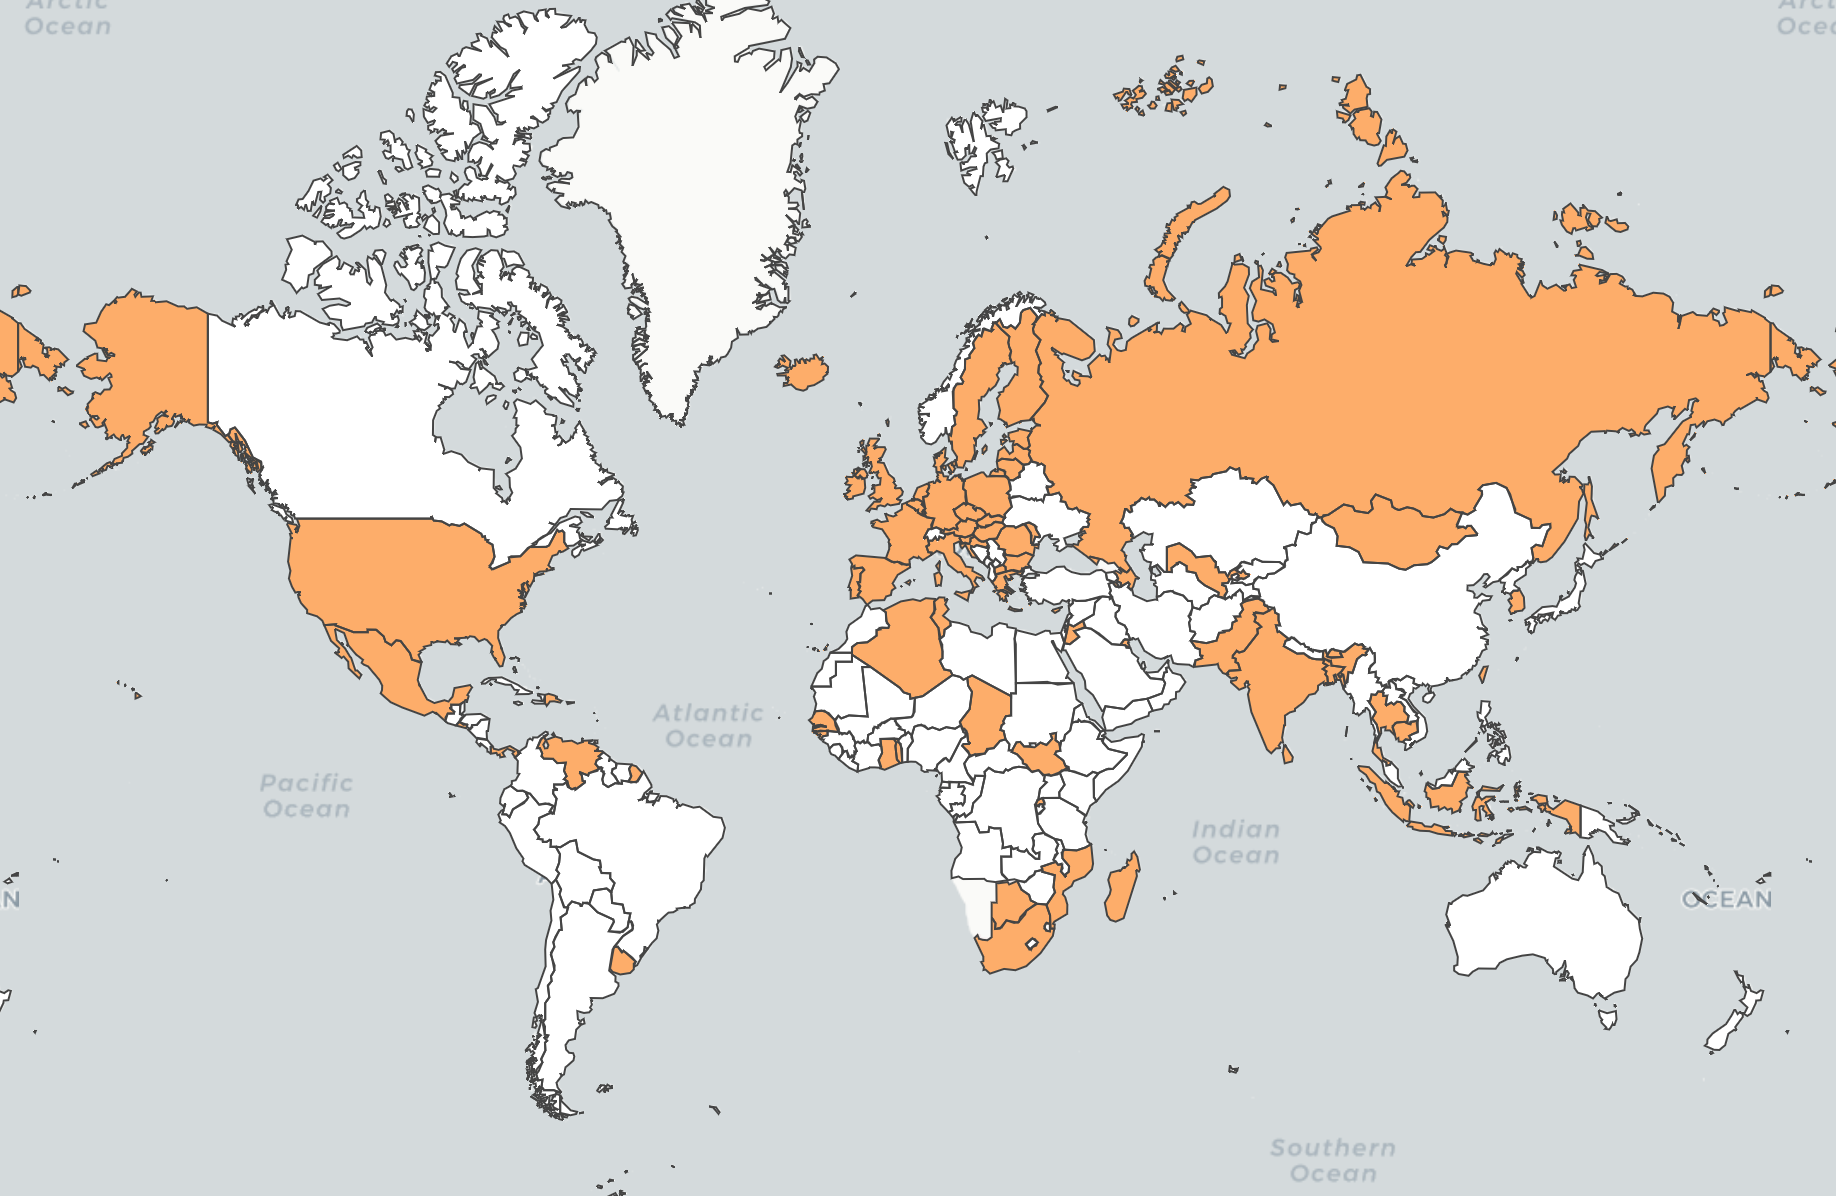
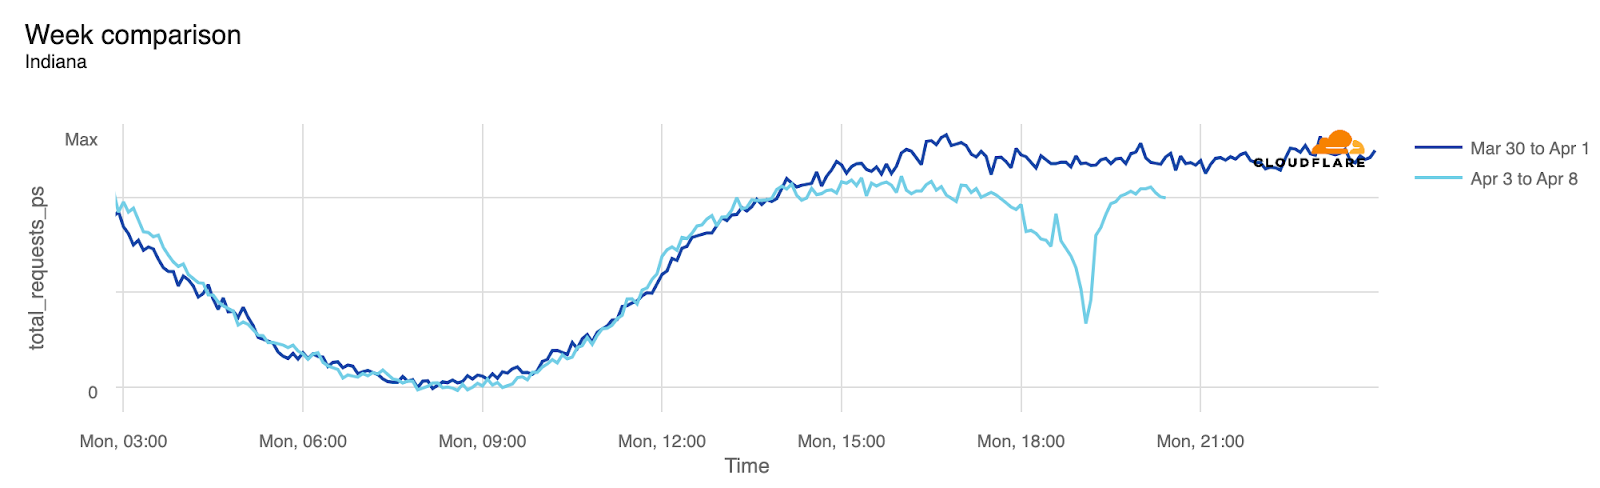
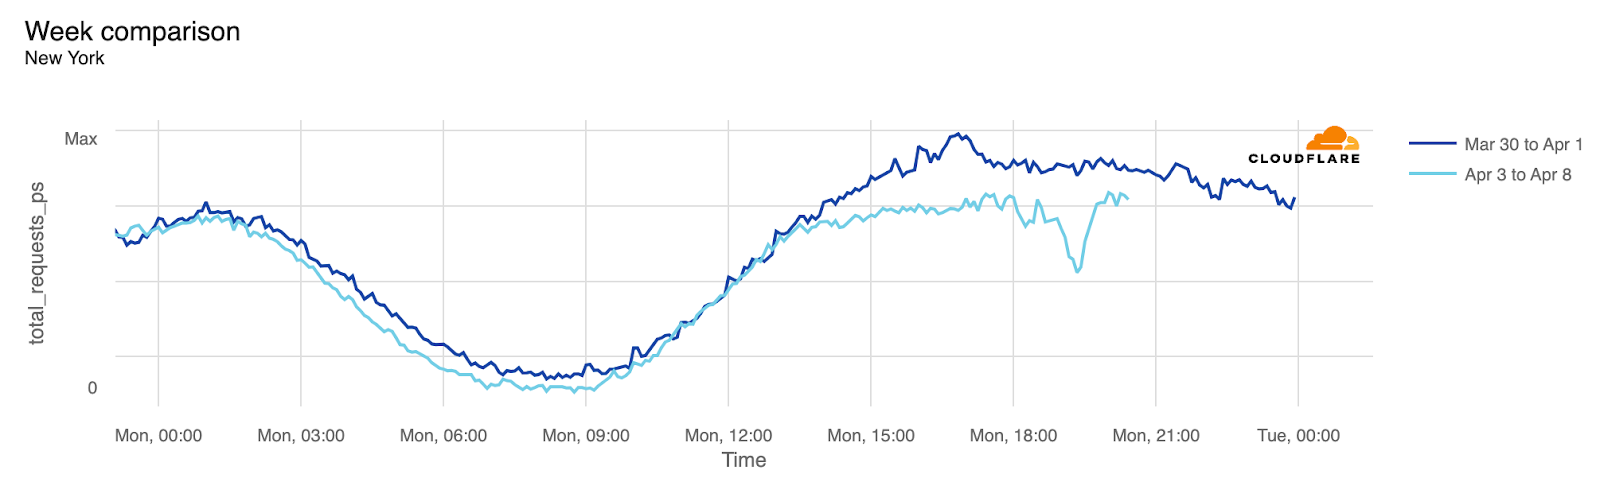
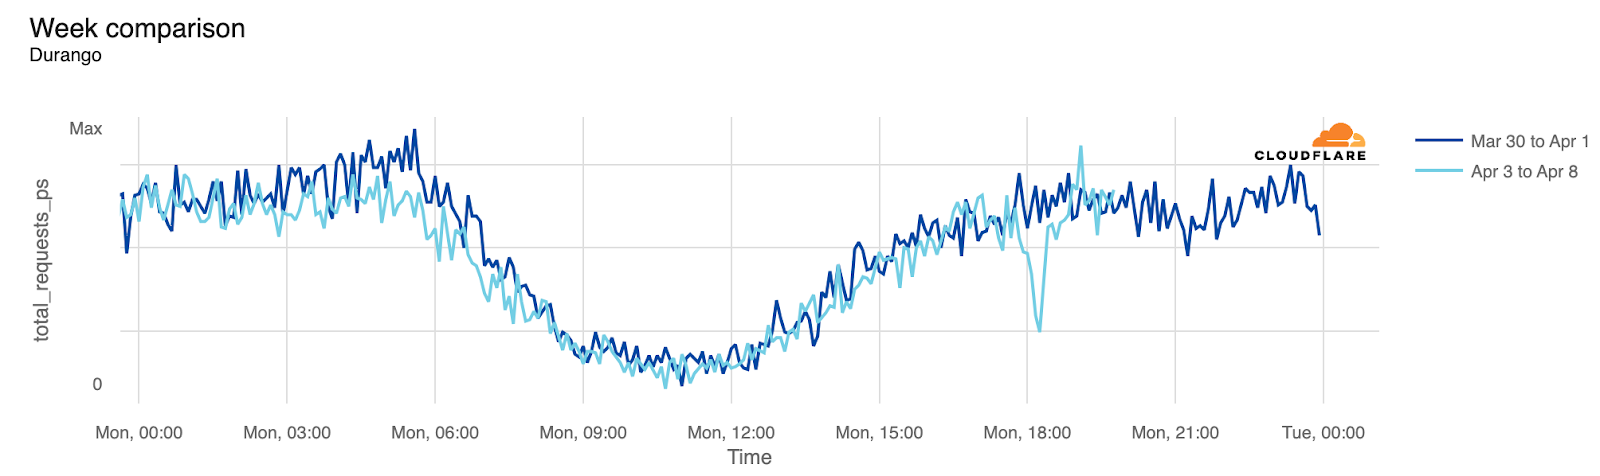
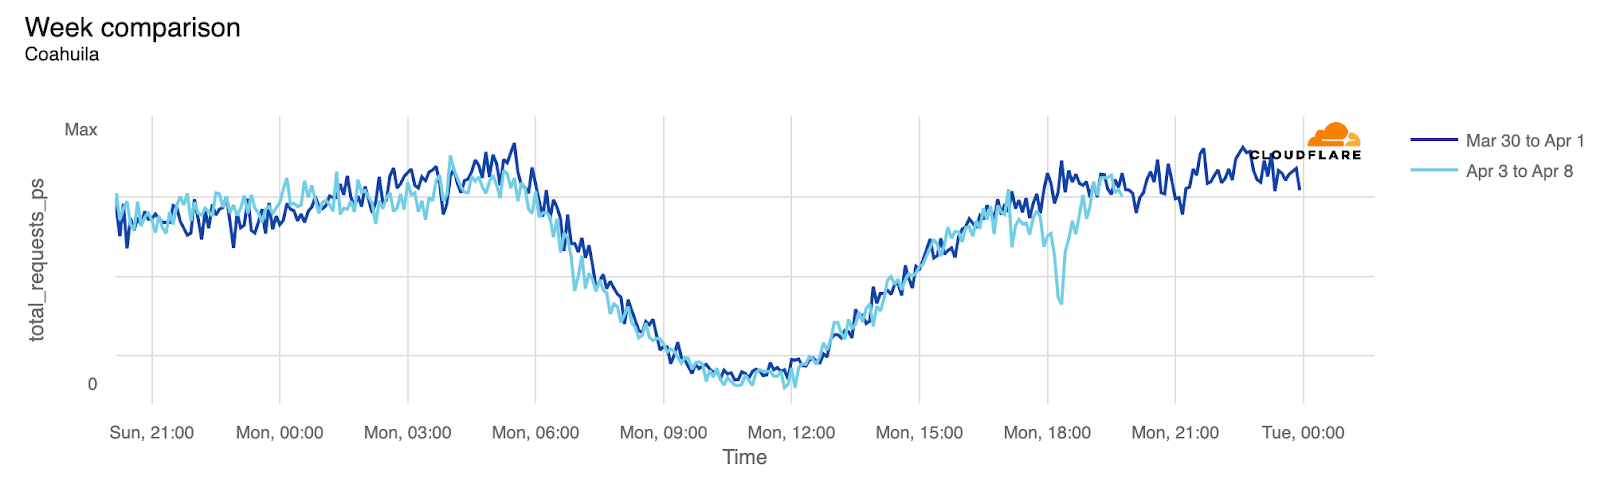
On April 10, 2024, DNS traffic spikes were observed not just in France but also notably in Germany, Russia, and the US, among others. Despite France leading in overall DNS traffic to Olympic sites since January, as seen on the world map above, this particular day saw the largest spikes originating from other countries. These spikes were most prominent from Germany, Russia, the US, the UK, France, Brazil, and Australia, in that order.
What caused these spikes? Several press conferences related to the Olympics took place that day. One major announcement, covered globally, declared that for the first time, the Olympics would offer prize money, with track and field gold medalists receiving $50,000. The following chart illustrates the spike in DNS traffic in these countries on that day.
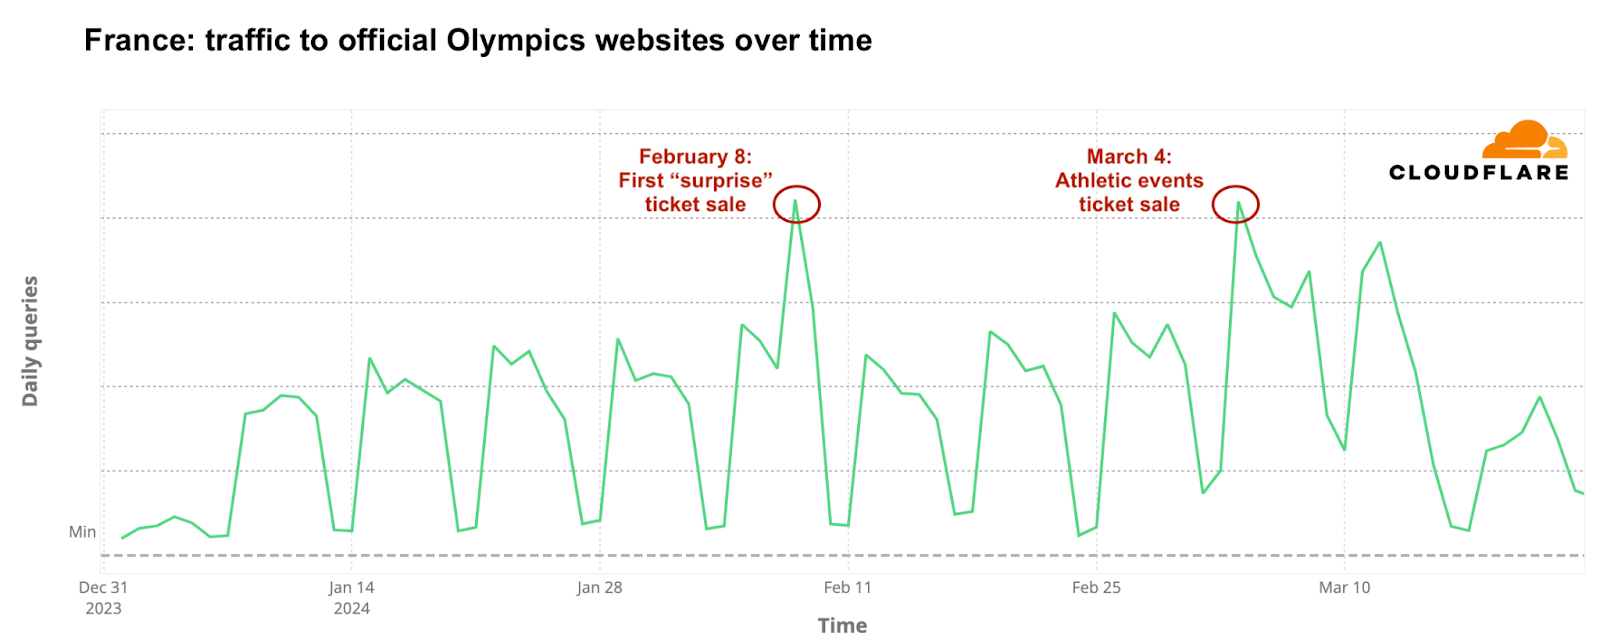
France’s trends: interest in tickets comes first
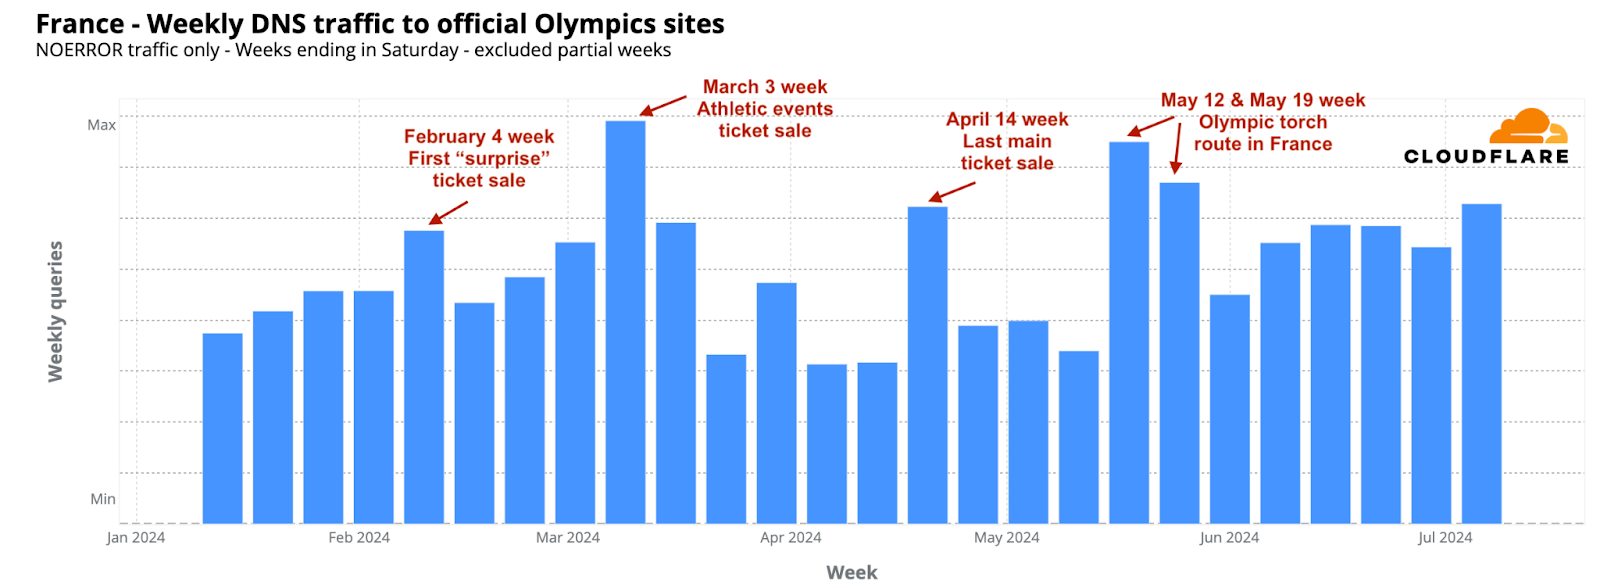
In France, the host nation, ticket sale days significantly influenced DNS traffic to official Olympic websites. The most obvious spike occurred on February 8, 2024, marking the start of the first phase of ticket sales for 2024, called the “Paris 2024 official ticketing website surprise releases.” On that day, daily DNS traffic was double that of the previous week. A significant surge was also observed at 10:00 local time, coinciding with the ticket release, which saw an hourly DNS traffic increase of 398% compared to the previous week.
The week of March 3, 2024, saw the highest DNS traffic to Olympic-related sites in France so far. The most significant increase occurred on March 4, the day the “Athletics Special” ticket sales began for events at the Stade de France, which also coincided with the unveiling of the Olympic poster. On this day, daily DNS traffic rose by 45% compared to the previous week. Other notable periods included the weeks of May 12 and May 19, when the Olympic torch arrived in France and started its journey through various cities. April 14 also marked a critical day, offering one of the last chances to purchase 250,000 tickets for major events.
“Olympics” and “Paris 2024” emails on the rise
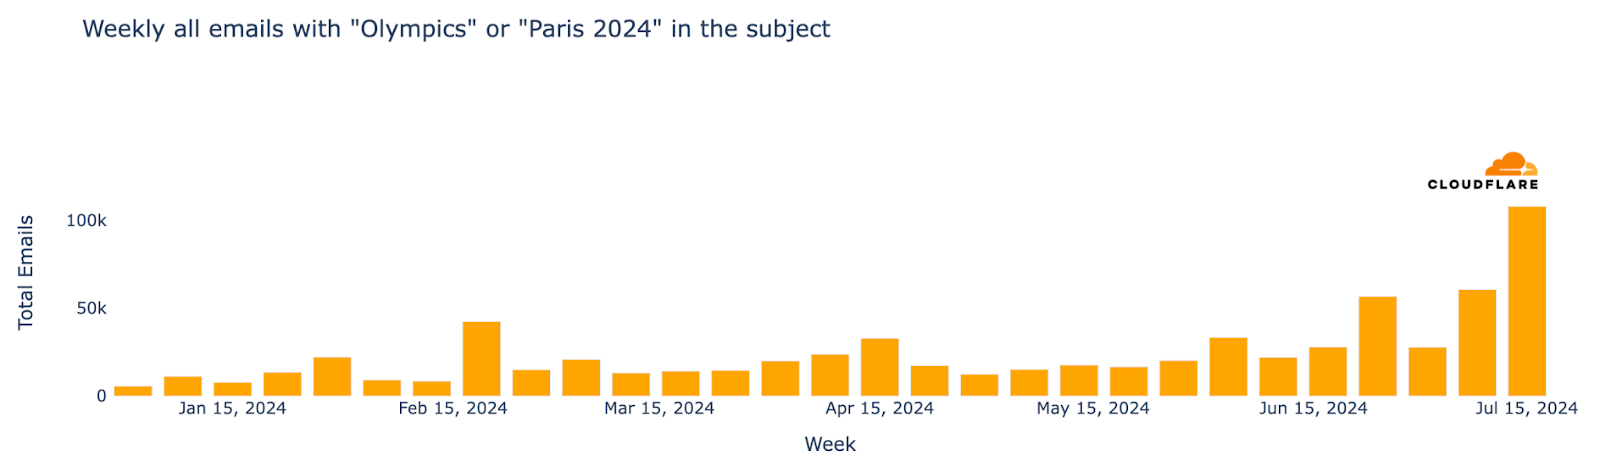
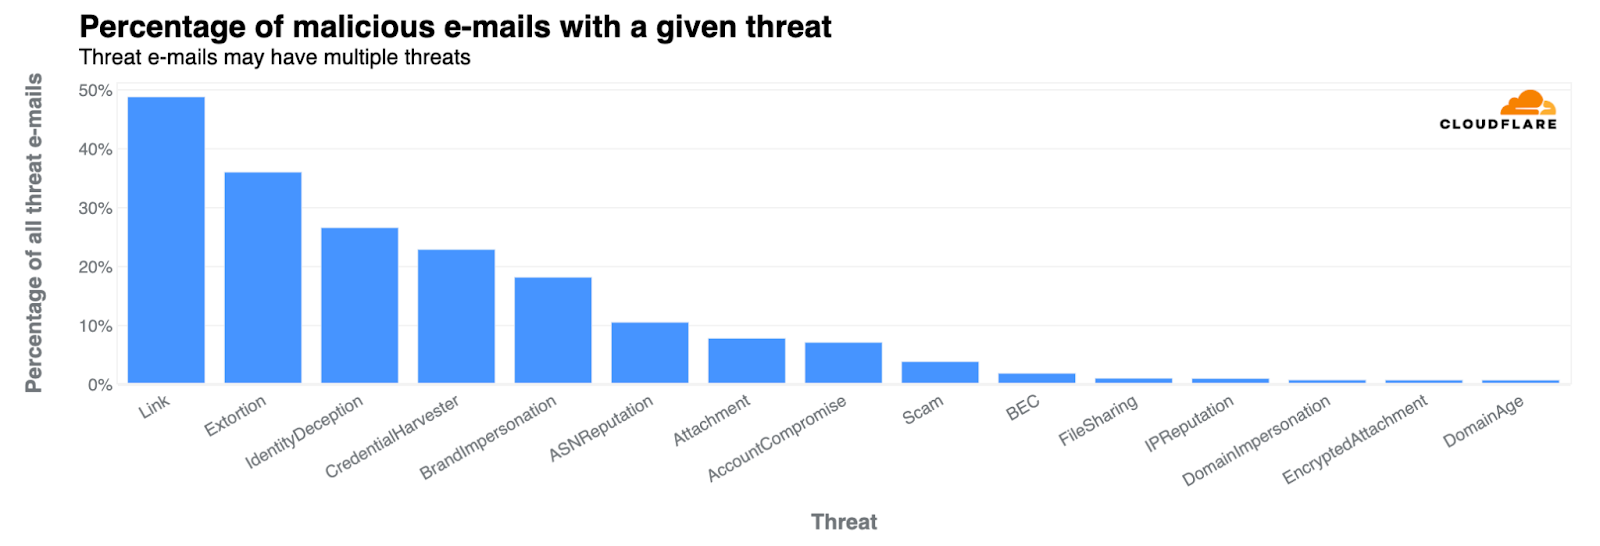
From a cybersecurity perspective, as major events often attract phishing and spam, we’ve analyzed email trends related to the Olympics—recently we did the same for the Biden vs Trump US presidential debate. From January 2024 up to late-July, Cloudflare’s Cloud Email Security service processed well over half a million emails containing “Olympics” or “Paris 2024” in the subject. The week of July 15 saw the highest number of such emails, marking a 694% increase compared to the busiest week in January.
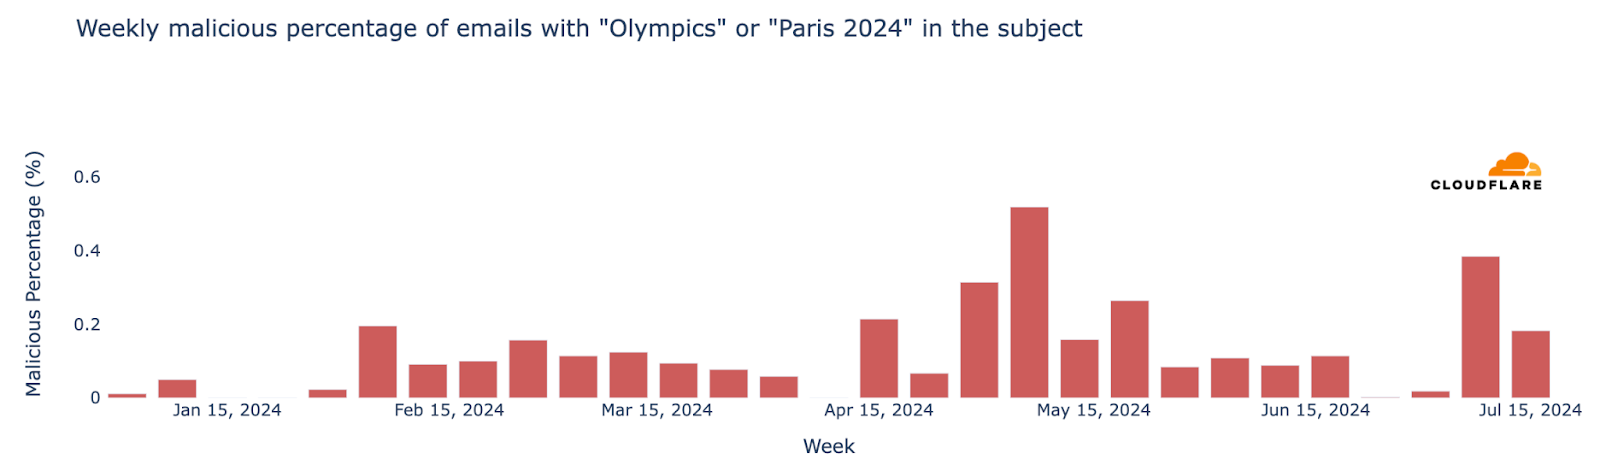
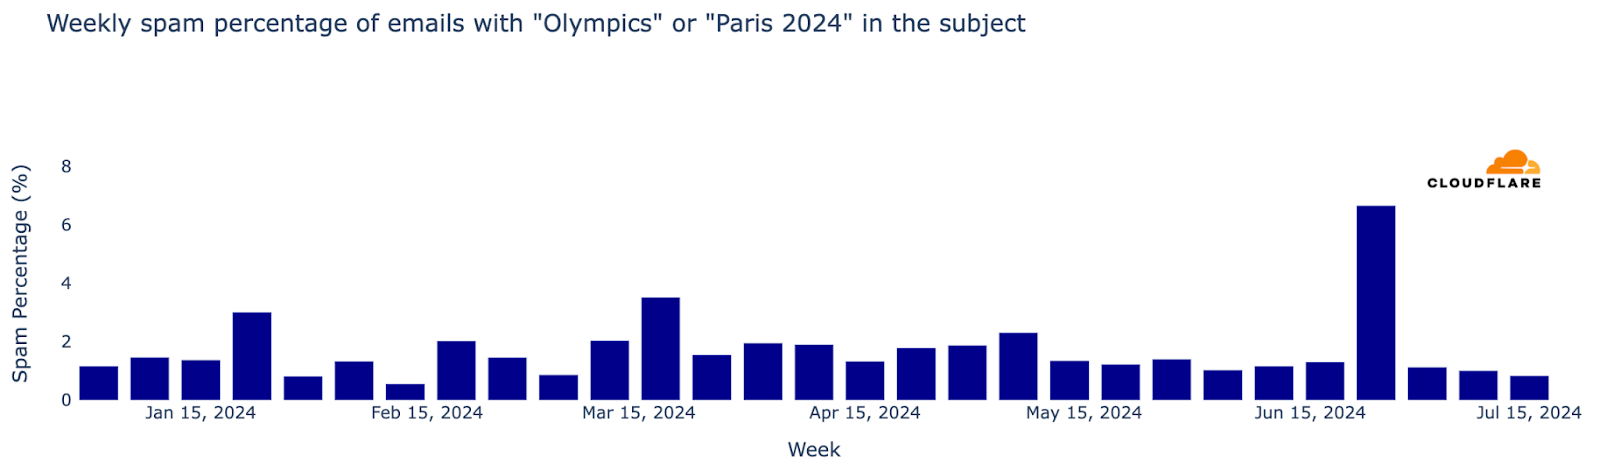
Regarding unwanted messages, spam accounted for 1.5% of all emails with “Olympics” or “Paris 2024” in the subject, while malicious emails made up 0.2%. This means that in a sample of 1000 emails, roughly 15 would be spam and about 2 would be malicious. The week with the highest percentage of malicious Olympic-related emails was May 6, with 0.6% classified as malicious. Declining after that peak, it ticked back up in July, to 0.4% on July 8.
Furthermore, the week of June 24 witnessed the highest proportion of spam emails for the year so far, at 7% of all emails.
As the Olympics opening ceremony approaches, we expect the volume of related emails, and the proportion of malicious and spam emails, to increase. We’ll provide an update of the first days of the Olympics next week.
As the world turns its eyes to Paris for the 2024 Summer Olympics, our latest analysis provides a snapshot of the enthusiasm surrounding the games, with France, the host nation, clearly leading in terms of DNS traffic to official Olympic websites, followed by the UK, the US, and Australia.
With the games about to start, the best is yet to come, with the Olympics bringing over three hundred events in 32 sports to people all around the world.
* “Citius, Altius, Fortius – Communiter” — Latin for “Faster, Higher, Stronger – Together.” The first three words comprise the original motto that was proposed by Pierre de Coubertin, a French historian and the “father” of the modern Olympic Games, upon the creation of the International Olympic Committee in 1894. It wasupdatedin 2021 to include “Communiter”, highlighting the power of sports to bring people together.
The 2024 Summer Olympics, or Paris 2024, is set from July 26 to August 11 in France. The opening ceremony, scheduled for Friday, July 26 at 17:30, will take place for the first time not in a stadium but in the open space of the Jardins du Trocadéro by the Seine River in Paris. We’ll monitor relevant Internet insights throughout the event, but here we analyze some pre-event trends, from the popularity of Olympic websites by country to the increase in Olympics-related spam and malicious emails.
This year’s Olympics will host 329 events across 32 sports, featuring the debut of breakdancing as an Olympic event and the return of skateboarding, sport climbing, and surfing from 2020. Similar to our 2024 elections coverage, we will maintain a Paris 2024 Olympics report on Cloudflare Radar, updating it as significant Internet trends related to the event emerge.
From our 1.1.1.1 resolver, DNS trends show heightened interest in the Olympics, especially from France. 24% of DNS requests for official Olympic-related websites came from the host country, followed by the United Kingdom and the United States, with 20% and 17% respectively.
Here’s the breakdown of countries responsible for at least 1% of 1.1.1.1. traffic for Olympic sites (percentages rounded):
France: 24%
United Kingdom: 20%
United States: 17%
Brazil: 5%
Germany: 4%
Russia: 3%
Australia: 2%
Japan: 2%
India: 2%
Spain: 1%
Ireland: 1%
Canada: 1%
South Africa: 1%
Netherlands: 1%
Italy: 1%
Days with the highest “Olympic” spikes
Analyzing the evolution of DNS traffic to official Olympic websites since January 2024, we’ve noted multiple spikes associated with specific Olympic events or ticket sales. The following ranking offers a global perspective via our 1.1.1.1 resolver, illustrating that as the event draws near and Paris readies itself, more recent dates are emerging prominently in the data.
Top 5 days with higher DNS traffic to Olympic official sites in 2024:
January 31: Eve of the 2024 Winter Youth Olympics closing ceremony in Gangwon, South Korea.
April 17: Over 250,000 new tickets for Olympic Games Paris 2024 went on sale – one of the last opportunities to get tickets to the main events.
January 19: Opening ceremony of the 2024 Winter Youth Olympics (South Korea).
June 26: One month before the opening ceremony; the Paris 2024 Main Operations Center starts full games operation; in Paris, areas like the Champ-de-Mars became full occupied by the Olympics; in the US, tickets for NBC’s Opening Ceremony coverage for the Paris 2024 in IMAX theaters went on sale.
July 1: Preparations in Paris with street and bridges closures and road signs added indicating fast track routes for Olympic related vehicles.
April 10 spikes in Germany, Russia and the US
On April 10, 2024, DNS traffic spikes were observed not just in France but also notably in Germany, Russia, and the US, among others. Despite France leading in overall DNS traffic to Olympic sites since January, as seen on the world map above, this particular day saw the largest spikes originating from other countries. These spikes were most prominent from Germany, Russia, the US, the UK, France, Brazil, and Australia, in that order.
What caused these spikes? Several press conferences related to the Olympics took place that day. One major announcement, covered globally, declared that for the first time, the Olympics would offer prize money, with track and field gold medalists receiving $50,000. The following chart illustrates the spike in DNS traffic in these countries on that day.
France’s trends: interest in tickets comes first
In France, the host nation, ticket sale days significantly influenced DNS traffic to official Olympic websites. The most obvious spike occurred on February 8, 2024, marking the start of the first phase of ticket sales for 2024, called the “Paris 2024 official ticketing website surprise releases.” On that day, daily DNS traffic was double that of the previous week. A significant surge was also observed at 10:00 local time, coinciding with the ticket release, which saw an hourly DNS traffic increase of 398% compared to the previous week.
The week of March 3, 2024, saw the highest DNS traffic to Olympic-related sites in France so far. The most significant increase occurred on March 4, the day the “Athletics Special” ticket sales began for events at the Stade de France, which also coincided with the unveiling of the Olympic poster. On this day, daily DNS traffic rose by 45% compared to the previous week. Other notable periods included the weeks of May 12 and May 19, when the Olympic torch arrived in France and started its journey through various cities. April 14 also marked a critical day, offering one of the last chances to purchase 250,000 tickets for major events.
“Olympics” and “Paris 2024” emails on the rise
From a cybersecurity perspective, as major events often attract phishing and spam, we’ve analyzed email trends related to the Olympics—recently we did the same for the Biden vs Trump US presidential debate. From January 2024 up to late-July, Cloudflare’s Cloud Email Security service processed well over half a million emails containing “Olympics” or “Paris 2024” in the subject. The week of July 15 saw the highest number of such emails, marking a 694% increase compared to the busiest week in January.
Regarding unwanted messages, spam accounted for 1.5% of all emails with “Olympics” or “Paris 2024” in the subject, while malicious emails made up 0.2%. This means that in a sample of 1000 emails, roughly 15 would be spam and about 2 would be malicious. The week with the highest percentage of malicious Olympic-related emails was May 6, with 0.6% classified as malicious. Declining after that peak, it ticked back up in July, to 0.4% on July 8.
Furthermore, the week of June 24 witnessed the highest proportion of spam emails for the year so far, at 7% of all emails.
As the Olympics opening ceremony approaches, we expect the volume of related emails, and the proportion of malicious and spam emails, to increase. We’ll provide an update of the first days of the Olympics next week.
Conclusion: “Citius, Altius, Fortius” *
As the world turns its eyes to Paris for the 2024 Summer Olympics, our latest analysis provides a snapshot of the enthusiasm surrounding the games, with France, the host nation, clearly leading in terms of DNS traffic to official Olympic websites, followed by the UK, the US, and Australia.
With the games about to start, the best is yet to come, with the Olympics bringing over three hundred events in 32 sports to people all around the world.
* “Citius, Altius, Fortius”—Latin for “Faster, Higher, Stronger.” This motto was proposed by Pierre de Coubertin, a French historian and the “father” of the modern Olympic Games, upon the creation of the International Olympic Committee in 1894.
Internet traffic typically mirrors human behavior, with significant fluctuations during large political events. This comes during a time when the United States is in election mode, as political campaigns are in full swing and candidates for various offices, primaries and caucuses make their case to voters and debates are being held. This week, the Republican National Convention was hosted in Milwaukee, Wisconsin from July 15 to 18, 2024. We examined traffic shifts and cyberattacks since June 2024 to see how these events have impacted the Internet.
Attacks on political related websites
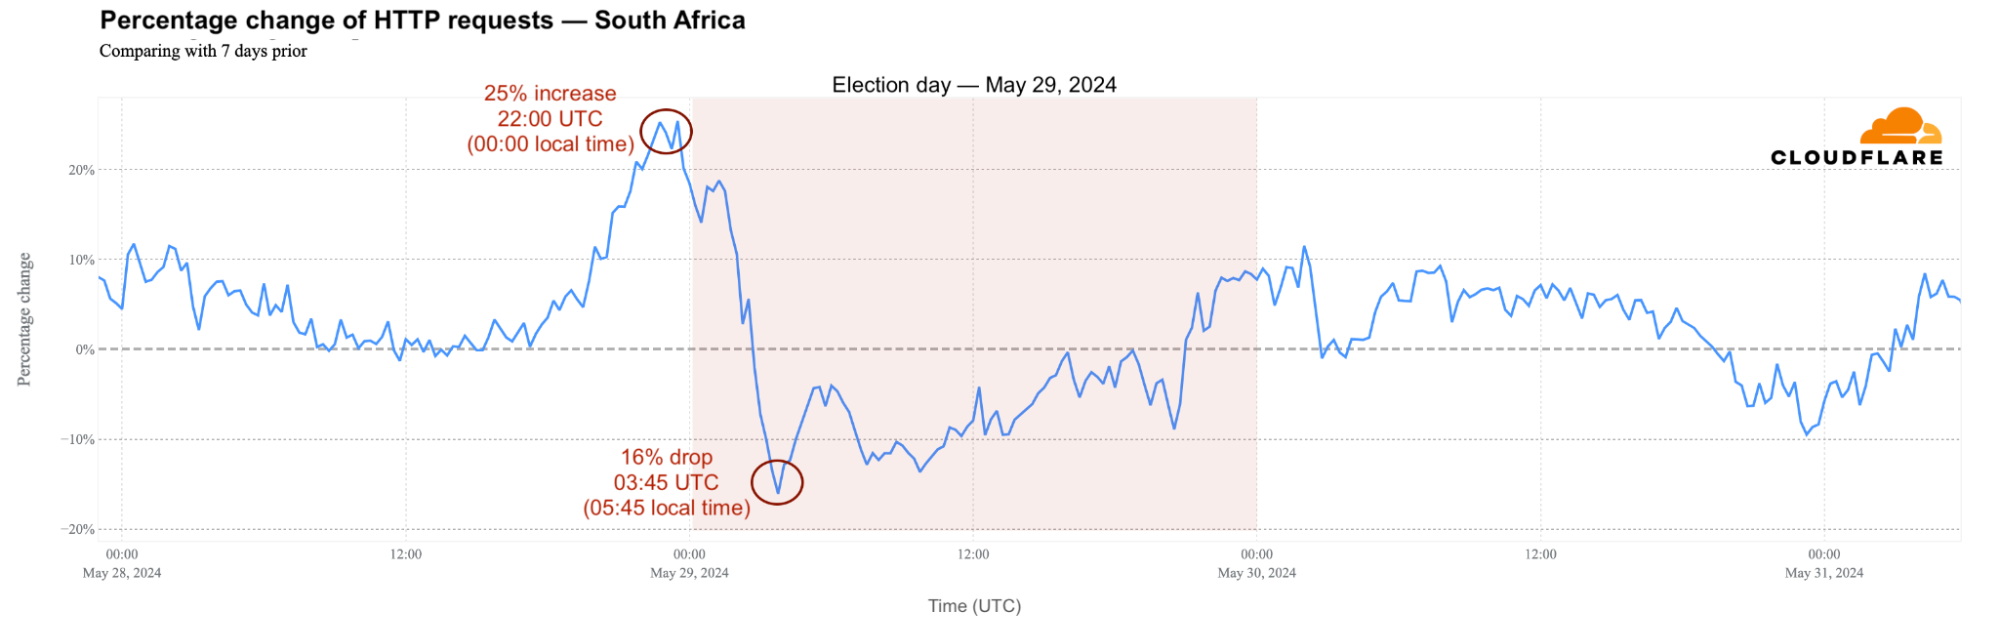
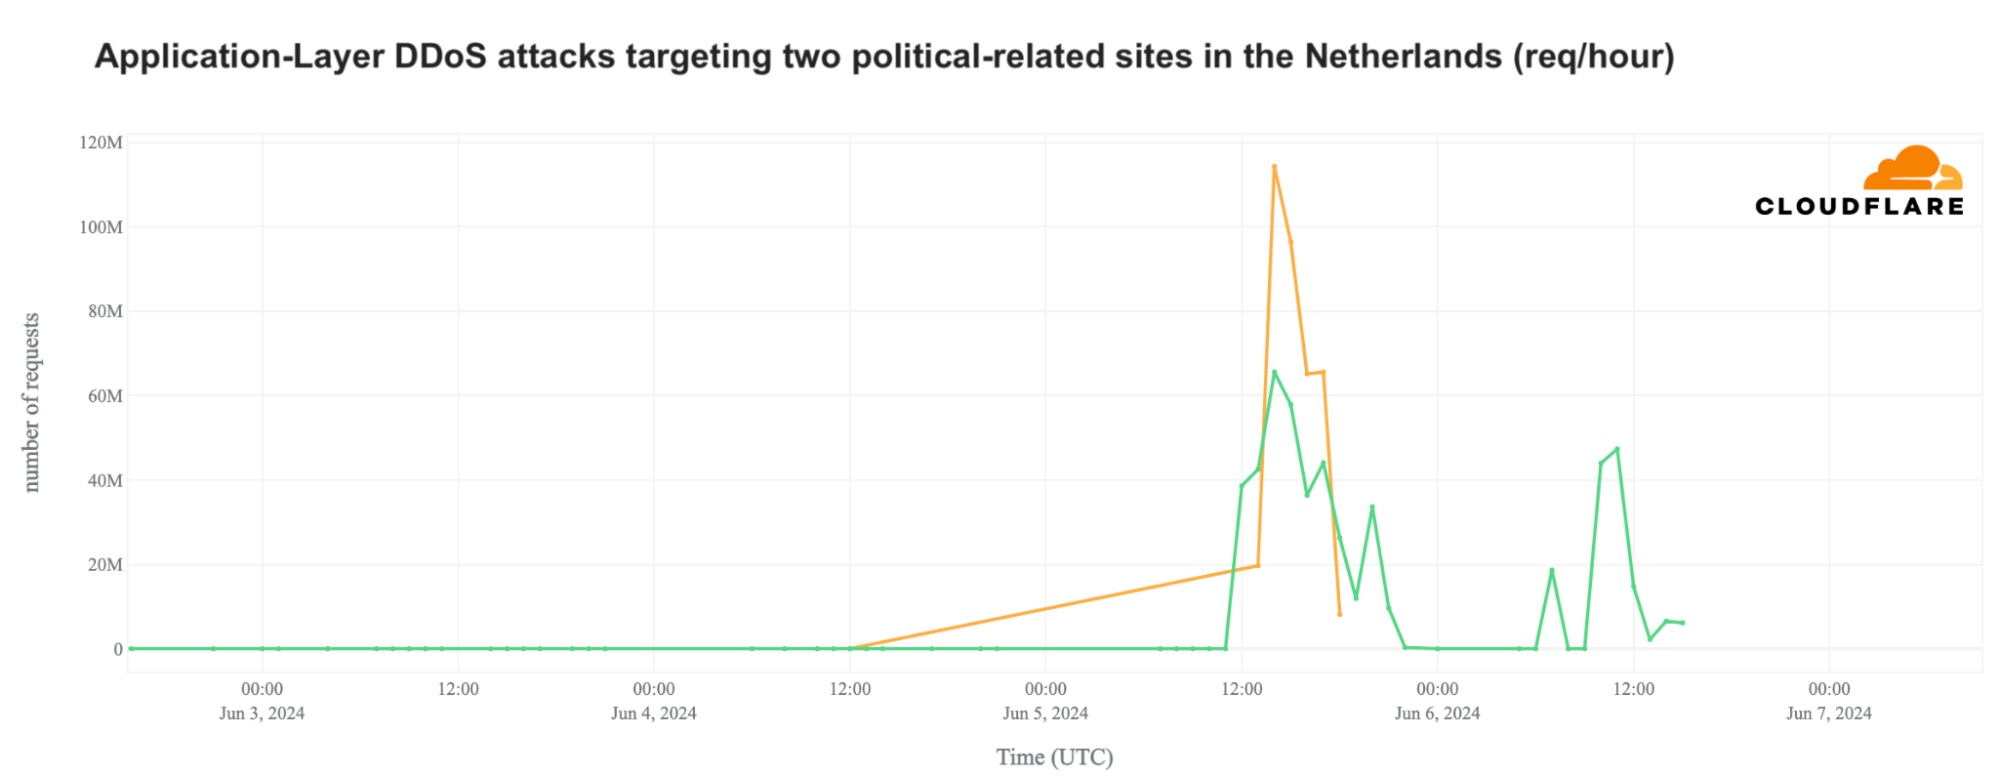
Cyberattacks are a constant threat, and aren’t necessarily driven by elections. With that said, notable trends can often be observed, and we’ve seen before how specific geopolitical events can trigger online attacks. For example, we saw cyberattacks at the start of the war in Ukraine to more recently in the Netherlands, when the June 2024 European elections coincided with cyberattacks on Dutch political-related websites that lasted two days — June 5th and 6th. The main DDoS (Distributed Denial of Service attack) attack on June 5, the day before the Dutch election, reached 73,000 requests per second (rps).
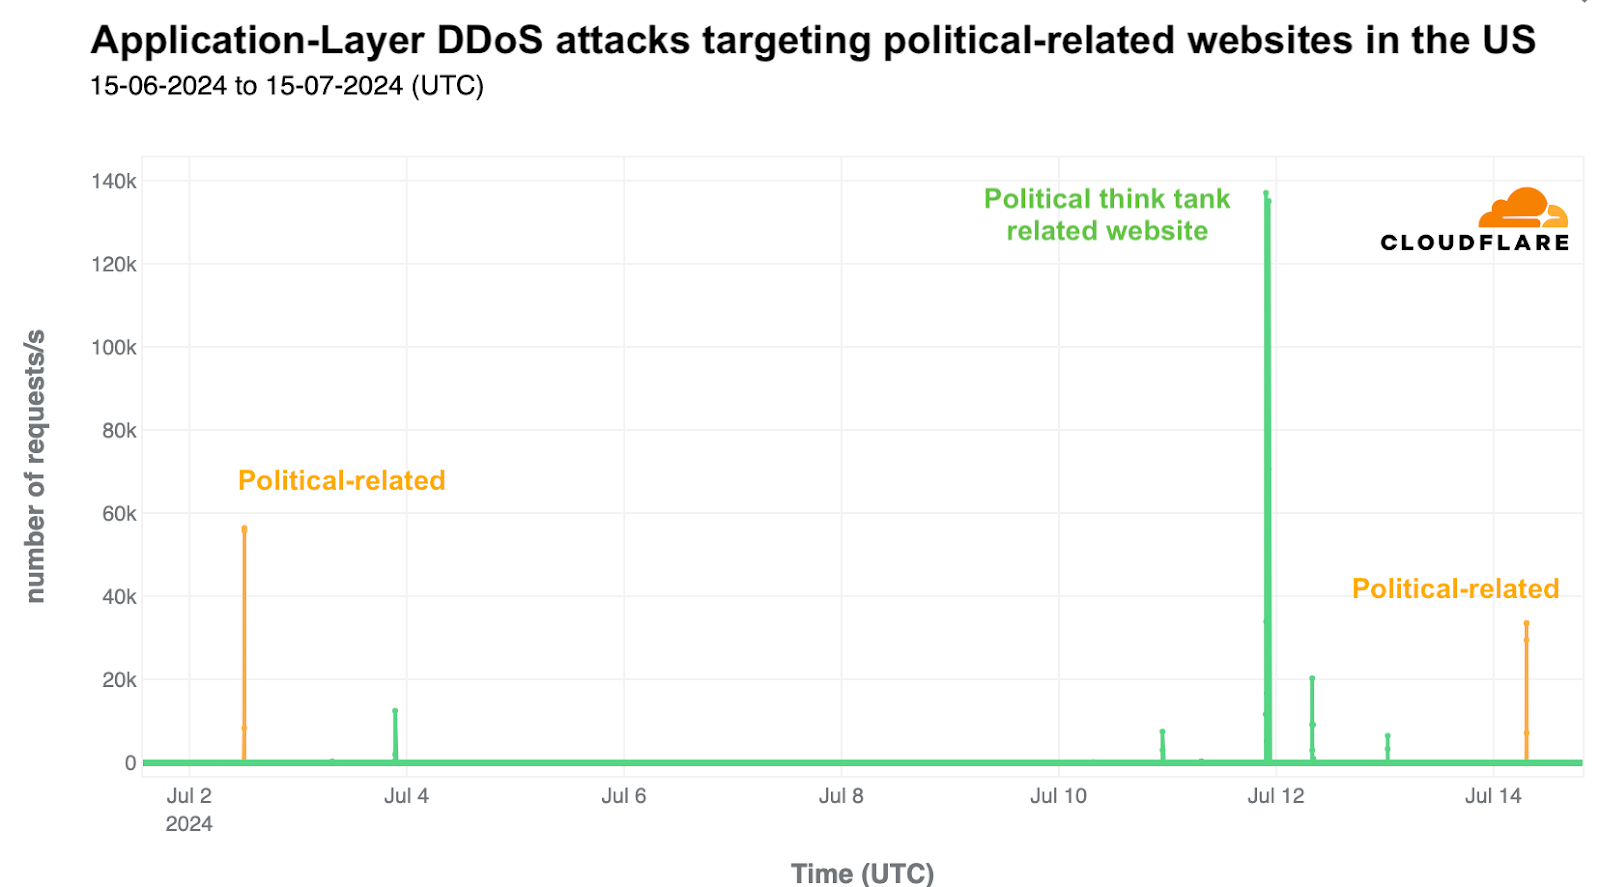
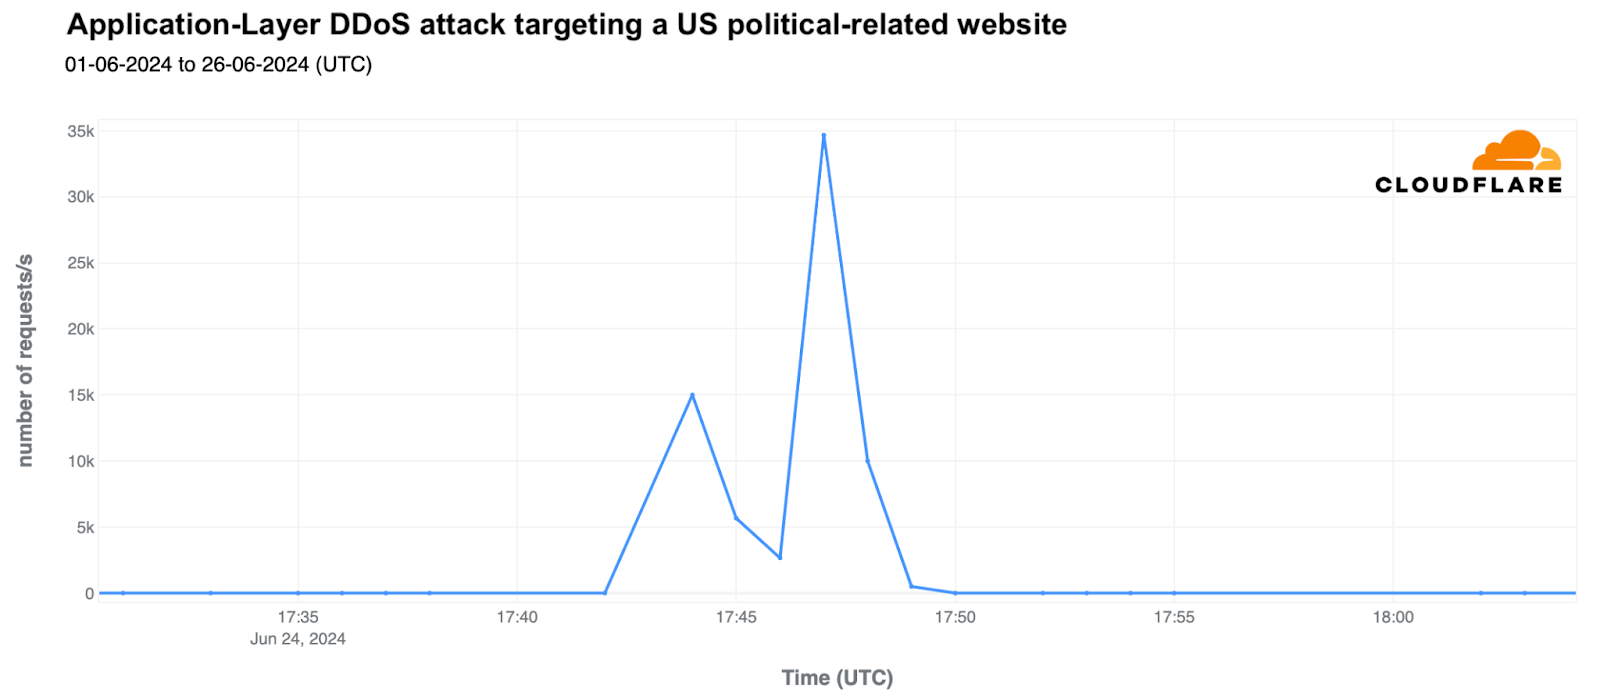
Shifting our focus to the United States in particular, in the weeks since April 2024, we’ve seen several DDoS attacks targeting both federal and state government and political-related websites in the United States. In recent days Cloudflare has also blocked DDoS attacks targeting two political-related websites.
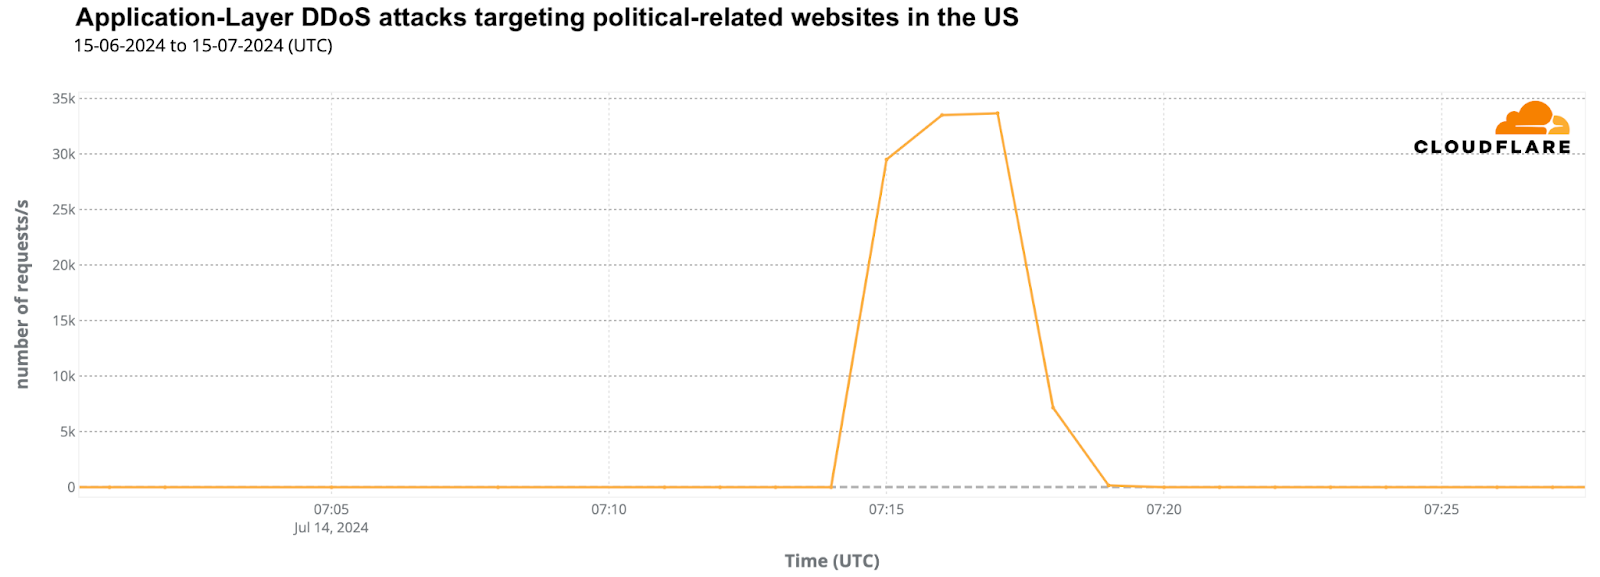
One of those is related to a political campaign, represented by the yellow line on the chart below. The first spike was a DDoS attack on July 2, 2024, peaking at 56,000 rps and lasting around 10 minutes. The same political-related site was attacked later on July 14, with a 34,000 rps peak, lasting four minutes.
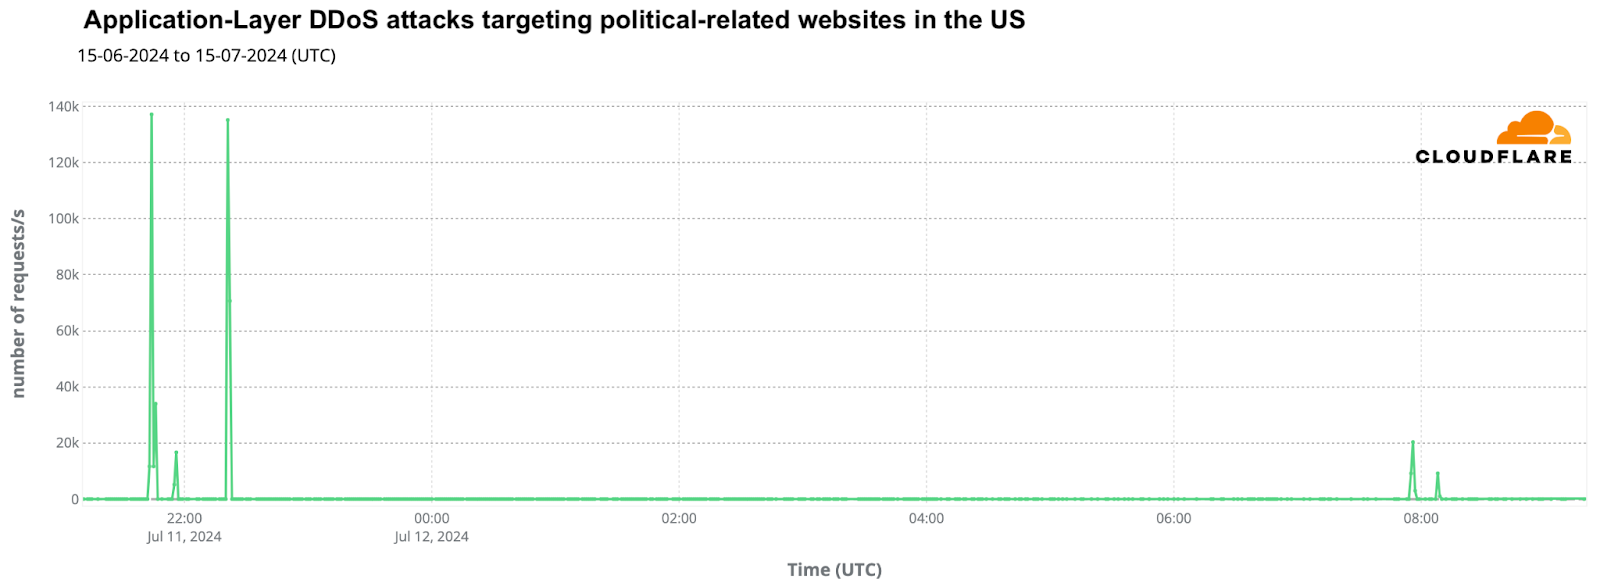
The other political-related site under attack, in green on the previous chart, is a think tank website that does policy advocacy related to presidential politics. It was already attacked before, around the time of the Biden vs Trump debate, as we’ve published at the time in a related blog post. The main attack was on July 11, with a 137,000 rps peak, lasting a few minutes, and was repeated, with slightly lower intensity, a few hours later on July 12.
As we’ve seen in our recent DDoS report, the vast majority of DDoS attacks are short. This emphasizes the need for automated, in-line detection and mitigation systems. Ten minutes are hardly enough time for a human to respond to an alert, analyze the traffic, and apply manual mitigations.
Trump assassination attempt impact
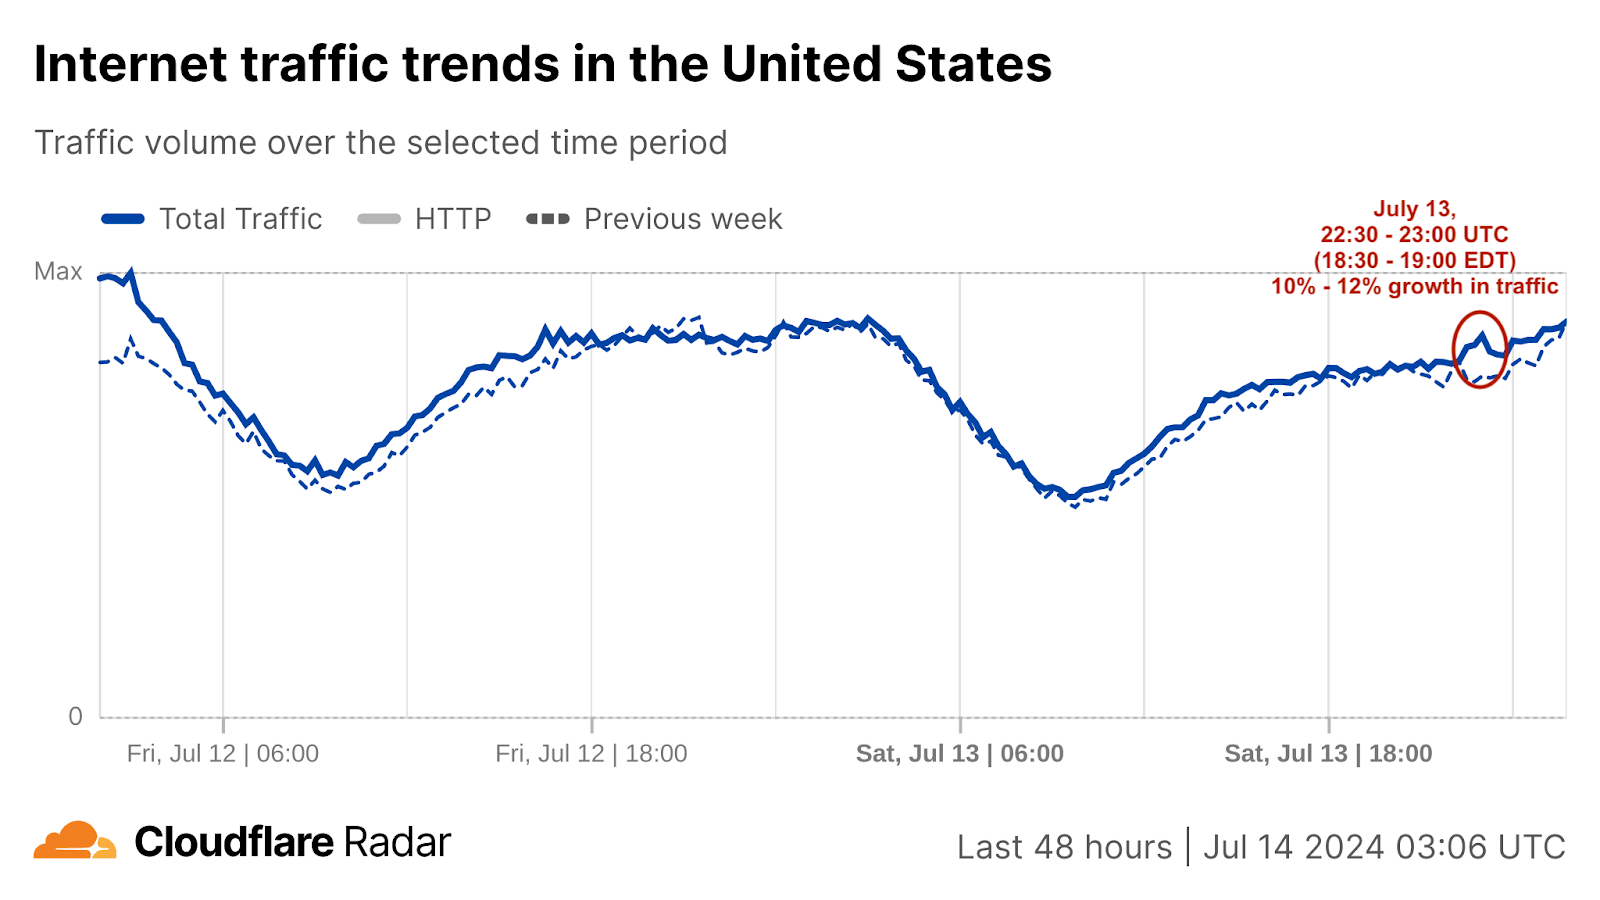
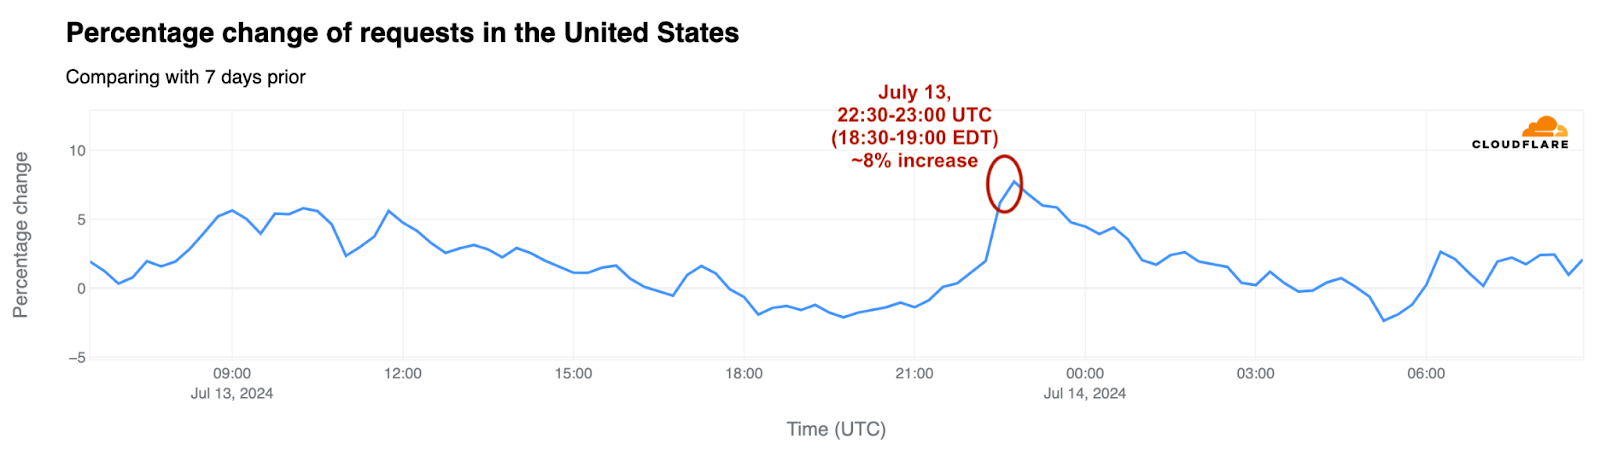
The attempted assassination of former President Trump at a campaign rally near Butler, Pennsylvania precipitated an increase in Internet traffic within the United States, particularly to news-related media outlets. As news broke of shots fired at a Trump rally, injuring the former president, Internet traffic in the United States (in bytes) increased around 22:30 – 23:00 UTC (18:30-19:00 EST) by 10% to 12%.
HTTP requests in the United States saw up to an 8% increase on July 13th compared to the previous week.
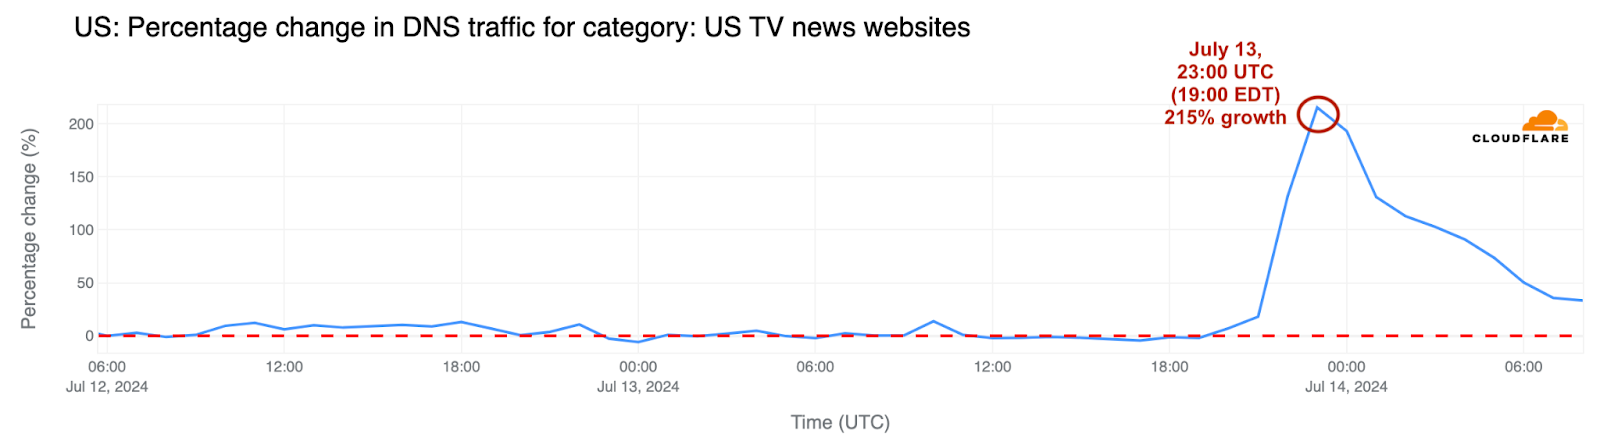
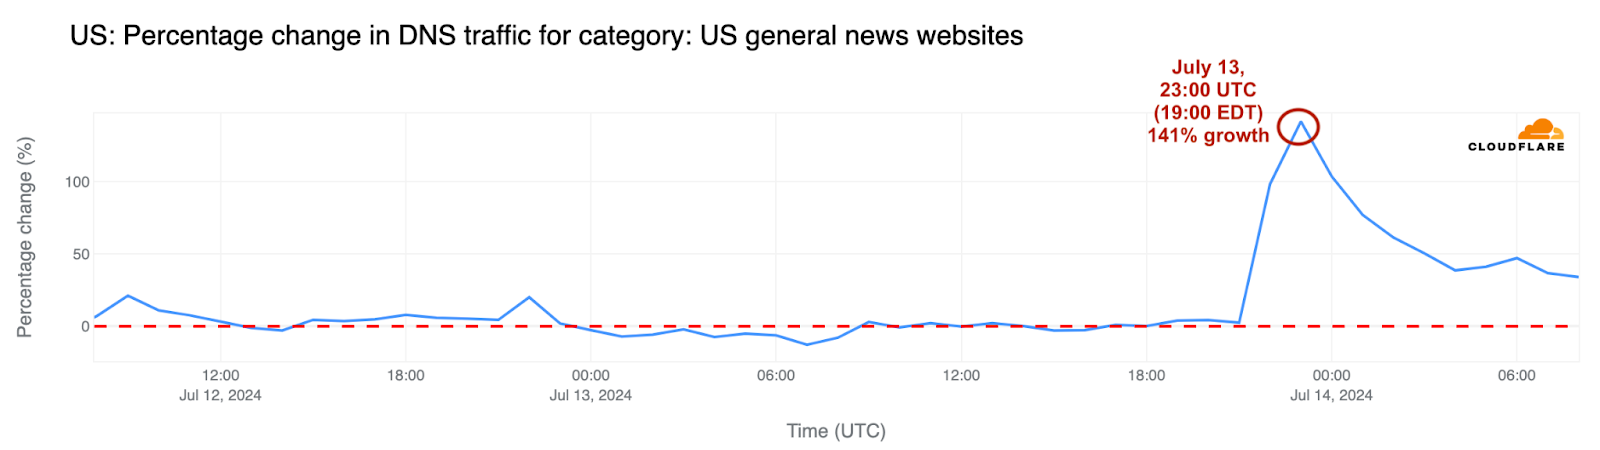
At the same time, DNS traffic to TV news sites, via our 1.1.1.1 resolver, surged by as much as 215%, and to general news sites by 141%.
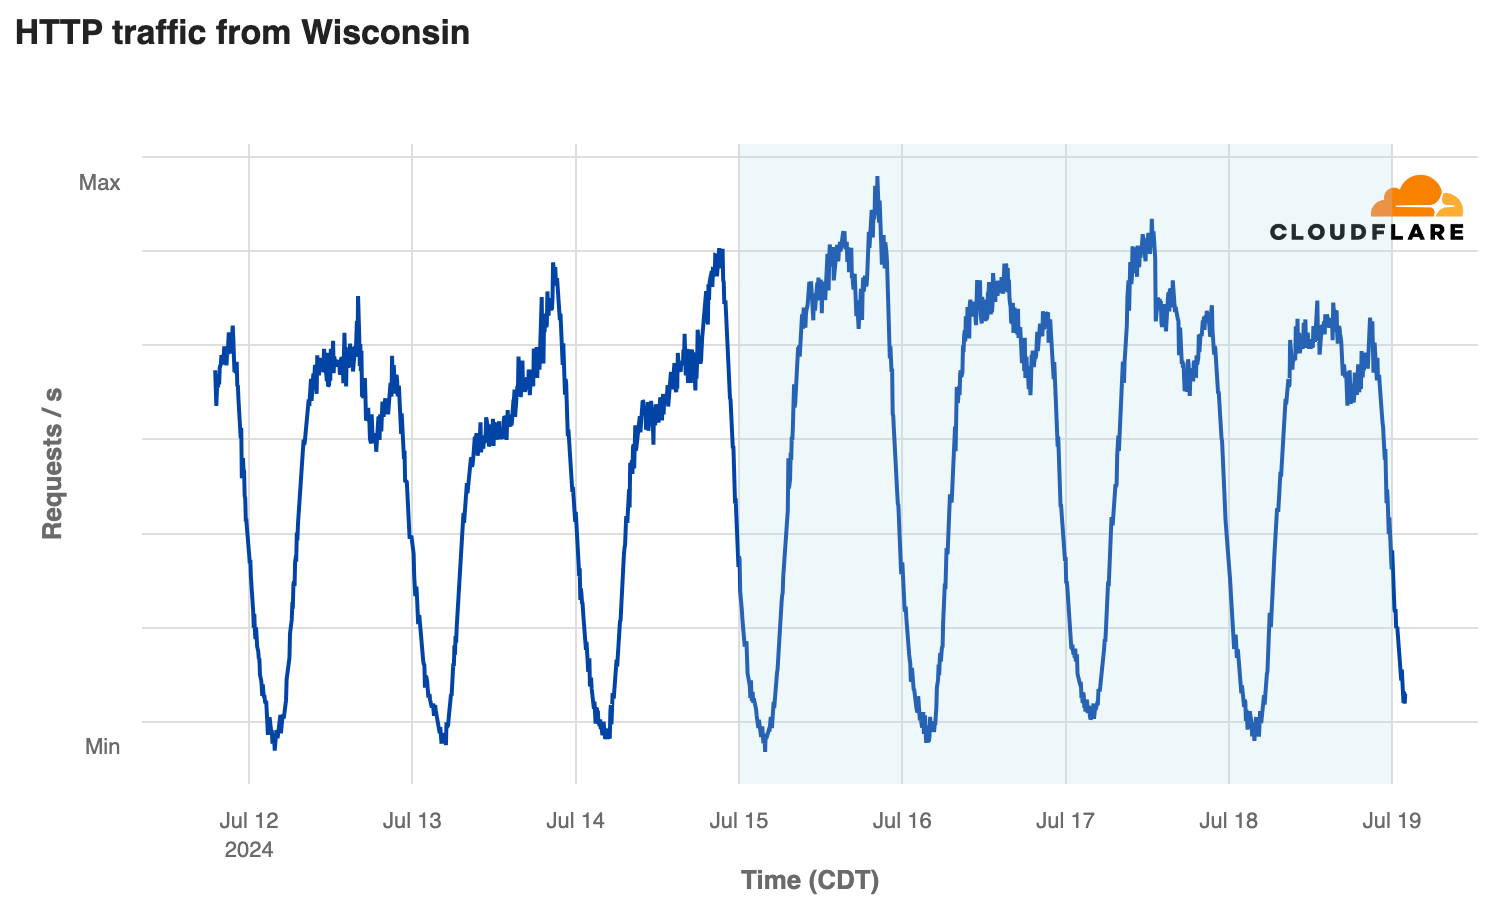
Republican National Convention
The Republican National Convention is an important political event as delegates of the United States Republican Party choose the party’s nominees for president and vice president in the 2024 United States presidential election. Over the four-day event, convention delegates formally nominate the party’s presidential and vice presidential candidates and adopt the party’s platform, which outlines its policies and positions on various issues. The convention features speeches from prominent party members, including the nominees, party leaders, and other influential figures.
This year’s convention was held in Milwaukee, Wisconsin. During this time, we didn’t identify any noticeable traffic spikes from Milwaukee or from Wisconsin in general.
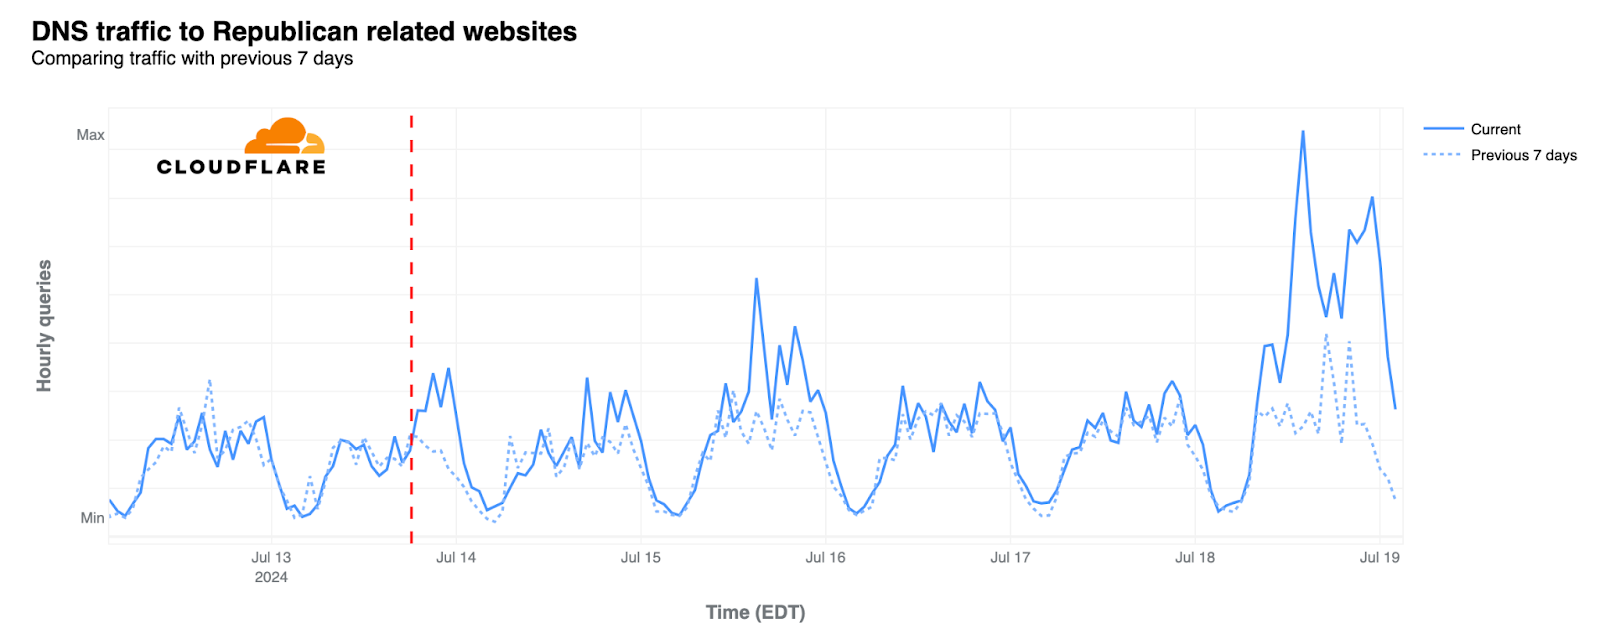
Compared to the previous week, there was an increase in DNS traffic to Republican political party and fundraising websites. On July 18th, the last day of the convention, we saw two considerable increases in hourly traffic compared to a week prior. The first at 14:00 EDT, an increase of 268% in traffic to these sites. The second, at 23:00 EDT with another increase at 266%. The daily aggregation on this day was an increase of 90.48% compared to daily traffic aggregations in the previous week.
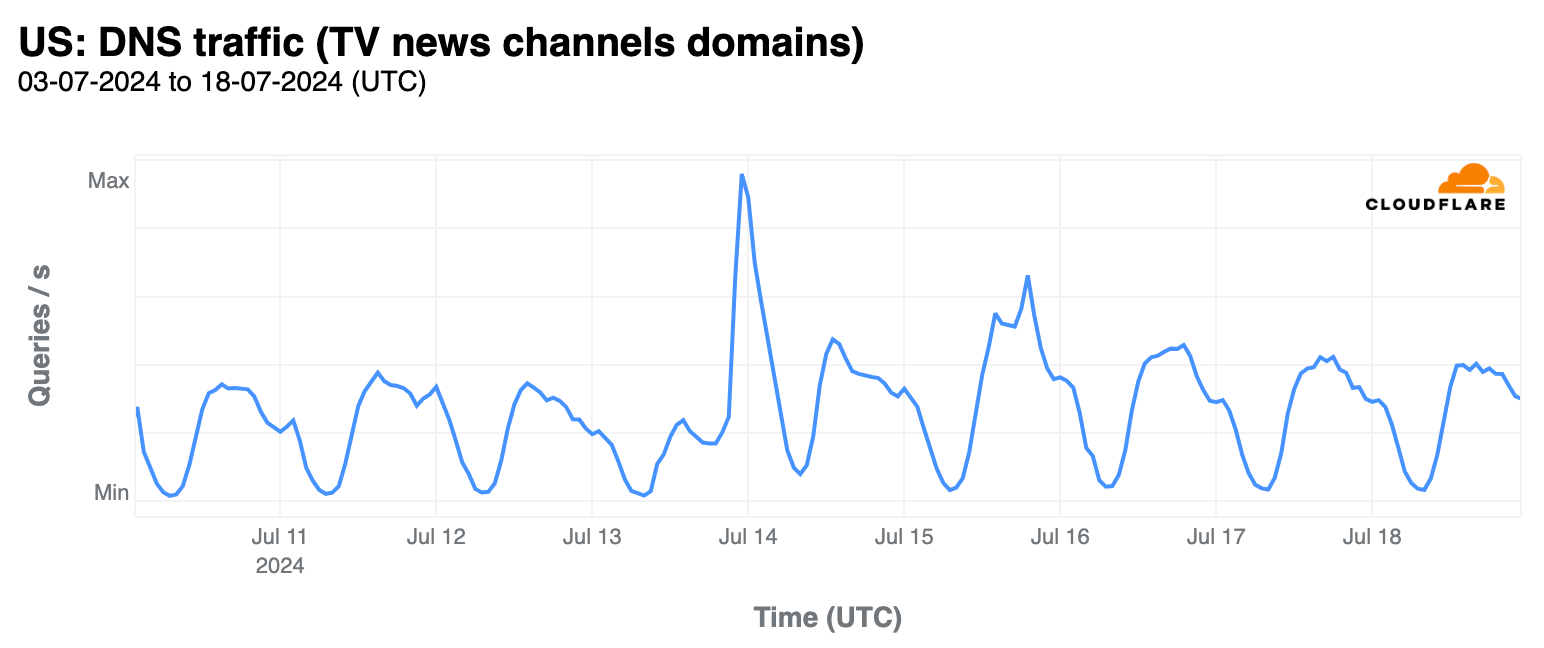
For DNS traffic during the convention for TV news channels, we see steady traffic numbers with the highest peaking days before the convention on July 14, then during the late hours of July 15th.
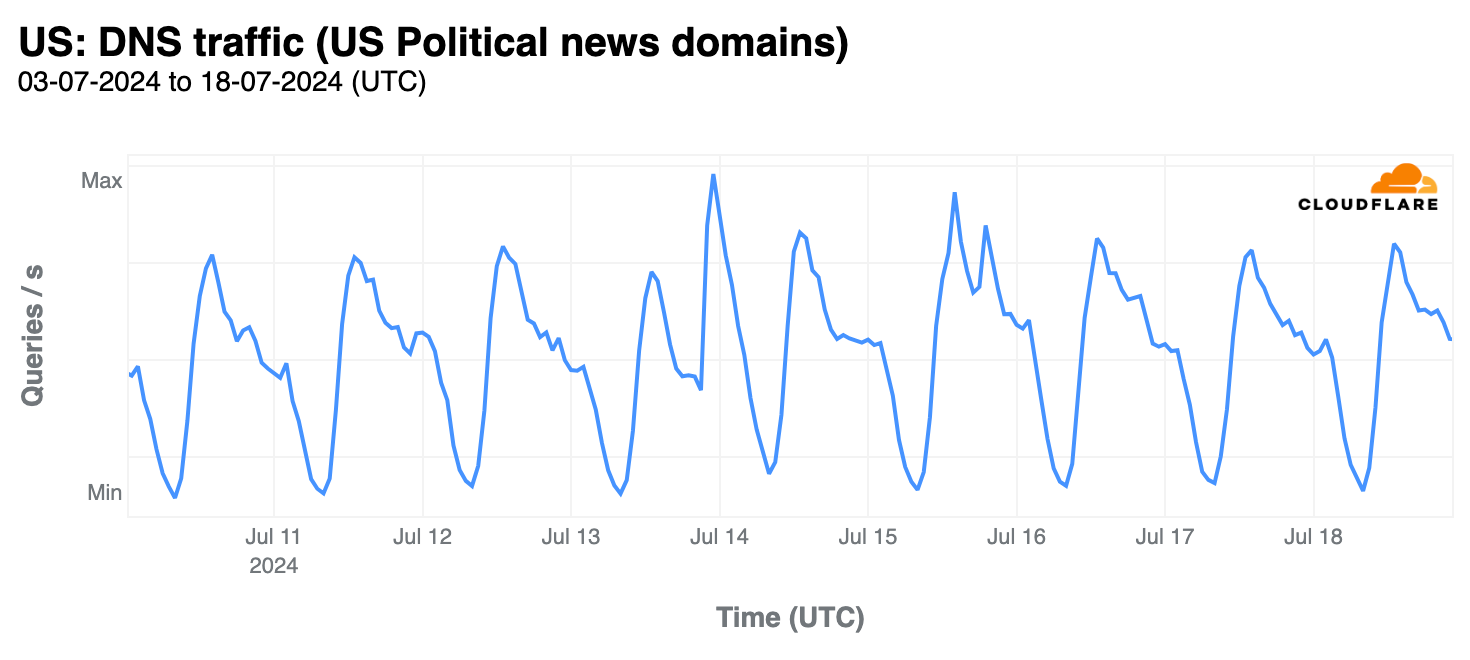
For political news websites covering the RNC, traffic numbers tend to decrease slightly as the event progresses.
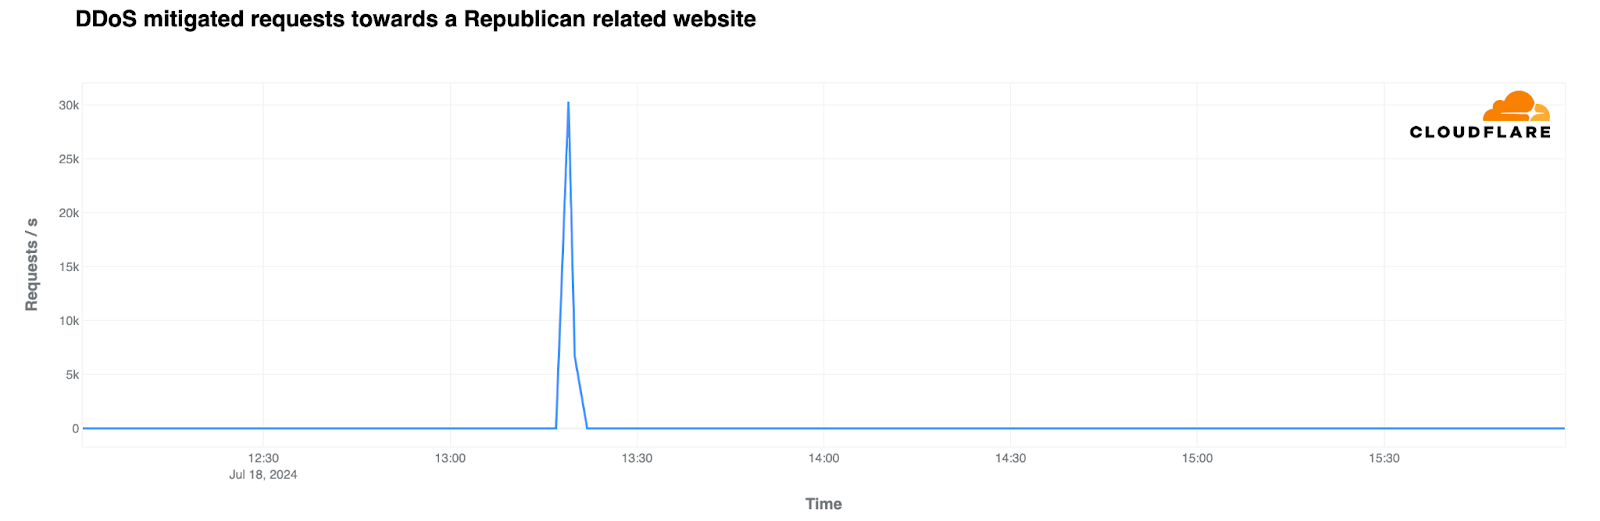
We identified an attack against a think-tank based in Washington D.C. that does policy advocacy related to presidential politics. The attack itself lasted around 3 minutes, from July 18th 13:18 to 13:22 exclusive (EDT) with a total of 3.12 million DDoS requests mitigated. The attack peaked at around 30.33k rps.
We see that major political events may not always cause significant shifts in Internet traffic. Our data indicates increases in traffic primarily to news and media organizations from July 13th onward. When it comes to cyber attacks, a majority of activity we see targets political campaigns and policy organizations.
If you want to follow more trends and insights about the Internet and elections in particular, you can check Cloudflare Radar, and more specifically our new 2024 Elections Insights report, which will be updated as elections take place throughout the year.
National team sports unite countries, and football (known as “soccer” in the US) is the world’s most popular sport, boasting approximately 3.5 billion fans globally. The UEFA Euro 2024, running from June 14 to July 14, 2024, significantly impacts Internet traffic across participating European nations. This blog post focuses on the two finalists, Spain and England, and comes after an initial post we published during the first week of the tournament.
Analyzing traffic patterns reveals distinct high-level trends. Spain saw the most significant drops in Internet traffic during games against major teams and former champions such as Italy (the defending champion), Germany, and France. In contrast, England’s games had crucial moments towards the end, leading to the largest traffic reductions in the UK, especially during the knockout stages.
For context, as previously mentioned, football games like the Super Bowl, differ from other events such as elections. When major teams or national squads play, especially in matches that captivate many viewers, Internet traffic often drops. This is particularly true if the game is broadcast on a national TV channel. During such broadcasts, people tend to focus more on their TV sets, relying on the traditional broadcast signal rather than online streaming, especially for games that aren’t behind a paywall. This is a typical scenario when national teams play in Europe.
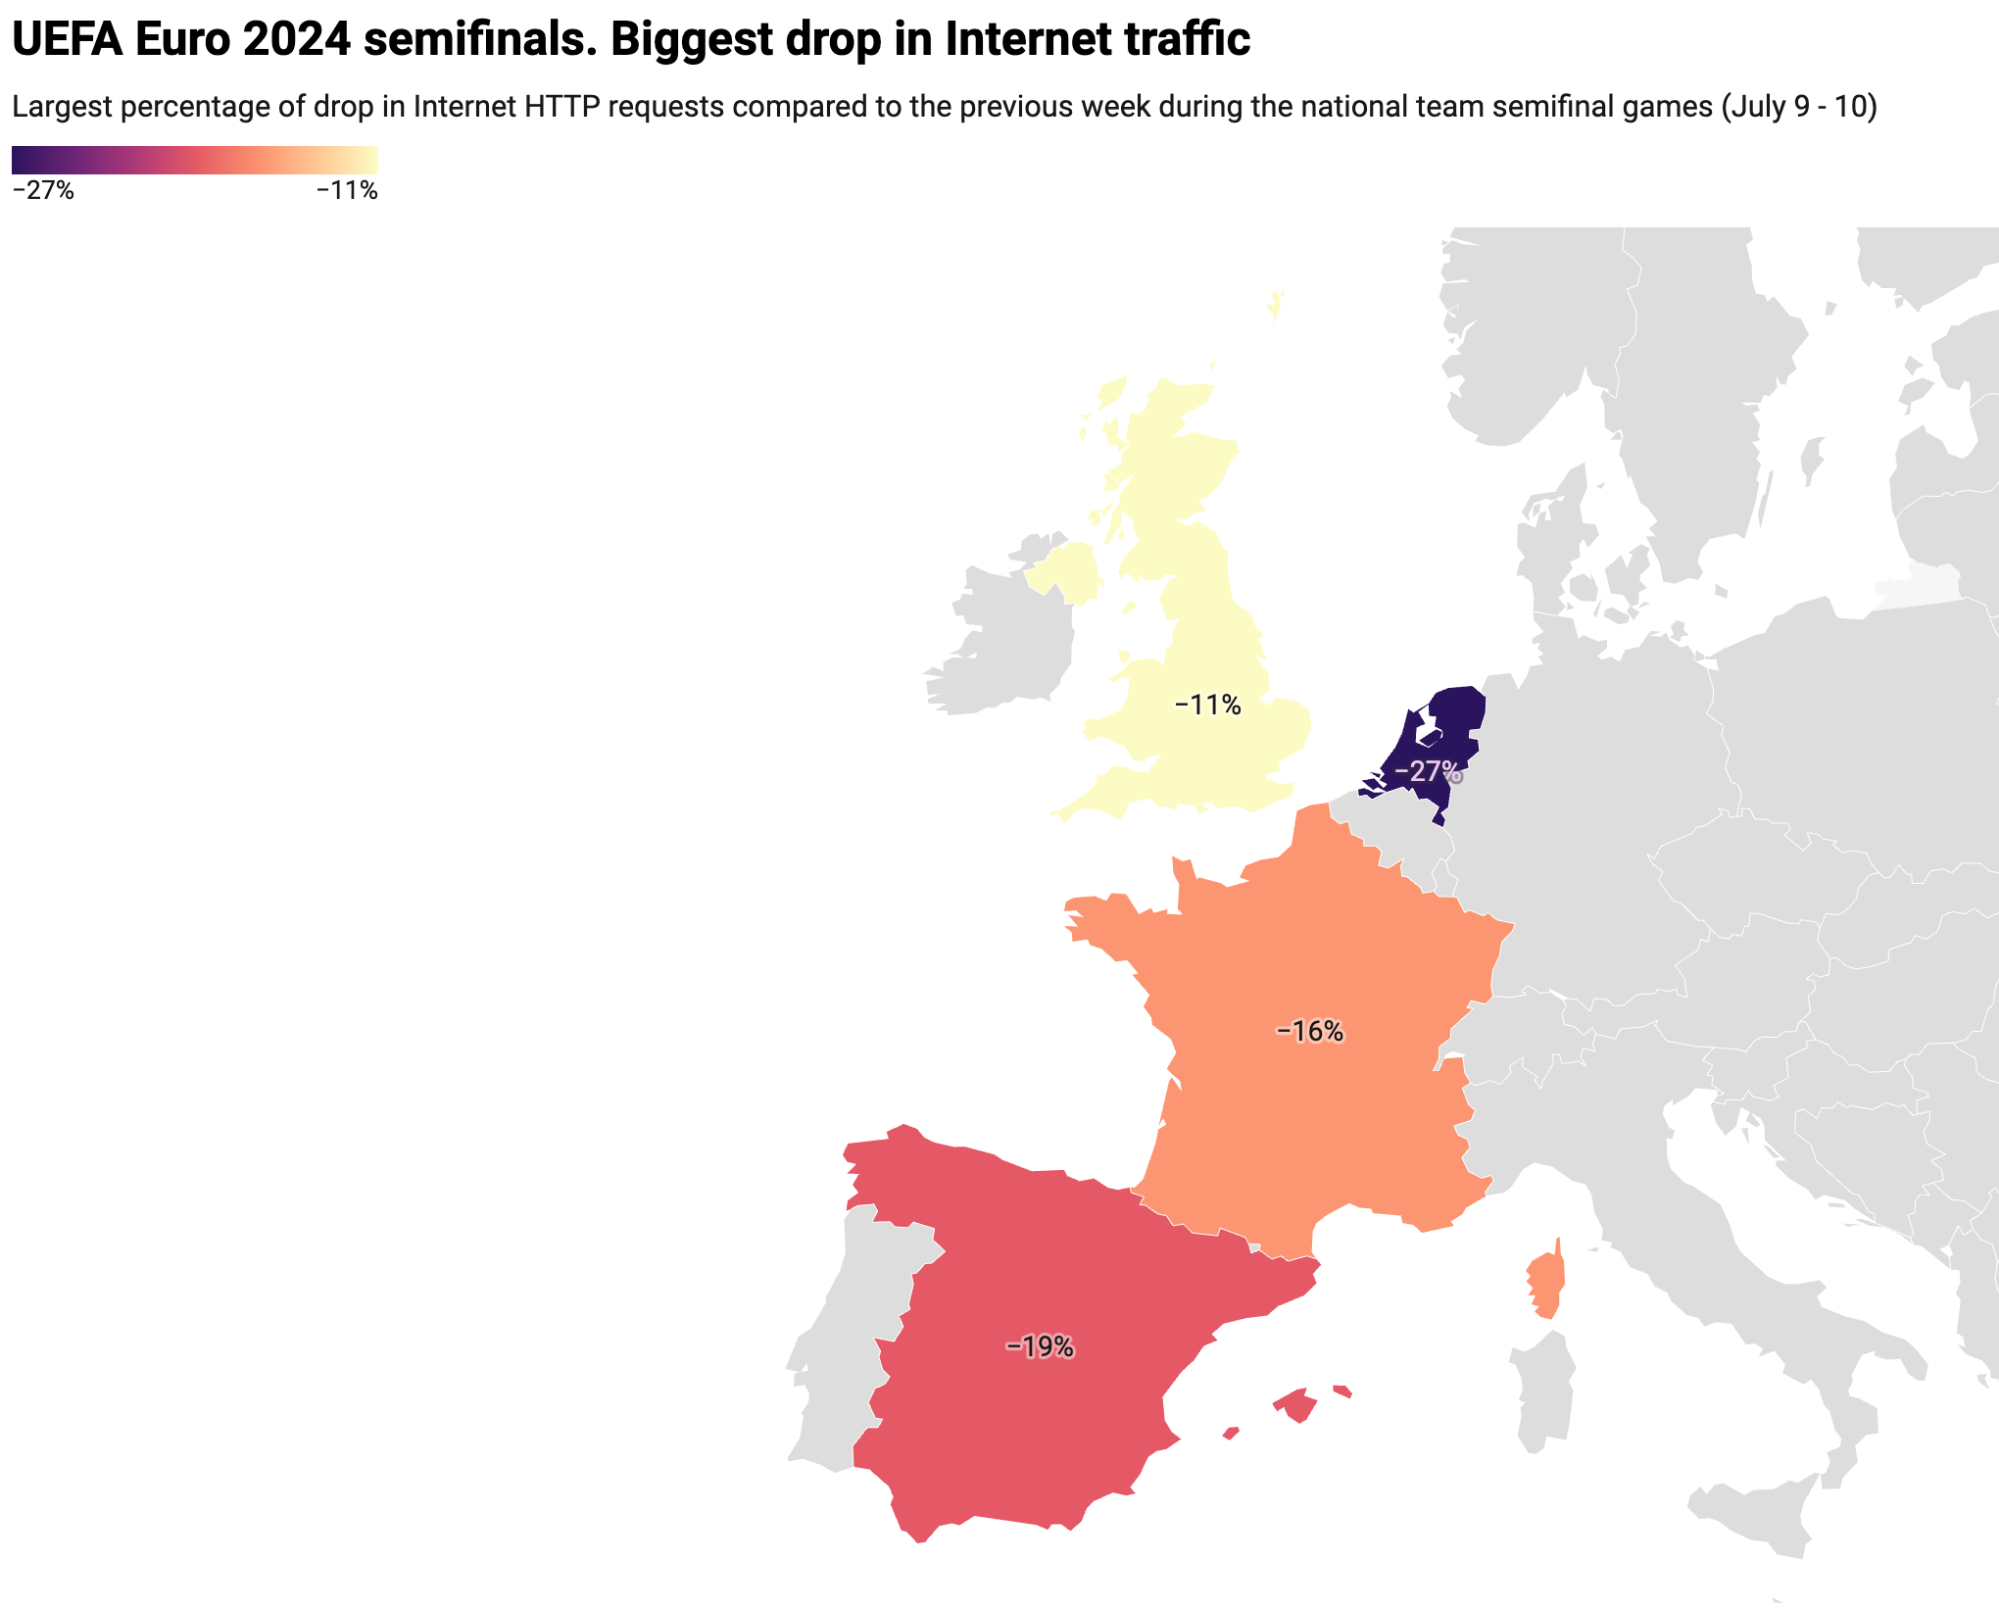
Semifinals: differences between four countries
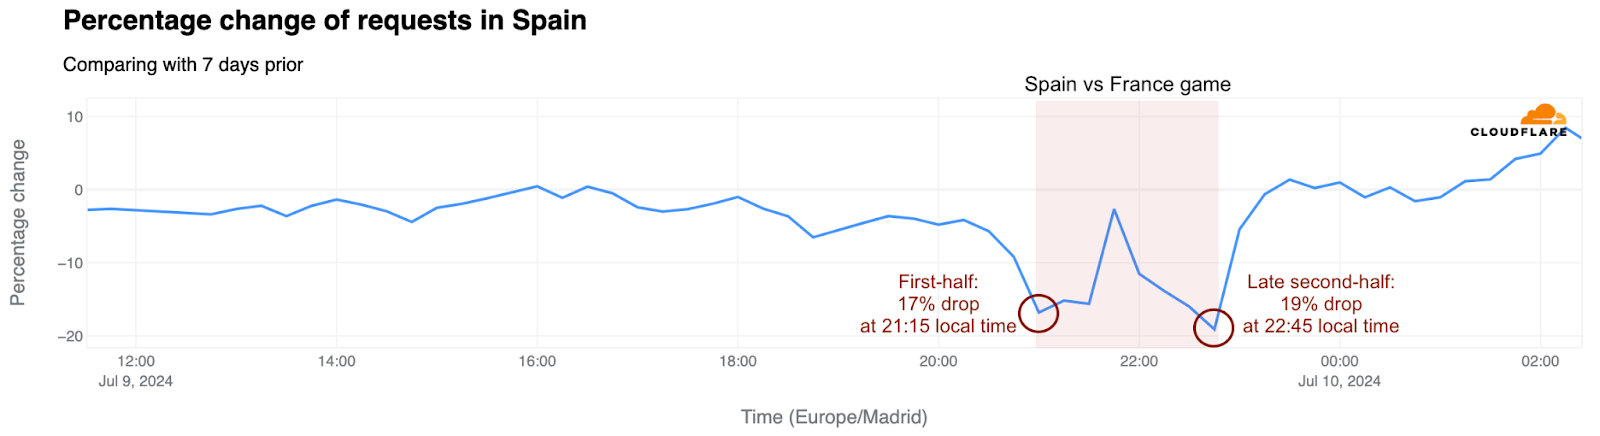
Let’s first analyze the impact of the semifinals on the four countries with national teams playing, using UK-related data for England. The following table displays the traffic drop percentages and the times of the largest declines during the Spain vs. France and Netherlands vs. England matches. Note that England is the only one not on Central European Time.
In both Spain and the UK, traffic decreased the most at the end of the game, details of which are provided below. In France and the Netherlands, significant drops of 16% and 27% respectively occurred primarily in the first half.
Country
Drop on traffic
Date / time of biggest drop (local time)
Spain
-19%
Jul 9, 22:45
France
-16%
Jul 9, 21:00
Netherlands
-27%
Jul 10, 21:15
England (UK)
-11%
July 10, 21:45
(Source: Cloudflare; created with Datawrapper)
Traffic in the UK: England’s late goal impact
England’s matches frequently saw crucial moments near the end, leading to the largest dips in UK Internet traffic. This trend was especially pronounced during the knockout phases and after Scotland’s exit from the tournament. England’s tournament opener, a win against Serbia on June 16, experienced the most significant traffic drop at the game’s start – an 8% decrease from the previous week.
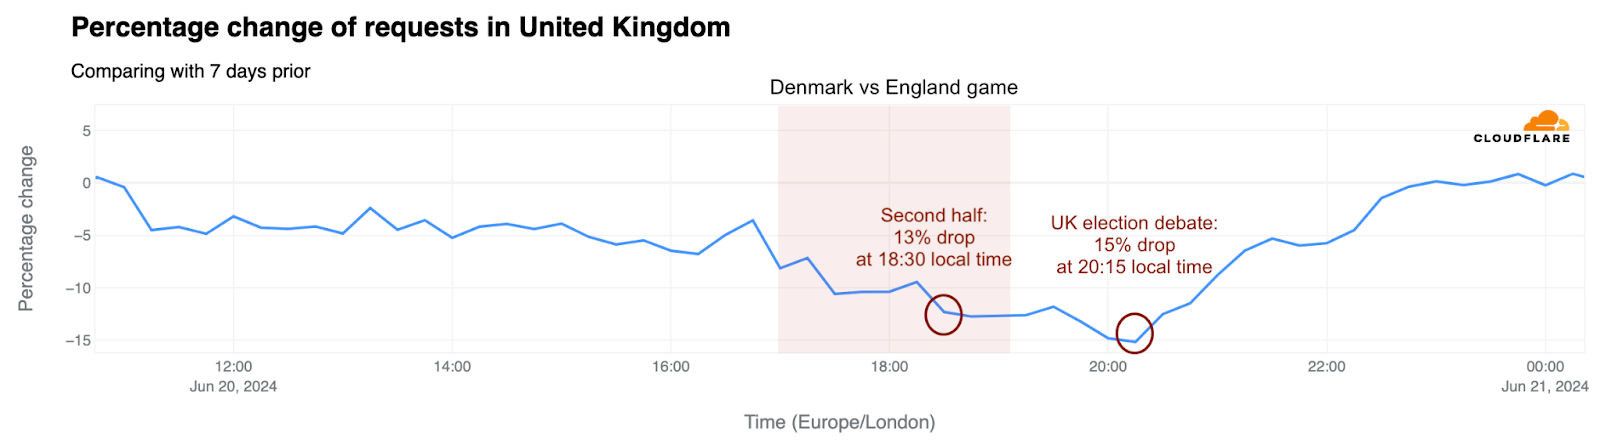
UK election debate vs England’s game
The second game, on June 20, against Denmark, ended in a draw and saw a bigger drop in traffic. During the game, traffic in the UK initially dropped 8% compared to the previous week, then fell even further in the second half, by as much as 13%. Following the game, the BBC broadcast a significant live event – the debate between the country’s four major political parties. It started at 20:00 local time, and 15 minutes later, traffic experienced its largest drop of the day: 15%.
The third and final group stage game for England, a draw against Slovenia, saw a 5% drop in Internet traffic during the second half and a 4% drop in the first half. In the round of 16 game against Slovakia on June 30, traffic dipped 9% in the UK towards the end of the second half as Jude Bellingham scored a crucial late goal. During extra time, when Harry Kane scored, traffic decreased further to 10% below the previous week’s level.
Next, during the July 6 quarter-final against Switzerland, traffic in the UK dipped 3% during the game, mostly towards the end of regular time. However, it decreased further by 11% towards the end of extra time and during the penalty shootouts.
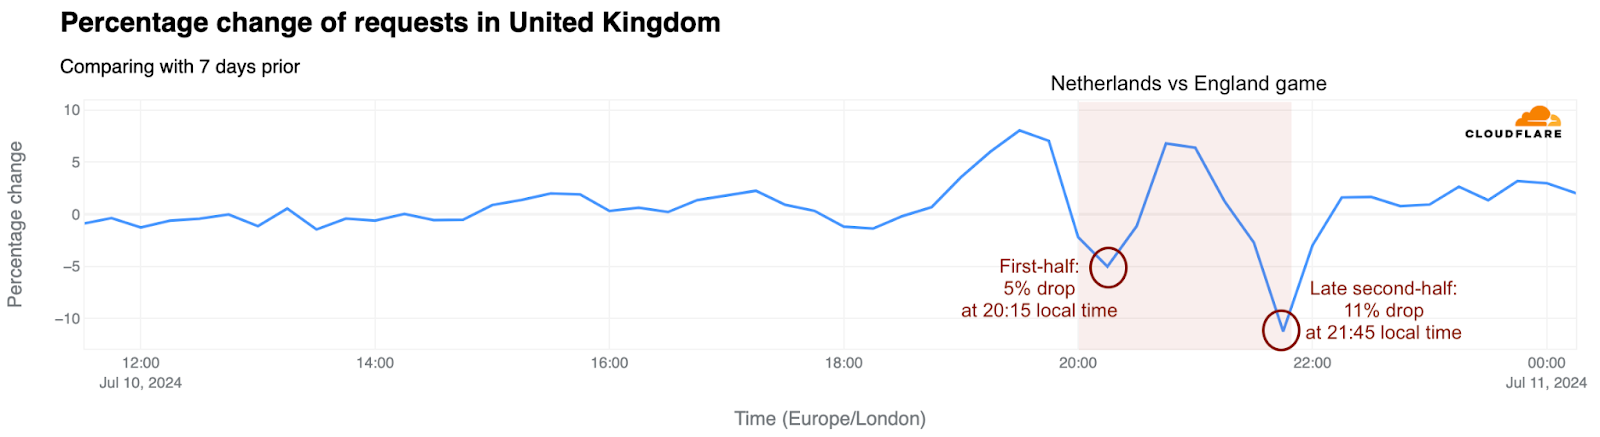
The semi-final between England and the Netherlands on July 10, 2024, experienced a noticeable drop in UK traffic – 5% at 20:15, when the first two goals were scored. Traffic decreased further, to 11% below the previous week, at the end of the game as Ollie Watkins scored the winning goal, securing England’s spot in the final.
Spain’s big game traffic impact
Spain was the only team to win all its matches without going to penalties throughout the tournament. The most significant drops in Internet traffic occurred during games against other major teams and previous titleholders like Italy, Germany, and France.
Spain’s first game in the tournament against Croatia on June 15, during dinner time in the country, ended in a decisive 3-0 win. It was accompanied by a significant drop in traffic – 7% in the first half and 9% in the second.
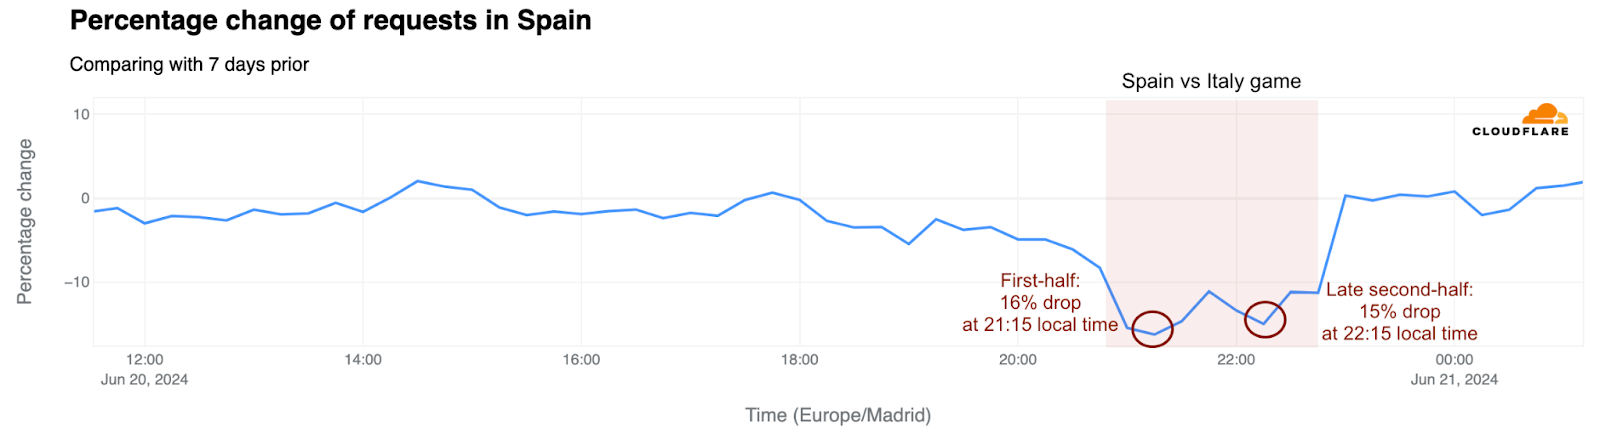
The June 20 match against Italy, featuring two teams with rich histories of European and World titles – and Italy as the defending champion – captured significant attention. Also broadcast on national TV, as the other games were, it led to substantial drops in traffic: a 16% decrease early in the first half, and a 15% drop in the second half, right after halftime, aligning with Calafiori’s goal that secured Spain’s win.
The final group stage game for Spain against Albania on June 24, which was non-decisive with Spain’s advancement already secured, saw a traffic decrease of 6%. Then came the knockout phase. It began with a round of 16 match against Georgia on June 30, where traffic fell by up to 8%, with a more pronounced drop in the first half coinciding with Spain equalizing the game.
The July 5 quarterfinals against host Germany was also a game that matched two football giants, in terms of national team international football titles. The game began with an initial 10% decline in traffic, followed by a 7% drop in the second half, and an 8% drop at the end of extra time, around the time Merino scored the winning goal.
Spain’s semi-final on July 9 saw early goals and a swift turnaround after France’s initial goal. The game started with a 17% drop in traffic compared to the previous week, persisting through the first half. By the end of the second half, as France aggressively sought to score and Spain defended vigorously to avoid extra time, traffic dipped further to a 19% drop. Ultimately, the Spanish squad secured a spot in the final.
Conclusion
The UEFA Euro 2024 has significantly impacted Internet traffic across participating European countries from Cloudflare’s perspective. Games broadcast on national TV drew fans’ attention away from the Internet. Critical moments such as last-minute goals, extra time, or penalty shootouts also led to larger drops in traffic as fans focused more on the game.
Also, distinct patterns have emerged in the finalist countries, Spain and England. For Spain, matches against traditional football powerhouses resulted in noticeable drops in traffic, indicating high viewer engagement during key matches. England’s games also saw significant traffic reductions at critical moments, particularly during the knockout stages.
The 2024 French legislative election runoff on July 7 yielded surprising results compared to the first round on June 30, with the New Popular Front (NPF) gaining the most seats, followed by French President Macron’s Ensemble party, and the National Rally. Coalition negotiations will follow. In this post, we examine the ongoing online attacks against French political parties and how initial election predictions at 20:00 local time led to a noticeable drop in France’s Internet traffic.
Let’s start with the attacks, and then move on to the Internet traffic trends.
Political parties under attack
As we highlighted last week, the first round of the French elections saw specific DDoS (Distributed Denial of Service) attacks targeting French political party websites. While online attacks are common and not always election-related, recent activities in France, the Netherlands, and the UK confirm that DDoS attacks frequently target political parties during election periods.
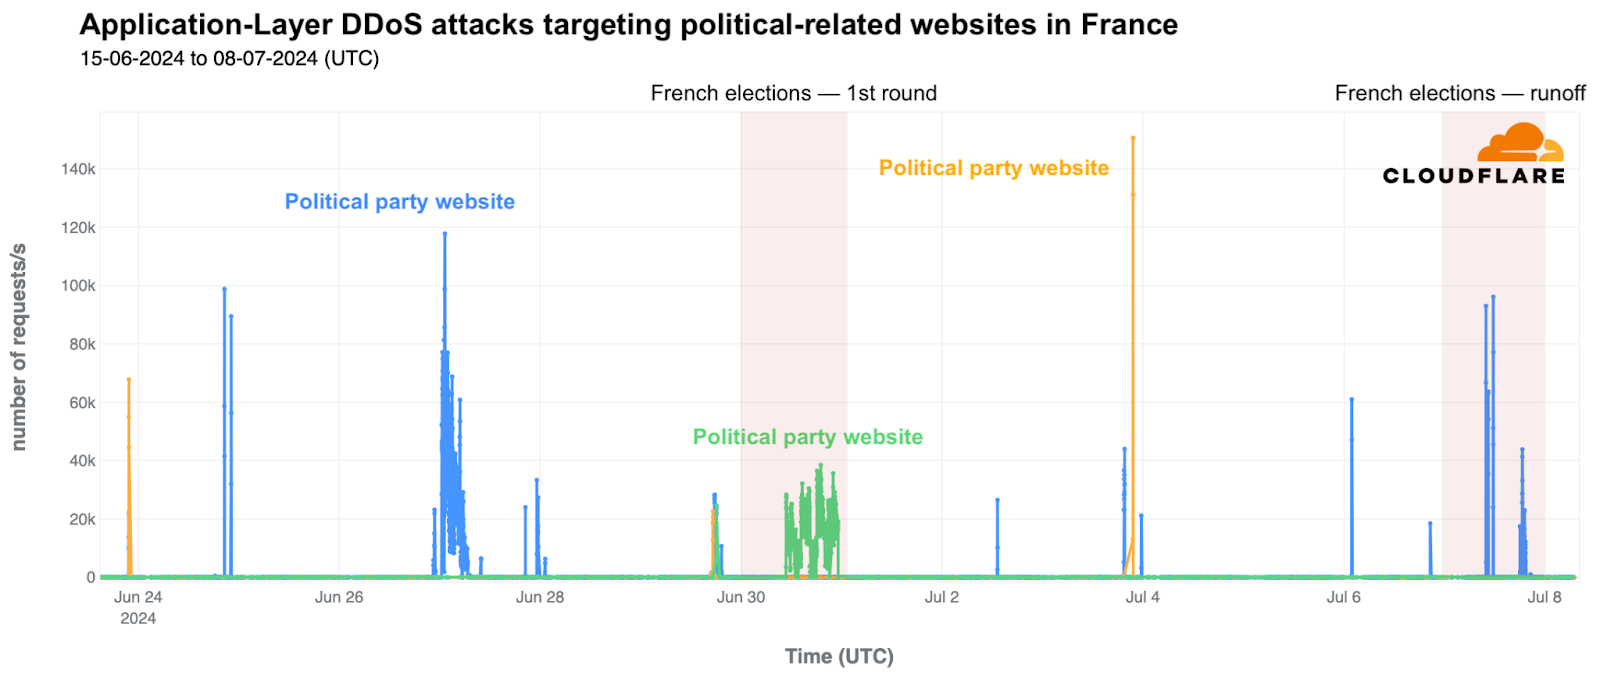
Two French political parties were attacked shortly before the first round of elections, and a third party was targeted on June 30. This third party, indicated in green on the chart below, faced attacks on the evening of June 29. Several attempts were thwarted by Cloudflare throughout election day, from 10:00 to 23:00 UTC (12:00 to 01:00 local time). The most intense attack occurred at 19:00 UTC (21:00 local time), reaching nearly 40,000 requests per second, with a total of 620 million DDoS requests recorded on that day (June 29).
Our data indicates that the most significant attack Cloudflare intercepted targeted a party shown in yellow on the chart above. The party had already been attacked on June 23, 2024, and this subsequent attack happened on July 3 at 21:36 UTC (23:36 local time), lasting four minutes and peaking at 151,000 requests per second (rps), making it the second-largest attack we’ve observed on political parties recently. This was comparable in intensity and duration to another attack on a UK political party right after their election.
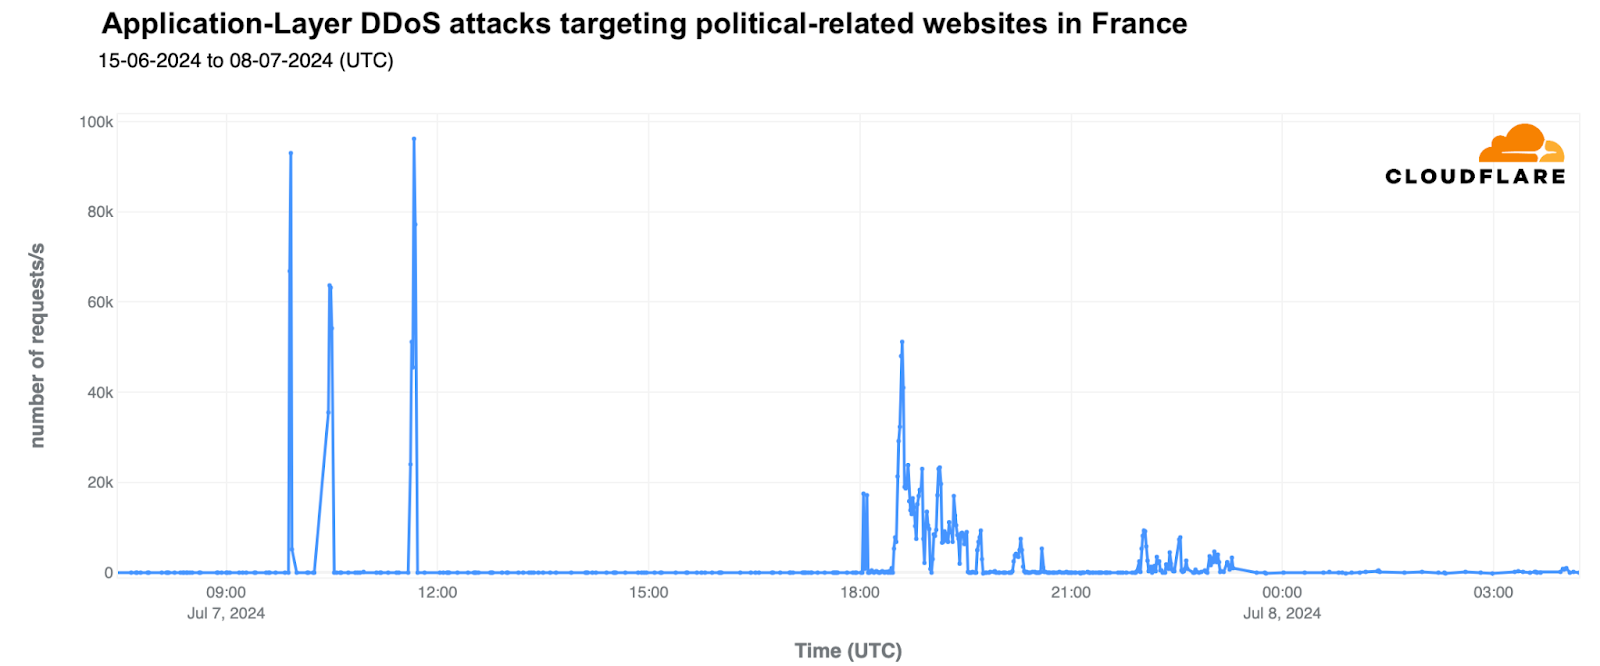
On the runoff election day, July 7, the party represented by the blue line was again a target, having been attacked previously on June 24, 27, and 29. The most severe of these occurred on June 27, with attacks reaching 118,000 rps during a day that totaled 610 million daily DDoS requests. On July 7, the attacks resumed, with the first starting at 09:55 UTC (11:55 local time) and continuing sporadically until 23:18 UTC (01:18 local time on July 8). The peak of these attacks came at 11:40 UTC (13:40 local time), reaching 96,000 rps.
While these rates may seem small to Cloudflare, they can be devastating for websites not well-protected against such high levels of traffic. DDoS attacks not only overwhelm systems but also serve, if successful, as a distraction for IT teams while attackers attempt other types of breaches.
Exit polls came with a 20:00 Internet traffic dip
Each election brings its own unique circumstances. For instance, the UK’s snap election took place on Thursday, July 4, 2024, aligning with Britain’s tradition of weekday elections. In contrast, France and many other countries hold elections on weekends, typically Sundays.
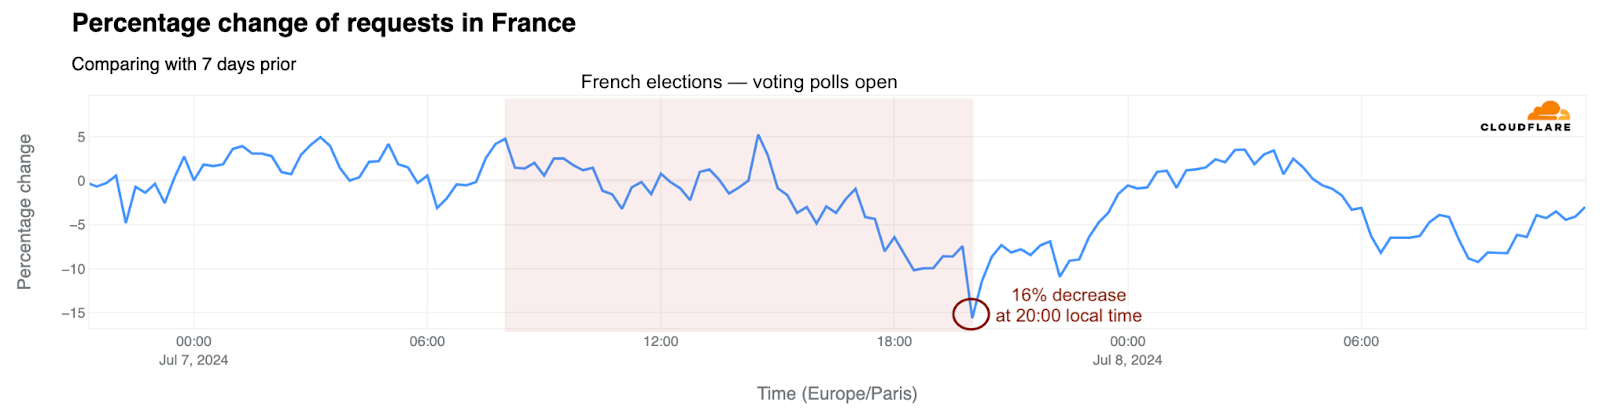
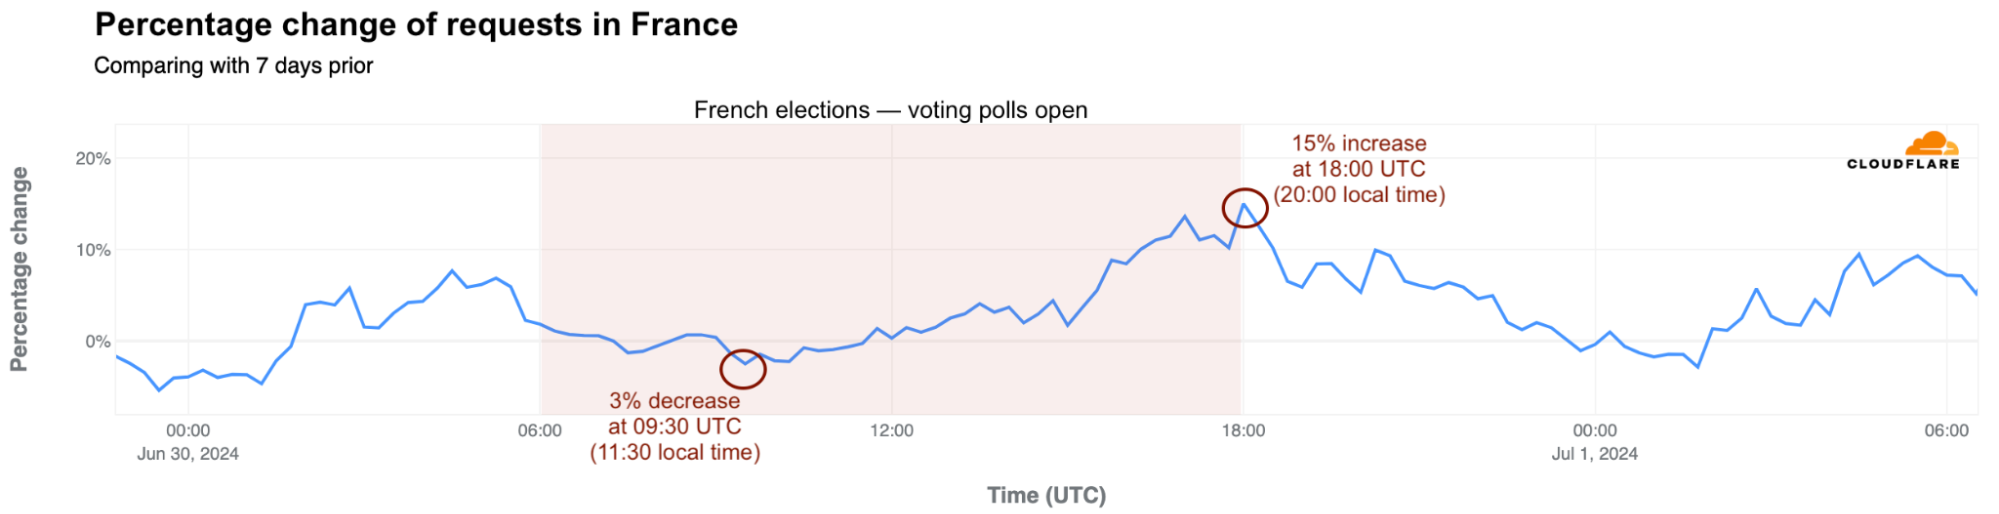
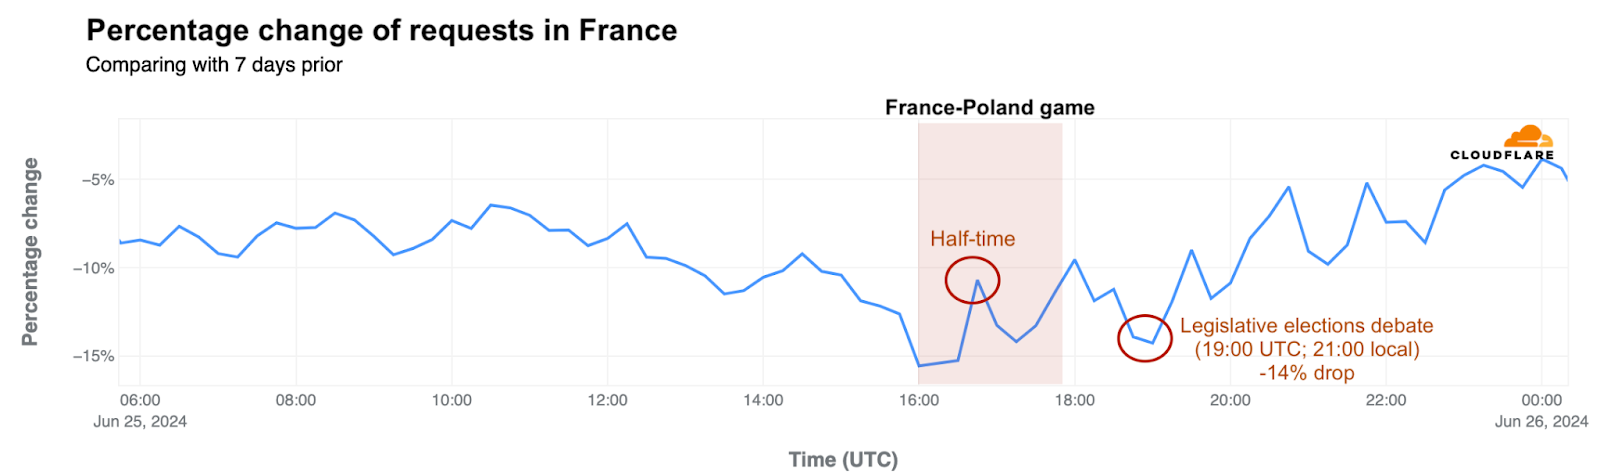
During the first round of the French elections on June 30, morning traffic was lower than the previous week and rose in the afternoon. The runoff, a week later, displayed a different pattern. Morning traffic remained stable compared to June 30, but it saw a significant decrease in the afternoon, especially after 17:30 local time. Polling stations in major cities closed at 20:00. At this time, TV media began broadcasting the first results, causing a 16% drop in traffic compared to the previous week. This trend, where traffic dips as initial results are announced, is also seen in other elections, like the UK’s.
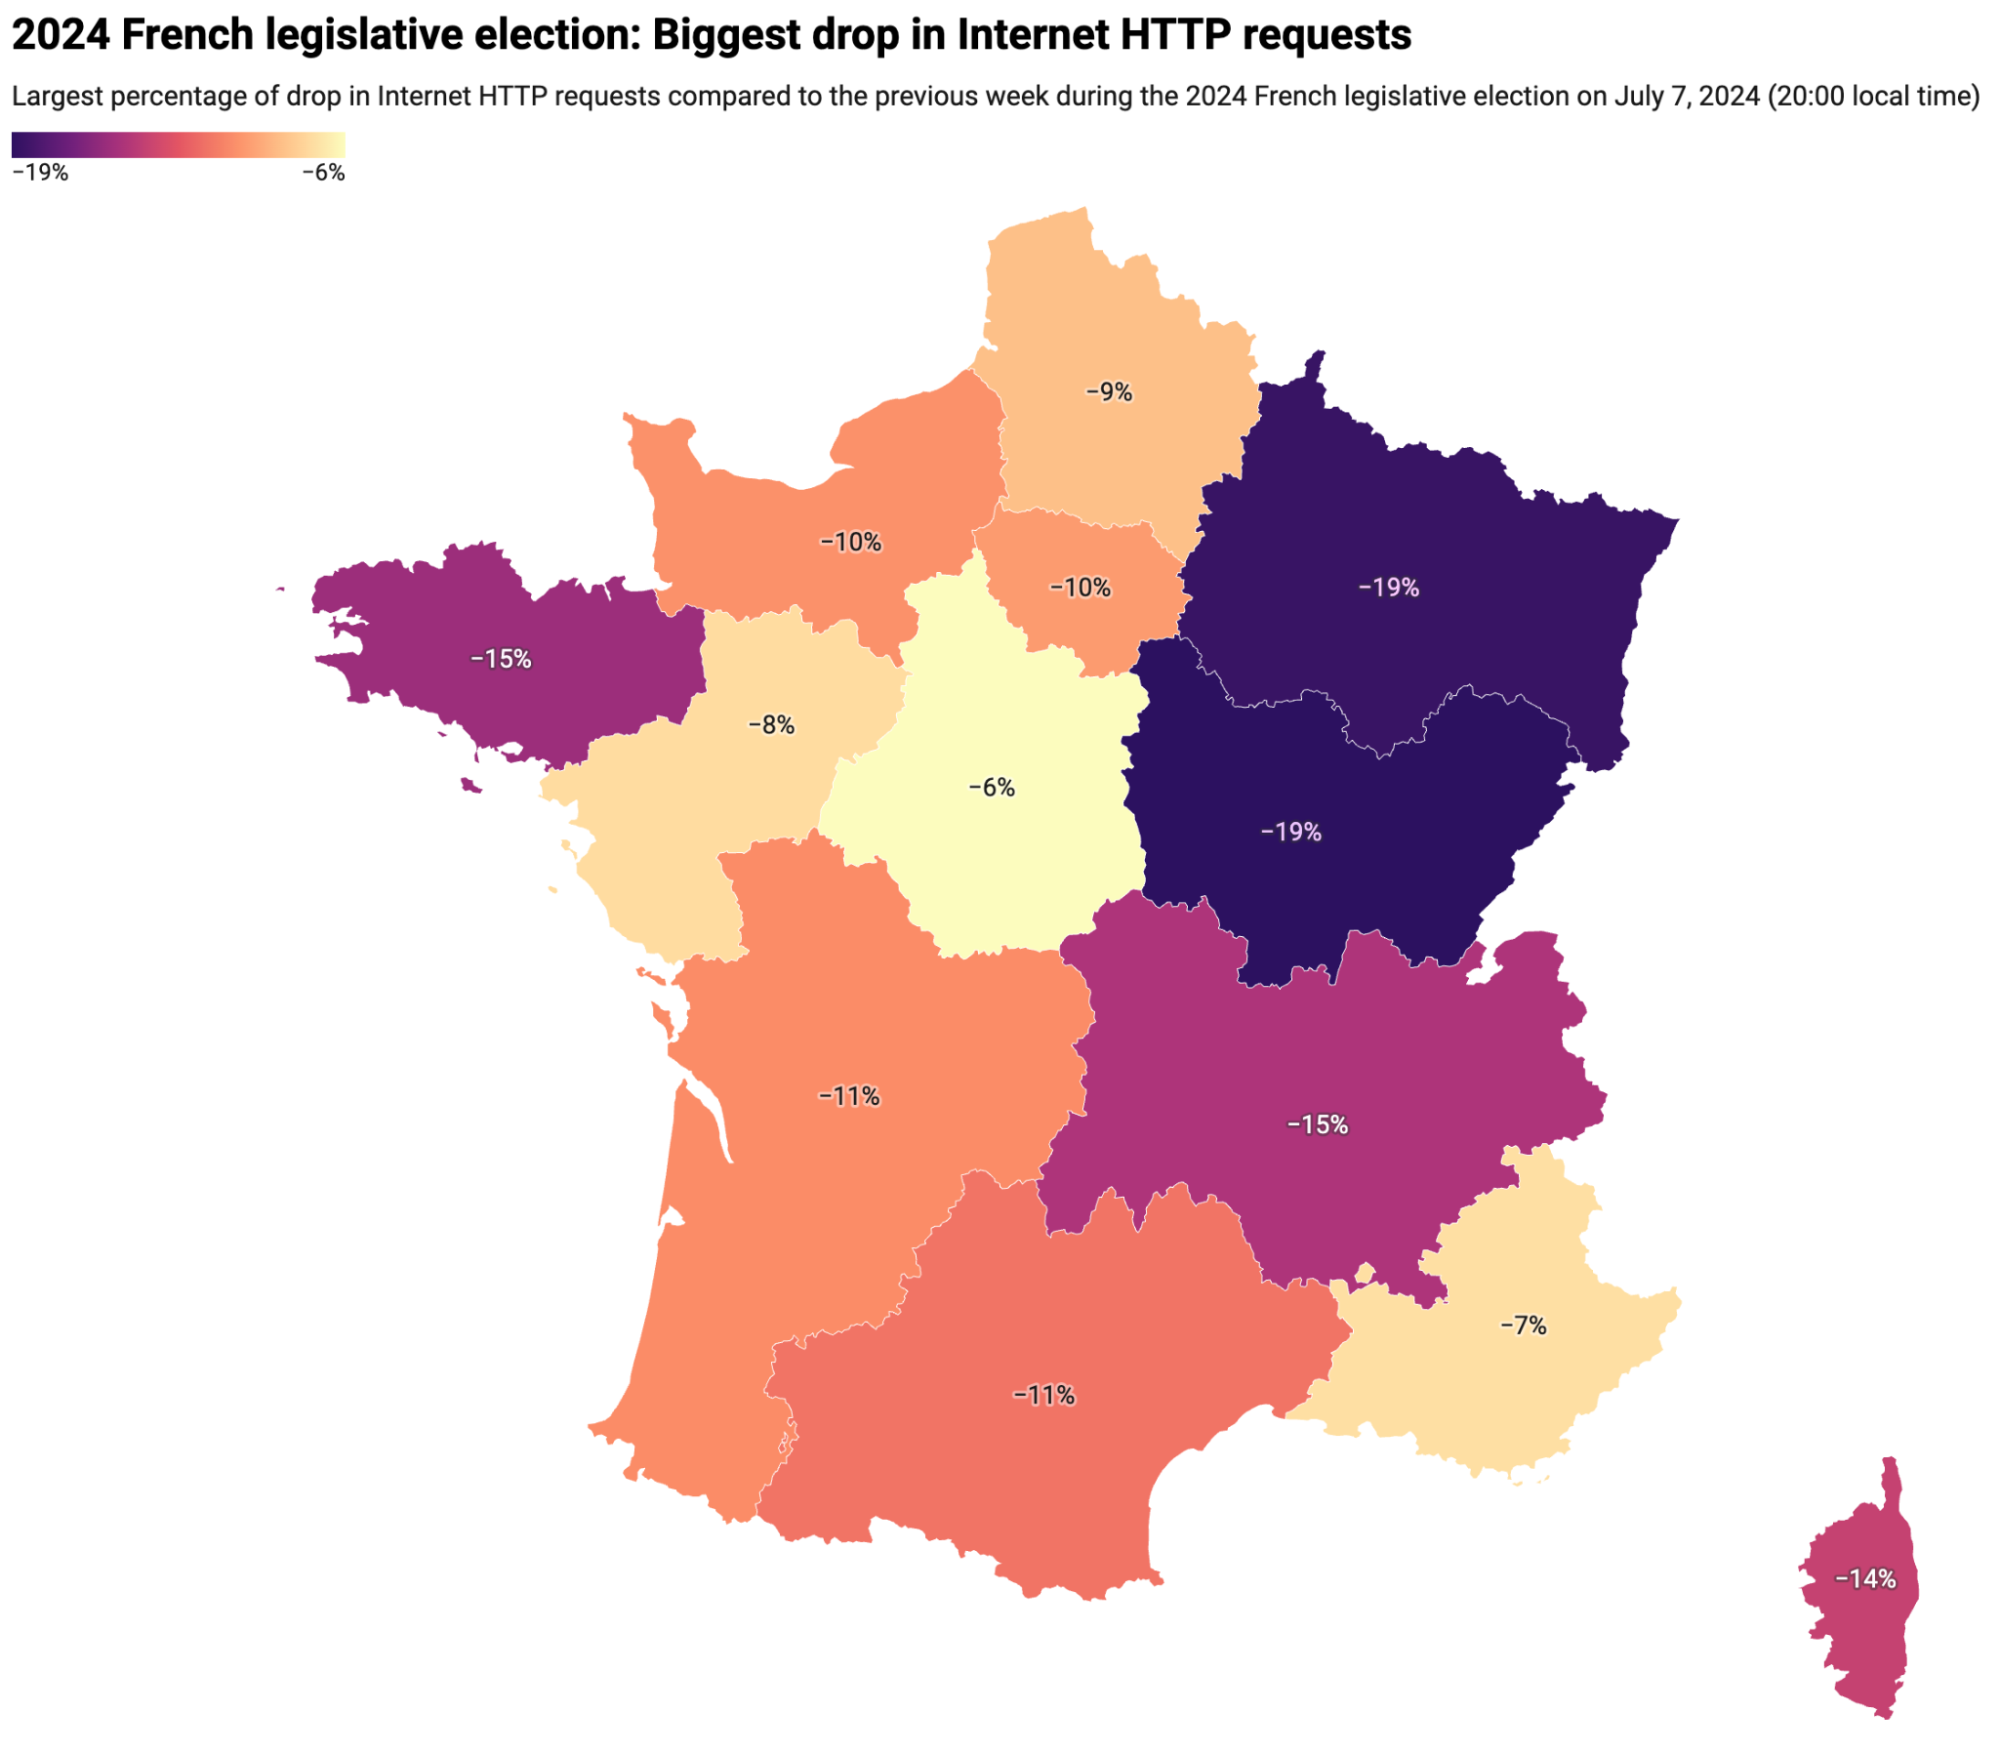
Traffic shifts during voting day, compared to the previous week, are more revealing when viewed in detail. The map and table below summarize the traffic changes observed at the state level within France, when voting closed and initial results predictions were revealed on TV at around 20:00 local time. This was the moment when, from Cloudflare’s data perspective, attention was diverted from online use.
(Source: Cloudflare; created with Datawrapper)
The table below shows the drops in traffic on July 7, at 20:00 local time, compared to the previous week.
State
Drop in traffic (%)
Bourgogne-Franche-Comté
-19%
Grand Est
-19%
Brittany
-15%
Auvergne-Rhône-Alpes
-15%
Corsica
-14%
Occitanie
-11%
Nouvelle-Aquitaine
-11%
Normandy
-10%
Île-de-France
-10%
Hauts-de-France
-9%
Pays de la Loire
-8%
Provence-Alpes-Côte d’Azur
-7%
Centre-Val de Loire
-6%
On election day in France, Internet traffic decreased most significantly in the regions of Bourgogne-Franche-Comté and Grand Est, both in the eastern part of the country and both experiencing a 19% drop. When comparing these regions to the Île-de-France region, where Paris is located, we see a smaller traffic decrease, at 10%. In the south, in regions like Provence-Alpes-Côte d’Azur, the drop was even less pronounced, at 7%.
Mobile device usage
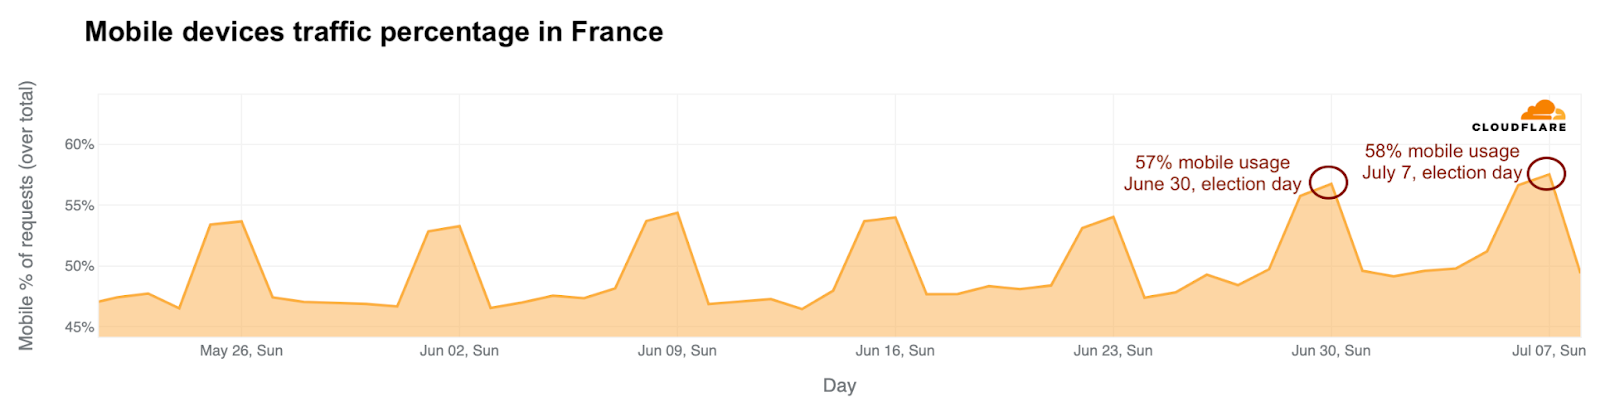
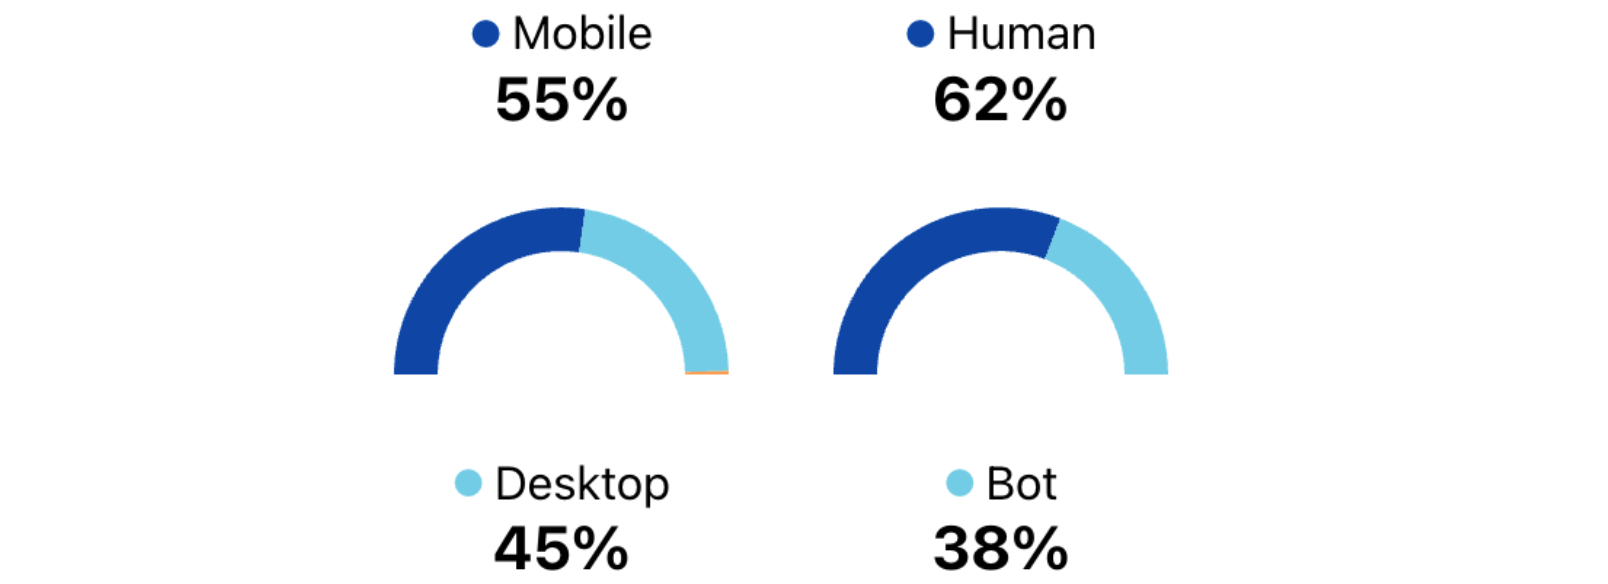
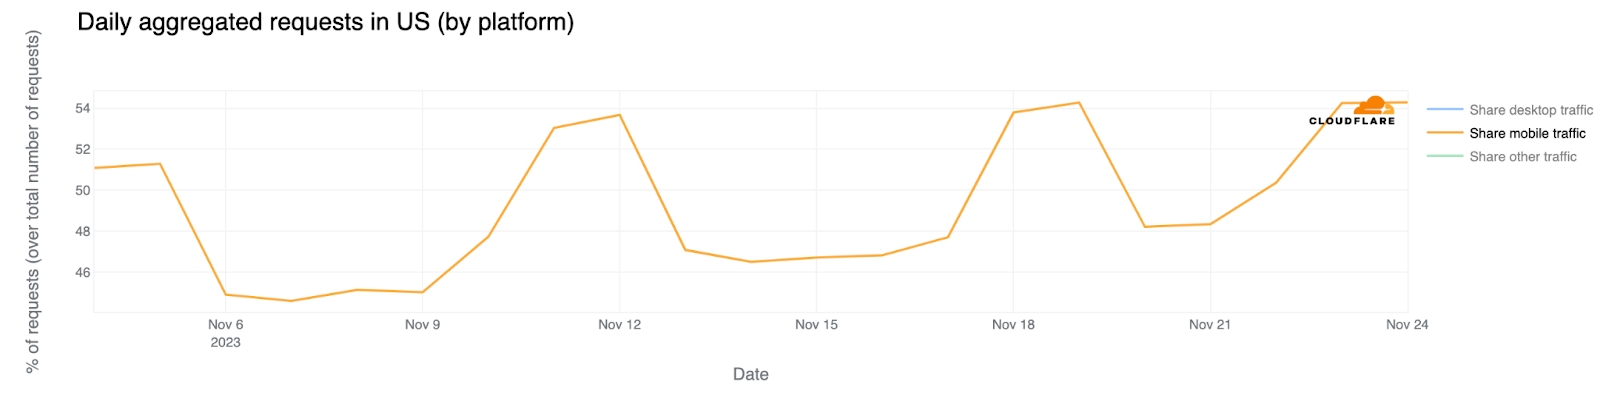
Also notable was the increase in mobile device request traffic share during both election days, driving the share to levels higher than usual. Over the past month, mobile device traffic share on Sundays typically ranged from 53% to 54%. However, it rose to 57% on the first election day, June 30, and increased further to 58% on the runoff day, July 7, 2024. Mobile device traffic share was especially elevated from 11:00 to 22:00 local time on these days.
DNS trends: news outlets bring results
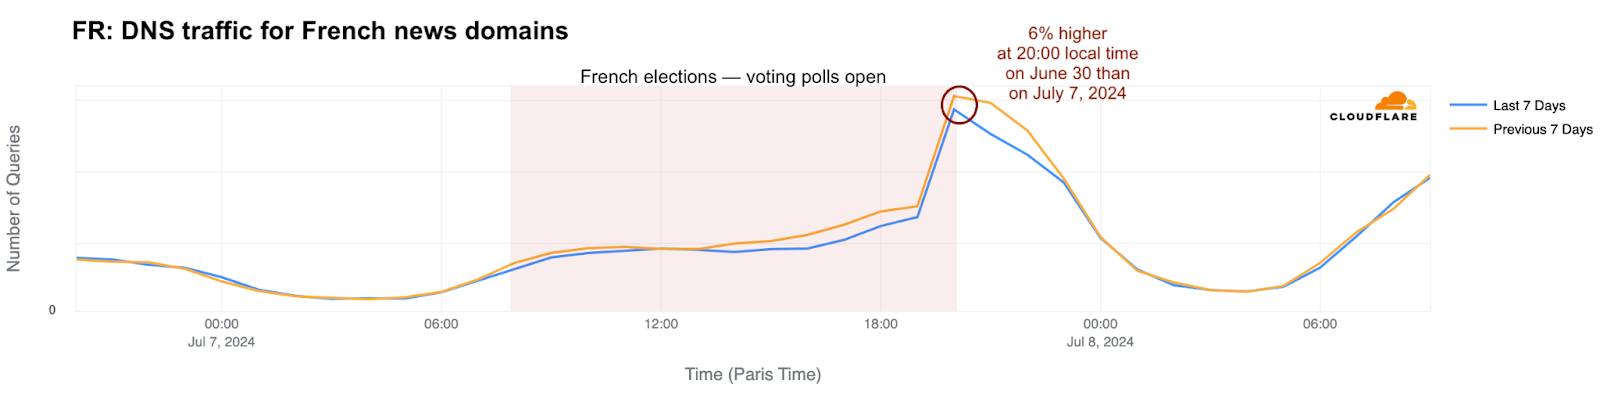
Switching focus to domain trends, our 1.1.1.1 resolver DNS data reveals a targeted impact from the French elections, allowing for a comparison between the two election days. Analyzing French news media outlets, DNS traffic in France was significantly higher on the first election day, June 30, with a 250% increase at 20:00 local time compared to the previous week. This was 6% higher than on the runoff day, July 7.
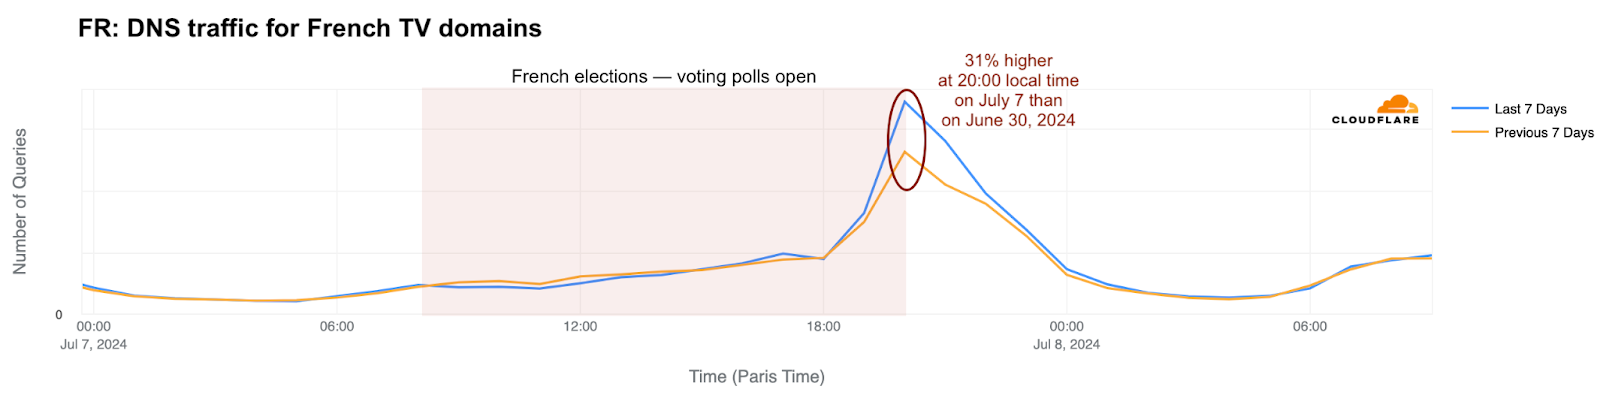
For French TV domains, the situation reversed during the runoff on July 7, showing 31% more DNS traffic at 20:00 local time than in the first round. On June 30, DNS traffic at that time was already 274% higher than the previous week, but the increase on July 7 was even more significant, at 391% compared to June 23, 2024—the Sunday before the two election days.
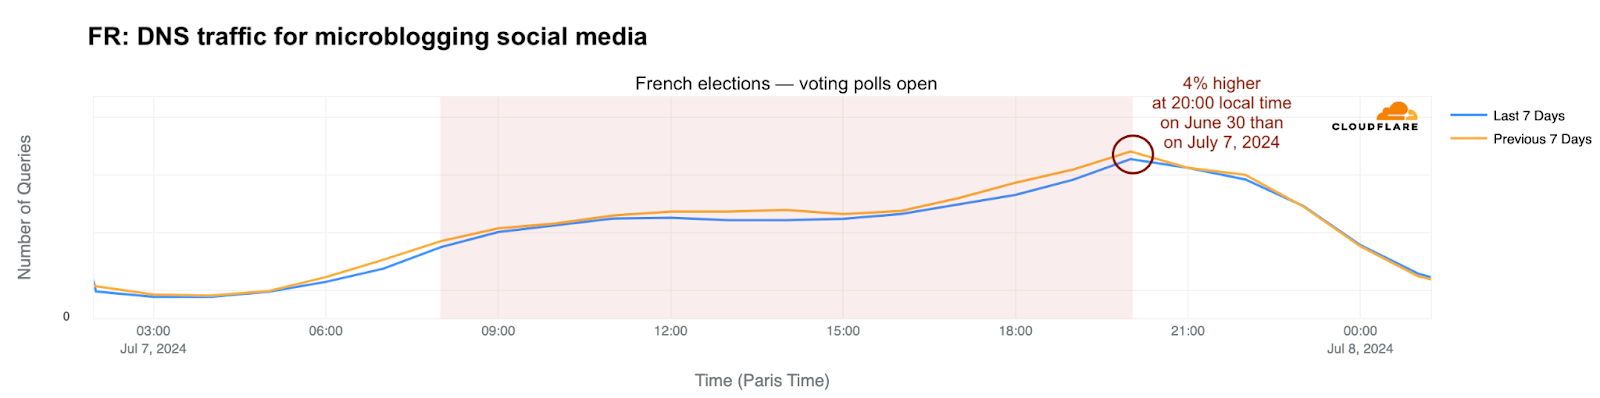
For microblogging social media in France, traffic was higher during the two election days, peaking on the first round. At the close of voting polls at 20:00 local time on June 30, traffic surged 38% compared to June 23, 2024. On July 7, runoff day, traffic increased by 32% at 20:00 local time compared to June 23, but was 4% lower than on June 30.
Conclusion: keeping track of elections
In France, more attention was diverted from the Internet during the decisive runoff election day than in the first round, with a noticeable dip in traffic when TV stations announced predicted results at 20:00 local time.
If you want to follow more trends and insights about the Internet and elections in particular, you can check Cloudflare Radar, and more specifically our new 2024 Elections Insights report, which will be updated as elections take place throughout the year.
The 2024 UK general election, the first since Brexit officially began (January 31, 2020) and after 14 years of Conservative leadership, saw the Labour Party secure a majority. This blog post examines Internet traffic trends and cyberattack activity on election day, highlighting notable declines in traffic during the afternoon and evening as well as a DDoS attack on a political party shortly after polls closed.
The UK’s snap election on Thursday, July 4, 2024, typical of British Thursday weekday elections, contrasts with weekend elections in other countries. Polling stations were open from 07:00 to 22:00.
Generally, election days do not result in drastic changes to Internet traffic. Traffic typically dips during voting hours but not as sharply as during major events like national holidays, and rises in the evening as results are announced.
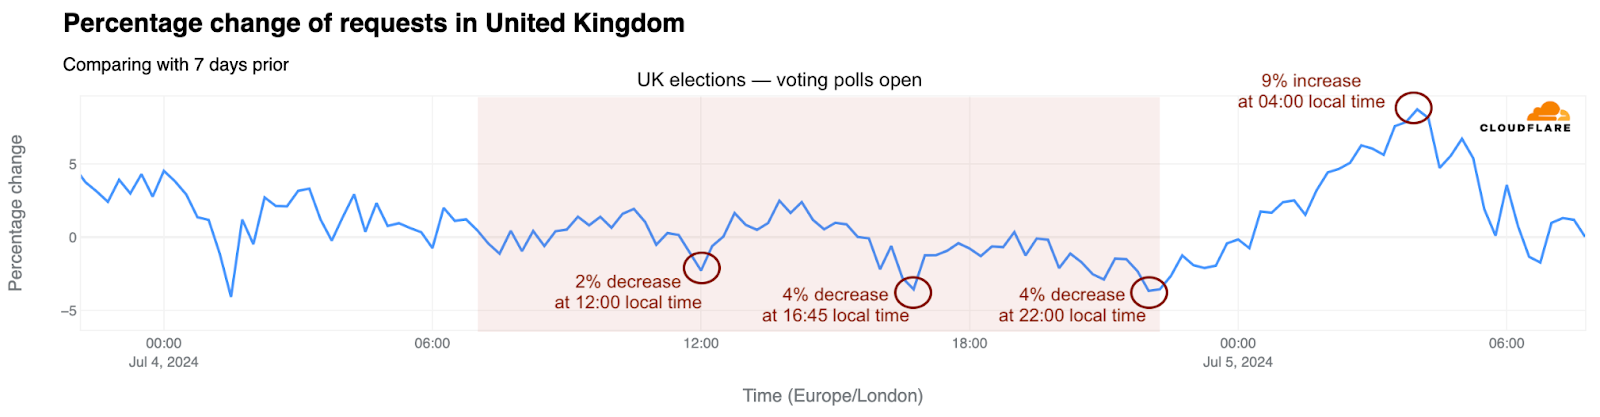
On July 4, 2024, traffic initially rose slightly from the previous week, then fell around noon (-2%). Significant declines began only after 16:00, with noticeable drops at 16:45 and again at 22:00 as polls closed.
Internet traffic dips across UK countries
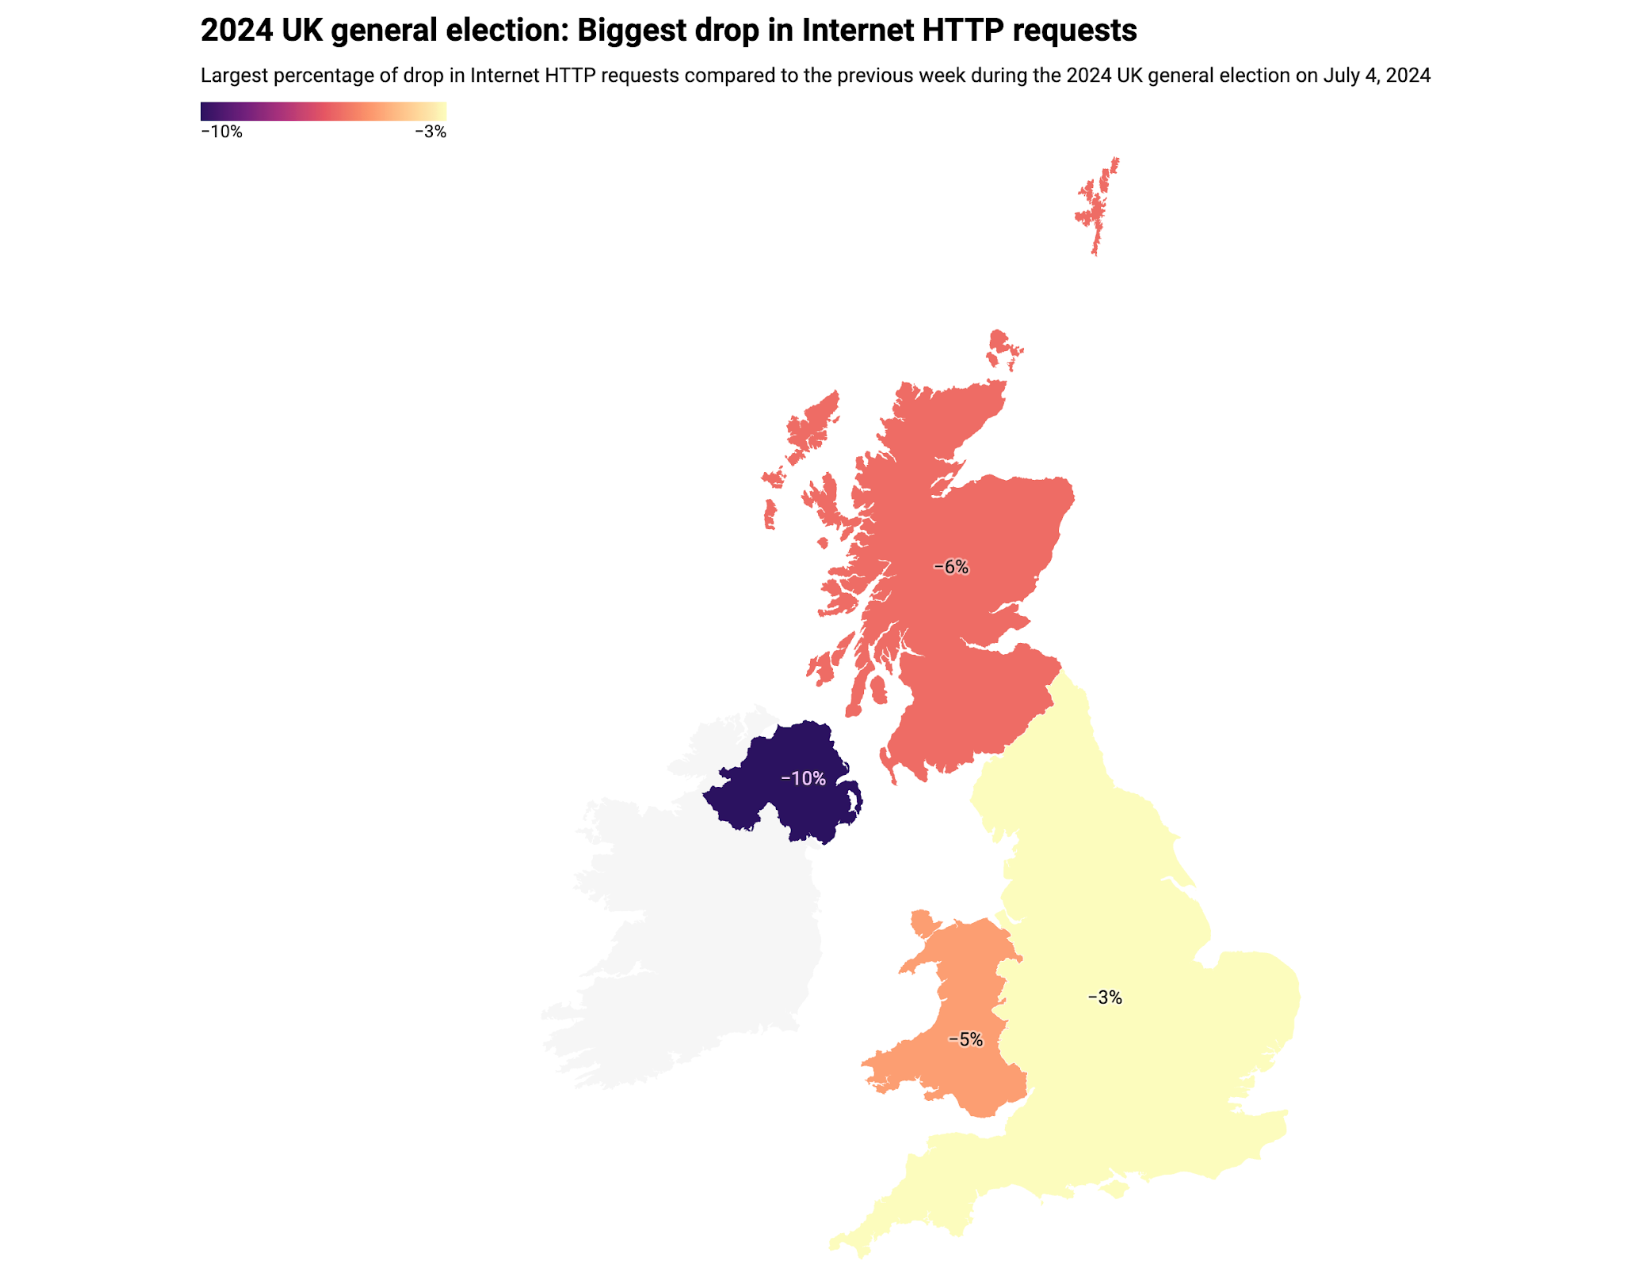
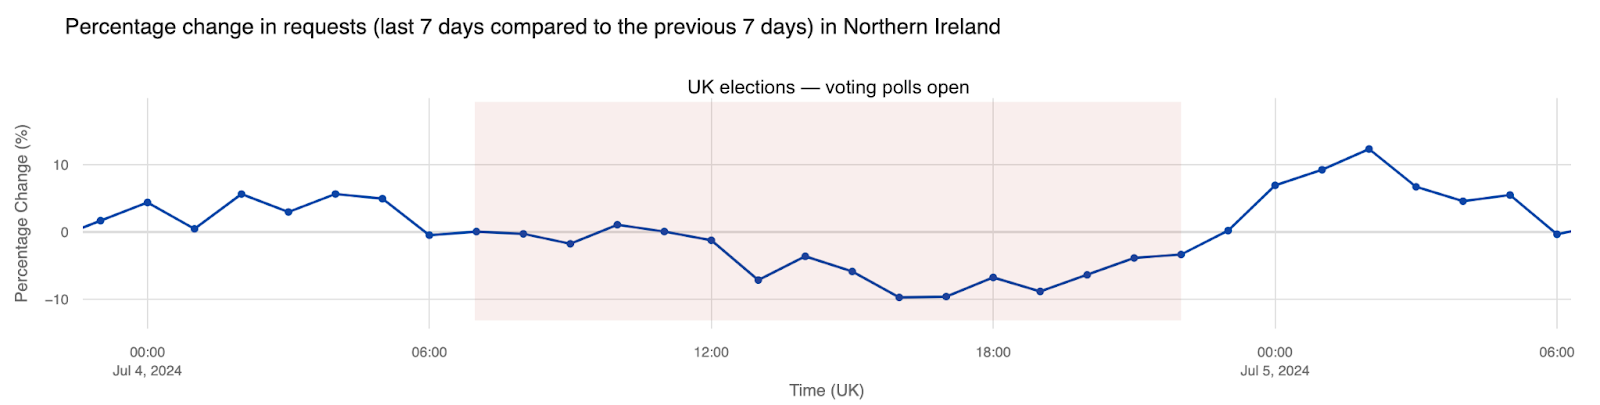
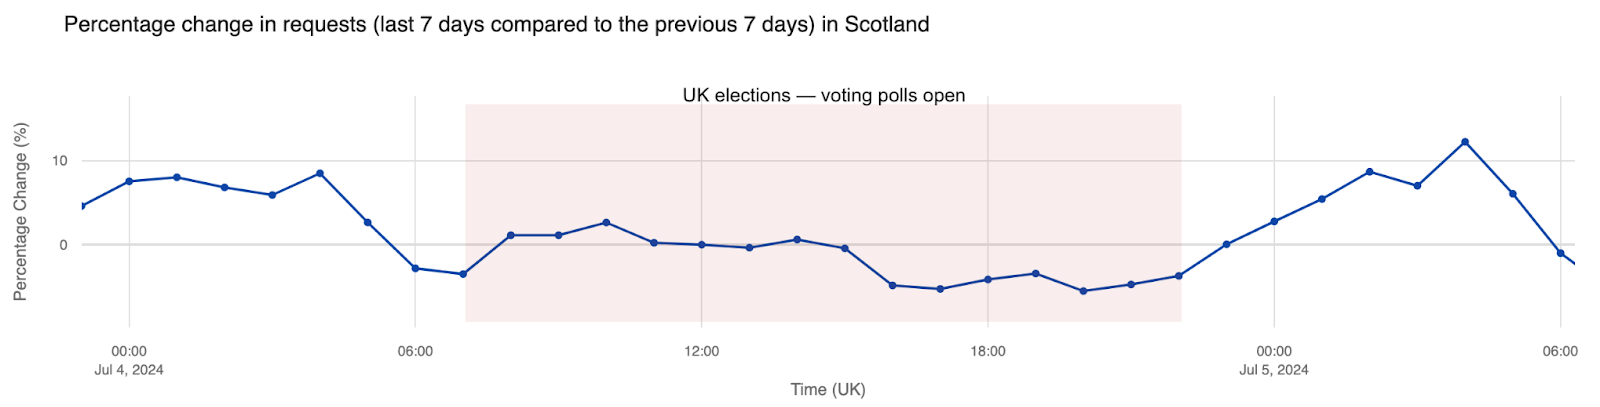
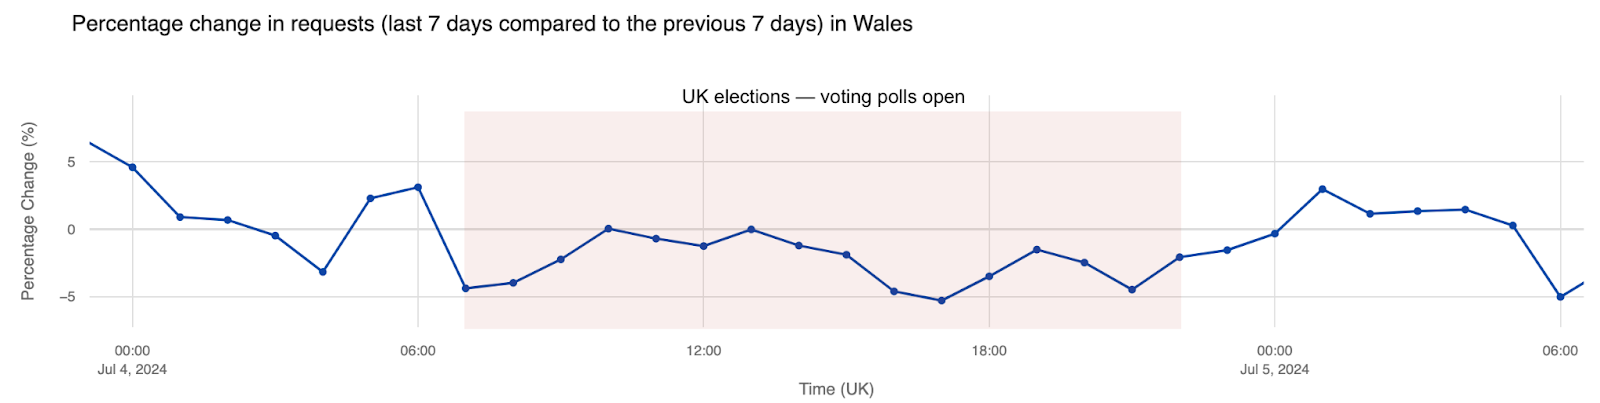
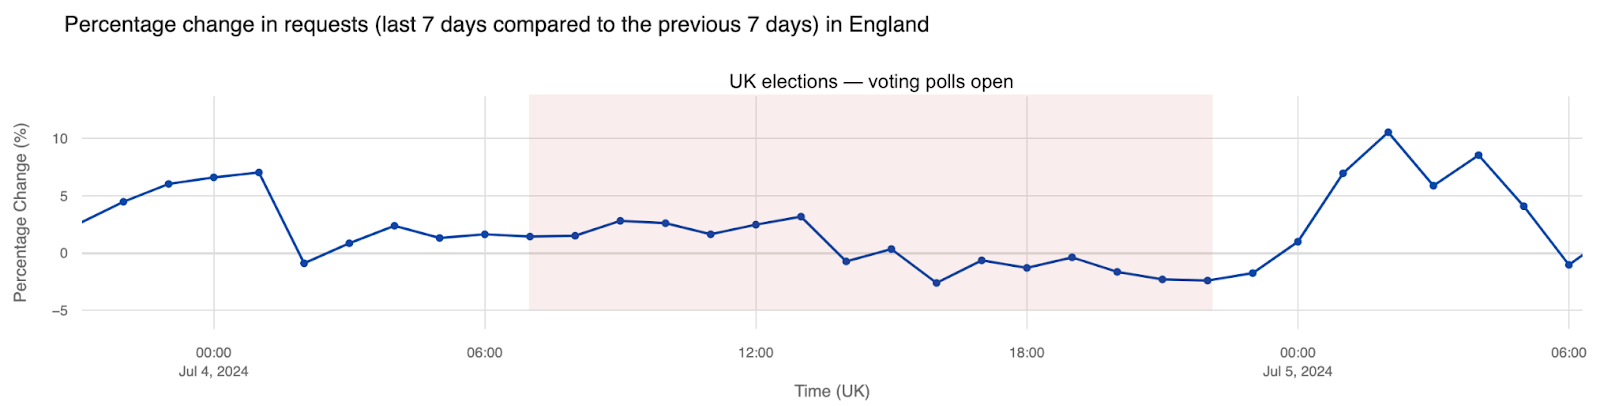
Traffic shifts during voting day, compared to the previous week, are more revealing when viewed in detail. The map and table below summarize the traffic changes observed at the country level within the UK, where the greatest impact was observed in Northern Ireland (-10%), followed by Scotland (-6%), Wales (-5%), and England (-3%), all after 16:00.
Country
Drop in traffic (%)
Time of drop in traffic (local)
Northern Ireland
-10%
July 4, 16:00
Scotland
-6%
July 4, 20:00
Wales
-5%
July 4, 17:00
England
-3%
July 4, 16:00
Next, examining the day’s traffic changes, we observed a clear drop in Northern Ireland around 13:00 local time and during off-work hours between 16:00 and 20:00, before it began to increase again.
In Scotland, traffic fell by about 5% from 16:00 to 21:00 local time compared to the previous week.
In Wales, decreases occurred at 07:00 (4% drop), between 16:00 and 18:00 (around 5% drop), and at 21:00.
And in England, traffic decreased by approximately 3% between 16:00 and 18:00 and about 2% between 20:00 and 22:00.
In all the countries within the UK, traffic clearly increased after 23:00 local time when the voting polls had already closed and the first results started to arrive. Peak increases were reached at different times: Wales saw a 3% increase at 01:00; Northern Ireland and England experienced their highest increases of 12% and 11% respectively at 02:00; and Scotland had a 9% increase at 02:00 followed by a 12% spike at 04:00.
DNS trends: news outlets bring results
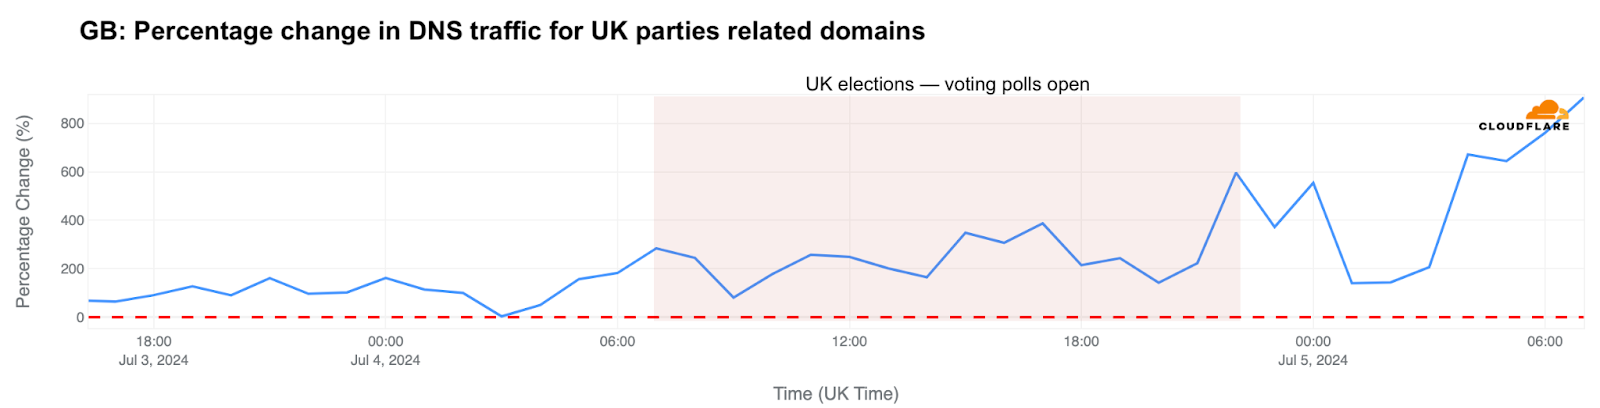
Switching focus to domain trends, our 1.1.1.1 resolver DNS data reveals a more targeted impact from the UK elections. Analyzing the participating parties, DNS traffic significantly increased on election day, peaking at 22:00 and midnight local time (up to 600% growth), and then again at 04:00 (671%).
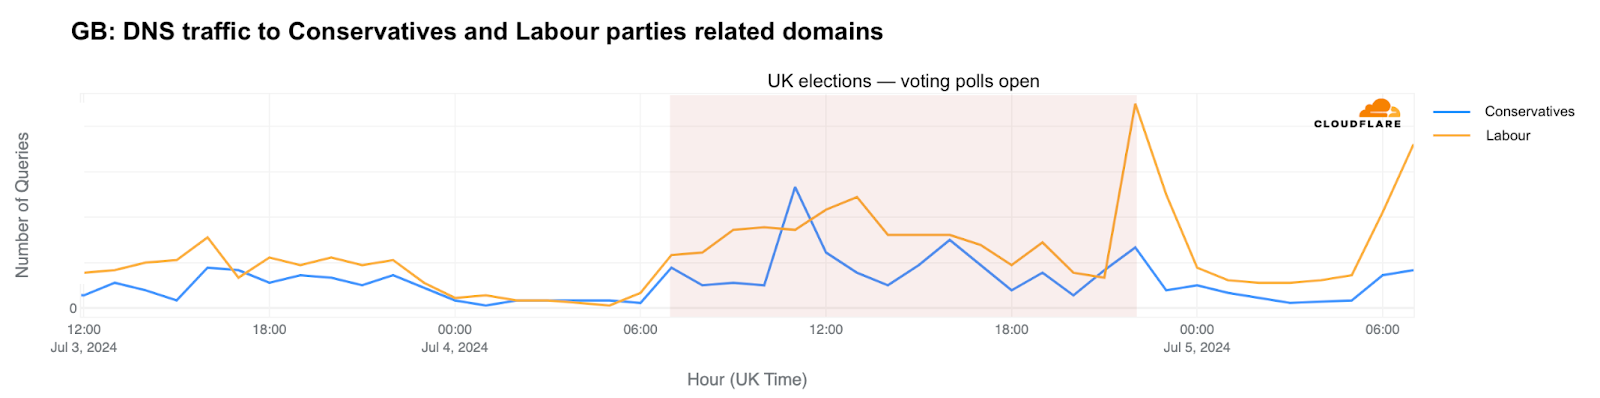
Among the main parties, Labour, led by Keir Starmer, outperformed the Conservative Party on election day. Labour’s DNS traffic spiked at 22:00 local time, with an 866% increase from the previous week.
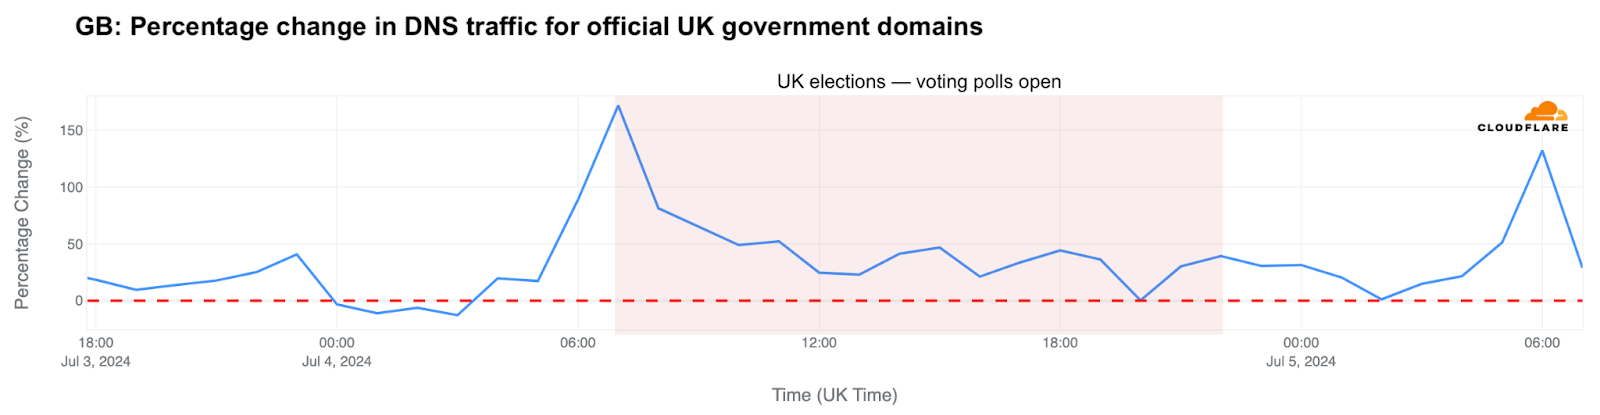
Analyzing official government and election-related websites, the UK differs from other countries in how results are shared. Official results weren’t continuously updated as they came in. The largest spike in DNS traffic, a 172% increase from the previous week, occurred on election morning around 07:00 local time. This increase likely happened because UK citizens were searching for the correct polling stations and other voting resources.
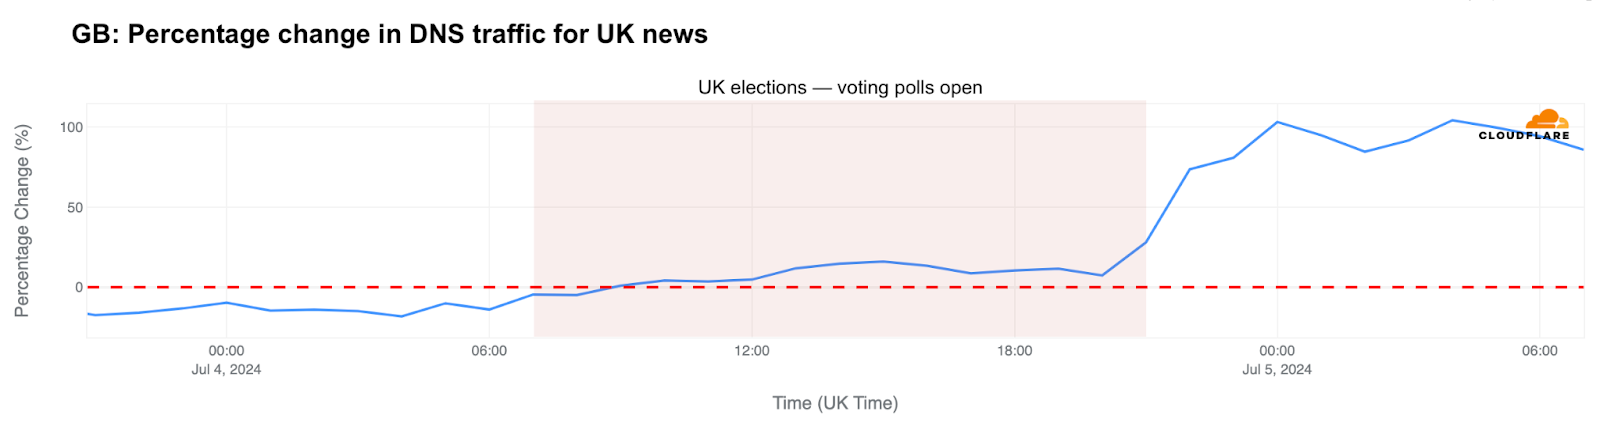
News sites and microblogging social media platforms in the UK experienced significant increases in usage after the polling stations closed at 22:00 local time. In the UK, news sites not only provide initial projections but also final results. DNS traffic for UK news media outlets surged 74% compared to the previous week, peaking at 104% at midnight and 04:00.
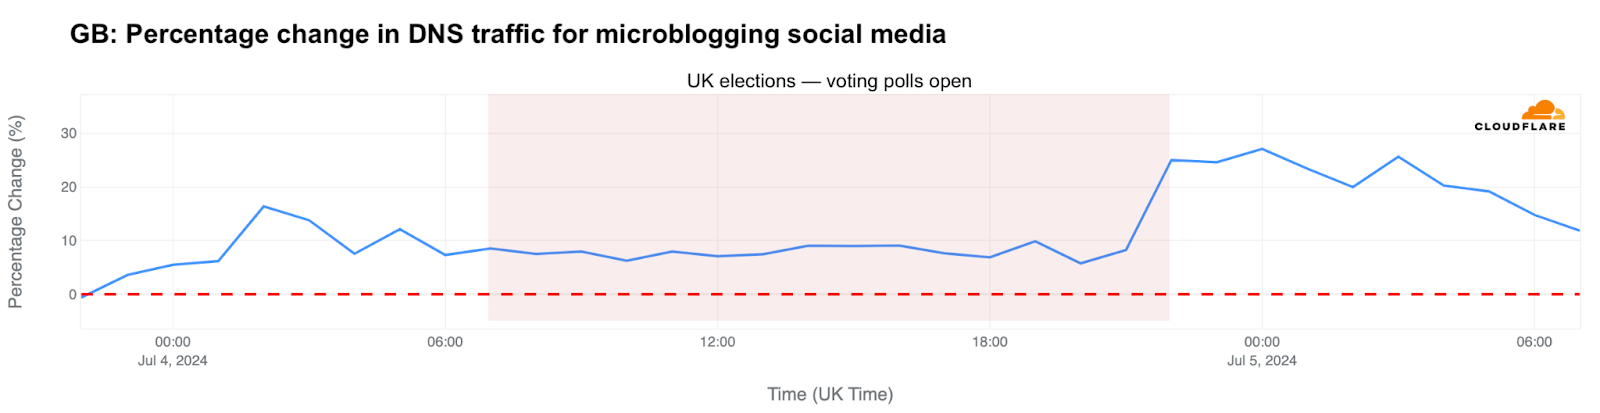
For microblogging social media in Great Britain, traffic was already 25% higher than the previous week when the polls closed (22:00), peaking at 27% at midnight and remaining elevated through the night.
We saw last week in the US, during the Biden vs Trump debate, that video streaming social platforms such as YouTube or TikTok, were used to watch through news outlets channels the debate live, with DNS traffic surging. How about the UK? DNS traffic was 10% higher than in the previous week starting at midnight, and at 01:00 local time was 15% higher.
Attacks: political parties included impact
Focusing on attacks, those are usually constant, and aren’t necessarily driven always by elections. But, as we’ve seen at the start of the war in Ukraine or more recently in the Netherlands or in France, specific events do trigger attacks. DDoS (Distributed Denial of Service) attacks remain a common method employed by attackers.
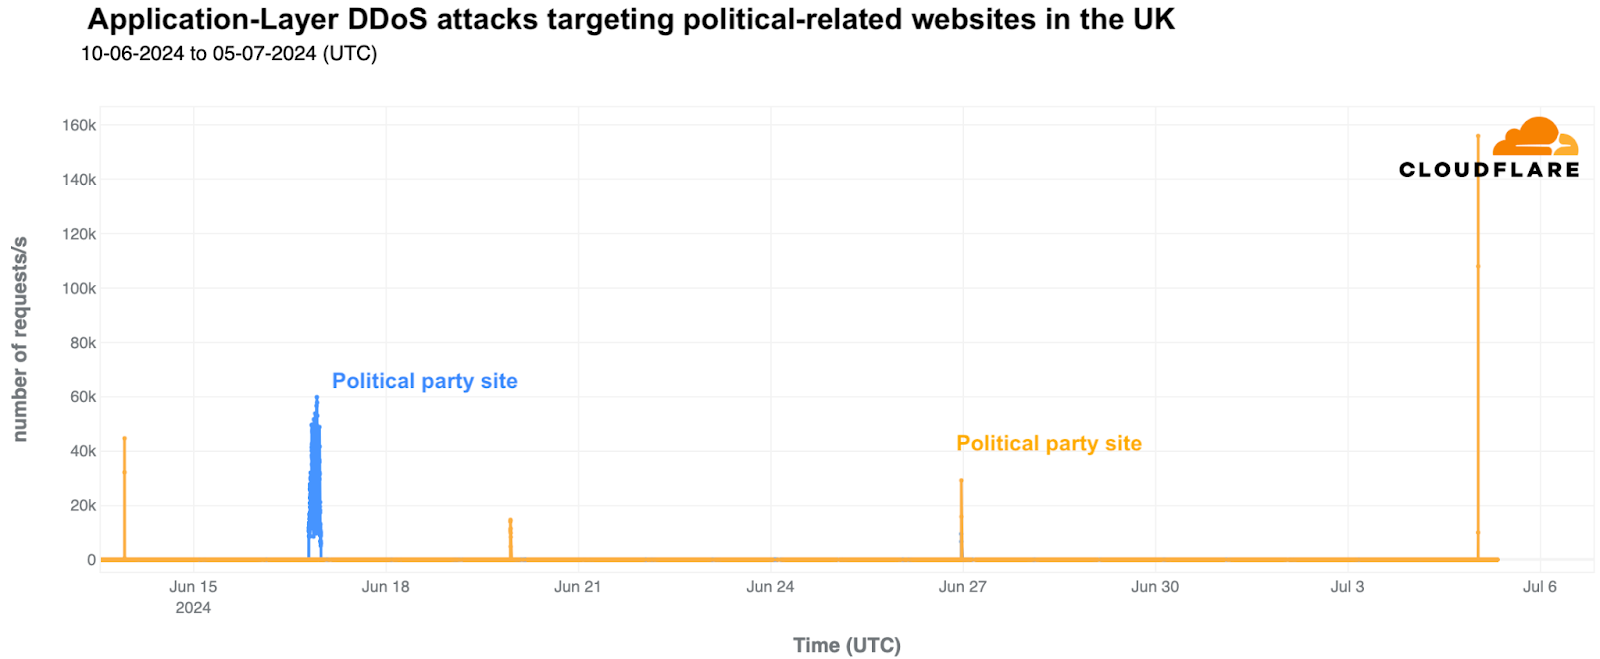
In recent days, there has been DDoS activity targeting political parties in the UK that participated in these elections. Our data shows that two parties experienced attacks that were blocked by Cloudflare. One party, represented in blue, suffered an attack on June 16, which lasted over four hours and peaked at 60,000 requests per second (rps).
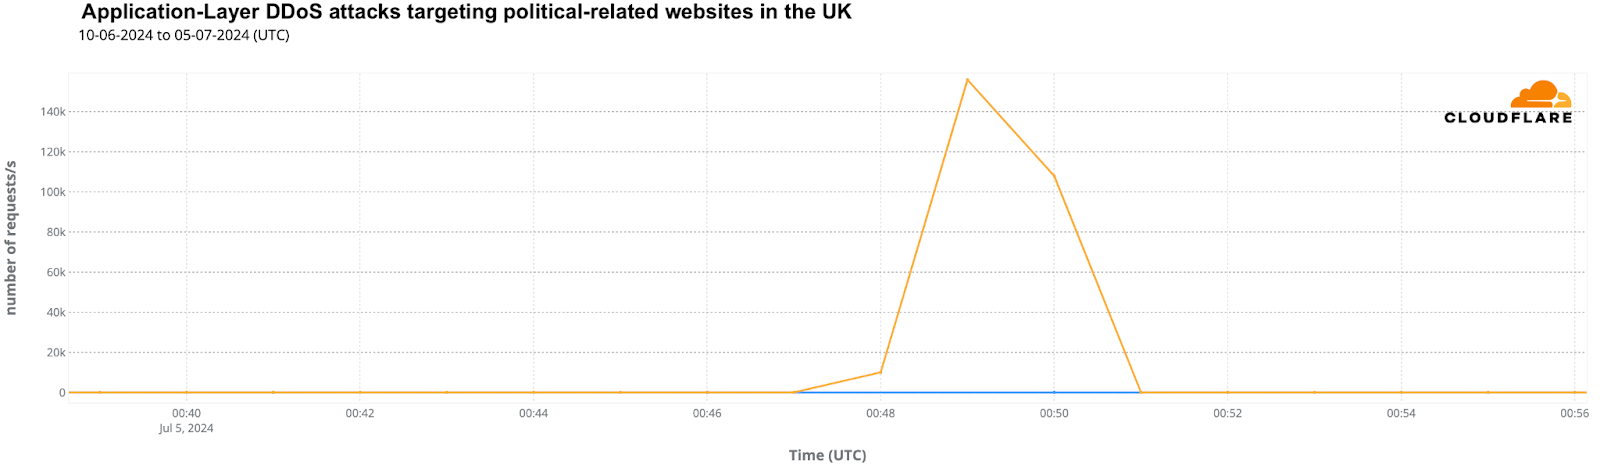
The party shown in yellow was hit by four DDoS attacks on different days: June 13, 19, 26, and in the early hours of July 5 (UTC), just after the election’s first predictions were broadcast, giving a majority to the Labour Party. This was the most significant attack in recent days, peaking at 156,000 rps. It began at 01:47 local time (00:47 UTC) and ended four minutes later. Here’s a closer look at that July 5, 2024, attack:
Although these rates are small on Cloudflare’s scale, they can be devastating for unprotected websites unaccustomed to such levels of traffic.
Conclusion: high intensity election year
Even if major political events don’t always bring notable changes to Internet traffic, our data shows that in the UK, traffic decreased more significantly in the afternoon and evening, especially as voting stations remained open until 22:00.
After voting ended, news sites became the go-to resource for UK residents seeking initial predictions and results.
We also observed attacks targeting political parties in the UK, further highlighting that this election year is marked by cyberattacks aimed at influencing politically related websites.
If you want to follow more trends and insights about the Internet and elections in particular, you can check Cloudflare Radar, and more specifically our new 2024 Elections Insights report, which will be updated as elections take place throughout the year.
France is currently electing a new government through early legislative elections that began on Sunday, June 30, 2024, with a second round scheduled for July 7. In this blog, we show how Cloudflare blocked DDoS attacks targeting three different French political parties.
2024 has been dubbed “the year of elections,” with elections taking place in over 60 countries, as we have mentioned before (1, 2, 3). If you regularly follow the Cloudflare blog, you’re aware that we consistently cover election-related trends, including in South Africa, India, Iceland, Mexico, the European Union and the 2024 US presidential debate. We also continuously update our election report on Cloudflare Radar.
Recently in France, as in the early stages of the war in Ukraine and during EU elections in the Netherlands, political events have precipitated cyberattacks. In France, several DDoS (Distributed Denial of Service attack) attacks targeted political parties involved in the elections over the past few days, with two parties hit just before the first round and another on election day itself.
The first political party, shown in yellow in the previous chart, experienced a DDoS attack on June 23, 2024, peaking at 68,000 requests per second (rps); it also endured a second DDoS attack on June 29, the day before the election, peaking at 20,000 rps. Although these rates are small on Cloudflare’s scale, they can be devastating for unprotected websites unaccustomed to such levels of traffic.
The second party, represented by the blue line, was targeted on June 24, June 27, and June 29, 2024, with the most severe attack occurring on June 27, reaching 118,000 rps during a day marked by frequent DDoS spikes that had in total 610 million daily requests.
The third party was attacked on the evening of June 29 in France, with several attempts blocked by Cloudflare on election day, June 30, between 10:00 and 23:00 UTC (12:00 and 01:00 local time). The peak activity targeting this party hit nearly 40,000 rps at 19:00 UTC (21:00 local time), with a total of 620 million daily DDoS requests on election day.
Modest drops and clear traffic increases after voting ends
During the first round of the election this past Sunday, June 30, 2024, Internet traffic was initially higher than the previous week but dropped by as much as 3% at 11:30 local time (09:30 UTC) after the polls opened. Traffic began to increase again after 17:45 local time (15:45 UTC) and peaked at 20:00 local time (18:00 UTC) when the polls closed and the first projections were announced.
We will provide a trends update on the French election after the runoff scheduled for July 7, 2024.
If you want to follow more trends and insights about the Internet and elections in particular, you can check Cloudflare Radar, and more specifically our new 2024 Elections Insights report, which will be updated as elections take place throughout the year.
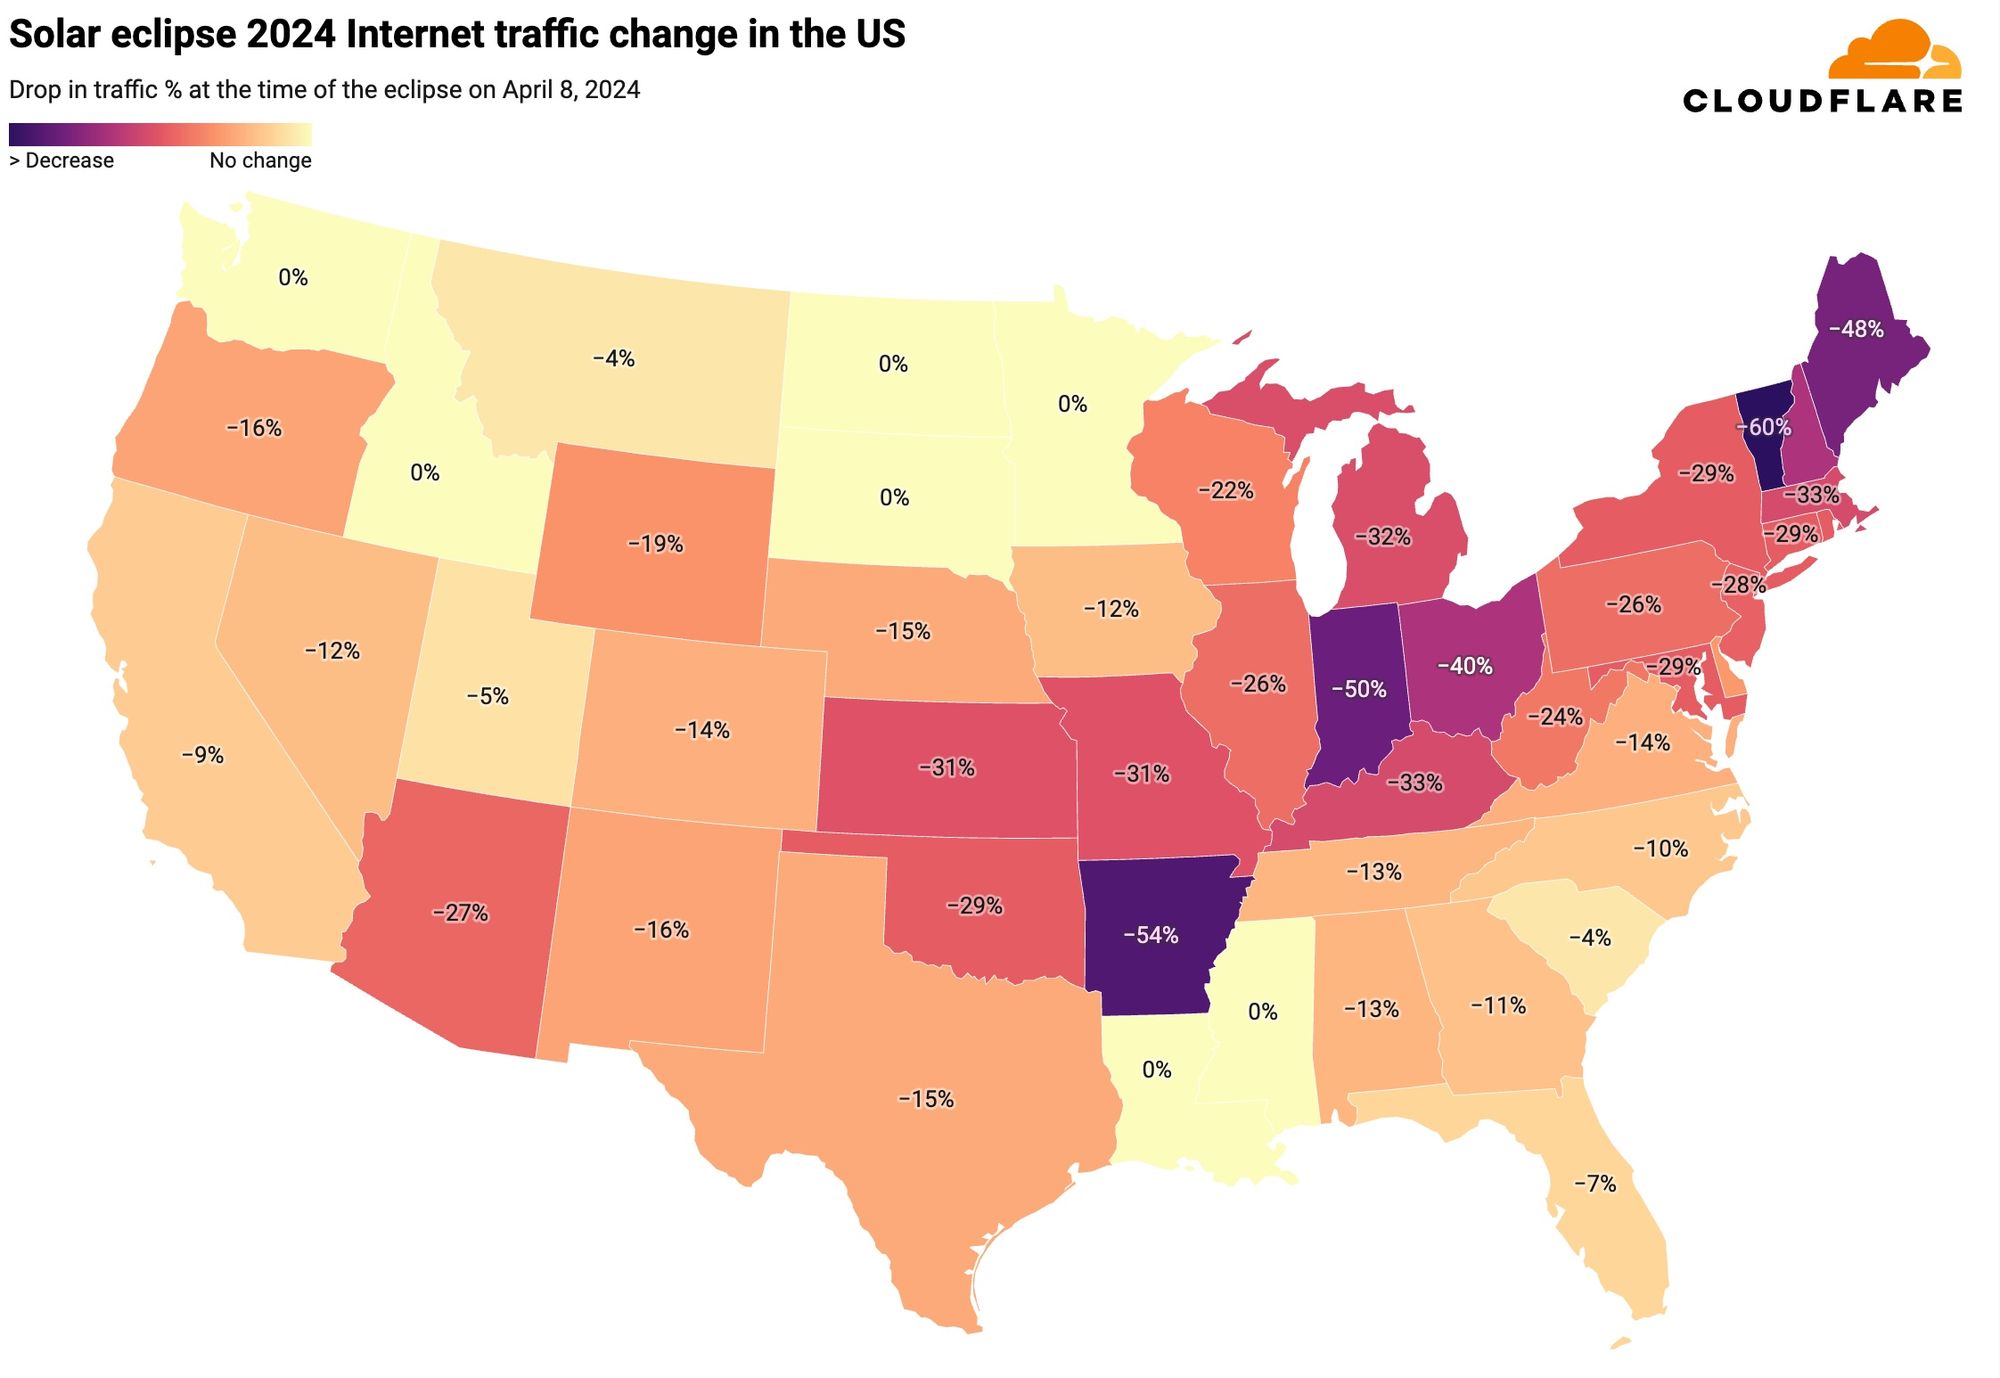
The Biden vs. Trump debate influenced Internet traffic at the state level in the US, with drops in traffic as high as 17% (in Vermont) during the debate.
Microblogging and video streaming platforms saw traffic changes during the debate.
Trump-related sites, including donation platforms, gained much more traction than Biden’s during and after the debate.
Emails with “Trump” in the subject had higher rates of spam and malicious content compared to those with “Biden.”
No increase in cyberattacks during the debate, but frequent DDoS attacks targeted government and political sites in the preceding months.
Internet traffic ebbs and flows usually follow human patterns, and high visibility events that are broadcast on TV usually have an impact. Let’s take a look at the first of the 2024 United States presidential debates between the two major presumptive candidates, Joe Biden and Donald Trump, for the November presidential election.
Typically, from what we usually observe, election days don’t come with highly intensive changes to Internet traffic, and the same is true for debates. Yet, debates can also draw attention that impacts traffic, especially when there is heightened anticipation. The 2024 debates are not only aired on broadcast and cable television but also streamed on platforms like YouTube, enhancing their reach and impact.
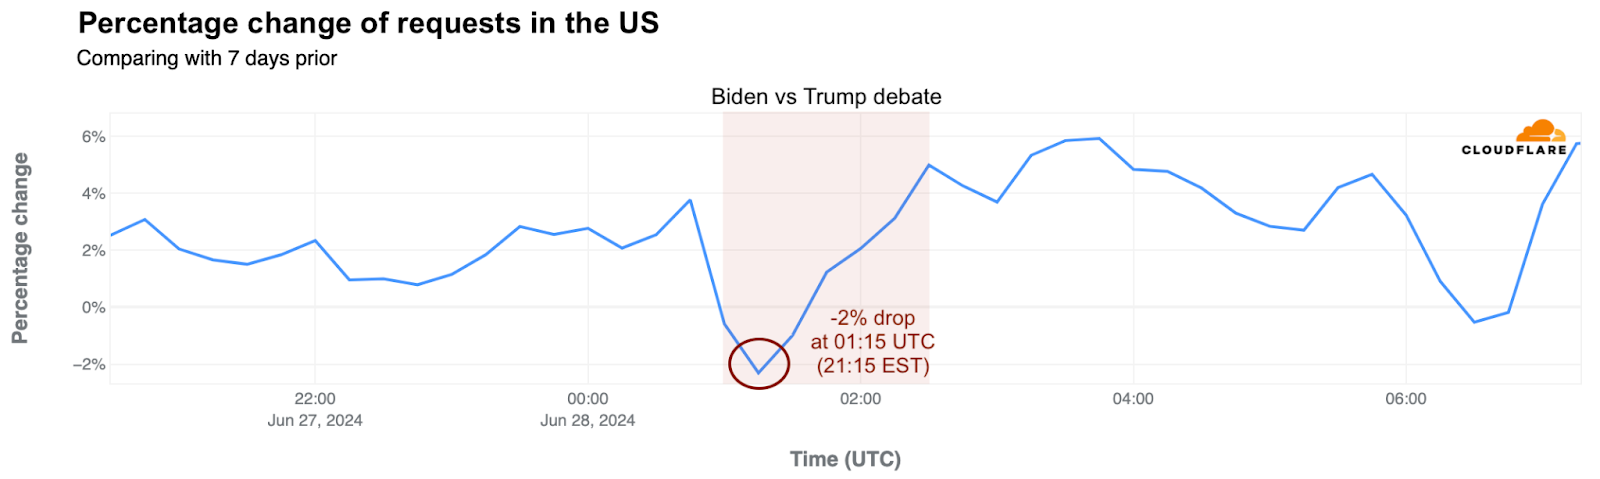
During the June 27, 2024, debate between Biden and Trump, hosted by CNN at 21:00 EST (01:00 UTC), Cloudflare noted a slight drop in nationwide Internet requests, falling to 2% below the same time a week prior at 21:15 EST (01:15 UTC). Interestingly, Internet traffic was 4% higher just before the debate started and surged to 6% above the previous week’s levels after the debate concluded at 23:45 EST (03:45 UTC).
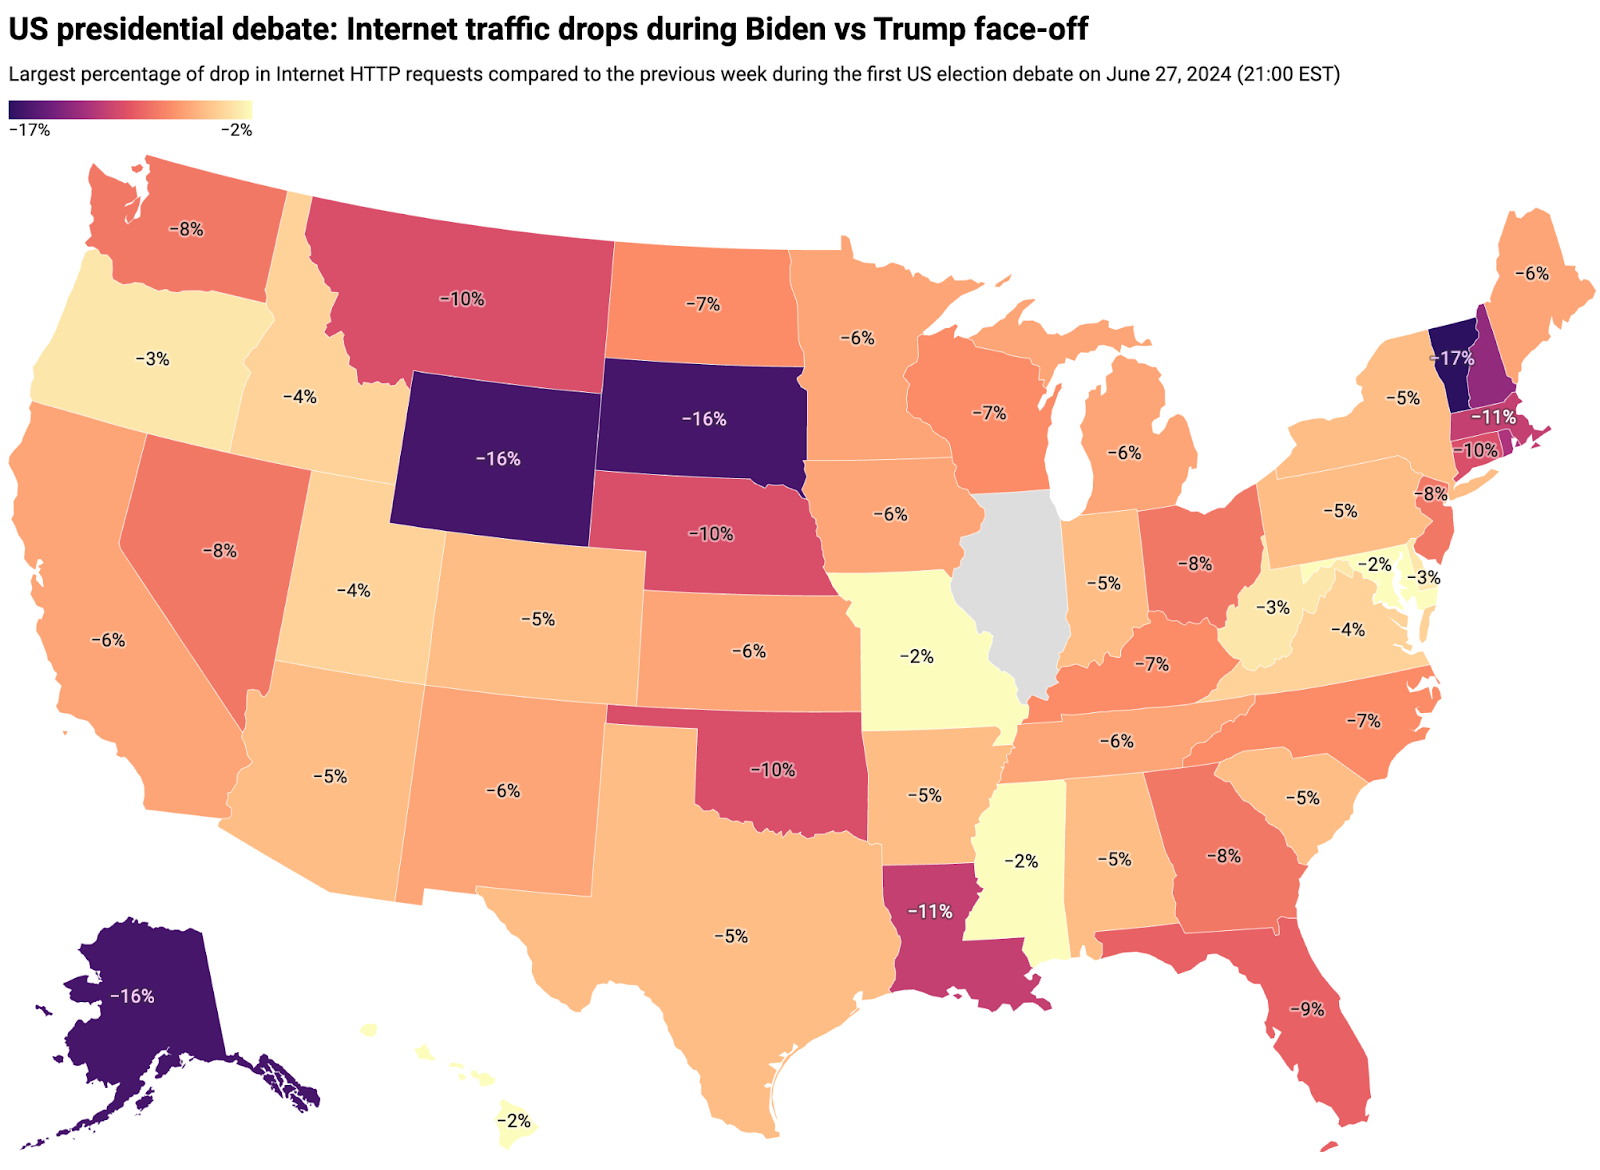
Internet traffic dips across US states
Traffic shifts at the time of the debate, as compared to the previous week, are much more revealing at a state-level perspective than at the country level. The map below summarizes traffic changes observed at a state level:
The most significant traffic drops were seen in Vermont (-17%), South Dakota (-16%), Wyoming (-16%), and Alaska (-16%). More populous states like California, Texas, and New York saw milder reductions of between 5% and 6%, and Florida experienced a 9% drop at 21:45 local time (01:45 UTC) during the debate.
The six swing states that are said to be decisive in the election, Arizona, Georgia, Michigan, Nevada, Pennsylvania and Wisconsin, all saw traffic drop between 5% and 8%.
The initial minutes of the Biden vs. Trump debate triggered the largest traffic declines in most states, though several, including Florida, Louisiana, Georgia, Nevada, and Wisconsin, observed deeper dips midway through. States like Ohio and Missouri recorded their most substantial traffic drops towards the debate’s conclusion.
In the next table, we provide a detailed breakdown of the same perspective shown on the US map ordered by the magnitude of the drop in traffic. We include the time of the biggest traffic drop compared to the previous week, at a 5-minute granularity, and also the percentage of the drop compared to the previous week. (Illinois is not included due to data issues.)
State
Drop in traffic (%)
Time of drop in traffic (local)
Time of drop in traffic (UTC)
Vermont
-17%
21:00
1:00
Alaska
-16%
17:30
1:30
South Dakota
-16%
20:10 / 19:10
1:10
Wyoming
-16%
19:25
1:25
New Hampshire
-13%
21:05
1:05
Rhode Island
-12%
21:05
1:05
Louisiana
-11%
20:45
1:45
Massachusetts
-11%
21:05
1:05
Connecticut
-10%
21:30
1:30
Montana
-10%
19:10 / 18:10
1:10
Nebraska
-10%
20:05 / 19:05
1:05
Oklahoma
-10%
20:05
1:05
Florida
-9%
21:45
1:45
Georgia
-8%
21:45
1:45
Nevada
-8%
18:40
1:40
New Jersey
-8%
21:05
1:05
Ohio
-8%
22:25
2:25
Washington
-8%
18:30
1:30
Kentucky
-7%
21:15
1:15
North Carolina
-7%
21:15
1:15
North Dakota
-7%
20:10 / 19:10
1:10
Wisconsin
-7%
20:45
1:45
California
-6%
18:05
1:05
Iowa
-6%
20:35
1:35
Kansas
-6%
20:05
1:05
Maine
-6%
21:05
1:05
Michigan
-6%
21:05
1:05
Minnesota
-6%
20:05
1:05
New Mexico
-6%
19:10
1:10
Tennessee
-6%
20:30 / 21:30
1:30
Alabama
-5%
20:10
1:10
Arizona
-5%
18:20
1:20
Arkansas
-5%
20:25
1:25
Colorado
-5%
19:15
1:15
Indiana
-5%
21:10
1:10
New York
-5%
21:25
1:25
Pennsylvania
-5%
21:15
1:15
South Carolina
-5%
21:35
1:35
Texas
-5%
20:20 / 19:20
1:20
Idaho
-4%
19:45 / 18:45
1:45
Utah
-4%
19:05
1:05
Virginia
-4%
21:05
1:05
Delaware
-3%
21:05
1:05
Oregon
-3%
18:15
1:15
West Virginia
-3%
21:05
1:05
District of Columbia
-2%
21:55
1:55
Hawaii
-2%
15:20
1:20
Maryland
-2%
21:10
1:10
Mississippi
-2%
20:20
1:20
Missouri
-2%
21:10
2:10
Illinois
–
–
–
DNS trends: Trump-related sites see accelerated growth
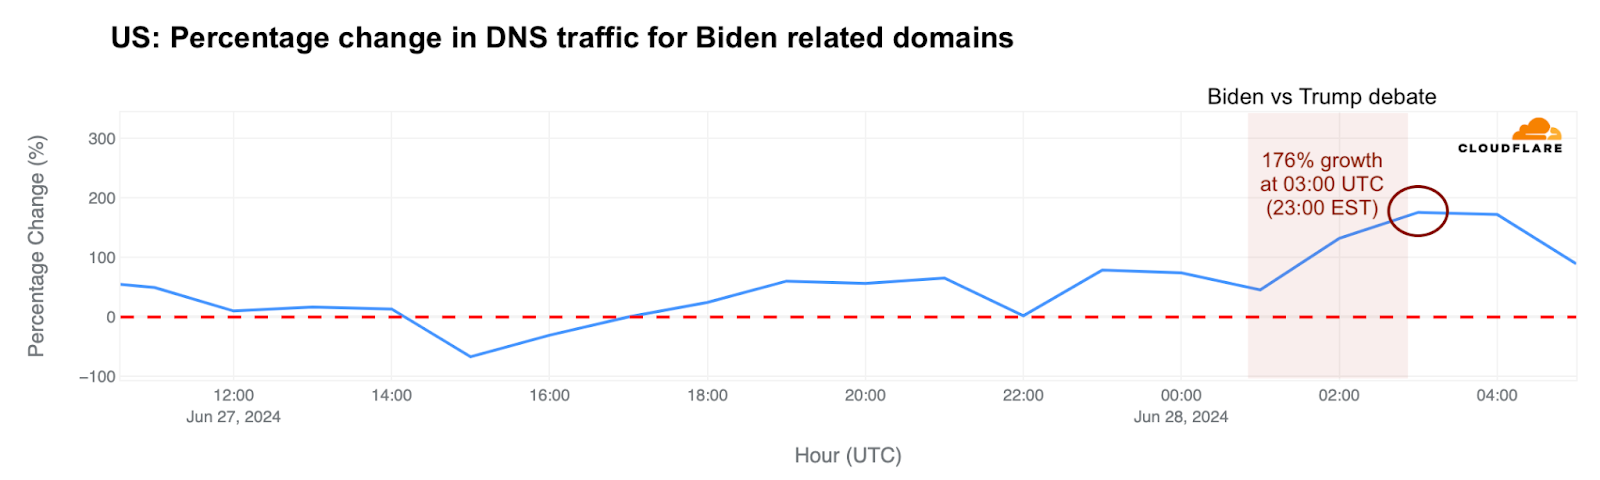
Switching focus to domain trends, our 1.1.1.1 resolver data reveals a more targeted impact from the debate. Considering the candidates individually (using the official sites related to both candidates), we found that Biden-associated websites saw a 176% surge in DNS queries at around 23:00 EST (03:00 UTC), compared to the previous week.
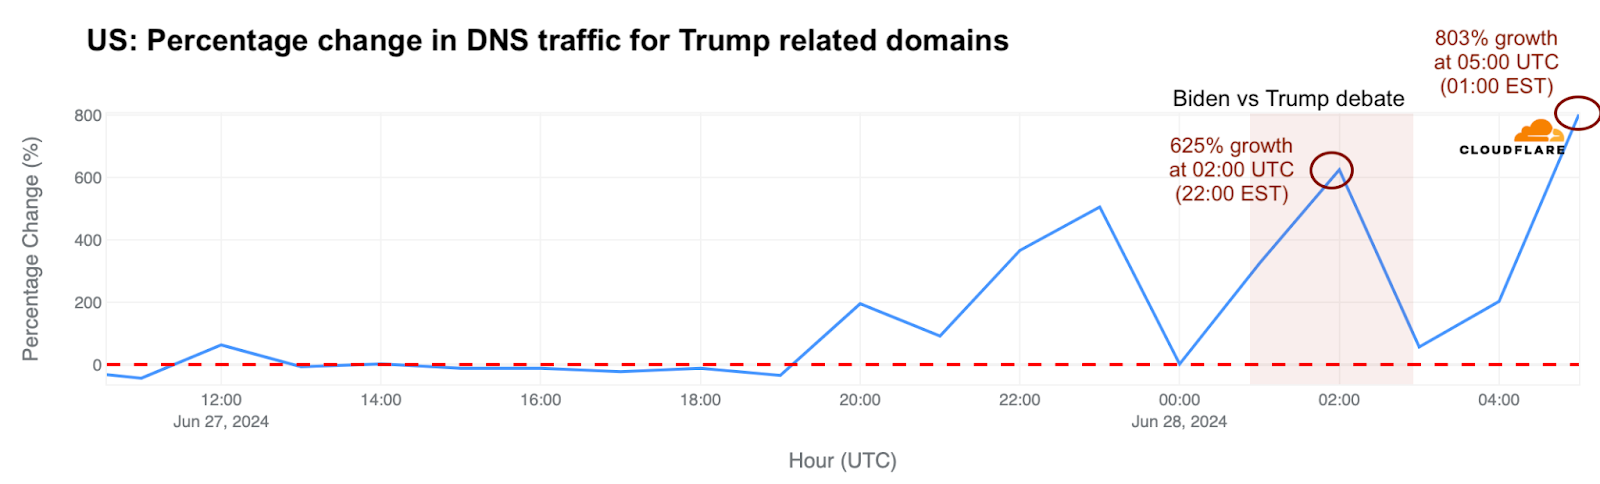
However, Trump-associated sites saw a greater increase than Biden-associated sites, showing an increase before, during, and after the debate, with the peak growth reaching 803% over the previous week at 01:00 EST (05:00 UTC).
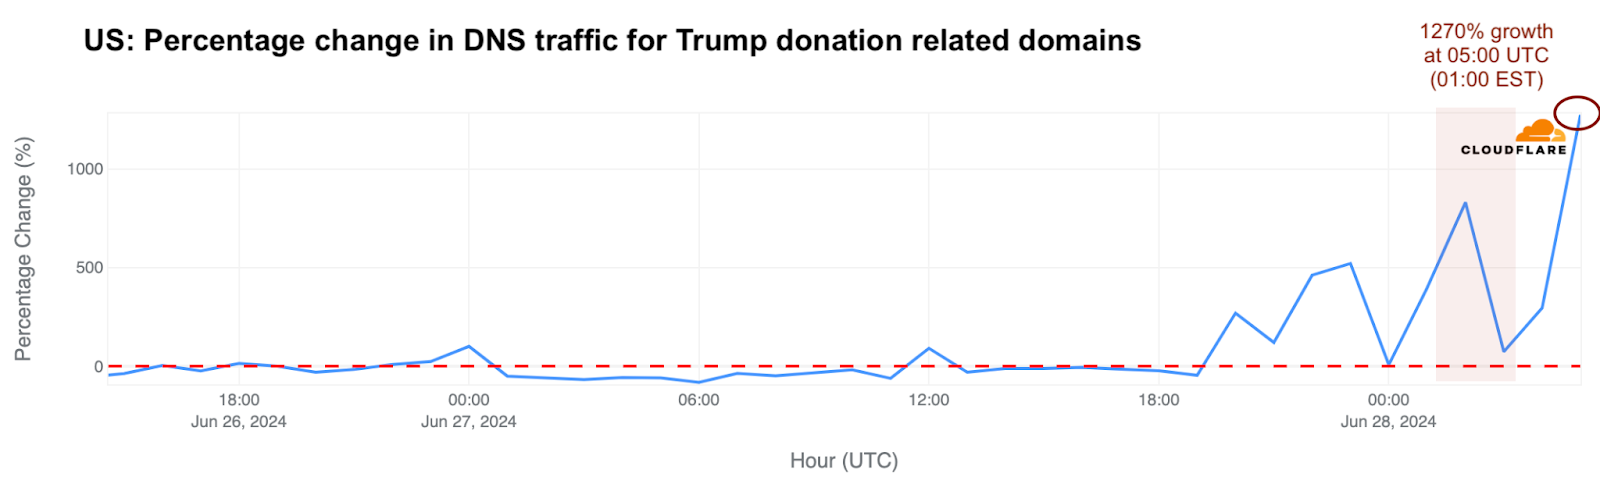
For donation sites, those linked to Biden were busiest before the debate on June 17 and 18, thanks to events with Barack Obama and Bill and Hillary Clinton. DNS traffic for Trump’s donation sites, as compared with the previous week, increased during the debate, growing 830% at 22:00 EST (02:00 UTC) and reaching a high of 1270% increase by 01:00 EST.
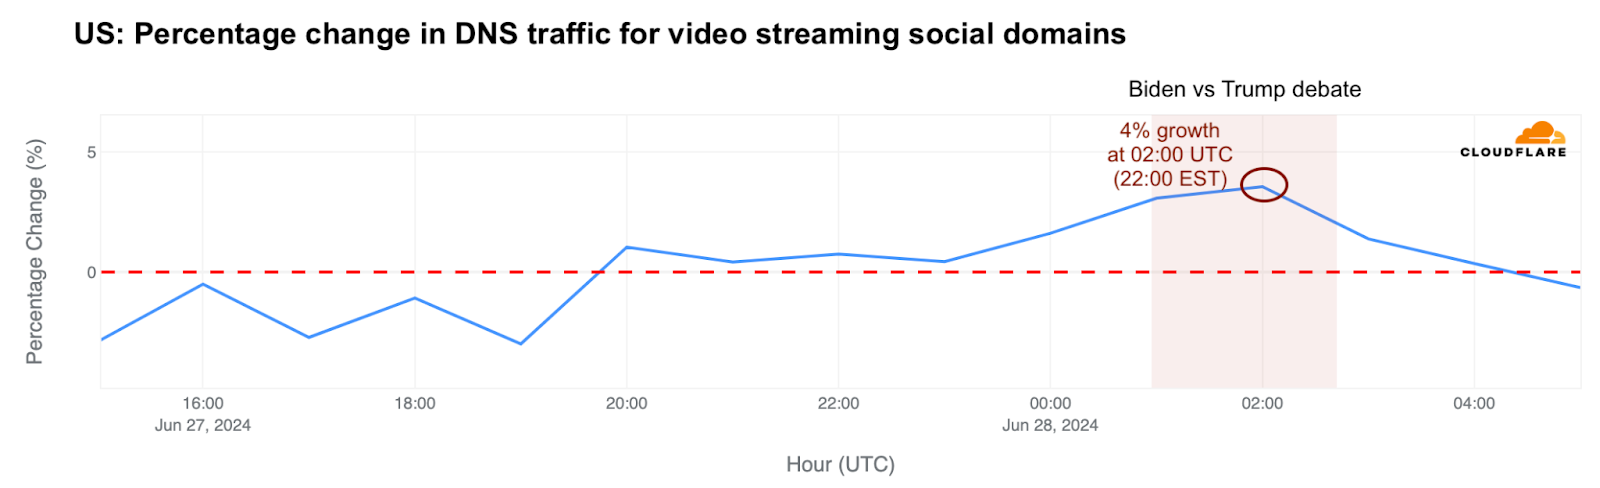
The debate aired on multiple TV channels and was streamed on YouTube. During the debate, video streaming platforms like TikTok and YouTube, which are among the top Internet services globally, saw a 4% increase in DNS traffic at 22:00 EST (02:00 UTC). Significant changes in DNS traffic on these platforms are uncommon due to their widespread popularity.
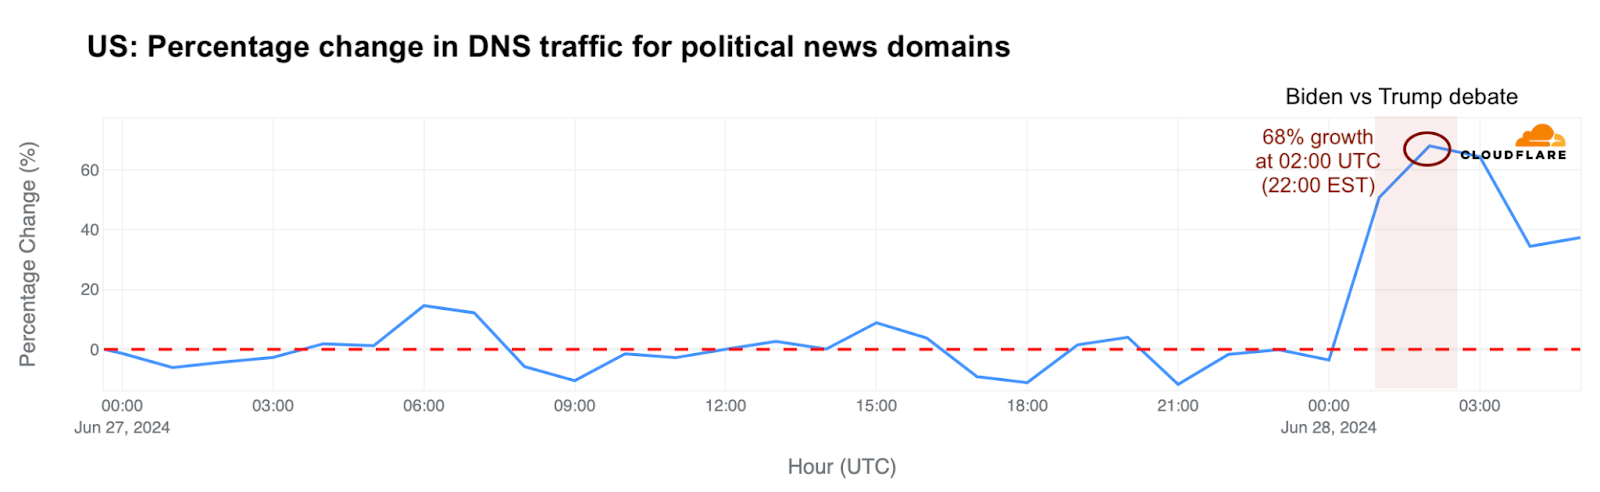
Political news sites also spiked, with a 68% traffic increase around 22:00 EST (02:00 UTC).
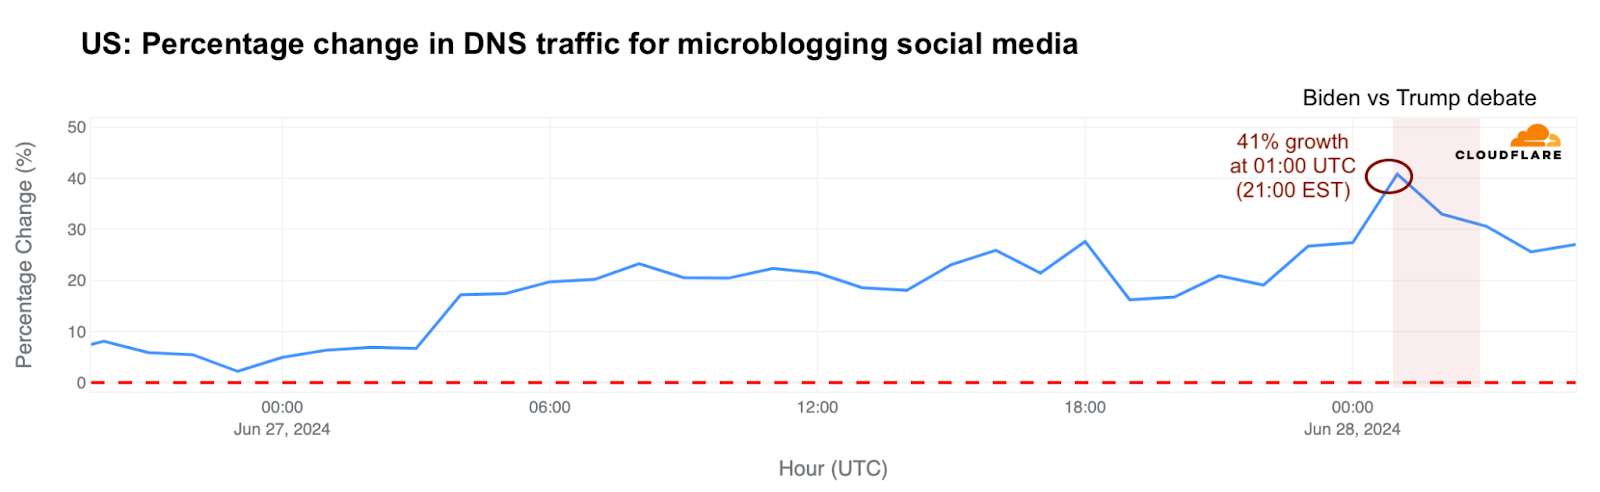
Microblogging social platforms like X or Threads outperformed their previous week’s traffic throughout the debate day, with growth peaking at 41% at the start of the debate around 21:00 EST (01:00 UTC).
Biden vs Trump: spam and malicious emails
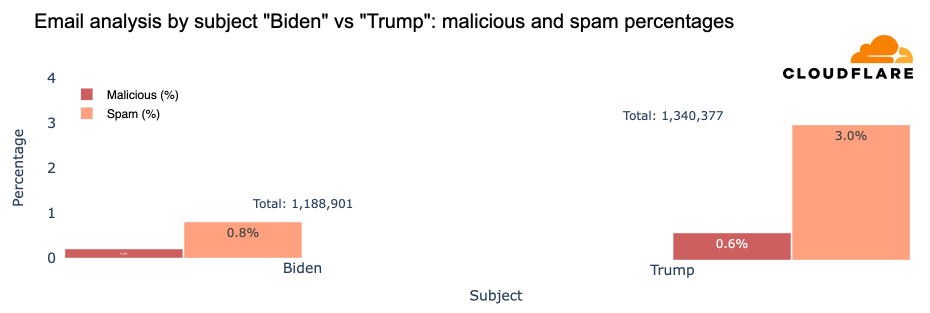
In June 2024 (through June 27), Cloudflare’s Cloud Email Security service processed over 2.5 million emails containing “Biden” or “Trump” in the subject line. Trump-related subjects appeared 13% more often than those related to Biden. Moreover, emails with “Trump” had higher percentages of spam, at 3%, and malicious messages, at 0.6%, compared to 0.8% for spam and 0.2% for malicious messages with “Biden.”
The peak occurrence of spam emails with “Trump” was on June 9, at 19.8%, and the highest rate of malicious messages was on June 12, at 2.9%. For “Biden,” the highest spam rate was on June 21, at 1.2%, and the peak for malicious messages was also on June 9, at 0.8%.
Attacks: government and political impact
Focusing on attacks, those are usually constant, and aren’t necessarily driven always by elections. But, as we’ve seen at the start of the war in Ukraine or more recently in the Netherlands, events do trigger attacks. Already in June 2024, during the European elections, we recently published a blog post about the cyberattack on Dutch political-related websites that lasted two days – June 5 and 6. The main DDoS (Distributed Denial of Service attack) attack on June 5, the day before the Dutch election, reached 73,000 requests per second (rps).
Shifting our focus to the US in particular, in the weeks since April 2024, we’ve seen some DDoS attacks targeting both government, state or political-related websites in the United States. That said, we haven’t seen any substantial attacks targeting political sites during the day of debate, June 27. The most recent one we saw was this week, on June 24, and targeted a political-related website involved in the current elections. It was a small attack that lasted under 10 minutes and peaked at 35,000 requests per second (rps).
Now that we’ve explored the US presidential debate trends, let’s compare it with Internet trends from other debates in the UK and France from the week of June 24, 2024.
UK and France: debates with an impact
In other countries like the UK and France, election-related debates during the week of June 24 also serve as examples for comparison with the Biden vs Trump debate. Both the UK and France experienced more significant nationwide traffic impacts during their debates compared to the US. However, the geographic and population size of the US, coupled with the debate’s broad availability on streaming platforms, could have influenced this disparity.
In France, the snap election is scheduled for Sunday, June 30, 2024, and the runoff on July 7, 2024. The final debate among the leading candidates on Tuesday, June 25, 2024 (21:00 local time), led to a 14% drop in Internet HTTP requests, as it was broadcast nationally and carried broad interest. Despite this, the UEFA Euro 2024 football match between France and Poland on the same day, at 18:00 local time, caused an even greater traffic decrease of 16%.
The following day, Wednesday, June 26, 2024, the two main candidates for the snap UK general election — scheduled for July 4, 2024 — participated in their final debate on BBC national TV. The debate between Rishi Sunak and Sir Keir Starmer, which started at 20:15 local time, resulted in a 7% drop in UK Internet traffic compared to the previous week. The most significant decrease occurred at 20:45. At a more detailed level, Wales experienced an 11% drop during the debate, followed by England at 8%, Scotland at 7%, and Northern Ireland at 5%.
Conclusion: high intensity election year
Even if major political events don’t always bring significant changes to Internet traffic, our data shows that the Biden vs. Trump debate had an impact, especially at the state level. Microblogging and video streaming social platforms also saw traffic shifts during the debate, with Trump-related sites seeing larger spikes in DNS traffic than Biden-related sites, especially after the debate.
We also observed a higher percentage of spam and malicious emails sent with “Trump” in the subject of the messages than with “Biden.” Although we didn’t see an uptick in cyberattacks during the debate, we note that these have been frequent, especially DDoS attacks in the months before, targeting both federal and state government services as well as politically related sites.
If you want to follow more trends and insights about the Internet and elections in particular, you can check Cloudflare Radar, and more specifically our new 2024 Elections Insights report, which will be updated as elections take place throughout the year.
Football (“soccer” in the US) is considered the most popular sport in the world, with around 3.5 billion fans spread across the world. European football is central to its popularity. The UEFA Euro 2024 (the European Football Championship) started on June 14 and will run until July 14, 2024. But how much do these games impact Internet traffic in countries where national teams are playing? That’s what we aim to explore in this blog post. We found that, on average, traffic dropped 6% during games in European countries with national teams playing in the tournament.
Cloudflare has a global presence with data centers in over 320 cities, which helps provide a global view of what’s happening on the Internet. This is helpful for security, privacy, efficiency, and speed purposes, but also for observing Internet disruptions and traffic trends.
In the past, we’ve seen how Internet traffic and HTTP requests are impacted by events such as total solar eclipses, the Super Bowl, and elections. 2024 is the year of elections, and we’ve been sharing our observations in blog posts and our new 2024 Election Insights report on Cloudflare Radar.
However, football games are different from elections. Related trends happen when major teams or national squads are playing matches that draw a lot of human attention. If a game is broadcast on a national TV channel, Internet traffic typically drops because during games. People’s attention is more on the TV set with the ‘old’ broadcast signal, for those games that don’t require a paid subscription. That’s the most common situation when national teams are playing in Europe.
If it’s on a closed or paid channel (where a subscription is needed), then sometimes traffic increases as fewer viewers have access to the TV broadcast. For context, there’s a trend of channels offering games in their apps through streaming, not only for paid channels but also national broadcasters such as the British BBC. The opening England game in Euro 2024 on Sunday, June 16, 2024, had 15 million viewers on BBC One and was also streamed 3.5 million times on BBC iPlayer. This variety of viewing options from a single service appears to be a new trend in the digital age.
Football games associated with drops in traffic
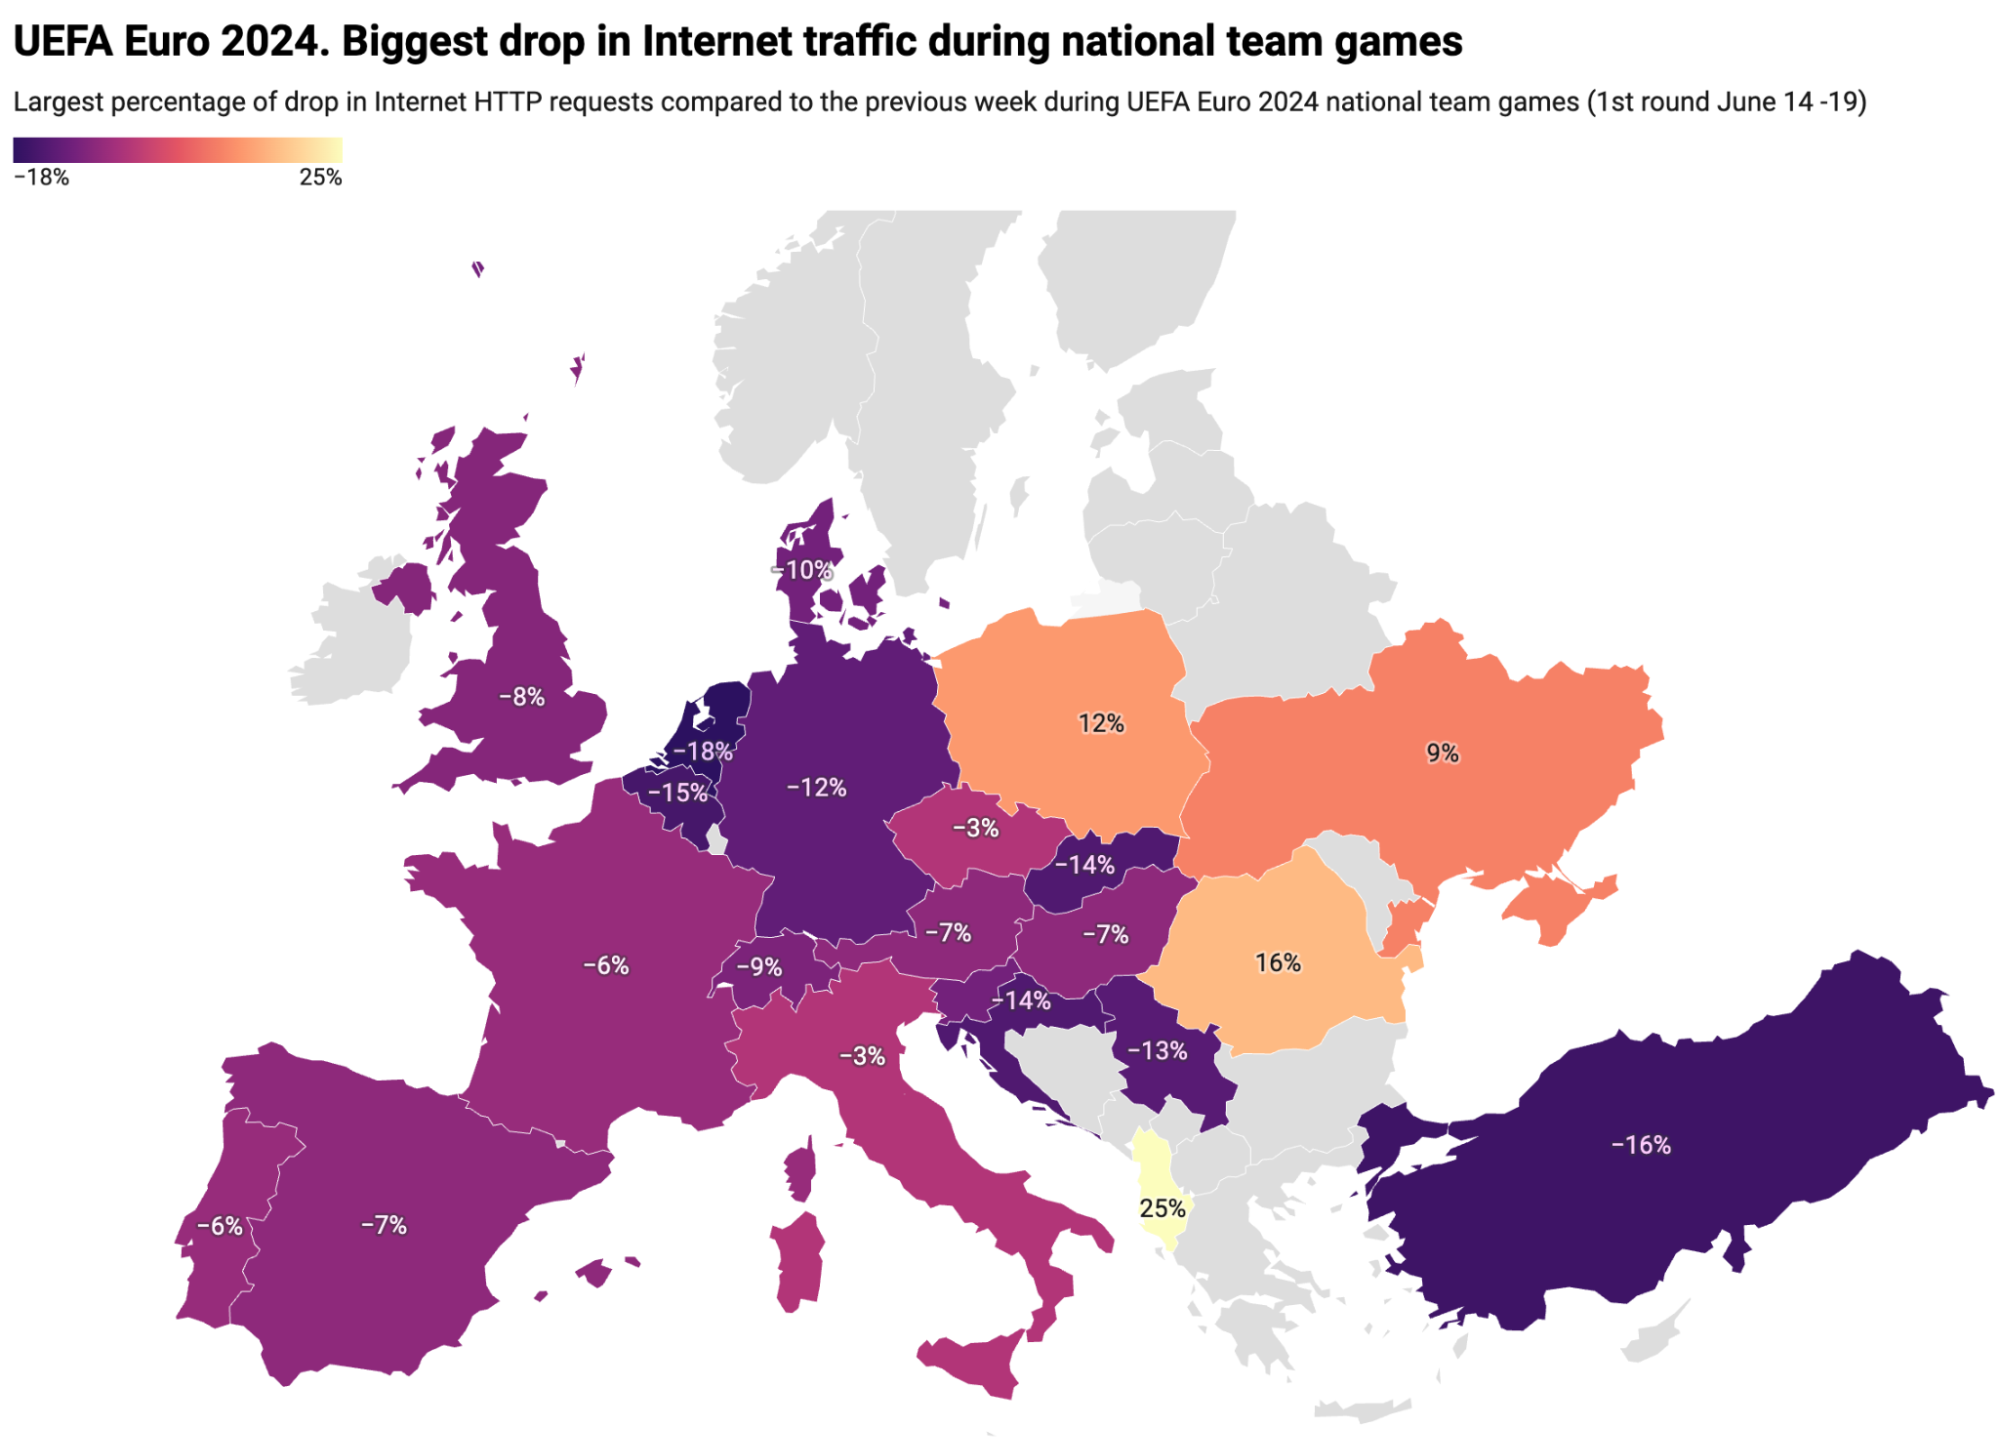
Now, for some game-related Internet trends: the Netherlands, Turkey, Belgium, Croatia, Slovakia, Serbia, and host Germany were the countries where their national team games had a significant impact on requests, with a drop of at least 12% compared to the previous week. Western Europe and countries around Germany top the list. The list shown in the map and the table below covers the first round of games among all teams in all six groups, which concluded on June 19, 2024.
Here is the full list, which provides more detail than the map above, showing each country and the percentage decrease (or increase) in traffic as compared to the previous week at the time those countries’ national team games were occurring.
Country
Increase/ decrease traffic
Game day/hour (UTC)
Opponent
Netherlands
-18%
June 16, 13:00
Poland
Turkey
-16%
June 18, 16:00
Georgia
Belgium
-15%
June 17, 16:00
Slovakia
Croatia
-14%
June 15, 16:00
Spain
Slovakia
-14%
June 17, 16:00
Belgium
Serbia
-13%
June 16, 19:00
England
Germany
-12%
June 14, 19:00
Scotland
Denmark
-10%
June 16, 16:00
Slovenia
Slovenia
-10%
June 16, 16:00
Denmark
Switzerland
-9%
June 15, 13:00
Hungary
England
-8%
June 16, 19:00
Serbia
Georgia
-8%
June 18, 16:00
Turkey
Austria
-7%
June 17, 19:00
France
Hungary
-7%
June 15, 13:00
Switzerland
Spain
-7%
June 15, 16:00
Croatia
France
-6%
June 17, 19:00
Austria
Scotland
-6%
June 14, 19:00
Germany
Portugal
-6%
June 18, 19:00
Czechia
Italy
-3%
June 15, 19:00
Albania
Czechia
-3%
June 18, 19:00
Portugal
Ukraine
9%
June 17, 13:00
Romania
Poland
12%
June 16, 13:00
Netherlands
Romania
16%
June 17, 13:00
Ukraine
Albania
25%
June 15, 19:00
Italy
Albania, Romania, Poland, Ukraine, and Slovenia were the only countries with an increase in HTTP requests during games. England (-8%) and Scotland (-6%) both have similar drops in requests during their national team games.
We’ve also noticed looking at our country-related HTTP data around games that social media services usually go up during half-time and before and after these national team games. As expected, traffic to websites in categories like AI chatbots, ecommerce (though some see increases during halftime), productivity tools, and business and financial services tends to decrease during Euro 2024 games.
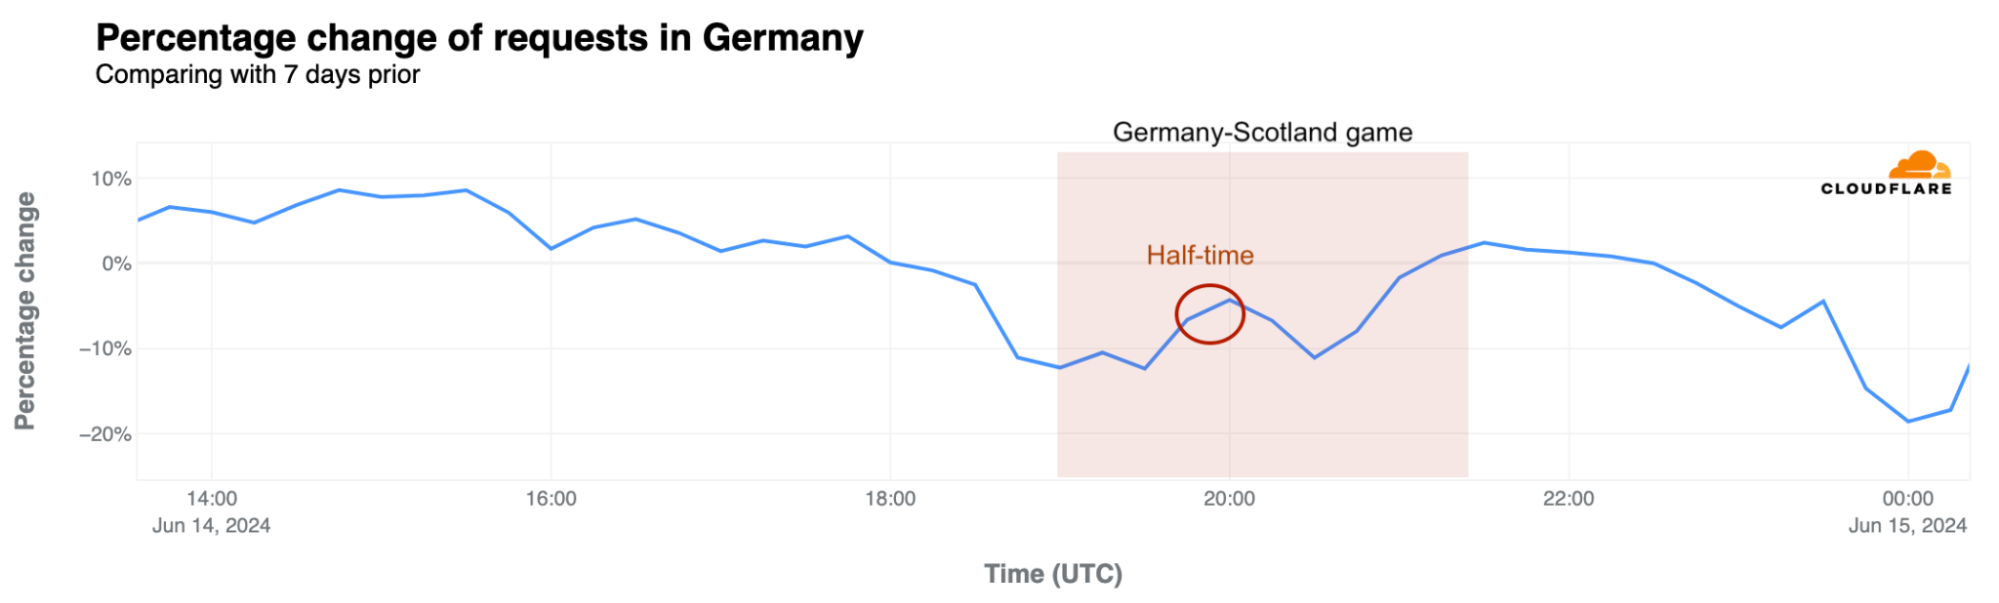
First day of competition: Germany-Scotland
Another important perspective is focused on the first day of competition. On June 14, 2024, Euro 2024 kicked off in Germany. How was Internet traffic impacted in the country?
When the ceremony started around 18:45 UTC (20:45 local time), by as much as 11%, deepening to a 12% drop from the previous week when the first game between Germany and Scotland began at 19:00 UTC (21:00 local time). Traffic briefly recovered during halftime to only 4% below the previous week’s levels, but fell again to 11% below the prior week during the second half. At 00:00 UTC (02:00 local time), requests dropped as much as 19% from the previous week, in a night of celebration for German fans.
The second round of games in the Euro 2024 group phase is already underway. We’re keeping an eye on country-related trends after games on X.
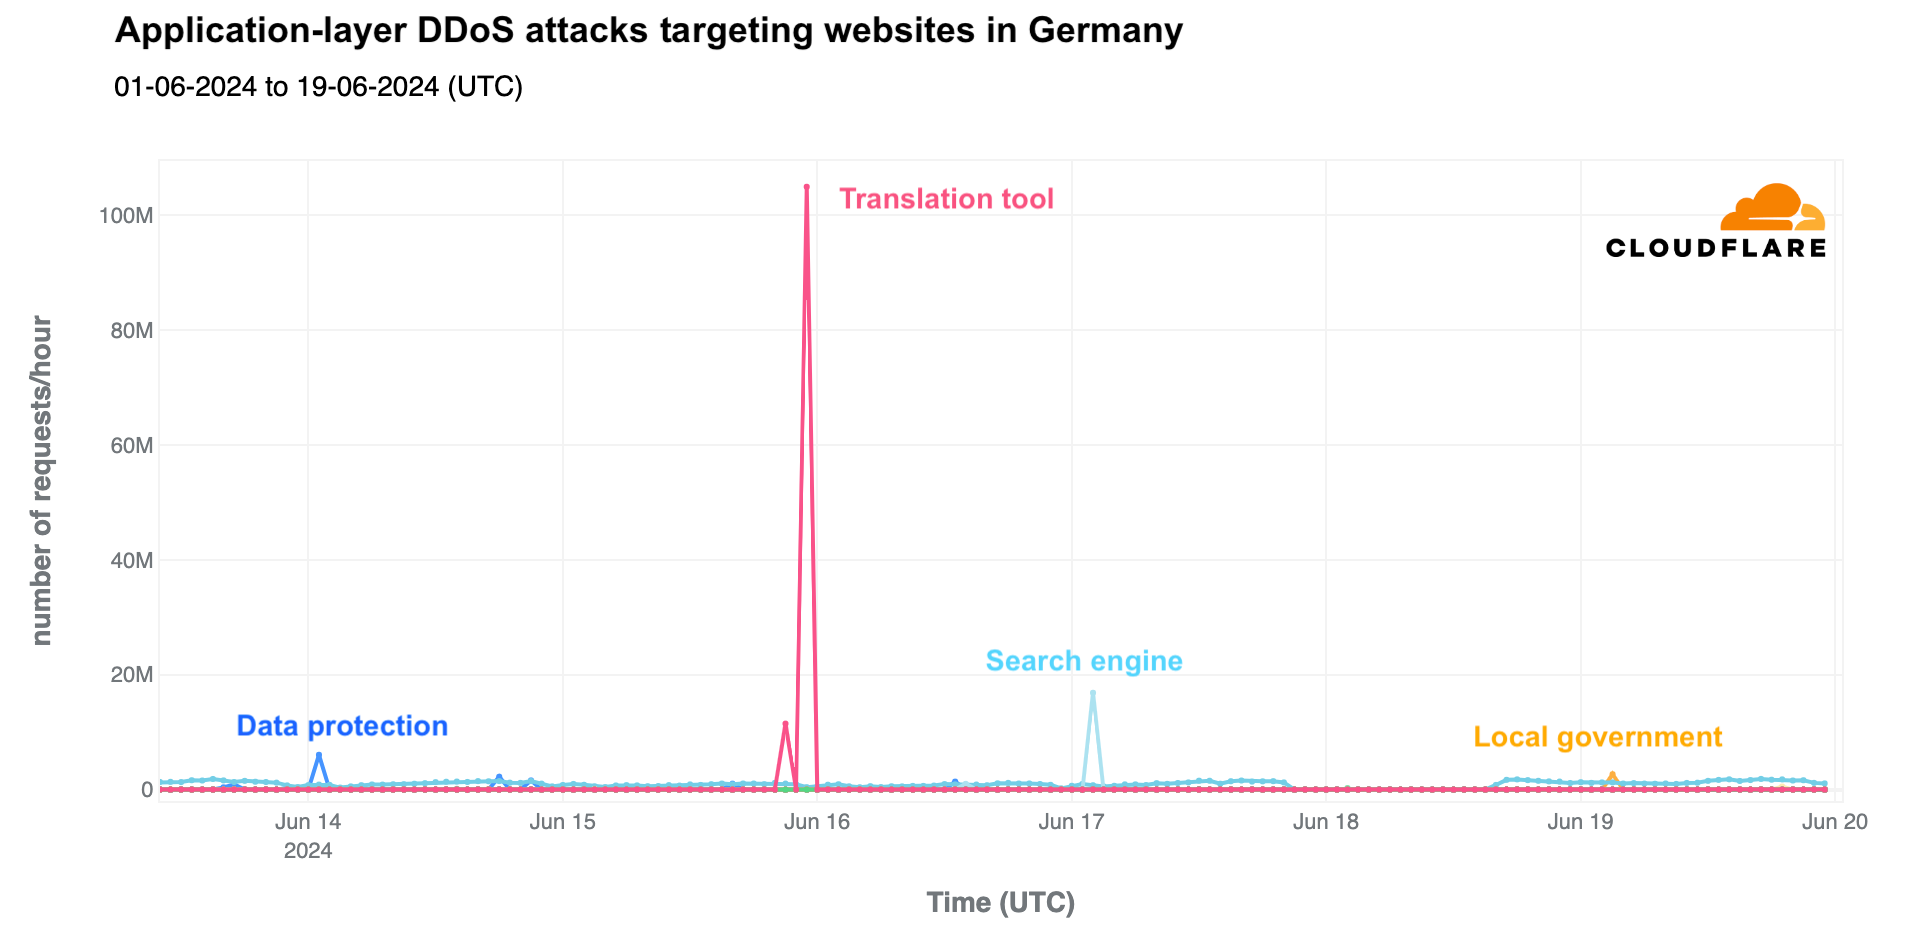
An attacks perspective
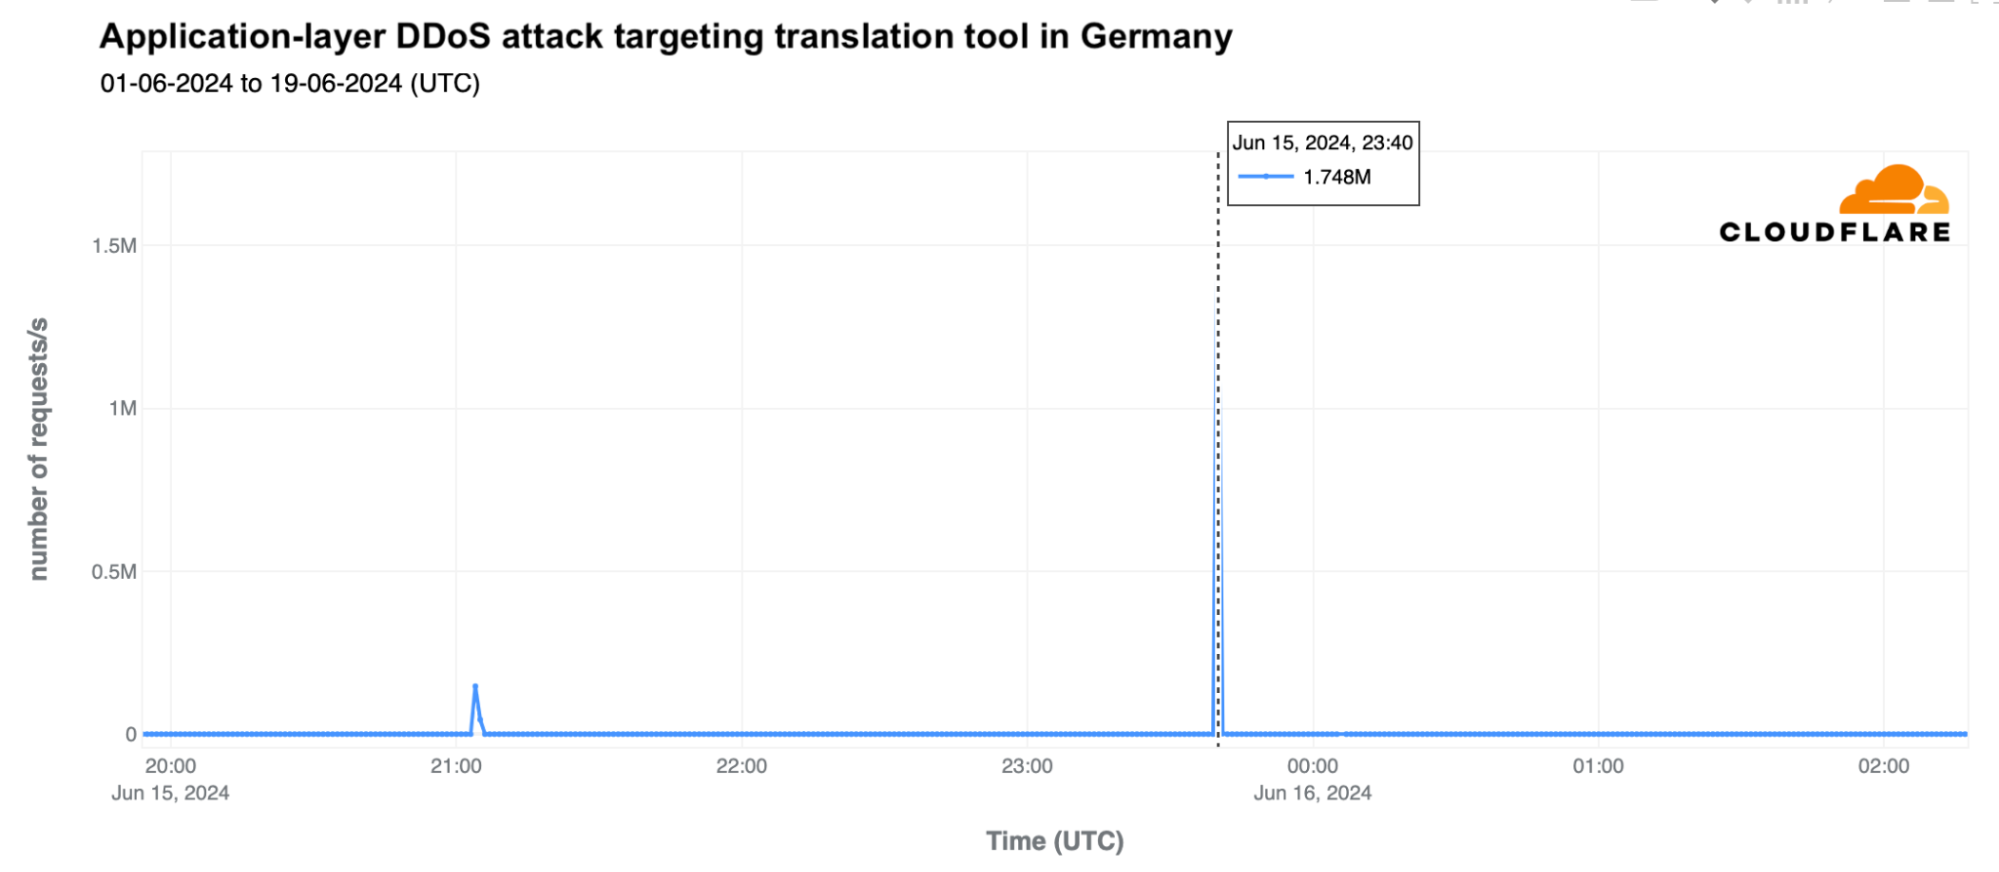
During the UEFA Euro 2024 event in Germany, we’ve observed several attacks in the country. These included application layer DDoS (Distributed Denial of Service) attacks targeting various websites, such as a translation tool, a data protection tool, a search engine, and a local government website. The most significant DDoS attack occurred on June 15, 2024, the day after the competition started, targeting the translation tool. This attack reached 105 million requests per hour at 23:00 UTC and lasted about two hours with two distinct spikes.
Looking more closely at the attack on the translation tool, it peaked at 1.74 million requests per second (rps) at 23:40 UTC, following an initial spike of 147,000 rps at 21:04 UTC.
Conclusion
Football is incredibly important to Europeans, enough to cause nationwide Internet traffic to drop when fans are rooting for their national teams in a UEFA Euro 2024 game broadcast on national TV.
Despite the popularity of online services like live score apps, sports news sites that track every minute of each game, and betting services enhanced with new visual tools and stats, national team football (or soccer) still significantly diverts attention away from the Internet.
We will continue to monitor UEFA Euro 2024 Internet trends. Based on the results of a poll we conducted on X, we plan to publish daily updates about games and their impact on countries whose national teams are playing that day. Follow us there.
The 2024 European Parliament election took place June 6-9, 2024, with hundreds of millions of Europeans from the 27 countries of the European Union electing 720 members of the European Parliament. This was the first election after Brexit and without the UK, and it had an impact on the Internet. In this post, we will review some of the Internet traffic trends observed during the election days, as well as providing insight into cyberattack activity.
Elections matter, and as we have mentioned before (1, 2), 2024 is considered “the year of elections”, with voters going to the polls in at least 60 countries, as well as the 27 EU member states. That’s why we’re publishing a regularly updated election report on Cloudflare Radar. We’ve already included our analysis of recent elections in South Africa, India, Iceland, and Mexico, and provided a policy view on the EU elections.
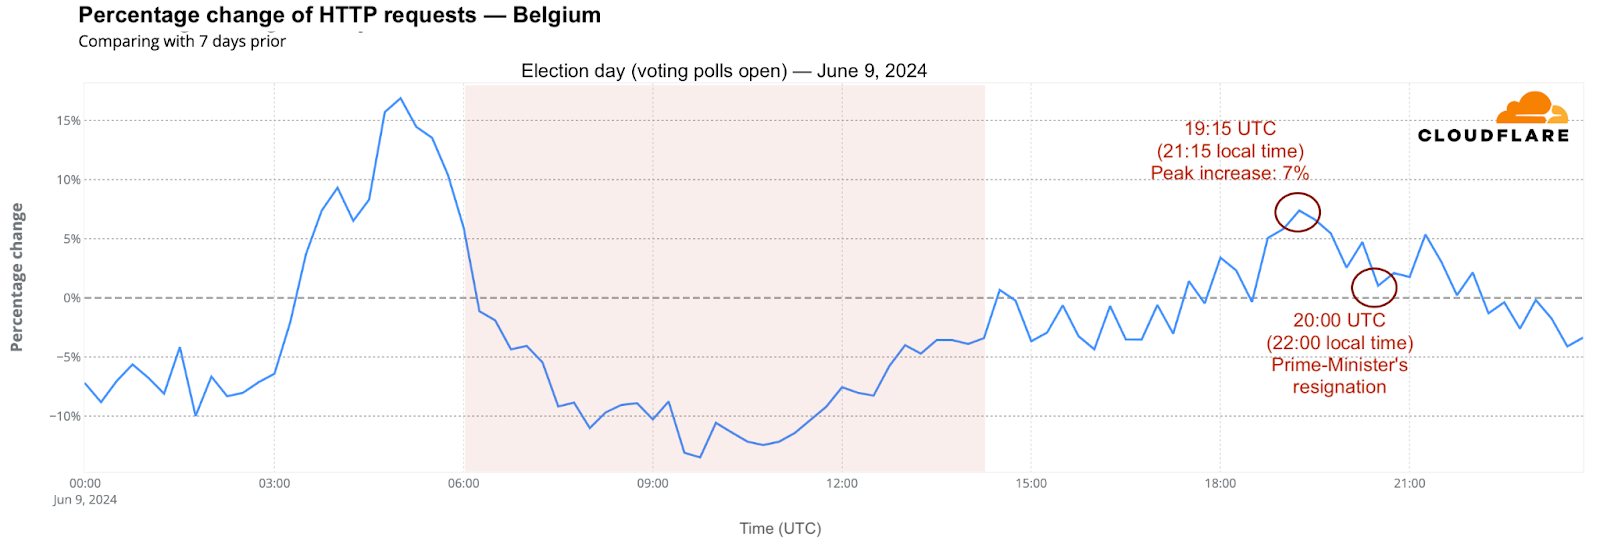
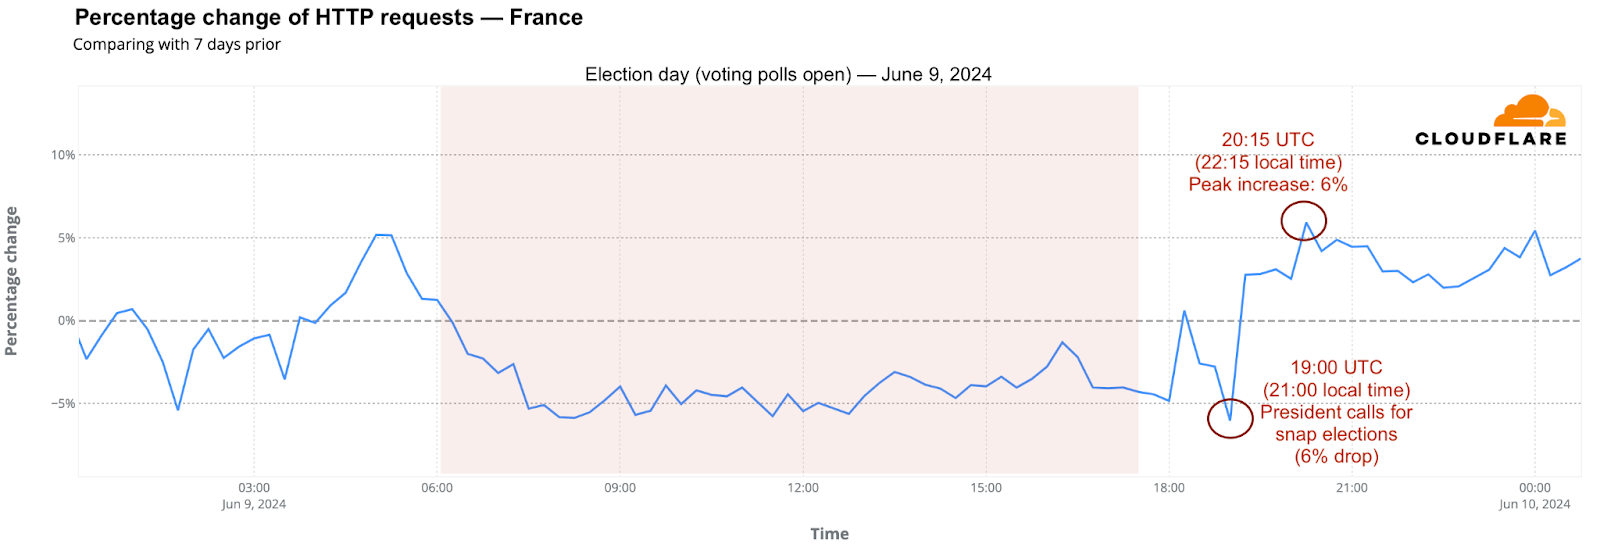
The European Parliament election coincided with several other national or local elections in European Union member states, leading to direct consequences. For example, in Belgium, the prime minister announced his resignation, resulting in a drop in Internet traffic during the speech followed by a clear increase after the speech was over. In France, we saw a similar pattern with the announcement of legislative snap elections.
From analyzing patterns seen during previous elections in France and Brazil, we know that Internet traffic often decreases during voting hours, though not as significantly as during other major events like national holidays. This usual drop is typically followed by an increase in traffic as election results are announced.
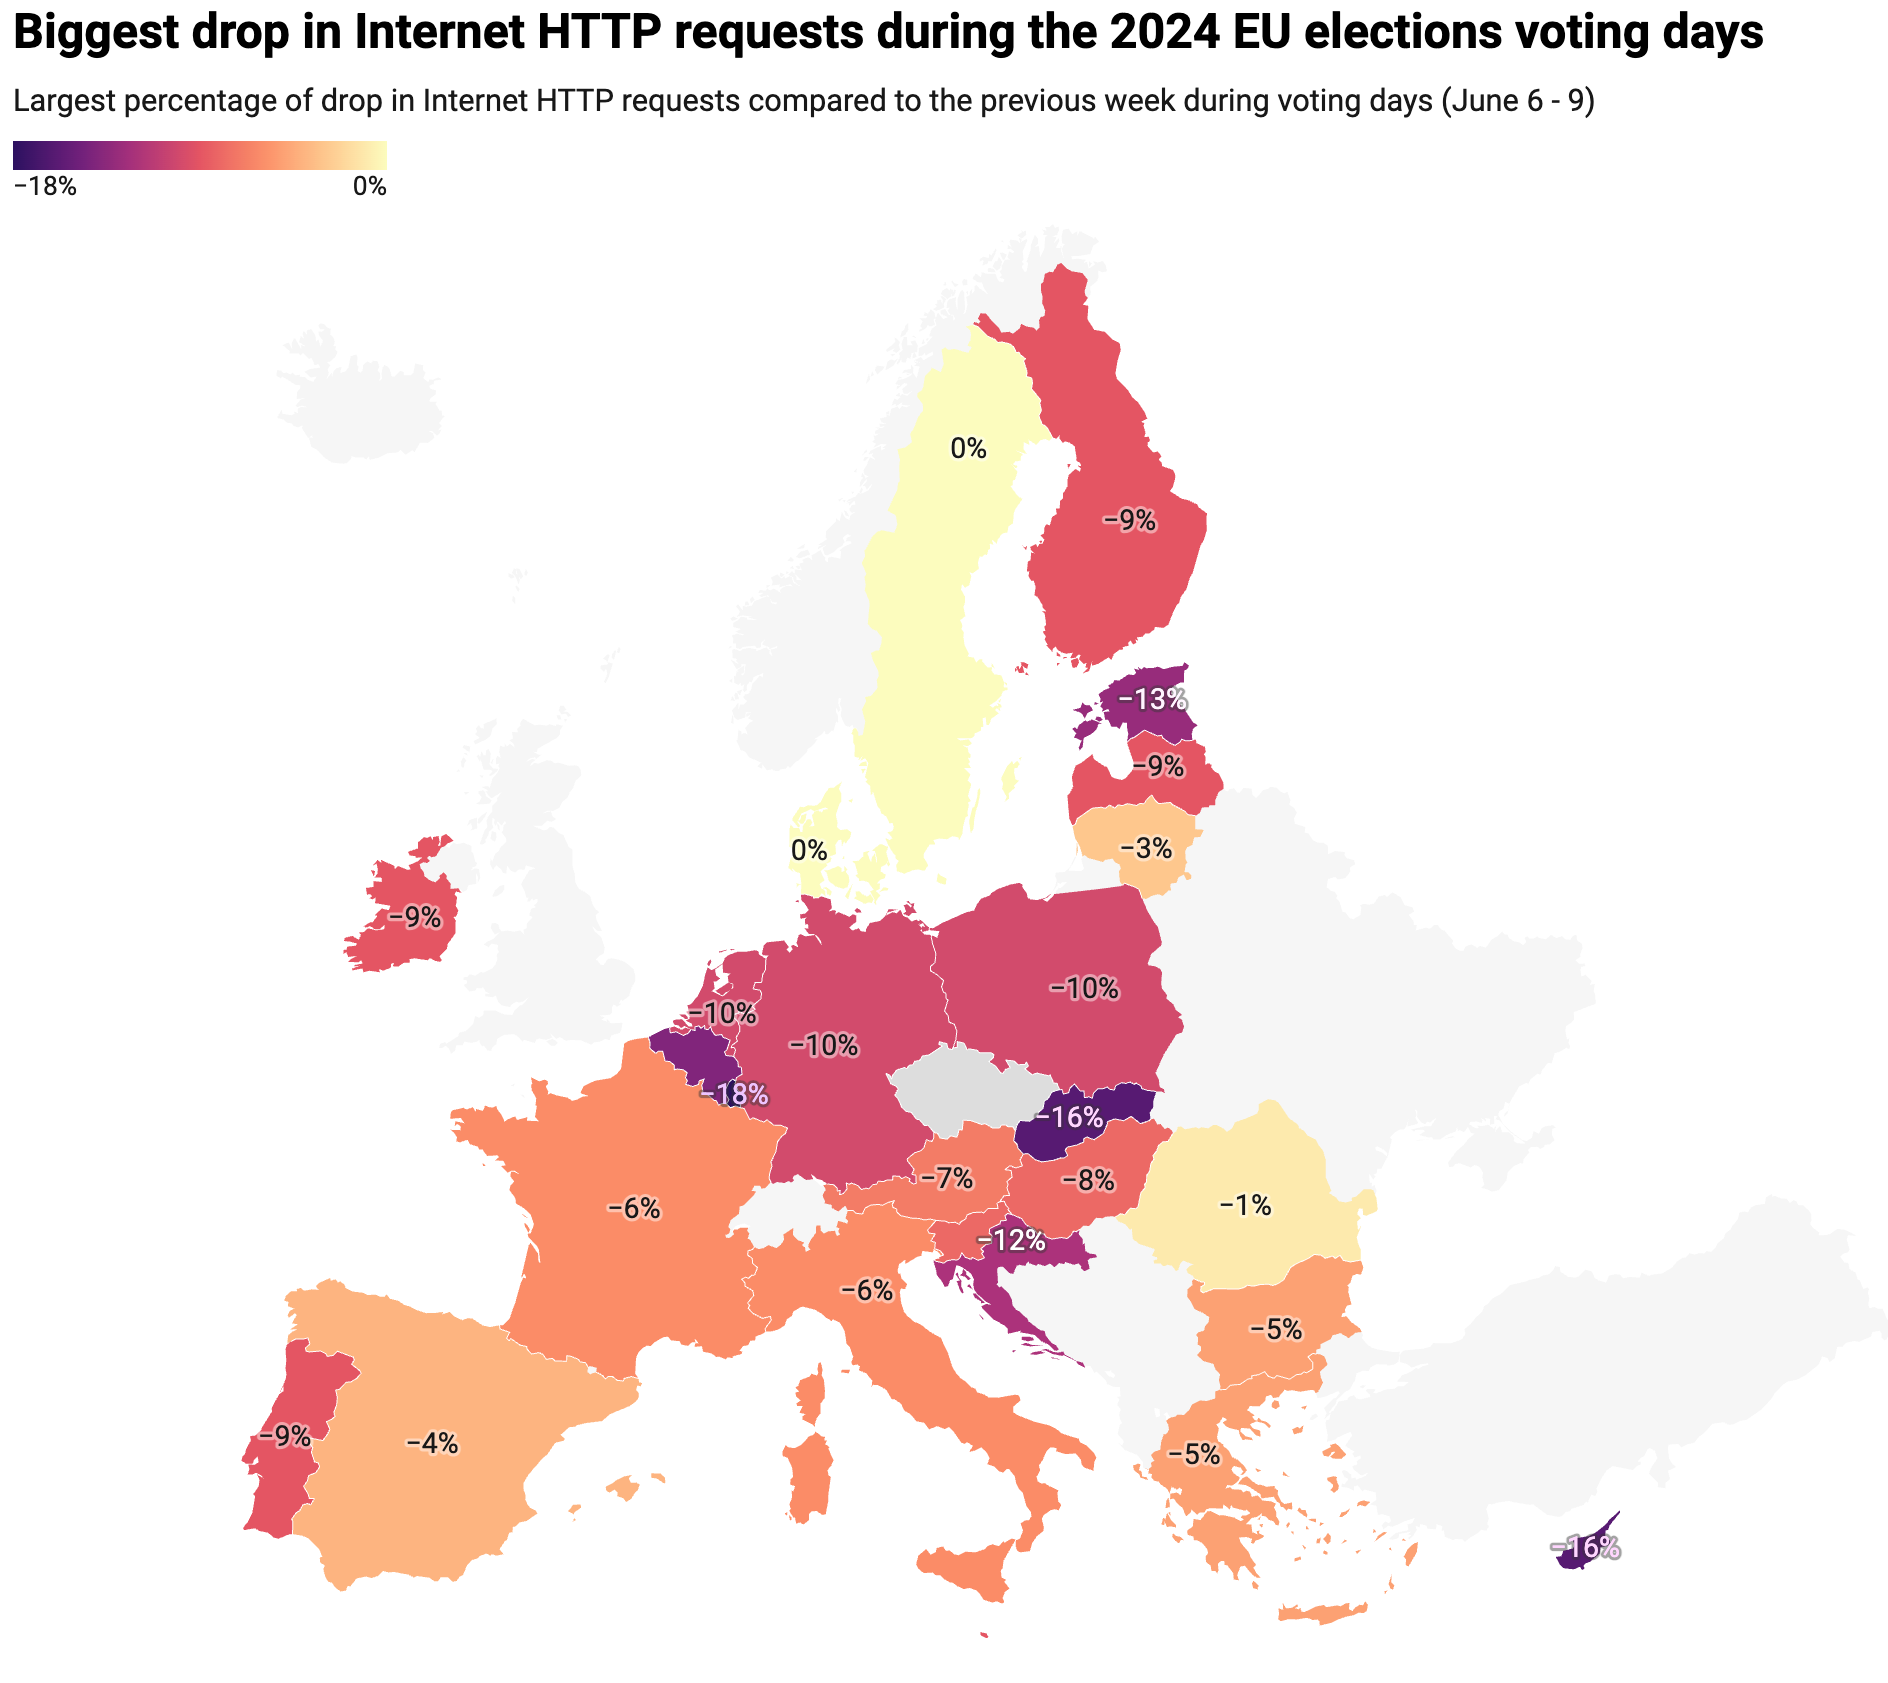
Let’s start with a wider picture of the 2024 European Parliament election, focusing on the time of the biggest drop in Internet HTTP requests during the election days as compared to the previous week. Note that there were some national or local elections taking place at the same time, and European Union elections are known to have low turnout compared to national and local ones.
Source: Cloudflare; created with Datawrapper
Drops greater than 10% were observed only in the Czech Republic, Luxembourg, Slovakia, Cyprus, Belgium, Estonia, and Croatia. The table below includes the percentage that traffic dropped and the specific time during the election day it occurred. In countries with more than one election day, we considered the time and day of the biggest drop.
Countries
Elections day(s)
Local time
Drop in traffic %
Czech Republic
June 7 – 8
June 8, 14:30
-20%
Luxembourg
June 9
12:45
-18%
Slovakia
June 8
15:45; 19:00
-16%
Cyprus
June 9
10:00
-16%
Belgium
June 9
11:45
-14%
Estonia
June 7-9
June 9, 9:00
-13%
Croatia
June 9
18:00
-12%
Poland
June 9
18:00
-10%
Netherlands
June 6
10:15
-10%
Germany
June 9
13:45
-10%
Ireland
June 7
7:15
-9%
Finland
June 9
9:00
-9%
Portugal
June 9
15:45
-9%
Malta
June 8
12:15
-9%
Latvia
June 8
08:30, 16:15
-9%
Slovenia
June 9
18:00
-8%
Hungary
June 9
6:00
-8%
Austria
June 9
12:30
-7%
Italy
June 8 – 9
June 9, 16:00
-6%
France
June 9
13:30
-6%
Bulgaria
June 9
19:45
-5%
Greece
June 9
8:00
-5%
Spain
June 9
13:00
-4%
Lithuania
June 9
8:00
-3%
Romania
June 9
9:45
-1%
Denmark
June 9
–
–
Sweden
June 9
–
–
The data in the list above shows that Central European countries had the highest drop in Internet traffic, particularly the Czech Republic and Slovakia. Eastern Europe saw significant drops in Estonia and Poland. Southern Europe had consistent moderate drops across multiple countries, with Cyprus and Croatia showing higher losses. Northern Europe showed minimal to no traffic drop in Scandinavian countries, with Finland and Ireland experiencing moderate declines.
Looking at the specific (local) times of day during voting periods on election days, morning drops (06:00 – 10:00) were more common in Northern and Eastern Europe. Late morning to early afternoon drops (10:15 – 14:30) were predominantly observed in Western and Central Europe. Late afternoon drops (15:45 – 19:45) were more common in Central and Southern Europe.
Impact of notable announcements in Belgium and France
There’s more to say when we look at specific country trends. The 27 members of the European Union bring diversity in habits, languages, and cultures. That also impacted traffic, and this election in particular had a national impact in some of the countries.
In Belgium, national and regional elections took place on the same day, June 9. After polling stations closed at 16:00 local time (14:00 UTC), HTTP requests followed the typical pattern of increasing, peaking at 21:15 local time (19:15 UTC), with 7% more requests than the previous week. This trend was interrupted by Prime Minister Alexander De Croo’s speech at around 22:00 local time (20:00 UTC), admitting defeat in the national elections. This pattern is typical when important announcements are broadcast on TV, impacting Internet traffic.
How about France? President Emmanuel Macron announced at around 21:00 local time (19:00 UTC) that he would dissolve the national parliament for a snap legislative election. This followed the EU elections that gave a victory to his rival Marine Le Pen’s National Rally in the European Parliament vote. At the time of his speech, requests dropped 6% compared to the previous week, and increased right after Macron’s speech, peaking at 22:15 local time (20:15 UTC) with a 6% increase.
After voting ends, traffic increases
It was not only Belgium and France that had typical increases in HTTP requests at night when the first projections and results started to be announced. The same happened in the Netherlands, the first European country to enter the 2024 European Parliament election, on Thursday, June 6.— We have previously written about Dutch political websites being attacked on that day. Traffic was 4% higher than usual after 20:30 local time (18:30 UTC), and peaked at 01:15 with a 15% increase compared to the previous week.
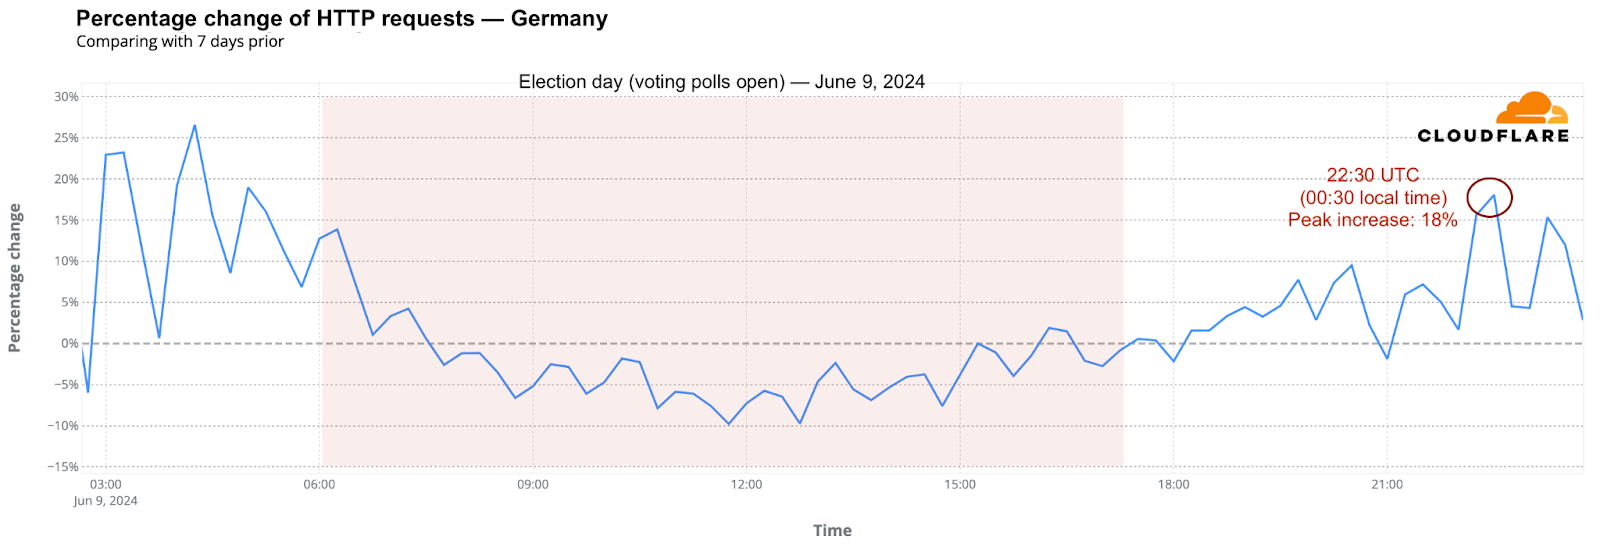
Similar trends were seen in Italy on June 9, and in Germany on the same day. In Germany, at 21:45 (19:45 UTC), requests were already 8% higher, with a 23:00 (21:00 UTC) drop of 2% during election speeches, and a peak at 00:30 (22:30 UTC) with an 18% increase.
The same night-time trends were observed in other countries:
Slovakia had a peak increase of 24% at 23:45 local time (21:45 UTC) on June 8.
Spain saw a 21% peak increase at 21:00 local time (19:00 UTC) on June 9.
Poland had a 9% peak increase at 01:45 local time (23:45 UTC).
Portugal experienced a 29% peak increase at 00:15 local time (23:15 UTC).
Croatia had a 19% peak increase at 23:00 (21:00 UTC).
Slovenia had a 19% peak increase at 22:45 (20:45 UTC).
Lithuania had a 22% peak increase at 23:00 (20:00 UTC).
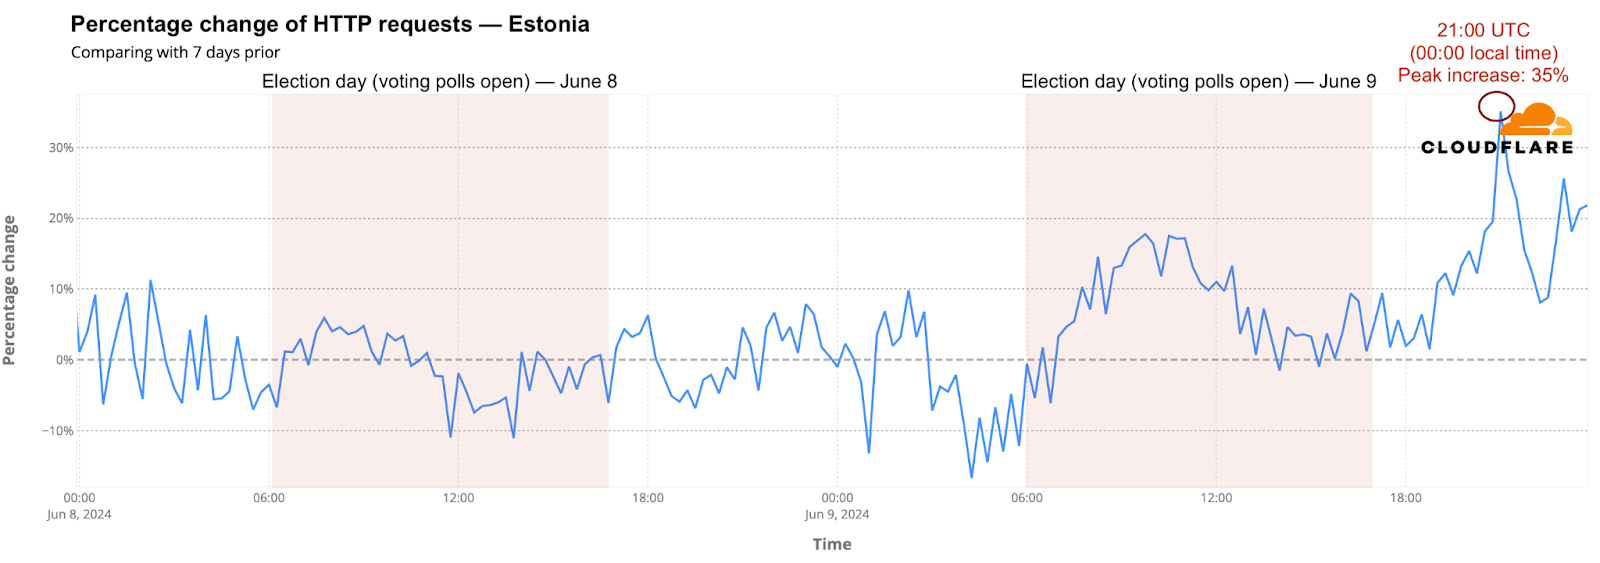
Estonia saw the highest peak increase, reaching 35% at 00:00 (21:00 UTC).
Growing interest in election information and news
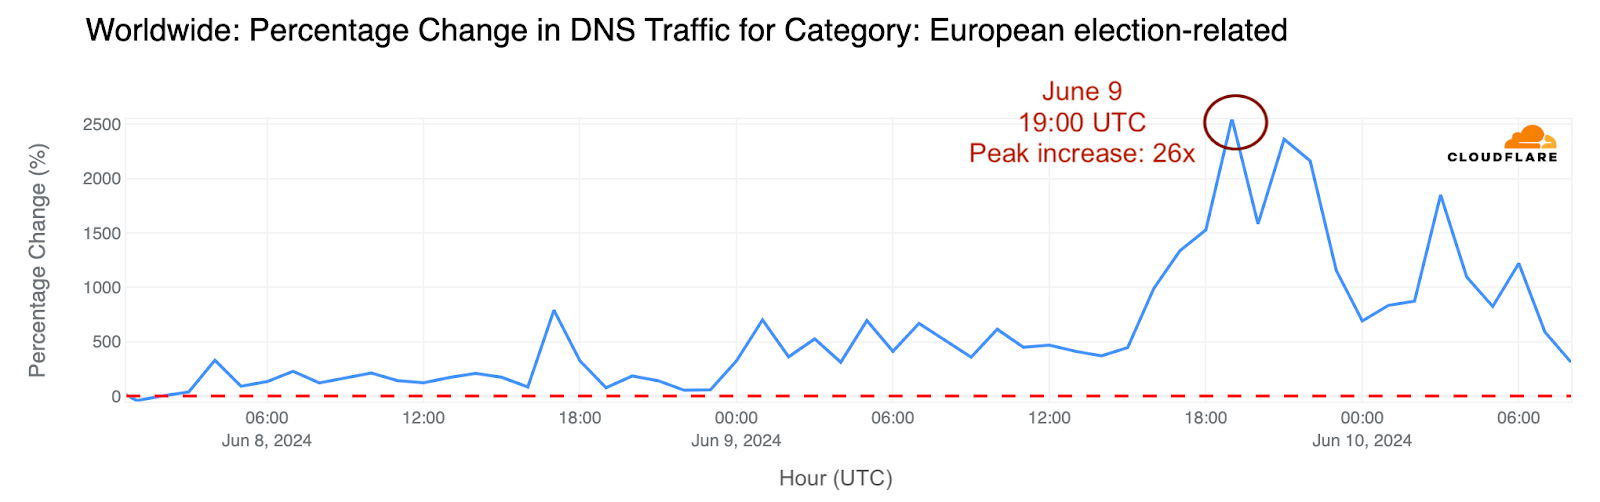
Switching to domain trends, DNS traffic (using our 1.1.1.1 resolver) shows a more specific impact related to elections. Social media platforms invited users in Europe to vote, sometimes giving European or local websites as a reference. Here’s an example from Instagram:
Did this increase traffic to election-related sites in the European Union? Our DNS data shows a 26x peak growth at 19:00 UTC on Sunday, June 9, 2024. DNS traffic was already much higher compared to the previous week on June 8, with a peak growth of 8x at 17:00 UTC.
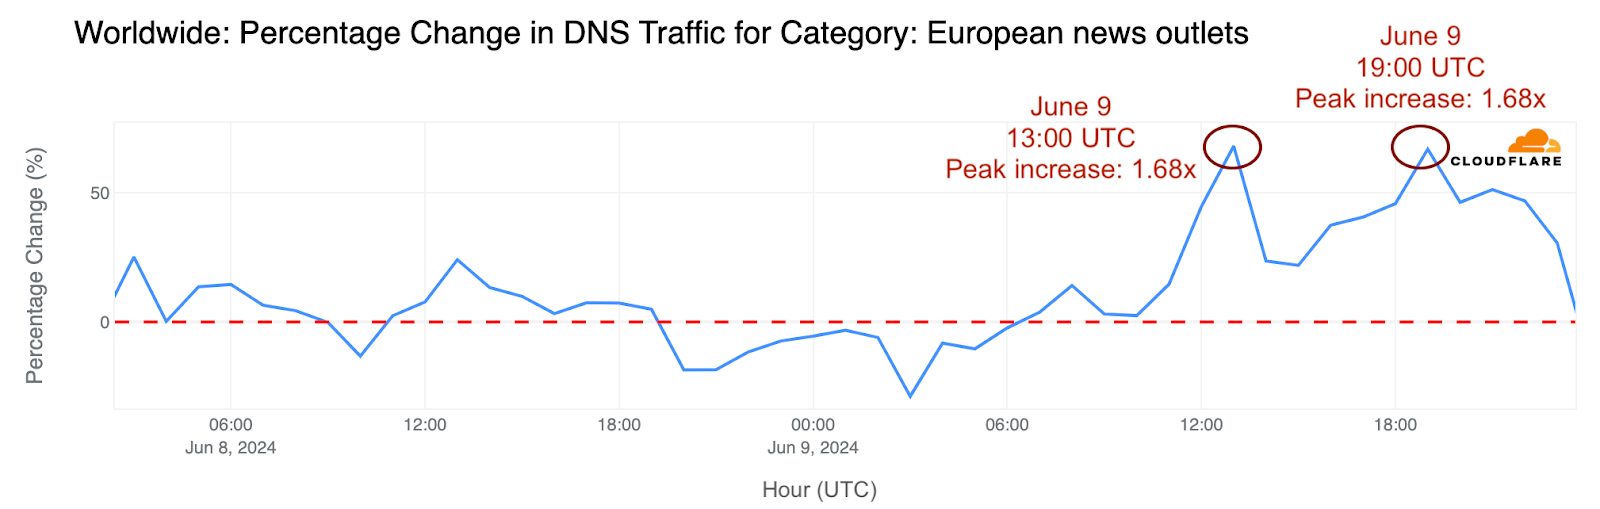
Looking at European news outlets’ domains, there was an initial 1.68x increase (compared to the previous week) at 13:00 UTC on June 9, 2024, and a second peak at 19:00 UTC.
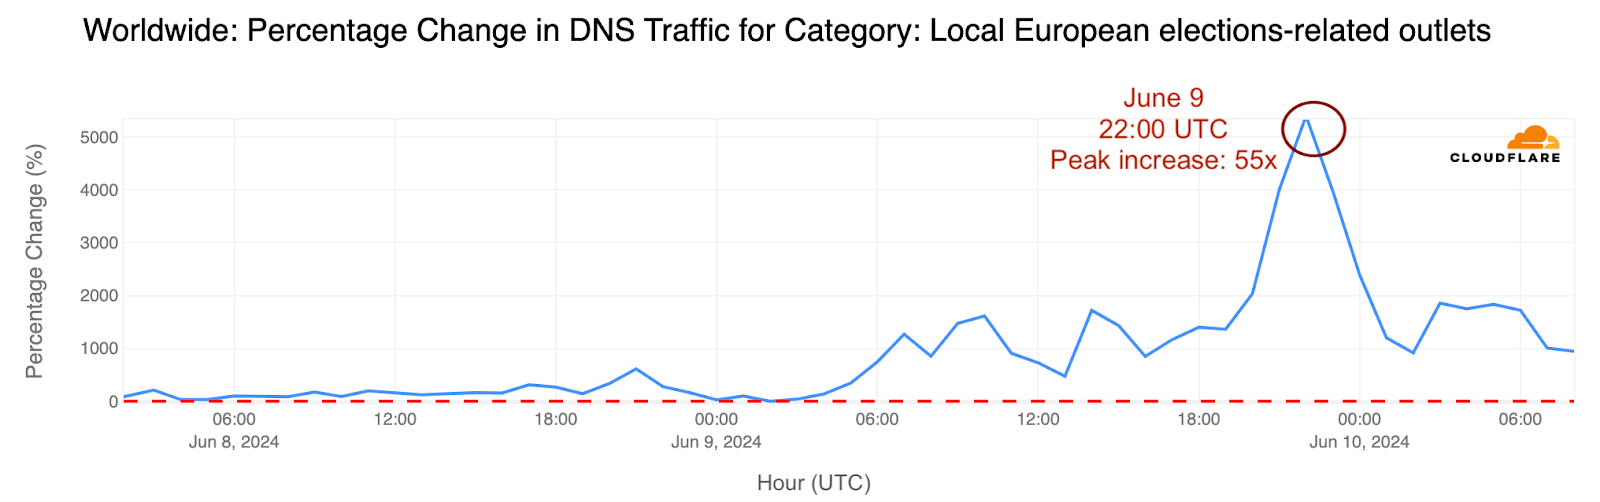
For local election-results sites, there was a significant 55x peak growth at 22:00 UTC on June 9, 2024, compared to the previous week.
Government-focused cyberattacks
Focusing on attacks, as mentioned above, we recently published a blog post about the cyberattack on Dutch political-related websites that lasted two days – June 5 and 6. The main DDoS (Distributed Denial of Service attack) attack on June 5, the day before the Dutch election, reached 73,000 requests per second (rps).
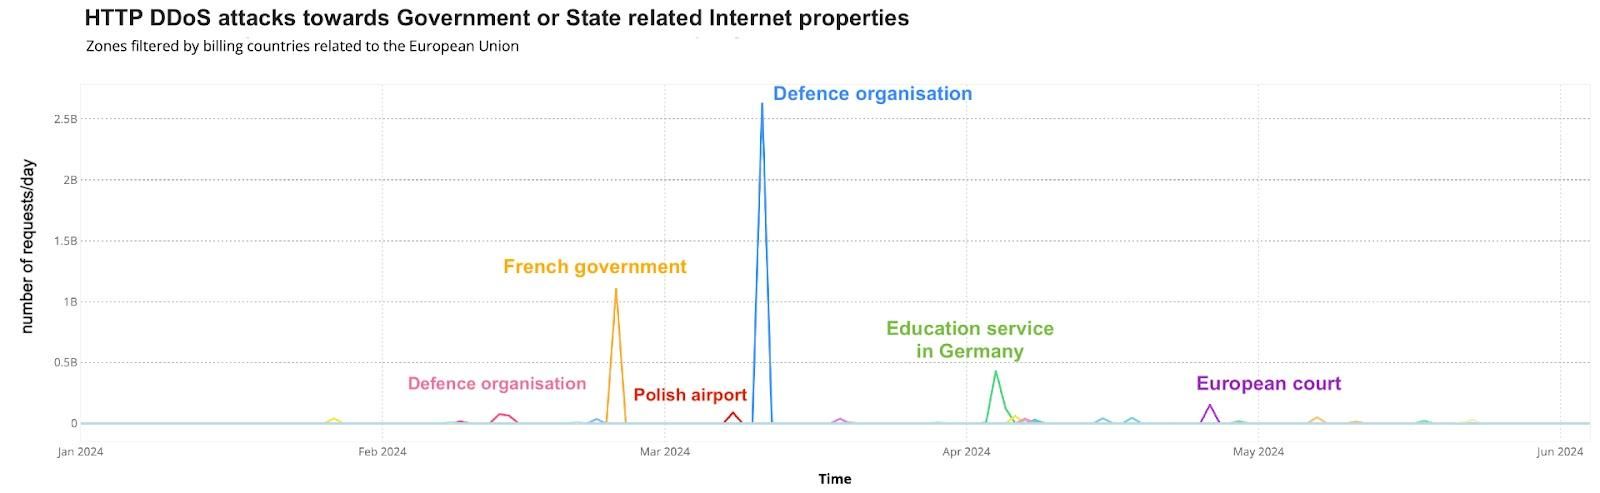
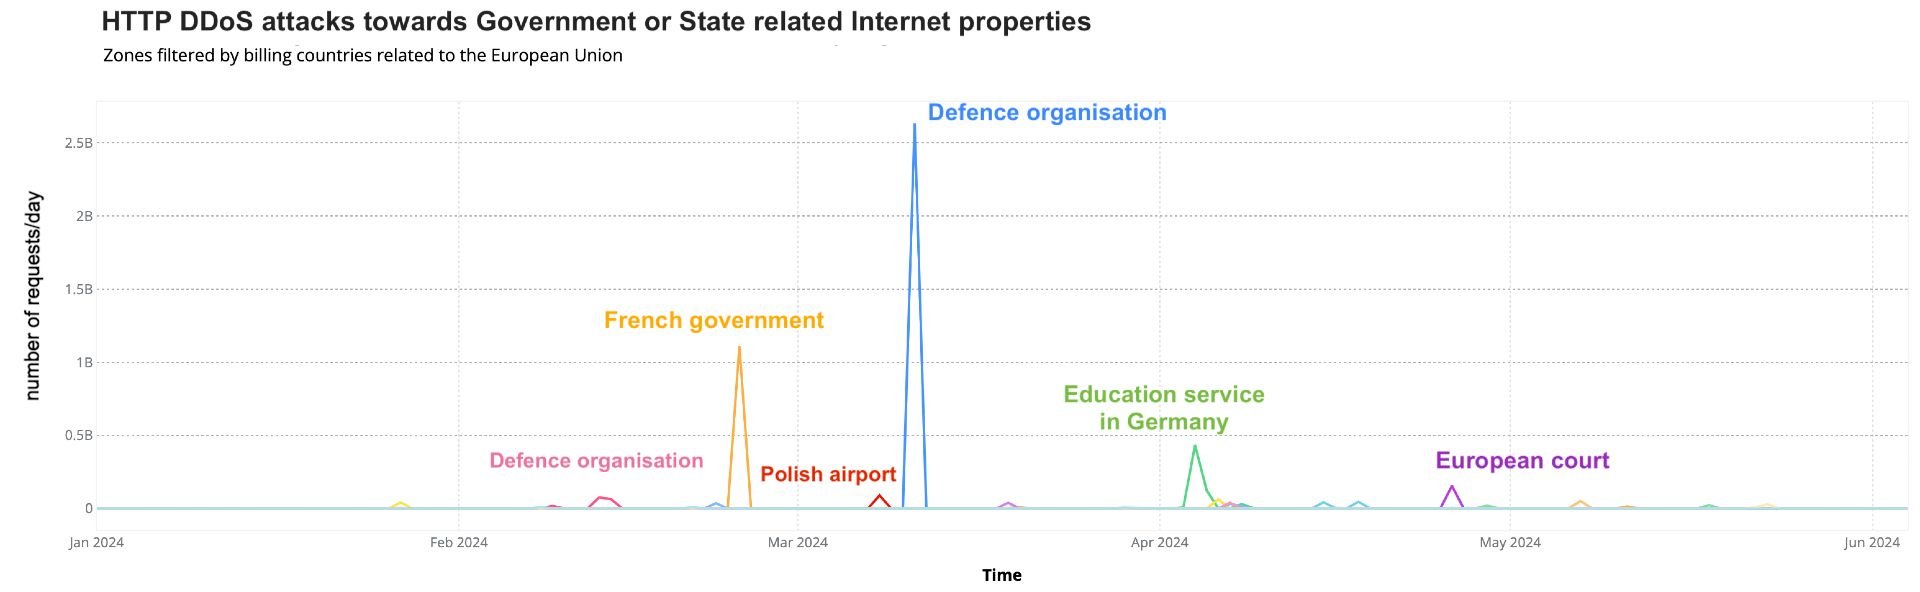
Looking at government or state-related websites in the European Union in 2024, there have been several spikes in attacks targeting defense organizations, European courts, and educational institutions since the year started.
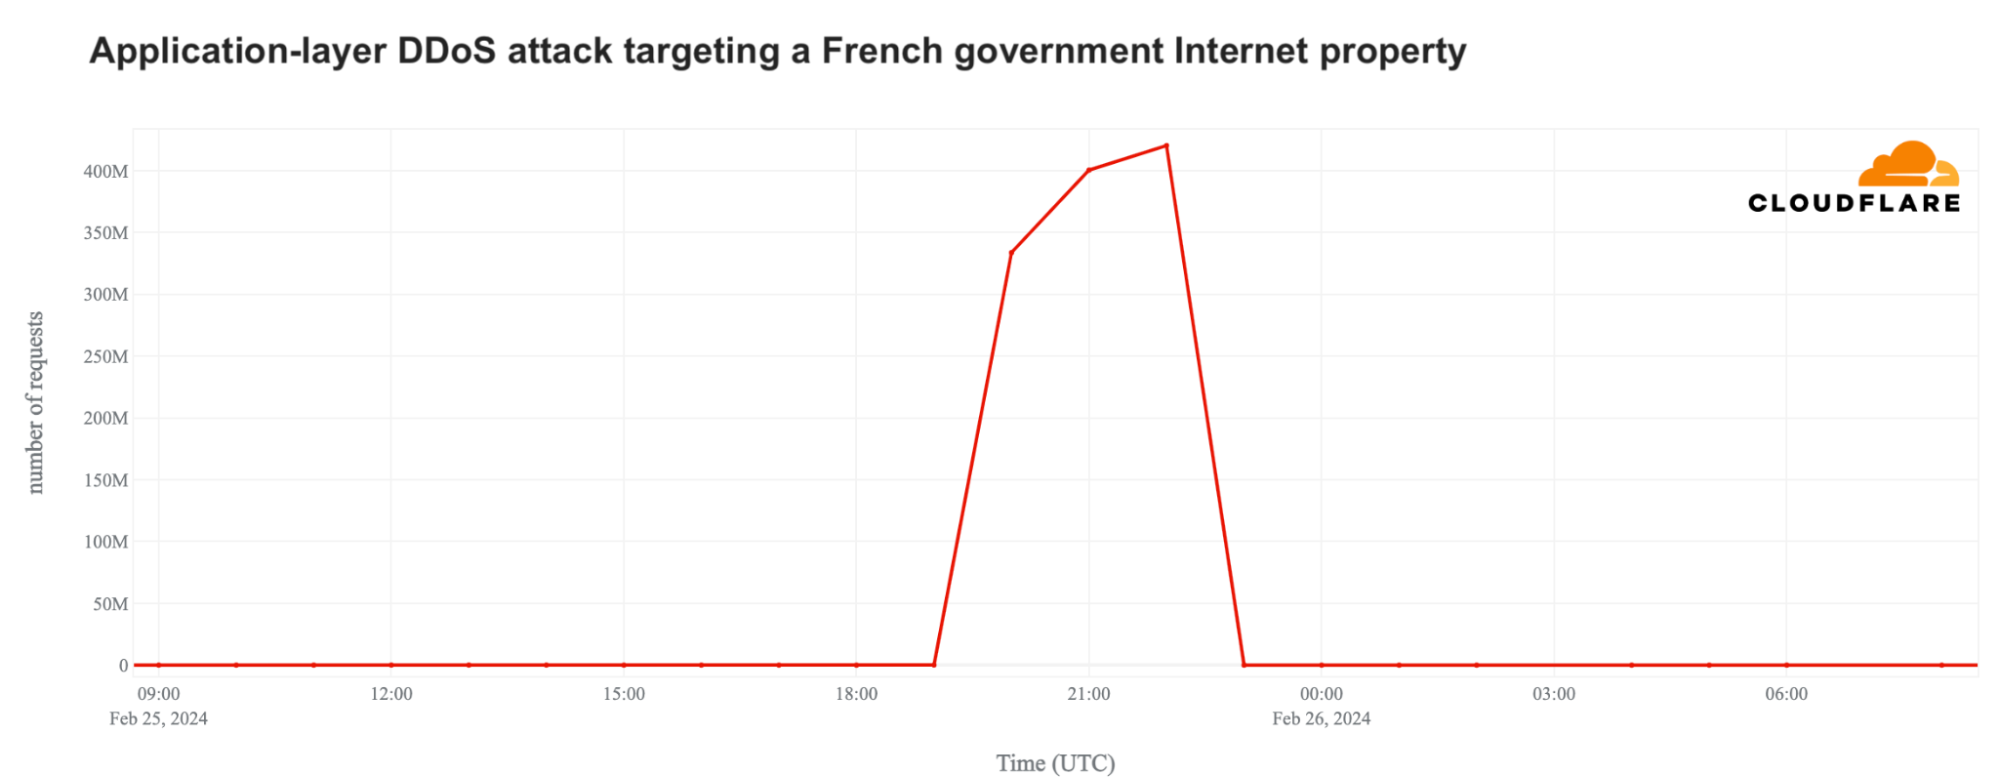
The main one was on February 25, 2024, when Cloudflare blocked a DDoS attack on a French government website that reached 420 million requests per hour and lasted over three hours.
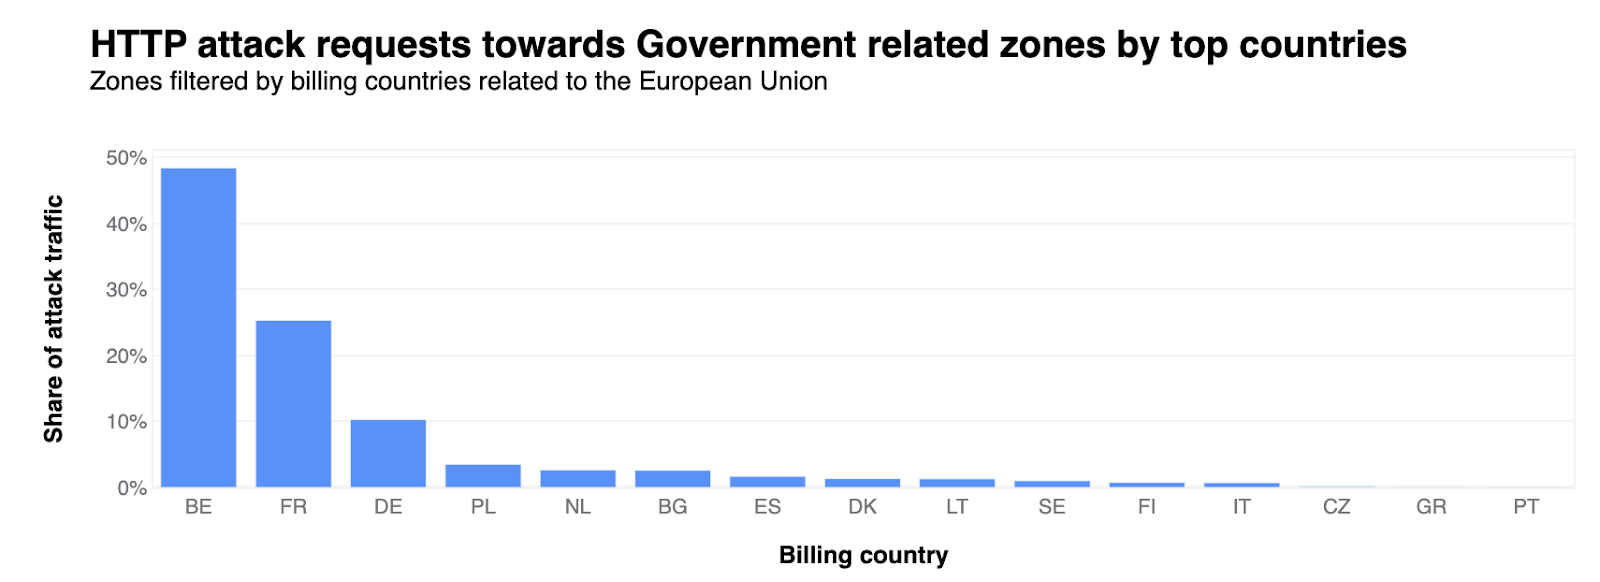
Between January and June 2024, government sites in Belgium, France, and Germany were the main targets, receiving 49%, 25%, and 10% respectively of attack requests targeting EU government-related sites.
In a broader view, from January 1 to June 9, Cloudflare mitigated 8.6 billion threats to government websites in the EU, with 68% of those being DDoS threats. This amounts to an average of 53.42 million threats mitigated per day. These trends highlight the ongoing threat to critical infrastructure across Europe, with government sites frequently targeted by cyberattacks.
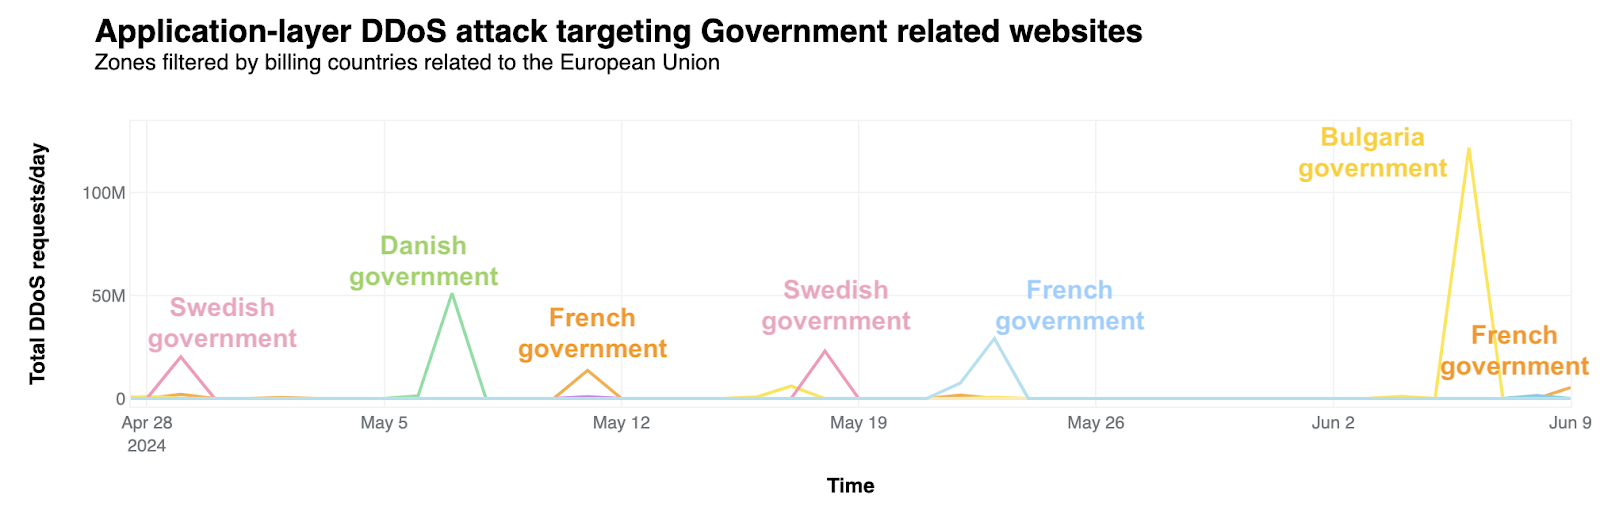
Just before the elections
Focusing on the five weeks before the EU election, we didn’t see significant attacks on European election-related organizations. However, there were a few DDoS threats that targeted government sites from European Union member states. Notable instances include attacks on the Bulgarian government on June 6, the French government on May 11 and June 9, another in France on May 23, Sweden on May 18 and April 29, and Denmark on May 7.
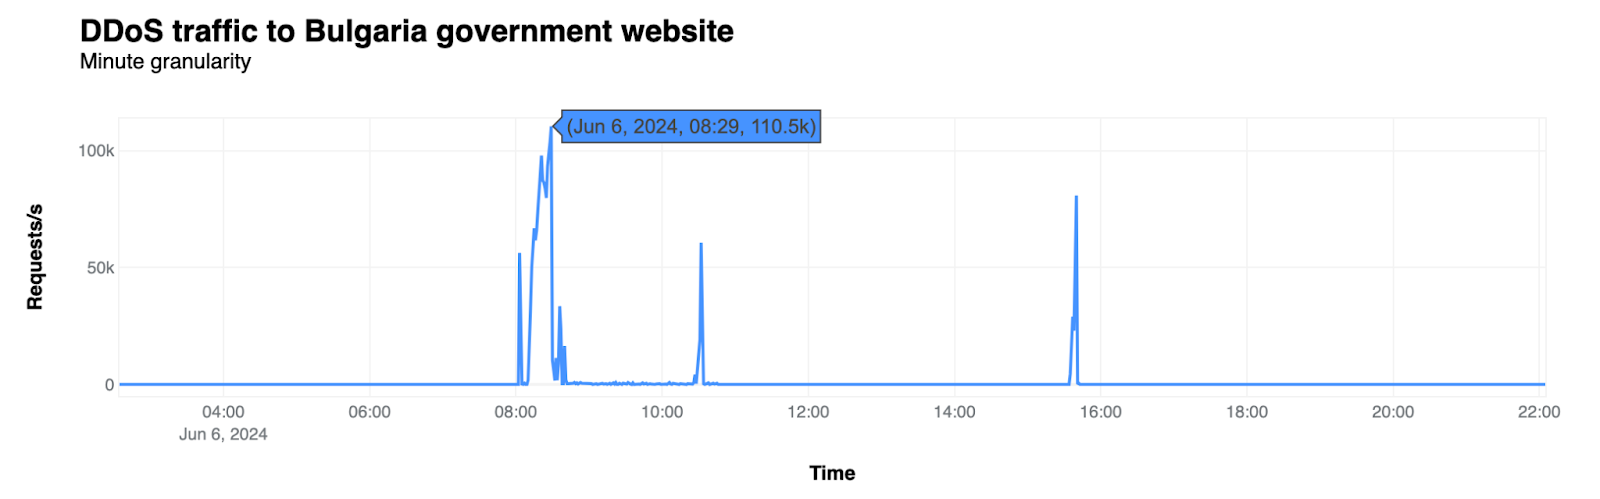
These attacks were not very large compared to others mentioned. The largest targeted the Bulgarian government on June 6, with 122 million daily DDoS requests and a peak of 110,500 requests per second at 11:29 local time (08:29 UTC).
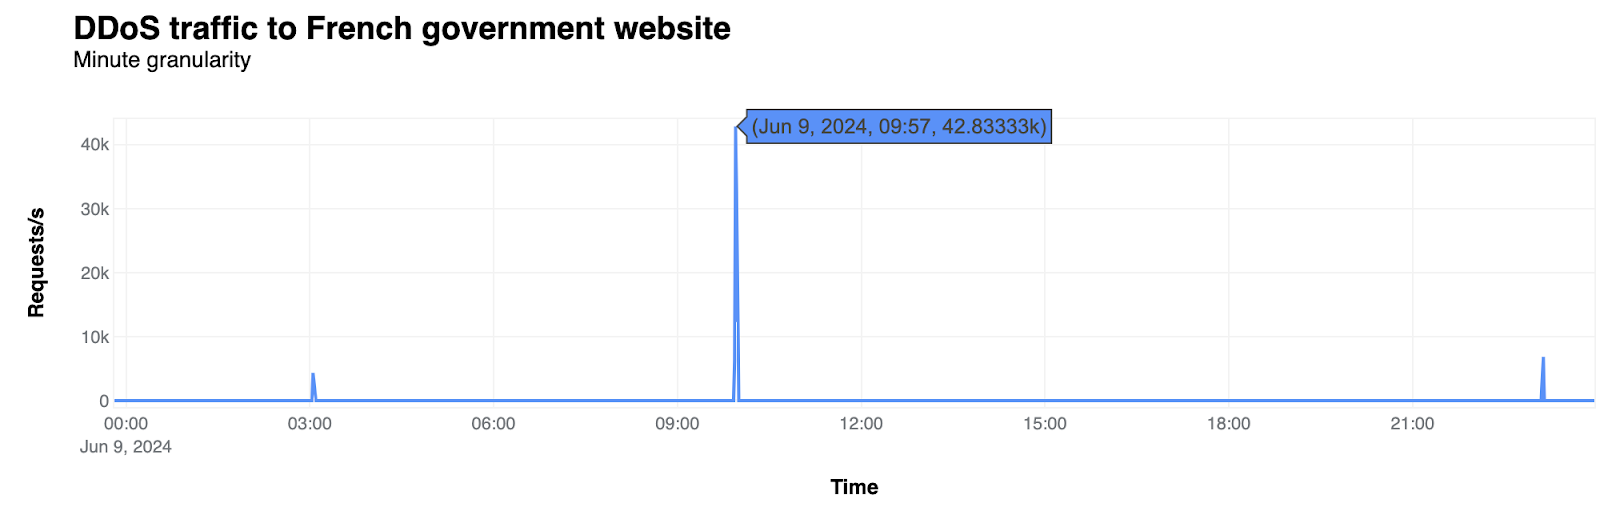
On election day in France, June 9, a French government website was also the target of a smaller attack, with 42,000 DDoS requests per second at 11:57 local time (09:57 UTC).
Conclusion
The 2024 European Parliament election had some clear impacts on Internet traffic, and cyber threats were looming in the weeks before, most notably the Dutch political-related attack around election day.
While voting led to typical drops in Internet traffic, the announcement of results and significant political events caused spikes in activity.
If you want to follow more trends and insights about the Internet and elections in particular, you can check Cloudflare Radar, and more specifically our new 2024 Elections Insights report, that we’re updating as elections take place throughout the year.
2024 is being called by the media “the” year of elections. More voters than ever are going to the polls in at least 60 countries for national elections, plus the 27 member states of the European Union. This includes eight of the world’s 10 most populous nations, impacting around half of the world’s population.
To track and analyze these significant global events, we’ve created the 2024 Election Insights report on Cloudflare Radar, which will be regularly updated as elections take place.
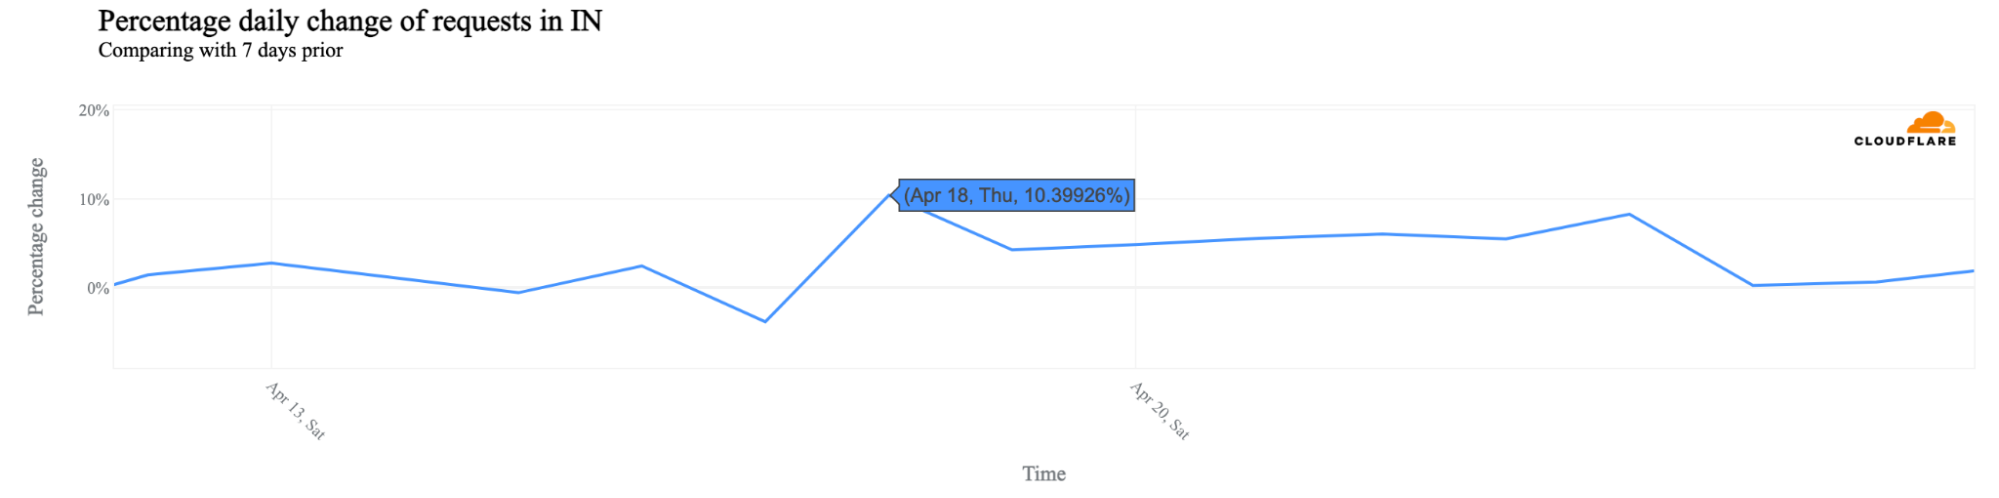
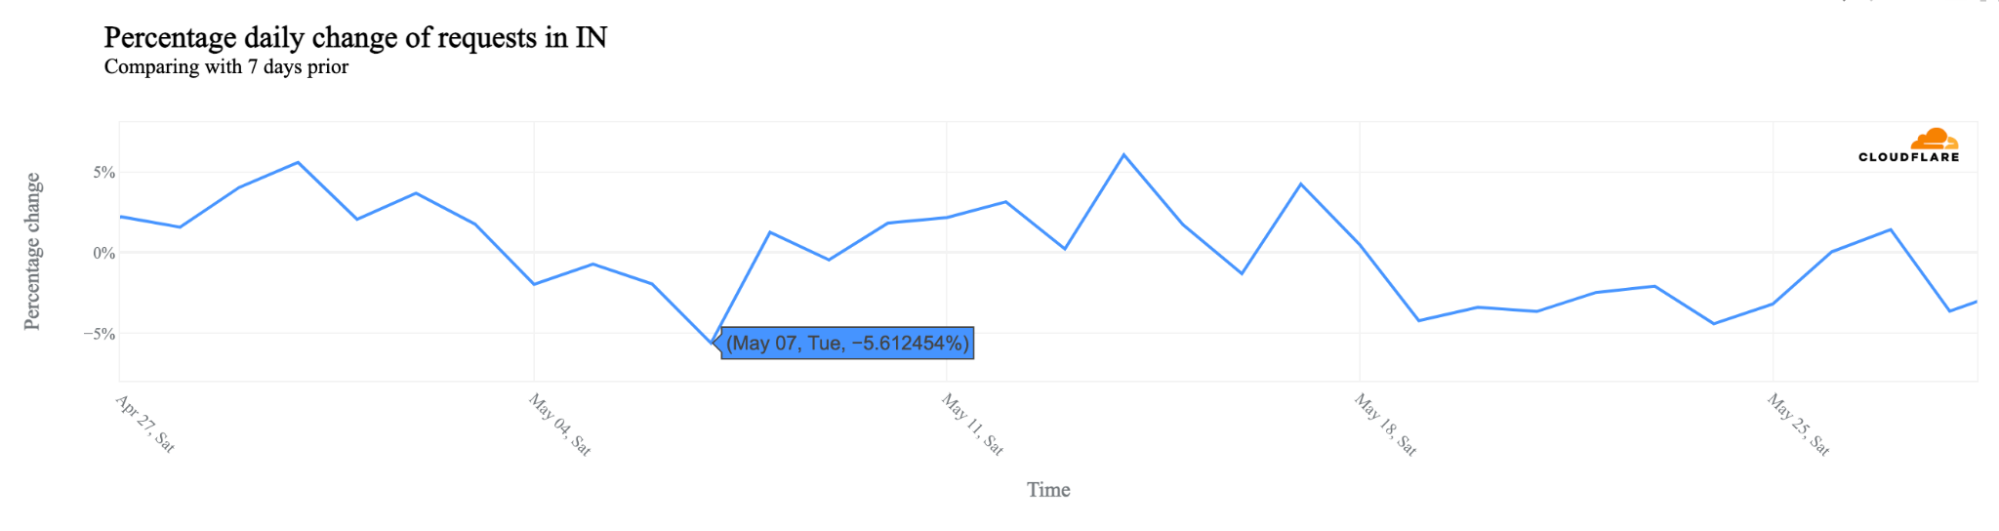
Our data shows that during elections, there is often a decrease in Internet traffic during polling hours, followed by an increase as results are announced. This trend has been observed before in countries like France and Brazil, and more recently in Mexico and India — where elections were held between April 19 and June 1 in seven phases. Some regions, like Comoros and Pakistan, have experienced government-directed Internet disruptions around election time.
Below, you’ll find a review of the trends we saw in elections in South Africa (May 29), to Mexico (June 2), India (April 19 – June 1) and Iceland (June 1). This includes election-related shifts in traffic, as well at attacks. For example, during the European Parliament election (June 6-9, 2024), DDoS attacks targeted Dutch political websites for two days, peaking at 73,000 requests per second.
We’ll also be keeping an eye on upcoming elections. The United Kingdom recently scheduled its general election for July 4, making it the latest addition to the electoral calendar.
Locations with national elections in 2024 (over 60, plus EU elections with 27 countries participating). Including local elections, over 100 countries will hold elections. In several countries, there will be multiple elections in 2024.
Dutch political websites hit by cyber attacks
Europe: 2024 European Parliament election (June 6-9)
As mentioned above, we recently published a blog post about the cyber attack on Dutch political-related websites. The 2024 European Parliament election started in the Netherlands on June 6, and continues through June 9 in the other 26 countries that are part of the European Union. Cloudflare observed DDoS attacks targeting multiple election or politically-related Internet properties on election day in the Netherlands, as well as the preceding day.
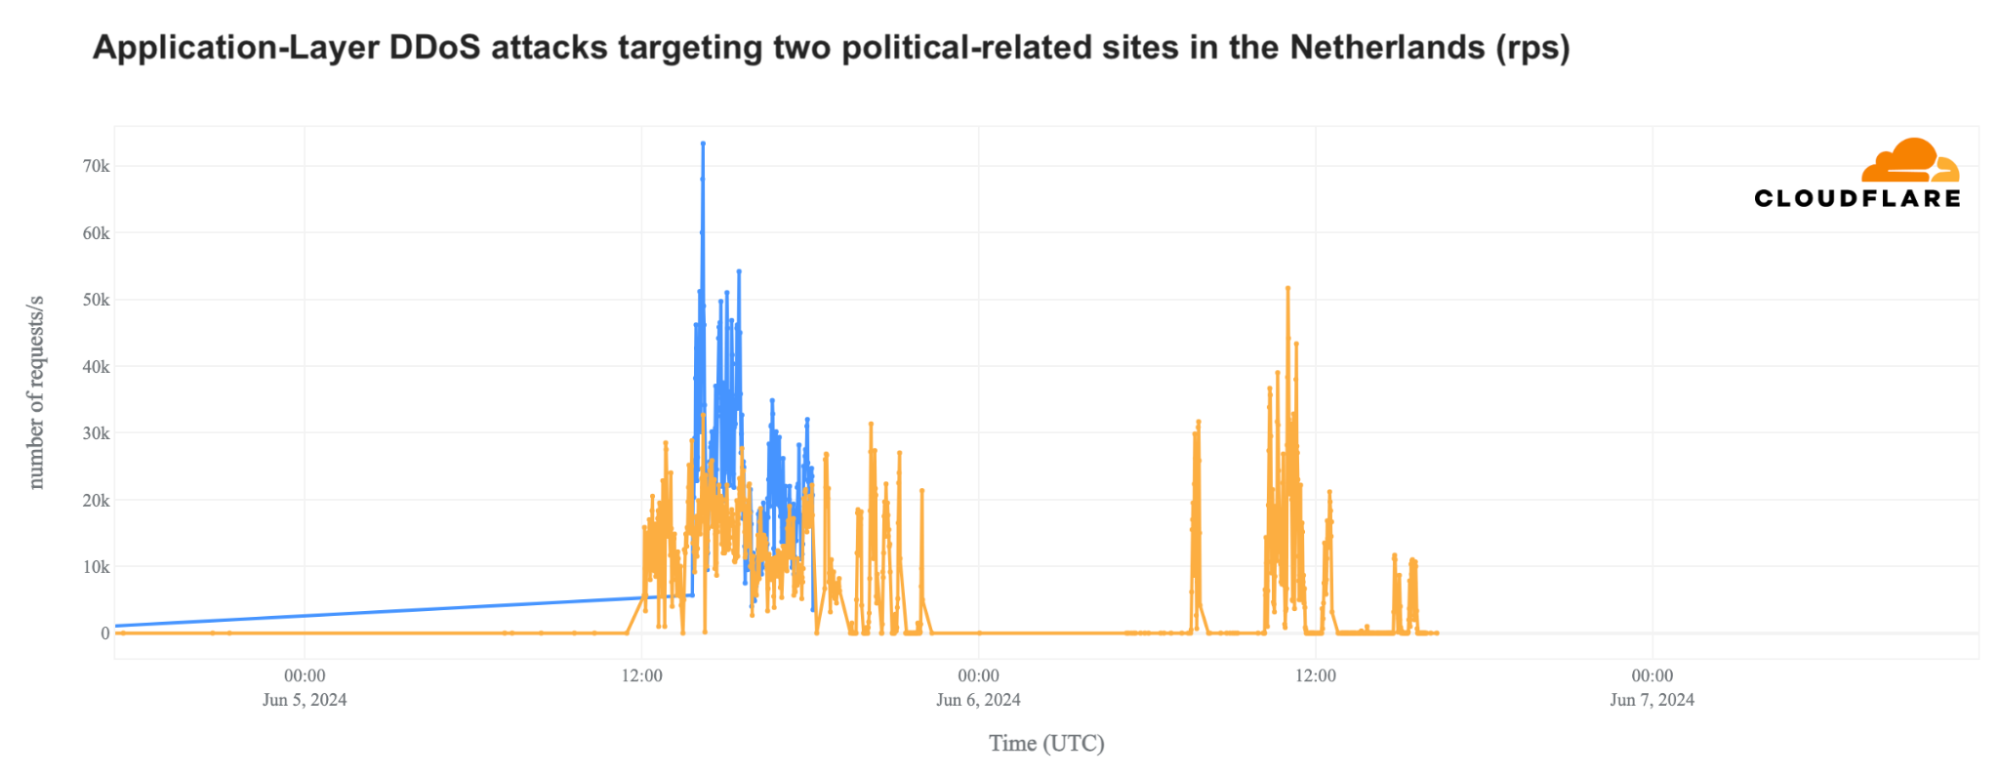
The main June 5 DDoS attack on one of the websites peaked at 14:13 UTC (16:13 local time), reaching 73,000 requests per second (rps) in an attack that lasted for a few hours. This attack is illustrated by the blue line in the graph below, which shows that it ramped slowly over the first half of the day, and then appeared to abruptly stop at 18:06. And on June 6, the main attack on the second website peaked at 11:01 UTC (13:01 local time) with 52,000 rps.
In Europe, cyberattacks have been a significant issue. In March 2024, French government websites faced attacks of “unprecedented intensity,” according to a spokesperson. Just days earlier, on February 25, 2024, Cloudflare blocked a major DDoS attack on a French government website, which reached 420 million requests per hour and lasted over three hours.
Looking at government or state-related websites in the European Union in 2024, there have been several spikes in attacks targeting defense organizations, European courts, and educational institutions.
These incidents highlight the ongoing threat to critical infrastructure across Europe, with government sites frequently targeted by cyberattacks.
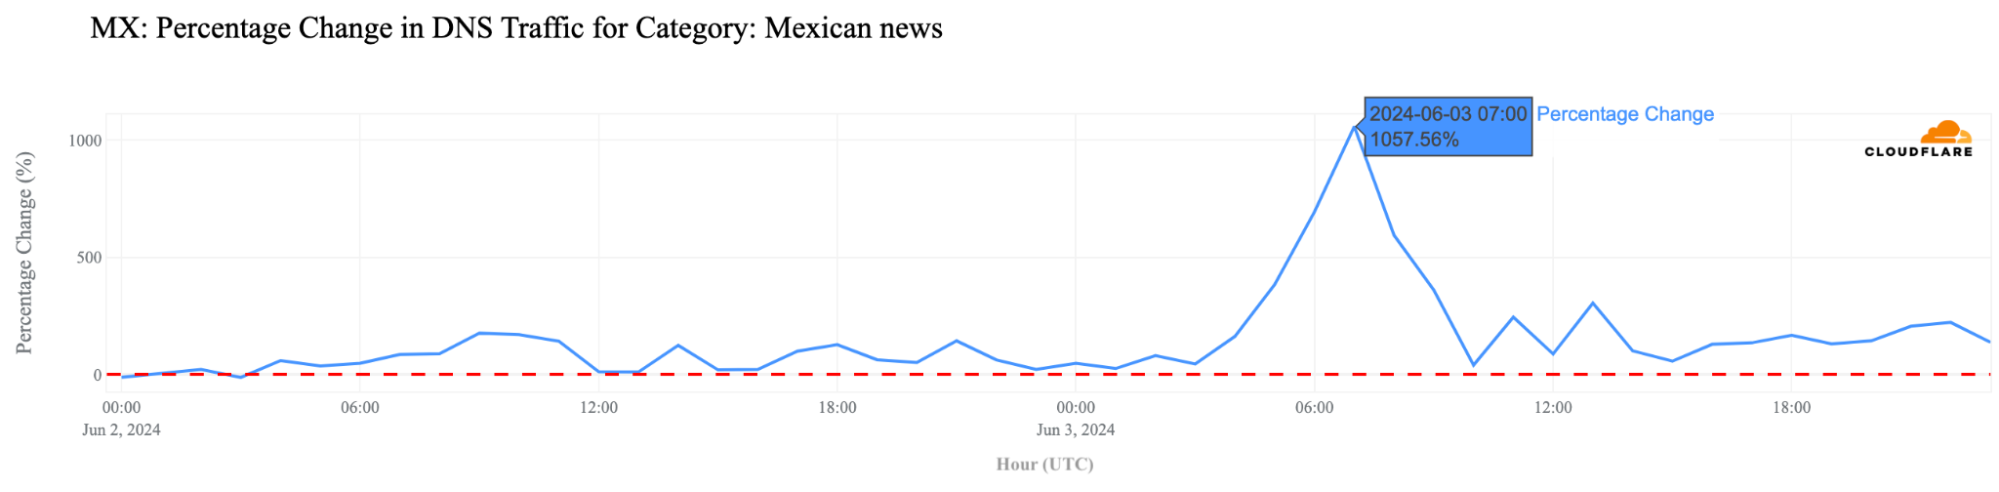
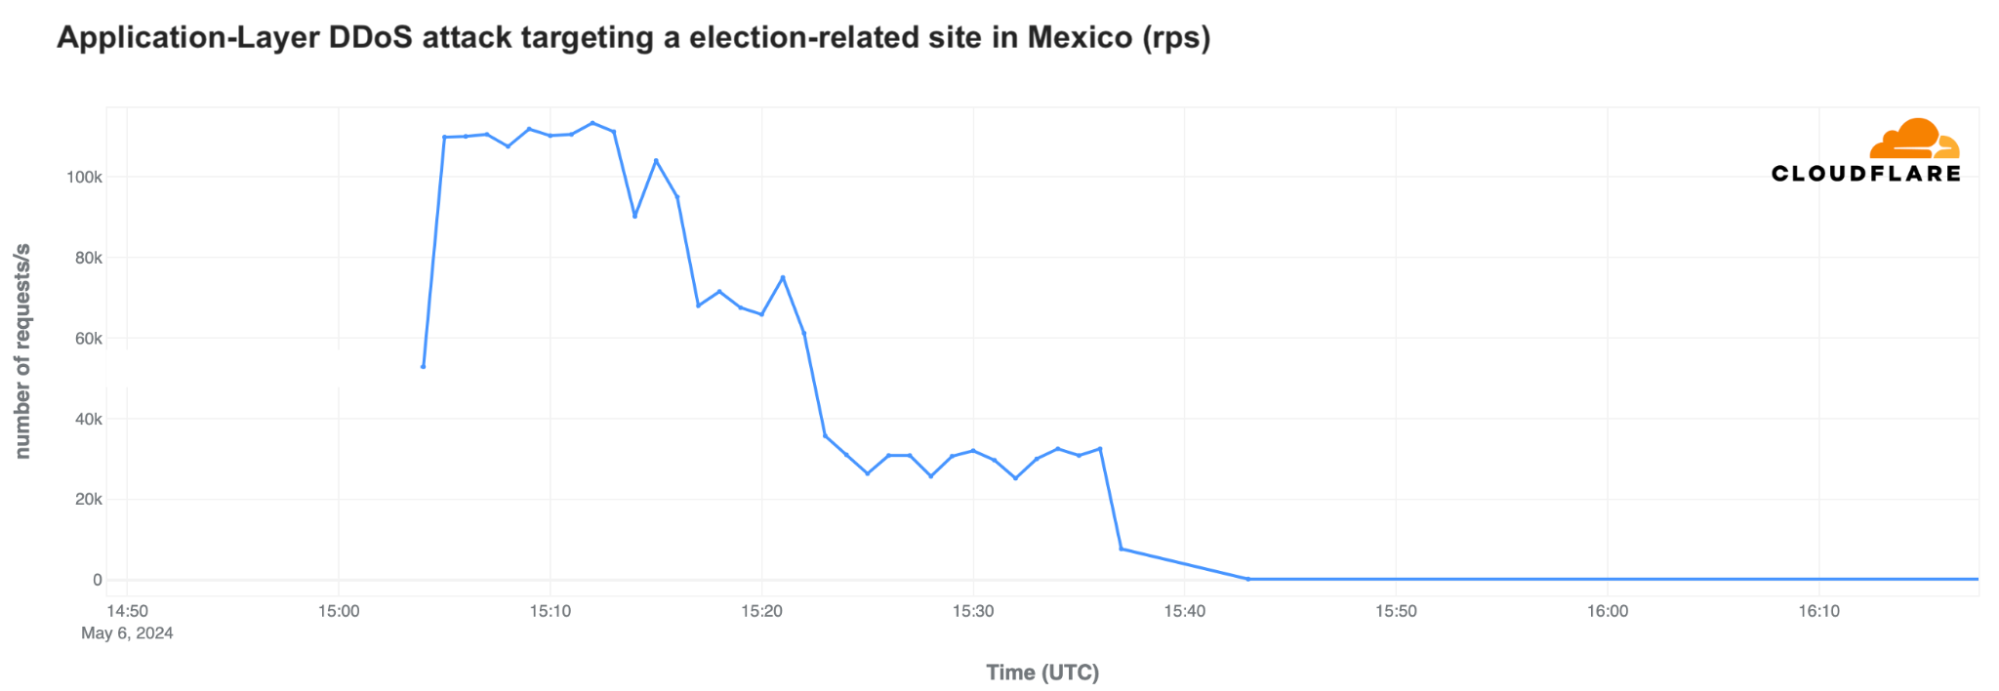
Mexicans go offline: early traffic drops on election day
Mexico: Presidential, Senate, and Chamber of Deputies elections (June 2)
General elections were held in Mexico on Sunday, June 2, 2024, resulting in the election of the first female president, Claudia Sheinbaum, from the Morena political party. Cloudflare data shows a typical election day pattern in Mexico, mirroring trends seen in other countries: when polling stations are open, HTTP requests dip below normal levels. On June 2, traffic decreased between 08:00 and 20:00 CST (14:00 and 02:00 UTC), gradually recovering afterward as polling stations closed at 18:00 CST. Throughout the day, traffic experienced drops of up to 11% at 09:30 and 13:00 CST, with daily traffic decreasing by 3%.
The first official results were released after 23:00 (05:00 UTC in the chart above), coinciding with an 8% increase in traffic compared to the previous week. This growth peaked at 01:30 (07:30 UTC), with a 14% surge in HTTP requests, maintaining elevated levels until 07:30 in Mexico.
A similar trend was observed at the state level, with the period between 10:00 CST and 14:00 being the one with the most significant drop in traffic, with voting taking place all over the country.
(We provide a full table of the biggest drops in traffic and the specific time of that drop on election day by Mexican state in our Radar 2024 Election Insightsreport).
Website trends: traffic spikes from news and election results
Switching to domain trends, DNS traffic (using our 1.1.1.1 resolver) to election results sites in Mexico grew by almost 116x compared to the previous week, peaking at 20:00 CST (02:00 UTC), and remained up to 80x higher, until 23:00 CST (05:00 UTC).
Examining news media outlets, there was noticeable growth in DNS queries on Election Day, June 2, with traffic significantly higher than the previous week in the early morning. By 20:00 CST (02:00 UTC), traffic surged to 1.8x higher, then skyrocketed to a 4.8x increase by 23:00 CST (05:00 UTC), reaching a peak at 01:00 CST (07:00 UTC) with a staggering 1057% more DNS traffic than the previous week.
Attacks: early May election-related DDoS spike
We didn’t see any unusual attacks targeting Mexico before the election, except for one targeting a state electoral organization. A specific DDoS attack on May 6 targeted a state electoral organization, reaching 130 million HTTP requests per hour, with a peak of 113,000 requests per second at 09:12 CST (15:12 UTC). The attack lasted about 30 minutes.
India’s elections: 44 days of traffic dips and mobile spikes
India: General election (April 19 – June 1)
In India, general elections were held from April 19 to June 1, 2024 in seven phases, with incumbent Prime Minister Narendra Modi winning by a smaller margin than in the previous election. More than 968 million people out of a population of 1.4 billion were eligible to vote, and there was a 66% turnout, making it the largest election in human history.
Not all states voted on the same days, leading to mixed HTTP request patterns. On April 18, the day before the first election day, traffic was 10% higher than the previous week, marking the biggest increase of the year, something we’ve seen in other elections.
Some of the seven election days had a nationwide impact. Not all states in India voted on the same days. However, days with more constituencies or populous states participating saw bigger traffic changes. For example, May 7, 2024, saw 11 states, including the most populous ones, voting. This day (highlighted in the next chart) experienced the biggest nationwide drop in traffic, with a 6% decrease compared to the previous week. May 20 and May 25 also saw drops of 4% and 3%, respectively.
The period between 15:30 and 19:30 local time (10:00 – 14:00 UTC) typically witnessed the most significant drop in traffic on election days.
In Uttar Pradesh, the most populous Indian state, the first day of elections on April 19 saw the biggest drop (9%). May 20 and 25, with more constituencies voting, also experienced significant traffic drops, especially May 20, with traffic lower than usual between 10:30 and 22:30 UTC (05:00 – 17:00 UTC), and a 5% daily drop compared to the previous week.
In Maharashtra, home to the capital Mumbai, May 20 saw the most impact, with a 17% drop in daily traffic compared to the previous week. On this day, traffic hit its lowest point at 14:30 local time (09:00 UTC), with a drop of approximately 20%.
(We provide a full table of the states in India with the biggest drop in daily traffic over the several election days in our Radar 2024 Election Insightsreport).
Mobile devices first in India
India is a mobile-first country, with most election days during the week. On weekends, mobile devices are used more, especially on Sundays when they can reach 69% of all traffic. During the week, usage is typically between 61% and 62%. On election days, mobile device usage increased to around 64%.
Saturday, June 1, 2024, the last election day, was the Saturday of the year in India with the highest daily mobile device traffic percentage, reaching 68% (typically around 65-66%).
The increase in mobile device usage on election days was more noticeable during the day, particularly between 10:00 and 13:00 local time (04:30 – 07:30 UTC). May 13 and May 20 showed the biggest differences compared to typical days, reaching up to 62% during those times. In India, mobile usage during weekends is higher at night than during the day.
Attacks
Since April 2024, Cloudflare hasn’t observed any unusual or potentially election-related attacks targeting India. However, there have been large attacks on online financial services, consulting firms, and online casinos. The most targeted industries during this period have been Information Technology and Services, BFSI (Banking, Financial Services, and Insurance), and Gaming/Gambling.
Iceland’s 2024 election: impact before and after extended voting day
Iceland: Presidential election (June 1)
Iceland held its presidential election on Saturday, June 1, 2024, and Halla Tómasdóttir was elected as the new president. She is the second woman to become president in Iceland and the fourth woman to hold a top leadership position, including prime ministers.
In terms of HTTP requests, there wasn’t much change during election day. This might be because polling stations in Iceland were open from 09:00 to 22:00 local time (same as UTC), spreading out the impact. However, traffic increased the days before and after the election.
On May 31, the day before the election, daily traffic in Iceland was 7% lower than the previous week. It remained stable on election day and increased by 14% on Sunday when results were announced. This increase was only surpassed by two days in 2024:
May 2: +17%, driven by a 9% drop the previous week due to the national holiday, the first day of summer.
March 19: +16%, due to a volcanic eruption that led to a state of emergency, evacuations, and road closures.
Looking deeper into election day traffic with 15-minute granularity, traffic was around 12% lower between 14:00 and 16:00 local time (same as UTC), with the biggest drop, 20%, at 15:30.
Mobile devices usage changes
June 2 and June 1, election day, were also the days in 2024 with the highest percentage of mobile device usage in Iceland, at 47% and 45%, respectively. June 1’s percentage is tied with March 2, the day the famous Blue Lagoon was evacuated due to nearby seismic activity suggesting an “imminent” volcanic eruption, and January 1, the first day of the year.
Attacks
Cloudflare didn’t observe any relevant attacks during the election period targeting Iceland and its Internet properties. Since the beginning of April 2024, the most attacked industries were Retail and Gaming.
South Africa: traffic surges pre-voting, 16% decrease during voting
South Africa: 2024 general election (May 29)
On general election day in South Africa, which took place on Wednesday, May 29, 2024, HTTP requests dipped while polling stations were open. Traffic remained lower than usual from around 05:30 local time (03:30 UTC), with a 16% drop observed at 05:45 (03:45 UTC) and a 14% decrease by 11:00 (09:00 UTC), persisting until 18:00 (16:00 UTC).
However, as shown in the chart above, the night leading up to the election saw a traffic surge, peaking at a 25% increase around midnight local time (22:00 UTC). Following the election, traffic rose compared to the previous week, with a 6% increase at 23:30 local time and a 12% to 8% rise around 04:00 and 09:00 local time (02:00 – 07:00 UTC) on May 30.
Daily traffic overall was 6% lower than the previous week, with mobile device usage increasing to 63%, compared to 57% the previous week.
Attacks: news under attack
Cloudflare didn’t detect any major threats targeting government or election-related online platforms. However, in the lead-up to election day, on May 7, a significant DDoS attack targeted a major news site in South Africa, with 773 million daily requests. This attack peaked at 16:06 local time (14:06 UTC) with 54,000 requests per second and continued in the following days.
Geopolitics are here to stay
Elections, geopolitical changes, and disputes impact the online world. Our DDoS threat report for Q1 2024 gives a few recent examples. One notable case was the 466% surge in DDoS attacks on Sweden after its acceptance into the NATO alliance, mirroring the pattern observed during Finland’s NATO accession in 2023.
Real-world conflicts and wars often lead to Internet pattern changes, disruptions, or cyberattacks. For instance, during the first year of the war in Ukraine, and more recently, Cloudflare’s Cloudforce One thwarted a phishing attack by the Russia-aligned threat actor FlyingYeti. Our recent Project Galileo blog post also details how we protected Meduza, an independent news outlet focused on Russia, from online attacks in late 2023.
We’ve also reported (1, 2) on Internet changes, disruptions, and increased cyberattacks following the start of the Israel-Hamas war on October 7, 2023. If you want to follow more trends and insights about the Internet and elections in particular, you can check Cloudflare Radar, and more specifically our new 2024 Elections Insights report, that we’re updating as national and European elections take place throughout the year.
The 2024 European Parliament election started in the Netherlands today, June 6, 2024, and will continue through June 9 in the other 26 countries that are part of the European Union. Cloudflare observed DDoS attacks targeting multiple election or politically-related Internet properties on election day in the Netherlands, as well as the preceding day.
These elections are highly anticipated. It’s also the first European election without the UK after Brexit.
According to news reports, several websites of political parties in the Netherlands suffered cyberattacks on Thursday, with a pro-Russian hacker group called HackNeT claiming responsibility.
On June 5 and 6, 2024, Cloudflare systems automatically detected and mitigated DDoS attacks that targeted at least three politically-related Dutch websites. Significant attack activity targeted two of them, and is described below.
A DDoS attack, short for Distributed Denial of Service attack, is a type of cyber attack that aims to take down or disrupt Internet services such as websites or mobile apps and make them unavailable for users. DDoS attacks are usually done by flooding the victim’s server with more traffic than it can handle. To learn more about DDoS attacks and other types of attacks, visit our Learning Center.
Attackers typically use DDoS attacks but also exploit other vulnerabilities and types of attacks simultaneously.
Daily DDoS mitigations on June 5 reached over 1 billion HTTP requests in the Netherlands, most of which targeted two election or political party websites. The attack continued on June 6. Attacks on one website peaked on June 5 at 14:00 UTC (16:00 local time) with 115 million requests per hour, with the attack lasting around four hours. Attacks on another politically-related website peaked at the same time at 65 million requests per hour.
On June 6, the first politically-related site with the highest peak on June 5 referenced above was attacked again for several hours. The main attack peak occurred at 11:00 UTC (13:00 local time), with 44 million requests per hour.
The main June 5 DDoS attack on one of the websites peaked at 14:13 UTC (16:13 local time), reaching 73,000 requests per second (rps) in an attack that lasted for a few hours. This attack is illustrated by the blue line in the graph below, which shows that it ramped slowly over the first half of the day, and then appeared to abruptly stop at 18:06. And on June 6, the main attack on the second website peaked at 11:01 UTC (13:01 local time) with 52,000 rps.
Geopolitical motivations
Elections, geopolitical changes, and disputes also impact the online world and cyberattacks. Our DDoS threat report for Q1 2024 gives a few recent examples. One notable case was the 466% surge in DDoS attacks on Sweden after its acceptance into the NATO alliance, mirroring the pattern observed during Finland’s NATO accession in 2023.
As we’ve seen in recent years, real-world conflicts, disputed and highly anticipated elections, and wars are always accompanied by cyberattacks. We reported (1, 2) on an increase in cyberattacks following the start of the Israel-Hamas war on October 7, 2023. We’ve put together a list of recommendations to optimize your defenses against DDoS attacks, and you can also follow our step-by-step wizards to secure your applications and prevent DDoS attacks.
If you want to follow more trends and insights about the Internet and elections in particular, you can check Cloudflare Radar, and more specifically our new 2024 Elections Insights report, that we’re keeping up to date as national elections take place throughout the year.
(UPDATED on April 15, 2024, with information regarding the Palestinian territories.)
As news came on Saturday, April 13, 2024, that Iran was launching a coordinated retaliatory attack on Israel, we took a closer look at the potential impact on Internet traffic and attacks. So far, we have seen some traffic shifts in both Israel and Iran, but we haven’t seen a coordinated large cyberattack on Israeli domains protected by Cloudflare.
First, let’s discuss general Internet traffic patterns. Following reports of attacks with drones, cruise missiles, and ballistic missiles, confirmed by Israeli and US authorities, Internet traffic in Israel surged after 02:00 local time on Saturday, April 13 (23:00 UTC on April 12), peaking at 75% higher than in the previous week around 02:30 (23:30 UTC) as people sought news updates. This traffic spike was predominantly driven by mobile device usage, accounting for 62% of all traffic from Israel at that time. Traffic remained higher than usual during Sunday.
Around that time, at 02:00 local time (23:00 UTC), the IDF (Israel Defense Forces) posted on X that sirens were sounding across Israel because of an imminent attack from Iran.
(April 15 UPDATE: the Palestinian territories related part). At around the same time, 01:25 local time (22:45 UTC), when the sirens were sounding in Israel, we observed not an increase, but a clear drop in traffic in Palestinian territories. The noticeable drop was seen in all of the Palestinian governorates, although it was a bigger drop in the West Bank, than in the Gaza Strip.
Usually, based on our past observations, drops in traffic unrelated to connectivity issues can occur when people pause their online activities for some reason (an eclipse or war, for example) or turn to television for news updates instead of the Internet (common during election days when TVs broadcast the latest exit polls).
Here’s the noticeable HTTP requests drop in Hebron, one of the most populated states of the Palestinian territories, part of the West Bank. The noticeable drops in the blue line from the previous week are related to the Ramadan, and the Iftar, the first meal after sunset that breaks the fast and often also a family or community event. Ramadan ended on Tuesday, April 9, 2024.
Meanwhile, in Iran, there has been a noticeable decline in traffic over the past few days in the early morning hours, around 04:30 local time (01:00 UTC), as compared to the previous week. However, this decline appears to be linked to the conclusion of Ramadan, which ended April 9. As we have writtenbefore, during Ramadan, there is typically an increase in traffic around 04:00 in most Muslim countries for Suhur, the pre-dawn meal. Nevertheless, traffic was higher in Iran early in the morning of Sunday, April 14 than the previous day, between 02:30 local time (23:00 UTC on April 13) and 07:00 (03:30 UTC).
When analyzing application layer attacks, we haven’t observed any significant changes in those targeting Israel over the past few days. However, over the past month, the Government Administration sector emerged as the most targeted industry, with blocked DDoS requests accounting for 46% of all traffic directed towards it.
Based on Cloudflare data, we have not yet seen a coordinated cyberattack campaign targeting Israel. However, we saw a clear uptick in attacks back in October 2023, after the Israel-Hamas war started, as we noted in a blog post at that time.
A photo of the eclipse taken by Bryton Herdes, a member of our Network team, in Southern Illinois.
There are events that unite people, like a total solar eclipse, reminding us, humans living on planet Earth, of our shared dependence on the sun. Excitement was obvious in Mexico, several US states, and Canada during the total solar eclipse that occurred on April 8, 2024. Dubbed the Great North American Eclipse, millions gathered outdoors to witness the Moon pass between Earth and the Sun, casting darkness over fortunate states. Amidst the typical gesture of putting the eclipse glasses on and taking them off, depending on if people were looking at the sky during the total eclipse, or before or after, what happened to Internet traffic?
Cloudflare’s data shows a clear impact on Internet traffic from Mexico to Canada, following the path of totality. The eclipse occurred between 15:42 UTC and 20:52 UTC, moving from south to north, as seen in this NASA image of the path and percentage of darkness of the eclipse.
Looking at the United States in aggregate terms, bytes delivered traffic dropped by 8%, and request traffic by 12% as compared to the previous week at 19:00 UTC (14:00 Eastern, 12:00 Pacific).
Bytes delivered percentage change (-8% at 19:00 UTC)HTTP requests percentage change (-12% at 19:00 UTC)
The state-level perspective in terms of traffic drop at the time of the eclipse, as compared to the previous week, is much more revealing. Here’s a summary of the US states’ traffic changes. We can almost trace the path of the eclipse, as shown in the previous NASA image.
From our data, Vermont, Arkansas, Indiana, Maine, New Hampshire, and Ohio experienced traffic drops of 40% or more around the time of the eclipse. These states were all in the path of totality, which was not the case for several others.
In the next table, we provide a detailed breakdown of the same perspective shown on the US map ordered by drop in traffic. In all of these charts, we’re using UTC as the time. We include the time of the biggest traffic drop compared to the previous week, at a 5-minute granularity, and also the percentage of drop compared to the previous week. States where it was possible to see at least part of the total eclipse are highlighted in bold. At the bottom are those with no clear difference.
The US: traffic change at time of the eclipse
State
Time of drop (UTC)
Local time
% of drop
Vermont
19:25
15:25
-60%
Arkansas
18:50
13:50
-54%
Indiana
19:05
15:05
-50%
Maine
19:30
15:30
-48%
New Hampshire
19:20
15:20
-40%
Ohio
19:10
15:10
-40%
Kentucky
19:05
14:05
-33%
Massachusetts
19:25
15:25
-33%
Michigan
19:15
15:15
-32%
Kansas
18:50
13:50
-31%
Missouri
18:55
13:55
-31%
Connecticut
19:20
15:20
-29%
Maryland
19:15
15:15
-29%
New York
19:25
15:25
-29%
Oklahoma
18:45
13:45
-29%
Rhode Island
19:25
15:25
-29%
New Jersey
19:20
15:20
-28%
Arizona
18:15
11:15
-27%
Illinois
19:05
14:05
-26%
Pennsylvania
19:15
15:15
-26%
West Virginia
19:15
15:15
-24%
Wisconsin
19:05
14:05
-22%
Wyoming
18:20
12:20
-19%
Alaska
20:15
12:15
-18%
Delaware
19:20
15:20
-18%
District of Columbia
19:15
15:15
-16%
New Mexico
18:25
12:25
-16%
Oregon
18:15
11:15
-16%
Nebraska
18:50
13:50/12:50
-15%
Texas
18:45
13:45
-15%
Colorado
18:25
12:25
-14%
Virginia
18:20
14:20
-14%
Alabama
19:00
14:00
-13%
Tennessee
19:00
15:00/14:00
-13%
Iowa
18:15
13:15
-12%
Nevada
18:10
11:10
-12%
Georgia
19:05
15:05
-11%
North Carolina
19:10
15:10
-10%
California
18:15
11:15
-9%
Florida
18:15
14:15
-7%
Utah
18:15
12:15
-5%
Montana
18:25
12:25
-4%
South Carolina
19:00
15:00
-4%
Hawaii
—
—
—
Louisiana
—
—
—
Minnesota
—
—
—
Mississippi
—
—
—
North Dakota
—
—
—
Idaho
—
—
—
South Dakota
—
—
—
Washington
—
—
—
Visualized, here’s what Vermont’s 60% drop looks like:
And here’s what the traffic drops in Arkansas, Maine, and Indiana look like:
In terms of states with larger populations, New York took the lead:
Mexico got the eclipse first
Before the eclipse became visible in the US, Mexico experienced it first. States within the eclipse zone, such as Coahuila, Durango, and Sinaloa, experienced noticeable drops in traffic. Even Mexico City, located further south, was affected.
Mexico: traffic change at time of the eclipse
State
Time of drop (UTC)
Local time
% of drop
Durango
18:15
12:15
-57%
Coahuila
18:15
12:15
-43%
Sinaloa
18:10
11:10
-34%
Mexico City
18:10
12:10
-22%
Here’s the Durango and Coahuila state perspectives:
Canada at last: an island stopped to see the eclipse
After Mexico and the US, Canada was next in the path of the eclipse. Prince Edward Island experienced the most significant impact in Canada. This region, with a population of less than 200,000, is one of eastern Canada’s maritime provinces, situated off New Brunswick and Nova Scotia in the Gulf of St. Lawrence. Next came New Brunswick and Newfoundland and Labrador.
This was the last total solar eclipse visible in the contiguous United States until August 23, 2044, with the next eclipse of similar breadth projected for August 12, 2045.
You’re browsing your inbox and spot an email that looks like it’s from a brand you trust. Yet, something feels off. This might be a phishing attempt, a common tactic where cybercriminals impersonate reputable entities — we’ve written about the top 50 most impersonated brands used in phishing attacks. One factor that can be used to help evaluate the email’s legitimacy is its Top-Level Domain (TLD) — the part of the email address that comes after the dot.
In this analysis, we focus on the TLDs responsible for a significant share of malicious or spam emails since January 2023. For the purposes of this blog post, we are considering malicious email messages to be equivalent to phishing attempts. With an average of 9% of 2023’s emails processed by Cloudflare’s Cloud Email Security service marked as spam and 3% as malicious, rising to 4% by year-end, we aim to identify trends and signal which TLDs have become more dubious over time. Keep in mind that our measurements represent where we observe data across the email delivery flow. In some cases, we may be observing after initial filtering has taken place, at a point where missed classifications are likely to cause more damage. This information derived from this analysis could serve as a guide for Internet users, corporations, and geeks like us, searching for clues, as Internet detectives, in identifying potential threats. To make this data readily accessible, Cloudflare Radar, our tool for Internet insights, now includes a new section dedicated to email security trends.
Cyber attacks often leverage the guise of authenticity, a tactic Cloudflare thwarted following a phishing scheme similar to the one that compromised Twilio in 2022. The US Cybersecurity and Infrastructure Security Agency (CISA) notes that 90% of cyber attacks start with phishing, and fabricating trust is a key component of successful malicious attacks. We see there are two forms of authenticity that attackers can choose to leverage when crafting phishing messages, visual and organizational. Attacks that leverage visual authenticity rely on attackers using branding elements, like logos or images, to build credibility. Organizationally authentic campaigns rely on attackers using previously established relationships and business dynamics to establish trust and be successful.
Our findings from 2023 reveal that recently introduced generic TLDs (gTLDs), including several linked to the beauty industry, are predominantly used both for spam and malicious attacks. These TLDs, such as .uno, .sbs, and .beauty, all introduced since 2014, have seen over 95% of their emails flagged as spam or malicious. Also, it’s important to note that in terms of volume, “.com” accounts for 67% of all spam and malicious emails (more on that below).
TLDs
2023 Spam %
2023 Malicious %
2023 Spam + malicious %
TLD creation
.uno
62%
37%
99%
2014
.sbs
64%
35%
98%
2021
.best
68%
29%
97%
2014
.beauty
77%
20%
97%
2021
.top
74%
23%
97%
2014
.hair
78%
18%
97%
2021
.monster
80%
17%
96%
2019
.cyou
34%
62%
96%
2020
.wiki
69%
26%
95%
2014
.makeup
32%
63%
95%
2021
Email and Top-Level Domains history
In 1971, Ray Tomlinson sent the first networked email over ARPANET, using the @ character in the address. Five decades later, email remains relevant but also a key entry point for attackers.
Before the advent of the World Wide Web, email standardization and growth in the 1980s, especially within academia and military communities, led to interoperability. Fast forward 40 years, and this interoperability is once again a hot topic, with platforms like Threads, Mastodon, and other social media services aiming for the open communication that Jack Dorsey envisioned for Twitter. So, in 2024, it’s clear that social media, messaging apps like Slack, Teams, Google Chat, and others haven’t killed email, just as “video didn’t kill the radio star.”
The structure of a domain name.
The domain name system, managed by ICANN, encompasses a variety of TLDs, from the classic “.com” (1985) to the newer generic options. There are also the country-specific (ccTLDs), where the Internet Assigned Numbers Authority (IANA) is responsible for determining an appropriate trustee for each ccTLD. An extensive 2014 expansion by ICANN was designed to “increase competition and choice in the domain name space,” introducing numerous new options for specific professional, business, and informational purposes, which in turn, also opened up new possibilities for phishing attempts.
3.4 billion unwanted emails
Cloudflare’s Cloud Email Security service is helping protect our customers, and that also comes with insights. In 2022, Cloudflare blocked 2.4 billion unwanted emails, and in 2023 that number rose to over 3.4 billion unwanted emails, 26% of all messages processed. This total includes spam, malicious, and “bulk” (practice of sending a single email message, unsolicited or solicited, to a large number of recipients simultaneously) emails. That means an average of 9.3 million per day, 6500 per minute, 108 per second.
Bear in mind that new customers also make the numbers grow — in this case, driving a 42% increase in unwanted emails from 2022 to 2023. But this gives a sense of scale in this email area. Those unwanted emails can include malicious attacks that are difficult to detect, becoming more frequent, and can have devastating consequences for individuals and businesses that fall victim to them. Below, we’ll give more details on email threats, where malicious messages account for almost 3% of emails averaged across all of 2023 and it shows a growth tendency during the year, with higher percentages in the last months of the year. Let’s take a closer look.
Top phishing TLDs (and types of TLDs)
First, let’s start with an 2023 overview of top level domains with a high percentage of spam and malicious messages. Despite excluding TLDs with fewer than 20,000 emails, our analysis covers unwanted emails considered to be spam and malicious from more than 350 different TLDs (and yes, there are many more).
A quick overview highlights the TLDs with the highest rates of spam and malicious attacks as a proportion of their outbound email, those with the largest volume share of spam or malicious emails, and those with the highest rates of just-malicious and just-spam TLD senders. It reveals that newer TLDs, especially those associated with the beauty industry (generally available since 2021 and serving a booming industry), have the highest rates as a proportion of their emails. However, it’s relevant to recognize that “.com” accounts for 67% of all spam and malicious emails. Malicious emails often originate from recently created generic TLDs like “.bar”, “.makeup”, or “.cyou”, as well as certain country-code TLDs (ccTLDs) employed beyond their geographical implications.
Highest % of spam and malicious emails
Volume share of spam + malicious
Highest % of malicious
Highest % of spam
TLD
Spam + mal %
TLD
Spam + mal %
TLD
Malicious %
TLD
Spam %
.uno
99%
.com
67%
.bar
70%
.autos
93%
.sbs
98%
.shop
5%
.makeup
63%
.today
92%
.best
97%
.net
4%
.cyou
62%
.directory
91%
.beauty
97%
.no
3%
.ml
56%
.boats
87%
.top
97%
.org
2%
.tattoo
54%
.center
85%
.hair
97%
.ru
1%
.om
47%
.monster
80%
.monster
96%
.jp
1%
.cfd
46%
.lol
79%
.cyou
96%
.click
1%
.skin
39%
.hair
78%
.wiki
95%
.beauty
1%
.uno
37%
.shop
78%
.makeup
95%
.cn
1%
.pw
37%
.beauty
77%
Focusing on volume share, “.com” dominates the spam + malicious list at 67%, and is joined in the top 3 by another “classic” gTLD, “.net”, at 4%. They also lead by volume when we look separately at the malicious (68% of all malicious emails are “.com” and “.net”) and spam (71%) categories, as shown below. All of the generic TLDs introduced since 2014 represent 13.4% of spam and malicious and over 14% of only malicious emails. These new TLDs (most of them are only available since 2016) are notable sources of both spam and malicious messages. Meanwhile, country-code TLDs contribute to more than 12% of both categories of unwanted emails.
This breakdown highlights the critical role of both established and new generic TLDs, which surpass older ccTLDs in terms of malicious emails, pointing to the changing dynamics of email-based threats.
Type of TLDs
Spam
Malicious
Spam + malicious
ccTLDs
13%
12%
12%
.com and .net only
71%
68%
71%
new gTLDs
13%
14%
13.4%
That said, “.shop” deserves a highlight of its own. The TLD, which has been available since 2016, is #2 by volume of spam and malicious emails, accounting for 5% of all of those emails. It also represents, when we separate those two categories, 5% of all malicious emails, and 5% of all spam emails. As we’re going to see below, its influence is growing.
Full 2023 top 50 spam & malicious TLDs list
For a more detailed perspective, below we present the top 50 TLDs with the highest percentages of spam and malicious emails during 2023. We also include a breakdown of those two categories.
It’s noticeable that even outside the top 10, other recent generic TLDs are also higher in the ranking, such as “.autos” (the #1 in the spam list), “.today”, “.bid” or “.cam”. TLDs that seem to promise entertainment or fun or are just leisure or recreational related (including “.fun” itself), occupy a position in our top 50 ranking.
2023 Top 50 spam & malicious TLDs (by highest %)
Rank
TLD
Spam %
Malicious %
Spam + malicious %
1
.uno
62%
37%
99%
2
.sbs
64%
35%
98%
3
.best
68%
29%
97%
4
.beauty
77%
20%
97%
5
.top
74%
23%
97%
6
.hair
78%
18%
97%
7
.monster
80%
17%
96%
8
.cyou
34%
62%
96%
9
.wiki
69%
26%
95%
10
.makeup
32%
63%
95%
11
.autos
93%
2%
95%
12
.today
92%
3%
94%
13
.shop
78%
16%
94%
14
.bid
74%
18%
92%
15
.cam
67%
25%
92%
16
.directory
91%
0%
91%
17
.icu
75%
15%
91%
18
.ml
33%
56%
89%
19
.lol
79%
10%
89%
20
.skin
49%
39%
88%
21
.boats
87%
1%
88%
22
.tattoo
34%
54%
87%
23
.click
61%
27%
87%
24
.ltd
70%
17%
86%
25
.rest
74%
11%
86%
26
.center
85%
0%
85%
27
.fun
64%
21%
85%
28
.cfd
39%
46%
84%
29
.bar
14%
70%
84%
30
.bio
72%
11%
84%
31
.tk
66%
17%
83%
32
.yachts
58%
23%
81%
33
.one
63%
17%
80%
34
.ink
68%
10%
78%
35
.wf
76%
1%
77%
36
.no
76%
0%
76%
37
.pw
39%
37%
75%
38
.site
42%
31%
73%
39
.life
56%
16%
72%
40
.homes
62%
10%
72%
41
.services
67%
2%
69%
42
.mom
63%
5%
68%
43
.ir
37%
29%
65%
44
.world
43%
21%
65%
45
.lat
40%
24%
64%
46
.xyz
46%
18%
63%
47
.ee
62%
1%
62%
48
.live
36%
26%
62%
49
.pics
44%
16%
60%
50
.mobi
41%
19%
60%
Change in spam & malicious TLD patterns
Let’s look at TLDs where spam + malicious emails comprised the largest share of total messages from that TLD, and how that list of TLDs changed from the first half of 2023 to the second half. This shows which TLDs were most problematic at different times during the year.
Highlighted in bold in the following table are those TLDs that climbed in the rankings for the percentage of spam and malicious emails from July to December 2023, compared with January to June. Generic TLDs “.uno”, “.makeup” and “.directory” appeared in the top list and in higher positions for the first time in the last six months of the year.
January – June 2023
July – Dec 2023
tld
Spam + malicious %
tld
Spam + malicious %
.click
99%
.uno
99%
.best
99%
.sbs
98%
.yachts
99%
.beauty
97%
.hair
99%
.best
97%
.autos
99%
.makeup
95%
.wiki
98%
.monster
95%
.today
98%
.directory
95%
.mom
98%
.bid
95%
.sbs
97%
.top
93%
.top
97%
.shop
92%
.monster
97%
.today
92%
.beauty
97%
.cam
92%
.bar
96%
.cyou
92%
.rest
95%
.icu
91%
.cam
95%
.boats
88%
.homes
94%
.wiki
88%
.pics
94%
.rest
88%
.lol
94%
.hair
87%
.quest
93%
.fun
87%
.cyou
93%
.cfd
86%
.ink
92%
.skin
85%
.shop
92%
.ltd
84%
.skin
91%
.one
83%
.ltd
91%
.center
83%
.tattoo
91%
.services
81%
.no
90%
.lol
78%
.ml
90%
.wf
78%
.center
90%
.pw
76%
.store
90%
.life
76%
.icu
89%
.click
75%
From the rankings, it’s clear that the recent generic TLDs have the highest spam and malicious percentage of all emails. The top 10 TLDs in both halves of 2023 are all recent and generic, with several introduced since 2021.
Reasons for the prominence of these gTLDs include the availability of domain names that can seem legitimate or mimic well-known brands, as we explain in this blog post. Cybercriminals often use popular or catchy words. Some gTLDs allow anonymous registration. Their low cost and the delay in updated security systems to recognize new gTLDs as spam and malicious sources also play a role — note that, as we’ve seen, cyber criminals also like to change TLDs and methods.
The impact of a lawsuit?
There’s also been a change in the types of domains with the highest malicious percentage in 2023, possibly due to Meta’s lawsuit against Freenom, filed in December 2022 and refiled in March 2023. Freenom provided domain name registry services for free in five ccTLDs, which wound up being used for purposes beyond local businesses or content: “.cf” (Central African Republic), “.ga” (Gabon), “.gq” (Equatorial Guinea), “.ml” (Mali), and “.tk” (Tokelau). However, Freenom stopped new registrations during 2023 following the lawsuit, and in February 2024, announced its decision to exit the domain name business.
Focusing on Freenom TLDs, which appeared in our top 50 ranking only in the first half of 2023, we see a clear shift. Since October, these TLDs have become less relevant in terms of all emails, including malicious and spam percentages. In February 2023, they accounted for 0.17% of all malicious emails we tracked, and 0.04% of all spam and malicious. Their presence has decreased since then, becoming almost non-existent in email volume in September and October, similar to other analyses.
TLDs ordered by volume of spam + malicious
In addition to looking at their share, another way to examine the data is to identify the TLDs that have a higher volume of spam and malicious emails — the next table is ordered that way. This means that we are able to show more familiar (and much older) TLDs, such as “.com”. We’ve included here the percentage of all emails in any given TLD that are classified as spam or malicious, and also spam + malicious to spotlight those that may require more caution. For instance, with high volume “.shop”, “.no”, “.click”, “.beauty”, “.top”, “.monster”, “.autos”, and “.today” stand out with a higher spam and malicious percentage (and also only malicious email percentage).
In the realm of country-code TLDs, Norway’s “.no” leads in spam, followed by China’s “.cn”, Russia’s “.ru”, Ukraine’s “.ua”, and Anguilla’s “.ai”, which recently has been used more for artificial intelligence-related domains than for the country itself.
In bold and red, we’ve highlighted the TLDs where spam + malicious represents more than 20% of all emails in that TLD — already what we consider a high number for domains with a lot of emails.
TLDs with more spam + malicious emails (in volume) in 2023
Rank
TLD
Spam %
Malicious %
Spam + mal %
1
.com
3.6%
0.8%
4.4%
2
.shop
77.8%
16.4%
94.2%
3
.net
2.8%
1.0%
3.9%
4
.no
76.0%
0.3%
76.3%
5
.org
3.3%
1.8%
5.2%
6
.ru
15.2%
7.7%
22.9%
7
.jp
3.4%
2.5%
5.9%
8
.click
60.6%
26.6%
87.2%
9
.beauty
77.0%
19.9%
96.9%
10
.cn
25.9%
3.3%
29.2%
11
.top
73.9%
22.8%
96.6%
12
.monster
79.7%
16.8%
96.5%
13
.de
13.0%
2.1%
15.2%
14
.best
68.1%
29.4%
97.4%
15
.gov
0.6%
2.0%
2.6%
16
.autos
92.6%
2.0%
94.6%
17
.ca
5.2%
0.5%
5.7%
18
.uk
3.2%
0.8%
3.9%
19
.today
91.7%
2.6%
94.3%
20
.io
3.6%
0.5%
4.0%
21
.us
5.7%
1.9%
7.6%
22
.co
6.3%
0.8%
7.1%
23
.biz
27.2%
14.0%
41.2%
24
.edu
0.9%
0.2%
1.1%
25
.info
20.4%
5.4%
25.8%
26
.ai
28.3%
0.1%
28.4%
27
.sbs
63.8%
34.5%
98.3%
28
.it
2.5%
0.3%
2.8%
29
.ua
37.4%
0.6%
38.0%
30
.fr
8.5%
1.0%
9.5%
The curious case of “.gov” email spoofing
When we concentrate our research on message volume to identify TLDs with more malicious emails blocked by our Cloud Email Security service, we discover a trend related to “.gov”.
TLDs ordered by malicious email volume
% of all malicious emails
.com
63%
.net
5%
.shop
5%
.org
3%
.gov
2%
.ru
2%
.jp
2%
.click
1%
.best
0.9%
.beauty
0.8%
The first three domains, “.com” (63%), “.net” (5%), and “.shop” (5%), were previously seen in our rankings and are not surprising. However, in fourth place is “.org”, known for being used by non-profit and other similar organizations, but it has an open registration policy. In fifth place is “.gov”, used only by the US government and administered by CISA. Our investigation suggests that it appears in the ranking because of typical attacks where cybercriminals pretend to be a legitimate address (email spoofing, creation of email messages with a forged sender address). In this case, they use “.gov” when launching attacks.
The spoofing behavior linked to “.gov” is similar to that of other TLDs. It includes fake senders failing SPF validation and other DNS-based authentication methods, along with various other types of attacks. An email failing SPF, DKIM, and DMARC checks typically indicates that a malicious sender is using an unauthorized IP, domain, or both. So, there are more straightforward ways to block spoofed emails without examining their content for malicious elements.
Ranking TLDs by proportions of malicious and spam email in 2023
In this section, we have included two lists: one ranks TLDs by the highest percentage of malicious emails — those you should exercise greater caution with; the second ranks TLDs by just their spam percentage. These contrast with the previous top 50 list ordered by combined spam and malicious percentages. In the case of malicious emails, the top 3 with the highest percentage are all generic TLDs. The #1 was “.bar”, with 70% of all emails being categorized as malicious, followed by “.makeup”, and “.cyou” — marketed as the phrase “see you”.
The malicious list also includes some country-code TLDs (ccTLDs) not primarily used for country-related topics, like .ml (Mali), .om (Oman), and .pw (Palau). The list also includes other ccTLDs such as .ir (Iran) and .kg (Kyrgyzstan), .lk (Sri Lanka).
In the spam realm, it’s “autos”, with 93%, and other generic TLDs such as “.today”, and “.directory” that take the first three spots, also seeing shares over 90%.
2023 ordered by malicious email %
2023 ordered by spam email %
tld
Malicious %
tld
Spam %
.bar
70%
.autos
93%
.makeup
63%
.today
92%
.cyou
62%
.directory
91%
.ml
56%
.boats
87%
.tattoo
54%
.center
85%
.om
47%
.monster
80%
.cfd
46%
.lol
79%
.skin
39%
.hair
78%
.uno
37%
.shop
78%
.pw
37%
.beauty
77%
.sbs
35%
.no
76%
.site
31%
.wf
76%
.store
31%
.icu
75%
.best
29%
.bid
74%
.ir
29%
.rest
74%
.lk
27%
.top
74%
.work
27%
.bio
72%
.click
27%
.ltd
70%
.wiki
26%
.wiki
69%
.live
26%
.best
68%
.cam
25%
.ink
68%
.lat
24%
.cam
67%
.yachts
23%
.services
67%
.top
23%
.tk
66%
.world
21%
.sbs
64%
.fun
21%
.fun
64%
.beauty
20%
.one
63%
.mobi
19%
.mom
63%
.kg
19%
.uno
62%
.hair
18%
.homes
62%
How it stands in 2024: new higher-risk TLDs
2024 has seen new players enter the high-risk zone for unwanted emails. In this list we have only included the new TLDs that weren’t in the top 50 during 2023, and joined the list in January. New entrants include Samoa’s “.ws”, Indonesia’s “.id” (also used because of its “identification” meaning), and the Cocos Islands’ “.cc”. These ccTLDs, often used for more than just country-related purposes, have shown high percentages of malicious emails, ranging from 20% (.cc) to 95% (.ws) of all emails.
January 2024: Newer TLDs in the top 50 list
TLD
Spam %
Malicious %
Spam + mal %
.ws
3%
95%
98%
.company
96%
0%
96%
.digital
72%
2%
74%
.pro
66%
6%
73%
.tz
62%
4%
65%
.id
13%
39%
51%
.cc
25%
21%
46%
.space
32%
8%
40%
.enterprises
2%
37%
40%
.lv
30%
1%
30%
.cn
26%
3%
29%
.jo
27%
1%
28%
.info
21%
5%
26%
.su
20%
5%
25%
.ua
23%
1%
24%
.museum
0%
24%
24%
.biz
16%
7%
24%
.se
23%
0%
23%
.ai
21%
0%
21%
Overview of email threat trends since 2023
With Cloudflare’s Cloud Email Security, we gain insight into the broader email landscape over the past months. The spam percentage of all emails stood at 8.58% in 2023. As mentioned before, keep in mind with these percentages that our protection typically kicks in after other email providers’ filters have already removed some spam and malicious emails.
How about malicious emails? Almost 3% of all emails were flagged as malicious during 2023, with the highest percentages occurring in Q4. Here’s the “malicious” evolution, where we’re also including the January and February 2024 perspective:
The week before Christmas and the first week of 2024 experienced a significant spike in malicious emails, reaching an average of 7% and 8% across the weeks, respectively. Not surprisingly, there was a noticeable decrease during Christmas week, when it dropped to 3%. Other significant increases in the percentage of malicious emails were observed the week before Valentine’s Day, the first week of September (coinciding with returns to work and school in the Northern Hemisphere), and late October.
Threat categories in 2023
We can also look to different types of threats in 2023. Links were present in 49% of all threats. Other categories included extortion (36%), identity deception (27%), credential harvesting (23%), and brand impersonation (18%). These categories are defined and explored in detail in Cloudflare’s 2023 phishing threats report. Extortion saw the most growth in Q4, especially in November and December reaching 38% from 7% of all threats in Q1 2023.
Other trends: Attachments are still popular
Other less “threatening” trends show that 20% of all emails included attachments (as the next chart shows), while 82% contained links in the body. Additionally, 31% were composed in plain text, and 18% featured HTML, which allows for enhanced formatting and visuals. 39% of all emails used remote content.
Conclusion: Be cautious, prepared, safe
The landscape of spam and malicious (or phishing) emails constantly evolves alongside technology, the Internet, user behaviors, use cases, and cybercriminals. As we’ve seen through Cloudflare’s Cloud Email Security insights, new generic TLDs have emerged as preferred channels for these malicious activities, highlighting the need for vigilance when dealing with emails from unfamiliar domains.
There’s no shortage of advice on staying safe from phishing. Email remains a ubiquitous yet highly exploited tool in daily business operations. Cybercriminals often bait users into clicking malicious links within emails, a tactic used by both sophisticated criminal organizations and novice attackers. So, always exercise caution online.
Cloudflare’s Cloud Email Security provides insights that underscore the importance of robust cybersecurity infrastructure in fighting the dynamic tactics of phishing attacks.
Internet connectivity in several African countries was disrupted today, March 14, 2024. Beginning at approximately 05:00 UTC, west and central African countries were most impacted, as was South Africa. Based on published reports and social media posts from impacted network providers, the disruption is believed to be due to multiple undersea cable failures in the region. From The Gambia to Côte d’Ivoire, including a major network in South Africa (Vodacom), a total of 11 African countries were impacted, based on our observations.
Cloudflare Radar data shows a pattern of disruptions from the north to the south of West Africa over time. It began south of Senegal, with The Gambia, Guinea, and Liberia experiencing disruptions around 05:00 UTC.
In The Gambia and Guinea, the disruptions lasted about 30 minutes, while in Liberia, the disruption has lasted more than 12 hours.
Moving south, around 07:30 UTC, disruptions were observed in Côte d’Ivoire and Ghana.
Niger, a landlocked nation in Central Africa, experienced a disruption at 09:15, lasting just over two hours.
This was followed by disruptions starting around 10:30 UTC in Nigeria, Benin, Cameroon, and Togo. These disruptions were ongoing at the time of writing.
At approximately the same time, a significant disruption was observed on Vodacom’s South African network (AS29975). Traffic began to recover after 13:30 UTC, and appears to have reached close to normal levels by 16:00 UTC.
The importance of submarine cables
This series of disruptions serves as a reminder of how dependent the Internet is on submarine cables, which are estimated to carry over 90% of intercontinental data traffic. Only a small percentage of general use is done via satellite networks. There are 529 active submarine cables and 1,444 landings that are currently active or under construction, running to an estimated 1.3 million km around the globe.
Reports from several local networks, including South Africa’s Vodacom, MTN in Nigeria, and Celtiis in Bénin, reference multiple submarine cable failures. Microsoft was more detailed, stating on their Azure status page that “multiple fiber cables on the West Coast of Africa — WACS, MainOne, SAT3, ACE — have been impacted which reduced total capacity supporting our Regions in South Africa”. The company also explains that the recent cable cuts in the Red Sea in combination with today’s cable issues, “has impacted all Africa capacity”.
In addition to the impacts to the Microsoft Azure cloud platform, the website of MainOne, owners of the MainOne submarine cable, was offline for several hours. DNS for mainone.net is handled by name servers located in MainOne’s address space. It appears that a portion of the IPv4 address space for AS37282 (MAINONE) stopped being announced between 07:30 and 15:00 UTC, and once this address space was being routed again, both the nameservers and website became reachable.
This map from TeleGeography highlights the impacted submarine cables: WACS (West Africa Cable System), MainOne, SAT-3/WASC, and ACE.
The disruptions are now being reported by news media outlets, including in South Africa, where the emphasis is not only on the latest outage but also on the problem with the submarine cable operator Seacom. This operator experienced a service-impacting outage on its cable system in the Red Sea. On March 8, the company stated that it is waiting for permits to start repairing its broken submarine cable in the Red Sea.
Ask nearly any Internet user, and they are bound to have their own personal list of favorite sites, applications, and Internet services for news, messaging, video, AI chatbots, music, and more. Sum that question up across a lot of users in a lot of different countries, and you end up with a sense of the most popular websites and services in the world. In a nutshell, that’s what this blog post is about: how humans interacted with the online world in 2023 from what Cloudflare observed.
Building on similar reports we’ve done over the past two years, we have compiled a ranking of the top Internet properties of 2023. In addition to our overall ranking, we chose 9 categories to focus on. One of these is a new addition in 2023: Generative AI. Here are the 9 categories we’ll be digging into:
Our method for calculating the results is the same as in 2022: we analyze anonymized DNS query data from our 1.1.1.1 public DNS resolver, used by millions of people around the world. To build the lists of Internet services, we use two additional methods. First, we aggregate domains that belong to one online service. For instance, for Twitter/X, we include twitter.com, t.co, and x.com among others. Second, we reference our large source list of domains and identify the sites that provide services to humans. That means that our rankings do not include every domain seen in the data (for example, we exclude domains such as root-servers.net and cloudflare-dns.com). A site’s overall ranking is relative to other sites that meet these criteria; its rank within a category is relative to other sites in the same category. That’s important to note: just because a site has gone down in the rankings, it doesn’t necessarily mean its traffic has declined — it could just be that other sites’ traffic increased. Similarly, the inverse is true. What we’re doing here isn’t tracking absolute traffic, but rather, relative popularity.
With that, we can begin our analysis. Following the success of OpenAI’s ChatGPT launch on November 30, 2022, Generative AI has captivated both the world and the news. OpenAI is now close to ranking among our top 100 most popular Internet services overall, rising from #200 in January.
In e-commerce, low price and fast fashion marketplace Temu experienced similar growth, becoming the year’s surprise by surpassing Shein and other major players, reaching #7 in its category. And Black Friday was the best day for several other e-commerce services, as well as payment services such as PayPal, Stripe and Klarna.
In social media, X/Twitter lost some ground in our Overall ranking, but maintained its status as a significant online discussion platform. New additions like Threads by Instagram, launched in July, are still gaining their footing in the category. Additionally, we observed notable news-related trends linked to events such as the March 2023 United States banking crisis, the Titan submersible implosion, the Wagner Group rebellion, and the October 7 Hamas attack on Israel.
We close our report out with a discussion of a range of trends that don’t fit neatly into our other categories, including a look at Taylor Swift’s and Beyoncé websites — both of which appeared in our overall traffic rankings.
Keep reading for a detailed look at the evolution of trends throughout the year. For more, visit our 2023 Cloudflare Radar Year in Review microsite. Along with the lists of most popular Internet services, the Year in Review site and its associated blog post explore a number of additional metrics.
Google is #1. Facebook, Apple and TikTok follow
Since we began reporting these rankings in 2021, we always start with an Overall Top 10 list. These are the services that are the top Internet properties globally in 2023, based on DNS traffic through our 1.1.1.1 resolver. Unsurprisingly, Google (we’re including here services like Google Maps and Google Flights that use google.com, for example) remained the #1 most popular Internet service in our Overall ranking. Since we implemented our new ranking method last year, no other service has challenged Google’s position as the #1 leader in our rankings.
Top 10 — Most popular Internet services 2023, Overall
Google
Facebook
Apple
TikTok
Microsoft
YouTube
AWS
Instagram
Amazon
iCloud
Beyond Google, Facebook was consistently #2, while Apple (that uses, for example, apple.com for several use cases, including on iPhone related services) was generally #3, except when TikTok took the spot in April. Microsoft mostly held the #5 ranking, although it sometimes traded places with YouTube at #6.
AWS — we’re separating it from Amazon by using domains like amazonaws.com — held a firm position at #7, and Instagram was clearly #8 through the year, with a few exceptions involving Amazon. The #10 position changed more frequently, alternating between iCloud (for which we use domains such as icloud.com, distinct from apple.com), Netflix (mainly on weekends), and Microsoft Office. In the chart below, you can follow the evolution of the top Internet services in our Overall ranking throughout the year.
In 2022, X/Twitter ranked as high as #10 in our Overall ranking, but never reached this spot in 2023. We’ll talk more about X/Twitter’s performance in the Social Media category below.
Ready to face the Generative AI era?
The Generative AI category became a global phenomenon in 2023, though it started gaining attention in late November 2022 with the launch of ChatGPT from OpenAI. We tested it on our ‘This Week in NET’ show on December 2, 2022, and were impressed. It’s not surprising that OpenAI was popular early in 2023 and topped this list. Other generative AI services also emerged during the year.
Top 10 — Generative AI services 2023
OpenAI
character.ai
QuillBot
Hugging Face
Poe
Perplexity
Wordtune
Bard
ProWritingAid
Voicemod
Significant changes occurred below Open AI’s #1 spot throughout the year. After mid-year, we noticed a shift, when character.ai took the #2 spot from Quillbot. Quora’s Poe AI, which combines several AI chatbots including ChatGPT, entered the top 10 in late March, holding the #3 spot until late April before settling at #4.
This figure shows movement among the Generative AI services that were more popular later in the year:
AI model platform Hugging Face was typically #5, but Google’s Bard also reached #5 in November. Bard, launched in limited regions in March, made our top 10 within the category after its broader release in Europe and Brazil. It was #7 from July to September before peaking later in the year.
Other Generative AI services that became important in our list later in 2023 include Anthropic’s Claude (whose new model, Claude 2, launched in July, though it is not yet available in the European Union). It was #5 in August before dropping to #6 after September. Perplexity AI, a ChatGPT competitor, was #8 after September.
Midjourney, which relies on Discord bot commands to create artwork, peaked at #3 in late March but started declining, dropping to #5 in April and May, and then to #10 in September.
Other AI-inclusive services like Prowritingaid, Voicemod, and Wordtune were more popular earlier in the year but became less so later on. Bardeen was in the top 10 in May and June, while Descript appeared at #9 between March and May.
Notable trends that we observed when looking at trends for Generative AI services in our larger Overall ranking include:
OpenAI, which was around #200 in our Overall ranking in early January, saw a significant rise between March and April (OpenAI launched GPT-4 and plugins during that time) and is now near the top 100. It peaked early in November (#104 on November 9), right after OpenAI’s first developer conference on November 6 in San Francisco. The brief removal of Sam Altman in late November didn’t have a noticeable impact.
character.ai‘s growth was similar to OpenAI, rising from the top 500 in early January to around #200 recently. Quillbot remained steady throughout the year, around #258.
Poe AI peaked at #276 on June 18 and is now around #290. Claude AI was around #380 in November after a late August peak at #337.
Social media: The Facebook (not X) effect
An analysis from Kepios estimates that there are 4.95 billion social media users around the world in 2023, comprising 61.4% of the world population, so this category plays a big role in our everyday life as a central stage for communication, information, and general attention.
Unsurprisingly, social media platforms such as Facebook, TikTok, and Instagram rank high in our most popular Internet properties and are featured in our Top 10 Overall Internet services list.
Within our Social Media category list, the top five remained the same as last year. Facebook was #1, followed by TikTok (#2), Instagram (#3), X/Twitter (#4), and Snapchat (#5).
Top 10 — Social Media services 2023
Facebook
TikTok
Instagram
X/Twitter
Snapchat
LinkedIn
Discord
Reddit
Pinterest
Kwai
In contrast to 2022, when Twitter (renamed X in July 2023) and Instagram often swapped places at #3, this year X/Twitter never challenged Instagram in our rankings.
LinkedIn held a strong #6, with Discord challenging it during a few days in January and April.
Reddit, usually at #8, competed with Discord for the #7 spot in February and March but fell back to #8 in April, concurrent with the controversy around Reddit API changes. Reddit often challenged Discord on weekdays, while Discord was more popular on weekends. Following these are Pinterest (#9) and Kwai, the Chinese video app popular in Brazil, Indonesia, and other countries (#10). Here’s the top 10 chart across 2023:
A Twitter (or X) drop after a possible football (or soccer) peak
Let’s continue on social media, but leave its specific category and examine how social media services fared in our Overall ranking where bigger shifts between services are seen.
The graph below depicts the position of Instagram and Twitter in the Overall ranking. Instagram consistently ranked in the top 10, typically holding positions #8 or #9 with brief dips to #10 around May 2023.
X/Twitter, which reached as high as #8 overall last year following the start of the war in Ukraine, ended 2022 at #12 and continued its downward trend in 2023. It started between #12 and #16, lower than last year, and ended between #13 and #19. Here’s how these two evolved in 2023:
We noticed that X/Twitter was particularly popular on weekends, peaking at #11 or #12 between April 15 and June 10. Specifically, it ranked at #11 in the weekends before May 14 and then at #12 from May 14 to June 10. This coincides with key moments in European football competitions. However, after the European Champions League final on June 10, X/Twitter never reached those heights again.
Let’s explore this possible football (or soccer) Twitter trend. X/Twitter’s rankings peaked around significant moments in the English Premier League (arguably the most-watched sports league in the world), particularly when Manchester City made crucial advances to their title after April 15. The trend lasted until the European Champions League final on June 10, where City’s victory and historic treble coincided with X/Twitter’s final peak ranking of the year — the weekend of June 3, when there were already no Premier League games, and X/Twitter dropped to #13.
Alternatives to X/Twitter: Mastodon, Threads, and others
Tumblr, a more established platform than other recent alternatives, fluctuated between #125 and #153 in our Overall ranking, showing a downward trend. Close behind was an aggregation of several hundred Mastodon servers, ranking between #160 and #200.
Threads from Instagram/Meta (seen in the next chart), peaked at #227 on July 6 in our Overall ranking, then dropped but recovered to around #300 after late August, and did not make it into the top 10 social media services ranking for 2023. For context, Kwai (#10 in the Social Media ranking) usually ranks around our Overall top 50.
Bluesky, a newer entrant, first appeared in our Top 500 in late August, with a first spike at #432 on September 19 and reaching the top 400 in November, peaking at #397 on November 19. Truth Social had a peak at #318 on August 23 but then dropped, averaging around #450 in November.
Other social apps including Hive Social, Counter Social, Post.News, T2/Pebble, Parler, etc., didn’t appear in our Overall 500 ranking.
Here are some other trends we observed among social media apps, and how they did in our Overall ranking:
Snapchat was more popular on weekends, fluctuating between #18 and #21 overall, with improved performance after October, with several days at #18, close to X/Twitter.
Discord was also more popular on weekends, varying between #24 and #35, peaking in April at #24. It had a similar trend to Midjourney, the generative AI image service that generates images for its users on Discord. It ended the year around #32.
Reddit, which was more popular on weekdays, dropped in our ranking during the summer in the Northern Hemisphere, in contrast with other social media services, and moved between #30 and #38.
Quora was also more popular on weekdays, and fluctuated between #116 and #146, dropping in summer and settling around #130 in November.
Tinder, the social dating app, fell from a peak of #124 to #133 in November, and is much more popular on Sundays.
OnlyFans showed steady growth, peaking at #148 in early July and settling around #175. The adult oriented social content subscription service was more popular on the weekends, particularly on Sundays.
BeReal, a French social media app for daily photo sharing, approached but did not enter the Social Media top 10 ranking, and grew to a peak of #141 in our Overall ranking in September but fell in November.
E-commerce: Temu means growth
E-commerce remains as relevant as ever, something that is especially evident in our recent Cyber Week blog post. Amazon consistently tops the category, with Taobao as a solid #2. In 2022, eBay was mostly #2 but has now dropped to #3, although it had several days in early 2023 in the #2 spot, as well as on June 19.
Top 10 — E-commerce services 2023
Amazon
Taobao
eBay
Shopify
Alibaba
AliExpress
Temu
Rakuten
Mercado Libre
Walmart
Throughout the year, Shopify was a solid #4, overtaking eBay at #3 on Black Friday. Alibaba was #5, peaking on Singles’ Day, November 11. AliExpress followed at #6.
Rakuten and Temu battled for the #7 ranking in 2023. Temu, the Chinese-owned and Boston-based low price and fast fashion marketplace (launched in the US in September 2022) was definitely one of the surprises of the year. It expanded to Canada, Australia and New Zealand in February, and ended 2023 as #7 in front of Rakuten. It ranked #6 at times during the year, including Black Friday. Temu wasn’t in our top 10 in 2022.
The South American e-commerce platform Mercado Libre, the American retail giant Walmart, and the fast fashion brand Shein, ‘battled’ during the year for the 9th and 10th place rankings in the E-commerce category.
Looking at how e-commerce sites did in our Overall ranking, we observed the following trends:
Amazon finished the year at #9 overall, reaching #8 on its Prime Day shopping event (July 11-12) and Black Friday.
Shein, the Chinese fast fashion brand, showed growth, starting at around #130 in January and ending around #120. It’s a similar trend to the one we observed in 2022.
Temu was not in the top 200 in January but finished in the top 100, peaking on Black Friday at #84 — a similar trend was seen in OpenAI performance. Temu also overtook Shein in May 2023.
Best Buy also peaked on Black Friday in 2023, as did Nike, Adidas, Victoria’s Secret, and H&M. Zara’s best day was November 23.
Target first peaked on November 12 at #134 and again on Black Friday at #135.
Alibaba’s highest position in 2023 was on Single’s Day, November 11, at #67.
Video streaming: YouTube and Netflix remain uncontested
Video streaming platforms continue to play a central role in entertaining us. YouTube remains the top service for all video streaming, with Netflix as a close second. However, within our rankings, Netflix is the clear leader among paid streaming services, followed by Disney Plus, Amazon Prime Video, Hulu, and HBO/HBO Max.
Top 10 — Video streaming services 2023
YouTube
Netflix
Twitch
Roku
Disney Plus
Prime Video
Hulu
HBO/Max
Vimeo
Pluto TV
Twitch, which has a significant amount of video game live-streaming content, secured the #3 spot, as it did in 2022. Roku, a digital media player that also offers streaming services, ranked #4. Following are Disney Plus, Prime Video, Hulu, and HBO/Max (now known as Max), with Vimeo surpassing Pluto TV later in the year. Dailymotion also made a top 10 appearance in late February for a few days.
Throughout the year, Disney+ occasionally challenged Roku, especially on weekends following the premiere of the Star Wars-related miniseries Ahsoka on August 23.
Looking at how video streaming services performed in our Overall ranking, we found:
Netflix peaked at #9 on Sundays in April and May, coinciding with the release of ‘The Diplomat‘ starring Keri Russell — it was the most watched show on the platform at that time. Netflix, Prime Video, HBO/Max, were more popular on weekends.
Prime Video was more popular earlier in the year, peaking at #50 on March 26, the weekend ‘Top Gun: Maverick‘ premiered.
HBO/Max has been dropping in our Overall ranking since September but remains in the top 100.
Peacock, NBC’s streaming service, peaked at #111 in October and was more popular on Sundays.
Paramount Plus has been falling in our Overall ranking, down to around #156 in November, and is also more popular on Sundays.
The News: Globo and BBC global perspectives
News organizations worldwide play a crucial role in keeping the public informed, especially during times of crisis like pandemics, wars, or financial uncertainty. With that in mind, the ranking of news organizations also highlights a few newsworthy trends.
Top 10 — News services 2023
Globo
BBC
Fox News
CNN
NY Times
Daily Mail
Washington Post
The Guardian
NPR
Wall Street Journal
Last year, BBC and Globo tied for #1 in this category. In 2023, Globo — a Brazilian media conglomerate popular in South America, was consistently #1, followed by the BBC, the UK’s national broadcaster. The only exception was on June 20, when the BBC was #1. This coincided with the Titan submersible implosion on June 18, which remained in global news for most of the following week.
Fox News and CNN also played a key role in our list. Fox News was overtaken by CNN for the #3 spot from July onwards, though Fox led again in November. The New York Times held a steady #5, followed by the Daily Mail and NPR, with the Washington Post overtaking NPR in June.
The ranking lower in the top 10 fluctuated more, with the Wall Street Journal mostly at #9, reaching #8 in September. The Guardian was #8 in October, coinciding with the start of the Hamas-Israel conflict on October 7.
Titan submersible implosion & the Hamas-Israel conflict
Notable news trends we identified in our larger Overall ranking include:
CNN had its 2023 peak on June 22, reaching #73, and was already higher than usual in the previous days. That was the day the United States Coast Guard announced that they had discovered debris from the Titan submersible implosion, confirming that the five people aboard were dead. The other peak of the year for CNN was February 14, Valentine’s Day.
The Daily Mail (#127) and The Indian Express (#389) also peaked on June 22, with Fox News also reaching one of its highest ranks on that day, although it was higher in early January.
German news outlet Bild also peaked on June 22, while Der Spiegel‘s highest point was the previous day, June 21.
BBC, had a significant peak in our Overall list on October 8, following the Hamas attack on Israel, reaching #76. It also moved higher in the news category ranking on that day, as noted above.
RT, the Russian news organization, showed a decline throughout the year but peaked on June 24 (#234) during the Wagner Group rebellion in Russia.
Israeli newspapers Times of Israel and Haaretz jumped into our Overall ranking on October 7, the day of the Hamas attack on Israel. The former had its peak on October 9 at #275, the latter on October 8 at #393.
The Washington Post peaked on April 4-5 (#117), coinciding with Finland joining NATO and Donald Trump’s not guilty plea after becoming the first US president to be indicted.
China Daily appeared in our top 500 in January, peaking on January 20 at #361, ahead of the Chinese New Year on January 22. A similar rise was seen in the South China Morning Post.
TMZ‘s highest rank was on October 29 (#243), following the announcement of the TV star Matthew Perry‘s death.
BuzzFeed, combining buzzfeed.com and buzzfeednews.com, declined in our Overall ranking, especially after the summer, falling to around #300 in November. In April 2023, it was announced that BuzzFeed News would be shutting down, and it did so in May.
Messaging: WhatsApp rules & Telegram rises
Messaging is seen as a type of social media and remains as relevant as ever including for specific communication purposes. Apple’s iMessage is not included in this category, because it doesn’t have a unique domain name whose traffic can be analyzed. Keeping that in mind, WhatsApp remained the top messaging service in 2023, consistent with its position in 2022.
Top — Messaging services 2023
WhatsApp
QQ
Viber
Telegram
LINE
Signal
WeChat
Messenger
GroupMe
Kik
Following WhatsApp is the Chinese service QQ, also known as Tencent QQ, which includes games and mobile payments and is popular in Asia, at #2. Viber, popular in Eastern Europe, Asia, and the Middle East, comes next. The top three are unchanged from 2022. Telegram, widely used in Eastern Europe and Asia, holds the #4 spot. LINE from Japan briefly contested this position early in 2023. Signal follows, and the Chinese app WeChat is at #7, ahead of Facebook’s Messenger.
The list concludes with Microsoft’s GroupMe and the Canadian service Kik Messenger. The standings are similar to 2022, but Telegram, WeChat, and Signal have shown improvements.
Here are other messaging trends from our Overall ranking:
WhatsApp‘s was generally most popular between late May and early September, though its peak came on November 14th, when it reached #13 in our Overall ranking (a rank it shared that month with X/Twitter).
Telegram rose to #79 overall on June 24, following the Wagner Group rebellion in Russia, which occurred June 23-24.
WeChat saw a significant spike the first quarter of the year on January 21-22, Chinese New Year‘s Eve and respective New Year day. WeChat peaked in 2023 at #122 on August 19, coinciding with news regarding China’s military drills around Taiwan.
Metaverse & Gaming: Roblox leads, Oculus grows
Is gaming part of the metaverse? In a sense, one could argue that it depends on the game, given that it is all about being immersed in another world. Concepts aside, we’ve included both in the same category since last year. Roblox was the uncontested winner of this category in 2023, followed by two services that are now much more than just popular gaming consoles, but also popular online gaming services: Microsoft’s Xbox and Sony’s PlayStation.
Top 10 — Metaverse & Gaming services 2023
Roblox
Xbox/Xbox Live
Epic Games/Fortnite
PlayStation
Oculus
Steam
Electronic Arts
Blizzard
Nintendo
Riot Games/League of Legends
Xbox and PlayStation were at the podium of the list for most of the year. The top spots were similar to 2022, but PlayStation, which was #3 last year, was surpassed by Epic Games (known for Fortnite) during the last part of 2023.
Oculus, a VR headset and also metaverse experience service owned by Meta (we’re considering domains related to those two aspects provided by Meta’s Reality Labs), rose in the rankings to #5, continuing a trend from late 2022. It reached as high as #2 on June 29, and again on October 3-4 after the announcement of Quest 3 at Meta Connect 2023.
Steam was more popular than Oculus from July to September, reaching #5. Electronic Arts was a solid #7 throughout the year, and Blizzard (famous for World of Warcraft and an Activision Blizzard subsidiary), was mostly in #8. The top 10 list ends with Nintendo and Riot Games/League of Legends ‘battling’ for the #9 and #10 spots, with the latter overtaking Nintendo since September.
Here’s the top 10 chart across 2023:
Financial services: Stripe takes the lead, Black Friday impact
The financial services sector is diverse, ranging from traditional banking to cryptocurrency-only services to tax-related services. This year, Stripe, an Irish-American payment platform, dethroned PayPal as the top service in this category.
Top 10 — Financial Services 2023
Stripe
PayPal
Alipay
TradingView
Nubank (BR)
Intuit
American Express
Binance
Bradesco Bank
CoinGecko
PayPal started the year at #1 but was overtaken by Stripe on most days since March. PayPal still led on some weekends during the summer and on Black Friday. TradingView lost its #3 spot to Alipay in late July. Intuit was more popular early in the year, peaking on April 18, the Tax Day in the United States, but ended mostly at #5 on weekdays (see our 2022 blog post on how Tax Day impacts related sites for more on this trend).
The Brazilian Nubank, an online-only bank or neobank, and the largest of its kind in Latin America, was a surprise at #6, often reaching higher ranks on weekends, especially on Saturdays, as it peaked on June 3 and July 1.
Focusing on specific crypto services in the Financial category (more on crypto below), we can see that Binance lost ground throughout 2023, especially after August moving between #8 and #9. This is a change from its trend in 2022, when Binance was on a growth trajectory and ranked #6. CoinGecko, a cryptocurrency data aggregation and tracking website, made a late appearance in 2023 with several days as #6 in November, and Coinbase appeared at #10 after late October. Here’s the crypto perspective in this Financial services category:
Here are other financial services trends from our Overall ranking
Investing.com‘s peak at #199 occurred on March 13, three days after the collapse and seizure of Silicon Valley Bank (SVB), and the same day that bank shares plunged on contagion fears — a period known as the 2023 US banking crisis. It was the same day MarketWatch also peaked (#293).
Online-only financial services such as PayPal (#71) and Klarna (#211) reached their annual peak in our Overall ranking on Black Friday, November 24. Stripe, however, had a clear spike at #77 on that day, but its best day was on November 10, at #68.
Venmo, an American mobile payment service owned by PayPal, had its best month in September.
Crypto: Binance declines and CoinGecko rises
In addition to our Financial Services category, we also evaluated cryptocurrency-related services in particular. Despite the disappearance of Sam Bankman-Fried’s FTX from our rankings after its bankruptcy in November 2022, the crypto sector continues to show several changes this year. Binance, Coinbase, and CoinGecko (a provider of crypto data tools) remain at the top of the list, a trend similar to 2022. While Binance held on to its #1 position across most of 2023, in the last month it was overtaken by CoinGecko.
Top 10 — Cryptocurrency services 2023
Binance
CoinGecko
Coinbase
CoinMarketCap
NiceHash
OKX
MEXC
CryptoCompare
Kraken
Crypto.com
Throughout the year, CoinGecko gained momentum, surpassing the cryptocurrency exchange platforms Binance and Coinbase in November. CoinMarketCap and NiceHash were also prominent, with CoinMarketCap reaching #4 by October. OKX, MEXC, and Crypto.com were already in the top 10 in 2022, and CryptoCompare, Kraken, and Trust: Crypto & Bitcoin, which also competed for the #10 position, were new inclusions in 2023. Kucoin and Etherscan fell out of the 2023 top 10 after being there in 2022.
What happened to Binance? In both the Financial Services and Cryptocurrency categories, we noticed Binance, a key cryptocurrency player, lost its leading position in 2023, dropping to #2 in November. The company faced challenges in July, with several top executives leaving. Then, in November, US authorities filed a lawsuit against Binance, resulting in multiple charges and fines. In our Overall ranking, Binance’s highest point was on April 19, the day after US Tax Day, ranking at #122. However, its rank fell later, though it slightly improved to around #140 by November.
Other trends from our overall ranking: Taylor, Beyoncé, GitHub and Spotify’s popularity
Outside the categories we reviewed in the Year in Review, several notable trends emerged in our Overall ranking:
Taylor Swift’s official site entered our top 500 on August 10 (#464), when she announced her album ‘1989 (Taylor’s Version)‘ in Los Angeles and on social media.
Surprise!! 1989 (Taylor’s Version) is on its way to you 🔜! The 1989 album changed my life in countless ways, and it fills me with such excitement to announce that my version of it will be out October 27th. To be perfectly honest, this is my most FAVORITE re-record I’ve ever done… pic.twitter.com/JFYOWhBxhj
Beyoncé’s official site went even higher on our overall ranking than Swift’s. It appeared only on June 15, but reached #346. In the news that day (and the day before), the Financial Times reported that economists at Danske Bank believed that Beyoncé’s decision to start her world tour in Stockholm led to a surge in local hotel prices that resulted in inflation in Sweden, calling it “astonishing for a single event”. At the time, June 15, Beyoncé had a Cologne, Germany, concert, where a fan gender reveal also made the news.
GitHub is a top 50 site in our Overall ranking, and it showed clear growth in 2023, moving from #49 to #42 in November. It reached its highest point at #36 on January 19, when it announced reaching 100 million developers, and had another peak on May 12 at #38. Have any guesses about what contributed to these peaks (or any of the others you see in our report)? Let us know at @CloudflareRadar.
Spotify’s best day in 2023 was on Black Friday, November 24, when it reached #57, after showing significant growth throughout November. However, our list ends on November 25, so we couldn’t capture the impact of the recently launched Spotify Wrapped.
NASA. This year, NASA continued to showcase images from the James Webb Space Telescope. The NASA website peaked in our ranking on October 12 at #160, the day before the scheduled launch of NASA’s Psyche mission, aimed at exploring a unique metal-rich asteroid. Another peak occurred on April 28 at #172, coinciding with a broadcasted spacewalk at the International Space Station.
SpaceX. SpaceX had its best and only notable days in our ranking (within the overall top 500) on April 17 (#412), followed by April 20 (#416). April 17 marked SpaceX’s Starship orbital flight‘s first attempt, which was aborted just before launch and then resumed on April 20.
Craigslist. The American classified ads website saw a decline in our ranking this year, with its lowest point in November and its worst day on Black Friday, when it fell to #268.
DHL. The courier service improved its ranking in 2023, with its best performance in November, peaking on Thanksgiving Day, November 23, in the US at #211.
NFL (National Football League). The NFL site had its first significant peak on April 29 at #189, the day of the NFL Draft, surpassing even the Super Bowl’s popularity. This peak was matched only by weekends after September 10, when it climbed as high as #160.
Flightradar24’s most-trafficked day was April 23, when an American Airlines flight made an emergency landing in Ohio due to an engine fire. It rose to #176 on that day.
Waze. The traffic app had lower rankings between June and early September (summer in the Northern Hemisphere), peaking on March 19 at #142 and on October 2 at #145.
Tides & Currents. The US Weather Service peaked on August 29-30 at #215 during Hurricane Idalia, described as “an unprecedented event,” as the storm approached Florida’s Gulf Coast.
Wrap up: 2023, shifting AI and e-commerce tides
The Internet plays a role in socializing, entertaining, working, communicating, learning, and staying informed when you most need it. In our popular Internet services rankings, the dominance of giants like Google and Facebook, and the relevance of TikTok and others, underscore the continued influence of established players in shaping online interactions and content consumption. However, the rise of generative AI services, notably OpenAI’s ChatGPT, signals an exciting sector that is rapidly gaining traction. Let’s see where generative AI services can go in 2024.
In the social media realm, X/Twitter seems to be losing some influence in our ranking but continues to be highly influential, and much higher than the direct competition. Mastodon, Threads, and others still have a long way to go to compete. Although not seen as direct microblogging competition, Discord and Reddit continue to show growth.
An emerging player, Temu, made significant strides in the E-commerce realm. In the cryptocurrency space, Binance lost momentum as CoinGecko gained traction. In the gaming and metaverse sectors, the highlights included Roblox’s consistency and Oculus’s growth.
Looking ahead, the trends observed in 2023 set the stage for an even more interconnected and technologically advanced future. The growing importance of AI, the steadfast popularity of social media, and the evolving dynamics in e-commerce and financial services suggest a future where humans will have to continue to adapt to the opportunities and challenges that lie ahead.
Creating rankings is a team effort that comes with its own challenges and requires careful attention and frequent updates. If you want to help us make these categorical rankings better, you can. Feedback is appreciated, including regarding other categories to include in the 2024 Year in Review.
(Our data scientist, Sabina Zejnilovic, played a crucial role in accurately gathering the Internet services data and contributed to this blog post, as did David Belson with his guidance, along with many others.)
Throughout the year, special events lead to changes in Internet traffic. We observed this with Thanksgiving in the US last week, where traffic dipped, and during periods like Black Friday (November 24, 2023) and Cyber Monday (November 27, 2023), where traffic spiked.
But how significant are these Cyber Week days on the Internet? Is it a global phenomenon? Does e-commerce interest peak on Black Friday or Cyber Monday, and are attacks increasing during this time? These questions are important to retailers and stakeholders around the world. At Cloudflare, we manage substantial traffic for our customers, which gives us a unique vantage from which to analyze traffic and attack patterns across large swaths of the Internet.
As we’ll explore next, we observed varying trends. From a global perspective, there was a clear Internet traffic winner: Cyber Monday was the highest overall traffic day of 2023 (as it was for 2022), followed by Black Friday, and then Monday, November 21 from the same week. But zooming in, this pattern didn’t hold in some countries.
For this analysis, we examined anonymized samples of HTTP requests crossing our network, as well as DNS queries. Cloudflare’s global data shows that peak request traffic occurred on Cyber Monday, and that recent weeks have generally been the year’s busiest. Here are some notable figures:
Cloudflare processed a peak of 80 million HTTP requests per second at 16:10 UTC on November 27.
The peak hour of 16:00 UTC saw more than 230 billion hourly requests.
Cloudflare powered around 4 trillion daily requests on Cyber Monday (with blocked attacks comprising around 5% of all traffic), a figure only approached by Black Friday, which saw 3.86 trillion requests.
There was a 27% increase in HTTP requests on Cyber Monday 2023 (November 27) as compared to Cyber Monday 2022 (November 28).
What about DNS queries?
Our 1.1.1.1 resolver showed that Cyber Monday 2023 experienced a peak of 1.68 trillion queries per day, with 22 million queries per second around 15:00 UTC. Of these DNS queries, 15% were encrypted (HTTPS and TLS). Back in August, the peak was at 1.35 trillion queries per day, marking a 24% increase.
Traffic to our authoritative DNS servers also peaked on Cyber Monday, with 811 billion daily queries and a peak of 9.4 million queries per second around 15:00 UTC.
So, during Cyber Monday, we saw a combined peak of over 100 million requests and queries per second across all Cloudflare services at around 16:00 UTC (November 27).
Black Friday week Internet traffic daily ranking
These numbers and trends are consistent with what we observed in 2022 and previous years, where traffic peaks in late November but usually drops in December. Here’s a snapshot of global human Internet traffic this year (bot traffic shows a similar pattern).
Worldwide. Most popular Internet traffic days
Cyber Monday, November 27
Black Friday, November 24
Monday, November 21
From the US perspective, the ranking is similar, with Saturday, November 25, the day after Black Friday, ranking as the third busiest day for Internet traffic.
US. Most popular Internet traffic days
Cyber Monday, November 27
Black Friday, November 24
Saturday, November 25
Additionally, most U.S. states show a similar trend, with Cyber Monday experiencing the most traffic, followed by Black Friday. However, Alaska is a notable exception, where the days with the highest Internet traffic were November 13 and 14, coinciding with a snow emergency that closed schools and roads.
States like Colorado, Hawaii, Idaho, New Mexico, and California also had Saturday, November 25, as their second busiest day, but Cyber Monday also “won” there.
Does the Black Friday week impact other countries?
Internationally, a trend of peak Internet traffic in November is observed in most countries, as highlighted in our previous 2022 Year in Review (stay tuned for our 2023 edition in the next few weeks). This trend is likely linked to colder weather in the Northern Hemisphere, where approximately 87% of the world’s population resided in 2023, as well as holidays and shopping periods, among other factors.
Here’s a table summarizing the November days with the most traffic, where the Black Friday week plays a significant role.
Most popular Internet traffic days
UK.
#1. Black Friday, November 24
#2. Cyber Monday, November 27
#3. Sunday, November 20
Canada.
#1. Black Friday, November 24
#2. Cyber Monday, November 27
#3. Thursday, November 23
Germany.
#1. Black Friday, November 24
#2. Sunday, November 26
#3. Cyber Monday, November 27
Mexico.
#1. Monday, November 21
#2. Friday, November 17 (one week before Black Friday)
#3. Black Friday, November 24
France.
#1. Cyber Monday, November 27
#2. Sunday, November 26
#3. Black Friday, November 24
Brazil.
#1. Tuesday, November 22
#2. Black Friday, November 24
#3. Monday, November 21
Spain.
#1. Cyber Monday, November 27
#2. Sunday, November 20
#3. Monday, November 21
Australia.
#1. Black Friday, November 24
#2. Thursday, November 23
#3. Sunday, November 20
Egypt.
#1. Saturday, November 25
#2. Sunday, November 26
#3. Black Friday, November 24
Singapore.
#1. Cyber Monday, November 27
#2. Black Friday, November 24
#3. Thursday, November 23
Turkey.
#1. Sunday, November 26 (Black Friday weekend)
#2. Saturday, November 25
#3. Singles Day, November 11
Philippines.
#1. Cyber Monday, November 27
#2. Wednesday, November 22
#3. Sunday, November 20
Countries like India, Japan, South Korea, Thailand, and Indonesia, though they show increased traffic during October and November compared to other months, do not exhibit an obvious increase in traffic during Black Friday week.
Singles’ Day (November 11), a popular Asian shopping event, only features in the top three traffic days in Turkey. In China, October saw bigger traffic peaks than November. However, in November, both Black Friday and the following day (November 25) showed clear increases in traffic, similar to Singles’ Day. In South Africa, Singles’ Day and Black Friday were the busiest traffic days in November, even though October also had higher peaks.
Black Friday goes mobile, Cyber Monday goes desktop
We observed last week that during Thanksgiving Day, mobile use in US Internet traffic was higher than in the previous week. This trend was intensified on Black Friday, peaking at 55.3% of all traffic, surpassing the typical weekend, which usually sees a higher mobile usage percentage. However, on Cyber Monday, desktop use took the lead, with the percentage of mobile device traffic dropping to 47.6%, lower than the previous Monday.
This trend seems to suggest that Black Friday shopping might involve more offline activities, with people in the US using their mobile devices more for Internet access on that day.
E-commerce DNS trends
Using our 1.1.1.1 resolver, we have a more focused, category-specific view of the DNS traffic growth to e-commerce sites. There’s a general rising trend throughout November, very similar to what we observed in the Internet traffic section.
Looking more closely at the US aggregated e-commerce sites, it’s evident that Cyber Monday and Black Friday, in that order, were the days with the most DNS traffic, with Saturday, November 25, ranking third on the podium — exactly mirroring the HTTP traffic pattern discussed earlier.
The peak hours of DNS traffic on Black Friday were around 16:00 and 17:00 UTC, which correspond to 12:00 and 13:00 EST and 09:00 and 10:00 PST. The same pattern was observed on Cyber Monday.
During Cyber Week (November 20 to 27), there was a 15% increase in DNS traffic compared with the previous week. A consistently high level of DNS traffic was maintained throughout Black Friday week, starting on Monday, November 20, with the sole exception being a noticeable drop on Thanksgiving Day — DNS traffic to e-commerce sites was 6% lower than the previous week on that day.
A glimpse into Europe’s e-commerce trends
The UK shows a very similar trend to the US in terms of Black Friday and Cyber Monday interest. However, in 2023, Black Friday and Cyber Monday are tied for the top spot, followed by Tuesday, November 21.
In Australia, Cyber Monday ranked as the most popular day for e-commerce DNS traffic, followed by Black Friday. Canada showed a similar pattern, with Black Friday being the most trafficked day, followed by Cyber Monday.
In Germany, Black Friday indisputably led in e-commerce DNS traffic, followed by the previous Friday, November 17, and then the Black Friday weekend. Cyber Monday did not make it to the top three in Germany.
In France, Black Friday was the most popular e-commerce day, followed by Saturday, November 18.
Electronics, fast fashion, and second-hand trends
Focusing on the US only again, electronics e-commerce sites experienced more DNS traffic on Black Friday than on Cyber Monday.
This trend was mirrored in the fast fashion category, with Black Friday clearly in the lead.
It’s perhaps unsurprising that second-hand shopping sites in the US gained more momentum and DNS traffic in the preceding week (November 12-18) leading up to Black Friday. However, these sites then reached their peak on Cyber Monday.
How about cyber threats?
Regarding cyber threats, let’s focus on DDoS (distributed denial-of-service) attacks, a popular method for disrupting Internet properties. Data from November 2023 shows that on Thanksgiving, DDoS attacks accounted for the lowest daily fraction of traffic volume observed in the month of November across the US. There were higher percentages of DDoS attacks in late August and September, associated with the HTTP/2 Zero-Day vulnerability, which led to record-breaking attacks.
The Black Friday week was not a peak period for DDoS attacks. The highest activity occurred earlier, mainly in the week of November 6-13.
This pattern is consistent with 2022, where a higher percentage of DDoS attacks was observed before November 21.
Going back to 2023, in terms of potential blocked attacks targeting the “Shopping & General Merchandise” industry, a similar pre-Black Friday week trend is evident. Here we’re including both DDoS and attacks blocked by the Managed Ruleset enforced by Cloudflare’s Web Application Firewall, and it’s a global perspective. The peak of 7.3 billion daily HTTP requests occurred during the weekend before Thanksgiving (November 18), coinciding with early Black Friday promotions.
Conclusion
The trends in Internet traffic during events like Black Friday and Cyber Monday highlight a complex pattern of behavior globally and regionally. Cyber Monday leads the way in Internet traffic, closely followed by Black Friday. The trends in the US and UK are similar, but other countries like Germany and France show distinct patterns. The period before Black Friday also gained traction in terms of Internet and e-commerce activity in some countries.
The shift towards mobile usage on Black Friday and desktop dominance on Cyber Monday (in the US) suggests different consumer behaviors, with e-commerce sites experiencing significant DNS traffic increase during these peak shopping periods.
In terms of cybersecurity, while attacks are constant, we observed a lower incidence of DDoS attacks during the Black Friday week in 2023, but there was a clear increase in the two weeks leading up to the most shopping-intense period.
And finally — don’t forget, you can check Cloudflare Radar to track global and country-specific Internet traffic trends.
Thanksgiving is a tradition celebrated by millions of Americans across six time zones and 50 states, usually involving travel and bringing families together. This year, it was celebrated yesterday, on November 23, 2023. With the Internet so deeply enmeshed into our daily lives, anything that changes how so many people behave is going to also have an impact on online traffic. But how big an impact, exactly?
At a high level: a 10% daily decrease in Internet traffic in the US (compared to the previous week). That happens to be the exact same percentage decrease we observed in 2022. So, Thanksgiving in the US, at least in the realm of Internet traffic, seems consistent with last year.
Let’s dig into more details about how people deal with cooking (or online ordering!) and whether family gatherings are less online, according to our Cloudflare Radar data. We’ll also touch on whether hackers stop for turkey, too.
The Thanksgiving hour: around 15:00 (local time)
While we can see a 10% overall daily drop in US traffic due to Thanksgiving, the drop is even more noticeable when examining traffic on an hour-by-hour basis. Internet activity began to decrease significantly after 12:00 EST, persisting until 19:00 EST (during those times, it was at least 15% lower compared to the previous week).
The peak drop for the entire country occurred around 21:00 UTC, which is 16:00 EST and 13:00 PST. That drop represented 22% less traffic than the previous week at the same hour. That’s also the same time and percentage of drop we’ve seen in 2022.
If we continue the country-wide comparison with the previous week, we also see how traffic really begins to pick up again during early Black Friday morning in the US (as much as 18% higher than in the previous week).
However, it’s also interesting to do an analysis of state by state looking at local time. One question we were curious about: from an Internet perspective, what time best represents the Thanksgiving hour? This would be the time when traffic dropped the most in each state.
We find that across states, it’s not exactly 4pm, as The Atlantic has made a case for!, but rather, most states experience the largest drop the hour before — 15:00 local time. But that’s not the only interesting trend! We observe that:
Central US states such as Kansas, Iowa, Alabama, or Mississippi apparently had an earlier Thanksgiving — given the biggest drop in traffic was at 13:00.
Coastal US states like Washington, California, Florida, Maryland, or Delaware had a later Thanksgiving, around 17:00. There’s also Hawaii, which had the latest of all — experiencing the biggest drop in traffic around 18:00 local time.
What surprised us the most when looking at these trends was how the “Thanksgiving time” was the same from our 2022 data in almost all the states, but also the hourly and daily drop in traffic across the US was mostly the same. It appears that when it comes to Thanksgiving, we are indeed creatures of habit.
The Thanksgiving effect: US states where traffic drop the most
To consider when traffic drops the most, we look between the local time of 13:00-18:00 and compare that to the week before.
This method allows us to observe clear differences between states, with more central US states showing larger drops in traffic compared to the previous week, while coastal states are not as significantly impacted. The exception along the US coast is Massachusetts, which experienced a 31% drop in traffic. East coast states also show a bigger drop in traffic compared to the West coast.
Here’s the ranking of the 50 states (plus DC or the District of Columbia), ordered by the biggest drops in traffic, for those who want to explore our data better:
U.S. State
Drop in traffic %
Peak Internet traffic drop (local time)
North Dakota
-36%
15:00 (CST)
South Dakota
-35%
14:00 (CST)
Mississippi
-33%
13:00 (CST)
District of Columbia
-32%
16:00 (EST)
Oklahoma
-32%
14:00 (CST)
Massachusetts
-31%
16:00 (EST)
Arkansas
-30%
14:00 (CST)
Rhode Island
-30%
16:00 (EST)
Kansas
-28%
13:00 (CST)
Connecticut
-27%
16:00 (EST)
Idaho
-27%
16:00 (MST)
New Hampshire
-27%
14:00 (EST)
Colorado
-26%
16:00 (MST)
Louisiana
-25%
14:00 (CST)
Maine
-25%
15:00 (EST)
New Mexico
-25%
14:00 (MST)
Pennsylvania
-25%
16:00 (EST)
Utah
-25%
15:00 (MST)
Arizona
-24%
16:00 (MST)
Missouri
-24%
15:00 (CST)
Maryland
-23%
17:00 (EST)
Georgia
-22%
16:00 (EST)
Tennessee
-22%
14:00 (CST)
Vermont
-22%
15:00 (EST)
Delaware
-21%
17:00 (EST)
Indiana
-21%
15:00 (EST)
Minnesota
-21%
15:00 (CST)
New York
-21%
16:00 (EST)
Alaska
-20%
16:00 (AKST)
Florida
-20%
17:00 (EST)
Iowa
-20%
13:00 (CST)
Kentucky
-20%
14:00 (EST)
Michigan
-20%
16:00 (EST)
North Carolina
-20%
16:00 (EST)
Texas
-20%
15:00 (CST)
Wisconsin
-20%
15:00 (CST)
Alabama
-19%
13:00 (CST)
Ohio
-18%
16:00 (EST)
South Carolina
-18%
15:00 (EST)
New Jersey
-17%
16:00 (EST)
West Virginia
-17%
16:00 (EST)
Illinois
-16%
16:00 (CST)
Nebraska
-16%
15:00 (CST)
Montana
-15%
16:00 (MST)
Washington
-15%
17:00 (PST)
California
-14%
17:00 (PST)
Nevada
-12%
17:00 (PST)
Oregon
-12%
15:00 (PST)
Wyoming
-10%
16:00 (MST)
Hawaii
-9%
18:00 (HST)
Virginia
-9%
16:00 (EST)
Mobile traffic percentage goes up
Another, perhaps unsurprising, trend is the rise of mobile devices over the Thanksgiving week in the US. Yesterday, on November 23, mobile traffic accounted for 54.5% of the Internet traffic in the US (the graph below rounds the percentages). It followed a similar trend in 2021 — we published a blog about it — and in 2022, although last year it was at 53.8%.
Looking at the past few weeks, the growth in mobile use in US Internet traffic is more evident. The average percentage of mobile traffic during the first week of November was 47% in the US; during this Thanksgiving week, it reached 51%, with the previously mentioned 54.5% peak on Thanksgiving Day (even higher than the typical weekend, which usually demonstrates more mobile usage).
It’s not just mobile usage that’s going up, though. Over the next few days, we’re expecting to see a surge in traffic to make up for the Thanksgiving lull.
The following chart presents the 2022 perspective on HTTP requests in the US, illustrating how the peak traffic of the year was reached on November 28, Cyber Monday. It’s also notable how Christmas Eve and Christmas Day, followed by January 1, 2023, exhibit the most significant drops in traffic in the US.
Food delivery and online groceries trends
Now, let’s explore whether there was an increase in late food delivery or online grocery shopping related to Thanksgiving. Traditionally, this is a time for cooking with family, but not everyone enjoys cooking. DNS traffic (from our 1.1.1.1 resolver) to food delivery sites was higher than the previous week on Tuesday and Wednesday, November 21 and 22, 2023, respectively, but notably dropped in the early morning on Thanksgiving Day.
Daily DNS traffic to food delivery services indicates a gradual increase throughout this month leading up to Thanksgiving Day, followed by a clear drop on the day itself, as much as 12%.
How about online grocery shopping services, catering to those last minute ingredients? DNS traffic to those sites was noticeably higher than the previous week on Tuesday but decreased on Wednesday, experiencing a distinct drop on Thanksgiving Day.
And do hackers stop for turkey, too?
To answer that, let’s examine DDoS (distributed denial-of-service) attacks, which remain one of the most common methods to disrupt or take down Internet properties. Our data indicates that in November 2023, Thanksgiving had the lowest percentage of traffic classified as DDoS attacks targeting the US.
Email messages slow down
Cloudflare Area 1 also enables us to analyze email messages sent from the US perspective. Unsurprisingly, our data reveals a 43% drop in email messages sent on Thanksgiving Day compared to the previous week. However, the spam percentage of all emails originating from the US increased to 4%, significantly higher than the 2% recorded on the same day of the previous week.
On the flip side, messages considered malicious stayed consistent in their percentage of all messages.
Conclusion
“The more you practice the art of thankfulness, the more you have to be thankful for.” — Norman Vincent Peale, American author
Thanksgiving Day in the United States still holds as a strong tradition in 2023, celebrating family, togetherness, and feasting that go beyond state borders and screens. Yet, notable differences exist among states, especially between the coastal and the central areas of the country.
Our data also hints at a slowdown in food deliveries and cyber threats during this time. Perhaps hackers are taking a day off. But, just wait for the story to change on Black Friday and Cyber Monday. We’ll keep an eye out.
Thanksgiving 2023 was also the day we announced that Stable Diffusion and Code Llama AI models are now available as part of Workers AI, running in over 100 cities across Cloudflare’s global network. If you’re looking to tinker with some new technology over this holiday weekend, we think you’ll enjoy these!
And finally — don’t forget, you can check Cloudflare Radar to track global and country-specific Internet traffic trends.
On Saturday, October 7, 2023, attacks from the Palestinian group Hamas launched from the Gaza Strip against the south of Israel started a new conflict in the region. Israel officially declared that it is at war the next day. Cloudflare's data shows that Internet traffic was impacted in different ways, both in Israel and Palestine, with two networks (autonomous systems) in the Gaza Strip going offline a few hours after the attacks. Subsequently, on October 9, two additional networks also experienced outages. We also saw an uptick in cyberattacks targeting Israel, including a 1.26 billion HTTP requests DDoS attack, and Palestine.
Starting with general Internet traffic trends, there was a clear increase in Internet traffic right after the attacks reportedly began (03:30 UTC, 06:30 local time). Traffic spiked at around 03:35 UTC (06:35 local time) in both Israel (~170% growth compared with the previous week) and Palestine (100% growth).
That growth is consistent with other situations, where we’ve seen surges in Internet traffic when countrywide events occur and people are going online to check for news, updates, and more information on what is happening, with social media and messaging also playing a role. However, in Palestine, that traffic growth was followed by a clear drop in traffic around 08:00 UTC (11:00 local time).
The Palestine uptick in traffic after the Hamas attacks started is more visible when only looking at HTTP requests. Requests in Palestine dropped on Saturday and Sunday, October 7 and 8, as much as 20% and 25%, respectively.
Palestine's outages and Internet impact
What drove the drop in Internet traffic in Palestine? Our data shows that two Gaza Strip related networks (autonomous systems or ASNs) were offline on that October 7 morning. Fusion (AS42314) was offline from 08:00 UTC, but saw some recovery after 17:00 UTC the next day; this only lasted for a few hours, given that it went back offline after 12:00 UTC this Monday, October 9.
It was the same scenario for DCC North (AS203905), but it went offline after 10:00 UTC and with no recovery of traffic observed as of Monday, October 9. These Internet disruptions may be related to power outages in the Gaza Strip.
During the day on October 7, other Palestinian networks saw less traffic than usual. JETNET (AS199046) had around half of the usual traffic after 08:00 UTC, similar to SpeedClick (AS57704), which had around 60% less traffic. After 14:15 on October 9, traffic to those networks dropped sharply (a 95% decrease compared with the previous week), showing only residual traffic.
When looking more closely at the Gaza Strip specifically, we can see that some districts or governorates had a drop in HTTP requests a few hours after the first Hamas attacks. The Gaza Governorate was impacted, with traffic dropping on October 7, 2023, after 09:15 UTC. On October 9, at 18:00 UTC, traffic was 46% lower than in the previous week. (Note: there were spikes in traffic during Friday, October 6, several hours before the attacks, but it is unclear what caused those spikes.)
The Deir al-Balah Governorate (on October 9, at 18:00 UTC, traffic was 46% lower than in the previous week) and the Khan Yunis Governorate (50% lower) also both experienced similar drops in traffic:
In the Rafah Governorate traffic dropped after 19:00 UTC on October 8 (and on October 9, at 18:00 UTC, traffic was 65% lower than in the previous week).
Other Palestinian governorates in the West Bank did not experience the same impact to Internet traffic.
Spikes in Internet traffic in Israel
In Israel, Internet traffic surged to ~170% as compared to the previous week right after the Hamas attacks on October 7 at around 03:35 UTC (06:35 local time), and again at around 16:00 UTC (19:00 local time), with ~80% growth compared to the previous week. In both cases, the increase was driven by mobile device traffic.
There was also increased traffic, as compared with usual levels, on Sunday, October 8, with notable spikes at around 06:00 (09:00 local time) and 12:00 UTC (15:00 local time), seen in the HTTP requests traffic graph below.
Mobile device traffic drove the Saturday, October 7 spikes in traffic, with the daily mobile device usage percentage reaching its highest in the past two months, reaching 56%.
Looking at specific Israel districts, traffic looks similar to the nationwide perspective.
Cyber attacks targeting Israel
Cyber attacks are frequent, recurrent, and are not necessarily dependent on actual wars on the ground, as our 2023 attacks landscape clearly showed. However, it is not unusual to see cyberattacks launched in tandem with ground assaults. We saw that in Ukraine, an uptick in cyber attacks started just before war began there on February 24, 2022, and were even more constant, and spread to other countries after that day.
In Israel, we saw a clear uptick in cyber attacks earlier this year, with another wave of notable attacks on October 7 and October 8, 2023, after the Hamas attacks. The largest ones were DDoS attacks targeting Israeli newspapers. One attack on October 8, reached 1.26 billion daily requests blocked by Cloudflare as DDoS attacks, and the other reached 346 million daily requests on October 7, and 332 million daily requests the following day.
Looking at these DDoS attacks in terms of requests per second, one of the impacted sites experienced a peak of 1.1 million requests per second on October 8 at 02:00 UTC, and the other Israeli newspaper saw a peak of 745k requests per second at around 06:00 the same day.
In Palestine, we also saw application layer DDoS attacks, but not as big. The main one in the past three months was on October 7, 2023, targeting a Palestine online newspaper, reaching 105 million daily requests.
Looking at these most notable DDoS attacks targeting Palestine in terms of requests per second (rps), the most impacted site (a Palestinian newspaper) experienced a peak of 214k requests per second at around 17:20 UTC on October 7.
Follow Cloudflare Radar for up to date information
To provide the best experiences, we use technologies like cookies to store and/or access device information. Consenting to these technologies will allow us to process data such as browsing behavior or unique IDs on this site. Not consenting or withdrawing consent, may adversely affect certain features and functions.
Functional
Always active
The technical storage or access is strictly necessary for the legitimate purpose of enabling the use of a specific service explicitly requested by the subscriber or user, or for the sole purpose of carrying out the transmission of a communication over an electronic communications network.
Preferences
The technical storage or access is necessary for the legitimate purpose of storing preferences that are not requested by the subscriber or user.
Statistics
The technical storage or access that is used exclusively for statistical purposes.The technical storage or access that is used exclusively for anonymous statistical purposes. Without a subpoena, voluntary compliance on the part of your Internet Service Provider, or additional records from a third party, information stored or retrieved for this purpose alone cannot usually be used to identify you.
Marketing
The technical storage or access is required to create user profiles to send advertising, or to track the user on a website or across several websites for similar marketing purposes.