All posts by John Graham-Cumming

Understanding Where the Internet Isn’t Good Enough Yet

Post Syndicated from John Graham-Cumming original https://blog.cloudflare.com/understanding-where-the-internet-isnt-good-enough-yet/


Understanding Where the Internet Isn’t Good Enough Yet

Understanding Where the Internet Isn’t Good Enough Yet

Since March 2020, the Internet has been the trusty sidekick that’s helped us through the pandemic. Or so it seems to those of us lucky enough to have fast, reliable (and often cheap) Internet access.

With a good connection you could keep working (if you were fortunate enough to have a job that could be done online), go to school or university, enjoy online entertainment like streaming movies and TV, games, keep up with the latest news, find out vital healthcare information, schedule a vaccination and stay in contact with loved ones and friends with whom you’d normally be spending time in person.

Without a good connection though, all those things were hard or impossible.

Sadly, access to the Internet is not uniformly distributed. Some have cheap, fast, low latency, reliable connections, others have some combination of expensive, slow, high latency and unreliable connections, still others have no connection at all. Close to 60% of the world have Internet access leaving a huge 40% without it at all.

This inequality of access to the Internet has real-world consequences. Without good access it is so much harder to communicate, to get vital information, to work and to study. Inequality of access isn’t a technical problem, it’s a societal problem.

This week, Cloudflare is announcing Project Pangea with the goal of helping reduce this inequality. We’re helping community networks get onto the Internet cheaply, securely and with good bandwidth and latency. We can’t solve all the challenges of bringing fast, cheap broadband access to everyone (yet) but we can give fast, reliable transit to ISPs in underserved communities to help move in that direction. Please refer to our Pangea announcement for more details.

The Tyranny of Averages

To understand why Project Pangea is important, you need to understand how different the experience of accessing the Internet is around the world. From a distance, the world looks blue and green. But we all know that our planet varies wildly from place to place: deserts and rainforests, urban jungles and placid rural landscapes, mountains, valleys and canyons, volcanos, salt flats, tundra, and verdant, rolling hills.

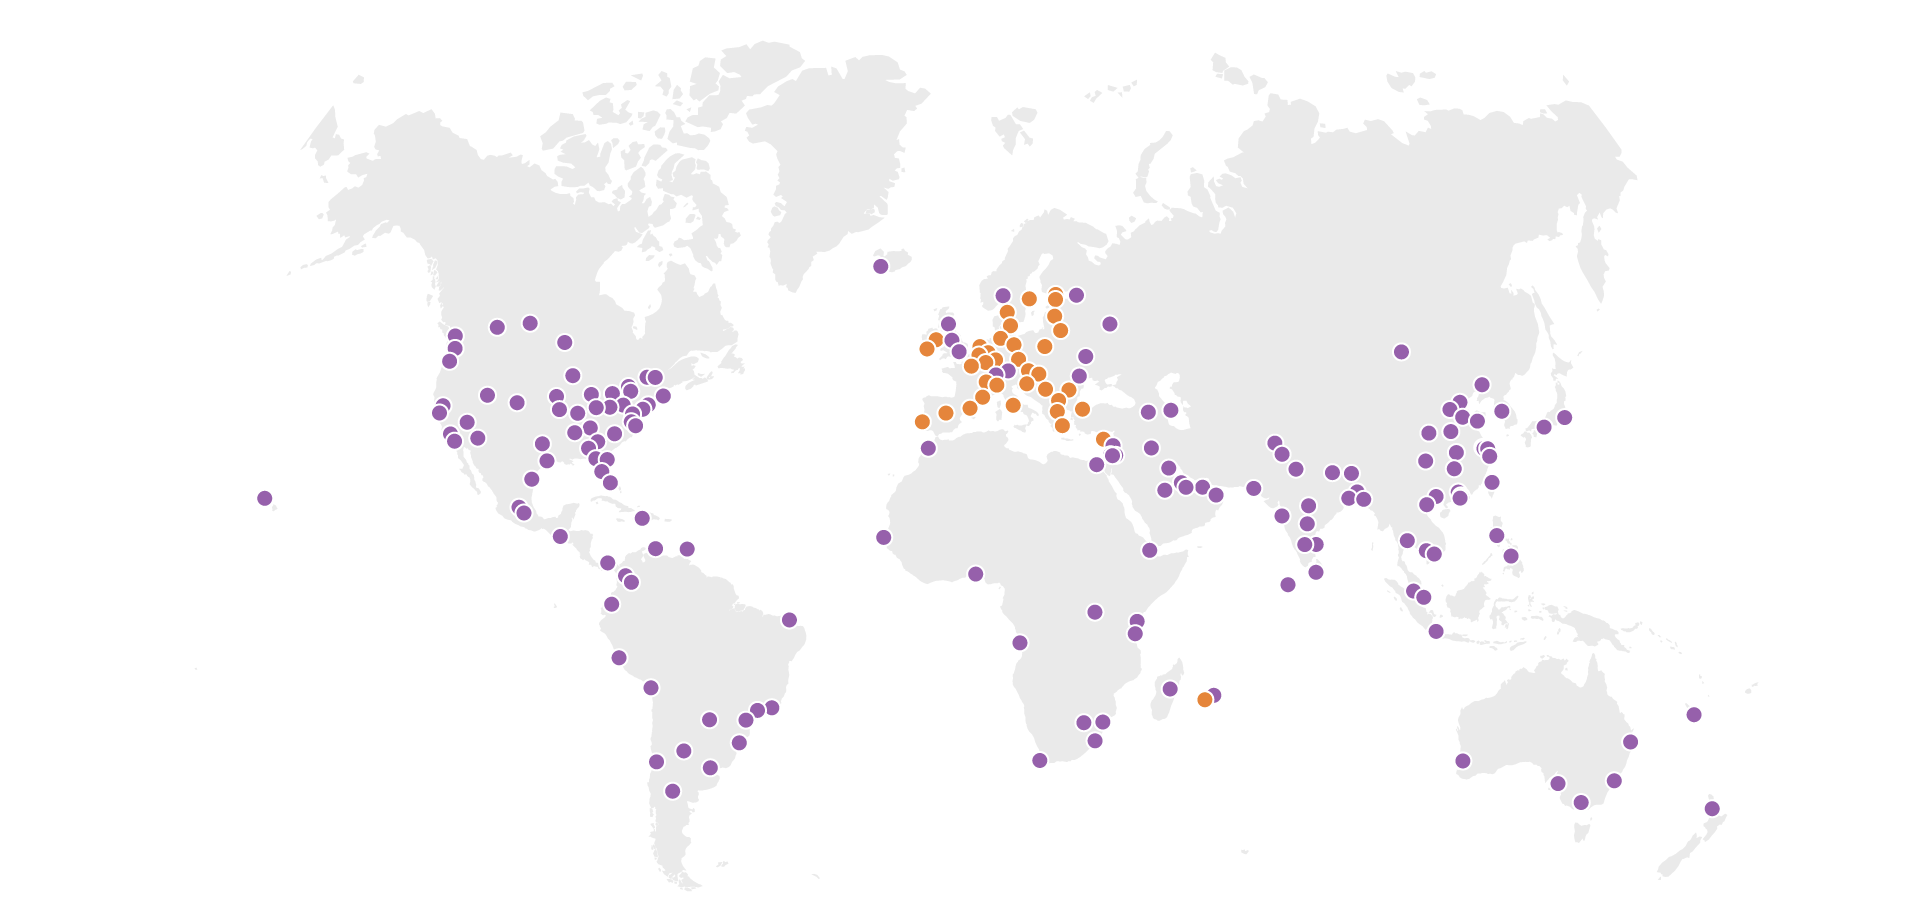
Cloudflare is in a unique position to measure the performance and reach of the Internet over this vast landscape. We have servers in more than 200 cities in over 100 countries, we process 10s of trillions of Internet requests every month. Our network and customers and their users span the globe, every country in every network.

Zoom out to the level of a city, county, state, or country, and average Internet performance can look good — or, at least, acceptable. Zoom in, however, and the inequalities start to show. Perhaps part of a county has great performance, and another limps along at barely dial-up speeds — or worse. Or perhaps a city has some neighborhoods with fantastic fiber service, and others that are underserved and struggling with spotty access.

Inequality of Internet access isn’t a distant problem, it’s not limited to developing countries, it exists in the richest countries in the world as well as the poorest. There are still many parts of the world  where a Zoom call is hard or impossible to make. And if you’re reading this on a good Internet connection, you may be surprised to learn that places with poor or no Internet are not far from you at all.

Bandwidth and Latency in Eight Countries

For Impact Week, we’ve analyzed Internet data in the United States, Brazil, United Kingdom, Germany, France, South Africa, Japan, and Australia to build a picture of Internet performance.

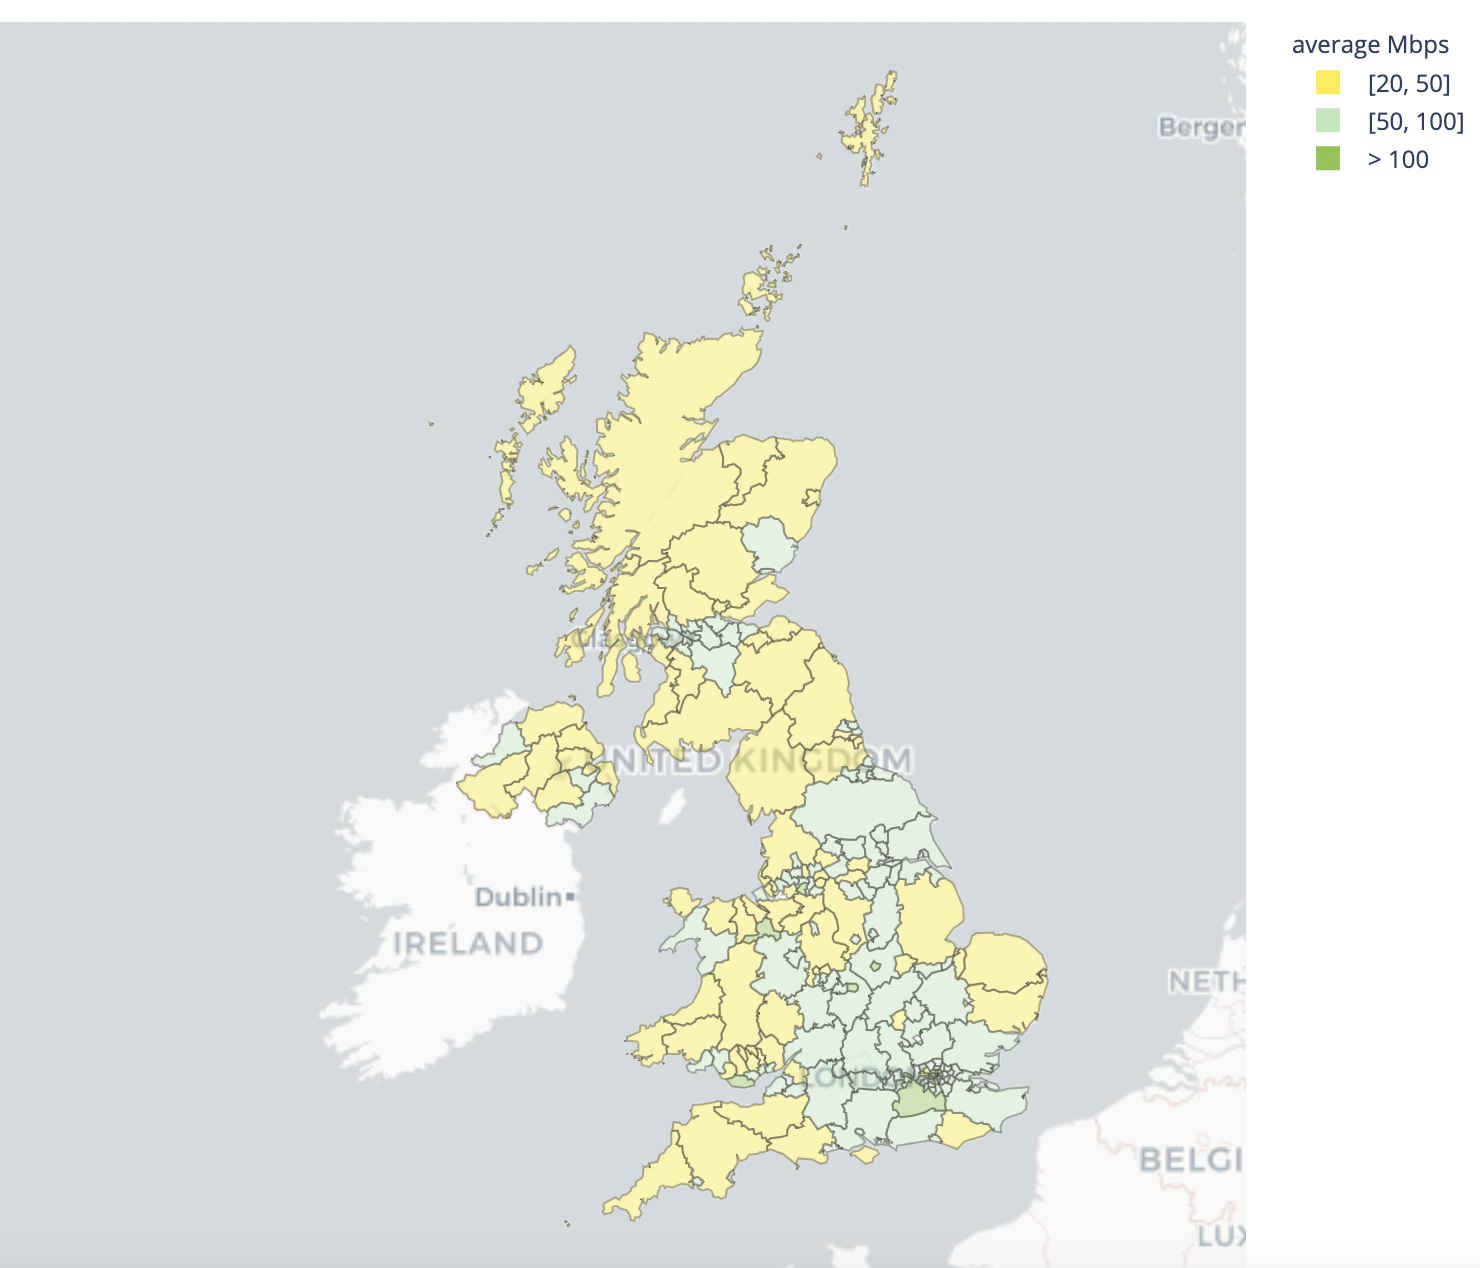
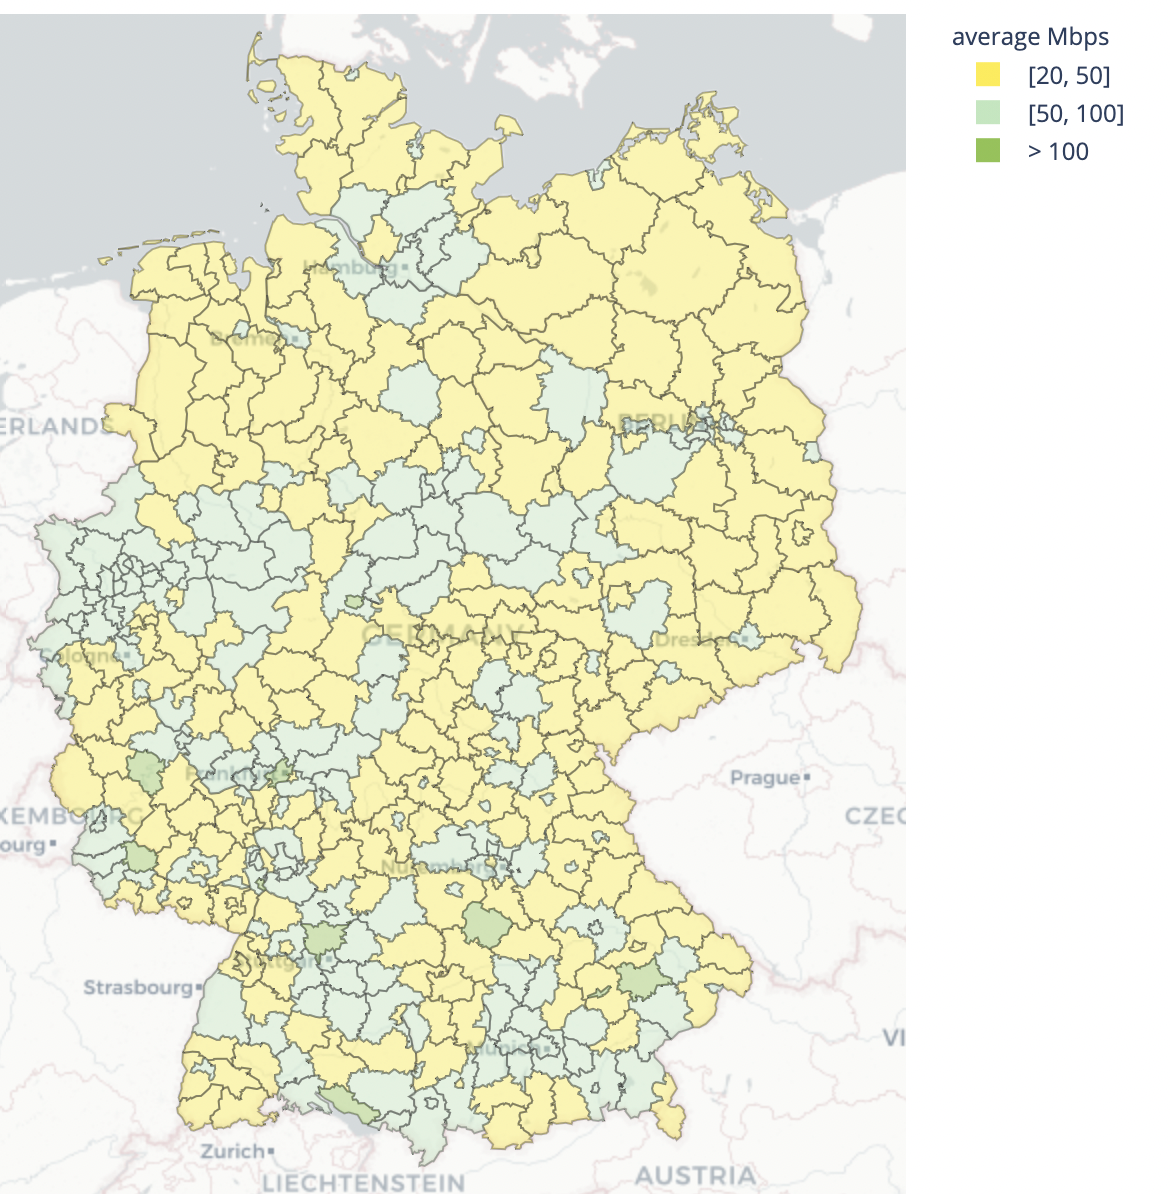
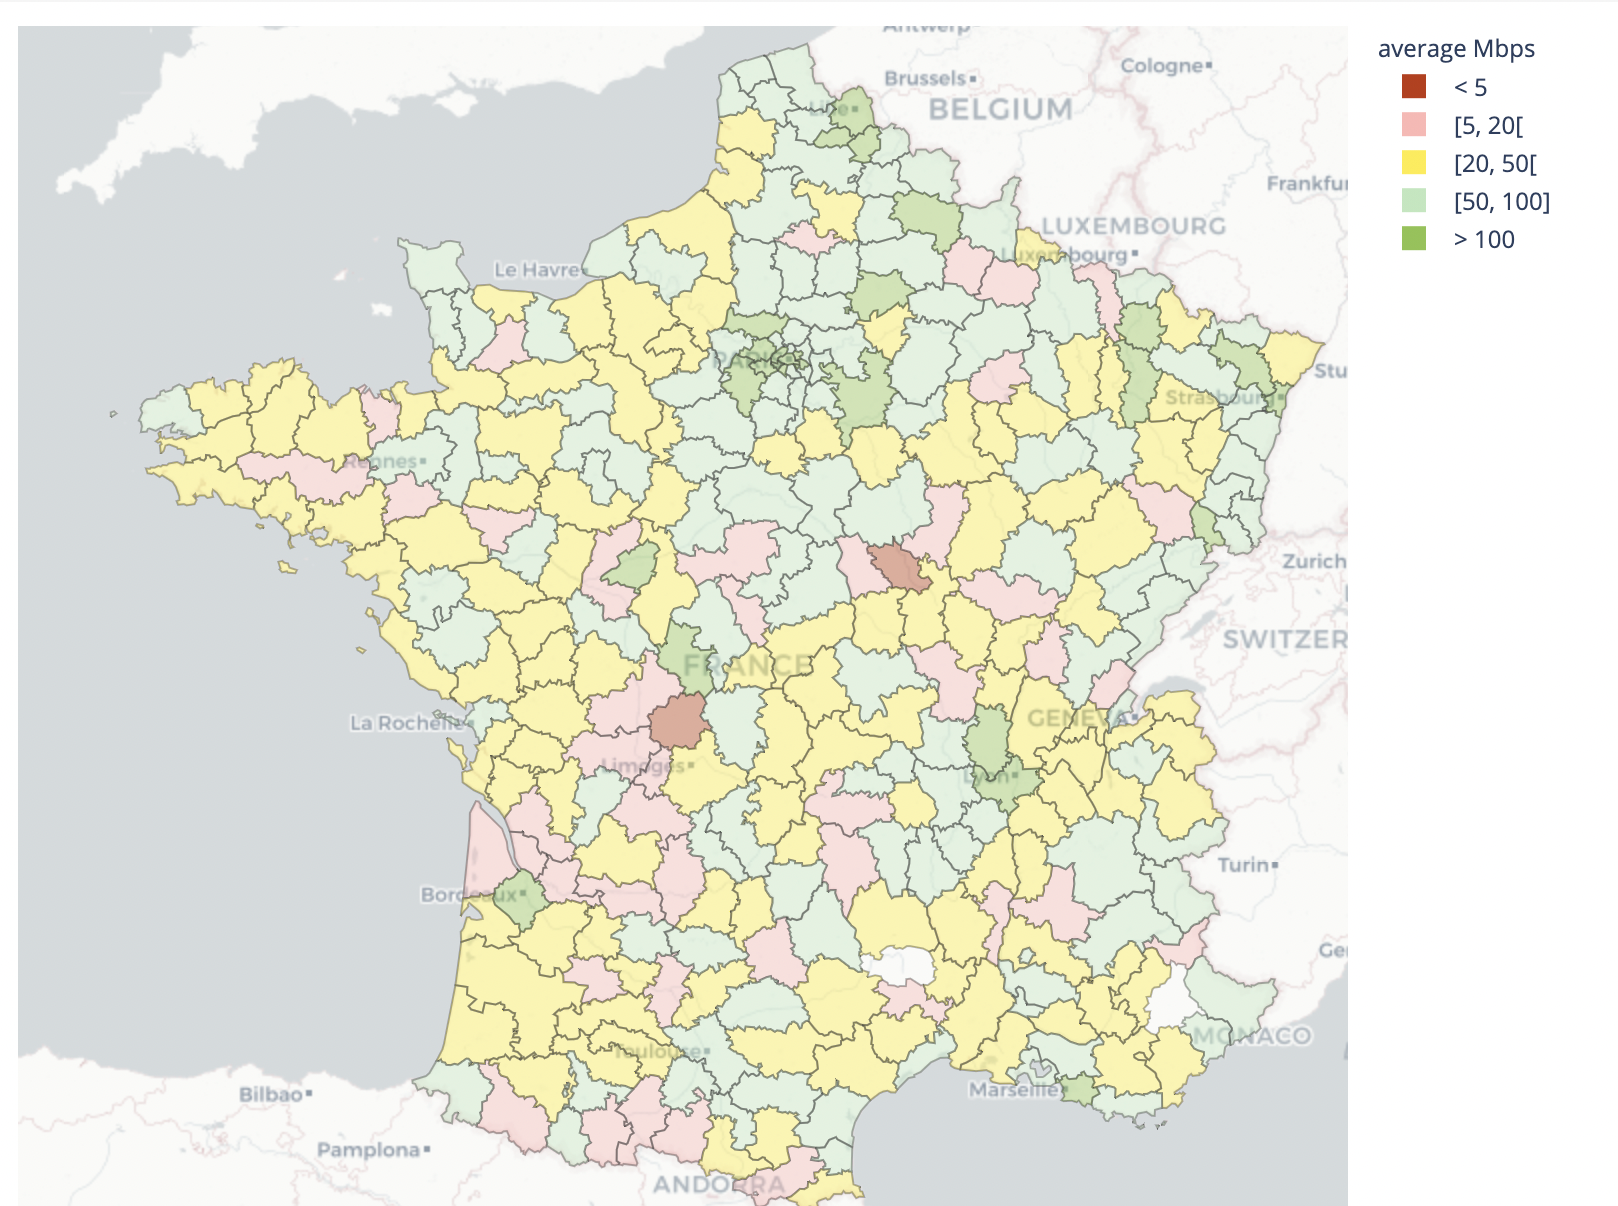
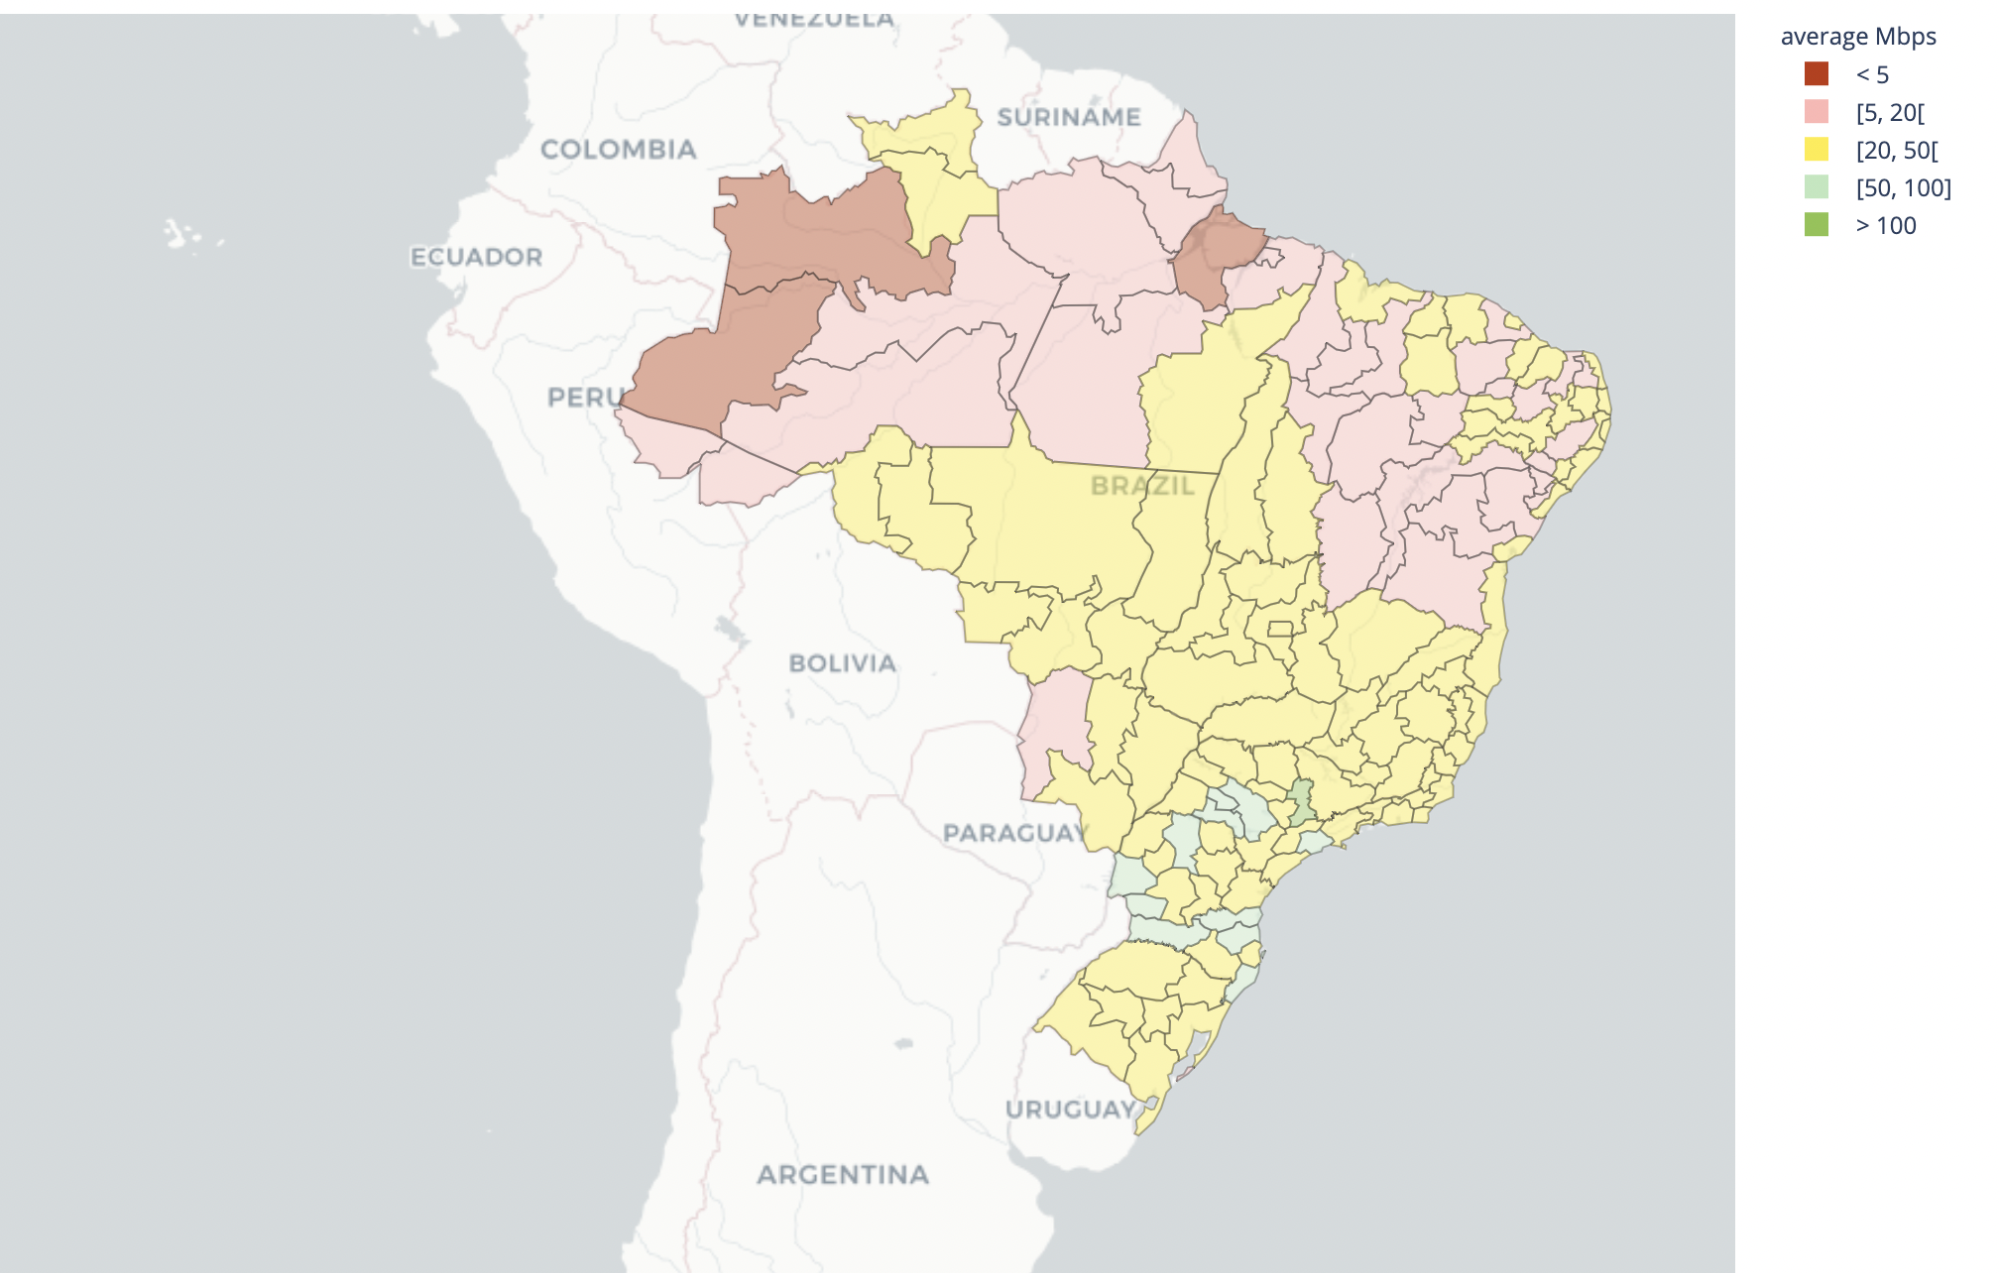
Below, you’ll find detailed maps of where the Internet is fast and slow (focusing on available bandwidth) and far away from the end user (at least in terms of the latency between the client and server). We’d have loved to have used a single metric, however, it’s hard for a single number to capture the distribution of good, bad, and non-existent Internet traffic in a region. It’s for that reason that we’ve used two metrics to represent performance: latency and bandwidth (otherwise known as throughput). The maps below are colored to show the differences in bandwidth and latency and answer part of the question: “How good is the Internet in different places around the world?”

As we like to say, we’re just getting started with this — we intend to make more of this data and analysis available in the near future. In the meantime, if you’re a local official who wants to better understand their community’s relative performance, please reach out — we’d love to connect with you. Or, if you’re interested in your own Internet performance, you can visit speed.cloudflare.com to run a personalized test on your connection.

A Quick Refresher on Latency and Bandwidth

Before we begin, a quick reminder: latency (usually measured in milliseconds or ms) is the time it takes for communications to go to an Internet destination from your device and back, whereas bandwidth is the amount of data that can be transferred in a second (it’s usually measured in megabits per second or Mbps).

Both latency and bandwidth affect the performance of an Internet connection. High latency particularly affects things like online gaming where quick responses from servers are needed, but also shows up by slowing down the loading of complex web pages, and even interrupting some streaming video. Low bandwidth makes downloading anything slow: be it images on a webpage, the new app you want to try out on your phone, or the latest movie.

Blinking your eyes takes about 100ms; but you’ll begin to notice performance changes around 60ms of latency and below 30ms is gold class performance, seeing little to no delay in video streaming or gaming.

United States
United States median throughput: 50.27Mbps
US median latency: 46.69ms

The US government has long recognized the importance of improving the Internet for underserved communities, but the Federal Communications Commission (FCC), the US agency responsible for determining where investment is most needed, has struggled to accurately map Internet access across the country.  Although the FCC has embarked on a new data collection effort to improve the accuracy of existing maps, the US government still lacks a comprehensive understanding of the areas that would most benefit from broadband investment.

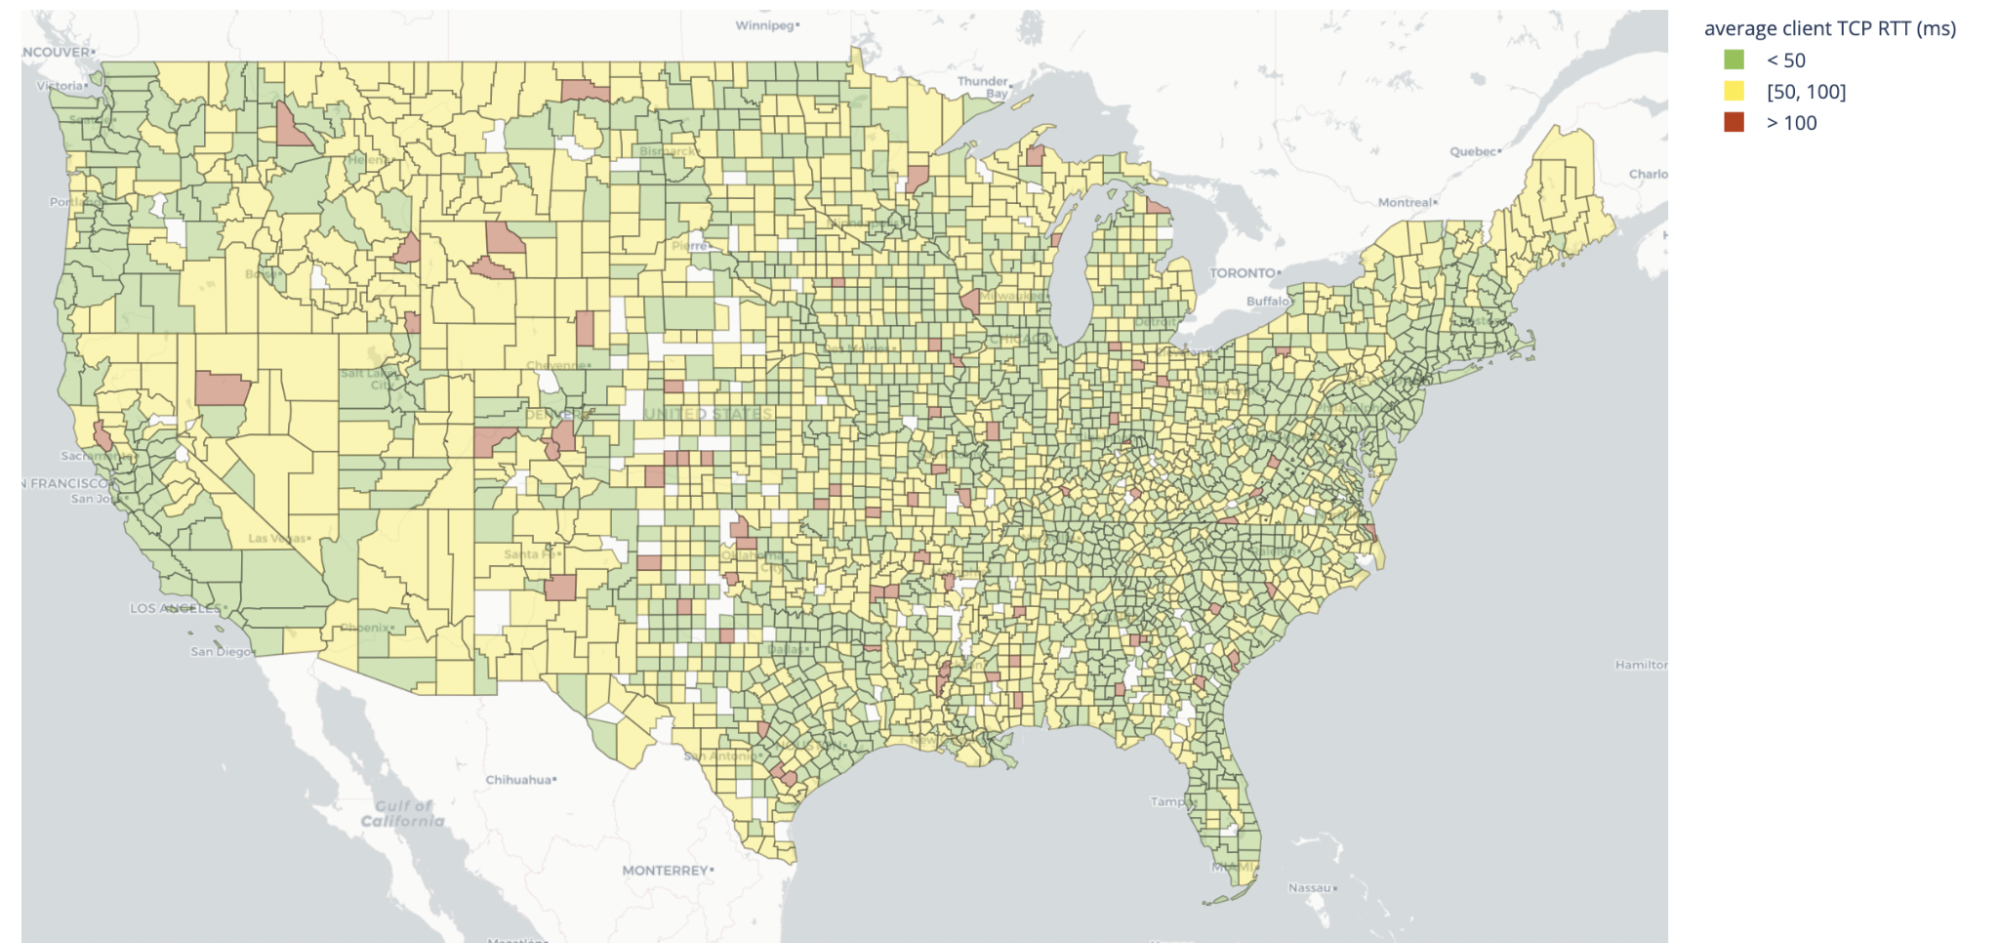
Cloudflare’s data confirms the overall concerns with inconsistent access to the Internet and helps fill in some of the current gaps.  A glance at the two maps of the US below will show that, even zoomed out to county level, there is inequality across the country. High latency and low bandwidth stand out as red areas.
Understanding Where the Internet Isn’t Good Enough Yet

US locations with the lowest latency (best) and highest latency (worst) are as follows.

Best performing geographies by latency Worst performing geographies by latency
La Habra, California Parrottsville, Tennessee
Midlothian, Texas Loganville, Wisconsin
Los Alamitos, California Mackinaw City, Michigan
St Louis, Missouri Reno, Nevada
Fort Worth, Texas Eva, Tennessee
Sugar Grove, North Carolina Milwaukee, Wisconsin
Rockwall, Texas Grove City, Minnesota
Justin, Texas Sacred Heart, Minnesota
Denton, Texas Scottsboro, Alabama
Hampton, Georgia Vesta, Minnesota

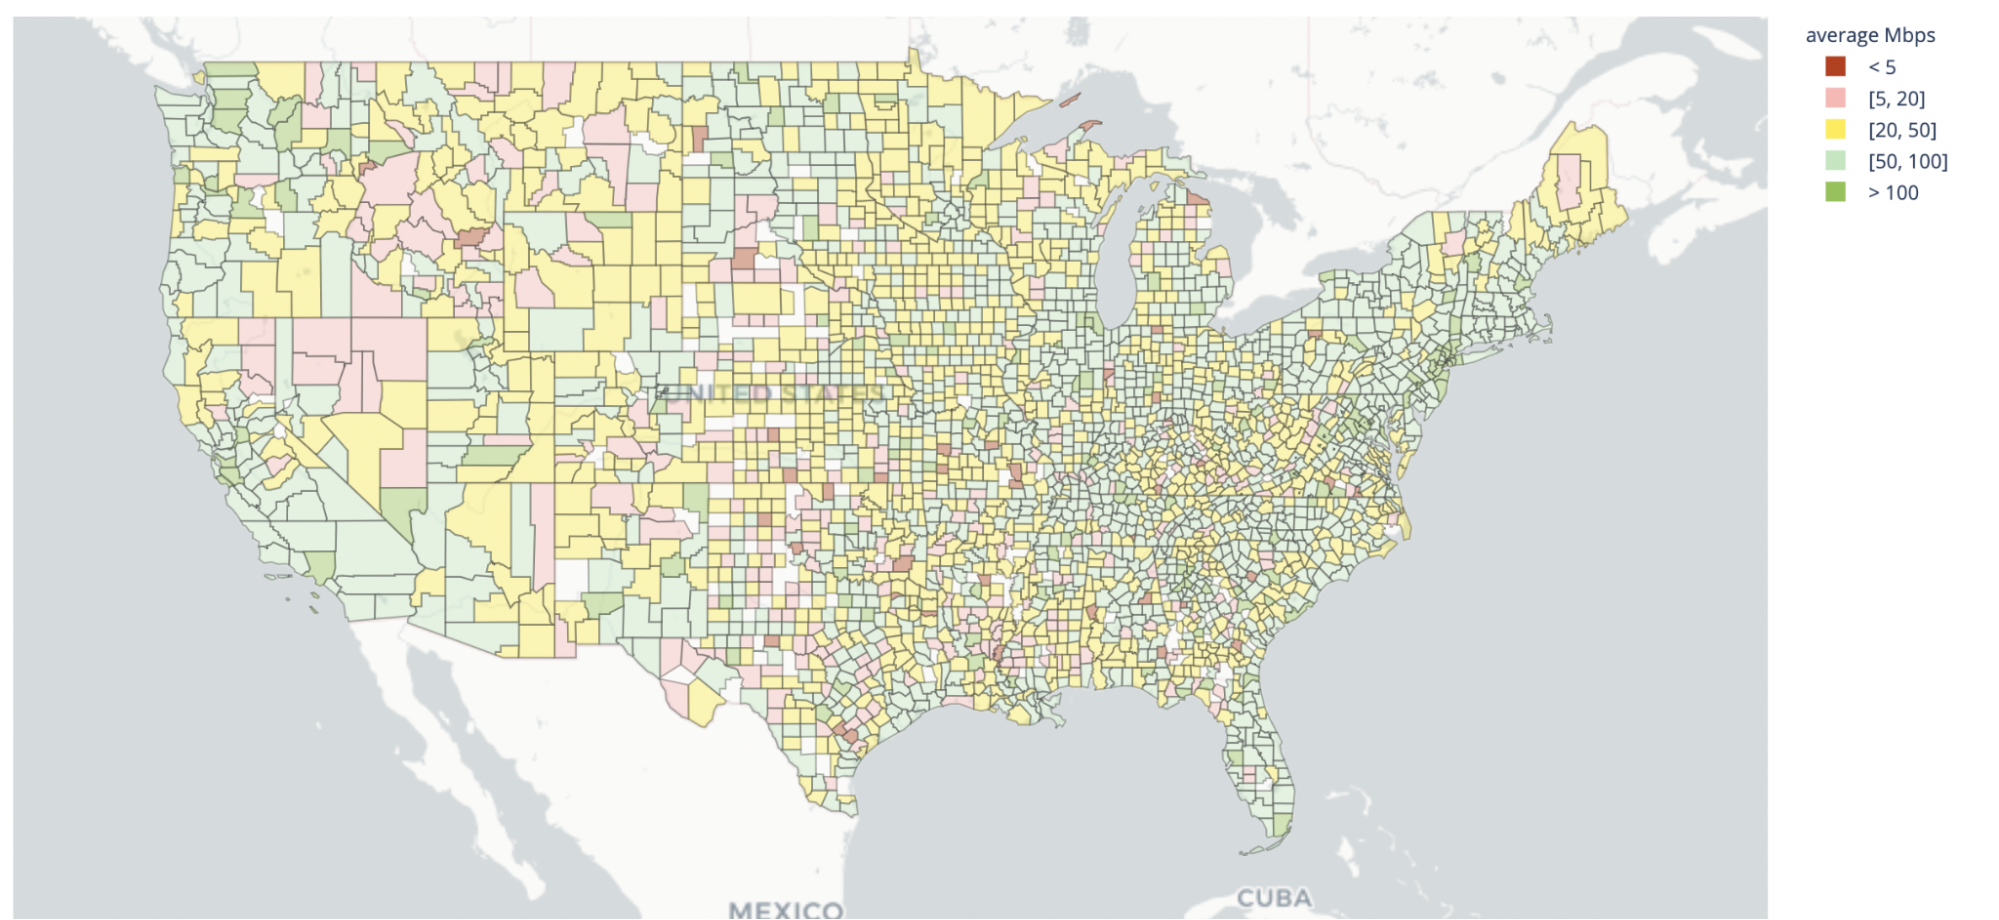
When thinking about bandwidth, 5 to 10Mbps are generally good enough for video conferencing, but ultra-HD TV watching might consume up to 20Mbps easily. For context, the Federal Communications Commission (FCC) defines the minimum bandwidth for “Advanced Service” at 25 Mbps.
Understanding Where the Internet Isn’t Good Enough Yet

The best performing (i.e., the highest bandwidth) in the US tells an interesting story. New York City comes out on top, but if you were to zoom in on the city you’d find pockets of inequality. You can read more about our partnership with NYC Mesh in the Project Pangea post and how they are helping bring better Internet to underserved parts of the Big Apple. Notice how the tyranny of averages can disguise a problem.

Best performing geographies by throughput Worst performing geographies by throughput
New York, New York Ozark, Missouri
Hartford, Connecticut Stanly, North Carolina
Avery, North Carolina Ellis, Kansas
Red Willow, Nebraska Marion, West Virginia
McLean, Kentucky Sedgwick, Kansas
Franklin, Alabama Calhoun, West Virginia
Montgomery, Pennsylvania Jasper, Georgia
Cook, Illinois Buchanan, Missouri
Montgomery, Maryland Wetzel, West Virginia
Monroe, Pennsylvania North Slope, Alaska

Contrary to popular discourse about access to the Internet as a product of the rural-urban divide, we found that poor performance was not unique to rural areas. Los Angeles, Milwaukee, Florida’s Orange County, Fairfax, San Bernardino, Knox County, and even San Francisco have pockets of uniformly poor performance, often while adjoining ZIP codes have stronger performance.

Even in areas with excellent Internet connectivity, the same connectivity to the same resources can cost wildly different amounts. Internet prices for end-users correlates with the number of ISPs in an area, i.e. the greater the consumer choice, the better the price. President Biden’s recent competition Executive Order, called out the lack of choice for broadband, noting “More than 200 million U.S. residents live in an area with only one or two reliable high-speed internet providers, leading to prices as much as five times higher in these markets than in markets with more options.”

The following cities have the greatest choice of Internet providers:

Geography
New York, New York
Los Angeles, California
Chicago, Illinois
Dallas, Texas
Washington, District of Columbia
Jersey City, New Jersey
Newark, New Jersey
Secaucus, New Jersey
Columbus, Ohio

One might expect less populated areas to have uniformly slower performance. There are, however, pockets of poor performance even in densely populated areas such as Los Angeles (California), Milwaukee (Wisconsin), Orange County (Florida), Fairfax (Virginia),  San Bernardino (California), Knox County (Tennessee), and even San Francisco (California).

In as many as 9% of ZIP codes, average latency exceeds 150ms, the acceptable threshold of performance to run a videoconferencing service such as Zoom.

Australia
Australia median throughput: 33.34Mbps
Australia median latency: 42.04ms

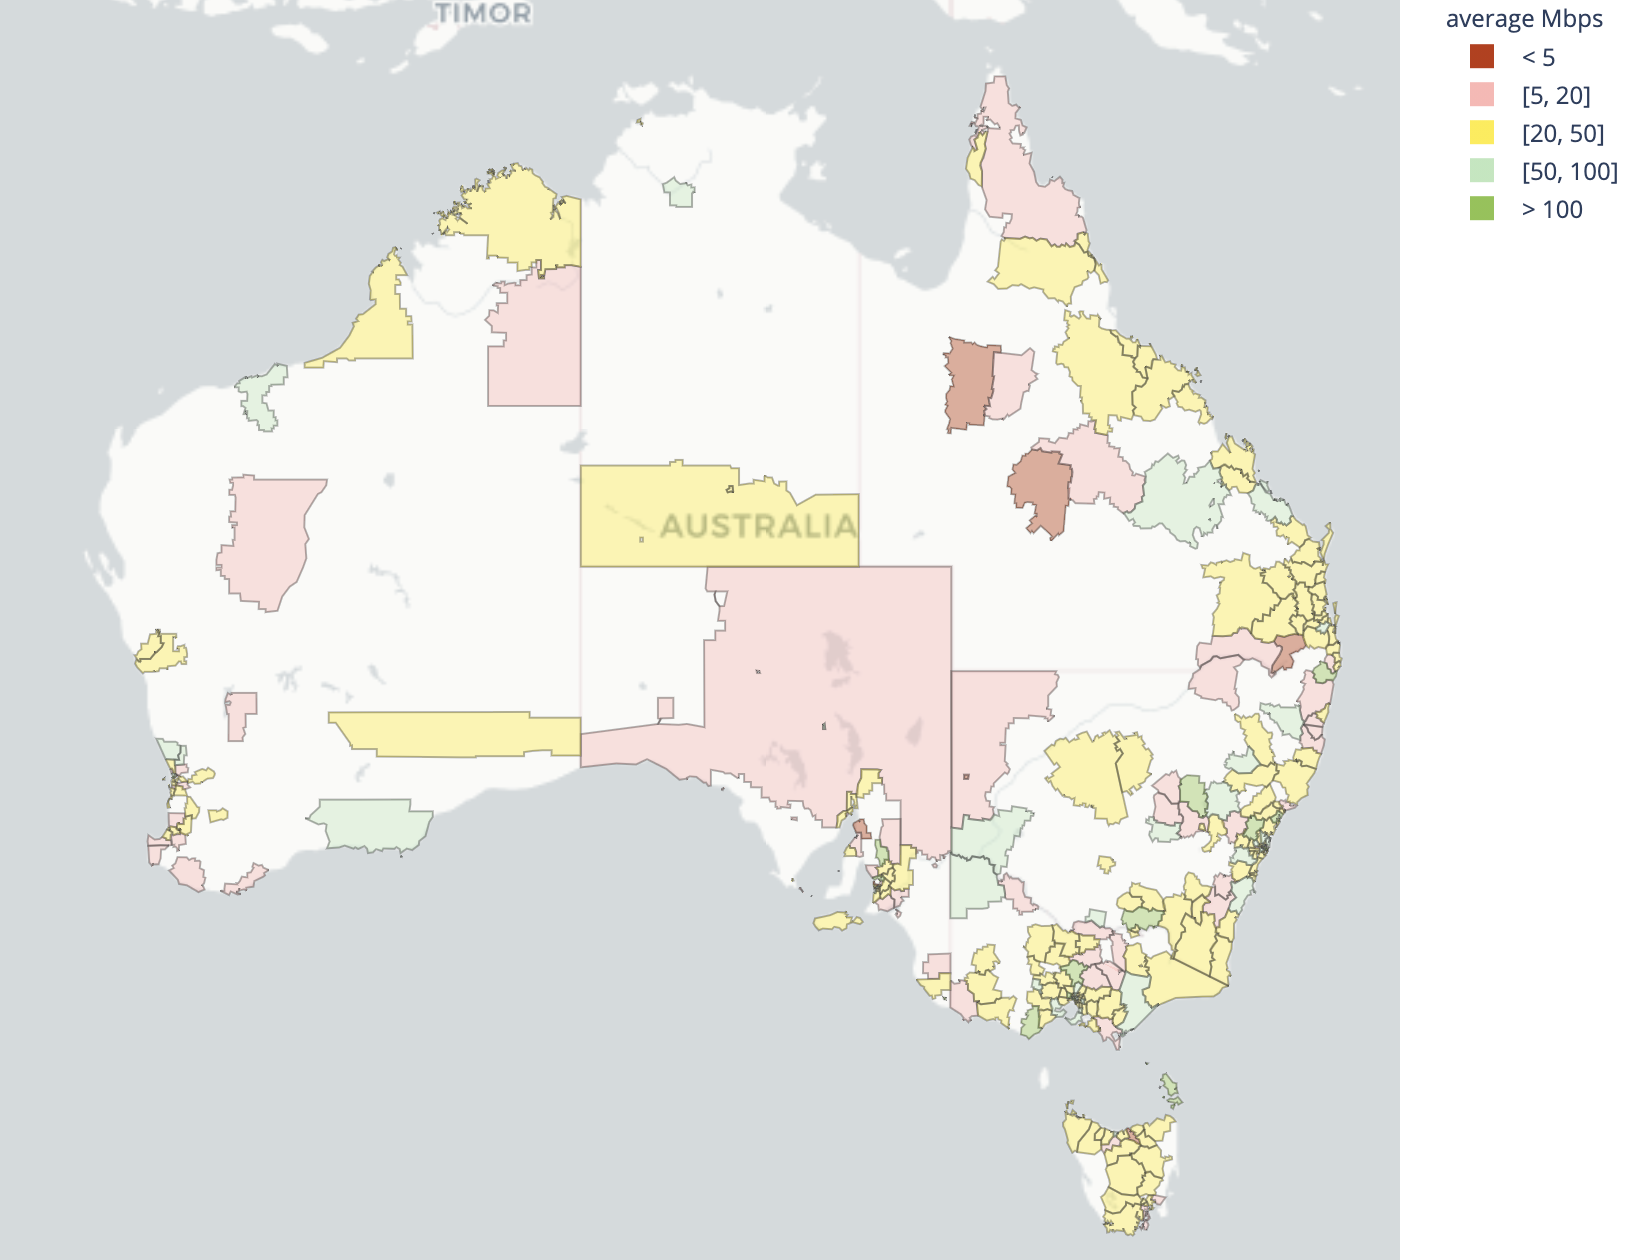
In general, Australia seems to suffer very poor broadband speeds, with speeds that are not capable of sustaining households watching video streaming, and possibly struggling with multiple video calls. The problem isn’t just a rural one either, while the inner cities showed good broadband speed, often with fiber-to-the-building Internet access, suburban areas suffered. Larger suburban areas like the Illawarra had similar speeds to more rural centers like Wagga Wagga, showing this is more than just an urban divide.
Understanding Where the Internet Isn’t Good Enough Yet

Best performing geographies by throughput Worst performing geographies by throughput
Inner West Sydney, New South Wales West Tamar, Tasmania
Port Phillip, Victoria Bassendean, Western Australia
Woollahra, New South Wales Alexandrina, South Australia
Brimbank, Victoria Bayswater, Western Australia
Lake Macquarie, New South Wales Augusta-Margaret River, Western Australia
Hawkesbury, New South Wales Goulburn Mulwaree, New South Wales
Sydney, New South Wales Goyder, South Australia
Wentworth, New South Wales Kingborough, Tasmania
Hunters Hill, New South Wales Cottesloe, Western Australia
Blacktown, New South Wales Lithgow, New South Wales

The irony is that, from a latency perspective, Australia actually performs quite well.
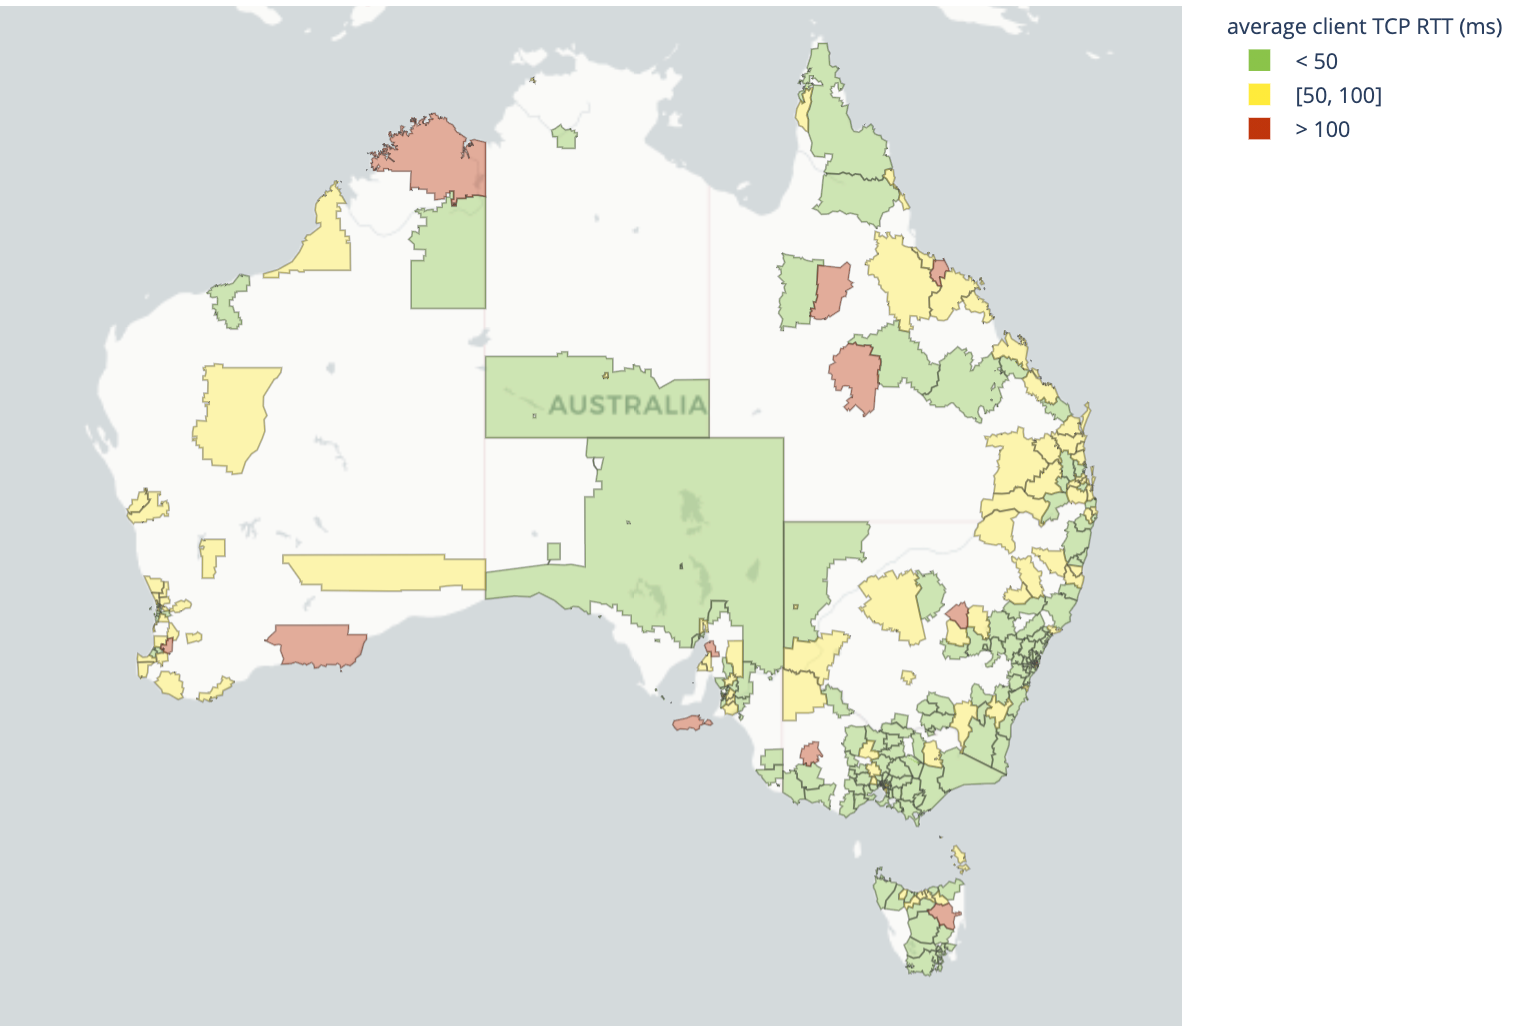
Understanding Where the Internet Isn’t Good Enough Yet

Best performing geographies by latency Worst performing geographies by latency
Port Phillip, Victoria Narromine, New South Wales
Mornington Peninsula, Victoria North Sydney, New South Wales
Whittlesea, Victoria Northern Midlands, Tasmania
Penrith, New South Wales Swan, Western Australia
Mid-Coast, New South Wales Wanneroo, Western Australia
Campbelltown, New South Wales Snowy Valleys, New South Wales
Northern Beaches, New South Wales Parkes, New South Wales
Strathfield, New South Wales Broome, Western Australia
Latrobe, Victoria Griffith, New South Wales
Surf Coast, Victoria Busselton, Western Australia

Japan
Japan median throughput: 61.4Mbps
Japan median latency: 31.89ms

Japan’s Internet has consistently low latency, including in distant areas such as Okinawa prefecture, 1,000 miles away from Tokyo.
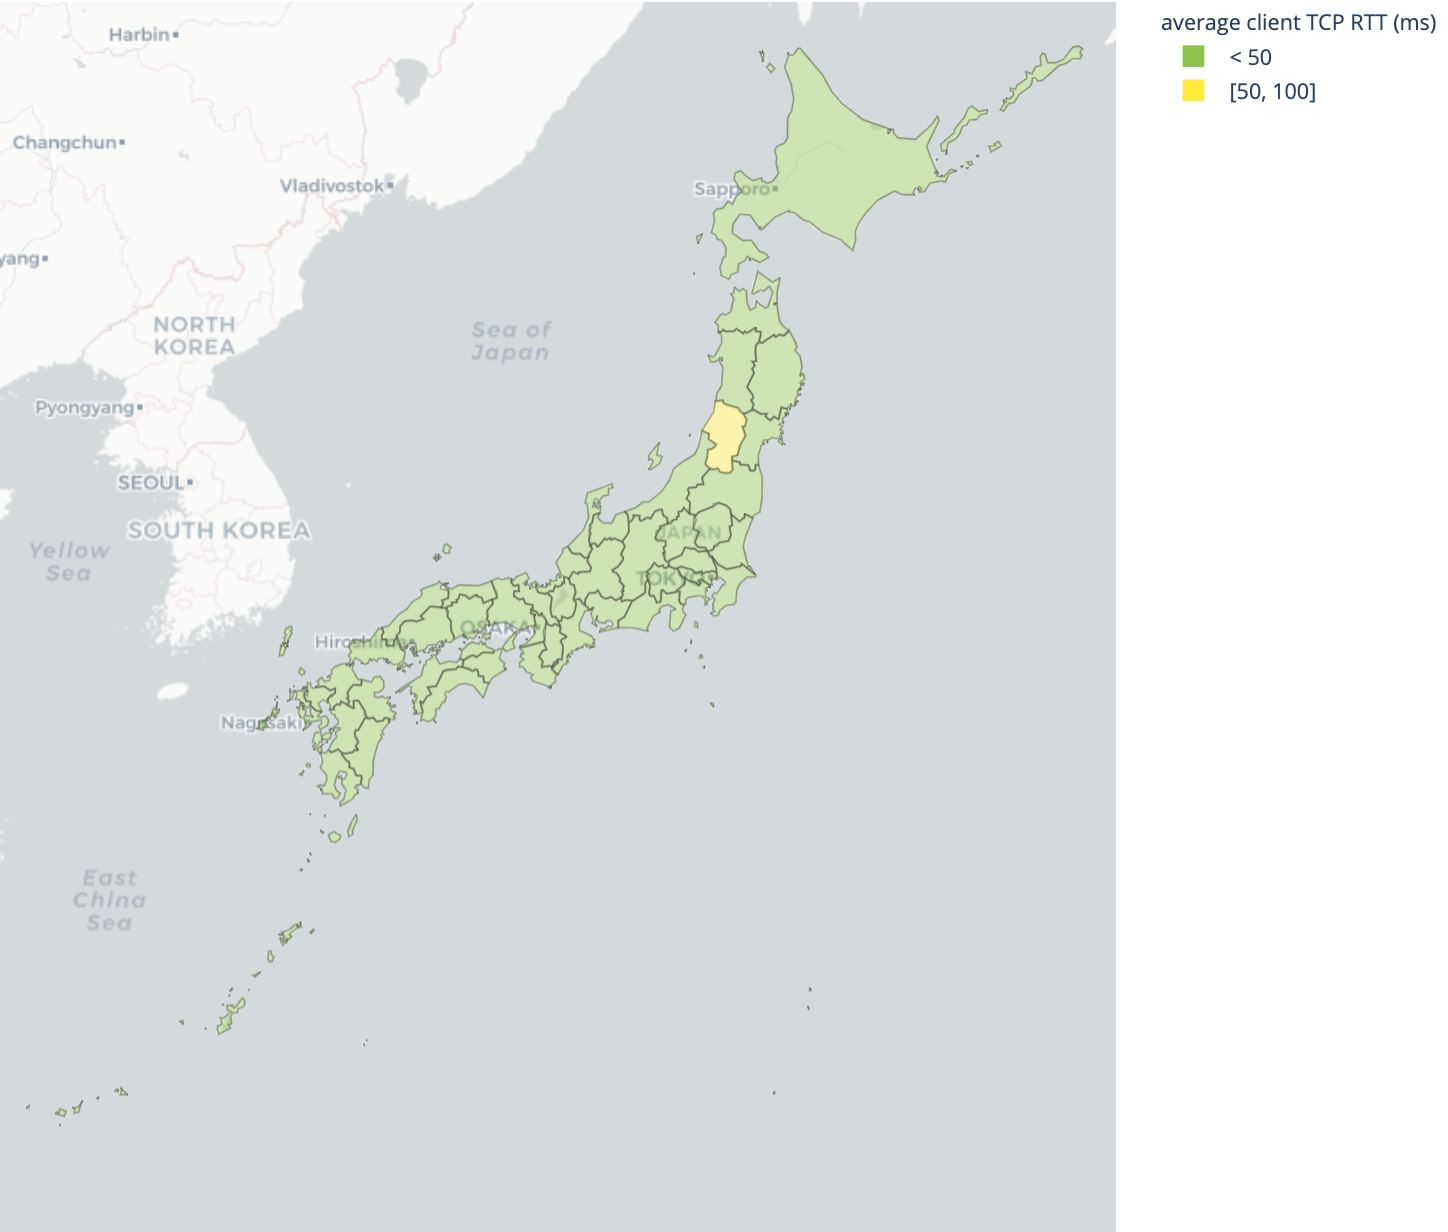
Understanding Where the Internet Isn’t Good Enough Yet

Best performing geographies by latency Worst performing geographies by latency
Nara Yamagata
Osaka Okinawa
Shiga Miyazaki
Kōchi Nagasaki
Kyoto Ōita
Tochigi Kagoshima
Tokushima Yamaguchi
Wakayama Tottori
Kanagawa Saga
Aichi Ehime

However, it’s a different story when it comes to bandwidth. Several prefectures in Kyushu Island, Okinawa Prefecture, and Western Honshu have performance falling behind the rest of the country. Unsurprisingly, the best Internet performance is seen in Tokyo, with the highest concentration of people and data centers.
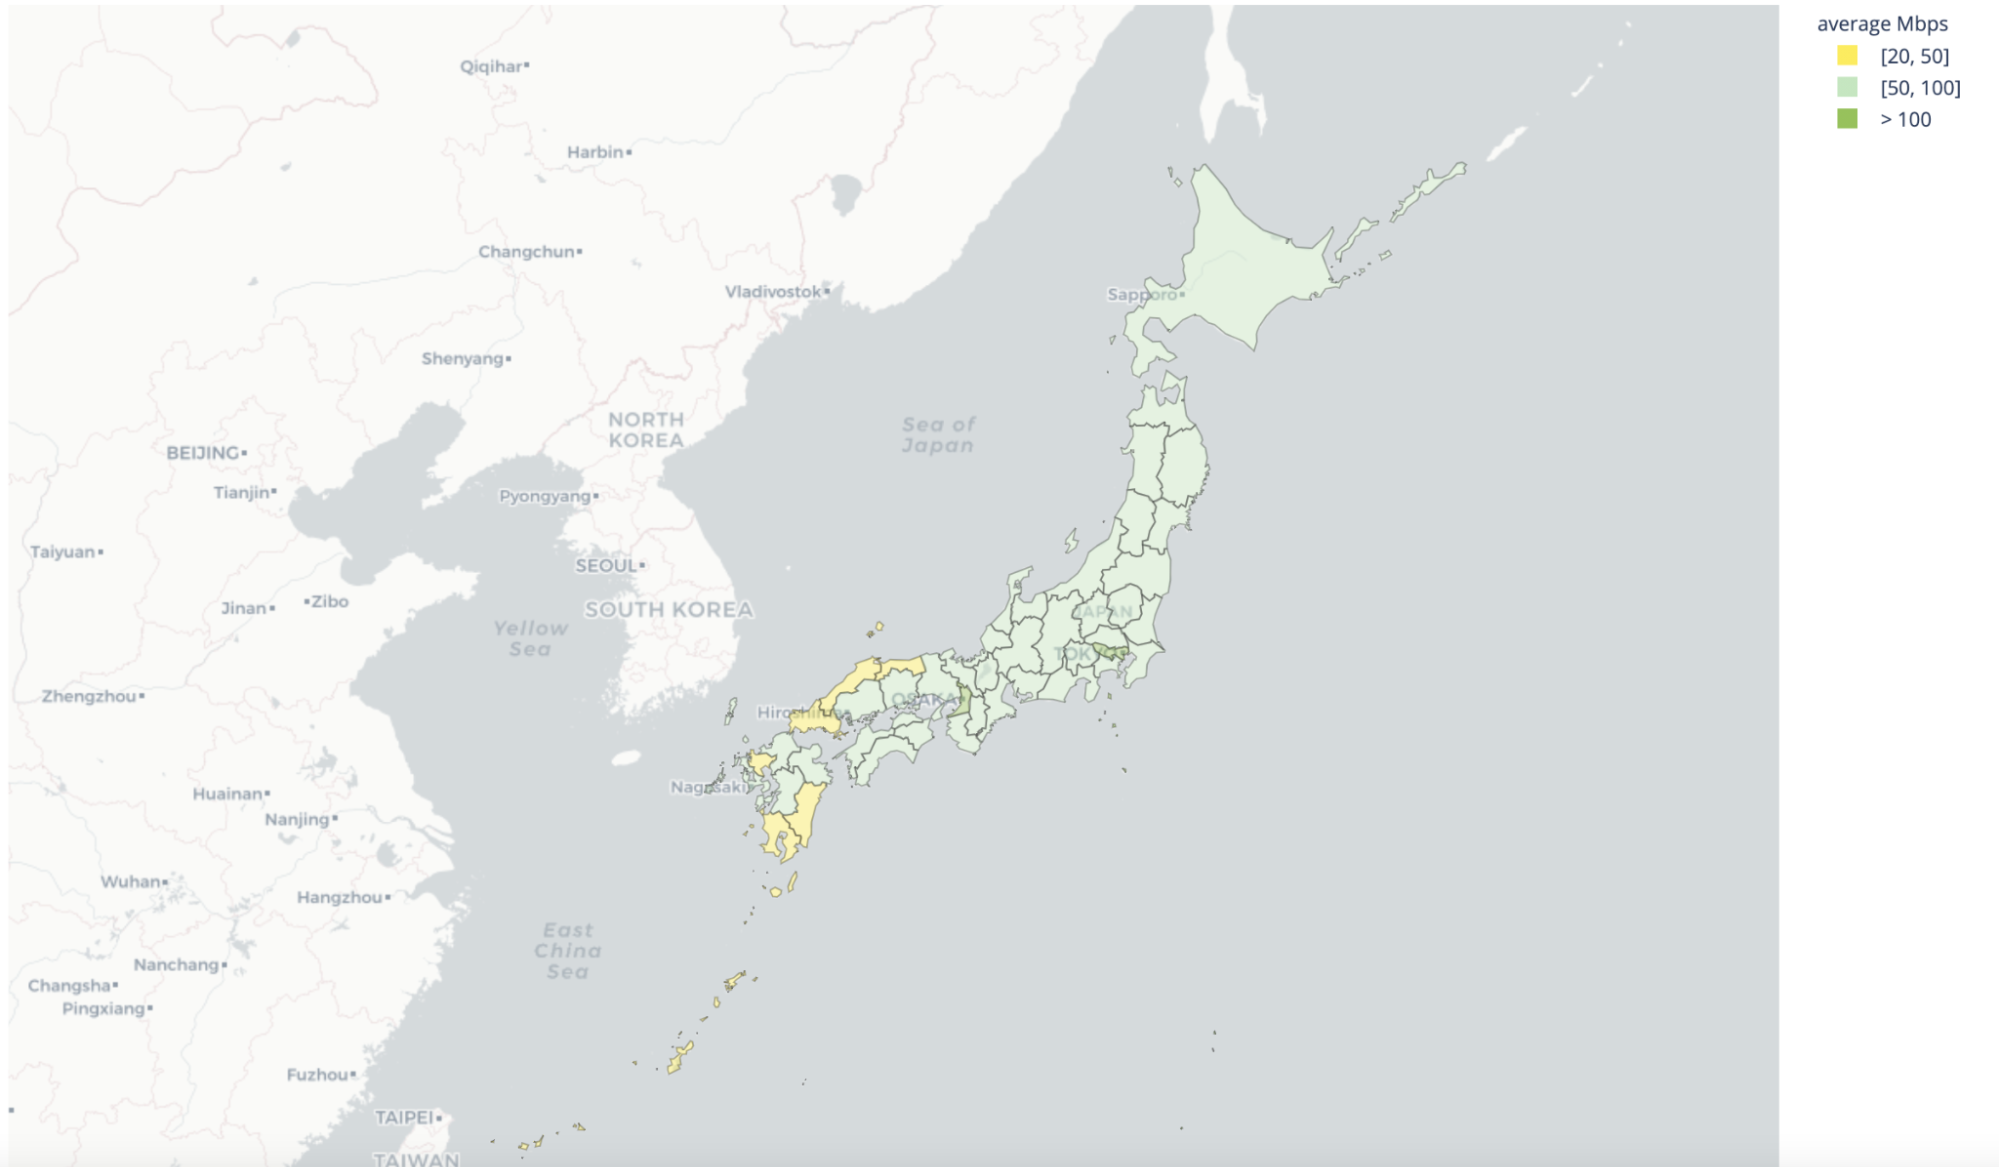
Understanding Where the Internet Isn’t Good Enough Yet

Best performing geographies by throughput Worst performing geographies by throughput
Osaka Tottori
Tokyo Shimane
Kanagawa Yamaguchi
Nara Okinawa
Chiba Saga
Aomori Miyazaki
Hyōgo Kagoshima
Kyoto Yamagata
Tokushima Nagasaki
Kōchi Fukui

United Kingdom
United Kingdom median throughput: 53.8Mbps
United Kingdom median latency: 34.12ms

The United Kingdom has good latency throughout most of the country, however bandwidth is a different story. The best performance is seen in inner London as well as some other larger cities like Manchester. London and Manchester are also the homes of the UK’s largest Internet exchange points. More effort to localize data into other cities, like Edinburgh, would be an important step to improving performance for those regions.
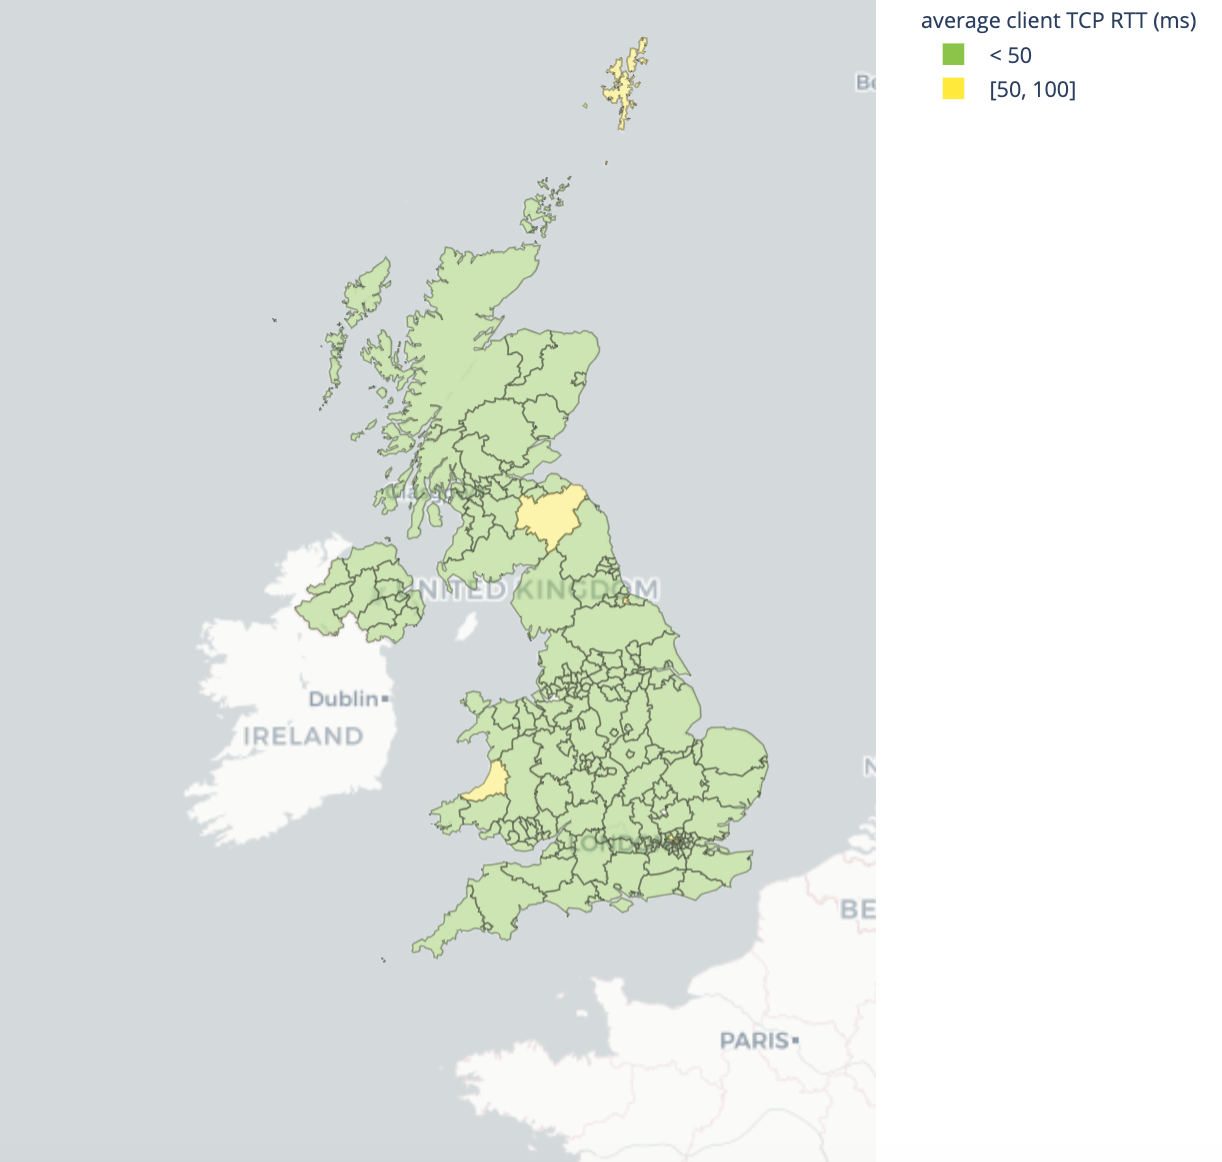
Understanding Where the Internet Isn’t Good Enough Yet

Best performing geographies by latency Worst performing geographies by latency
Sutton Brent
Milton Keynes Ceredigion
Lambeth Westminster
Cardiff Scottish Borders
Harrow Shetland Islands
Hackney Middlesbrough
Islington Fermanagh and Omagh
Kensington and Chelsea Slough
Thurrock Highland
Kingston upon Thames Denbighshire

Understanding Where the Internet Isn’t Good Enough Yet

Best performing geographies by throughput Worst performing geographies by throughput
City of London Orkney Islands
Slough Shetland Islands
Lambeth Blaenau Gwent
Surrey Ceredigion
Tower Hamlets Isle of Anglesey
Coventry Fermanagh and Omagh
Wrexham Scottish Borders
Islington Denbighshire
Vale of Glamorgan Midlothian
Leicester Rutland

Germany
Germany median throughput: 48.79Mbps
Germany median latency: 42.1ms

Germany has some of the best performance centered on Frankfurt am Main, which is one of the major Internet hubs of the world, however what was formerly East Germany, has higher latency, and slower speeds, leaning to a poorer Internet performance.
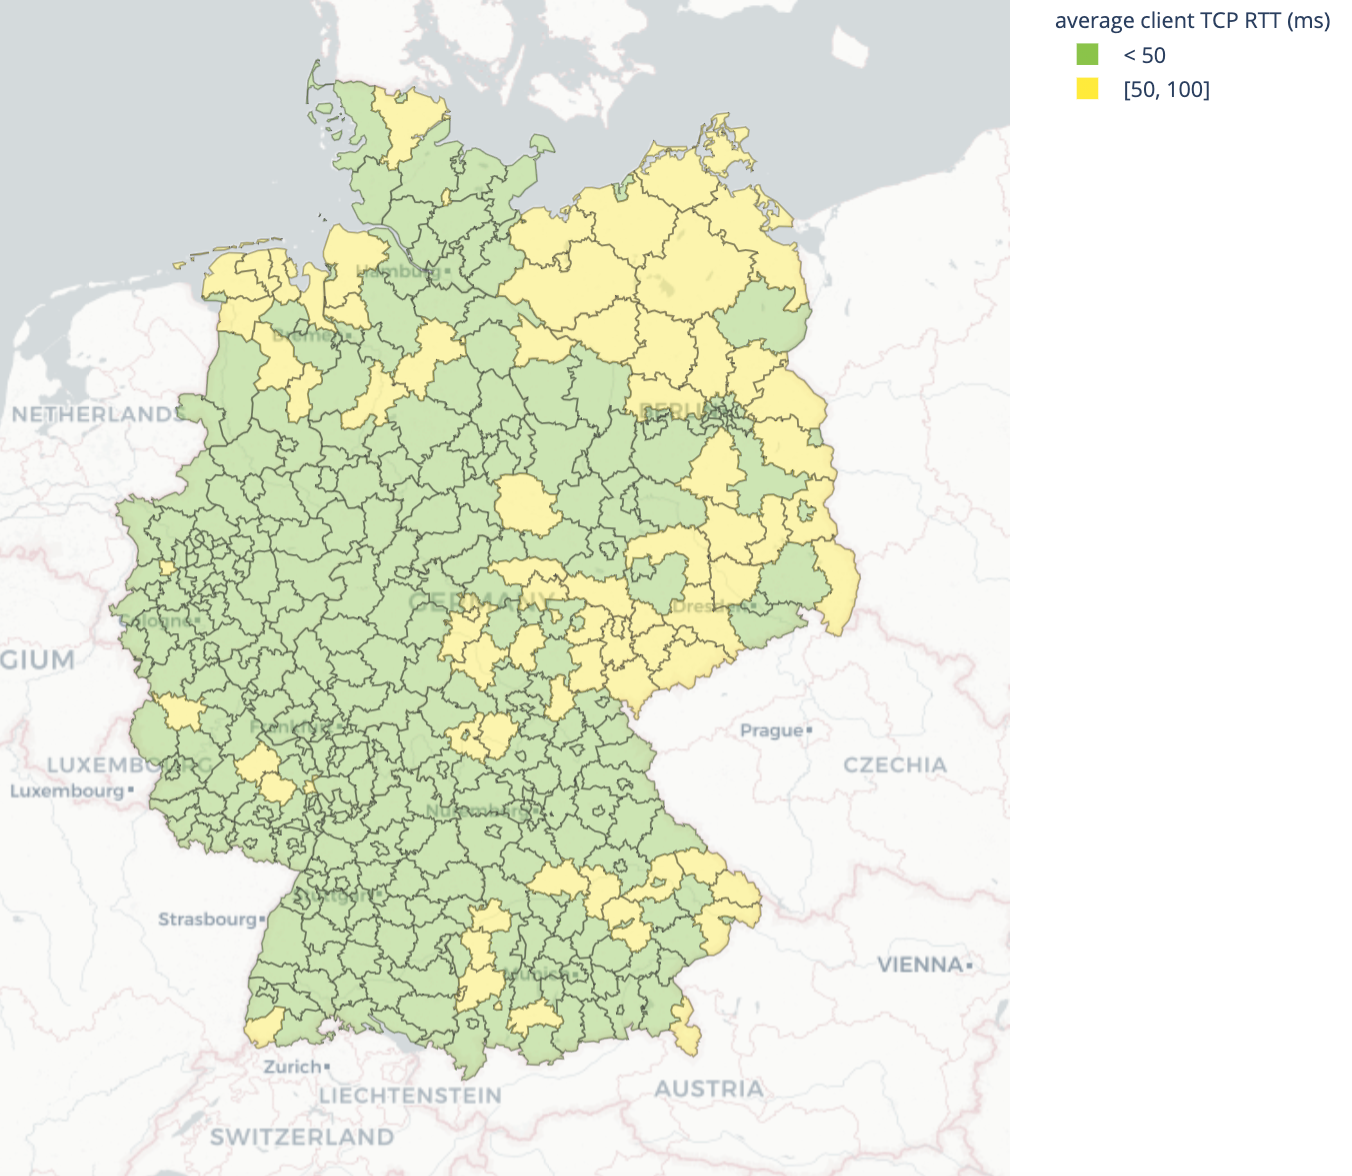
Understanding Where the Internet Isn’t Good Enough Yet

Best performing geographies by latency Worst performing geographies by latency
Erlangen Harz
Coesfeld Nordwestmecklenburg
Weißenburg-Gunzenhausen Saale-Holzland-Kreis
Heinsberg Elbe-Elster
Main-Taunus-Kreis Vorpommern-Greifswald
Main-Kinzig-Kreis Vorpommern-Rügen
Darmstadt Kyffhäuserkreis
Peine Barnim
Herzogtum Lauenburg Rostock
Segeberg Meißen

Understanding Where the Internet Isn’t Good Enough Yet

Best performing geographies by throughput Worst performing geographies by throughput
Weißenburg-Gunzenhausen Saale-Holzland-Kreis
Frankfurt am Main Weimarer Land
Kassel Vulkaneifel
Cochem-Zell Kusel
Dingolfing-Landau Spree-Neiße
Bodenseekreis Eisenach
Sankt Wendel Unstrut-Hainich-Kreis
Landshut Saale-Orla-Kreis
Ludwigsburg Weimar
Speyer Südliche Weinstraße

France
France median throughput: 48.51Mbps
France median latency: 54.2ms

Paris has long been the Internet hub in France. Marseille has started to grow as a hub, especially with the large number of submarine cables landing. Other interconnection hubs in Lyon and Bordeaux are where we’ll start to see growth as Internet hubs. These four cities are where we also see the best performance, with the highest speeds and lowest latencies, giving the best Internet performance.
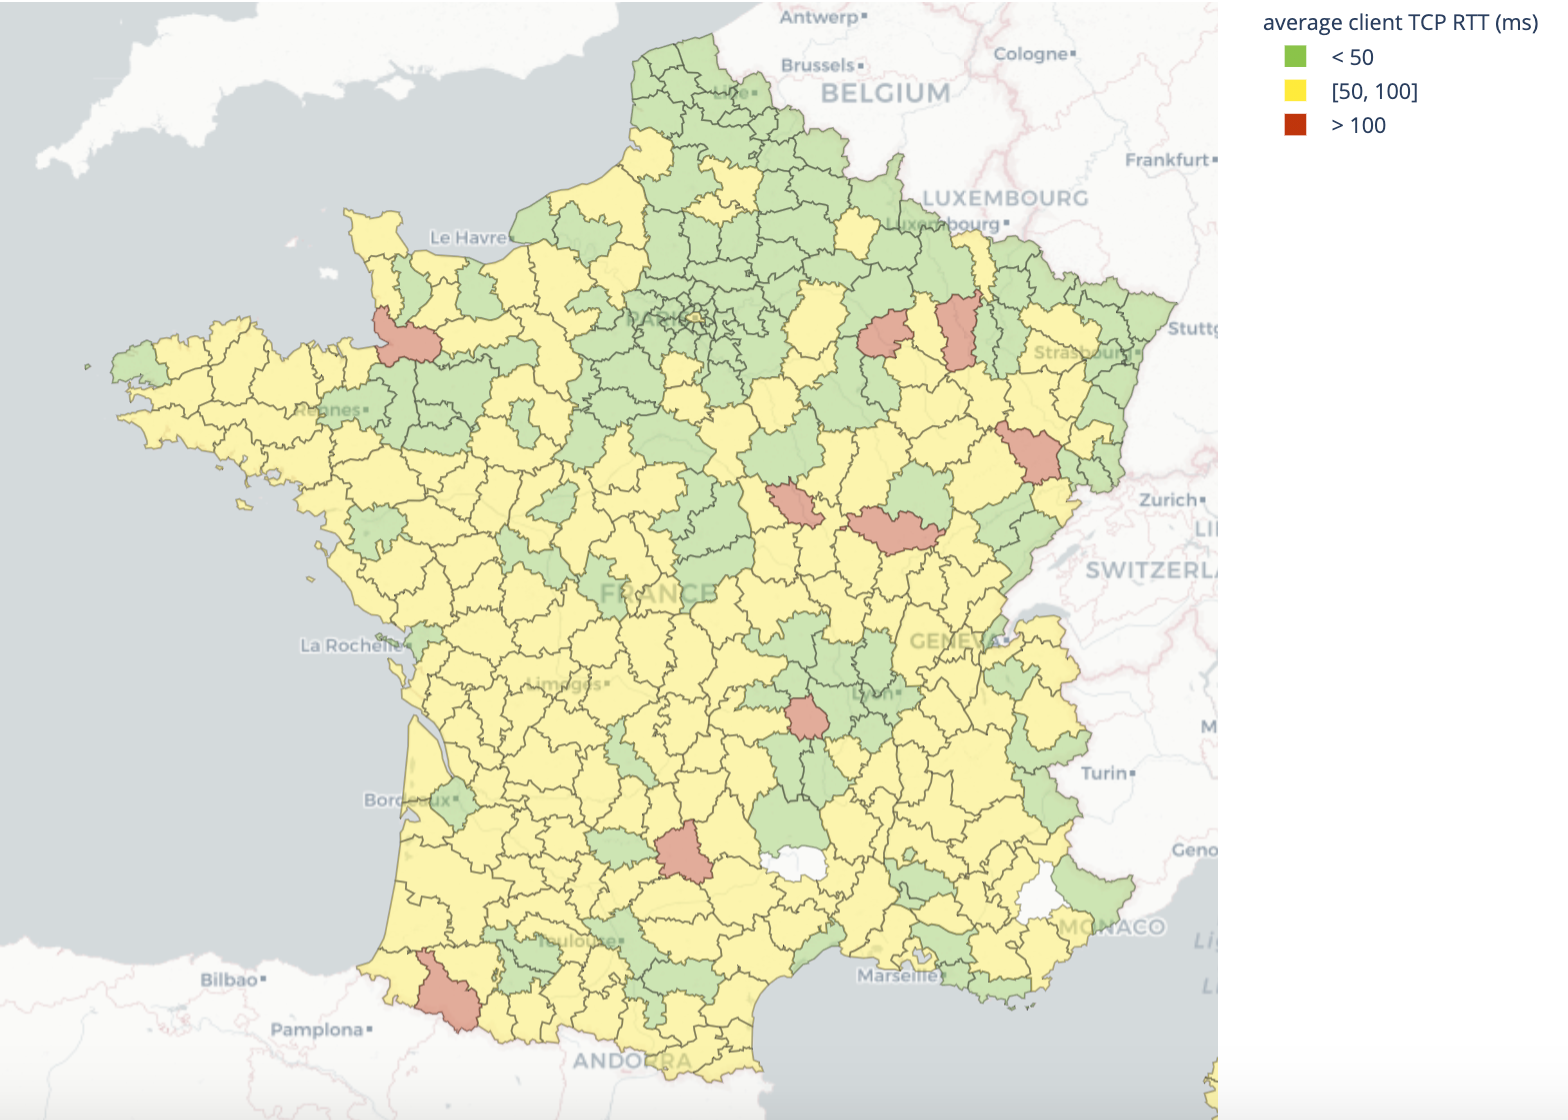
Understanding Where the Internet Isn’t Good Enough Yet

Best performing geographies by latency Worst performing geographies by latency
Antony Clamecy
Boulogne-Billancourt Beaune
Lyon Ambert
Lille Commercy
Versailles Vitry-le-François
Nogent-sur-Marne Villefranche-de-Rouergue
Bobigny Lure
Marseille Avranches
Saint-Germain-en-Laye Oloron-Sainte-Marie
Créteil Privas

Understanding Where the Internet Isn’t Good Enough Yet

Best performing geographies by throughput Worst performing geographies by throughput
Boulogne-Billancourt Clamecy
Antony Bellac
Marseille Issoudun
Lille Vitry-le-François
Nanterre Sarlat-la-Canéda
Paris Segré
Lyon Rethel
Bobigny Avallon
Versailles Privas
Saverne Sartène

Brazil
Brazil median throughput: 26.28Mbps
Brazil median latency: 49.25ms

Much of Brazil has good, low latency Internet performance, given geographic proximity to the major Internet hubs in São Paulo and Rio de Janeiro. Much of the Amazon has low speeds and high latency, for those parts that are actually connected to the Internet.

Campinas is one stand out, with some of the best performing Internet across Brazil, and is also the site of a recent Cloudflare data center launch.
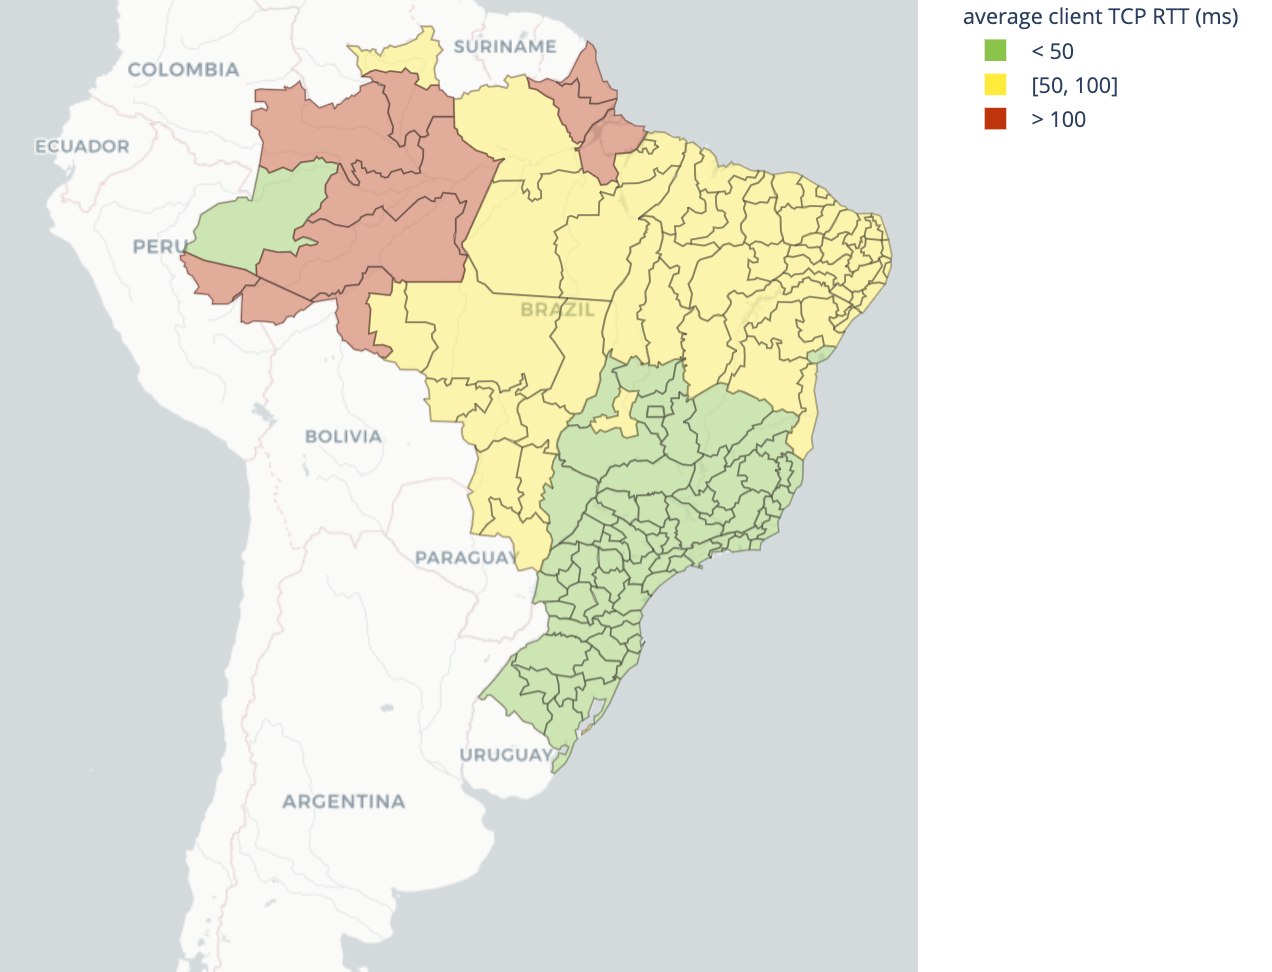
Understanding Where the Internet Isn’t Good Enough Yet

Best performing geographies by latency Worst performing geographies by latency
Vale do Paraiba Paulista Vale do Acre
Assis Sul Amazonense
Sudoeste Amazonense Marajo
Litoral Sul Paulista Vale do Jurua
Baixadas Sul de Roraima
Centro Fluminense Centro Amazonense
Sul Catarinense Madeira-Guapore
Vale do Paraiba Paulista Sul do Amapa
Noroeste Fluminense Metropolitana de Belem
Bauru Baixo Amazonas

Understanding Where the Internet Isn’t Good Enough Yet

Best performing geographies by throughput Worst performing geographies by throughput
Metropolitana do Rio de Janeiro Sudoeste Amazonense
Campinas Marajo
Metropolitana de São Paulo Norte Amazonense
Oeste Catarinense Baixo Amazonas
Marilia Sudeste Rio-Grandense
Vale do Itajaí Sul Amazonense
Sul Catarinense Centro-Sul Cearense
Sudoeste Paranaense Sudoeste Paraense
Grande Florianópolis Sertão Sergipano
Norte Catarinense Sertoes Cearenses

South Africa
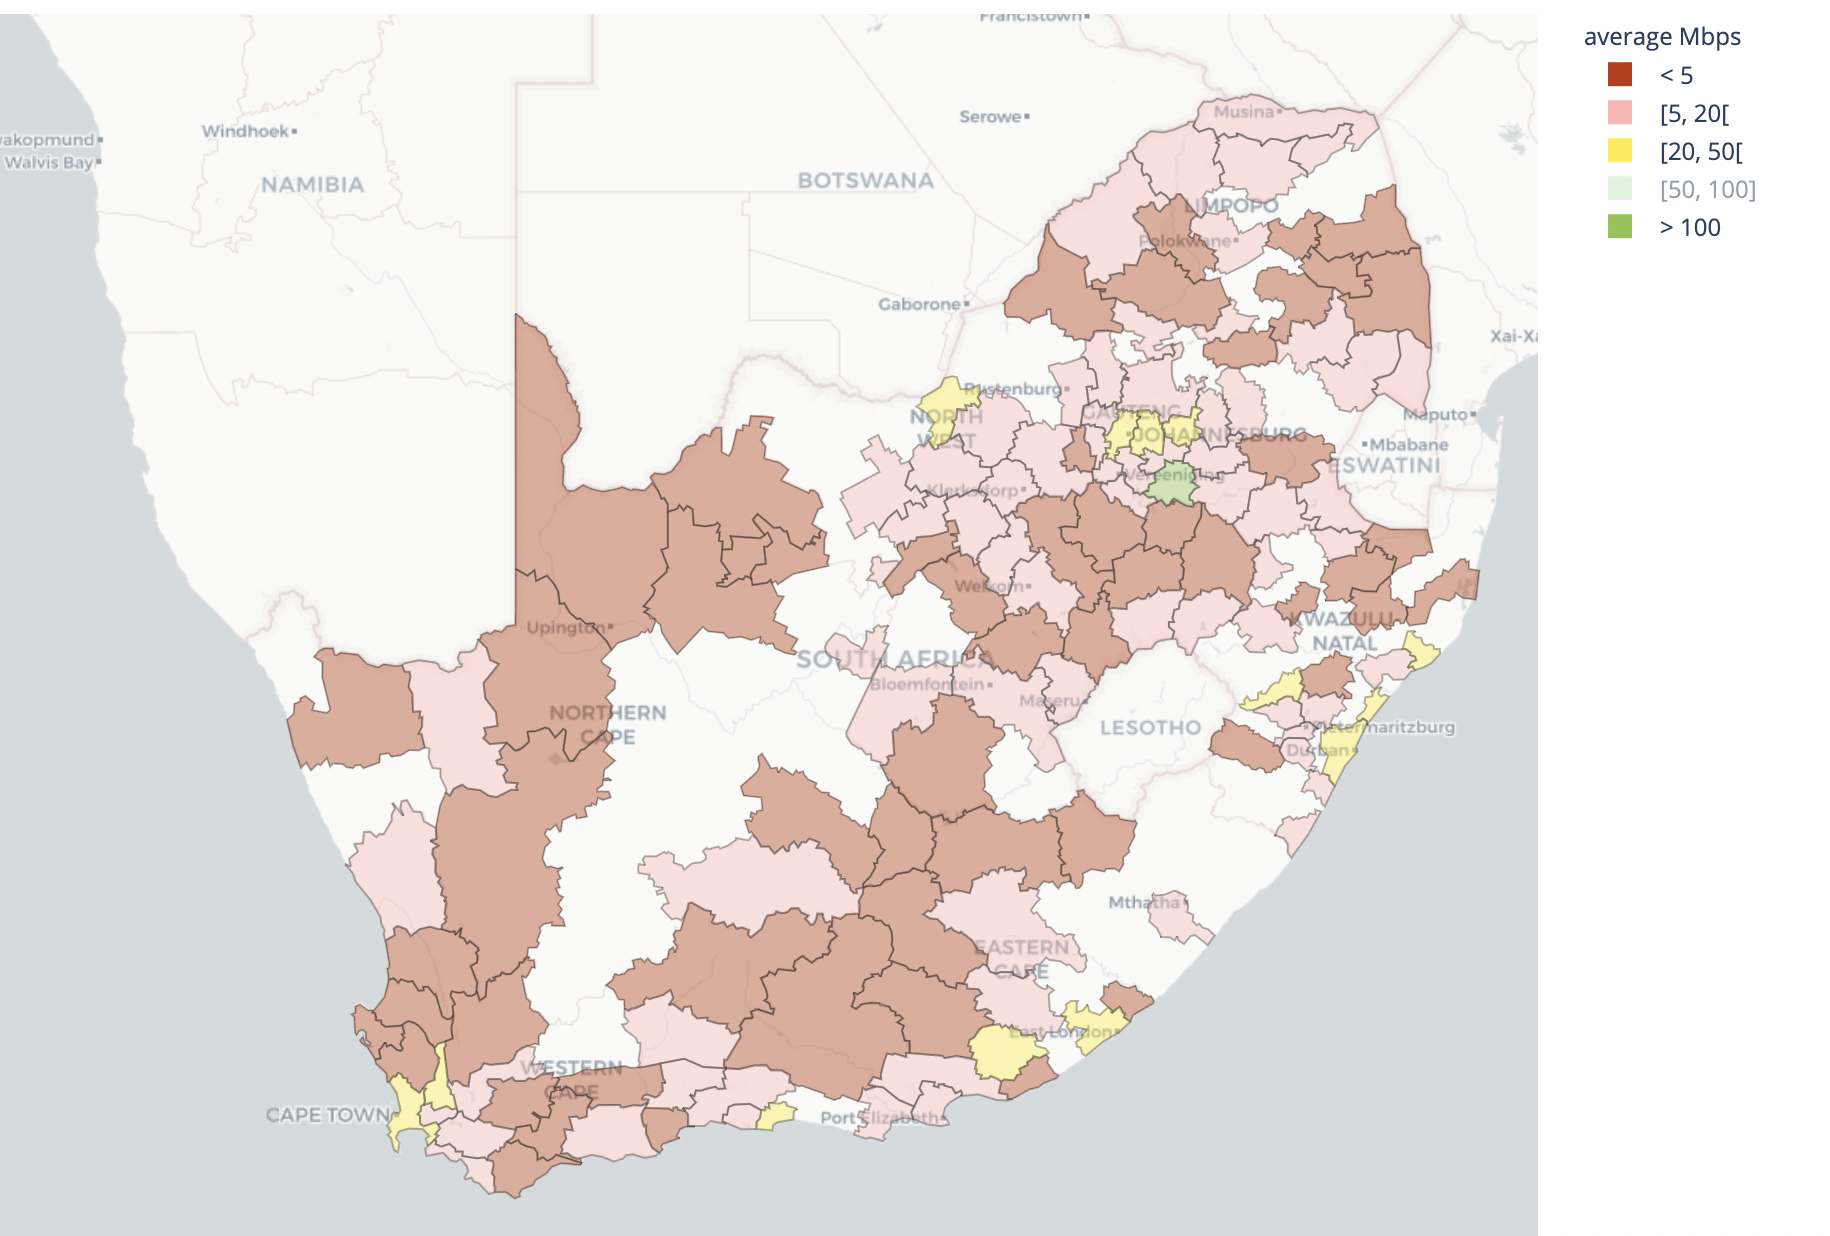
South Africa median throughput: 6.4Mbps
South Africa median latency: 59.78ms

Johannesburg has been the historical hub for South Africa’s Internet. This is where many Internet giants have built data centers, and it shows in latency as distance from Johannesburg. South Africa has grown to have two more Internet hubs in Cape Town and Durban. Internet performance also follows these three cities. However, much of South Africa’s Internet performance lacks the ability for video streaming and video conferencing in high definition.
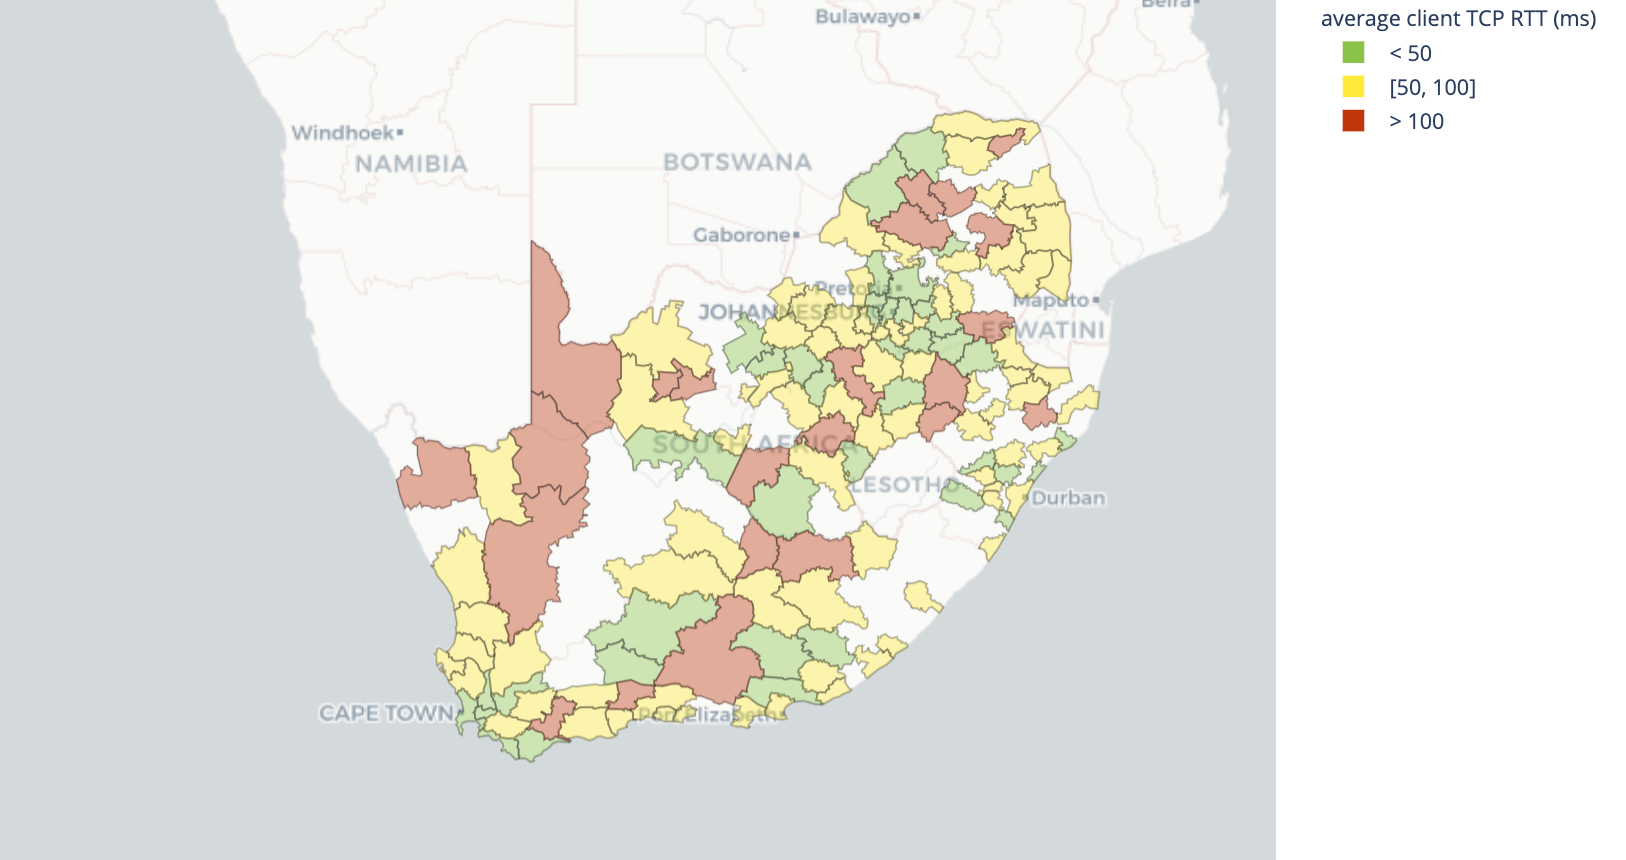
Understanding Where the Internet Isn’t Good Enough Yet

Best performing geographies by latency Worst performing geographies by latency
Siyancuma Dr Beyers Naude
uMshwathi Mogalakwena
City of Tshwane Ulundi
Breede Valley Modimolle/Mookgophong
City of Cape Town Maluti a Phofung
Overstrand Moqhaka
Local Municipality of Madibeng Thulamela
Metsimaholo Walter Sisulu
Stellenbosch Dawid Kruiper
Ekurhuleni Ga-Segonyana

Understanding Where the Internet Isn’t Good Enough Yet

Best performing geographies by throughput Worst performing geographies by throughput
Siyancuma Dr Beyers Naude
City of Cape Town Walter Sisulu
City of Johannesburg Lekwa-Teemane
Ekurhuleni Dr Nkosazana Dlamini Zuma
Drakenstein Emthanjeni
eThekwini Dawid Kruiper
Buffalo City Swellendam
uMhlathuze Merafong City
City of Tshwane Blue Crane Route
City of Matlosana Modimolle/Mookgophong

Case Study on ISP Concentration’s Impact on Performance: Alabama, USA

One question we had as we went through a lot of this data: does ISP concentration impact Internet performance?

On one hand, there’s a case to be made that more ISP competition results in no one vendor being able to invest sufficient resources to build out a fast network. On the other hand, well, classical economics would suggest that monopolies are bad, right?

To investigate the question further, we did a deep dive into Alabama in the United States, the 24th most populous state in the US. We tracked two key metrics across 65 counties: Internet performance as defined by average download speed, and ISP concentration, as measured by the largest ISP’s traffic share.

Here is the raw data:

County Avg. Download Speed Largest ISP’s Traffic Share County Avg. Download Speed Largest ISP’s Traffic Share
Marion 53.77 41% Franklin 32.01 83%
Escambia 29.14 43% Coosa 82.15 83%
Etowah 56.07 49% Crenshaw 44.49 84%
Jackson 37.77 52% Randolph 21.4 86%
Winston 59.25 56% Lamar 33.94 86%
Montgomery 79.5 58% Autuaga 65.55 86%
Baldwin 49.06 58% Choctaw 23.97 87%
Houston 73.73 61% Butler 29.86 90%
Dallas 86.92 62% Pike 50.54 92%
Marshall 59.93 62% Sumter 38.52 91%
Chambers 72.05 63% Pickens 43.76 92%
Jefferson 99.84 64% Marengo 42.89 92%
Elmore 71.05 66% Macon 12.69 92%
Fayette 41.7 68% Lawrence 62.87 92%
Lauderdale 62.87 69% Bullock 23.89 92%
Colbert 47.91 70% Chilton 17.13 95%
DeKalb 58.55 70% Wilcox 62.12 93%
Morgan 61.78 71% Monroe 20.74 96%
Washington 5.14 72% Dale 55.46 97%
Geneva 32.01 73% Coffee 58.18 97%
Lee 78.1 73% Conecuh 34.94 97%
Tuscaloosa 58.85 76% Cleburne 38.25 97%
Cullman 61.03 77% Clarke 38.14 97%
Covington 35.48 78% Calhoun 64.19 97%
Shelby 69.66 79% Lowndes 9.91 98%
St. Clair 33.05 79% Russell 49.48 98%
Blount 40.58 80% Henry 4.69 98%
Mobile 68.77 80% Limestone 71.6 98%
Walker 39.36 81% Bibb 70.14 98%
Barbour 51.48 82% Cherokee 17.13 99%
Tallapoosa 60 82% Greene 4.76 99%
Madison 99 83% Clay 3.42 100%

Across most of Alabama, we see very high ISP concentration. For the majority of counties, the largest ISP has 80% (or higher) share of traffic, while all the other ISPs combined operate at considerably smaller scale. In only three counties (Marion, Escambia and Etowah) does each ISP carry less than 50% of user traffic. Interestingly, Etowah is one of the best performing in the state, while Henry, a county where 98% of Internet traffic is concentrated behind a single ISP is the worst performing.

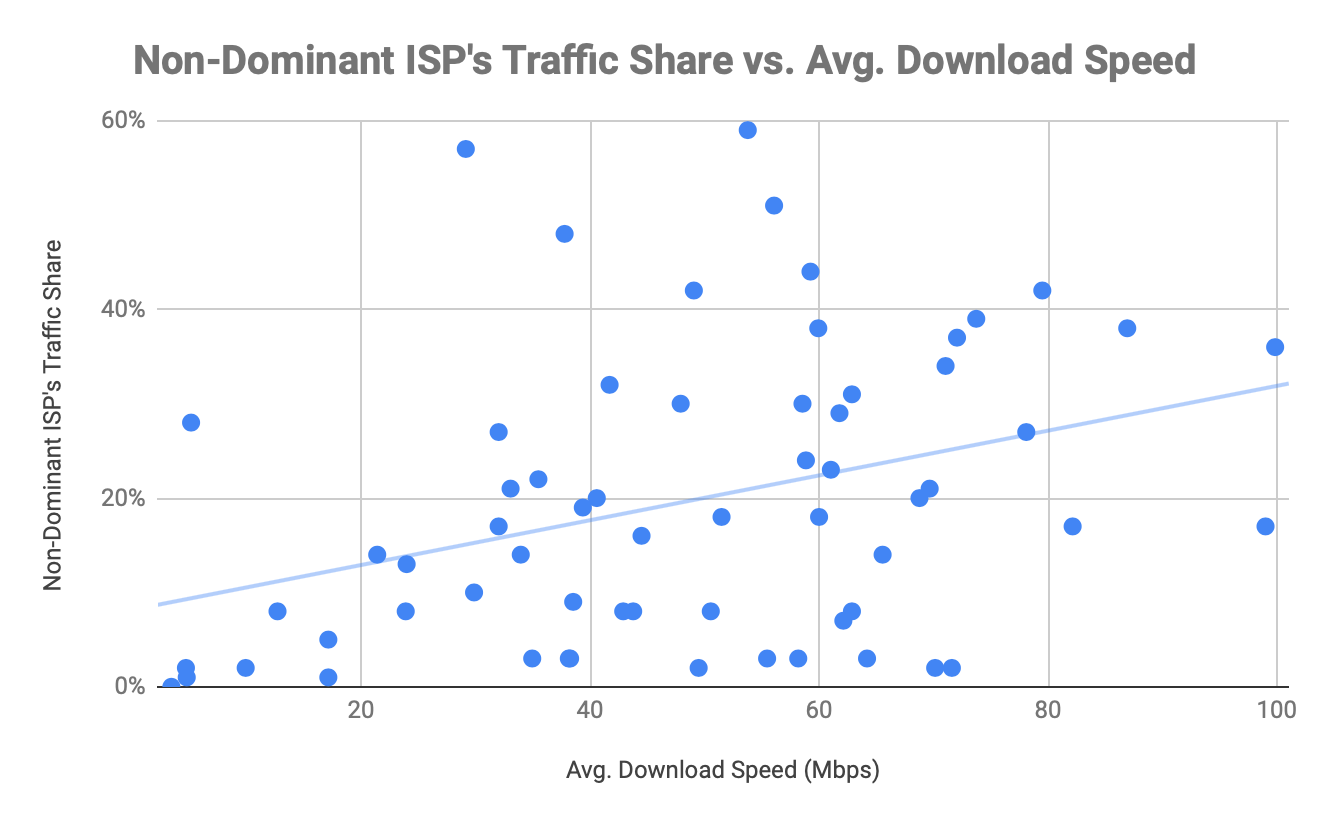
Where it gets interesting is when you plot the data, tracking the non-dominant ISP by traffic share (which is simply 100% less the traffic share of the dominant ISP) against the performance (as measured by download speed) and then use a linear line of best fit to find the relationship. Here’s what you get:
Understanding Where the Internet Isn’t Good Enough Yet

As you can see, there is a strong positive relationship between the non-dominant ISP’s traffic share and the average download speed. As the non-dominant ISP increases its traffic share, Internet speeds tend to improve. The conclusion is clear: if you want to improve Internet performance in a region, foster more competition between multiple Internet service providers.

The Other Performance Challenge: Limited ISP Exchanges, and Tromboning

There is more to the story, however, than just concentration. Alabama, like a lot of other regions that aren’t served well by ISPs, faces another performance challenge: poor routing, also sometimes known as “tromboning”.

Consider Tuskegee in Alabama, home to a local university.

In Tuskegee, choice is limited. Consumers only have a single choice for high-speed broadband. But even once an off-campus student has local access to the Internet, it isn’t truly local: Tuskegee students on a different ISP than their university will likely see their traffic detour all the way through Atlanta (two hours northeast by car!) before making its way back to school.

This doesn’t happen in isolation: today, the largest ISPs only exchange traffic with other networks in a handful of cities, notably Seattle, San Jose, Los Angeles, Dallas, Chicago, Atlanta, Miami, Ashburn, and New York City.

If you’re in one of these big cities, you’re unlikely to suffer from tromboning. But if you’re not? Your Internet traffic can often have to travel further away before looping back, similar to the shape of a trombone, reducing your Internet performance. Tromboning contributes to inefficiency and drives up the cost of Internet access. An increasing amount of traffic is wastefully carried to cities far away, instead of keeping the data local.

You can visualize how your Internet traffic is flowing, by using tools like traceroute.

As an example, we ran tests using RIPE Atlas probes to Facebook from Alabama, and unfortunately found extremes where traffic can sometimes take a highly circuitous route — traffic going to Atlanta, then Ashburn, Paris, Amsterdam, before making its way back to Alabama. The path begins on AT&T’s network and goes to Atlanta where it enters the network for Telia (an IP transit provider), crosses the Atlantic, meets Facebook, and then comes back.
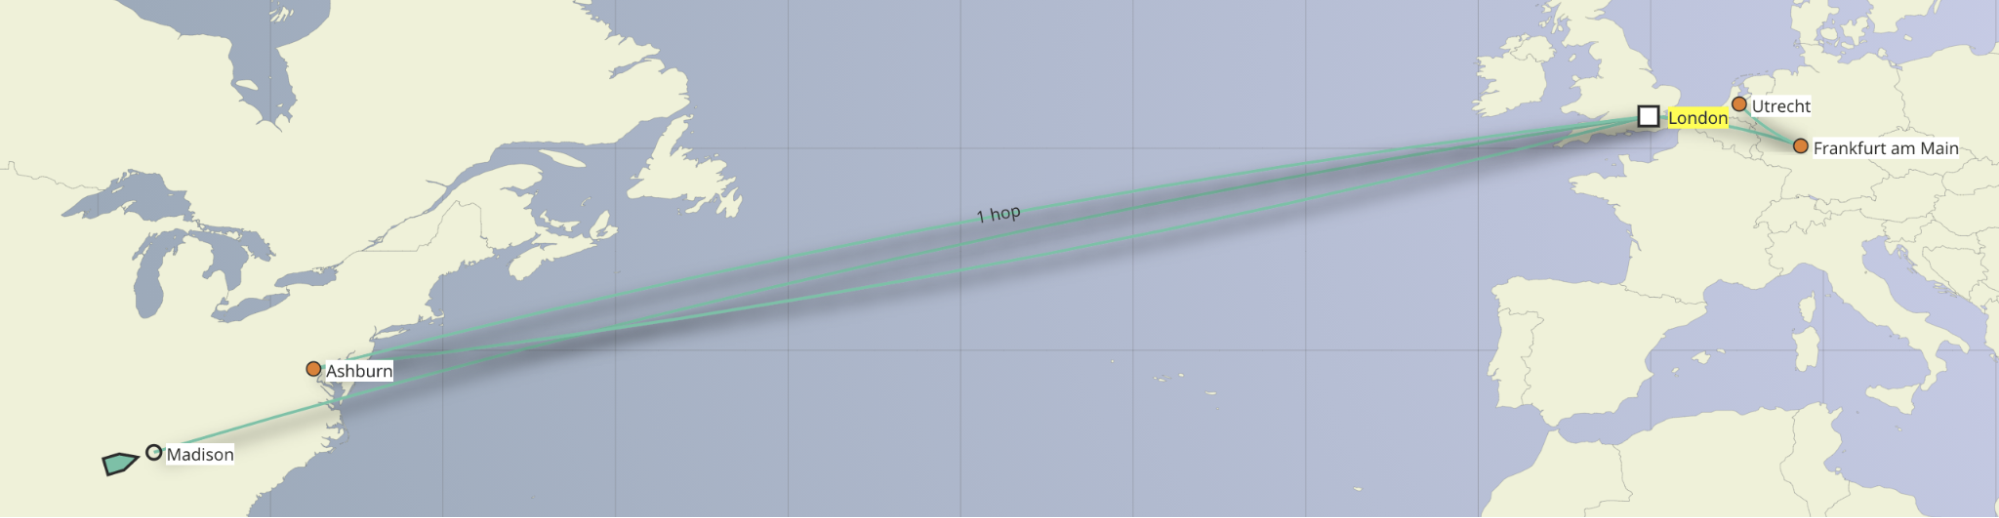
Understanding Where the Internet Isn’t Good Enough Yet

Traceroute to 157.240.201.35 (157.240.201.35), 48 byte packets
1- 192.168.6.1 1.435ms 0.912ms 0.636ms
2-  99.22.36.1 99-22-36-1.lightspeed.dctral.sbcglobal.net AS7018 1.26ms 1.134ms 1.107ms
3-  99.173.216.214 AS7018 3.185ms 3.173ms 3.099ms
4-  12.122.140.70 cr84.attga.ip.att.net AS7018 11.572ms 13.552ms 15.038ms
5 - * * *
6- 192.205.33.42 AS7018 8.695ms 9.185ms 8.703ms
7-  62.115.125.129 ash-bb2-link.ip.twelve99.net AS1299 23.53ms 22.738ms 23.012ms
8-  62.115.112.243 prs-bb1-link.ip.twelve99.net AS1299 115.516ms 115.52ms 115.211ms
9-  62.115.134.96 adm-bb3-link.ip.twelve99.net AS1299 113.487ms 113.405ms 113.25ms
10-  62.115.136.195 adm-b1-link.ip.twelve99.net AS1299 115.443ms 115.703ms 115.45ms
11- 62.115.148.231 facebook-ic331939-adm-b1.ip.twelve99-cust.net AS1299 134.149ms 113.885ms 114.246ms
12- 129.134.51.84 po151.asw02.ams2.tfbnw.net AS32934 113.27ms 113.078ms 113.149ms
13-  129.134.48.101 po226.psw04.ams4.tfbnw.net AS32934 114.529ms 114.439ms 117.257ms
14-  157.240.38.227 AS32934 113.281ms 113.365ms 113.448ms
15- 157.240.201.35 edge-star-mini-shv-01-ams4.facebook.com AS32934 115.013ms 115.223ms 115.112ms

The intent here isn’t to shame AT&T, Telia, or Facebook — nor is this challenge unique to them. Facebook’s content is undoubtedly cached in Atlanta and the request from Alabama should go no further than that. While many possible conditions within and between these three networks could have caused this tromboning, in the end, the consumer suffers.

The solution? Have more major ISPs exchange in more cities and with more networks. Of course, there’d be an upfront cost involved in doing so, even if it would reduce cost more over the long run.

Conclusion

As William Gibson famously observed: the future is here, but it’s just not evenly distributed.

One of the clearest takeaways from the data and analysis presented here is that Internet access varies tremendously across geographies. But it’s not just a case of the developed world vs the developing, or even rural vs urban. There are underserved urban communities and regions of the developed world that do not score as highly as you might expect.

Furthermore, our case study of Alabama shows that the structure of the ISP market is incredibly important to promoting performance. We found a strong positive correlation between more competition and faster performance. Similarly, there’s a lot of opportunity for more networks to interconnect in more places, to avoid bad routing.

Finally, if we want to get the other 40% of the world online, we are going to need more initiatives that drive up access and drive down cost. There’s plenty of scope to help — and we’re excited to be launching Project Pangea to help.
The UEFA EURO 2020 final as seen online by Cloudflare Radar

Post Syndicated from John Graham-Cumming original https://blog.cloudflare.com/the-uefa-euro-2020-final-as-seen-online-by-cloudflare-radar/

The UEFA EURO 2020 final as seen online by Cloudflare Radar

Last night’s Italy-England match was a nail-biter. 1-1 at full time, 1-1 at the end of extra time, and then an amazing penalty shootout with incredible goalkeeping by Pickford and Donnarumma.

Cloudflare has been publishing statistics about all the teams involved in EURO 2020 and traffic to betting websites, sports newspapers, streaming services and sponsors. Here’s a quick look at some specific highlights from England’s and Italy’s EURO 2020.

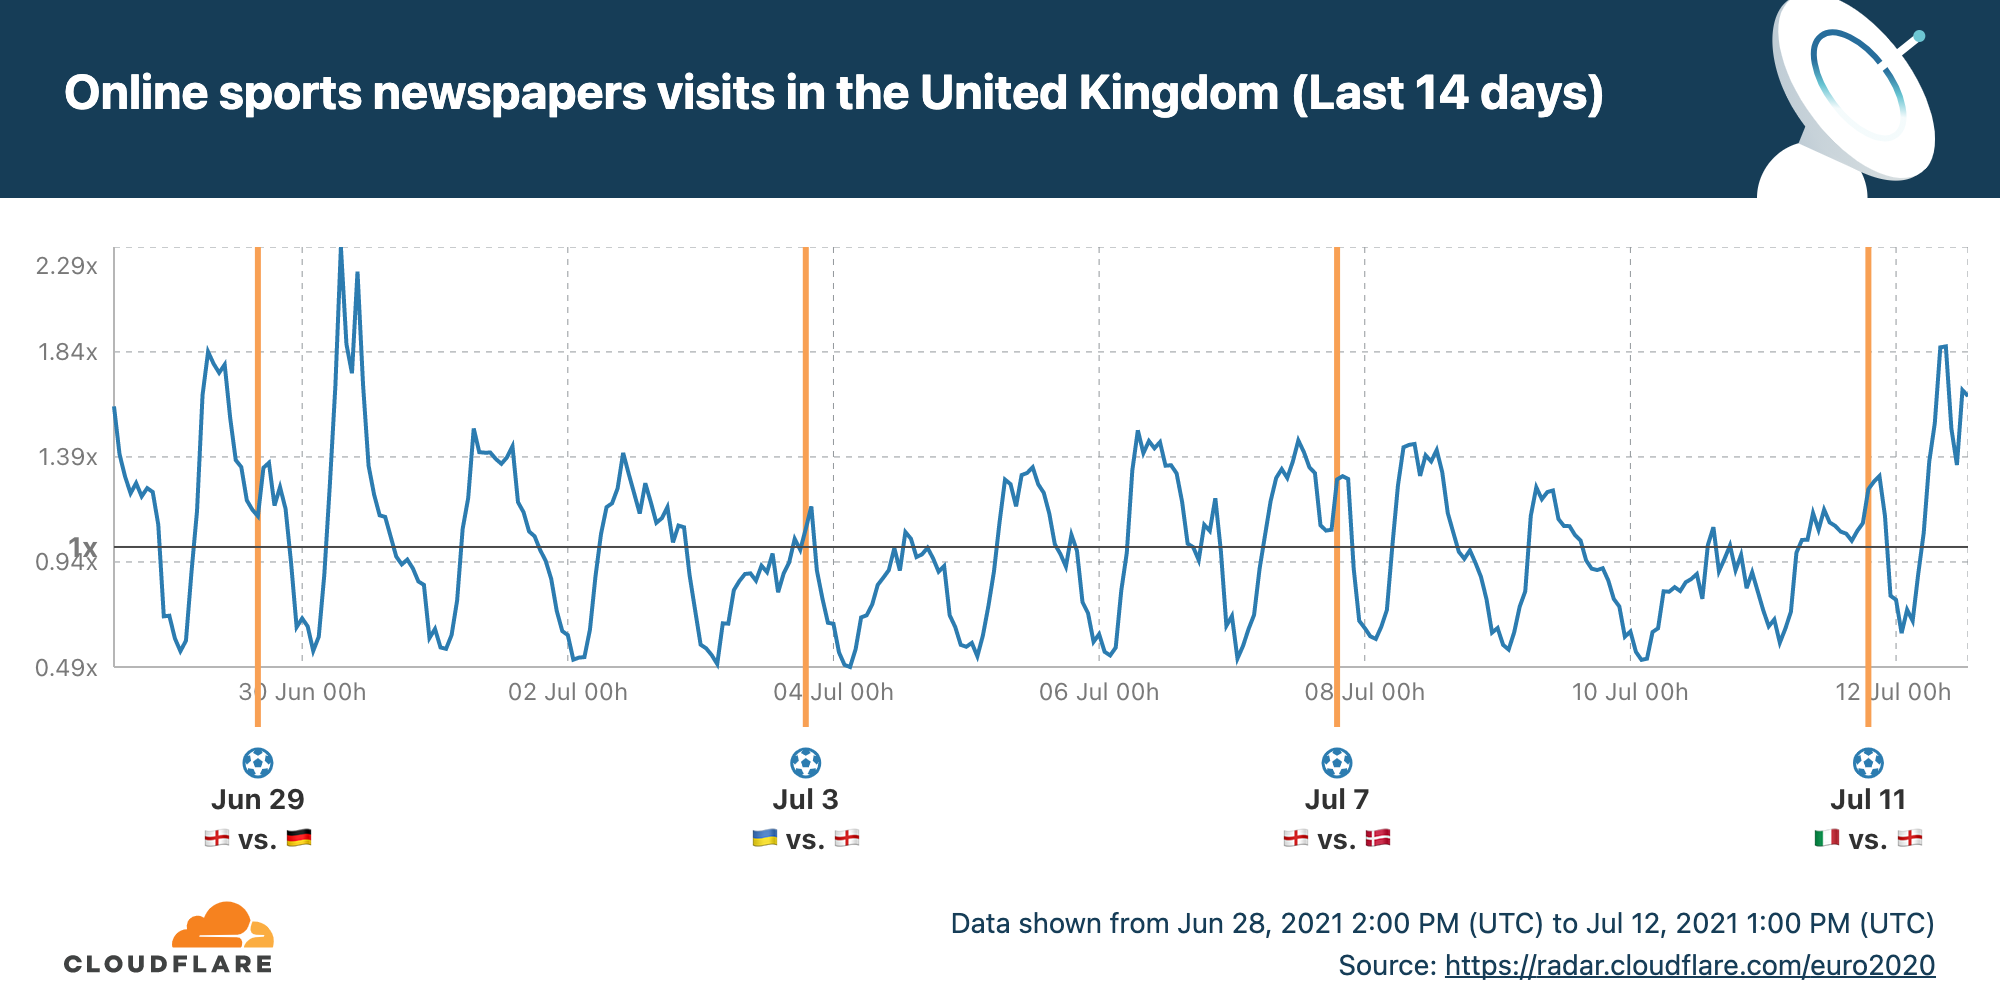
Two interesting peaks show up in UK visits to sports newspapers: the day after England-Germany and today after England’s defeat. Looks like fans are hungry for analysis and news beyond the goals. You can see all the data on the dedicated England EURO 2020 page on Cloudflare Radar.

The UEFA EURO 2020 final as seen online by Cloudflare Radar

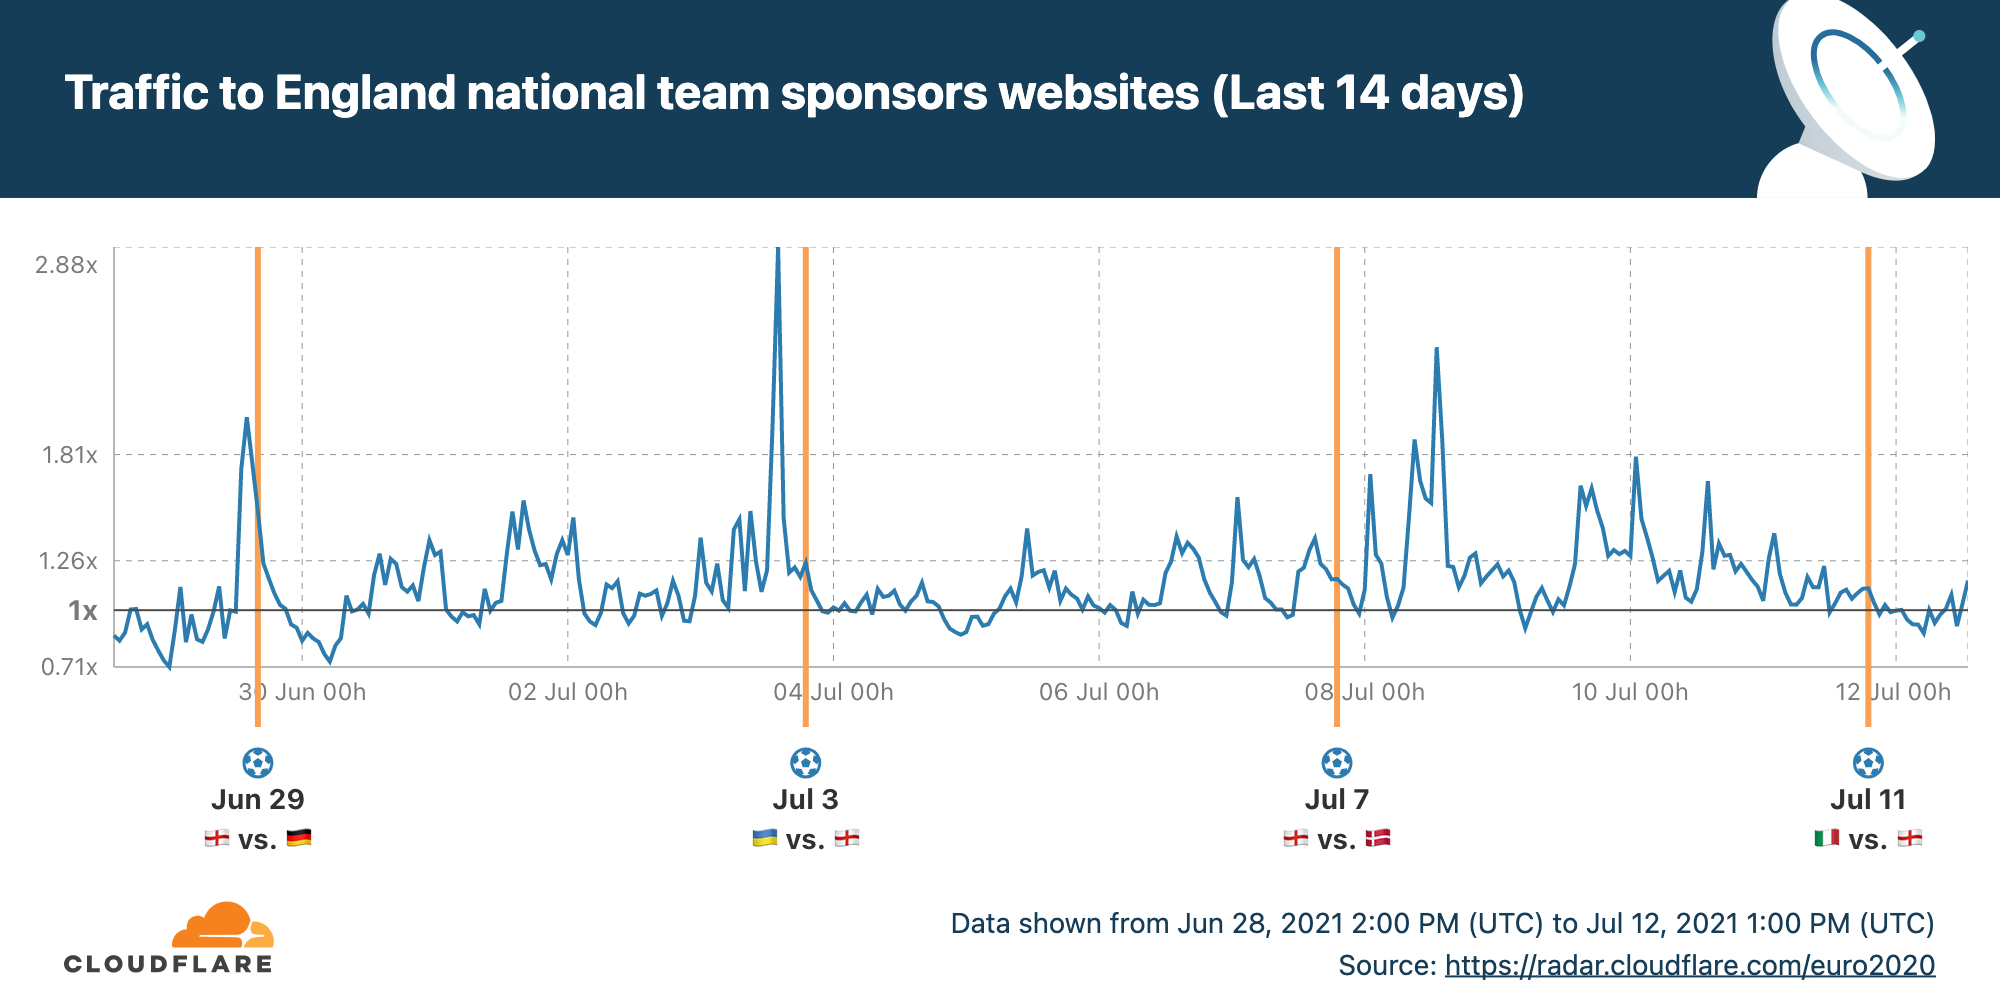
But it was a quiet morning for the websites of the England team’s sponsors.

The UEFA EURO 2020 final as seen online by Cloudflare Radar

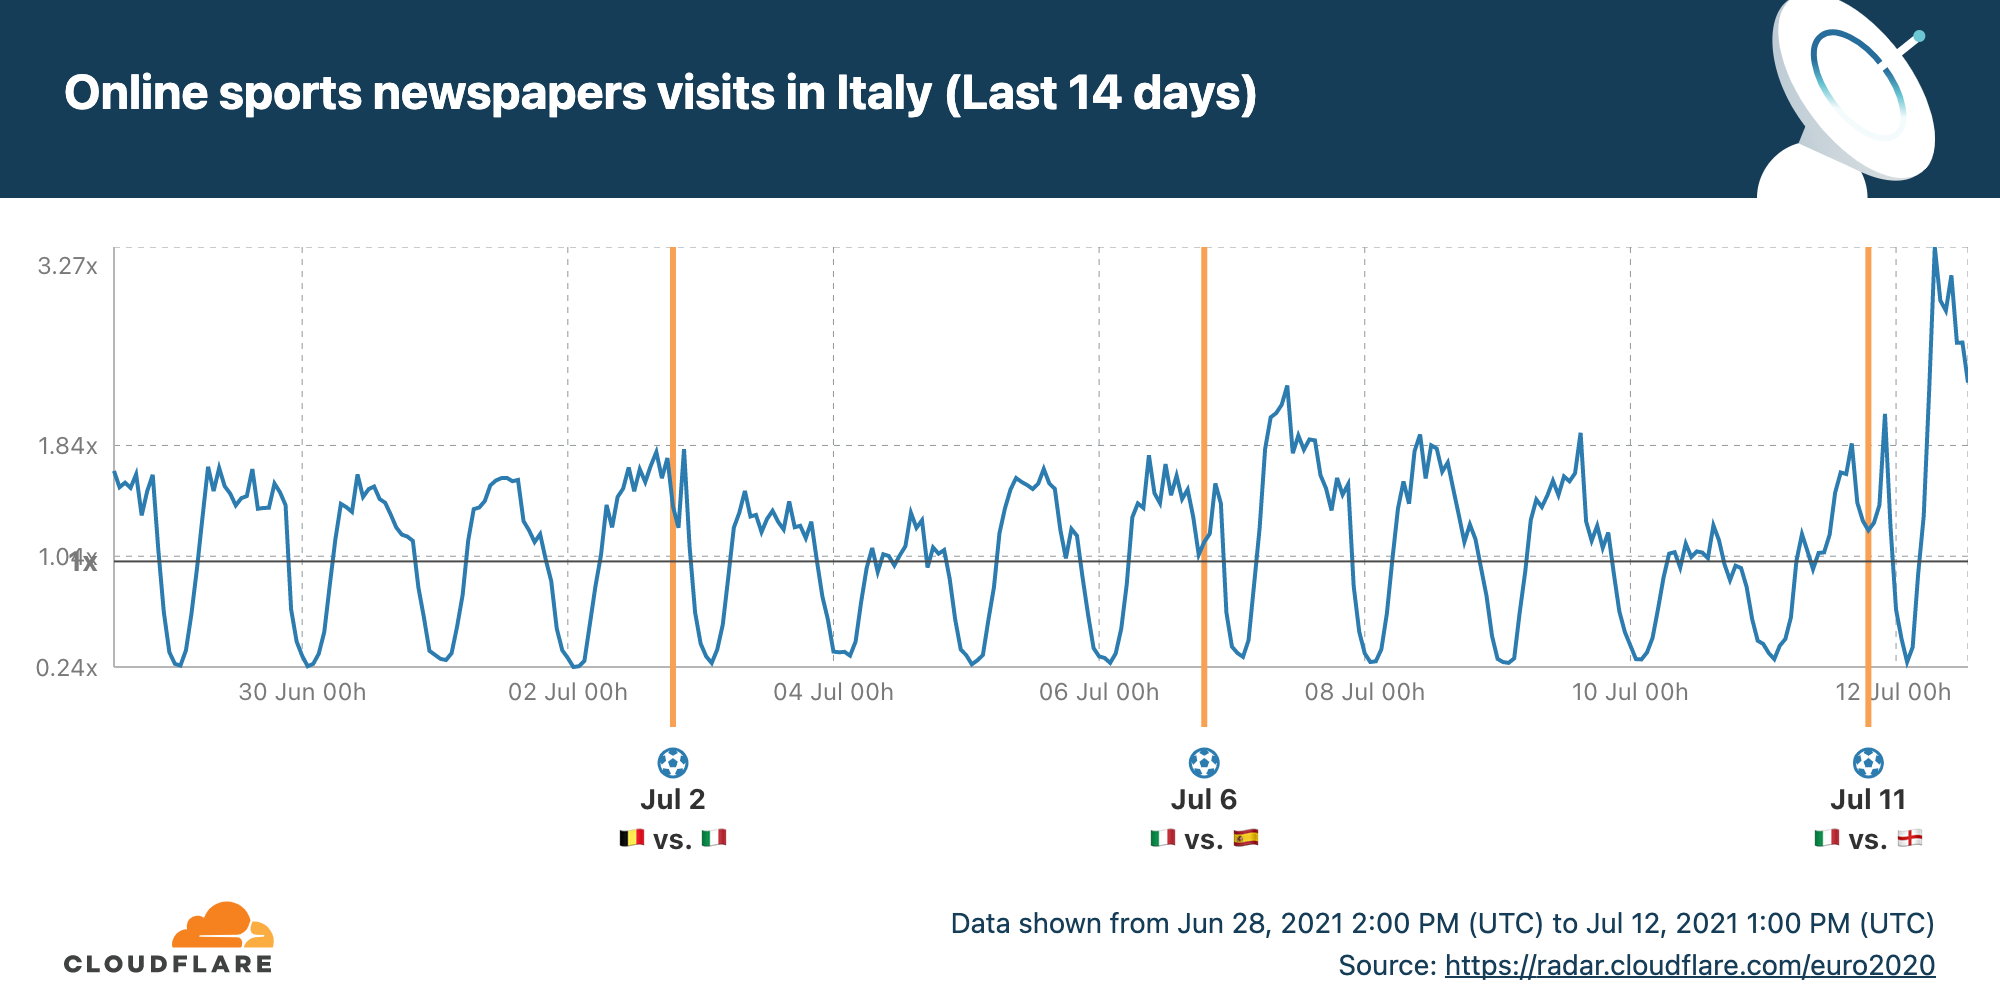
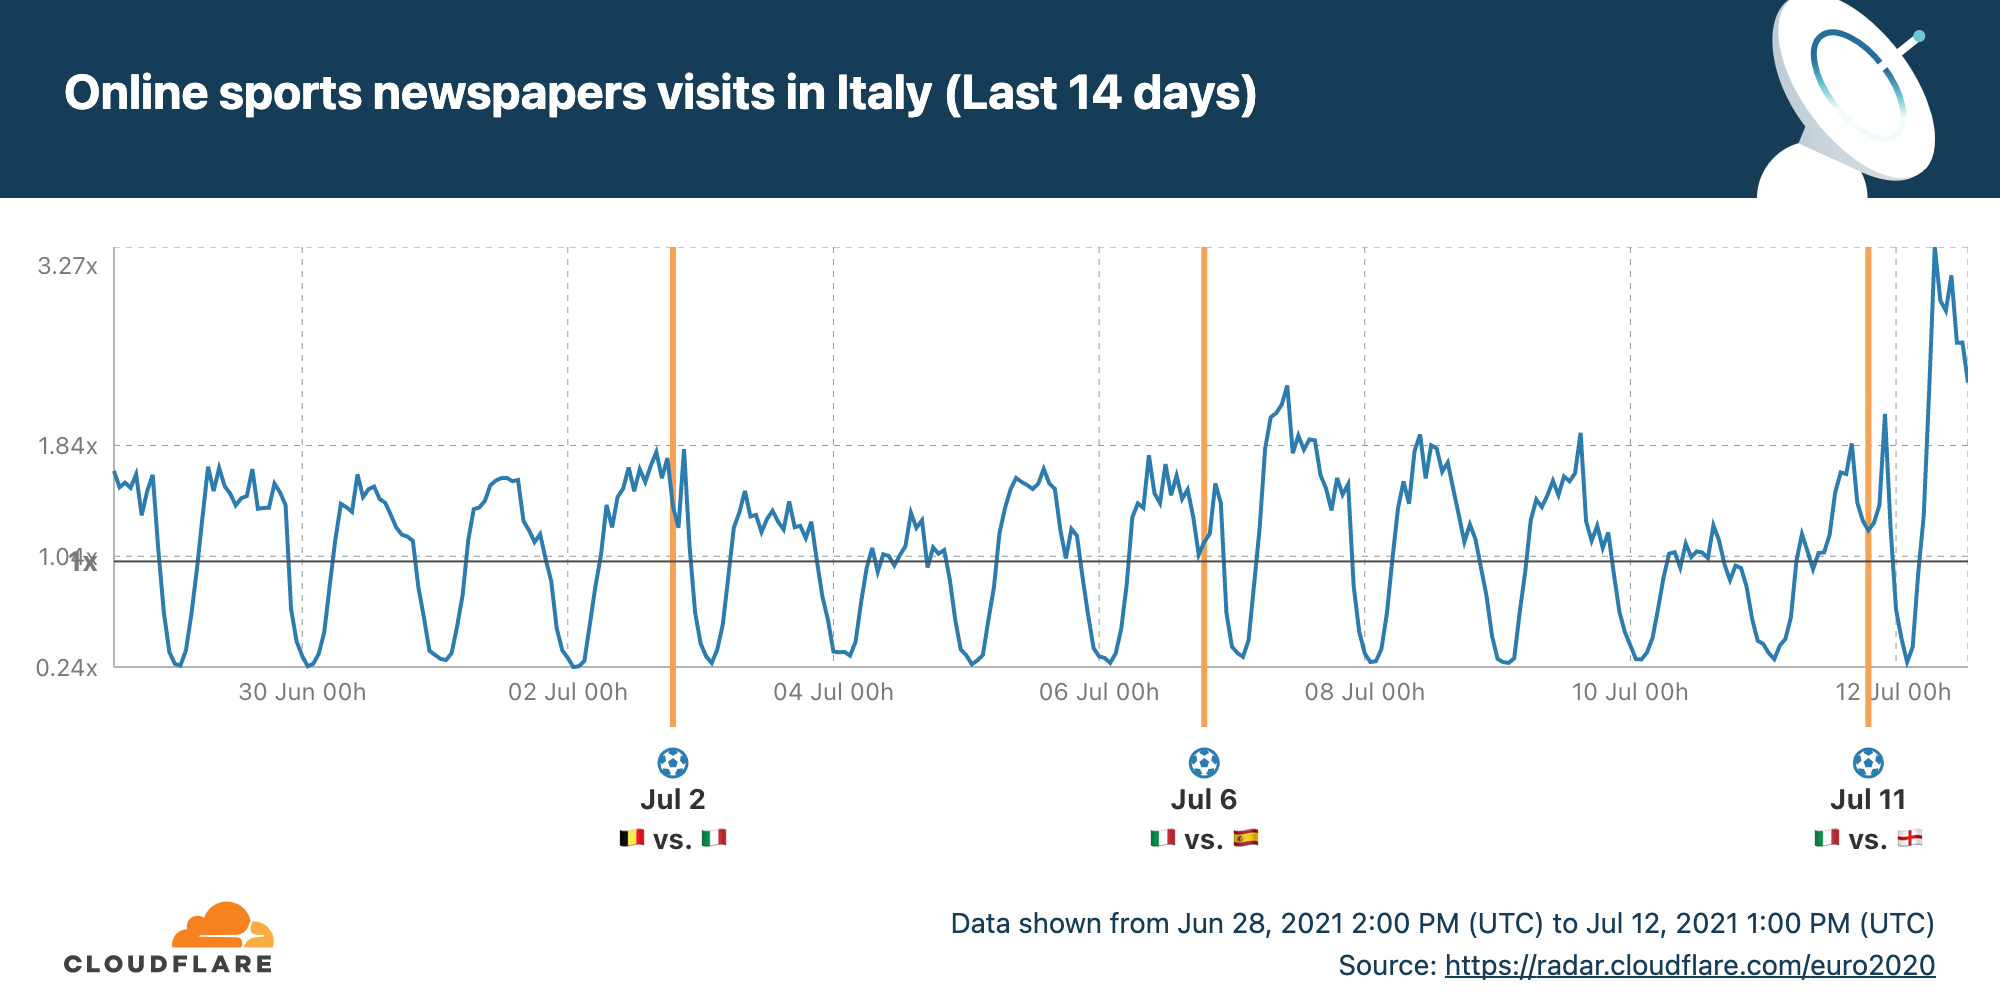
Turning to the winners, we can see that Italian readers are even more interested in knowing more about their team’s success.

The UEFA EURO 2020 final as seen online by Cloudflare Radar

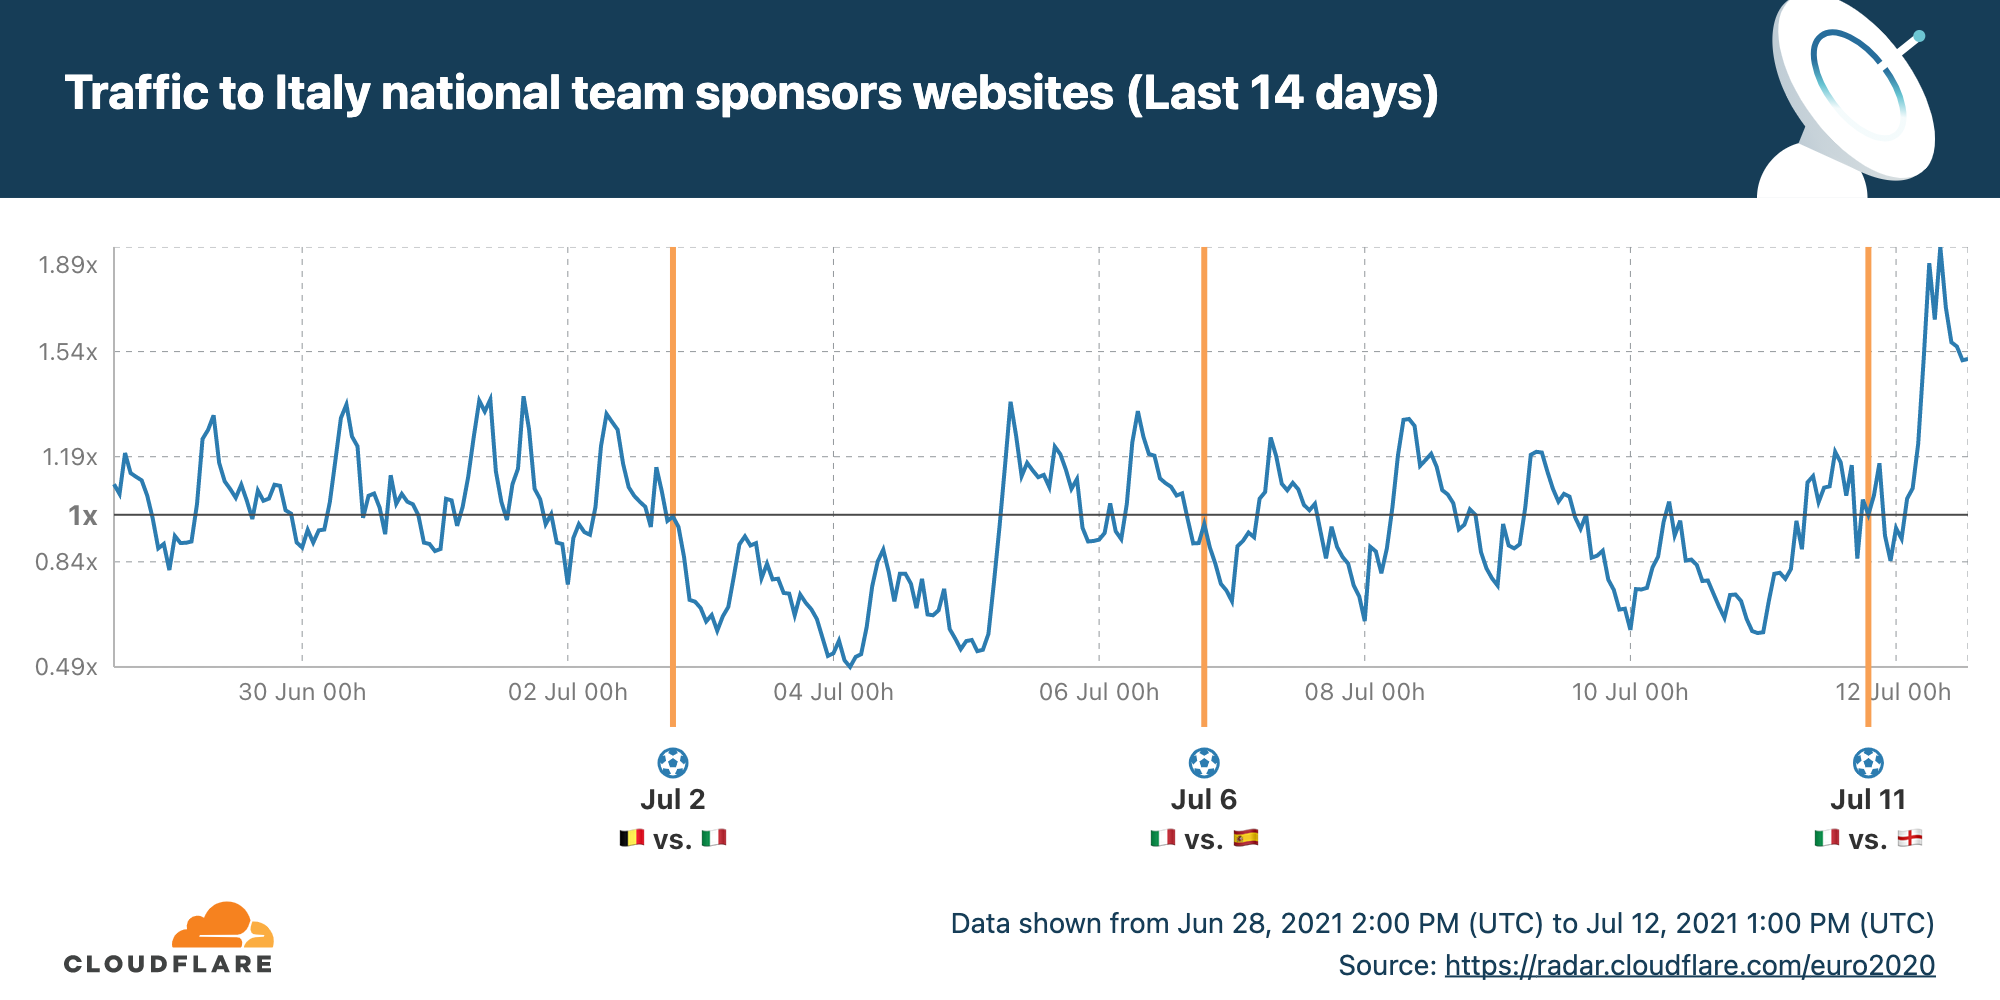
And this enthusiasm spills over into visits to the Italian team’s sponsors.

The UEFA EURO 2020 final as seen online by Cloudflare Radar

You can follow along on the dedicated Cloudflare Radar page for Italy in EURO 2020.

Visit Cloudflare Radar for information on global Internet trends, trending domains, attacks and usage statistics.

Sudan’s exam-related Internet shutdowns

Post Syndicated from John Graham-Cumming original https://blog.cloudflare.com/sudans-exam-related-internet-shutdowns/

Sudan's exam-related Internet shutdowns

To prevent cheating in exams many countries restrict or even shut down Internet access during critical exam hours. I wrote two weeks ago about Syria having planned Internet shutdowns during June, for exams.

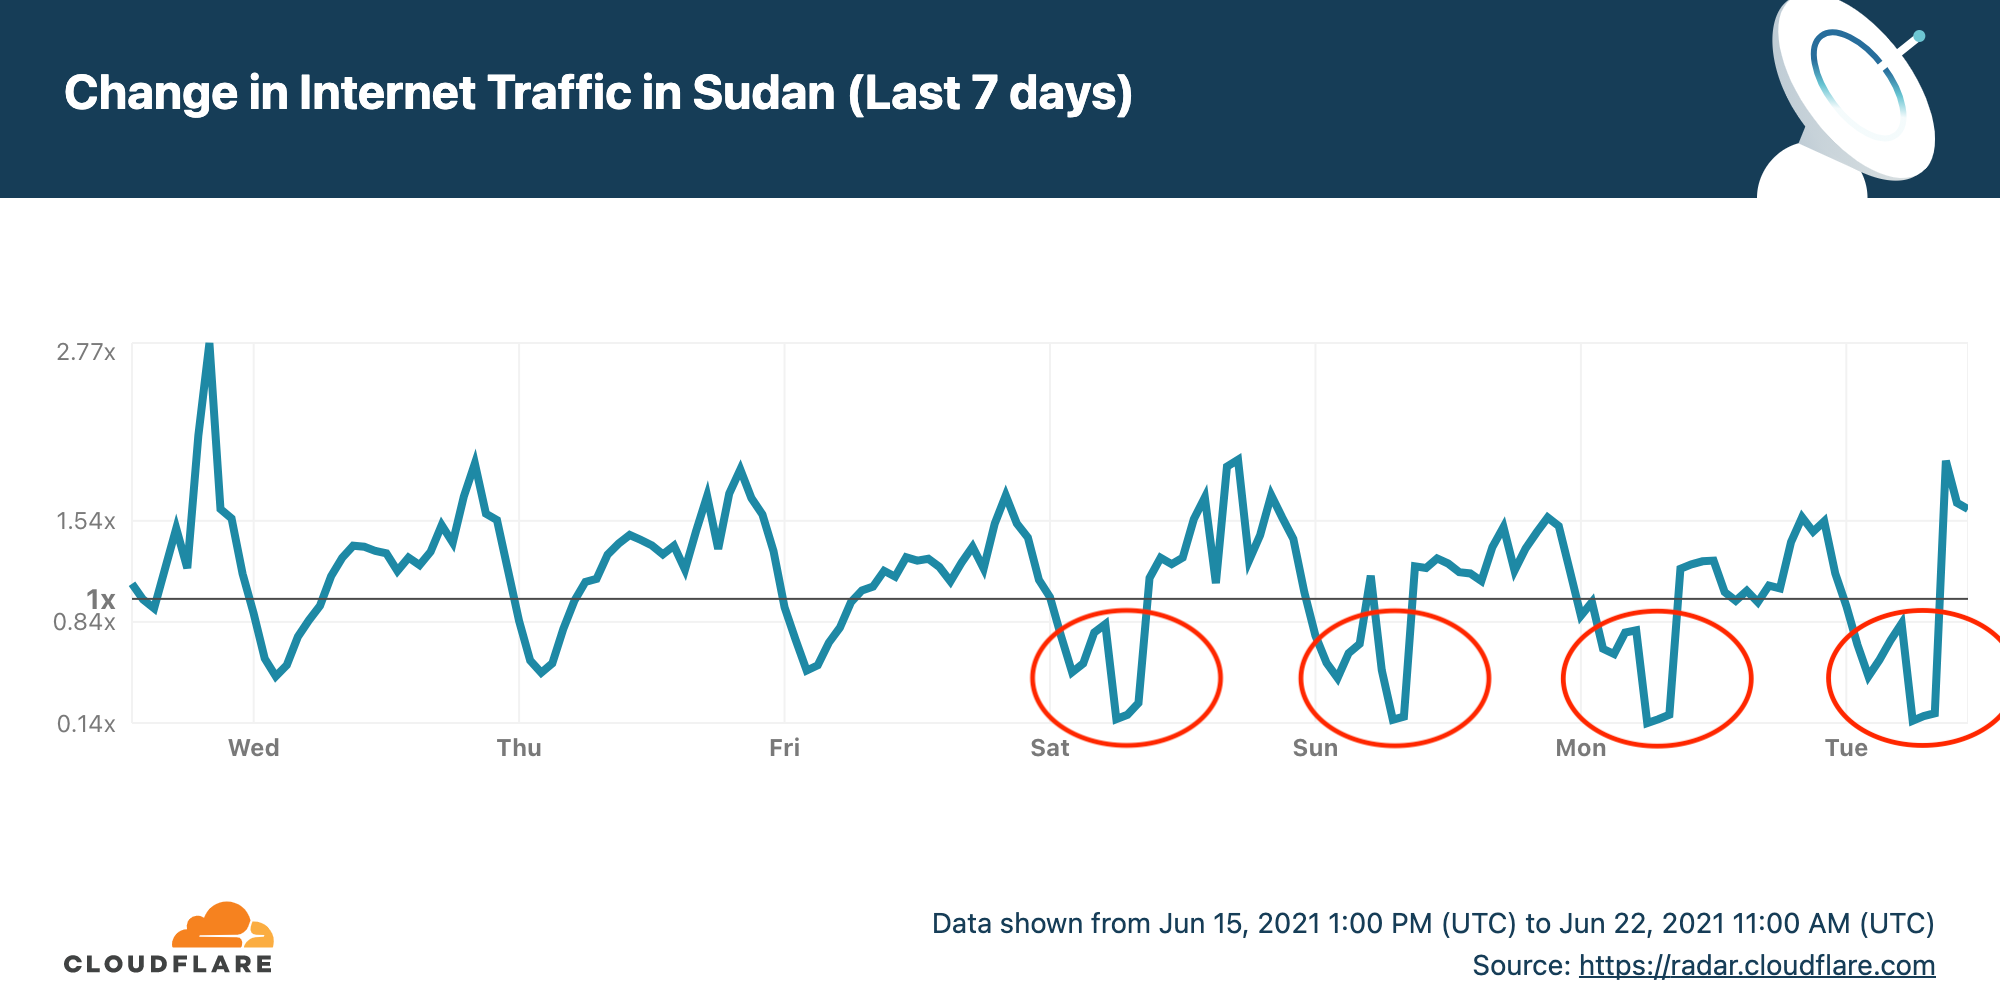
Sudan is doing the same thing and has had four shutdowns so far. Here’s the Internet traffic pattern for Sudan over the last seven days. I’ve circled the shutdowns on Saturday, Sunday, Monday and Tuesday (today, June 22, 2021).

Sudan's exam-related Internet shutdowns

Cloudflare Radar allows anyone to track Internet traffic patterns around the world, and it has country-specific pages. The chart for the last seven days (shown above) came from the dedicated page for Sudan.

The Internet outages start at 0600 UTC (0800 local time) and end three hours later at 0900 UTC (1100 local time). This corresponds to the timings announced by the Sudanese Ministry of Education.

Sudan's exam-related Internet shutdowns

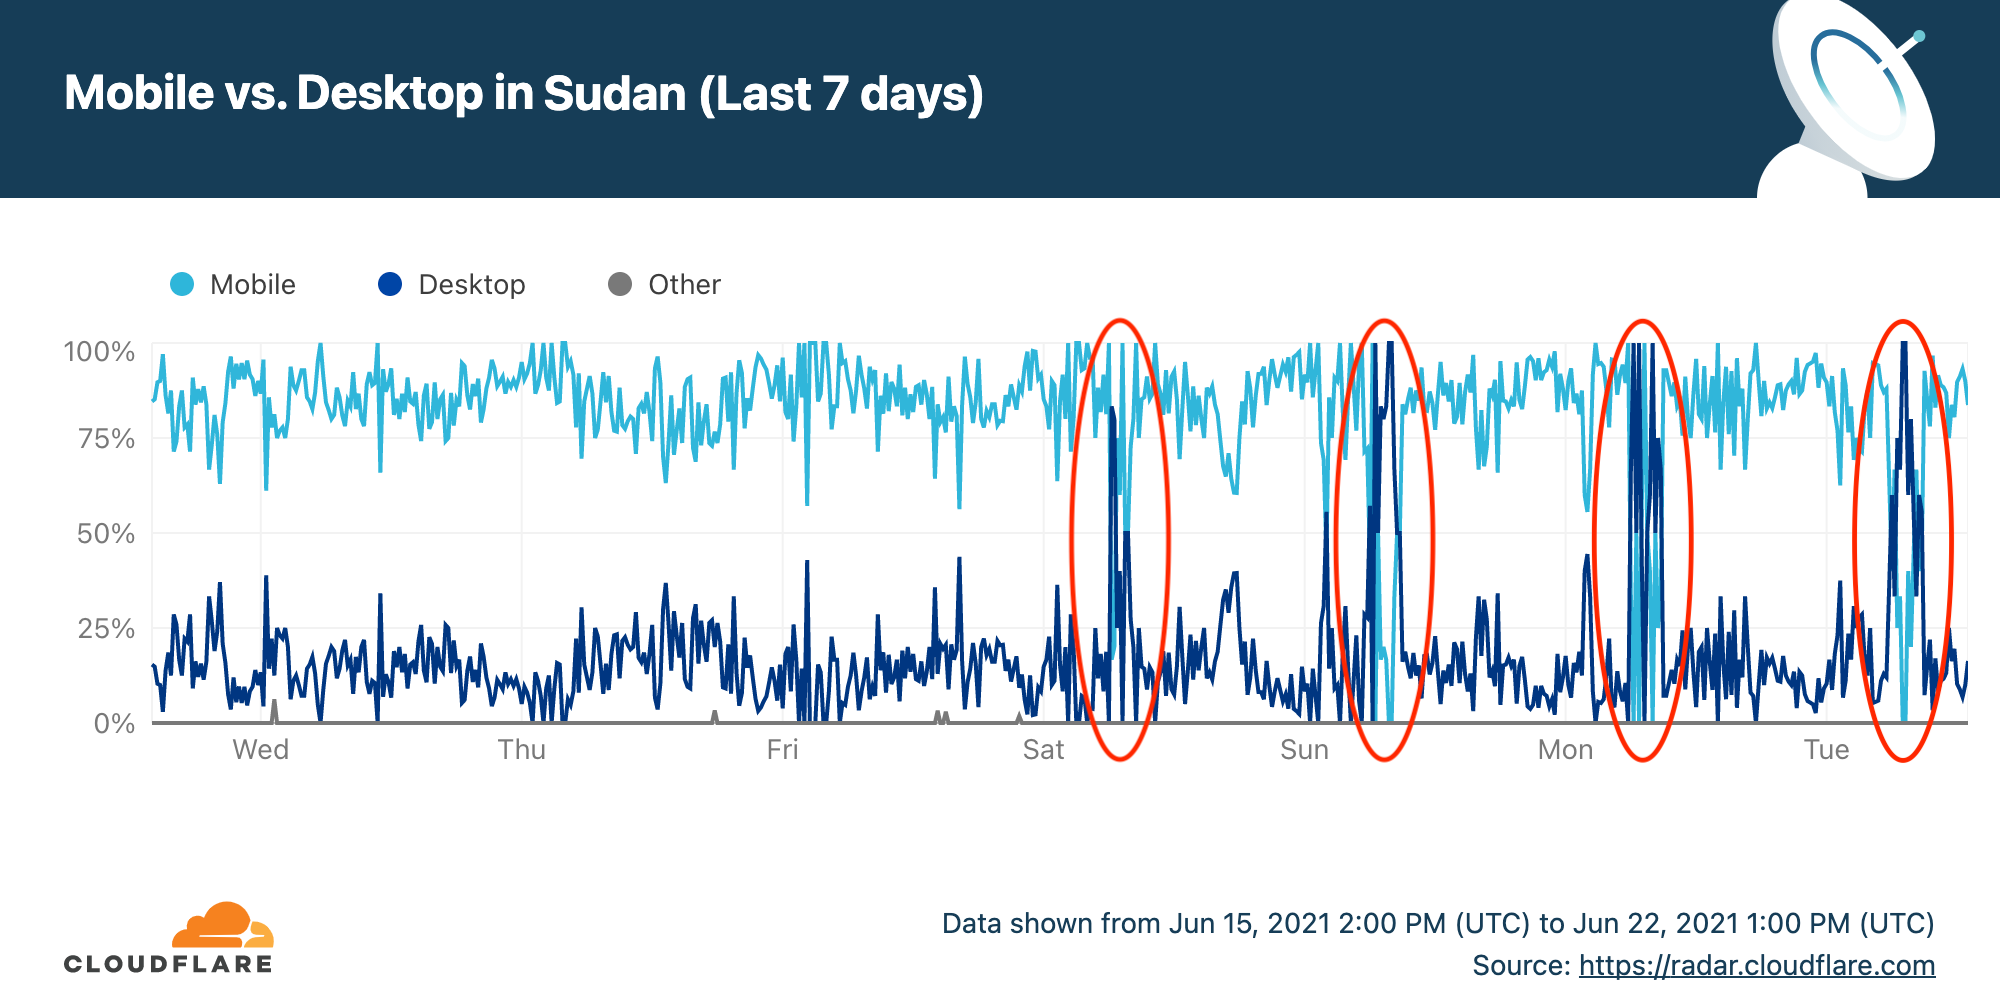
Further shutdowns are likely in Sudan on June 24, 26, 27, 29 and 30 (thanks to Twitter user _adonese for his assistance). Looking deeper into the data, the largest drop in use is for mobile Internet access in Sudan (the message above talks about mobile Internet use being restricted) while some non-mobile access appears to continue.

That can be seen by looking at the traffic mix from Sudan. During the exam times mobile use drops (as a percentage of traffic) and desktop use increases. This chart also shows how popular mobile Internet access is in Sudan: it’s typically above 75% of traffic (compare with, for example, the US).

Sudan's exam-related Internet shutdowns

If you want to follow the other outages for the remaining five exams, you can see live data on the Cloudflare Radar Sudan page.

Creating serendipity with Python

Post Syndicated from John Graham-Cumming original https://blog.cloudflare.com/creating-serendipity-with-python/

Creating serendipity with Python

We’ve been experimenting with breaking up employees into random groups (of size 4) and setting up video hangouts between them. We’re doing this to replace the serendipitous meetings that sometimes occur around coffee machines, in lunch lines or while waiting for the printer. And also, we just want people to get to know each other.

Which lead to me writing some code. The core of which is divide n elements into groups of at least size g minimizing the size of each group. So, suppose an office has 15 employees in it then it would be divided into three groups of sizes 5, 5, 5; if an office had 16 employees it would be 4, 4, 4, 4; if it had 17 employees it would be 4, 4, 4, 5 and so on.


I initially wrote the following code (in Python):

    groups = [g] * (n//g)

    for e in range(0, n % g):
        groups[e % len(groups)] += 1

The first line creates n//g (// is integer division) entries of size g (for example, if g == 4 and n == 17 then groups == [4, 4, 4, 4]). The for loop deals with the ‘left over’ parts that don’t divide exactly into groups of size g. If g == 4 and n == 17 then there will be one left over element to add to one of the existing [4, 4, 4, 4] groups resulting in [5, 4, 4, 4].

The e % len(groups) is needed because it’s possible that there are more elements left over after dividing into equal sized groups than there are entries in groups. For example, if g == 4 and n == 11 then groups is initially set to [4, 4] with three left over elements that have to be distributed into just two entries in groups.

So, that code works and here’s the output for various sizes of n (and g == 4):

    4 [4]
    5 [5]
    6 [6]
    7 [7]
    8 [4, 4]
    9 [5, 4]
    10 [5, 5]
    11 [6, 5]
    12 [4, 4, 4]
    13 [5, 4, 4]
    14 [5, 5, 4]
    15 [5, 5, 5]
    16 [4, 4, 4, 4]
    17 [5, 4, 4, 4]

But the code irritated me because I felt there must be a simple formula to work out how many elements should be in each group. After noodling on this problem I decided to do something that’s often helpful… make the problem simple and naive, or, at least, the solution simple and naive, and so I wrote this code:

    groups = [0] * (n//g)

    for i in range(n):
        groups[i % len(groups)] += 1

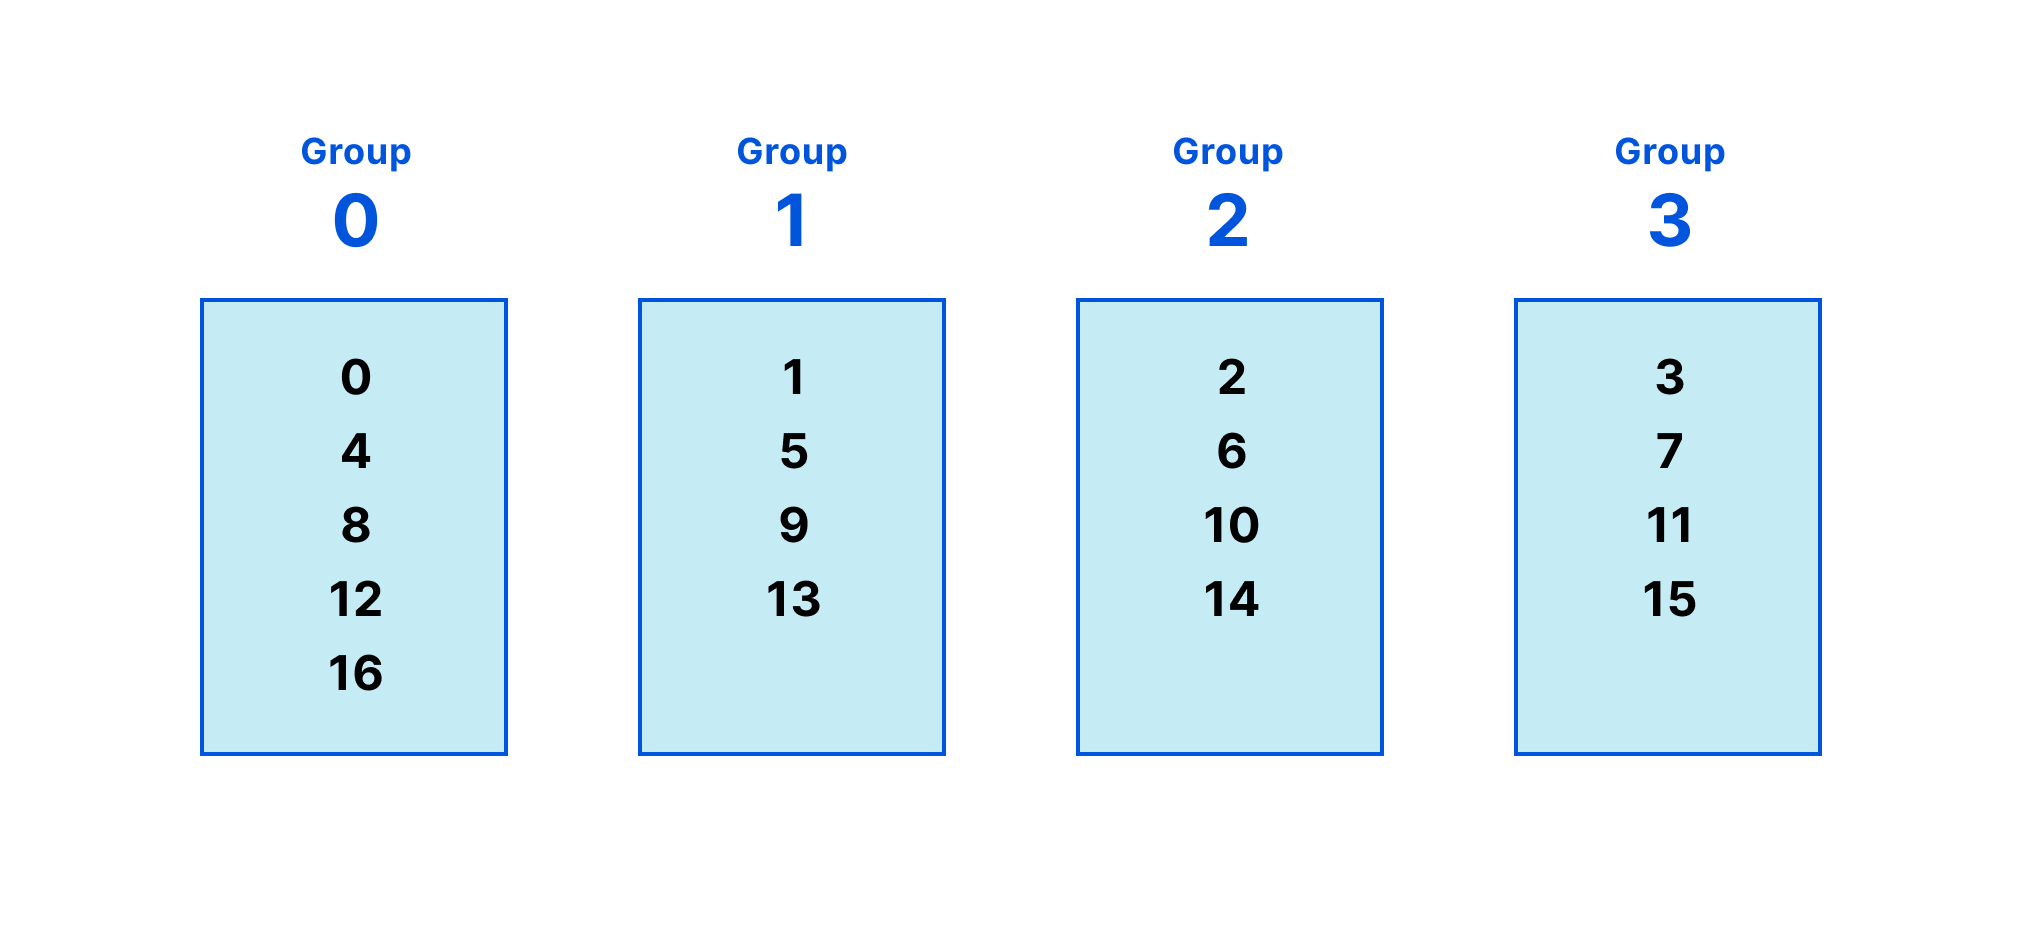
This is a really simple implementation. I don’t like it because it loops n times but it helps visualize something. Imagine that g == 4 and n == 17. This loop ‘fills up’ each entry in groups like this (each square is an entry in groups and numbers in the squares are values of i for which that entry was incremented by the loop).

Creating serendipity with Python

So groups ends up being [5, 4, 4, 4].  What this helps see is that the number of times groups[i] is incremented depends on the number of times the for loop ‘loops around’ on the ith element. And that’s something that’s easy to calculate without looping.

So this means that the code is now simply:

    groups = [1+max(0,n-(i+1))//(n//g) for i in range(n//g)]

And to me that is more satisfying. n//g is the size of groups which makes the loop update each entry in groups once. Each entry is set to 1 + max(0, n-(i+1))//(n//g). You can think of this as follows:

1. The 1 is the first element to be dropped into each entry in groups.

2. max(0, n-(i+1)) is the number of elements left over once you’ve placed 1 in each of the elements of groups up to position i. It’s divided by n//g to work out how many times the process of sharing out elements (see the naive loop above) will loop around.

If #2 there isn’t clear, consider the image above and imagine we are computing groups[0] (n == 17 and g == 4). We place 1 in groups[0] leaving 16 elements to share out. If you naively shared them out you’d loop around four times and thus need to add 16/4 elements to groups[0]making it 5.

Move on to groups[1] and place a 1 in it. Now there are 15 elements to share out, that’s 15/4 (which is 3 in integer division) and so you place 4 in groups[1]. And so on…

And that solution pleases me most. It succinctly creates groups in one shot. Of course, I might have over thought this… and others might think the other solutions are clearer or more maintainable.

Cloudflare Radar’s 2020 Year In Review

Post Syndicated from John Graham-Cumming original https://blog.cloudflare.com/cloudflare-radar-2020-year-in-review/

Cloudflare Radar's 2020 Year In Review

Cloudflare Radar's 2020 Year In Review

Throughout 2020, we tracked changing Internet trends as the SARS-Cov-2 pandemic forced us all to change the way we were living, working, exercising and learning. In early April, we created a dedicated website https://builtforthis.net/ that showed some of the ways in which Internet use had changed, suddenly, because of the crisis.

On that website, we showed how traffic patterns had changed; for example, where people accessed the Internet from, how usage had jumped up dramatically, and how Internet attacks continued unabated and ultimately increased.

Today we are launching a dedicated Year In Review page with interactive maps and charts you can use to explore what changed on the Internet in 2020. Year In Review is part of Cloudflare Radar. We launched Radar in September 2020 to give anyone access to Internet use and abuse trends that Cloudflare normally had reserved only for employees.

Where people accessed the Internet

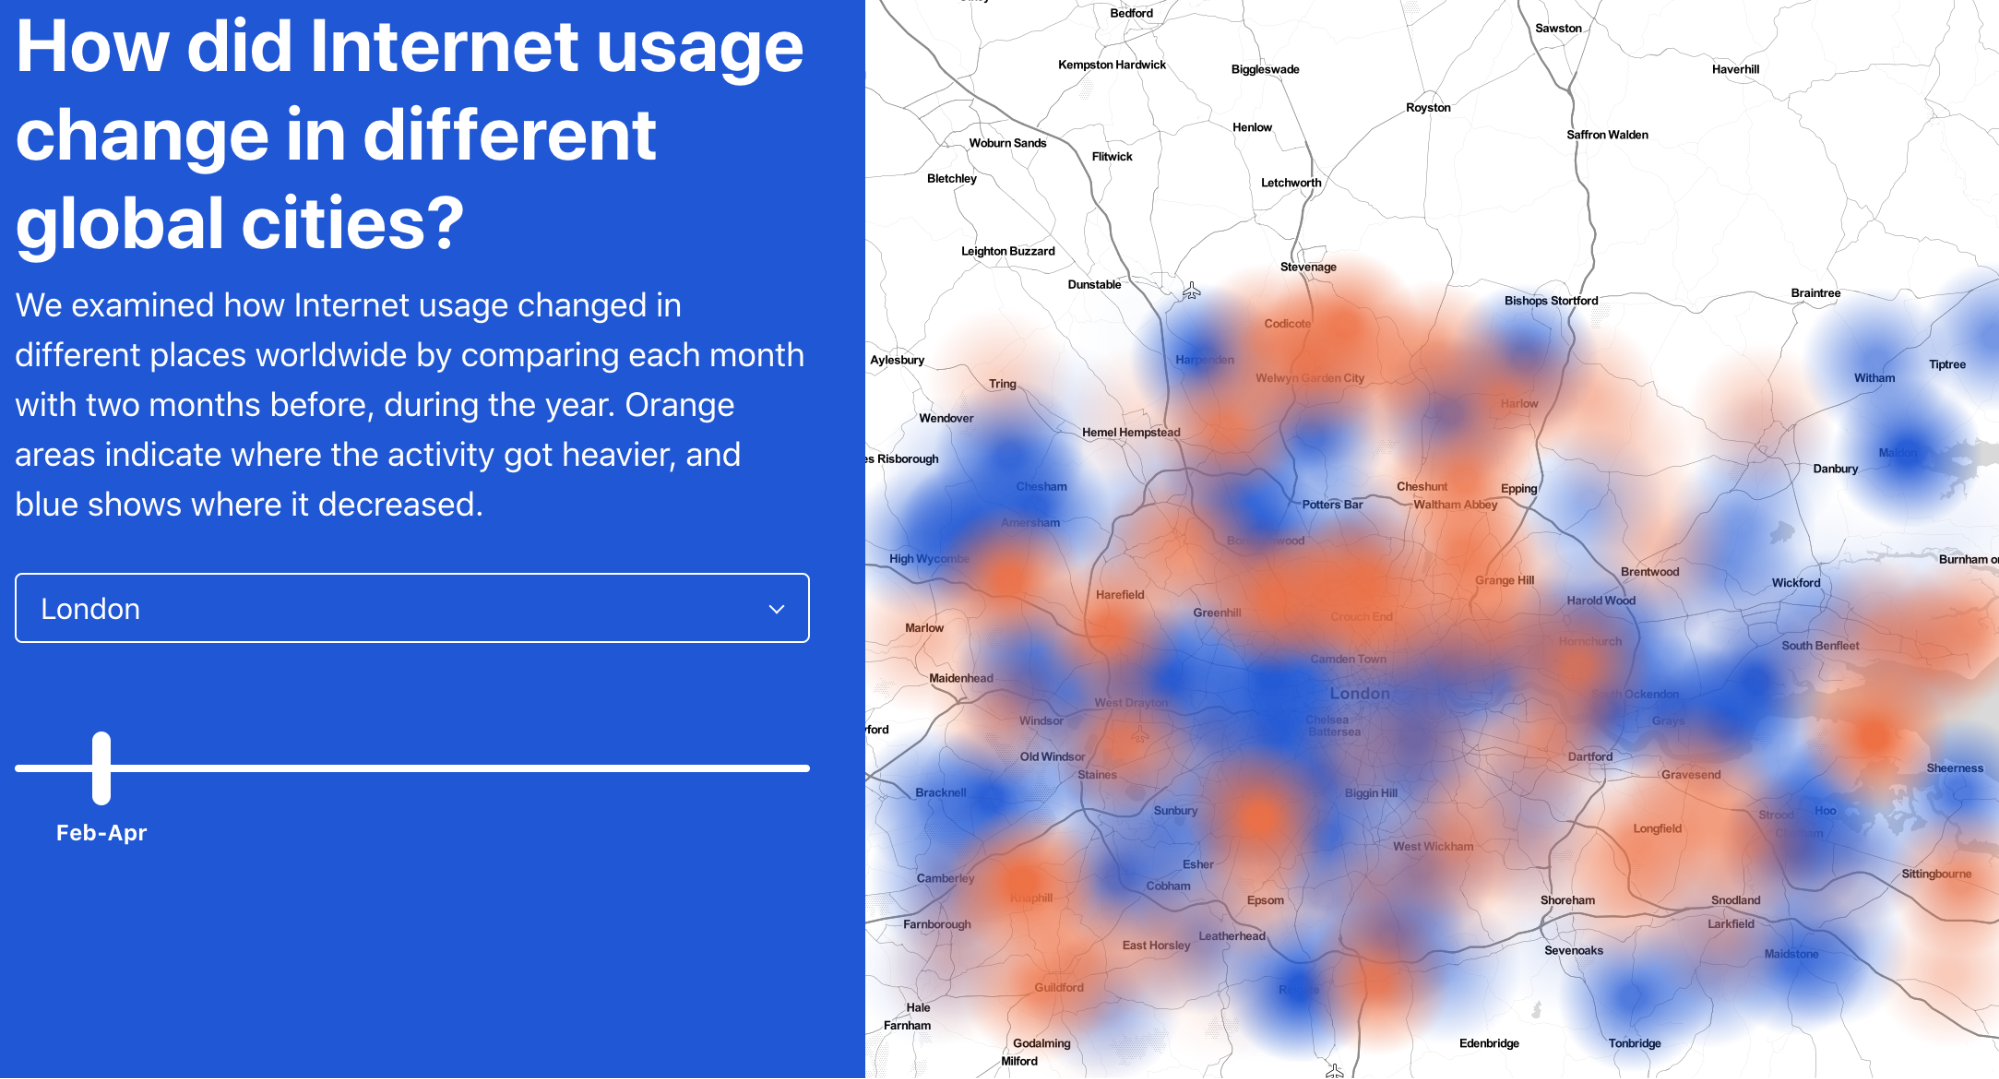
To get a sense for the Year In Review, let’s zoom in on London (you can do the same with any city from a long list of locations that we’ve analyzed). Here’s a map showing the change in Internet use comparing April (post-lockdown) and February (pre-lockdown). This map compares working hours Internet use on a weekday between those two months.

As you can clearly see, with offices closed in central London (and elsewhere), Internet use dropped (the blue colour) while usage increased in largely residential areas. Looking out to the west of London, a blue area near Windsor shows how Internet usage dropped at London’s Heathrow airport and surrounding areas.

Cloudflare Radar's 2020 Year In Review

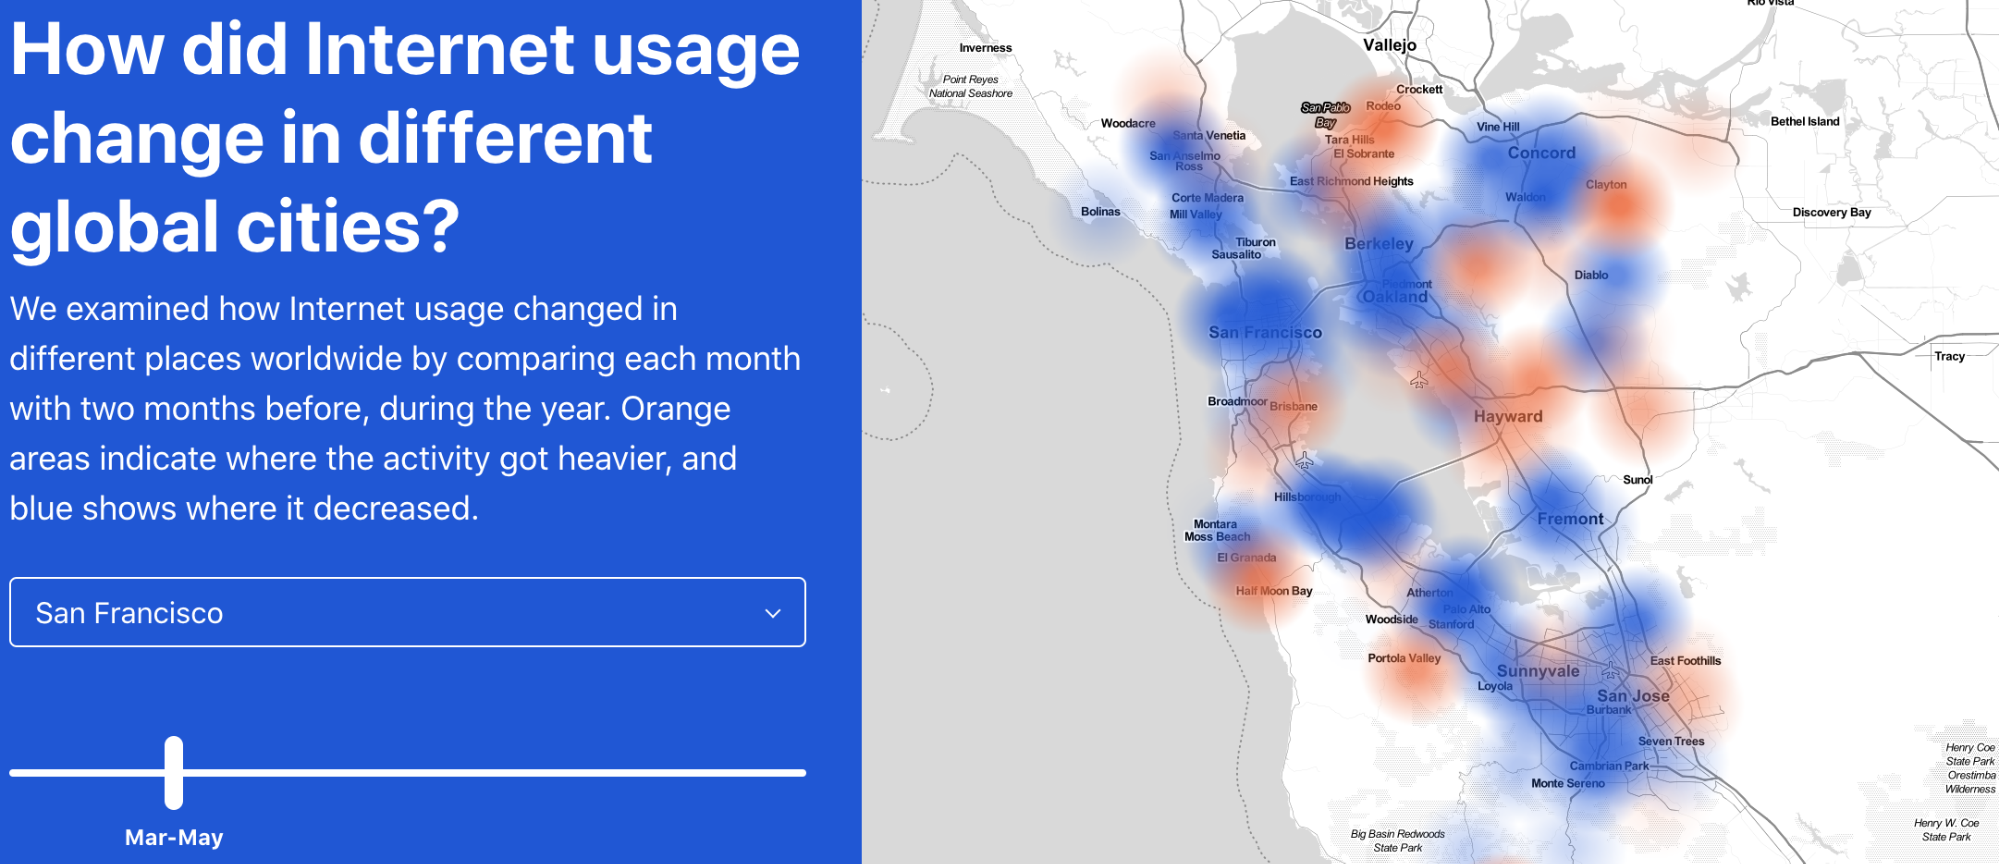
A similar story plays out slightly later in the San Francisco Bay Area.

Cloudflare Radar's 2020 Year In Review

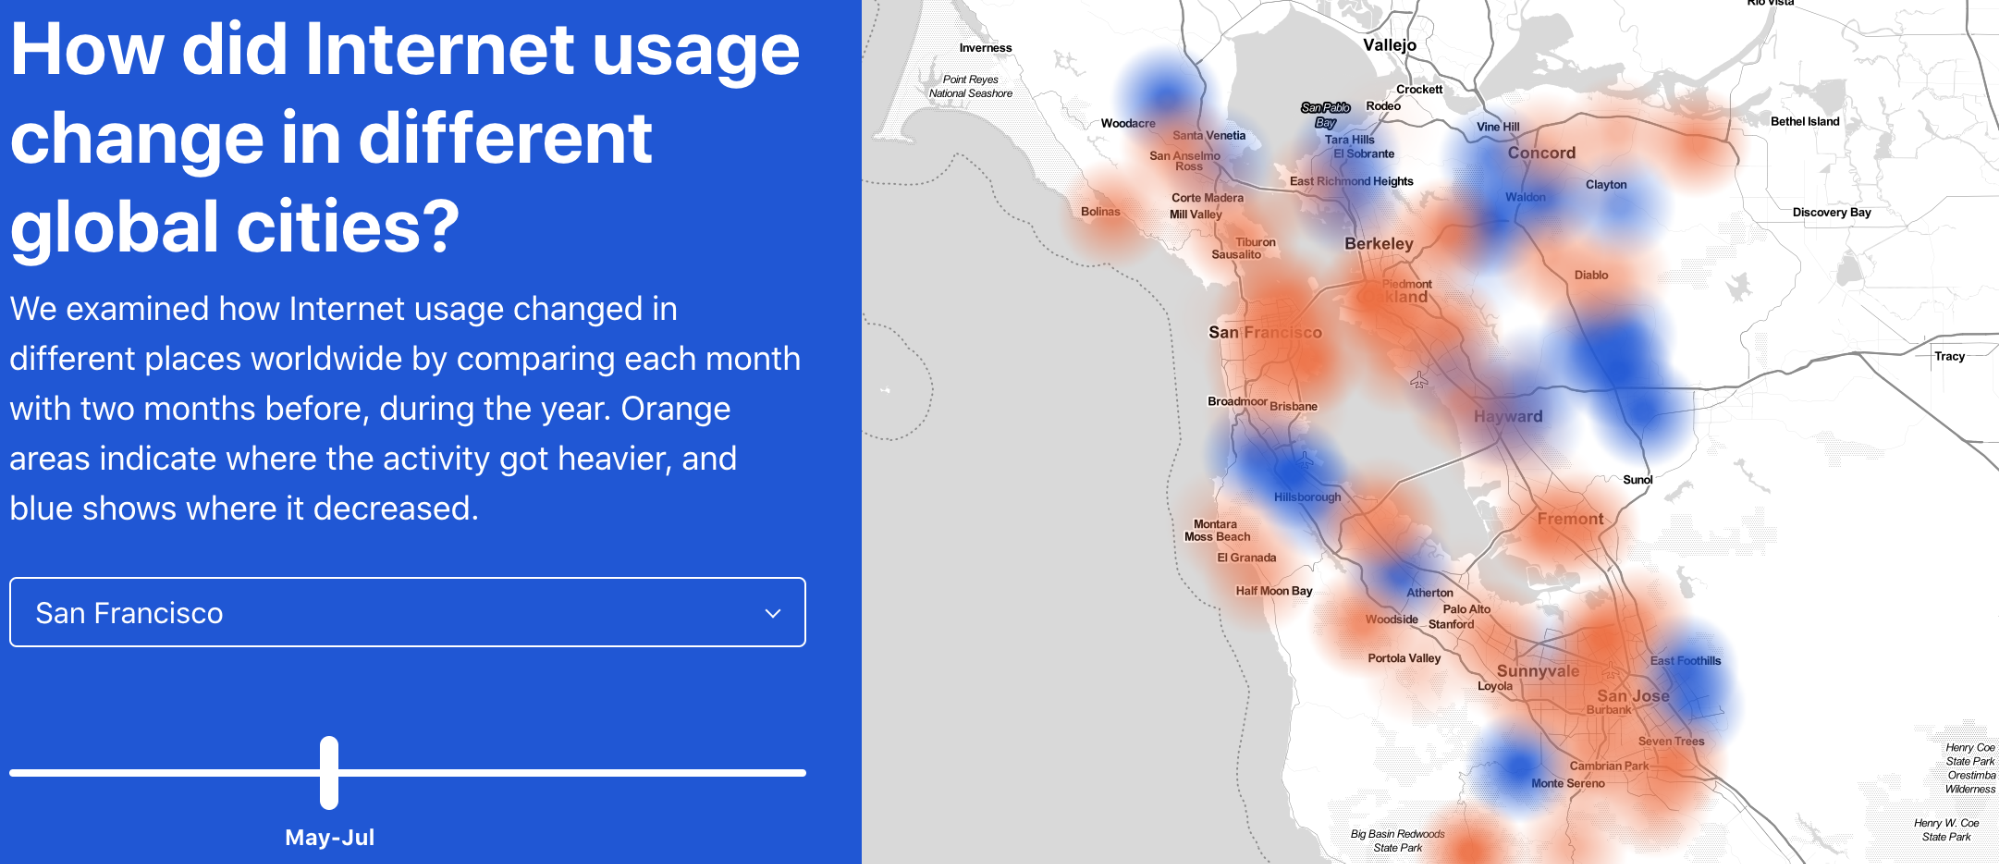
But that trend reverses in July, with an increase in Internet use in many places that saw a rapid decrease in April.

Cloudflare Radar's 2020 Year In Review

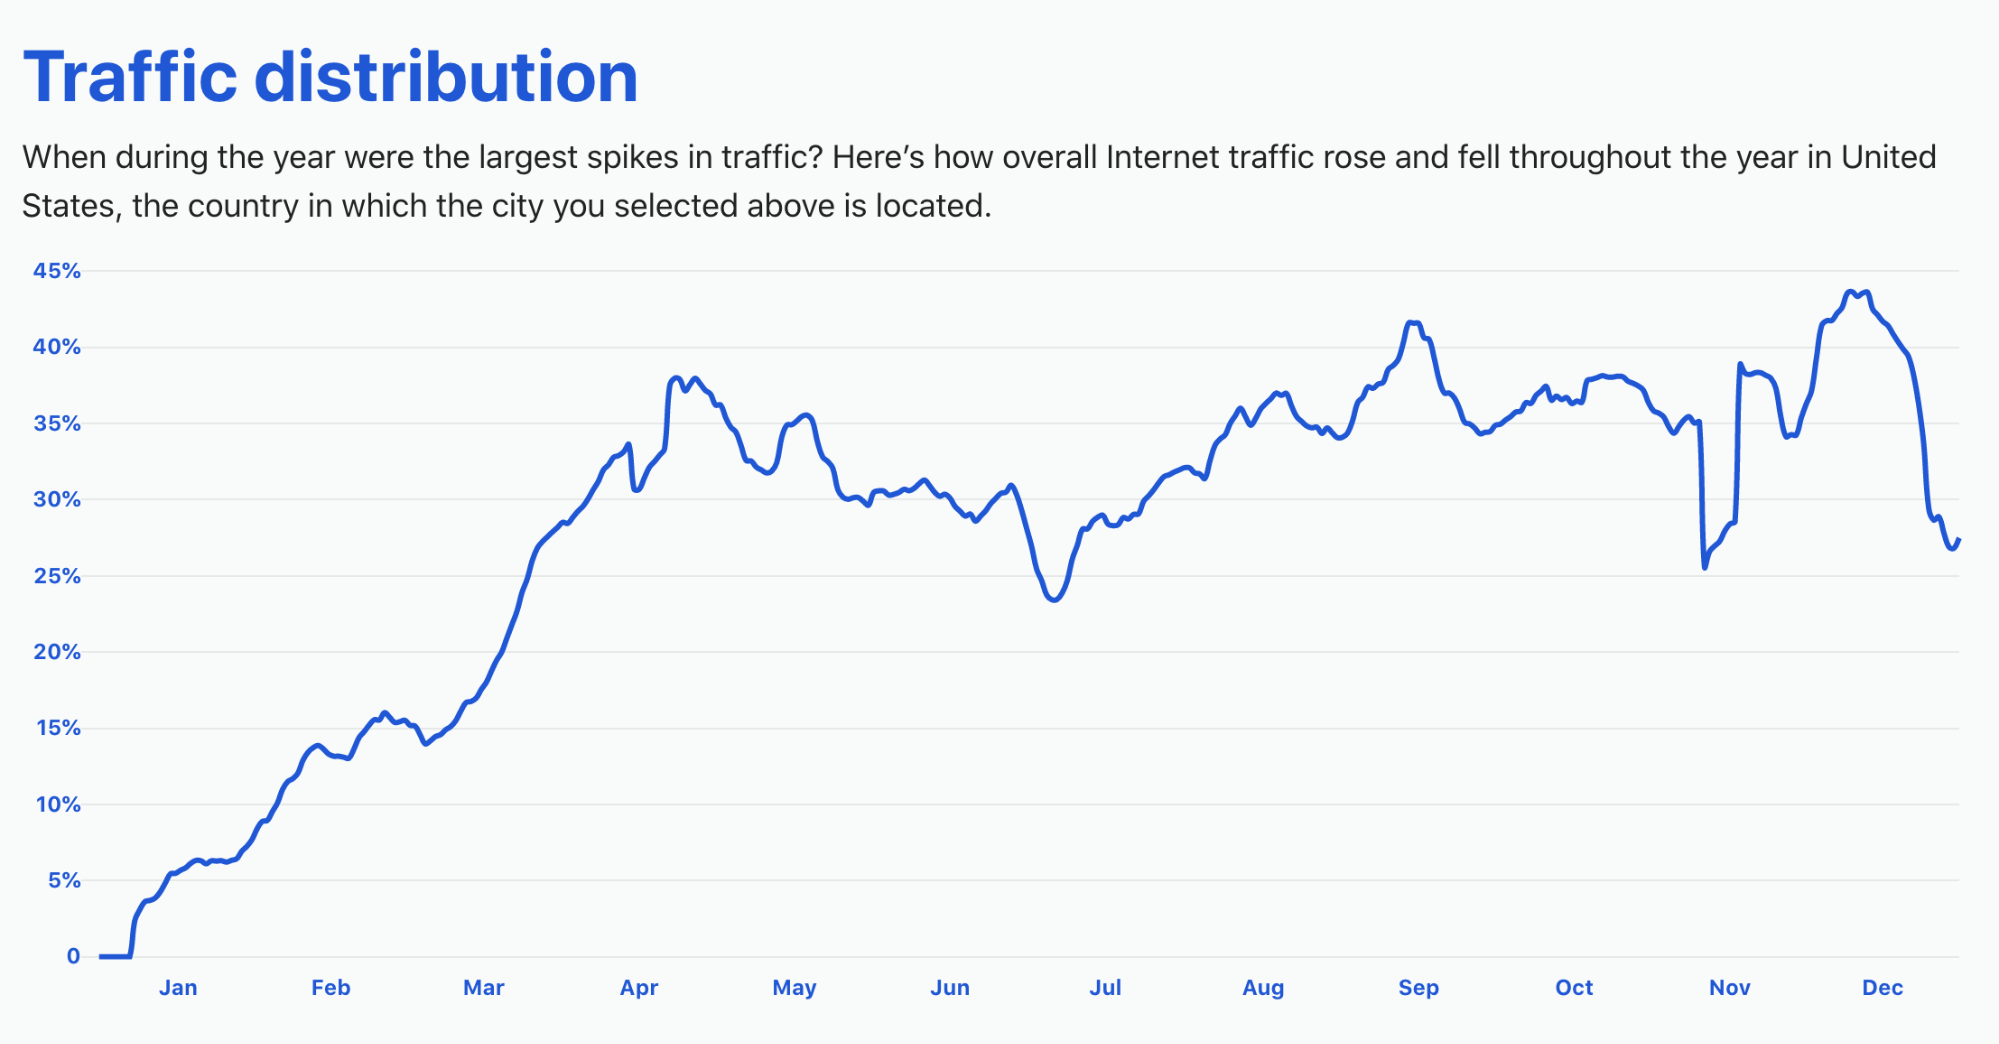
When you select a city from the map, a second chart shows the overall trend in Internet use for the country in which that city is located. For example, here’s the chart for the United States. The Y-axis shows the percentage change in Internet traffic compared to the start of the year.

Cloudflare Radar's 2020 Year In Review

Internet use really took off in March (when the lockdowns began) and rapidly increased to 40% higher than the start of the year. And usage has pretty much stayed there for all of 2020: that’s the new normal.

Here’s what happened in France (when selecting Paris) on the map view.

Cloudflare Radar's 2020 Year In Review

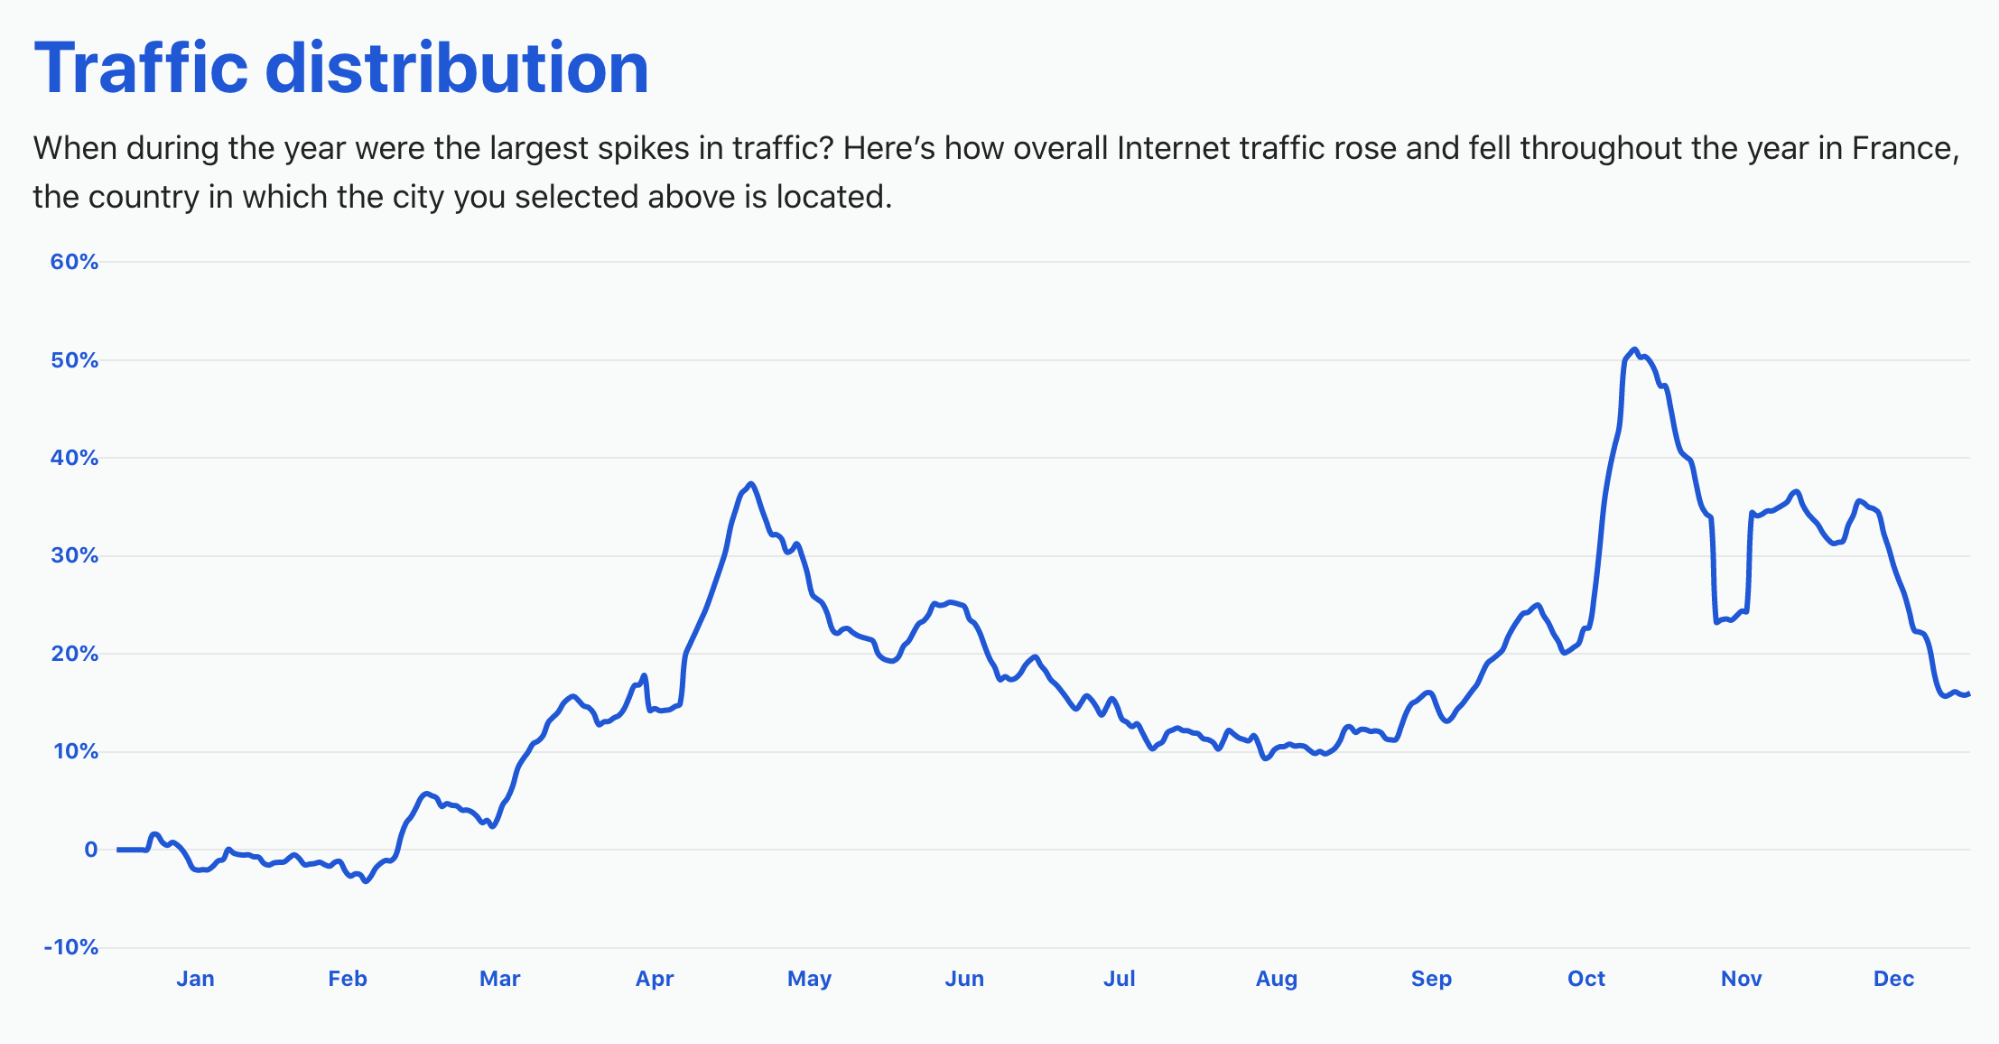
Internet use was flat until the lockdowns began. At that point, it took off and grew close to 40% over the beginning of the year. But there’s a visible slow down during the summer months, with Internet use up “only” 20% over the start of the year. Usage picked up again at “la rentrée” in September, with a new normal of about 30% growth in 2020.

What people did on the Internet

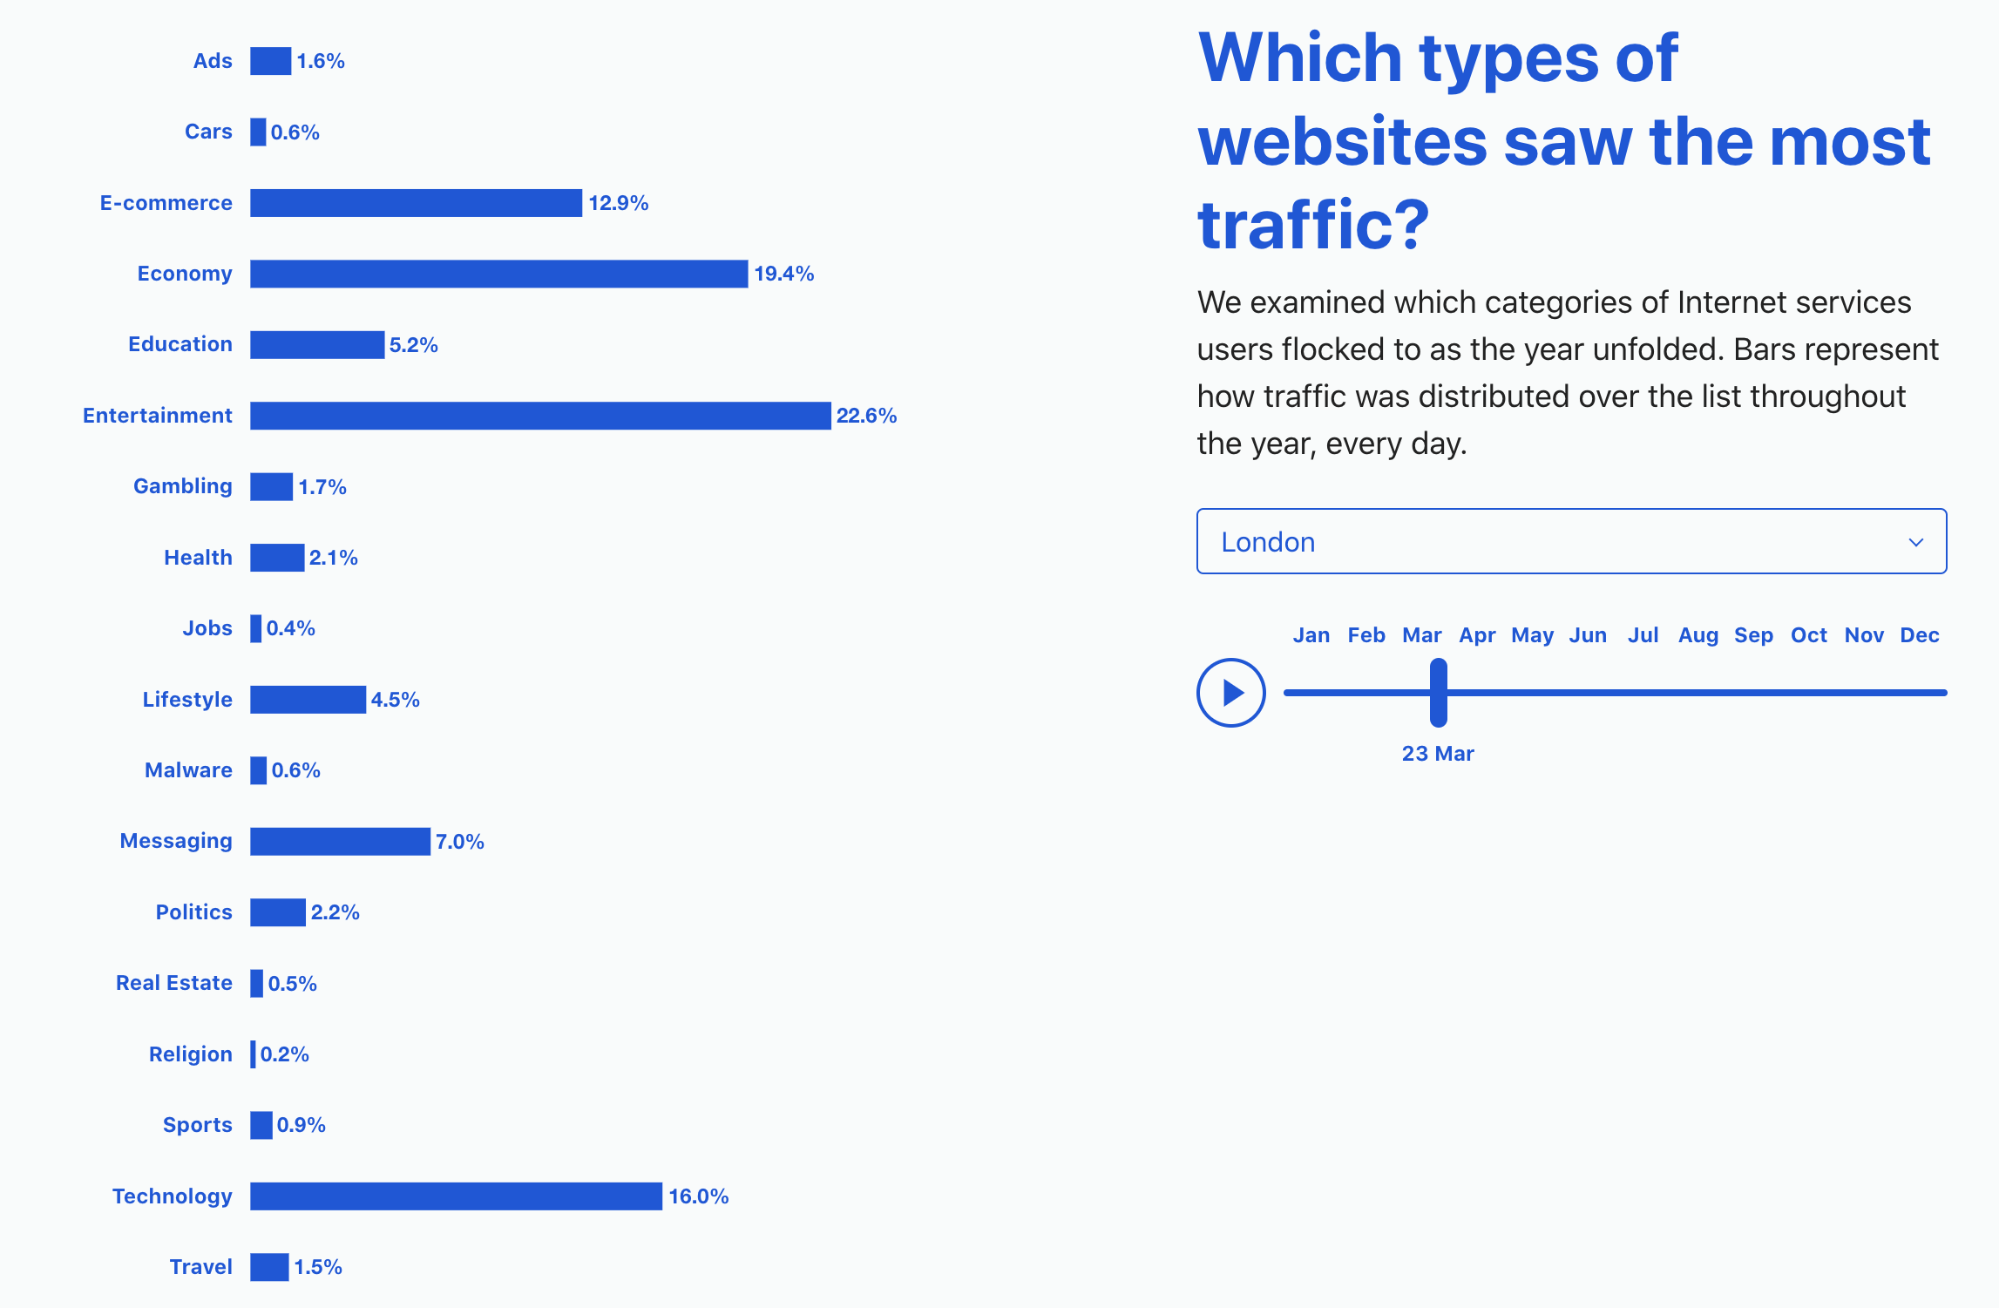
Returning to London, we can zoom into what people did on the Internet as the lockdowns began. The UK government announced a lockdown on March 23. On that day, the mixture of Internet use looked like this:

Cloudflare Radar's 2020 Year In Review

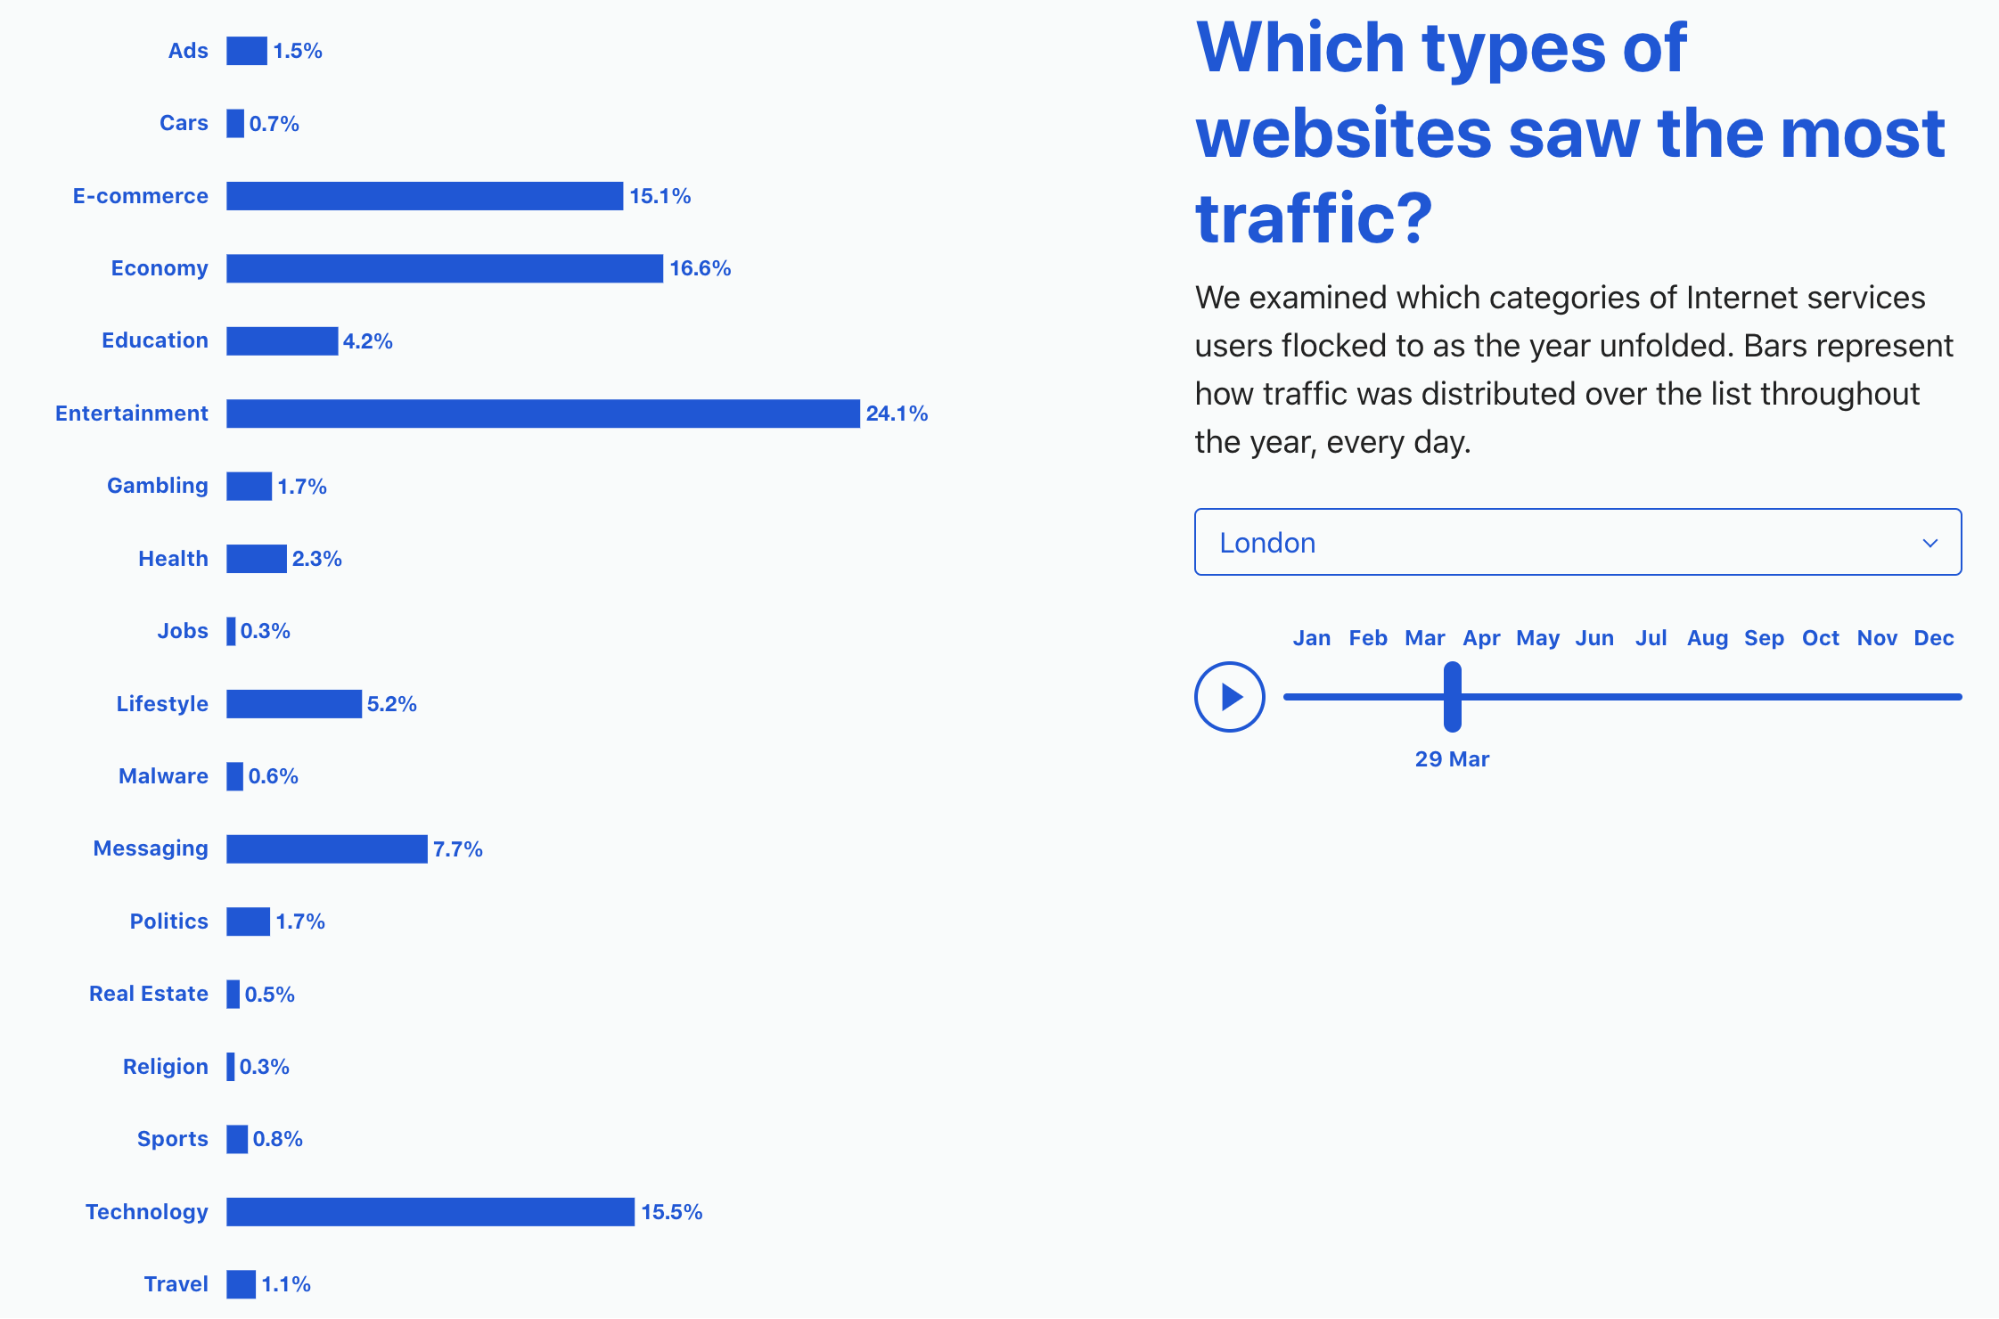
A few days later, the E-commerce category had jumped from 12.9% to 15.1% as people shopped online for groceries, clothing, webcams, school supplies, and more. Travel dropped from 1.5% of traffic to 1.1% (a decline of 30%).

Cloudflare Radar's 2020 Year In Review

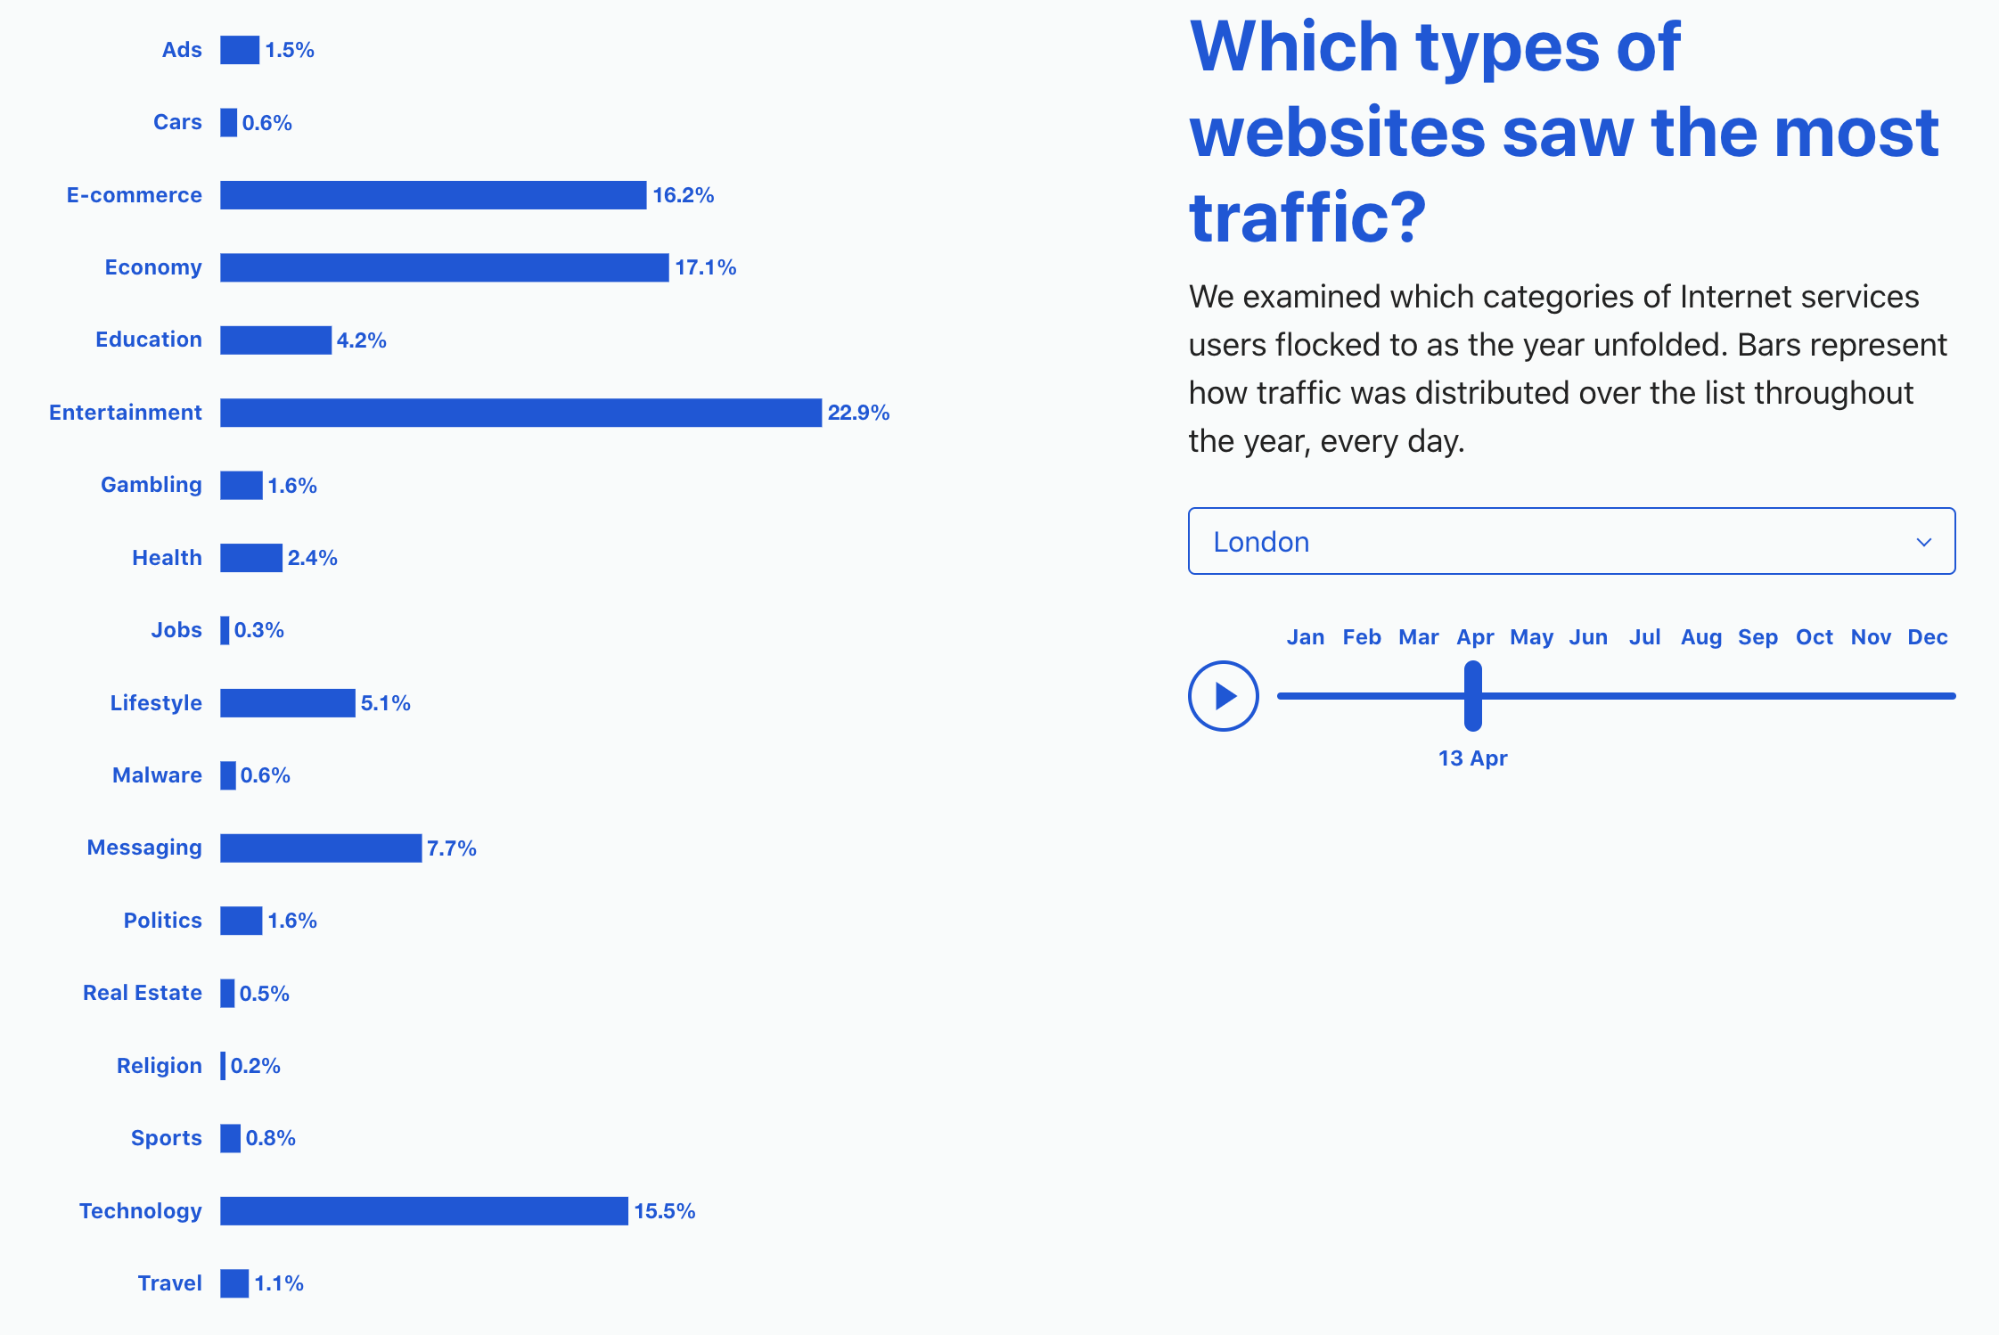
And then by early mid-April E-commerce had increased to 16.2% of traffic with Travel remaining low.

Cloudflare Radar's 2020 Year In Review

But not all the trends are pandemic-related. One question is: to what extent is Black Friday (November 27, 2020) an event outside the US? We can answer that by moving the London slider to late November and look at the change in E-commerce. Watch carefully as E-commerce traffic grows towards Black Friday and actually peaks at 21.8% of traffic on Saturday, November 28.

As Christmas approached, E-commerce dropped off, but another category became very important: Entertainment. Notice how it peaked on Christmas Eve, as Britons, no doubt, turned to entertainment online during a locked-down Christmas.


And Hacking 2020

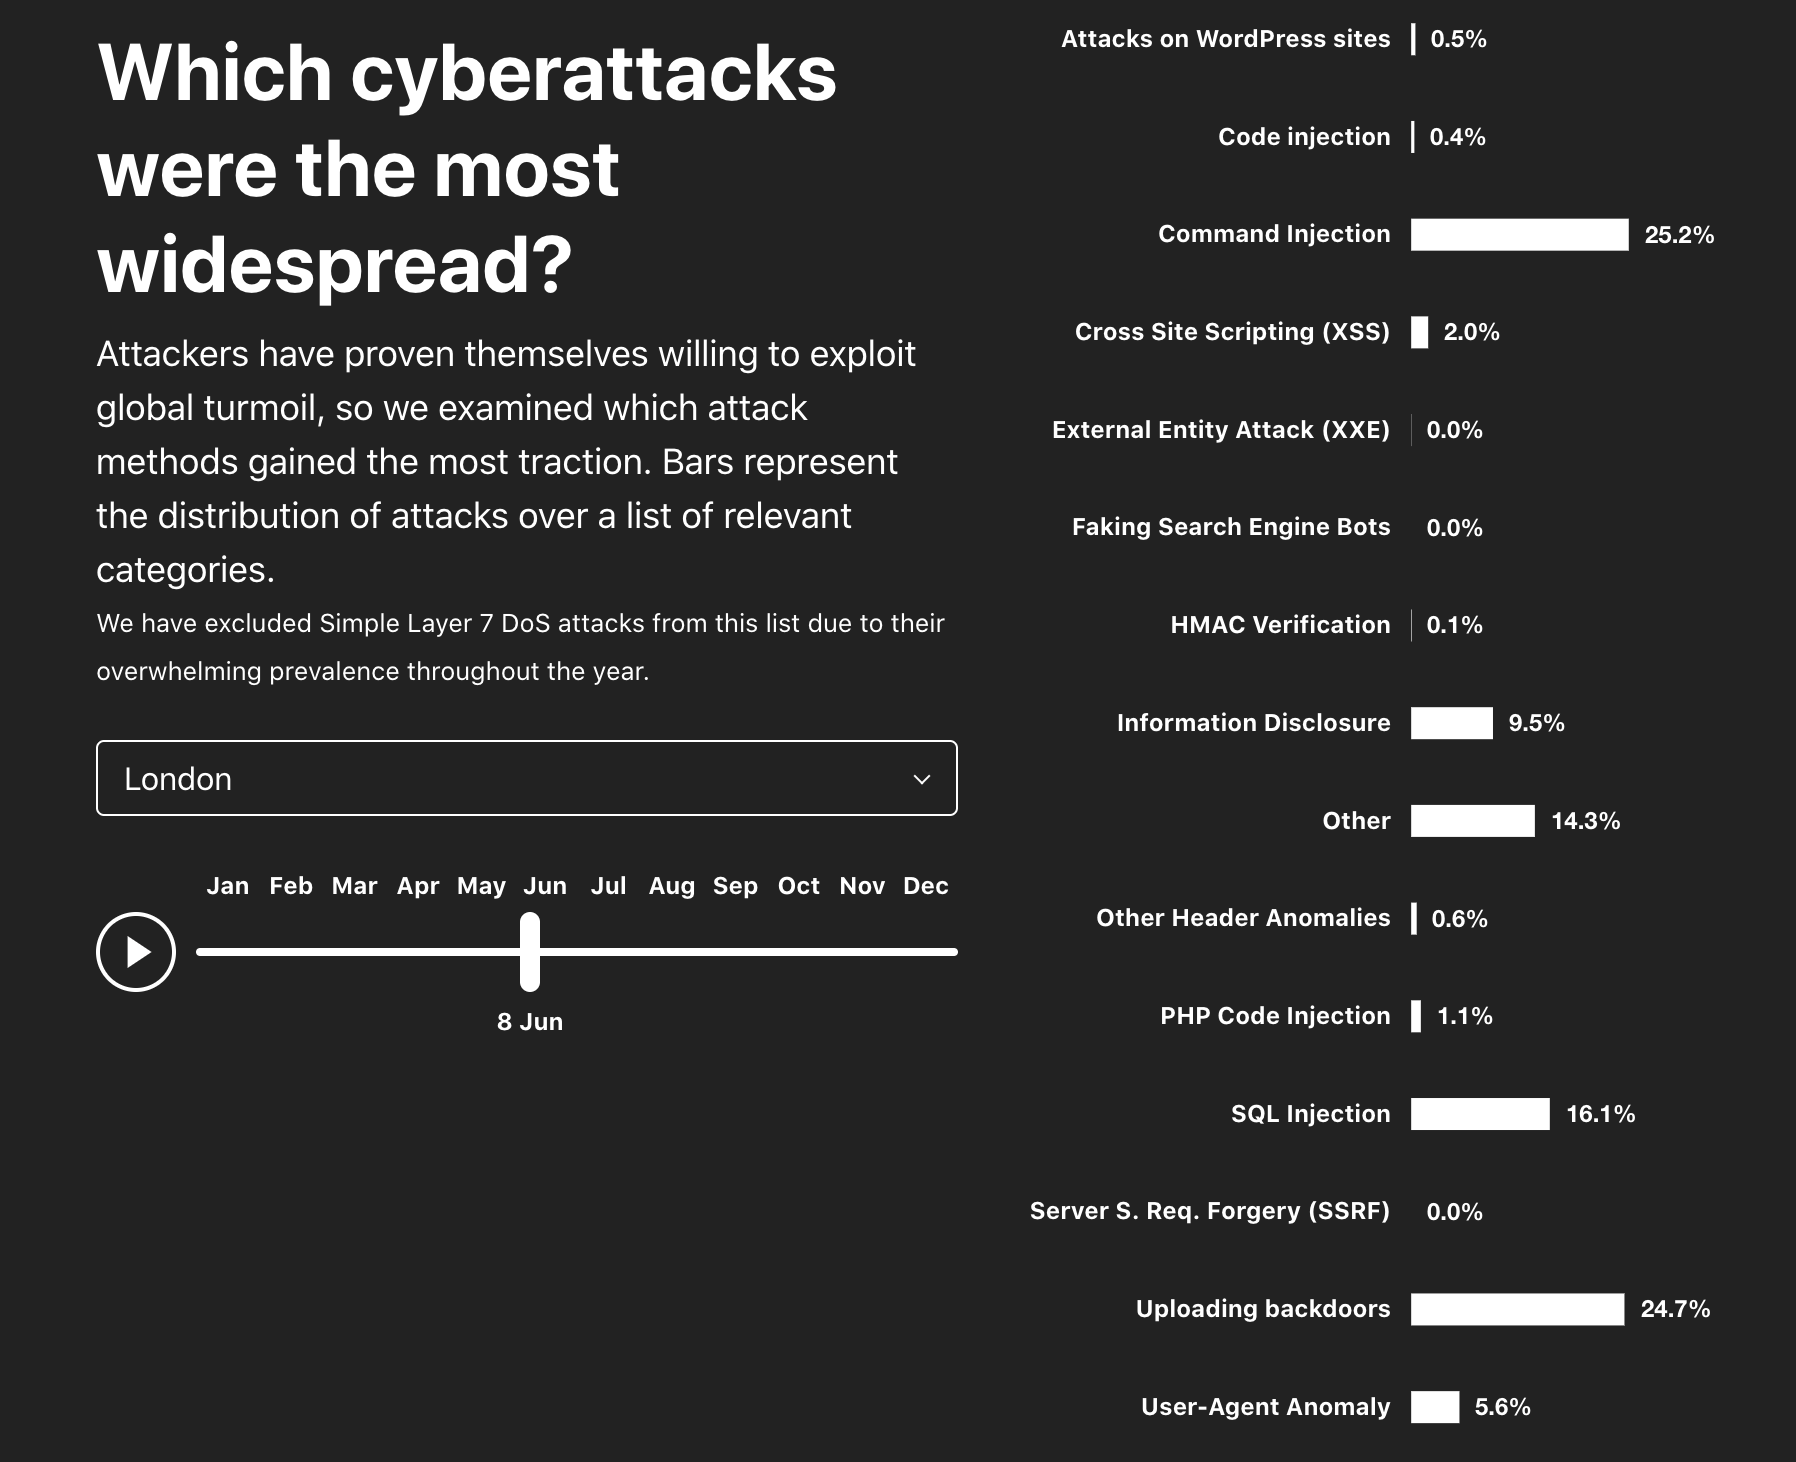
Of course, a pandemic didn’t mean that hacking activity decreased. Throughout 2020 and across the world, hackers continued to run their tools to attack websites, overwhelm APIs, and try to exfiltrate data.

Cloudflare Radar's 2020 Year In Review

Explore More

To explore data for 2020, you can check out Cloudflare Radar’s Year In Review page. To go deep into any specific country with up-to-date data about current trends, start at Cloudflare Radar’s homepage.

Internet traffic disruption caused by the Christmas Day bombing in Nashville

Post Syndicated from John Graham-Cumming original https://blog.cloudflare.com/internet-traffic-disruption-caused-by-the-christmas-day-bombing-in-nashville/

Internet traffic disruption caused by the Christmas Day bombing in Nashville

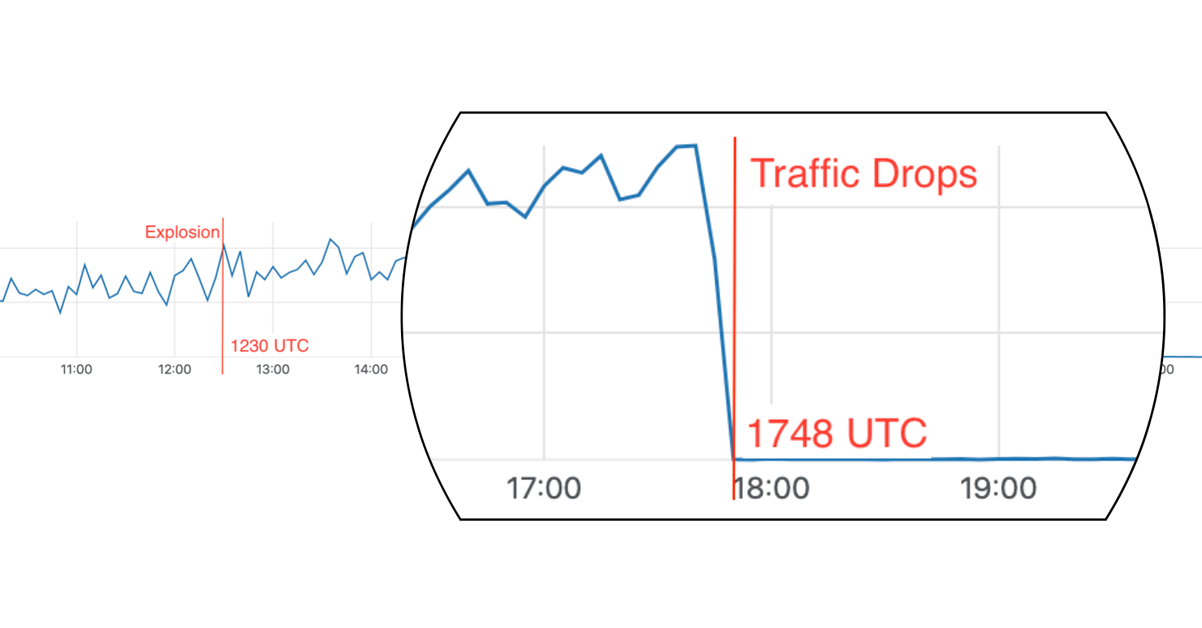
On Christmas Day 2020, an apparent suicide bomb exploded in Nashville, TN. The explosion happened outside an AT&T network building on Second Avenue in Nashville at 1230 UTC. Damage to the AT&T building and its power supply and generators quickly caused an outage for telephone and Internet service for local people. These outages continued for two days.

Looking at traffic flow data for AT&T in the Nashville area to Cloudflare we can see that services continued operating (on battery power according to reports) for over five hours after the explosion, but at 1748 UTC we saw a dramatic drop in traffic. 1748 UTC is close to noon in Nashville when reports indicate that people lost phone and Internet service.

Internet traffic disruption caused by the Christmas Day bombing in Nashville

We saw traffic from Nashville via AT&T start to recover over a 45 minute period on December 27 at 1822 UTC making the total outage 2 days and 34 minutes.

Internet traffic disruption caused by the Christmas Day bombing in Nashville

Traffic flows continue to be normal and no further disruption has been seen.

Privacy needs to be built into the Internet

Post Syndicated from John Graham-Cumming original https://blog.cloudflare.com/internet-privacy/

Privacy needs to be built into the Internet

Privacy needs to be built into the Internet

The first phase of the Internet lasted until the early 1990s. During that time it was created and debugged, and grew globally. Its growth was not hampered by concerns about data security or privacy. Until the 1990s the race was for connectivity.

Connectivity meant that people could get online and use the Internet wherever they were. Because the “inter” in Internet implied interoperability the network was able to grow rapidly using a variety of technologies. Think dialup modems using ordinary phones lines, cable modems sending the Internet over coax originally designed for television, Ethernet, and, later, fibre optic connections and WiFi.

By the 1990s, the Internet was being used widely and for uses far beyond its academic origins. Early web pioneers, like Netscape, realized that the potential for e-commerce was gigantic but would be held back if people couldn’t have confidence in the security of online transactions.

Thus, with the introduction of SSL in 1994, the Internet moved to a second phase where security became paramount. Securing the web, and the Internet more generally, helped create the dotcom rush and the secure, online world we live in today. But this security was misunderstood by some as providing guarantees about privacy which it did not.

People feel safe going online to shop, read the news, look up ailments and search for a life partner because cryptography prevents an eavesdropper from seeing what they are doing, and provides a guarantee that a website is who it claims to be. But it does not provide any privacy guarantee. The website you are visiting knows, at the very least, the IP address of your Internet connection.

And even with encryption a well placed eavesdropper can learn at least the names of websites you are visiting because of that information leaks from protocols that weren’t designed to preserve privacy.

People who aim to remain anonymous on the Internet therefore turn to technologies like Tor or VPNs. But remaining anonymous from a website you shop from or an airline’s online booking site doesn’t make any sense. In those instances, the company you are dealing with will know who you are because you tell them your home address, name, passport number etc. You want them to know.

That makes privacy a nuanced thing: you want to remain anonymous to an eavesdropper but make sure a retailer knows where you live.

The connectivity phase of the Internet made it possible for you to connect to a computer anywhere in the world just as easily as one in your own city. The security phase of the Internet solved the problem of giving you confidence to hand over information to an airline or a retailer. Combining these two phases resulted in an Internet you can trust to transmit your data, but little control over where that data ultimately ended up.

Phase 3

A French citizen could just as easily buy goods from a Spanish website as from a North American one. In both cases, the retailer would know the French name and address where the purchases were to be delivered. This creates a conundrum for a privacy-conscious citizen. The Internet created an amazing global platform for commerce, news and information (how easy it is for the French citizen to stay in contact with family in Cote d’Ivoire and even read the local news there from afar).

And while shopping an eavesdropper (such as an ISP, a coffee shop owner or an intelligence agency) could tell which website the French citizen was visiting.

And the Internet also meant that your and my information is dispersed across the world. And different countries have different rules about how that data is to be stored and shared. And countries and regions have data sharing agreements to allow cross-border transfer of private information about citizens.

Concerns about eavesdropping and where data ends up have created the world we are living in today where privacy concerns are coming to the forefront, especially in Europe but in many other countries as well.

In addition, the economics and flexibility of SaaS and cloud applications meant that it made sense to actually transfer data to a limited number of large data centers (which are sometimes confusingly called regions) where data from people all over the world can be processed. And, by and large, that was the world of the Internet, universal connectivity, widespread security, and data sharing through cross-border agreements.

This apparent utopia got snowed on by the leaking of secret documents describing the relationship between the US NSA (and its Five Eyes partners) and large Internet companies, and that intelligence agencies were scooping up data from choke points on the Internet. Those revelations brought to the public’s attention the fact that their data could, in some cases, be accessed by foreign intelligence agencies

Quite quickly those large data centers in far flung countries looked like a bad idea, and governments and citizens started to demand control of data. This is the third phase of the Internet. Privacy joins universal connectivity and security as core.

But what is control over data or privacy? Different governments have different ideas and different requirements, which can differ for different data sets. Some countries are convinced that the only way to control data is to keep it inside their countries, where they believe they can control who gets access to it. Other countries believe that they can address the risks by putting restrictions to prevent certain governments or companies from getting access to data. And the regulatory challenges are only getting more complicated.

This will be an enormous challenge for companies that have built a business on aggregating citizens’ information in order to target advertising, but it is also a challenge for anyone offering an Internet service. Just as companies have had to face the scourge of DDoS attacks and hacking, and have had to stay up to date with the latest in encryption technology, they will fundamentally have to store and process their customers’ data in different countries in different ways.

The European Union, in particular, has pushed a comprehensive approach to data privacy. Although the EU has had data protection principles in place since 1995, the implementation of the EU’s General Data Protection Regulation (GDPR) in 2018 has generated a new era of privacy online. GDPR imposes limitations on how the personal data of EU residents can be collected, stored, deleted, modified and otherwise processed.

Among the GDPR’s requirements are provisions on how EU personal data should be protected if that personal data leaves the EU. Although the US and the EU worked together to develop a set of voluntary commitments to make it easier for companies to transfer data between the two countries, that framework — the Privacy Shield — was invalidated this past summer. As a result, companies are grappling with how they can transfer data outside the EU, consistent with GDPR requirements. Recommendations recently issued by the European Data Protection Board (EDPB), which require data exporters to assess the law in third countries, determine whether that law adequately protects privacy, and if necessary, obtain guarantees of additional safeguards from data importers, have only added to companies’ concerns.

This anxiety over whether there are controls over data adequate to address the concerns of European regulators has prompted many of our customers to explore whether it is possible to prevent data subject to the GDPR from leaving the EU at all.

Gone are the days when all the world’s data could be processed in a massive data center regardless of its provenance.

One reaction to this change could be a retreat into every country building its own online email services, HR systems, e-commerce providers, and more. This would be a massive wasted effort. There are economies of scale if the same service can be used by Germans, Peruvians, Indonesians, Australians…

The answer to this privacy challenge is the same as the answer to the connectivity and security phases of the Internet: build it! We need to build a privacy-respecting Internet and give companies the tools to easily build privacy-respecting applications.

This week we’ll be talking about new tools from Cloudflare that make building privacy-respecting applications easy by allowing companies to situate their users’ data in the countries and regions of their choosing. And we’ll be talking about new protocols that build privacy into the very structure of the Internet. We’ll update on the latest quantum-resistant algorithms that help keep private data private today and into the far future.

We’ll show how it’s possible to run a massive DNS resolver service like 1.1.1.1 and preserve users’ privacy through a clever new protocol. We’ll look at how to make passwords that can’t be leaked. And we’ll give everyone the power to get web analytics without tracking people.

Welcome to Phase 3 of the Internet: always on, always secure, always private.

Introducing the Cloudflare Data Localization Suite

Post Syndicated from John Graham-Cumming original https://blog.cloudflare.com/introducing-the-cloudflare-data-localization-suite/

Introducing the Cloudflare Data Localization Suite

Introducing the Cloudflare Data Localization Suite

Today we’re excited to announce the Cloudflare Data Localization Suite, which helps businesses get the performance and security benefits of Cloudflare’s global network, while making it easy to set rules and controls at the edge about where their data is stored and protected.

The Data Localization Suite is available now as an add-on for Enterprise customers.

Cloudflare’s network is private and compliant by design. Preserving end-user privacy is core to our mission of helping to build a better Internet; we’ve never sold personal data about customers or end users of our network. We comply with laws like GDPR and maintain certifications such as ISO-27001.

Today, we’re announcing tools that make it simple for our customers to build the same rigor into their own applications. In this post, I’ll explain the different types of data that we process and how the Data Localization Suite keeps this data local.

We’ll also talk about how Cloudflare makes it possible to build applications that comply with data locality laws, while remaining fast, secure and scalable.

Why keep data local?

Cloudflare’s customers have increasing desire or face legal requirements for data locality: they want to control the geographic location where their data is handled. Many categories of data that our customers process (including healthcare, legal, or financial data) may be subject to obligations that specify the data be stored or processed in a specific location. The preference or requirement for data localization is growing across jurisdictions such as the EU, India, and Brazil; over time, we expect more customers in more places will be expected to keep data local.

Although “data locality” sounds like a simple concept, our conversations with Cloudflare customers make clear that there are a number of unique challenges they face in the attempt to move toward this goal.  The availability of information on their Internet properties will remain global–they don’t want to limit access to their websites to local jurisdictions–but they want to make sure data stays local. Variously, they are trying to figure out:

  • How do I build local requirements into my global online operations?
  • How do I make sure unencrypted traffic is only available locally?
  • How do I make sure personal data is handled according to localization obligations?
  • How do I make sure my applications only store data in certain locations?

The Cloudflare Data Localization Suite attempts to respond to these questions.

Until now, customers who wanted to localize their data had to choose to restrict their application to one data center, or to one cloud provider’s region. This is a fragile approach, fraught with performance, reliability, and security challenges. Cloudflare is creating a new paradigm: customers should be able to get the performance and security benefits of our global network, while effortlessly keeping their data local.

Encryption is the backbone of privacy

Before we go into data locality, we should discuss encryption. Privacy isn’t possible without strong encryption; otherwise, anyone could snoop your customers’ data, regardless of where it’s stored.

Data is often described as being “in transit” and “at rest”. It’s critically important that both are encrypted. Data “in transit” refers to just that—data while it’s moving about on the wire, whether a local network or the public Internet. “At rest” generally means stored on a disk somewhere, whether a spinning HDD or a modern SSD.

In transit, Cloudflare can enforce that all traffic to end-users uses modern TLS and gets the highest level of encryption possible. We can also enforce that all traffic back to customers’ origin servers is always encrypted. Communication between all our edge and core data centers is always encrypted.

Cloudflare encrypts all of the data we handle at rest, usually with disk-level encryption. From cached files on our edge network, to configuration state in databases in our core data centers—every byte is encrypted at rest.

Control where TLS private keys can be accessed

Given the importance of encryption, one of the most sensitive pieces of data that our customers trust us to protect are their cryptographic keys, which enable data to be decrypted. Cloudflare offers two ways for customers to ensure that their private keys are only accessible in locations they specify.

Keyless SSL allows a customer to store and manage their own SSL private keys for use with Cloudflare on any external infrastructure of their choosing. Customers can use a variety of systems for their keystore, including hardware security modules (“HSMs”), virtual servers, and hardware running Unix/Linux and Windows that is housed in environments customers control. Cloudflare never has access to the private key with Keyless SSL.

Geo Key Manager gives customers granular control over which locations should store their keys. For example, a customer can choose for the private keys required for inspection of traffic to only be accessible inside data centers located in the European Union.

Manage where HTTPS requests and responses are inspected

In order to deploy our WAF, or detect malicious bot traffic, Cloudflare must terminate TLS in our edge data centers and inspect HTTPS request and response payloads.

Regional Services gives organizations control over where their traffic is inspected. With Regional Services enabled, traffic is ingested on Cloudflare’s global Anycast network at the location closest to the client, where we can provide L3 and L4 DDoS protection. Instead of being inspected at the HTTP level at that data center, this traffic is securely transmitted to Cloudflare data centers inside the region selected by the customer and handled there.

Introducing the Cloudflare Data Localization Suite

Control the logs and analytics generated by your traffic

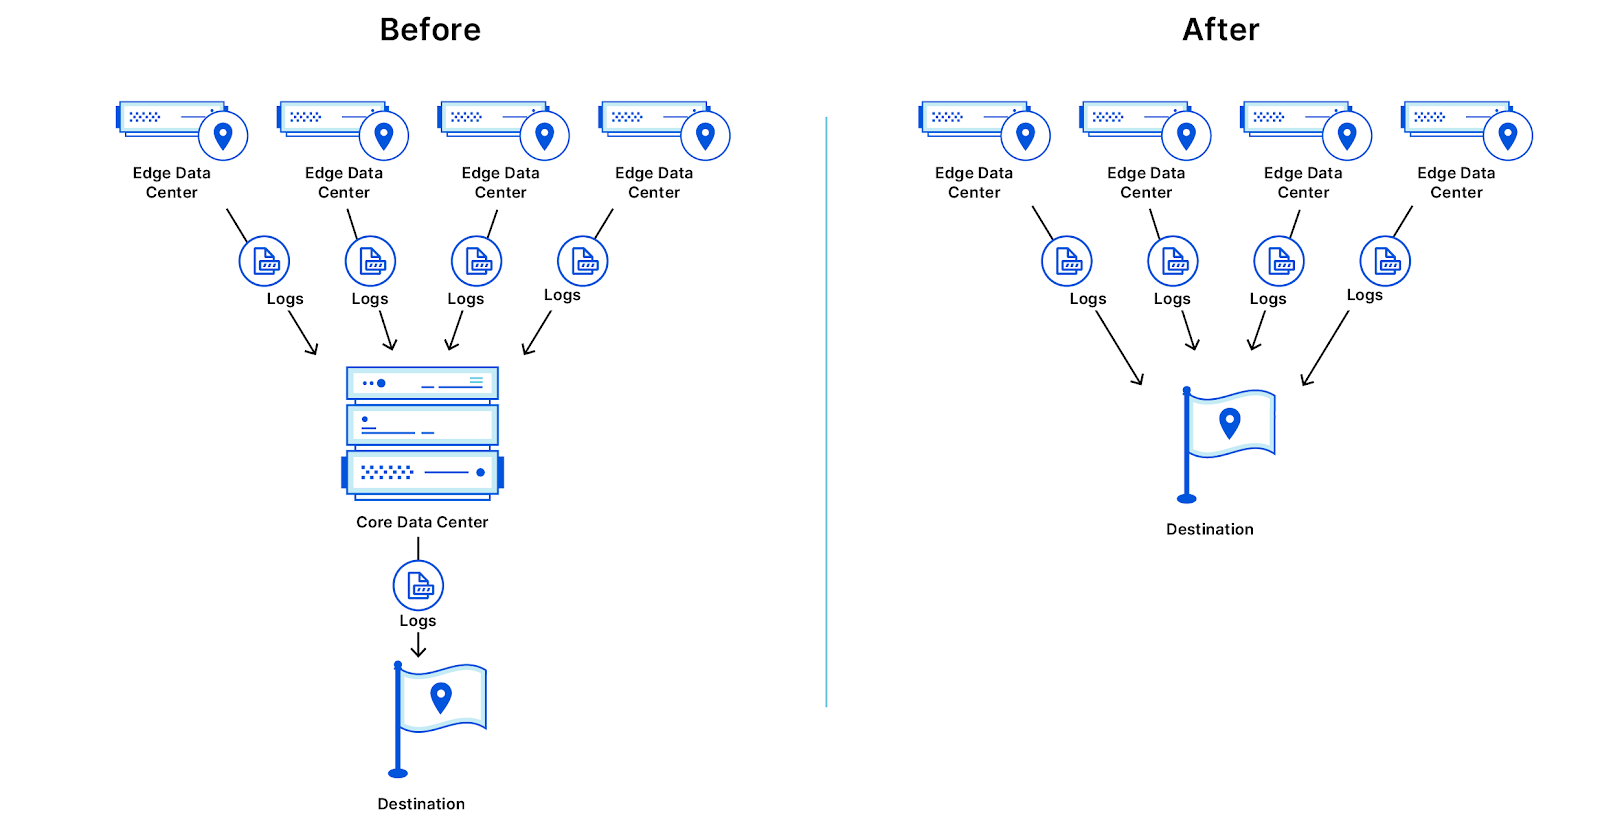
In addition to making our customers’ infrastructure and teams faster, more secure, and more reliable, we also provide insights into what our services do, and how customers can make better use of them. We gather metadata about the traffic that goes through our edge data centers, and use this to improve the operation of our own network: for example, by crafting WAF rules to block the latest attacks, or by developing machine learning models to detect malicious bots. We also make this data available to our customers in the form of logs and analytics.

This only requires a subset of the metadata to be processed in our core data centers in the US/EU. This data contains information about how many requests were served, how much data was sent, how long requests took, and other information that is essential for the operation of our network.

With Edge Log Delivery, customers can send logs directly from the edge to their partner of choice—for example, an Azure storage bucket in their preferred region, or an instance of Splunk that runs in an on-premise data center. With this option, customers can still get their complete logs in their preferred region, without these logs first flowing through either of our US or EU core data centers.

Introducing the Cloudflare Data Localization Suite

Edge Log Delivery is in early beta for Enterprise customers today—please visit our product page for more information.

Ultimately, we are working towards providing customers full control over where their metadata is stored, and for how long. In the coming year, we plan to allow customers to be able to choose exactly which fields are stored, and for how long, and in which location.

Building location-aware applications from the ground up

So far, we’ve discussed how Cloudflare’s products can offer global performance and security solutions for our customers, while keeping their existing keys, application data, and metadata local.

But we know that customers are also struggling to use existing, traditional cloud systems to manage their data locality needs. Existing platforms may allow code or data to be deployed to a specific region, but having copies of applications in each region, and managing state across each of them, can be challenging at best (or impossible at worst).

The ultimate promise of serverless has been to allow any developer to say “I don’t care where my code runs, just make it scale.” Increasingly, another promise will need to be “I do care where my code runs, and I need more control to satisfy my compliance department.” Cloudflare Workers allows you the best of both worlds, with instant scaling, locations that span more than 100 countries around the world, and the granularity to choose exactly what you need.

Introducing the Cloudflare Data Localization Suite

We are announcing a major improvement that lets customers control where their applications store data: Workers Durable Objects will support Jurisdiction Restrictions.  Durable Objects provide globally consistent state and coordination to serverless applications running on the Cloudflare Workers platform. Jurisdiction Restrictions will make it possible for users to ensure that their Durable Objects do not store data or run outside of a given jurisdiction—making it trivially simple to build applications that combine global performance with local compliance. With automatic migration of Durable Objects, adapting to new rules will be as simple as adding a tag to a set of Durable Objects.

Building for the long haul

The data localization landscape is constantly evolving. Since we began working on the Data Localization Suite, the European Data Protection Board has released new guidance about how data may be transferred between the EU and the US. And we know this is just the beginning — over time, more regions and more industries will have data localization requirements.

At Cloudflare, we stay on top of the latest developments around data protection so our customers don’t have to. The Data Localization Suite gives our customers the tools to set rules and controls at the edge about where their data is stored and protected, while taking advantage of our global network.

Welcome to Birthday Week 2020

Post Syndicated from John Graham-Cumming original https://blog.cloudflare.com/welcome-to-birthday-week-2020/

Welcome to Birthday Week 2020

Each year we celebrate our launch on September 27, 2010 with a week of product announcements. We call this Birthday Week, but rather than receiving gifts, we give them away. This year is no different, except that it is… Cloudflare is 10 years old.

Before looking forward to the coming week, let’s take a look back at announcements from previous Birthday Weeks.

Welcome to Birthday Week 2020

A year into Cloudflare’s life (in 2011) we launched automatic support for IPv6. This was the first of a long line of announcements that support our goal of making available to everyone the latest technologies. If you’ve been following Cloudflare’s growth you’ll know those include SPDY/HTTP/2, TLS 1.3, QUIC/HTTP/3, DoH and DoT, WebP, … At two years old we celebrated with a timeline of our first two years and the fact that we’d reached 500,000 domains using the service. A year later that number had tripled.

Welcome to Birthday Week 2020

In 2014 we released Universal SSL and gave all our customers SSL certificates. In one go we massively increased the size of the encrypted web and made it free and simple to go from http:// to https://. Other HTTPS related features we’ve rolled out include: Automatic HTTPS Rewrites, Encrypted SNI and our CT Log.

Welcome to Birthday Week 2020

In 2017 we unwrapped a bunch of goodies with Unmetered DDoS Mitigation, our video streaming service, Cloudflare Stream, the ability to control where private SSL keys stored through Geo Key Manager. And, last but not least, our hugely popular serverless platform Cloudflare Workers. It’s hard to believe that it’s been three years since we changed the way people think about serverless with our massively distributed, secure and fast to update platform.

Welcome to Birthday Week 2020

Two years ago Cloudflare became a domain registrar with the launch of our “at cost” service: Cloudflare Registrar. We also announced the Bandwidth Alliance which is designed to reduce or eliminate high cloud egress fees. We rolled out support for QUIC and Cloudflare Workers got a globally distributed key value store: Workers KV.

Welcome to Birthday Week 2020

Which brings us to last year with the launch of WARP Plus to speed up and secure the “last mile” connection between a device and Cloudflare’s network. Browser Insights so that customers can optimize their website’s performance and see how each Cloudflare tool helps.

We greatly enhanced our bot management tools with Bot Defend Mode, and rolled out Workers Sites to bring the power of Workers and Workers KV to entire websites.

Welcome to Birthday Week 2020

No Spoilers Here

Here are some hints about what to expect this year for our 10th anniversary Birthday Week:

Welcome to Birthday Week 2020
  • Monday: We’re fundamentally changing how people think about Serverless

If you studied computer science you’ll probably have come across Niklaus Wirth’s book “Algorithms + Data Structures = Programs”. We’re going to start the week with two enhancements to Cloudflare Workers that are fundamentally going to change how people think about serverless. The lambda calculus is a nice theoretical foundation, but it’s Turing machines that won the day. If you want to build large, real programs you need to have algorithms and data structures.

Welcome to Birthday Week 2020
  • Tuesday and Wednesday are all about observability. Of an Internet property and of the Internet itself. And they are also about privacy. We’ll roll out new functionality so you can see what’s happening without the need to track people.
Welcome to Birthday Week 2020
  • Thursday is security day with a new service to protect the parts of websites and Internet applications that are behind the scenes. And, finally, on Friday it’s all about one click performance improvements that leverage our more than 200 city network to speed up static and dynamic content.

Welcome to Birthday Week 2020!