Post Syndicated from Muthu Pitchaimani original https://aws.amazon.com/blogs/big-data/reduce-mean-time-to-resolution-with-an-observability-agent/
Customers of all sizes have been successfully using Amazon OpenSearch Service to power their observability workflows and gain visibility into their applications and infrastructure. During incident investigation, Site Reliability Engineers (SREs) and operations center personnel rely on OpenSearch Service to query logs, examine visualizations, analyze patterns, correlate traces to find the root cause of the incident, and reduce Mean Time to Resolution (MTTR). When an incident happens that triggers alerts, SREs typically jump between multiple dashboards, write specific queries, check recent deployments, and correlate between logs and traces to piece together a timeline of events. Not only is this process largely manual, but it also creates a cognitive load on these personnel, even when all the data is readily available. This is where agentic AI can help, by being an intelligent assistant that can understand how to query, interpret various telemetry signals, and systematically investigate an incident.
In this post, we present an observability agent using OpenSearch Service and Amazon Bedrock AgentCore that can help surface root cause and get insights faster, handle multiple query-correlation cycles, and ultimately reduce MTTR even further.
Solution overview
The following diagram shows the overall architecture for the observability agent.
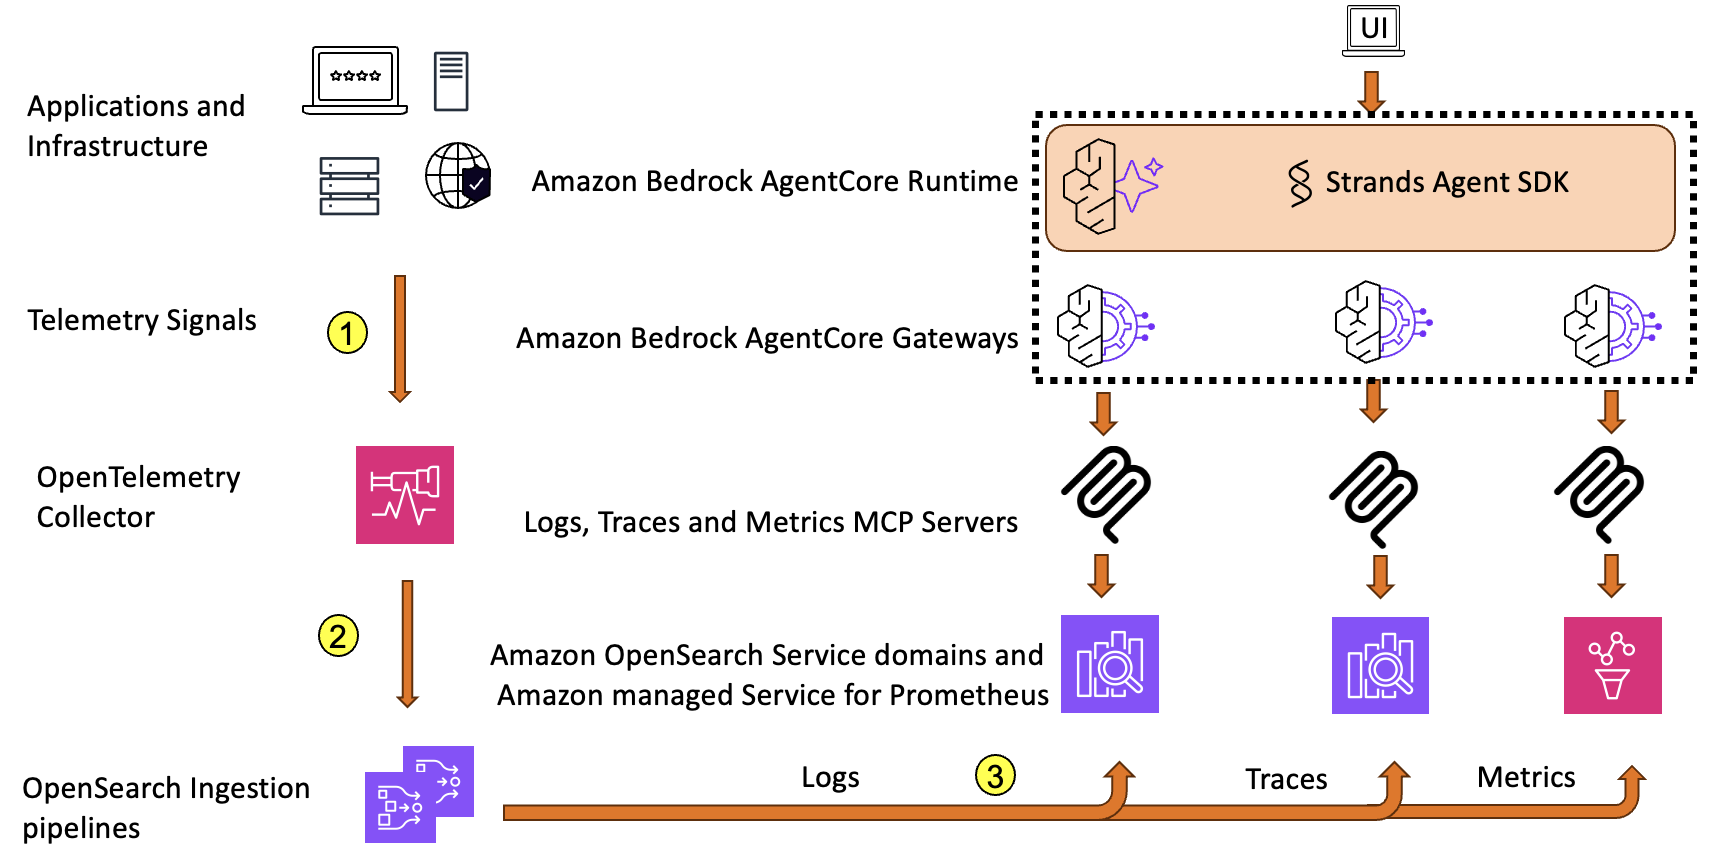
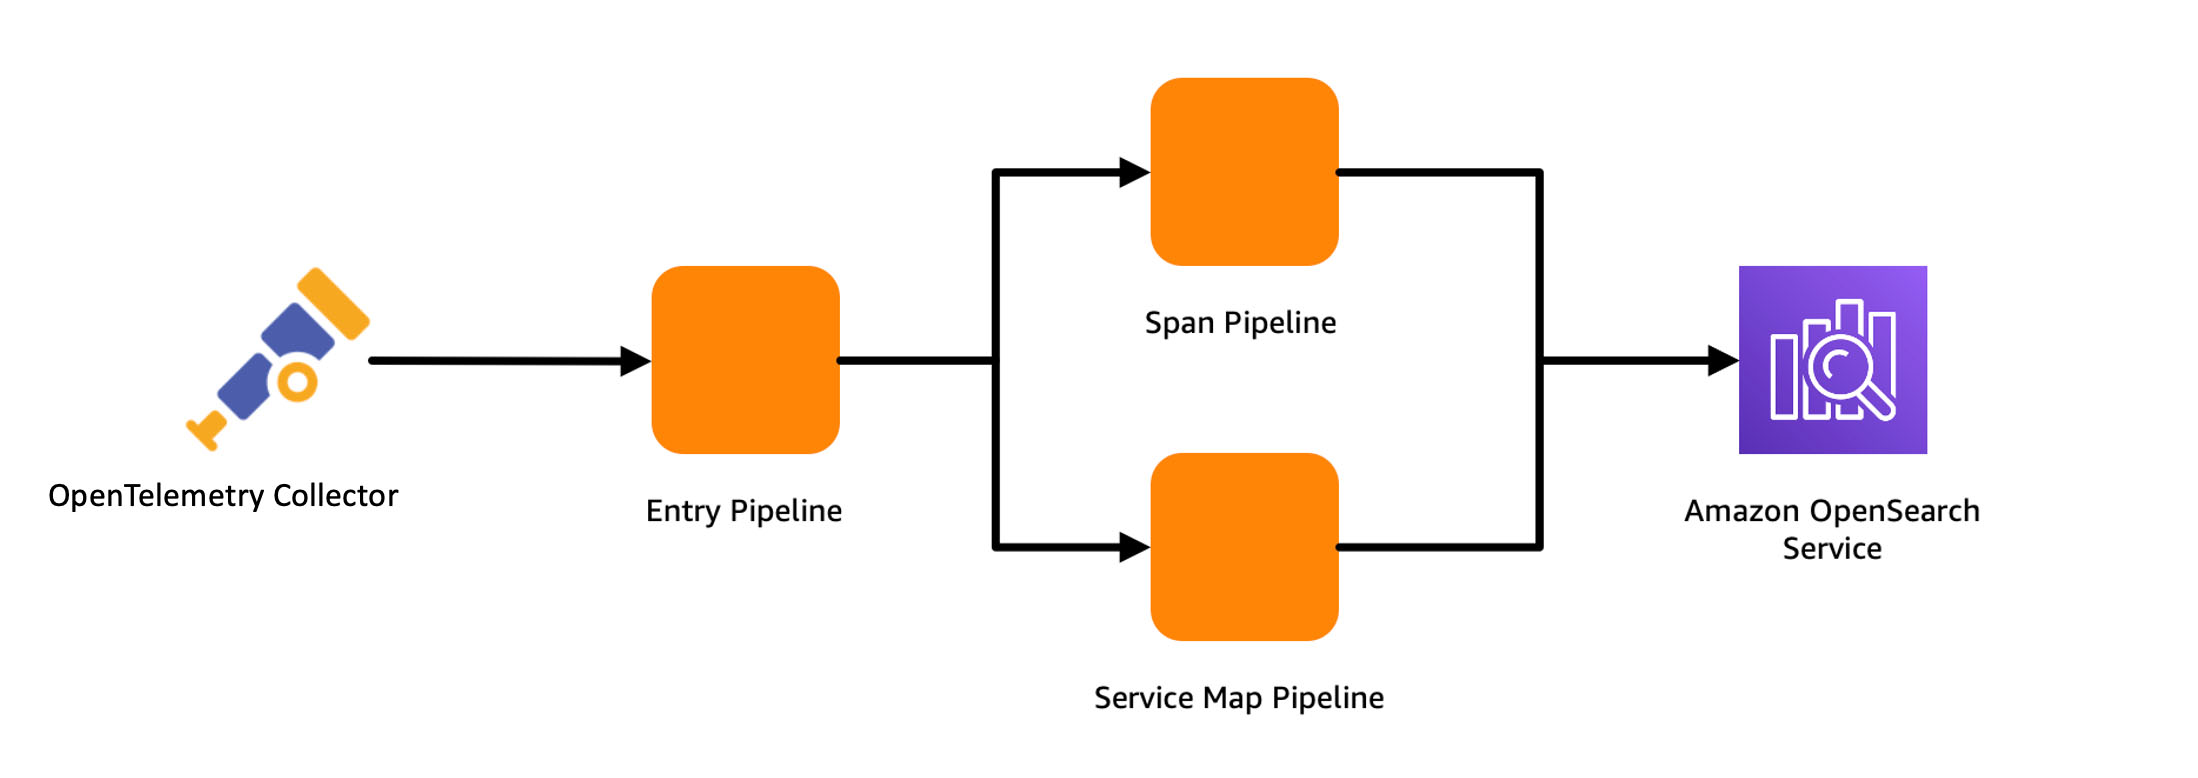
Applications and infrastructure emit telemetry signals in the form of logs, traces, and metrics. These signals are then gathered by OpenTelemetry Collector (Step 1) and exported to Amazon OpenSearch Ingestion using individual pipelines for every signal: logs, traces, and metrics (Step 2). These pipelines deliver the signal data to an OpenSearch Service domain and Amazon Managed Service for Prometheus (Step 3).
OpenTelemetry is the standard for instrumentation, and provides vendor-neutral data collection across a broad range of languages and frameworks. Enterprises of various sizes are adopting this architecture pattern using OpenTelemetry for their observability needs, especially those committed to open source tools. More notably, this architecture builds on open source foundations, helping enterprises avoid vendor lock-in, benefit from the open source community, and implement it across on-premises and various cloud environments.
For this post, we use the OpenTelemetry Demo application to demonstrate our observability use case. This is an ecommerce application powered by about 20 different microservices, and generates realistic telemetry data together with feature sets to generate load and simulate failures.
Model Context Protocol servers for observability signal data
The Model Context Protocol (MCP) provides a standardized mechanism to connect agents to external data sources and tools. In this solution, we built three distinct MCP servers, one for each type of signal.
The Logs MCP server exposes tool functions for searching, filtering, and selecting log data that is stored in an OpenSearch Service domain for log data. This enables the agent to query the logs using various criteria like simple keyword matching, service name filter, log level, or time ranges. This mimics the typical queries you would run during an investigation. The following snippet shows a pseudo code of what the tool function can look like:
The Traces MCP server exposes tool functions for searching and retrieving information about distributed traces. These functions can help look up traces by trace ID and find traces for a particular service, the spans belonging to a trace, the service map information constructed based on the spans, and the rate, error, and duration (also known as RED metrics). This enables the agent to follow a request’s path across the services and pinpoint where failures happened or latency originated.
The Metrics MCP server exposes tool functions for querying time series metrics. The agent can use these functions to check error rate percentiles and resource utilization, which are key signals for understanding the overall health of the system and identifying anomalous behavior.
These three MCP servers span across the different types of data used by investigation engineers, providing a complete working set for an agent to conduct investigations with autonomous correlation across logs, traces, and metrics to determine the possible root causes for an issue. Additionally, a custom MCP server exposes tool functions over business data on revenue, sales, and other business metrics. For the OpenTelemetry demo application, you can develop synthetic data to aid in providing context for impact and other business level metrics. For brevity, we don’t show that server as a part of this architecture.
Observability agent
The observability agent is central to the solution. It is built to help with incident investigation. Traditional automations and manual runbooks typically follow predefined operating procedures, but with an observability agent, you don’t need to define them. The agent can analyze, reason based on the data available to it, and adapt its strategy based on what it discovers. It correlates findings across logs, traces, and metrics to arrive at a root cause.
The observability agent is built with the Strands Agent SDK, an open source framework that simplifies development of AI agents. The SDK provides a model-driven approach with flexibility to handle underlying orchestration and reasoning (the agent loop) by invoking exposed tools and maintaining coherent, turn-based interactions. This implementation also discovers tools dynamically, so if there is a change in the capabilities, the agent can make decisions based on up-to-date information.
The agent runs on Amazon Bedrock AgentCore Runtime, which provides fully managed infrastructure for hosting and running agents. The runtime supports popular agent frameworks, including Stands, LangGraph, and CrewAI. The runtime also provides scaling availability and compute that many enterprises require to run production-grade agents.
We use Amazon Bedrock AgentCore Gateway to connect to all three MCP servers. When deploying agents at scale, gateways are indispensable components to reduce management tasks like custom code development, infrastructure provisioning, comprehensive ingress and egress security, and unified access. These are essential enterprise functions needed when bringing a workload to production. In this application, we create gateways that connect all three MCP servers as targets using server-sent events. Gateways work alongside Amazon Bedrock AgentCore Identities to provide secure credentials management and secure identity propagation from the user to the communicating entities. The sample application uses AWS Identity and Access Management (IAM) for identity management and propagation.
Incident investigation is often a multi-step process. It involves iterative hypothesis testing, multiple rounds of querying, and building context over time. We use Amazon Bedrock AgentCore Memory for this purpose. In this solution, we use session-based namespaces to maintain separate conversation threads for different investigations. For example, when a user asks “What about Payment service?” during an investigation, the agent retrieves recent conversation history from memory to maintain awareness of prior findings. We store both user questions and agent responses with timestamps to help the agent reconstruct the conversation chronologically and reason about already completed findings.
We configured the observability agent to use Anthropic’s Claude Sonnet v4.5 in Amazon Bedrock for reasoning. The model interprets questions, decides which MCP tool to invoke, analyzes the results, and formulates the set of questions or conclusions. We use a system prompt to instruct the model to think like an experienced SRE or an operation center engineer: “Starting with a high-level check, narrowing down affected components, correlate across telemetry signal types and derive conclusion with substantiation. You ask the model to also suggest logical next steps such as performing a drill down to investigate inter service dependencies.” This makes the agent versatile to analyze and reason about common varieties of incident investigations.
Observability agent in action
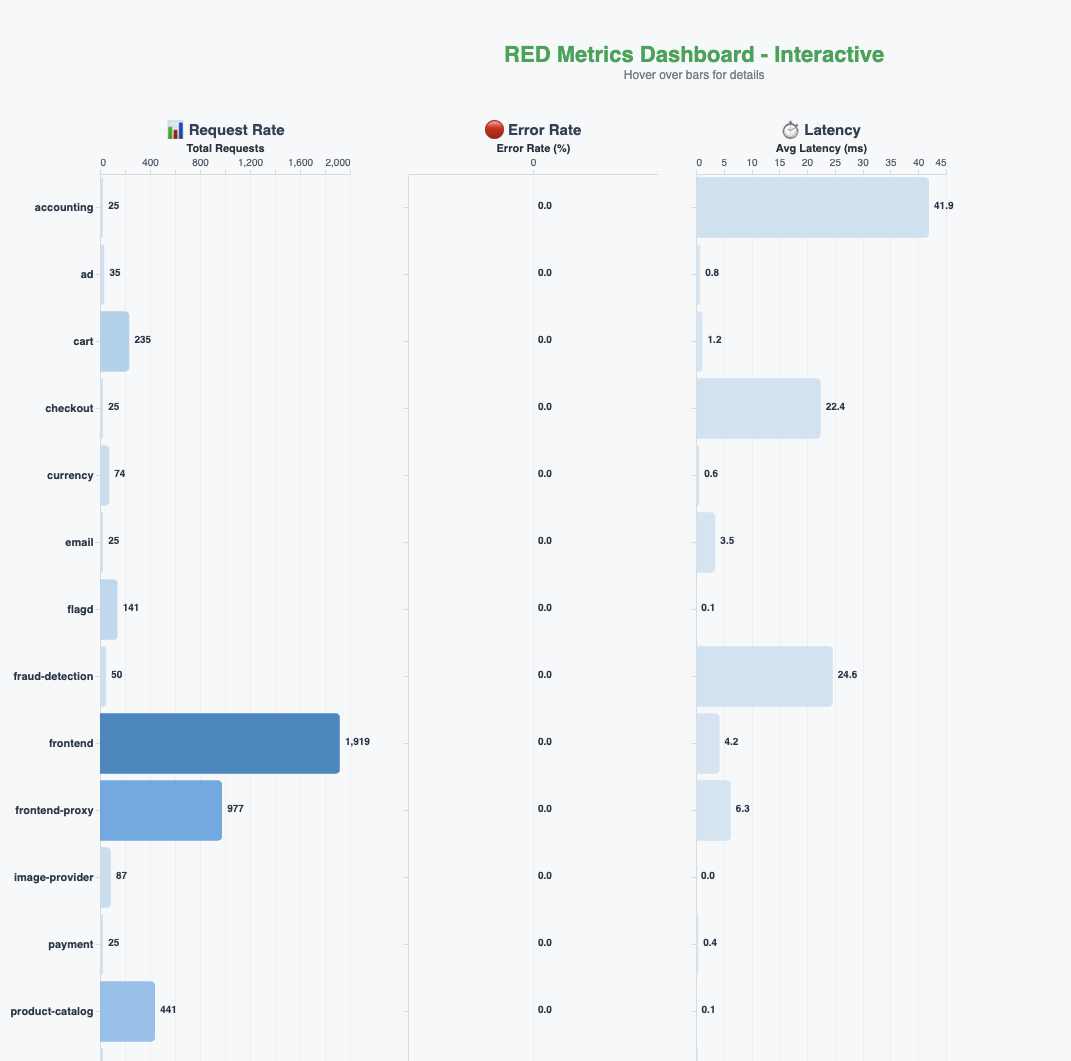
We built a real-time RED (rate, errors, duration) metrics dashboards for the entire application, as shown in the following figure.
To establish a baseline, we asked the agent the following question: “Are there any errors in my application in the last five minutes?”The agent queries the traces and metrics, analyzes the results, and responds saying there are no errors in the system. It notes that all the services are active, traces are healthy, and the system is processing requests normally. The agent also proactively suggests next steps that might be useful for further investigation.
Introducing failures
The OpenTelemetry demo application has a feature flag that we can use to introduce deliberate failures in the system. It also includes load generation so these errors can surface prominently. We use these features to introduce a few failures with the payment service. The real-time RED metrics dashboards in the previous figure reflect the impact and show the error rates climbing.
Investigation and root cause analysis
Now that we are generating errors, we engage the agent again. This is typically the start of the investigation session. Also, we have workflows like alarms triggering or pages going out that will trigger the starting of an investigation.
We ask the question “Users are complaining that it is taking a long time to buy items. Can you check to see what is going on?”
The agent retrieves the conversation history from memory (if there is any), invokes tools to query RED metrics across services, and analyzes the results. It identifies a critical purchase flow performance issue: payment service is in a connectivity crisis and completely unavailable, with extreme latency observed in fraud detection, ad service, and recommendation service. The agent provides immediate action recommendations—restore payment service connectivity as the top priority—and suggests next steps, including investigating payment service logs.
Following the agent’s suggestion, we ask it to investigate the logs: “Investigate payment service logs to understand the connectivity issue.”
The agent searches logs for the checkout and payment services, correlates them with trace data, and analyzes service dependencies from the service map. It confirms that although cart service, product catalog service, and currency service are healthy, the payment service is completely unreachable, successfully identifying the root cause of our deliberately introduced failure.
Beyond root cause: Analyzing business impact
As mentioned earlier, we have synthetic business sales and revenue data in a separate MCP server, so when the user asks the agent “Analyze the business impact of the checkout and payment service failures,” the agent uses this business data, examines the transaction data from traces, calculates estimated revenue impact, and assesses customer abandonment rates due to checkout failures. This shows how the agent can go beyond identifying the root cause and provide help with operational activities like creating a runbook for issue resolution in the future, which can be first the step to providing automatic remediation without involving SREs.
Benefits and results
Although the failure scenario in this post is simplified for illustration, it highlights several key benefits that directly contribute to reducing MTTR.
Accelerated investigation cycles
Traditional workflows for troubleshooting involve multiple iterations of hypotheses, verification, querying, and data analysis at each step, requiring context switching and consuming hours of effort. The observability agent reduces these drastically to a few minutes by autonomous reasoning, correlation, and actioning, which in turn reduces MTTR.
Handling complex workflows
Real-world production scenarios often involve cascading failures and multiple system failures. The observability agent’s capabilities can extend to these scenarios by using historical data and pattern recognition. For instance, it can distinguish related issues from false positives using temporal or identity-based correlation, dependency graphs, and other techniques, helping SREs avoid wasted investigation effort on unrelated anomalies.
Rather than provide a single answer, the agent can provide probabilistic distribution across potential root causes, helping SREs prioritize remediation methods; for example:
- Payment service network connectivity issue: 75%
- Downstream payment gateway timeout: 15%
- Database connection pool exhaustion: 8%
- Other/Unknown: 2%
The agent can compare current symptoms against past incidents, identifying whether similar patterns have happened in the past, thereby evolving from a reactive query tool into a proactive diagnostic assistant.
Conclusion
Incident investigation remains largely manual. SREs juggle dashboards, craft queries, and correlate signals under pressure, even when all the data is readily available. In this post, we showed how an observability agent built with Amazon Bedrock AgentCore and OpenSearch Service can alleviate this cognitive burden by autonomously querying logs, traces, and metrics; correlating findings; and guiding SREs toward root cause faster. Although this pattern represents one approach, the flexibility of Amazon Bedrock AgentCore combined with the search and analytics capabilities of OpenSearch Service enables agents to be designed and deployed in numerous ways—at different stages of the incident lifecycle, with varying levels of autonomy, or focused on specific investigation tasks—to suit your organization’s unique operational needs. Agentic AI doesn’t replace existing observability investment, but amplifies them by providing an effective way to use your data during incident investigations.


 Muthu Pitchaimani is a Search Specialist with Amazon OpenSearch Service. He builds large-scale search applications and solutions. Muthu is interested in the topics of networking and security, and is based out of Austin, Texas.
 Hang (Arthur) Zuo is a Senior Product Manager with Amazon OpenSearch Service. Arthur leads generative AI, workspaces, and infrastructural features in OpenSearch UI. Arthur is passionate about cloud technologies and building data products that help users and businesses gain actionable insights and achieve operational excellence.


 Muthu Pitchaimani is a Search Specialist with Amazon OpenSearch Service. He builds large-scale search applications and solutions. Muthu is interested in the topics of networking and security, and is based out of Austin, Texas.
 Dagney Braun is a Senior Manager of Product on the Amazon Web Services OpenSearch team. She is passionate about improving the ease of use of OpenSearch and expanding the tools available to better support all customer use cases.

 Muthu Pitchaimani is a Search Specialist with Amazon OpenSearch Service. He builds large-scale search applications and solutions. Muthu is interested in the topics of networking and security, and is based out of Austin, Texas.
 Aruna Govindaraju is an Amazon OpenSearch Specialist Solutions Architect and has worked with many commercial and open source search engines. She is passionate about search, relevancy, and user experience. Her expertise with correlating end-user signals with search engine behavior has helped many customers improve their search experience.


 Muthu Pitchaimani is a Search Specialist with Amazon OpenSearch Service. He builds large-scale search applications and solutions. Muthu is interested in the topics of networking and security, and is based out of Austin, Texas.
 Arjun Nambiar is a Product Manager with Amazon OpenSearch Service. He focuses on ingestion technologies that enable ingesting data from a wide variety of sources into Amazon OpenSearch Service at scale. Arjun is interested in large-scale distributed systems and cloud-centered technologies, and is based out of Seattle, Washington.


 Prashant Agrawal is a Sr. Search Specialist Solutions Architect with Amazon OpenSearch Service. He works closely with customers to help them migrate their workloads to the cloud and helps existing customers fine-tune their clusters to achieve better performance and save on cost. Before joining AWS, he helped various customers use OpenSearch and Elasticsearch for their search and log analytics use cases. When not working, you can find him traveling and exploring new places. In short, he likes doing Eat → Travel → Repeat.
 Rahul Sharma is a Technical Account Manager at Amazon Web Services. He is passionate about the data technologies that help leverage data as a strategic asset and is based out of New York city, New York.
 Arjun Nambiar is a Product Manager with Amazon OpenSearch Service. He focusses on ingestion technologies that enable ingesting data from a wide variety of sources into Amazon OpenSearch Service at scale. Arjun is interested in large scale distributed systems and cloud-native technologies and is based out of Seattle, Washington.
 Jay is Customer Success Engineering leader for OpenSearch service. He focusses on overall customer experience with the OpenSearch. Jay is interested in large scale OpenSearch adoption, distributed data store and is based out of Northern Virginia.
 Rich Giuli is a Principal Solutions Architect at Amazon Web Service (AWS). He works within a specialized group helping ISVs accelerate adoption of cloud services. Outside of work Rich enjoys running and playing guitar.

 Muthu Pitchaimani is a Search Specialist with Amazon OpenSearch Service. He builds large-scale search applications and solutions. Muthu is interested in the topics of networking and security, and is based out of Austin, Texas.
 Raj Sharma is a Sr. SDM with Amazon OpenSearch Service. He builds large-scale distributed applications and solutions. Raj is interested in the topics of Analytics, databases, networking and security, and is based out of Palo Alto, California.


 Aish Gunasekar is a Specialist Solutions architect with a focus on Amazon OpenSearch Service. Her passion at AWS is to help customers design highly scalable architectures and help them in their cloud adoption journey. Outside of work, she enjoys hiking and baking.
 Jimish Shah is a Senior Product Manager at AWS with 15+ years of experience bringing products to market in log analytics, cybersecurity, and IP video streaming. He’s passionate about launching products that offer delightful customer experiences, and solve complex customer problems. In his free time, he enjoys exploring cafes, hiking, and taking long walks.
 Muthu Pitchaimani is a Search Specialist with Amazon OpenSearch Service. He builds large-scale search applications and solutions. Muthu is interested in the topics of networking and security, and is based out of Austin, Texas.


 Muthu Pitchaimani is a Search Specialist with Amazon OpenSearch Service. He builds large-scale search applications and solutions. Muthu is interested in the topics of networking and security, and is based out of Austin, Texas.