Tag Archives: Amazon Security Lake

How to deploy an Amazon OpenSearch cluster to ingest logs from Amazon Security Lake

Post Syndicated from Kevin Low original https://aws.amazon.com/blogs/security/how-to-deploy-an-amazon-opensearch-cluster-to-ingest-logs-from-amazon-security-lake/

Many customers use Amazon Security Lake to automatically centralize security data from Amazon Web Services (AWS) environments, software as a service (SaaS) providers, on-premises workloads, and cloud sources into a purpose-built data lake in their AWS accounts. With Security Lake, customers can choose between native AWS security analytics tools and partner security information and event management (SIEM) and analytics solutions to streamline security investigations.

Amazon OpenSearch Service natively integrates with Security Lake to enable customers to perform interactive log analytics and searches across large datasets, create enterprise visualization and dashboards, and perform analysis across disparate applications and logs. With Amazon OpenSearch Security Analytics, customers can also gain visibility into the security posture of their organization’s infrastructure, monitor for anomalous activity, detect potential security threats in real time, and initiate alerts to pre-configured destinations.

In part one of this two-part blog post, I show you how to plan and deploy an OpenSearch Service cluster that ingests logs from Security Lake to facilitate real-time monitoring with OpenSearch Security Analytics. This will include considerations about instance choice and storage. Then, I will show you how to set up an OpenSearch Ingestion pipeline to ingest logs and data expiration rules to expire logs after a set period of time.

The architecture diagram in Figure 1 shows the completed architecture of the solution. The OpenSearch Service cluster is deployed within a virtual private cloud (VPC) across three Availability Zones and ingests logs from Security Lake using an OpenSearch Ingestion pipeline. The cluster is accessed through a public facing proxy hosted on an Amazon Elastic Compute Cloud (Amazon EC2) instance and authentication to the cluster is managed with Amazon Cognito.

Figure 1: Solution architecture

Figure 1: Solution architecture

Prerequisites

Security Lake should already be deployed. For details on how to deploy Security Lake, see Getting started with Amazon Security Lake. You will need AWS Identity and Access Management (IAM) permissions to manage Security Lake, OpenSearch Service, Amazon Cognito, and EC2 and to create IAM roles to follow along with this post.

Deciding instances for the OpenSearch Service master and data nodes

First, determine what instance type to use for the master and data nodes. For workloads that generate less than 100 GB of logs per day, we recommend using 3x m6g.large.search master nodes and 3x r6g.large.search for the data nodes. The number of data nodes and master nodes should be a multiple of three. You can start small and scale up or scale out later. For more information about deciding the size and number of instances, see the blog post Get started with Amazon OpenSearch Service. Note the instance types that you have selected.

Configuring storage

To determine how much storage is needed, you need to plan your data strategy. With Security Lake acting as your primary long-term log storage, you don’t need to store as much data in OpenSearch. We recommend storing around 30 days of data in OpenSearch. This allows you to react to and investigate the most immediate security events while optimizing storage costs for older logs.

The next step is to determine the volume of logs generated by Security Lake. You can get this information from the AWS Management Console for Security Lake in the Security Lake delegated administrator account, on the Usage screen. Select the Last 30 days as the range of usage. Add the total actual usage for the last 30 days for the data sources that you intend to send to OpenSearch. If you have used Security Lake for less than 30 days, you can use the Total predicted usage per month instead. Divide this figure by 30 to get the daily data volume.

Figure 2: Select range of usage

Figure 2: Select range of usage

To determine the total storage needed, multiply the data generated by Security Lake per day by the retention period you chose, then by 1.1 to account for the indexes, then multiply that number by 1.15 for overhead storage. Some example calculations are shown in the following table:

Data generated by Security Lake (GB) Multiplied by the number of days to store Multiplied by indexes Multiplied by overhead space Total storage needed (GB)
10 30 1.1 1.15 379.5
50 30 1.1 1.15 1897.5
200 15 1.1 1.15 3795

Take the total amount of storage you need and divide it by the number of nodes you have to determine the amount of Amazon Elastic Block Store (Amazon EBS) storage you need per node. Round that number up to the nearest whole number. You can increase the amount of storage after deployment when you have a better understanding of your workload. Make a note of this number. The following table shows storage per node based on the previous calculations.

Total data (GB) Number of nodes Storage per node (GB)
379.5 3 ~127
1897.5 6 ~317
3795 12 ~317

Where to deploy the cluster?

If you have an AWS Control Tower deployment or have a deployment modelled after the AWS Security Reference Architecture (AWS SRA), Security Lake should be deployed in the Log Archive account. Because security best practices recommend that the Log Archive account should not be frequently accessed, the OpenSearch Service cluster should be deployed into your Security Tooling account. While you can deploy an OpenSearch Service cluster in the same account as Security Lake, it isn’t a best practice.

Your cluster should be deployed in the same AWS Region as your Security Lake roll-up Region. If you have more than one roll-up Region, choose the Region that has the largest volume of logs.

Deploy the solution

To deploy the solution, you will use a CloudFormation template to deploy the OpenSearch Service cluster. After deployment, you will configure an OpenSearch Ingestion pipeline to ingest logs from Security Lake, and set up object expiration.

To deploy the OpenSearch cluster:

  1. To deploy the CloudFormation template that builds the OpenSearch service cluster, choose the following Launch Stack button.
    Launch Stack
  2. In the CloudFormation console, make sure that you are in the same Region as your Security Lake roll-up Region. Enter a name for your stack and enter the instance type and AWS EBS volume size that you noted earlier. For SearchEngineVersion, select the most recent one available.

    Figure 3: Add stack details

    Figure 3: Add stack details

  3. Choose Next and Next to proceed to the Review and create page.
  4. Check the acknowledgements in the Capabilities section and choose Submit to begin deploying the resources.
  5. It will take 20–30 minutes to deploy the multiple nested templates. Wait for the main stack (not the nested ones) to achieve CREATE_COMPLETE status before proceeding to the next step.
  6. Go to the Outputs pane of the main CloudFormation stack. Open the DashboardsProxyURL value in a new tab.

    Figure 4: The stacks in the CREATE_COMPLETE state with the relevant outputs highlighted

    Figure 4: The stacks in the CREATE_COMPLETE state with the relevant outputs highlighted

    Note: Because the proxy relies on a self-signed certificate, you will get an insecure certificate warning. You can safely ignore this warning and proceed. For a production workload, you should issue a trusted private certificate from your internal public key infrastructure or use AWS Private Certificate Authority.

  7. You will be presented with the Amazon Cognito sign-in page. Sign in with the CognitoUser and CognitoPassword details found in the Outputs pane in the CloudFormation console. After changing your password, you will be sent to the OpenSearch dashboard.

To ingest logs from Amazon Security Lake:

  1. Go to the OpenSearch console and select the cluster that was created by the CloudFormation template. Choose the Security configuration tab and choose Edit.

    Figure 5: Edit the security configuration

    Figure 5: Edit the security configuration

  2. Under Fine-grained access control, ensure that Enable fine-grained access control is selected and select Create master user. Enter a username and password for this user and keep it secure. You will use this to upload the component and index templates later.

    Figure 6: Configure fine-grained access control

    Figure 6: Configure fine-grained access control

  3. On Access Policy, change the Domain access policy to Only use fine-grained access control. If an Access policy will be cleared window appears, choose Clear policy.

    Figure 7: Select the access policy

    Figure 7: Select the access policy

  4. Choose Save changes.
  5. Follow the instructions from the blog post Generate security insights from Amazon Security Lake data using Amazon OpenSearch Ingestion starting from Create an Amazon Security Lake subscriber to set up the Security Lake subscriber.
  6. You need to use your proxy to complete the Install templates and dashboards for Amazon Security Lake data section of the post. Go to the Amazon EC2 console and select the checkbox next to the instance with dashboards-proxy in its name. Choose Connect.

    Figure 8: Selecting the proxy instance to connect to

    Figure 8: Selecting the proxy instance to connect to

  7. Choose Connect to connect to the proxy instance with Session Manager, a capability of AWS Systems Manager.

    Figure 9: Connecting to the instance with Session Manager

    Figure 9: Connecting to the instance with Session Manager

  8. Run the following commands to download the templates to your proxy.
    sudo su
    wget https://aws-blogs-artifacts-public.s3.amazonaws.com/bdb-3541/component_templates.zip
    wget https://aws-blogs-artifacts-public.s3.amazonaws.com/bdb-3541/index_templates.zip
    unzip component_templates.zip 
    unzip index_templates.zip
    

  9. You can follow the rest of the instructions in the blog post to finish setting up the OpenSearch Ingestion pipeline, which will enable OpenSearch to ingest logs from Security Lake.

To expire stale findings

After your OpenSearch cluster is ingesting data, you need to configure it to expire stale data.

  1. Choose the menu icon (three stacked horizontal lines) on the top left and select Index Management in the Management section.

    Figure 10: Navigating to the Index Management page in the OpenSearch console

    Figure 10: Navigating to the Index Management page in the OpenSearch console

  2. Choose Create policy and select JSON editor. Enter a name for the policy and paste the following JSON into the Define policy window. Choose Auto Indent to make it more readable.
    {"policy": { "policy_id": "Expire stale data", "description": "Expires data that is more than 30 days old. ", "last_updated_time": 1716283888632, "schema_version": 19, "error_notification": null, "default_state": "Hot storage", "states": [ { "name": "Hot storage", "actions": [], "transitions": [ { "state_name": "Delete", "conditions": { "min_index_age": "30d" } } ] }, { "name": "Delete", "actions": [ { "retry": { "count": 3, "backoff": "exponential", "delay": "1m" }, "delete": {} } ], "transitions": [] } ], "ism_template": [ { "index_patterns": [ "ocsf-*" ], "priority": 1, "last_updated_time": 1716279164421 } ] } }

  3. Choose Create.

This policy automatically deletes indices after 30 days and is automatically applied to new indices created by data from Security Lake. You can select the policy to change its configuration using the visual editor.

Clean up

To avoid unwanted charges, delete the OpenSearch Ingestion pipeline, the main CloudFormation template (not the nested stacks), and disable Security Lake.

Conclusion

In this post, you learned how to plan an OpenSearch deployment with Amazon OpenSearch Service to ingest logs from Amazon Security Lake. You determined the size of your OpenSearch Service cluster and deployed it into a VPC. You then set up an OpenSearch Ingestion pipeline to ingest data from Security Lake and deployed a script to expire stale data. Through this, you created the infrastructure needed to use OpenSearch Service as a threat detection tool. In part 2, I will show you how to set up the Security Analytics detector to generate alerts to security findings in near-real time.

 
If you have feedback about this post, submit comments in the Comments section below. If you have questions about this post, contact AWS Support.

Kevin Low

Kevin Low
Kevin is a Security Solutions Architect who helps the largest customers across ASEAN build securely. He is passionate about integrating resilience and security and has a keen interest in chaos engineering. Outside of work, he loves spending time with his wife and dog, a poodle called Noodle.

Accelerate incident response with Amazon Security Lake – Part 2

Post Syndicated from Frank Phillis original https://aws.amazon.com/blogs/security/accelerate-incident-response-with-amazon-security-lake-part-2/

This blog post is the second of a two-part series where we show you how to respond to a specific incident by using Amazon Security Lake as the primary data source to accelerate incident response workflow. The workflow is described in the Unintended Data Access in Amazon S3 incident response playbook, published in the AWS incident response playbooks repository.

The first post in this series outlined prerequisite information and provided steps for setting up Security Lake. The post also highlighted how Security Lake can add value to your incident response capabilities and how that aligns with the National Institute of Standards and Technology (NIST) SP 800-61 Computer Security Incident Handling Guide. We demonstrated how you can set up Security Lake and related services in alignment with the AWS Security Reference Architecture (AWS SRA).

The following diagram shows the service architecture that we configured in the previous post. The highlighted services (Amazon Macie, Amazon GuardDuty, AWS CloudTrail, AWS Security Hub, Amazon Security Lake, Amazon Athena, and AWS Organizations) are relevant to the example referenced in this post, which focuses upon the phases of incident response outlined in NIST SP 800-61.

Figure 1: Example architecture configured in the previous blog post

Figure 1: Example architecture configured in the previous blog post

The first phase of the NIST SP 800-61 framework is preparation, which was covered in part 1 of this two-part blog series. The following sections cover phase 2 (detection and analysis) and phase 3 (containment, eradication, and recovery) of the NIST framework, and demonstrate how Security Lake accelerates your incident response workflow by providing a central datastore of security logs and findings in a standardized format.

Consider a scenario where your security team has received an Amazon GuardDuty alert through Amazon EventBridge for anomalous user behavior. As a result, the team becomes aware of potential unintended data access. GuardDuty noted unusual IAM user activity for the AWS Identity and Access Management (IAM) user Service_Backup and generated a finding. The security team had set up a rule in EventBridge that sends an alert email notifying them of GuardDuty findings relating to IAM user activity. At this point, the security team is unsure if any malicious activity has occurred, however, the username is not familiar. The security team should investigate further to determine whether the finding is a false positive by querying data in Security Lake. In line with the NIST incident response framework, the team moves to phase 2 of this investigation.

Phase 2: Acquire, preserve, and document evidence

The security team wants to investigate which API calls the unfamiliar user has been making. First, the team checks AWS CloudTrail management activity for the user, and they can do that by using Security Lake. They want a list of that user’s activity, which will help them in several ways:

  1. Give them a list of API calls that warrant further investigation (especially Create*)
  2. Give an indication whether the activity is unusual or not (in the context of “typical” user activity within the account, team, user group, or individual user)
  3. Give an indication of when potentially malicious activity might have started (user history)

The team can use Amazon Athena to query CloudTrail management events that were captured by Security Lake. In some cases, compromised user accounts might have existed for a long time previously as legitimate users and made tens of thousands of API calls. In such a case, how would a security team identify the calls that might need further investigation? A quick way to get a summary list of API calls the user has made would be to run a query like the following:

SELECT DISTINCT api.operation FROM amazon_security_lake_table_us_west_2_cloud_trail_mgmt_2_0
WHERE lower(actor.user.name) = 'service_backup'

From the results, the team can determine information and queries of interest to focus on for further investigation. To begin with, the security team uses the preceding query to enumerate the number and type of API calls made by the user, as shown in Figure 2.

Figure 2: Example API call summary made by an IAM user

Figure 2: Example API call summary made by an IAM user

The initial query results in Figure 2 show API calls that could indicate privilege elevation (creating users, attaching user policies, and similar calls are a good indicator). There are other API calls that indicate that additional resources may have been created, such as Amazon Simple Storage Service (Amazon S3) buckets and Amazon Elastic Compute Cloud (Amazon EC2) instances.

Note that in this early phase, the team didn’t time-bound the query. However, if there is a high degree of confidence that the team can focus on a specific time or date range, the query can be further modified. How would the team decide on a time period to focus on? When the team received the alert email from EventBridge, that email included information about the GuardDuty finding, including the time it was observed. The team can use that time as an anchor to search around.

The team now wants to look at the user’s activity in a bit more detail. To do that, they can use a query that returns more detail for each of the API calls the user has made:

SELECT time_dt AS "Time Date", metadata.product.name AS "Log Source", cloud.region, actor.user.type, actor.user.name, actor.user.account.uid AS "User AWS Acc ID", api.operation AS "API Operation", status AS "API Response", api.service.name AS "Service", api.request.data AS "Request Data"
FROM amazon_security_lake_table_us_west_2_cloud_trail_mgmt_2_0
WHERE lower(actor.user.name) = 'service_backup';
Figure 3: Example CloudTrail activity for an IAM user

Figure 3: Example CloudTrail activity for an IAM user

Figure 3 shows the result of the example query. The team observes that the user created an S3 bucket and performed other management plane actions, including creating IAM users and attaching the administrator access policy to a newly created user. Attempts were made to create other resources such as Amazon EC2 instances, but these were not successful. So the team needs to do further investigation on the newly created IAM users and S3 buckets, but they don’t need to take further action on EC2 instances, at least for this user.

The team starts to focus on investigating the IAM permissions of the Service_Backup user because some resources created by this user could lead to privilege elevation (for example: CreateUser >> AttachPolicy >> CreateAccessKey). The team verifies that the policy attached to that new user was AdminAccess. The activities of this newly created user should be investigated. Now, with a broad idea of that user’s activity and the time the activity occurred, the security team wants to focus on IAM activity, so that they can understand what resources have been created. Those resources will likely also need to be investigated.

The team can use the following query to find more detail about the resources that the user has created, modified, or deleted. In this case, the user has also created additional IAM users and roles. The team uses timestamps to limit query results to a specific time range during which they believe the suspicious activity occurred, and can also focus on IAM activity specifically.

SELECT time_dt AS "Time", cloud.region AS "Region", actor.session.issuer AS "Role Issuer", actor.user.name AS "User Name", api.operation AS "API Call", json_extract(api.request.data, '$.userName') AS "Target Principal", json_extract(api.request.data, '$.policyArn') AS "Target Policy", json_extract(api.request.data, '$.roleName') AS "Target Role", actor.user.uid AS "User ID", user.name AS "Target Principal", status AS "Response Status", accountid AS "AWS Account"
FROM amazon_security_lake_table_us_west_2_cloud_trail_mgmt_2_0
WHERE (lower(api.operation) LIKE 'create%' OR lower(api.operation) LIKE 'attach%' OR lower(api.operation) LIKE 'delete%')
AND lower(api.service.name) = 'iam.amazonaws.com'
AND lower(actor.user.name) = 'service_backup'
AND time_dt BETWEEN TIMESTAMP '2024-03-01 00:00:00.000' AND TIMESTAMP  '2024-05-31 23:59:00.000';
Figure 4: CloudTrail IAM activity for a specific user with additional resource detail

Figure 4: CloudTrail IAM activity for a specific user with additional resource detail

This additional detail helps the security team focus on the resources created by the Service_Backup user. These will need to be investigated further and most likely quarantined. If further analysis is required, resources can be disabled, or (in some instances) copied over to a forensic account to conduct the analysis.

Having identified newly created IAM resources that require further investigation, the team now continues by focusing on the resources created in S3. Has the Service_Backup user put objects into that bucket? Have they interacted with objects in any other buckets? To do that, the team queries the S3 data events by using Athena, as follows:

SELECT time_dt AS "Time Date", cloud.region AS "Region", actor.user.type, actor.user.name AS "User Name", api.operation AS "API Call", status AS "Status", api.request.data AS "Request Data", accountid AS "AWS Account ID"
FROM amazon_security_lake_table_us_west_2_s3_data_2_0
WHERE lower(actor.user.name) = 'service_backup';

The security team discovers that the Service_Backup user created an S3 bucket named breach.notify and uploaded a file named data-locked-xxx.txt in the bucket (the bucket name is also returned in the query results shown in Figure 3). Additionally, they see GetObject API calls for potentially sensitive data, followed by DeleteObject API calls for the same data and additional potentially sensitive data files. These are a group of CSV files, for example cc-data-2.csv, as shown in Figure 5.

Figure 5: Example Amazon S3 API activity for an IAM user

Figure 5: Example Amazon S3 API activity for an IAM user

Now the security team has two important goals:

  1. Protect and recover their data and resources
  2. Make sure that any applications that are reliant on those resources or data are available and serving customers

The security team knows that their S3 buckets do contain sensitive data, and they need a quick way to understand which files may be of value to a threat actor. Because the security team was able to quickly investigate their S3 data logs and determine that files have indeed been downloaded and deleted, they already have actionable information. To enrich that with additional context, the team needs a way to verify whether the file contains sensitive data. Amazon Macie can be configured to detect sensitive data in S3 buckets and natively integrate with Security Hub. The team had already configured Macie to scan their buckets and provide alerts if potentially sensitive data is discovered. The team can continue to use Athena to query Security Hub data stored in Security Lake, to see if the Macie results could be related to those files or buckets. The team looks for such findings that were generated around the time that the breach.notify S3 bucket was created, with the unusually named object uploaded, through the following Athena query:

SELECT time_dt AS "Date/Time", metadata.product.name AS "Log Source", cloud.account.uid AS "AWS Account ID", cloud.region AS "AWS Region", resources[1].type AS "Resource Type", resources[1].uid AS "Bucket ARN", resources[2].type AS "Resource Type 2", resources[2].uid AS "Object Name", finding_info.desc AS "Finding summary" FROM amazon_security_lake_table_us_west_2_sh_findings_2_0
WHERE cloud.account.uid = '<YOUR_AWS_ACCOUNT_ID>'
AND lower(metadata.product.name) = 'macie'
AND time_dt BETWEEN TIMESTAMP '2024-03-10 00:00:00.000' AND TIMESTAMP  '2024-03-14 23:59:00.000';
Figure 6: Example Amazon Macie finding summary for data in S3 buckets

Figure 6: Example Amazon Macie finding summary for data in S3 buckets

As Figure 6 shows, the team used the preceding query to pull just the information they needed to help them understand whether there is likely sensitive information in the bucket, which files contain that information, and what kind of information it is. From these results, it appears that the files listed do contain sensitive information, which appears to be credit card related data.

It’s time to stop and briefly review what the team now knows, and what still needs to be done. The team established that the Service_Backup user created additional IAM users and assigned wide-ranging permissions to those users. They also found that the Service_Backup user downloaded what appears to be confidential data, and then deleted those files from the customer’s buckets. Meanwhile, the Service_Backup user created a new S3 bucket and stored ransom files in it. In addition to this, that user also created IAM roles and attempted to create EC2 instances. In our example scenario, the first part of the investigation is complete.

There are a few things to note about what the team has done so far with Security Lake. First, because they’ve set up Security Lake across their entire organization, the team can query results from accounts in their organization, for various types of resources. That in itself saves a significant amount of time during the investigative process. Additionally, the team has seamlessly queried different sets of data to get an outcome—so far they have queried CloudTrail management events, S3 data events, and Macie findings through Security Hub—with the preceding queries done through Security Lake, directly from the Athena console, with no account or role switching, and no tool switching.

Next, we’ll move on to the containment step.

Phase 3: Containment, eradication, and recovery

Having gathered sufficient evidence in the previous phases to act, it’s now time for the team to contain this incident and focus on the AWS API by using either the AWS Management Console, the AWS CLI, or other tools. For the purposes of this blog post, we’ll use the CLI tools.

The team needs to perform several actions to contain the incident. They want to reduce the risk of further data exposure and the creation, modification, or deletion of resources in these AWS accounts. First, they will disable the Service_Backup user’s access and subsequently investigate and assess whether to disable the access of the IAM principal which created that user. Additionally, because Service_Backup created other IAM users, those users must also be investigated using the same process outlined earlier.

Next, the security team needs to determine whether or how they can restore the sensitive data that has been deleted from the bucket. If the bucket has versioning enabled, the act of deleting the object will result in the next most recent version becoming the current version. Alternatively, if they are using AWS Backup to protect their Amazon S3 data, they will be able to restore the most recently backed-up version. It’s worth noting that there could be other ways to restore that data—for example, the organization might have configured cross-Region replication for S3 buckets or other methods to protect their data.

After completing the steps to help prevent further access of the impacted IAM users, and restoring relevant data in impacted S3 buckets, the team now turns their attention to the additional resources created by the now-disabled user. Because these resources include IAM resources, the team needs a list of what has been created and deleted. They could see that information from earlier queries, but now decide to focus just on IAM resources by using the following example query;

SELECT time_dt AS "Time", cloud.region AS "Region", actor.session.issuer AS "Role Issuer", actor.user.name AS "User Name", api.operation AS "API Call", json_extract(api.request.data, '$.userName') AS "Target Principal", json_extract(api.request.data, '$.policyArn') AS "Target Policy", json_extract(api.request.data, '$.roleName') AS "Target Role", actor.user.uid AS "User ID", user.name AS "Target Principal", status AS "Response Status", accountid AS "AWS Account"
FROM amazon_security_lake_table_us_west_2_cloud_trail_mgmt_2_0
WHERE (lower(api.operation) LIKE 'create%' OR lower(api.operation) LIKE 'attach%' OR lower(api.operation) LIKE 'delete%')
AND lower(api.service.name) = 'iam.amazonaws.com'
AND time_dt BETWEEN TIMESTAMP '2024-03-01 00:00:00.000' AND TIMESTAMP  '2024-05-31 23:59:00.000';

This query returns a concise and informative list of activities for several users. There is a separate column for the role name or the user ID, corresponding to IAM roles and users, respectively, as shown in Figure 7.

Figure 7: IAM mutating API activity

Figure 7: IAM mutating API activity

The team uses the AWS CLI to revoke IAM role session credentials, to verify and, if necessary, to modify the role’s trust policy. They also capture an image of the EC2 instance for forensic analysis and terminate the instance. They will copy the data they want to save from the questionable S3 buckets and then delete the buckets, or at least remove the bucket policy.

After completing these tasks, the security team now confirms with the application owners that application recovery is complete or ongoing. They will subsequently review the event and undertake phase 4 of the NIST framework (post-incident activity) to find the root cause, look for opportunities for improvement, and work on remediating any configuration or design flaws that led to the initial breach.

Conclusion

This is the second post in a two-part series about accelerating security incident response with Security Lake. We used anomalous IAM user activity as an incident example to show how you can use Security Lake as a central repository for your security logs and findings, to accelerate the incident response process.

With Security Lake, your security team is empowered to use analytics tools like Amazon Athena to run queries against a central point of security logs and findings from various security data sources, including management logs and S3 data logs from AWS CloudTrail, Amazon Macie findings, Amazon GuardDuty findings, and more.

 
If you have feedback about this post, submit comments in the Comments section below. If you have questions about this post, contact AWS Support.

Frank Phillis

Frank Phillis
Frank is a Senior Solutions Architect (Security) at AWS. He enables customers to get their security architecture right. Frank specializes in cryptography, identity, and incident response. He’s the creator of the popular AWS Incident Response playbooks and regularly speaks at security events. When not thinking about tech, Frank can be found with his family, riding bikes, or making music.
You can follow Frank on LinkedIn.

Jerry Chen

Jerry Chen
Jerry is a Senior Cloud Optimization Success Solutions Architect at AWS. He focuses on cloud security and operational architecture design for AWS customers and partners.
You can follow Jerry on LinkedIn.

Patterns for consuming custom log sources in Amazon Security Lake

Post Syndicated from Pratima Singh original https://aws.amazon.com/blogs/security/patterns-for-consuming-custom-log-sources-in-amazon-security-lake/

As security best practices have evolved over the years, so has the range of security telemetry options. Customers face the challenge of navigating through security-relevant telemetry and log data produced by multiple tools, technologies, and vendors while trying to monitor, detect, respond to, and mitigate new and existing security issues. In this post, we provide you with three patterns to centralize the ingestion of log data into Amazon Security Lake, regardless of the source. You can use the patterns in this post to help streamline the extract, transform and load (ETL) of security log data so you can focus on analyzing threats, detecting anomalies, and improving your overall security posture. We also provide the corresponding code and mapping for the patterns in the amazon-security-lake-transformation-library.

Security Lake automatically centralizes security data into a purpose-built data lake in your organization in AWS Organizations. You can use Security Lake to collect logs from multiple sources, including natively supported AWS services, Software-as-a-Service (SaaS) providers, on-premises systems, and cloud sources.

Centralized log collection in a distributed and hybrid IT environment can help streamline the process, but log sources generate logs in disparate formats. This leads to security teams spending time building custom queries based on the schemas of the logs and events before the logs can be correlated for effective incident response and investigation. You can use the patterns presented in this post to help build a scalable and flexible data pipeline to transform log data using Open Cybersecurity Schema Framework (OCSF) and stream the transformed data into Security Lake.

Security Lake custom sources

You can configure custom sources to bring your security data into Security Lake. Enterprise security teams spend a significant amount of time discovering log sources in various formats and correlating them for security analytics. Custom source configuration helps security teams centralize distributed and disparate log sources in the same format. Security data in Security Lake is centralized and normalized into OCSF and compressed in open source, columnar Apache Parquet format for storage optimization and query efficiency. Having log sources in a centralized location and in a single format can significantly improve your security team’s timelines when performing security analytics. With Security Lake, you retain full ownership of the security data stored in your account and have complete freedom of choice for analytics. Before discussing creating custom sources in detail, it’s important to understand the OCSF core schema, which will help you map attributes and build out the transformation functions for the custom sources of your choice.

Understanding the OCSF

OCSF is a vendor-agnostic and open source standard that you can use to address the complex and heterogeneous nature of security log collection and analysis. You can extend and adapt the OCSF core security schema for a range of use cases in your IT environment, application, or solution while complementing your existing security standards and processes. As of this writing, the most recent major version release of the schema is v1.2.0, which contains six categories: System Activity, Findings, Identity and Access Management, Network Activity, Discovery, and Application Activity. Each category consists of different classes based on the type of activity, and each class has a unique class UID. For example, File System Activity has a class UID of 1001.

As of this writing, Security Lake (version 1) supports OCSF v1.1.0. As Security Lake continues to support newer releases of OCSF, you can continue to use the patterns from this post. However, you should revisit the mappings in case there’s a change in the classes you’re using.

Prerequisites

You must have the following prerequisites for log ingestion into Amazon Security Lake. Each pattern has a sub-section of prerequisites that are relevant to the data pipeline for the custom log source.

  1. AWS Organizations is configured your AWS environment. AWS Organizations is an AWS account management service that provides account management and consolidated billing capabilities that you can use to consolidate multiple AWS accounts and manage them centrally.
  2. Security Lake is activated and a delegated administrator is configured.
    1. Open the AWS Management Console and navigate to AWS Organizations. Set up an organization with a Log Archive account. The Log Archive account should be used as the delegated Security Lake administrator account where you will configure Security Lake. For more information on deploying the full complement of AWS security services in a multi-account environment, see AWS Security Reference Architecture.
    2. Configure permissions for the Security Lake administrator access by using an AWS Identity and Access Management (IAM) role. This role should be used by your security teams to administer Security Lake configuration, including managing custom sources.
    3. Enable Security Lake in the AWS Region of your choice in the Log Archive account. When you configure Security Lake, you can define your collection objectives, including log sources, the Regions that you want to collect the log sources from, and the lifecycle policy you want to assign to the log sources. Security Lake uses Amazon Simple Storage Service (Amazon S3) as the underlying storage for the log data. Amazon S3 is an object storage service offering industry-leading scalability, data availability, security, and performance. S3 is built to store and retrieve data from practically anywhere. Security Lake creates and configures individual S3 buckets in each Region identified in the collection objectives in the Log Archive account.

Transformation library

With this post, we’re publishing the amazon-security-lake-transformation-library project to assist with mapping custom log sources. The transformation code is deployed as an AWS Lambda function. You will find the deployment automation using AWS CloudFormation in the solution repository.

To use the transformation library, you should understand how to build the mapping configuration file. The mapping configuration file holds mapping information from raw events to OCSF formatted logs. The transformation function builds the OCSF formatted logs based on the attributes mapped in the file and streams them to the Security Lake S3 buckets.

The solution deployment is a four-step process:

  1. Update mapping configuration
  2. Add a custom source in Security Lake
  3. Deploy the log transformation infrastructure
  4. Update the default AWS Glue crawler

The mapping configuration file is a JSON-formatted file that’s used by the transformation function to evaluate the attributes of the raw logs and map them to the relevant OCSF class attributes. The configuration is based on the mapping identified in Table 3 (File System Activity class mapping) and extended to the Process Activity class. The file uses the $. notation to identify attributes that the transformation function should evaluate from the event.

{  "custom_source_events": {
        "source_name": "windows-sysmon",
        "matched_field": "$.EventId",
        "ocsf_mapping": {
            "1": {
                "schema": "process_activity",
                "schema_mapping": {   
                    "metadata": {
                        "profiles": "host",
                        "version": "v1.1.0",
                        "product": {
                            "name": "System Monitor (Sysmon)",
                            "vendor_name": "Microsoft Sysinternals",
                            "version": "v15.0"
                        }
                    },
                    "severity": "Informational",
                    "severity_id": 1,
                    "category_uid": 1,
                    "category_name": "System Activity",
                    "class_uid": 1007,
                    "class_name": "Process Activity",
                    "type_uid": 100701,
                    "time": "$.Description.UtcTime",
                    "activity_id": {
                        "enum": {
                            "evaluate": "$.EventId",
                            "values": {
                                "1": 1,
                                "5": 2,
                                "7": 3,
                                "10": 3,
                                "19": 3,
                                "20": 3,
                                "21": 3,
                                "25": 4
                            },
                            "other": 99
                        }
                    },
                    "actor": {
                        "process": "$.Description.Image"
                    },
                    "device": {
                        "type_id": 6,
                        "instance_uid": "$.UserDefined.source_instance_id"
                    },
                    "process": {
                        "pid": "$.Description.ProcessId",
                        "uid": "$.Description.ProcessGuid",
                        "name": "$.Description.Image",
                        "user": "$.Description.User",
                        "loaded_modules": "$.Description.ImageLoaded"
                    },
                    "unmapped": {
                        "rulename": "$.Description.RuleName"
                    }
                    
                }
            },
…
…
…
        }
    }
}

Configuration in the mapping file is stored under the custom_source_events key. You must keep the value for the key source_name the same as the name of the custom source you add for Security Lake. The matched_field is the key that the transformation function uses to iterate over the log events. The iterator (1), in the preceding snippet, is the Sysmon event ID and the data structure that follows is the OCSF attribute mapping.

Some OCSF attributes are of an Object data type with a map of pre-defined values based on the event signature such as activity_id. You represent such attributes in the mapping configuration as shown in the following example:

'activity_id': {
    'enum': {
        'evaluate': '$.EventId',
        'values': {
              2: 6,
              11: 1,
              15: 1,
              24: 3,
              23: 4
         },
         'other': 99
      }
 }

In the preceding snippet, you can see the words enum and evaluate. These keywords tell the underlying mapping function that the result will be the value from the map defined in values and the key to evaluate is the EventId, which is listed as the value of the evaluate key. You can build your own transformation function based on your custom sources and mapping or you can extend the function provided in this post.

Pattern 1: Log collection in a hybrid environment using Kinesis Data Streams

The first pattern we discuss in this post is the collection of log data from hybrid sources such as operating system logs collected from Microsoft Windows operating systems using System Monitor (Sysmon). Sysmon is a service that monitors and logs system activity to the Windows event log. It’s one of the log collection tools used by customers in a Windows Operating System environment because it provides detailed information about process creations, network connections, and file modifications This host-level information can prove crucial during threat hunting scenarios and security analytics.

Solution overview

The solution for this pattern uses Amazon Kinesis Data Streams and Lambda to implement the schema transformation. Kinesis Data Streams is a serverless streaming service that makes it convenient to capture and process data at any scale. You can configure stream consumers—such as Lambda functions—to operate on the events in the stream and convert them into required formats—such as OCSF—for analysis without maintaining processing infrastructure. Lambda is a serverless, event-driven compute service that you can use to run code for a range of applications or backend services without provisioning or managing servers. This solution integrates Lambda with Kinesis Data Streams to launch transformation tasks on events in the stream.

To stream Sysmon logs from the host, you use Amazon Kinesis Agent for Microsoft Windows. You can run this agent on fleets of Windows servers hosted on-premises or in your cloud environment.

Figure 1: Architecture diagram for Sysmon event logs custom source

Figure 1: Architecture diagram for Sysmon event logs custom source

Figure 1 shows the interaction of services involved in building the custom source ingestion. The servers and instances generating logs run the Kinesis Agent for Windows to stream log data to the Kinesis Data Stream which invokes a consumer Lambda function. The Lambda function transforms the log data into OCSF based on the mapping provided in the configuration file and puts the transformed log data into Security Lake S3 buckets. We cover the solution implementation later in this post, but first let’s review how you can map Sysmon event streaming through Kinesis Data Streams into the relevant OCSF classes. You can deploy the infrastructure using the AWS Serverless Application Model (AWS SAM) template provided in the solution code. AWS SAM is an extension of the AWS Command Line Interface (AWS CLI), which adds functionality for building and testing applications using Lambda functions.

Mapping

Windows Sysmon events map to various OCSF classes. To build the transformation of the Sysmon events, work through the mapping of events with relevant OCSF classes. The latest version of Sysmon (v15.14) defines 30 events including a catch-all error event.

Sysmon eventID Event detail Mapped OCSF class
1 Process creation Process Activity
2 A process changed a file creation time File System Activity
3 Network connection Network Activity
4 Sysmon service state changed Process Activity
5 Process terminated Process Activity
6 Driver loaded Kernel Activity
7 Image loaded Process Activity
8 CreateRemoteThread Network Activity
9 RawAccessRead Memory Activity
10 ProcessAccess Process Activity
11 FileCreate File System Activity
12 RegistryEvent (Object create and delete) File System Activity
13 RegistryEvent (Value set) File System Activity
14 RegistryEvent (Key and value rename) File System Activity
15 FileCreateStreamHash File System Activity
16 ServiceConfigurationChange Process Activity
17 PipeEvent (Pipe created) File System Activity
18 PipeEvent (Pipe connected) File System Activity
19 WmiEvent (WmiEventFilter activity detected) Process Activity
20 WmiEvent (WmiEventConsumer activity detected) Process Activity
21 WmiEvent (WmiEventConsumerToFilter activity detected) Process Activity
22 DNSEvent (DNS query) DNS Activity
23 FileDelete (File delete archived) File System Activity
24 ClipboardChange (New content in the clipboard) File System Activity
25 ProcessTampering (Process image change) Process Activity
26 FileDeleteDetected (File delete logged) File System Activity
27 FileBlockExecutable File System Activity
28 FileBlockShredding File System Activity
29 FileExecutableDetected File System Activity
255 Sysmon error Process Activity

Table 1: Sysmon event mapping with OCSF (v1.1.0) classes

Start by mapping the Sysmon events to the relevant OCSF classes in plain text as shown in Table 1 before adding them to the mapping configuration file for the transformation library. This mapping is flexible; you can choose to map an event to a different event class depending on the standard defined within the security engineering function. Based on our mapping, Table 1 indicates that a majority of the events reported by Sysmon align with the File System Activity or the Process Activity class. Registry events map better with the Registry Key Activity and Registry Value Activity classes, but these classes are deprecated in OCSF v1.0.0, so we recommend using File System Activity instead of registry events for compatibility with future versions of OCSF. You can be selective about the events captured and reported by Sysmon by altering the Sysmon configuration file. For this post, we’re using the sysmonconfig.xml published in the sysmon-modular project. The project provides a modular configuration along with publishing tactics, techniques, and procedures (TTPs) with Sysmon events to help in TTP-based threat hunting use cases. If you have your own curated Sysmon configuration, you can use that. While this solution offers mapping advice, if you’re using your own Sysmon configuration, you should make sure that you’re mapping the relevant attributes using this solution as a guide. As a best practice, mapping should be non-destructive to keep your information after the OCSF transformation. If there are attributes in the log data that you cannot map to an available attribute in the OCSF class, then you should use the unmapped attribute to collect all such information. In this pattern, RuleName captures the TTPs associated with the Sysmon event, because TTPs don’t map to a specific attribute within OCSF.

Across all classes in OCSF, there are some common attributes that are mandatory. The common mandatory attributes are mapped shown in Table 2. You need to set these attributes regardless of the OCSF class you’re transforming the log data to.

OCSF Raw
metadata.profiles [host]
metadata.version v1.1.0
metadata.product.name System Monitor (Sysmon)
metadata.product.vendor_name Microsoft Sysinternals
metadata.product.version v15.14
severity Informational
severity_id 1

Table 2: Mapping mandatory attributes

Each OCSF class has its own schema, which is extendable. After mapping the common attributes, you can map the attributes in the File System Activity class relevant to the log information. Some of the attribute values can be derived from a map of options standardised by the OCSF schema. One such attribute is Activity ID. Depending on the type of activity performed on the file, you can assign a value from the pre-defined set of values in the schema such as 0 if the event activity is unknown, 1 if a file was created, 2 if a file was read, and so on. You can find more information on standard attribute maps in File System Activity, System Activity Category.

File system activity mapping example

The following is a sample file creation event reported by Sysmon:

File created:
RuleName: technique_id=T1574.010,technique_name=Services File Permissions Weakness
UtcTime: 2023-10-03 23:50:22.438
ProcessGuid: {78c8aea6-5a34-651b-1900-000000005f01}
ProcessId: 1128
Image: C:\Windows\System32\svchost.exe
TargetFilename: C:\Windows\ServiceState\EventLog\Data\lastalive1.dat
CreationUtcTime: 2023-10-03 00:04:00.984
User: NT AUTHORITY\LOCAL SERVICE

When the event is streamed to the Kinesis Data Streams stream, the Kinesis Agent can be used to enrich the event. We’re enriching the event with source_instance_id using ObjectDecoration configured in the agent configuration file.

Because the transformation Lambda function reads from a Kinesis Data Stream, we use the event information from the stream to map the attributes of the File System Activity class. The following mapping table has attributes mapped to the values based on OCSF requirements, the values enclosed in brackets (<>) will come from the event. In the solution implementation section for this pattern, you learn about the transformation Lambda function and mapping implementation for a sample set of events.

OCSF Raw
category_uid 1
category_name System Activity
class_uid 1001
class_name File System Activity
time <UtcTime>
activity_id 1
actor {process: {name: <Image>}}
device {type_id: 6}
unmapped {pid: <ProcessId>, uid: <ProcessGuid>, name: <Image>, user: <User>, rulename: <RuleName>}
file {name: <TargetFilename>, type_id: ‘1’}
type_uid 100101

Table 3: File System Activity class mapping with raw log data

Solution implementation

The solution implementation is published in the AWS Samples GitHub repository titled amazon-security-lake-transformation-library in the windows-sysmon instructions. You will use the repository to deploy the solution in your AWS account.

First update the mapping configuration, then add the custom source in Security Lake and deploy and configure the log streaming and transformation infrastructure, which includes the Kinesis Data Stream, transformation Lambda function and associated IAM roles.

Step 1: Update mapping configuration

Each supported custom source documentation contains the mapping configuration. Update the mapping configuration for the windows-sysmon custom source for the transformation function.

You can find the mapping configuration in the custom source instructions in the amazon-security-lake-transformation-library repository.

Step 2: Add a custom source in Security Lake

As of this writing, Security Lake natively supports AWS CloudTrail, Amazon Route 53 DNS logs, AWS Security Hub findings, Amazon Elastic Kubernetes Service (Amazon EKS) Audit Logs, Amazon Virtual Private Cloud (Amazon VPC) Flow Logs, and AWS Web Application Firewall (AWS WAF). For other log sources that you want to bring into Security Lake, you must configure the custom sources. For the Sysmon logs, you will create a custom source using the Security Lake API. We recommend using dashes in custom source names as opposed to underscores to be able to configure granular access control for S3 objects.

  1. To add the custom source for Sysmon events, configure an IAM role for the AWS Glue crawler that will be associated with the custom source to update the schema in the Security Lake AWS Glue database. You can deploy the ASLCustomSourceGlueRole.yaml CloudFormation template to automate the creation of the IAM role associated with the custom source AWS Glue crawler.
  2. Capture the Amazon Resource Name (ARN) for the IAM role, which is configured as an output of the infrastructure deployed in the previous step.
  3. Add a custom source using the following AWS CLI command. Make sure you replace the <AWS_ACCOUNT_ID>, <SECURITY_LAKE_REGION> and the <GLUE_IAM_ROLE_ARN> placeholders with the AWS account ID you’re deploying into, the Security Lake deployment Region and the ARN of the IAM role created above, respectively. External ID is a unique identifier that is used to establish trust with the AWS identity. You can use External ID to add conditional access from third-party sources and to subscribers.
    aws securitylake create-custom-log-source \
       --source-name windows-sysmon \
       --configuration crawlerConfiguration={"roleArn=<GLUE_IAM_ROLE_ARN>"},providerIdentity={"externalId=CustomSourceExternalId123,principal=<AWS_ACCOUNT_ID>"} \
       --event-classes FILE_ACTIVITY PROCESS_ACTIVITY \
       --region <SECURITY_LAKE_REGION>

    Note: When creating the custom log source, you only need to specify FILE_ACTIVITY and PROCESS_ACTIVITY event classes as these are the only classes mapped in the example configuration deployed in Step 1. If you extend your mapping configuration to handle additional classes, you would add them here.

Step 3: Deploy the transformation infrastructure

The solution uses the AWS SAM framework—an open source framework for building serverless applications—to deploy the OCSF transformation infrastructure. The infrastructure includes a transformation Lambda function, Kinesis data stream, IAM roles for the Lambda function and the hosts running the Kinesis Agent, and encryption keys for the Kinesis data stream. The Lambda function is configured to read events streamed into the Kinesis Data Stream and transform the data into OCSF based on the mapping configuration file. The transformed events are then written to an S3 bucket managed by Security Lake. A sample of the configuration file is provided in the solution repository capturing a subset of the events. You can extend the same for the remaining Sysmon events.

To deploy the infrastructure:

  1. Clone the solution codebase into your choice of integrated development environment (IDE). You can also use AWS CloudShell or AWS Cloud9.
  2. Sign in to the Security Lake delegated administrator account.
  3. Review the prerequisites and detailed deployment steps in the project’s README file. Use the SAM CLI to build and deploy the streaming infrastructure by running the following commands:
    sam build
    
    sam deploy –guided

Step 4: Update the default AWS Glue crawler

Sysmon logs are a complex use case because a single source of logs contains events mapped to multiple schemas. The transformation library handles this by writing each schema to different prefixes (folders) within the target Security Lake bucket. The AWS Glue crawler deployed by Security Lake for the custom log source must be updated to handle prefixes that contain differing schemas.

To update the default AWS Glue crawler:

  1. In the Security Lake delegated administrator account, navigate to the AWS Glue console.
  2. Navigate to Crawlers in the Data Catalog section. Search for the crawler associated with the custom source. It will have the same name as the custom source name. For example, windows-sysmon. Select the check box next to the crawler name, then choose Action and select Edit Crawler.

    Figure 2: Select and edit an AWS Glue crawler

    Figure 2: Select and edit an AWS Glue crawler

  3. Select Edit for the Step 2: Choose data sources and classifiers section on the Review and update page.
  4. In the Choose data sources and classifiers section, make the following changes:
    • For Is your data already mapped to Glue tables?, change the selection to Not yet.
    • For Data sources, select Add a data source. In the selection prompt, select the Security Lake S3 bucket location as presented in the output of the create-custom-source command above. For example, s3://aws-security-data-lake-<region><exampleid>/ext/windows-sysmon/. Make sure you include the path all the way to the custom source name and replace the <region> and <exampleid> placeholders with the actual values. Then choose Add S3 data source.
    • Choose Next.
    • On the Configure security settings page, leave everything as is and choose Next.
    • On the Set output and scheduling page, select the Target database as the Security Lake Glue database.
    • In a separate tab, navigate to AWS Glue > Tables. Copy the name of the custom source table created by Security Lake.
    • Navigate back to the AWS Glue crawler configuration tab, update the Table name prefix with the copied table name and add an underscore (_) at the end. For example, amazon_security_lake_table_ap_southeast_2_ext_windows_sysmon_.
    • Under Advanced options, select the checkbox for Create a single schema for each S3 path and for Table level enter 4.
    • Make sure you allow the crawler to enforce table schema to the partitions by selecting the Update all new and existing partitions with metadata from the table checkbox.
    • For the Crawler schedule section, select Monthly from the Frequency dropdown. For Minute, enter 0. This configuration will run the crawler every month.
    • Choose Next, then Update.
Figure 3: Set AWS Glue crawler output and scheduling

Figure 3: Set AWS Glue crawler output and scheduling

To configure hosts to stream log information:

As discussed in the Solution overview section, you use Kinesis Data Streams with a Lambda function to stream Sysmon logs and transform the information into OCSF.

  1. Install Kinesis Agent for Microsoft Windows. There are three ways to install Kinesis Agent on Windows Operating Systems. Using AWS Systems Manager helps automate the deployment and upgrade process. You can also install Kinesis Agent by using a Windows installer package or PowerShell scripts.
  2. After installation you must configure Kinesis Agent to stream log data to Kinesis Data Streams (you can use the following code for this). Kinesis Agent for Windows helps capture important metadata of the host system and enrich information streamed to the Kinesis Data Stream. The Kinesis Agent configuration file is located at %PROGRAMFILES%\Amazon\AWSKinesisTap\appsettings.json and includes three parts—sources, pipes, and sinks:
    • Sources are plugins that gather telemetry.
    • Sinks stream telemetry information to different AWS services, including but not limited to Amazon Kinesis.
    • Pipes connect a source to a sink.
    {
      "Sources": [
        {
          "Id": "Sysmon",
          "SourceType": "WindowsEventLogSource",
          "LogName": "Microsoft-Windows-Sysmon/Operational"
        }
      ],
      "Sinks": [
        {
          "Id": "SysmonLogStream",
          "SinkType": "KinesisStream",
          "StreamName": "<LogCollectionStreamName>",
          "ObjectDecoration": "source_instance_id={ec2:instance-id};",
          "Format": "json",
          "RoleARN": "<KinesisAgentIAMRoleARN>"
        }
      ],
      "Pipes": [
        {
           "Id": "JsonLogSourceToKinesisLogStream",
           "SourceRef": "Sysmon",
           "SinkRef": "SysmonLogStream"
        }
      ],
      "SelfUpdate": 0,
      "Telemetrics": { "off": "true" }
    }

    The preceding configuration shows the information flow through sources, pipes, and sinks using the Kinesis Agent for Windows. Use the sample configuration file provided in the solution repository. Observe the ObjectDecoration key in the Sink configuration; you can use this key to add key information to identify the generating system. For example, to identify whether the event is being generated by an Amazon Elastic Compute Cloud (Amazon EC2) instance or a hybrid server. This information can be used to map the Device attribute in the various OCSF classes such as File System Activity and Process Activity. The <KinesisAgentIAMRoleARN> is configured by the transformation library deployment unless you create your own IAM role and provide it as a parameter to the deployment.

    Update the Kinesis agent configuration file %PROGRAMFILES%\Amazon\AWSKinesisTap\appsettings.json with the contents of the kinesis_agent_configuration.json file from this repository. Make sure you replace the <LogCollectionStreamName> and <KinesisAgentIAMRoleARN> placeholders with the value of the CloudFormation outputs, LogCollectionStreamName and KinesisAgentIAMRoleARN, that you captured in the Deploy transformation infrastructure step.

  3. Start Kinesis Agent on the hosts to start streaming the logs to Security Lake buckets. Open an elevated PowerShell command prompt window, and start Kinesis Agent for Windows using the following PowerShell command:
    Start-Service -Name AWSKinesisTap

Pattern 2: Log collection from services and products using AWS Glue

You can use Amazon VPC to launch resources in an isolated network. AWS Network Firewall provides the capability to filter network traffic at the perimeter of your VPCs and define stateful rules to configure fine-grained control over network flow. Common Network Firewall use cases include intrusion detection and protection, Transport Layer Security (TLS) inspection, and egress filtering. Network Firewall supports multiple destinations for log delivery, including Amazon S3.

In this pattern, you focus on adding a custom source in Security Lake where the product in use delivers raw logs to an S3 bucket.

Solution overview

This solution uses an S3 bucket (the staging bucket) for raw log storage using the prerequisites defined earlier in this post. Use AWS Glue to configure the ETL and load the OCSF transformed logs into the Security Lake S3 bucket.

Figure 4: Architecture using AWS Glue for ETL

Figure 4: Architecture using AWS Glue for ETL

Figure 4 shows the architecture for this pattern. This pattern applies to AWS services or partner services that natively support log storage in S3 buckets. The solution starts by defining the OCSF mapping.

Mapping

Network firewall records two types of log information—alert logs and netflow logs. Alert logs report traffic that matches the stateful rules configured in your environment. Flow logs are network traffic flow logs that capture network traffic information for standard stateless rule groups. You can use stateful rules for use cases such as egress filtering to restrict the external domains that the resources deployed in a VPC in your AWS account have access to. In the Network Firewall use case, events can be mapped to various attributes in the Network Activity class in the Network Activity category.

Network firewall sample event: netflow log

{
    "firewall_name":"firewall",
    "availability_zone":"us-east-1b",
    "event_timestamp":"1601587565",
    "event":{
        "timestamp":"2020-10-01T21:26:05.007515+0000",
        "flow_id":1770453319291727,
        "event_type":"netflow",
        "src_ip":"45.129.33.153",
        "src_port":47047,
        "dest_ip":"172.31.16.139",
        "dest_port":16463,
        "proto":"TCP",
        "netflow":{
            "pkts":1,
            "bytes":60,
            "start":"2020-10-01T21:25:04.070479+0000",
            "end":"2020-10-01T21:25:04.070479+0000",
            "age":0,
            "min_ttl":241,
            "max_ttl":241
        },
        "tcp":{
            "tcp_flags":"02",
            "syn":true
        }
    }
}

Network firewall sample event: alert log

{
    "firewall_name":"firewall",
    "availability_zone":"zone",
    "event_timestamp":"1601074865",
    "event":{
        "timestamp":"2020-09-25T23:01:05.598481+0000",
        "flow_id":1111111111111111,
        "event_type":"alert",
        "src_ip":"10.16.197.56",
        "src_port":49157,
        "dest_ip":"10.16.197.55",
        "dest_port":8883,
        "proto":"TCP",
        "alert":{
            "action":"allowed",
            "signature_id":2,
            "rev":0,
            "signature":"",
            "category":"",
            "severity":3
        }
    }
}

The target mapping for the preceding alert logs is as follows:

Mapping for alert logs

OCSF Raw
app_name <firewall_name>
activity_id 6
activity_name Traffic
category_uid 4
category_name Network activity
class_uid 4001
type_uid 400106
class_name Network activity
dst_endpoint {ip: <event.dest_ip>, port: <event.dest_port>}
src_endpoint {ip: <event.src_ip>, port: <event.src_port>}
time <event.timestamp>
severity_id <event.alert.severity>
connection_info {uid: <event.flow_id>, protocol_name: <event.proto>}
cloud.provider AWS
metadata.profiles [cloud, firewall]
metadata.product.name AWS Network Firewall
metadata.product.feature.name Firewall
metadata.product.vendor_name AWS
severity High
unmapped {alert: {action: <event.alert.action>, signature_id: <event.alert.signature_id>, rev: <event.alert.rev>, signature: <event.alert.signature>, category: <event.alert.category>, tls_inspected: <event.alert.tls_inspected>}}

Mapping for netflow logs

OCSF Raw
app_name <firewall_name>
activity_id 6
activity_name Traffic
category_uid 4
category_name Network activity
class_uid 4001
type_uid 400106
class_name Network activity
dst_endpoint {ip: <event.dest_ip>, port: <event.dest_port>}
src_endpoint {ip: <event.src_ip>, port: <event.src_port>}
Time <event.timestamp>
connection_info {uid: <event.flow_id>, protocol_name: <event.proto>, tcp_flags: <event.tcp.tcp_flags>}
cloud.provider AWS
metadata.profiles [cloud, firewall]
metadata.product.name AWS Network Firewall
metadata.product.feature.name Firewall
metadata.product.vendor_name AWS
severity Informational
severity_id 1
start_time <event.netflow.start>
end_time <event.netflow.end>
Traffic {bytes: <event.netflow.bytes>, packets: <event.netflow.packets>}
Unmapped {availability_zone: <availability_zone>, event_type: <event.event_type>, netflow: {age: <event.netflow.age>, min_ttl: <event.netflow.min_ttl>, max_ttl: <event.netflow.max_ttl>}, tcp: {syn: <event.tcp.syn>, fin: <event.tcp.fin>, ack: <event.tcp.ack>, psh: <event.tcp.psh>}}

Solution implementation

The solution implementation is published in the AWS Samples GitHub repository titled amazon-security-lake-transformation-library in the Network Firewall instructions. Use the repository to deploy this pattern in your AWS account. The solution deployment is a four-step process:

  1. Update the mapping configuration
  2. Configure the log source to use Amazon S3 for log delivery
  3. Add a custom source in Security Lake
  4. Deploy the log staging and transformation infrastructure

Because Network Firewall logs can be mapped to a single OCSF class, you don’t need to update the AWS Glue crawler as in the previous pattern. However, you must update the AWS Glue crawler if you want to add a custom source with multiple OCSF classes.

Step 1: Update the mapping configuration

Each supported custom source documentation contains the mapping configuration. Update the mapping configuration for the Network Firewall custom source for the transformation function.

The mapping configuration can be found in the custom source instructions in the amazon-security-lake-transformation-library repository

Step 2: Configure the log source to use S3 for log delivery

Configure Network Firewall to log to Amazon S3. The transformation function infrastructure deploys a staging S3 bucket for raw log storage. If you already have an S3 bucket configured for raw log delivery, you can update the value of the parameter RawLogS3BucketName during deployment. The deployment configures event notifications with Amazon Simple Queue Service (Amazon SQS). The transformation Lambda function is invoked by SQS event notifications when Network Firewall delivers log files in the staging S3 bucket.

Step 3: Add a custom source in Security Lake

As with the previous pattern, add a custom source for Network Firewall in Security Lake. In the previous pattern you used the AWS CLI to create and configure the custom source. In this pattern, we take you through the steps to do the same using the AWS console.

To add a custom source:

  1. Open the Security Lake console
  2. In the navigation pane, select Custom sources.
  3. Then select Create custom source.

    Figure 5: Create a custom source

    Figure 5: Create a custom source

  4. Under Custom source details enter a name for the custom log source such as network_firewall and choose Network Activity as the OCSF Event class

    Figure 6: Data source name and OCSF Event class

    Figure 6: Data source name and OCSF Event class

  5. Under Account details, enter your AWS account ID for the AWS account ID and External ID fields. Leave Create and use a new service role selected and choose Create.

    Figure 7: Account details and service access

    Figure 7: Account details and service access

  6. The custom log source will now be available.

Step 4: Deploy transformation infrastructure

As with the previous pattern, use AWS SAM CLI to deploy the transformation infrastructure.

To deploy the transformation infrastructure:

  1. Clone the solution codebase into your choice of IDE.
  2. Sign in to the Security Lake delegated administrator account.
  3. The infrastructure is deployed using the AWS SAM, which is an open source framework for building serverless applications. Review the prerequisites and detailed deployment steps in the project’s README file. Use the SAM CLI to build and deploy the streaming infrastructure by running the following commands:
    sam build
    
    sam deploy --guided

Clean up

The resources created in the previous patterns can be cleaned up by running the following command:

sam delete

You also need to manually delete the custom source by following the instructions from the Security Lake User Guide.

Pattern 3: Log collection using integration with supported AWS services.

In a threat hunting and response use case, customers often use multiple sources of logs to correlate information to find more information on unauthorized third-party interactions originating from trusted software vendors. These interactions can be due to vulnerable components in the product or exposed credentials such as integration API keys. An operationally effective way to source logs from partner software and external vendors is to use the supported AWS services that natively integrate with Security Lake.

AWS Security Hub

AWS Security Hub is a cloud security posture measurement service that provides a comprehensive view of the security posture of your AWS environment. Security Hub supports integration with several AWS services including AWS Systems Manager Patch Manager, Amazon Macie, Amazon GuardDuty, and Amazon Inspector. For the full list, see AWS service integrations with AWS Security Hub. Security Hub also integrates with multiple third-party partner products that you can use. These products support sending findings to Security Hub seamlessly.

Security Lake natively supports ingestion of Security Hub findings, which centralizes the findings from the source integrations into Security Lake. Before you start building a custom source, we recommend you review whether the product is supported by Security Hub, which could remove the need for building manual mapping and transformation solutions.

AWS AppFabric

AWS AppFabric is a fully managed software as a service (SaaS) interoperability solution. Security Lake supports AppFabric output schema and format—OCSF and JSON respectively. Security Lake supports AppFabric as a custom source using Amazon Kinesis Data Firehose delivery stream. You can find step-by-step instructions in the AppFabric user guide.

Conclusion

Security Lake offers customers the capability to centralize disparate log sources in a single format, OCSF. Using OCSF improves correlation and enrichment activities because security teams no longer have to build queries based on the individual log source schema. Log data is normalized such that customers can use the same schema across the log data collected. Using the patterns and solution identified in this post, you can significantly reduce the effort involved in building custom sources to bring your own data into Security Lake.

You can extend the concepts and mapping function code provided in the amazon-security-lake-transformation-library to build out a log ingestion and ETL solution. You can use the flexibility offered by Security Lake and the custom source feature to ingest log data generated by all sources including third-party tools, log forwarding software, AWS services, and hybrid solutions.

In this post, we provided you with three patterns that you can use across multiple log sources. The most flexible being Pattern 1, where you can choose the OCSF mapped class and attributes that are in-line with your organizational mappings and custom source configuration with Security Lake. You can continue to use the mapping function code from the amazon-security-lake-transformation-library demonstrated through this post and update the mapping variable for the OCSF class you’re mapping to. This solution can be scaled to build a range of custom sources to enhance your threat detection and investigation workflow.

If you have feedback about this post, submit comments in the Comments section below. If you have questions about this post, contact AWS Support.

Pratima Singh

Pratima Singh
Pratima is a Security Specialist Solutions Architect with Amazon Web Services based out of Sydney, Australia. She is a security enthusiast who enjoys helping customers find innovative solutions to complex business challenges. Outside of work, Pratima enjoys going on long drives and spending time with her family at the beach.

Chris Lamont-Smith

Chris Lamont-Smith
Chris is a Senior Security Consultant working in the Security, Risk, and Compliance team for AWS ProServe based out of Perth, Australia. He enjoys working in the area where security and data analytics intersect and is passionate about helping customers gain actionable insights from their security data. When Chris isn’t working, he is out camping or off-roading with his family in the Australian bush.

Accelerate incident response with Amazon Security Lake

Post Syndicated from Jerry Chen original https://aws.amazon.com/blogs/security/accelerate-incident-response-with-amazon-security-lake/

This blog post is the first of a two-part series that will demonstrate the value of Amazon Security Lake and how you can use it and other resources to accelerate your incident response (IR) capabilities. Security Lake is a purpose-built data lake that centrally stores your security logs in a common, industry-standard format. In part one, we will first demonstrate the value Security Lake can bring at each stage of the National Institute of Standards and Technology (NIST) SP 800-61 Computer Security Incident Handling Guide. We will then demonstrate how you can configure Security Lake in a multi-account deployment by using the AWS Security Reference Architecture (AWS SRA).

In part two of this series, we’ll walk through an example to show you how to use Security Lake and other AWS services and tools to drive an incident to resolution.

At Amazon Web Services (AWS), security is our top priority. When security incidents occur, customers need the right capabilities to quickly investigate and resolve them. Security Lake enhances your capabilities, especially during the detection and analysis stages, which can reduce time to resolution and business impact. We also cover incident response specifically in the security pillar of the AWS Well-Architected Framework, provide prescriptive guidance on preparing for and handling incidents, and publish incident response playbooks.

Incident response life cycle

NIST SP 800-61 describes a set of steps you use to resolve an incident. These include preparation (Stage 1), detection and analysis (Stage 2), containment, eradication and recovery (Stage 3), and finally post-incident activities (Stage 4).

Figure 1 shows the workflow of incident response defined by NIST SP 800-61. The response flows from Stage 1 through Stage 4, with Stages 2 and 3 often being an iterative process. We will discuss the value of Security Lake at each stage of the NIST incident response handling process, with a focus on preparation, detection, and analysis.

Figure 1: NIST 800-61 incident response life cycle. Source: NIST 800-61

Figure 1: NIST 800-61 incident response life cycle. Source: NIST 800-61

Stage 1: Preparation

Preparation helps you ensure that tools, processes, and people are prepared for incident response. In some cases, preparation can also help you identify systems, networks, and applications that might not be sufficiently secure. For example, you might determine you need certain system logs for incident response, but discover during preparation that those logs are not enabled.

Figure 2 shows how Security Lake can accelerate the preparation stage during the incident response process. Through native integration with various security data sources from both AWS services and third-party tools, Security Lake simplifies the integration and concentration of security data, which also facilitates training and rehearsal for incident response.

Figure 2: Amazon Security Lake data consolidation for IR preparation

Figure 2: Amazon Security Lake data consolidation for IR preparation

Some challenges in the preparation stage include the following:

  • Insufficient incident response planning, training, and rehearsal – Time constraints or insufficient resources can slow down preparation.
  • Complexity of system integration and data sources – An increasing number of security data sources and integration points require additional integration effort, or increase risk that some log sources are not integrated.
  • Centralized log repository for mixed environments – Customers with both on-premises and cloud infrastructure told us that consolidating logs for those mixed environments was a challenge.

Security Lake can help you deal with these challenges in the following ways:

  • Simplify system integration with security data normalization
  • Streamline data consolidation across mixed environments
    • Security Lake supports multiple log sources, including AWS native services and custom sources, which include third-party partner solutions, other cloud platforms and your on-premises log sources. For example, see this blog post to learn how to ingest Microsoft Azure activity logs into Security Lake.
  • Facilitate IR planning and testing
    • Security Lake reduces the undifferentiated heavy lifting needed to get security data into tooling so teams spend less time on configuration and data extract, transform, and load (ETL) work and more time on preparedness.
    • With a purpose-built security data lake and data retention policies that you define, security teams can integrate data-driven decision making into their planning and testing, answering questions such as “which incident handling capabilities do we prioritize?” and running Well-Architected game days.

Stages 2 and 3: Detection and Analysis, Containment, Eradication and Recovery

The Detection and Analysis stage (Stage 2) should lead you to understand the immediate cause of the incident and what steps need to be taken to contain it. Once contained, it’s critical to fully eradicate the issue. These steps form Stage 3 of the incident response cycle. You want to ensure that those malicious artifacts or exploits are removed from systems and verify that the impacted service has recovered from the incident.

Figure 3 shows how Security Lake can enable effective detection and analysis. Doing so enables teams to quickly contain, eradicate, and recover from the incident. Security Lake natively integrates with other AWS analytics services, such as Amazon Athena, Amazon QuickSight, and Amazon OpenSearch Service, which makes it easier for your security team to generate insights on the nature of the incident and to take relevant remediation steps.

Figure 3: Amazon Security Lake accelerates IR Detection and Analysis, Containment, Eradication, and Recovery

Figure 3: Amazon Security Lake accelerates IR Detection and Analysis, Containment, Eradication, and Recovery

Common challenges present in stages 2 and 3 include the following:

  • Challenges generating insights from disparate data sources
    • Inability to generate insights from security data means teams are less likely to discover an incident, as opposed to having the breach revealed to them by a third party (such as a threat actor).
    • Breaches disclosed by a threat actor might involve higher costs than incidents discovered by the impacted organizations themselves, because typically the unintended access has progressed for longer and impacted more resources and data than if the impacted organization discovered it sooner.
  • Inconsistency of data visibility and data siloing
    • Security log data silos may slow IR data analysis because it’s challenging to gather and correlate the necessary information to understand the full scope and impact of an incident. This can lead to delays in identifying the root cause, assessing the damage, and taking remediation steps.
    • Data silos might also mean additional permissions management overhead for administrators.
  • Disparate data sources add barriers to adopting new technology, such as AI-driven security analytics tools
    • AI-driven security analysis requires a large amount of security data from various data sources, which might be in disparate formats. Without a centralized security data repository, you might need to make additional effort to ingest and normalize data for model training.

Security Lake offers native support for log ingestion for a range of AWS security services, including AWS CloudTrail, AWS Security Hub, and VPC Flow Logs. Additionally, you can configure Security Lake to ingest external sources. This helps enrich findings and alerts.

Security Lake addresses the preceding challenges as follows:

  • Unleash security detection capability by centralizing detection data
    • With a purpose-built security data lake with a standard object schema, organizations can centrally access their security data—AWS and third-party—using the same set of IR tools. This can help you investigate incidents that involve multiple resources and complex timelines, which could require access logs, network logs, and other security findings. For example, use Amazon Athena to query all your security data. You can also build a centralized security finding dashboard with Amazon QuickSight.
  • Reduce management burden
    • With Security Lake, permissions complexity is reduced. You use the same access controls in AWS Identity and Access Management (IAM) to make sure that only the right people and systems have access to sensitive security data.

See this blog post for more details on generating machine learning insights for Security Lake data by using Amazon SageMaker.

Stage 4: Post-Incident Activity

Continuous improvement helps customers to further develop their IR capabilities. Teams should integrate lessons learned into their tools, policies, and processes. You decide on lifecycle policies for your security data. You can then retroactively review event data for insight and to support lessons learned. You can also share security telemetry at levels of granularity you define. Your organization can then establish distributed data views for forensic purposes and other purposes, while enforcing least privilege for data governance.

Figure 4 shows how Security Lake can accelerate the post-incident activity stage during the incident response process. Security Lake natively integrates with AWS Organizations to enable data sharing across various OUs within the organization, which further unleashes the power of machine learning to automatically create insights for incident response.

Figure 4: Security Lake accelerates post-incident activity

Figure 4: Security Lake accelerates post-incident activity

Having covered some advantages of working with your data in Security Lake, we will now demonstrate best practices for getting Security Lake set up.

Setting up for success with Security Lake

Most of the customers we work with run multiple AWS accounts, usually with AWS Organizations. With that in mind, we’re going to show you how to set up Security Lake and related tooling in line with guidance in the AWS Security Reference Architecture (AWS SRA). The AWS SRA provides guidance on how to deploy AWS security services in a multi-account environment. You will have one AWS account for security tooling and a different account to centralize log storage. You’ll run Security Lake in this log storage account.

If you just want to use Security Lake in a standalone account, follow these instructions.

Set up Security Lake in your logging account

Most of the instructions we link to in this section describe the process using either the console or AWS CLI tools. Where necessary, we’ve described the console experience for illustrative purposes.

The AmazonSecurityLakeAdministrator AWS managed IAM policy grants the permissions needed to set up Security Lake and related services. Note that you may want to further refine permissions, or remove that managed policy after Security Lake and the related services are set up and running.

To set up Security Lake in your logging account

  1. Note down the AWS account number that will be your delegated administrator account. This will be your centralized archive logs account. In the AWS Management Console, sign in to your Organizations management account and set up delegated administration for Security Lake.
  2. Sign in to the delegated administrator account, go to the Security Lake console, and choose Get started. Then follow these instructions from the Security Lake User Guide. While you’re setting this up, note the following specific guidance (this will make it easier to follow the second blog post in this series):

    Define source objective: For Sources to ingest, we recommend that you select Ingest the AWS default sources. However, if you want to include S3 data events, you’ll need to select Ingest specific AWS sources and then select CloudTrail – S3 data events. Note that we use these events for responding to the incident in blog post part 2, when we really drill down into user activity.

    Figure 5 shows the configuration of sources to ingest in Security Lake.

    Figure 5: Sources to ingest in Security Lake

    Figure 5: Sources to ingest in Security Lake

    We recommend leaving the other settings on this page as they are.

    Define target objective: We recommend that you choose Add rollup Region and add multiple AWS Regions to a designated rollup Region. The rollup Region is the one to which you will consolidate logs. The contributing Region is the one that will contribute logs to the rollup Region.

    Figure 6 shows how to select the rollup regions.

    Figure 6: Select rollup Regions

    Figure 6: Select rollup Regions

You now have Security Lake enabled, and in the background, additional services such as AWS Lake Formation and AWS Glue have been configured to organize your Security Lake data.

Now you need to configure a subscriber with query access so that you can query your Security Lake data. Here are a few recommendations:

  1. Subscribers are specific to a Region, so you want to make sure that you set up your subscriber in the same Region as your rollup Region.
  2. You will also set up an External ID. This is a value you define, and it’s used by the IAM role to prevent the confused deputy problem. Note that the subscriber will be your security tooling account.
  3. You will select Lake Formation for Data access, which will create shares in AWS Resource Access Manager (AWS RAM) that will be shared with the account that you specified in Subscriber credentials.
  4. If you’ve already set up Security Lake at some time in the past, you should select Specific log and event sources and confirm the source and version you want the subscriber to access. If it’s a new implementation, we recommend using version 2.0 or greater.
  5. There’s a note in the console that says the subscribing account will need to accept the RAM resource shares. However, if you’re using AWS Organizations, you don’t need to do that; the resource share will already list a status of Active when you select the Shared with me >> Resource shares in the subscriber (security tooling) account RAM console.

Note: If you prefer a visual guide, you can refer to this video to set up Security Lake in AWS Organizations.

Set up Amazon Athena and AWS Lake Formation in the security tooling account

If you go to Athena in your security tooling account, you won’t see your Security Lake tables yet because the tables are shared from the Security Lake account. Although services such as Amazon Athena can’t directly access databases or tables across accounts, the use of resource links overcomes this challenge.

To set up Athena and Lake Formation

  1. Go to the Lake Formation console in the security tooling account and follow the instructions to create resource links for the shared Security Lake tables. You’ll most likely use the Default database and will see your tables there. The table names in that database start with amazon_security_lake_table. You should expect to see about eight tables there.

    Figure 7 shows the shared tables in the Lake Formation service console.

    Figure 7: Shared tables in Lake Formation

    Figure 7: Shared tables in Lake Formation

    You will need to create resource links for each table, as described in the instructions from the Lake Formation Developer Guide.

    Figure 8 shows the resource link creation process.

    Figure 8: Creating resource links

    Figure 8: Creating resource links

  2. Next, go to Amazon Athena in the same Region. If Athena is not set up, follow the instructions to get it set up for SQL queries. Note that you won’t need to create a database—you’re going to use the “default” database that already exists. Select it from the Database drop-down menu in the Query editor view.
  3. In the Tables section, you should see all your Security Lake tables (represented by whatever names you gave them when you created the resource links in step 1, earlier).

Get your incident response playbooks ready

Incident response playbooks are an important tool that enable responders to work more effectively and consistently, and enable the organization to get incidents resolved more quickly. We’ve created some ready-to-go templates to get you started. You can further customize these templates to meet your needs. In part two of this post, you’ll be using the Unintended Data Access to an Amazon Simple Storage Service (Amazon S3) bucket playbook to resolve an incident. You can download that playbook so that you’re ready to follow it to get that incident resolved.

Conclusion

This is the first post in a two-part series about accelerating security incident response with Security Lake. We highlighted common challenges that decelerate customers’ incident responses across the stages outlined by NIST SP 800-61 and how Security Lake can help you address those challenges. We also showed you how to set up Security Lake and related services for incident response.

In the second part of this series, we’ll walk through a specific security incident—unintended data access—and share prescriptive guidance on using Security Lake to accelerate your incident response process.

 
If you have feedback about this post, submit comments in the Comments section below. If you have questions about this post, contact AWS Support.

Want more AWS Security news? Follow us on Twitter.

Jerry Chen

Jerry Chen

Jerry is currently a Senior Cloud Optimization Success Solutions Architect at AWS. He focuses on cloud security and operational architecture design for AWS customers and partners. You can follow Jerry on LinkedIn.

Frank Phillis

Frank Phillis

Frank is a Senior Solutions Architect (Security) at AWS. He enables customers to get their security architecture right. Frank specializes in cryptography, identity, and incident response. He’s the creator of the popular AWS Incident Response playbooks and regularly speaks at security events. When not thinking about tech, Frank can be found with his family, riding bikes, or making music.

Navigating the threat detection and incident response track at re:Inforce 2024

Post Syndicated from Nisha Amthul original https://aws.amazon.com/blogs/security/navigating-the-threat-detection-and-incident-response-track-at-reinforce-2024/

reInforce 2024 blog

A full conference pass is $1,099. Register today with the code flashsale150 to receive a limited time $150 discount, while supplies last.

We’re counting down to AWS re:Inforce, our annual cloud security event! We are thrilled to invite security enthusiasts and builders to join us in Philadelphia, PA, from June 10–12 for an immersive two-and-a-half-day journey into cloud security learning. This year, we’ve expanded the event by half a day to give you more opportunities to delve into the latest security trends and technologies. At AWS re:Inforce, you’ll have the chance to explore the breadth of the Amazon Web Services (AWS) security landscape, learn how to operationalize security services, and enhance your skills and confidence in cloud security to improve your organization’s security posture. As an attendee, you will have access to over 250 sessions across multiple topic tracks, including data protection; identity and access management; threat detection and incident response; network and infrastructure security; generative AI; governance, risk, and compliance; and application security. Plus, get ready to be inspired by our lineup of customer speakers, who will share their firsthand experiences of innovating securely on AWS.

In this post, we’ll provide an overview of the key sessions that include lecture-style presentations featuring real-world use cases from our customers, as well as the interactive small-group sessions led by AWS experts that guide you through practical problems and solutions.

The threat detection and incident response track is designed to demonstrate how to detect and respond to security risks to help protect workloads at scale. AWS experts and customers will present key topics such as threat detection, vulnerability management, cloud security posture management, threat intelligence, operationalization of AWS security services, container security, effective security investigation, incident response best practices, and strengthening security through the use of generative AI and securing generative AI workloads.

Breakout sessions, chalk talks, and lightning talks

TDR201 | Breakout session | How NatWest uses AWS services to manage vulnerabilities at scale
As organizations move to the cloud, rapid change is the new normal. Safeguarding against potential security threats demands continuous monitoring of cloud resources and code that are constantly evolving. In this session, NatWest shares best practices for monitoring their AWS environment for software and configuration vulnerabilities at scale using AWS security services like Amazon Inspector and AWS Security Hub. Learn how security teams can automate the identification and prioritization of critical security insights to manage alert fatigue and swiftly collaborate with application teams for remediation.

TDR301 | Breakout session | Developing an autonomous framework with Security Lake & Torc Robotics
Security teams are increasingly seeking autonomy in their security operations. Amazon Security Lake is a powerful solution that allows organizations to centralize their security data across AWS accounts and Regions. In this session, learn how Security Lake simplifies centralizing and operationalizing security data. Then, hear from Torc Robotics, a leading autonomous trucking company, as they share their experience and best practices for using Security Lake to establish an autonomous security framework.

TDR302 | Breakout session | Detecting and responding to threats in generative AI workloads
While generative AI is an emerging technology, many of the same services and concepts can be used for threat detection and incident response. In this session, learn how you can build out threat detection and incident response capabilities for a generative AI workload that uses Amazon Bedrock. Find out how to effectively monitor this workload using Amazon Bedrock, Amazon GuardDuty, and AWS Security Hub. The session also covers best practices for responding to and remediating security issues that may come up.

TDR303 | Breakout session | Innovations in AWS detection and response services
In this session, learn about the latest advancements and recent AWS launches in the field of detection and response. This session focuses on use cases like threat detection, workload protection, automated and continual vulnerability management, centralized monitoring, continuous cloud security posture management, unified security data management, and discovery and protection of workloads and data. Through these use cases, gain a deeper understanding of how you can seamlessly integrate AWS detection and response services to help protect your workloads at scale, enhance your security posture, and streamline security operations across your entire AWS environment.

TDR304 | Breakout session | Explore cloud workload protection with GuardDuty, feat. Booking.com
Monitoring your workloads at runtime allows you to detect unexpected activity sooner—before it escalates to broader business-impacting security issues. Amazon GuardDuty Runtime Monitoring offers fully managed threat detection that gives you end-to-end visibility across your AWS environment. GuardDuty’s unique detection capabilities are guided by AWS’s visibility into the cloud threat landscape. In this session, learn why AWS built the Runtime Monitoring feature and how it works. Also discover how Booking.com used GuardDuty for runtime protection, supporting their mission to make it easier for everyone to experience the world.

TDR305 | Breakout session | Cyber threat intelligence sharing on AWS
Real-time, contextual, and comprehensive visibility into security issues is essential for resilience in any organization. In this session, join the Australian Cyber Security Centre (ACSC) as they present their Cyber Threat Intelligence Sharing (CTIS) program, built on AWS. With the aim to improve the cyber resilience of the Australian community and help make Australia the most secure place to connect online, the ACSC protects Australia from thousands of threats every day. Learn the technical fundamentals that can help you apply best practices for real-time, bidirectional sharing of threat intelligence across all sectors.

TDR331 | Chalk talk | Unlock OCSF: Turn raw logs into insights with generative AI
So, you have security data stored using the Open Cybersecurity Schema Framework (OCSF)—now what? In this chalk talk, learn how to use AWS analytics tools to mine data stored using the OCSF and leverage generative AI to consume insights. Discover how services such as Amazon Athena, Amazon Q in QuickSight, and Amazon Bedrock can extract, process, and visualize security insights from OCSF data. Gain practical skills to identify trends, detect anomalies, and transform your OCSF data into actionable security intelligence that can help your organization respond more effectively to cybersecurity threats.

TDR332 | Chalk talk | Anatomy of a ransomware event targeting data within AWS
Ransomware events can interrupt operations and cost governments, nonprofits, and businesses billions of dollars. Early detection and automated responses are important mechanisms that can help mitigate your organization’s exposure. In this chalk talk, learn about the anatomy of a ransomware event targeting data within AWS including detection, response, and recovery. Explore the AWS services and features that you can use to protect against ransomware events in your environment, and learn how you can investigate possible ransomware events if they occur.

TDR333 | Chalk talk | Implementing AWS security best practices: Insights and strategies
Have you ever wondered if you are using AWS security services such as Amazon GuardDuty, AWS Security Hub, AWS WAF, and others to the best of their ability? Do you want to dive deep into common use cases to better operationalize AWS security services through insights developed via thousands of deployments? In this chalk talk, learn tips and tricks from AWS experts who have spent years talking to users and documenting guidance outlining AWS security services best practices.

TDR334 | Chalk talk | Unlock your security superpowers with generative AI
Generative AI can accelerate and streamline the process of security analysis and response, enhancing the impact of your security operations team. Its unique ability to combine natural language processing with large existing knowledge bases and agent-based architectures that can interact with your data and systems makes it an ideal tool for augmenting security teams during and after an event. In this chalk talk, explore how generative AI will shape the future of the SOC and lead to new capabilities in incident response and cloud security posture management.

TDR431 | Chalk talk | Harnessing generative AI for investigation and remediation
To help businesses move faster and deliver security outcomes, modern security teams need to identify opportunities to automate and simplify their workflows. One way of doing so is through generative AI. Join this chalk talk to learn how to identify use cases where generative AI can help with investigating, prioritizing, and remediating findings from Amazon GuardDuty, Amazon Inspector, and AWS Security Hub. Then find out how you can develop architectures from these use cases, implement them, and evaluate their effectiveness. The talk offers tenets for generative AI and security that can help you safely use generative AI to reduce cognitive load and increase focus on novel, high-value opportunities.

TDR432 | Chalk talk | New tactics and techniques for proactive threat detection
This insightful chalk talk is led by the AWS Customer Incident Response Team (CIRT), the team responsible for swiftly responding to security events on the customer side of the AWS Shared Responsibility Model. Discover the latest trends in threat tactics and techniques observed by the CIRT, along with effective detection and mitigation strategies. Gain valuable insights into emerging threats and learn how to safeguard your organization’s AWS environment against evolving security risks.

TDR433 | Chalk talk | Incident response for multi-account and federated environments
In this chalk talk, AWS security experts guide you through the lifecycle of a compromise involving federation and third-party identity providers. Learn how AWS detects unauthorized access and which approaches can help you respond to complex situations involving organizations with multiple accounts. Discover insights into how you can contain and recover from security events and discuss strong IAM policies, appropriately restrictive service control policies, and resource termination for security event containment. Also, learn how to build resiliency in an environment with IAM permission refinement, organizational strategy, detective controls, chain of custody, and IR break-glass models.

TDR227 | Lightning talk | How Razorpay scales threat detection using AWS
Discover how Razorpay, a leading payment aggregator solution provider authorized by the Reserve Bank of India, efficiently manages millions of business transactions per minute through automated security operations using AWS security services. Join this lightning talk to explore how Razorpay’s security operations team uses AWS Security Hub, Amazon GuardDuty, and Amazon Inspector to monitor their critical workloads on AWS. Learn how they orchestrate complex workflows, automating responses to security events, and reduce the time from detection to remediation.

TDR321 | Lightning talk | Scaling incident response with AWS developer tools
In incident response, speed matters. Responding to incidents at scale can be challenging as the number of resources in your AWS accounts increases. In this lightning talk, learn how to use SDKs and the AWS Command Line Interface (AWS CLI) to rapidly run commands across your estate so you can quickly retrieve data, identify issues, and resolve security-related problems.

TDR322 | Lightning talk | How Snap Inc. secures its services with Amazon GuardDuty
In this lightning talk, discover how Snap Inc. established a secure multi-tenant compute platform on AWS and mitigated security challenges within shared Kubernetes clusters. Snap uses Amazon GuardDuty and the OSS tool Falco for runtime protection across build time, deployment time, and runtime phases. Explore Snap’s techniques for facilitating one-time cluster access through AWS IAM Identity Center. Find out how Snap has implemented isolation strategies between internal tenants using the Pod Security Standards (PSS) and network policies enforced by the Amazon VPC Container Network Interface (CNI) plugin.

TDR326 | Lightning talk | Streamlining security auditing with generative AI
For identifying and responding to security-related events, collecting and analyzing logs is only the first step. Beyond this initial phase, you need to utilize tools and services to parse through logs, understand baseline behaviors, identify anomalies, and create automated responses based on the type of event. In this lightning talk, learn how to effectively parse security logs, identify anomalies, and receive response runbooks that you can implement within your environment.

Interactive sessions (builders’ sessions, code talks, and workshops)

TDR351 | Builders’ session | Accelerating incident remediation with IR playbooks & Amazon Detective
In this builders’ session, learn how to investigate incidents more effectively and discover root cause with Amazon Detective. Amazon Detective provides finding-group summaries by using generative AI to automatically analyze finding groups. Insights in natural language then help you accelerate security investigations. Find out how you can create your own incident response playbooks and test them by handling multi-event security issues.

TDR352 | Builders’ session | How to automate containment and forensics for Amazon EC2
Automated Forensics Orchestrator for Amazon EC2 deploys a mechanism that uses AWS services to orchestrate and automate key digital forensics processes and activities for Amazon EC2 instances in the event of a potential security issue being detected. In this builders’ session, learn how to deploy and scale this self-service AWS solution. Explore the prerequisites, learn how to customize it for your environment, and experience forensic analysis on live artifacts to identify what potential unauthorized users could do in your environment.

TDR353 | Builders’ session | Preventing top misconfigurations associated with security events
Have you ever wondered how you can prevent top misconfigurations that could lead to a security event? Join this builders’ session, where the AWS Customer Incident Response Team (CIRT) reviews some of the most commonly observed misconfigurations that can lead to security events. Then learn how to build mechanisms using AWS Security Hub and other AWS services that can help detect and prevent these issues.

TDR354 | Builders’ session | Insights in your inbox: Build email reporting with AWS Security Hub
AWS Security Hub provides you with a comprehensive view of the security state of your AWS resources by collecting security data from across AWS accounts, AWS Regions, and AWS services. In this builders’ session, learn how to set up a customizable and automated summary email that distills security posture information, insights, and critical findings from Security Hub. Get hands-on with the Security Hub console and discover easy-to-implement code examples that you can use in your own organization to drive security improvements.

TDR355 | Builders’ session | Detecting ransomware and suspicious activity in Amazon RDS
In this builders’ session, acquire skills that can help you detect and respond to threats targeting AWS databases. Using services such as AWS Cloud9 and AWS CloudFormation, simulate real-world intrusions on Amazon RDS and Amazon Aurora and use Amazon Athena to detect unauthorized activities. The session also covers strategies from the AWS Customer Incident Response Team (CIRT) for rapid incident response and configuring essential security settings to enhance your database defenses. The session provides practical experience in configuring audit logging and enabling termination protection to ensure robust database security measures.

TDR451 | Builders’ session | Create a generative AI runbook to resolve security findings
Generative AI has the potential to accelerate and streamline security analysis, response, and recovery, enhancing the effectiveness of human engagement. In this builders’ session, learn how to use Amazon SageMaker notebooks and Amazon Bedrock to quickly resolve security findings in your AWS account. You rely on runbooks for the day-to-day operations, maintenance, and troubleshooting of AWS services. With generative AI, you can gain deeper insights into security findings and take the necessary actions to streamline security analysis and response.

TDR441 | Code talk | How to use generative AI to gain insights in Amazon Security Lake
In this code talk, explore how you can use generative AI to gather enhanced security insights within Amazon Security Lake by integrating Amazon SageMaker Studio and Amazon Bedrock. Learn how AI-powered analytics can help rapidly identify and respond to security threats. By using large language models (LLMs) within Amazon Bedrock to process natural language queries and auto-generate SQL queries, you can expedite security investigations, focusing on relevant data sources within Security Lake. The talk includes a threat analysis exercise to demonstrate the effectiveness of LLMs in addressing various security queries. Learn how you can streamline security operations and gain actionable insights to strengthen your security posture and mitigate risks effectively within AWS environments.

TDR442 | Code talk | Security testing, the practical way
Join this code talk for a practical demonstration of how to test security capabilities within AWS. The talk can help you evaluate and quantify your detection and response effectiveness against key metrics like mean time to detect and mean time to resolution. Explore testing techniques that use open source tools alongside AWS services such as Amazon GuardDuty and AWS WAF. Gain insights into testing your security configurations in your environment and uncover best practices tailored to your testing scenarios. This talk equips you with actionable strategies to enhance your security posture and establish robust defense mechanisms within your AWS environment.

TDR443 | Code talk | How to conduct incident response in your Amazon EKS environment
Join this code talk to gain insights from both adversaries’ and defenders’ perspectives as AWS experts simulate a live security incident within an application across multiple Amazon EKS clusters, invoking an alert in Amazon GuardDuty. Witness the incident response process as experts demonstrate detection, containment, and recovery procedures in near real time. Through this immersive experience, learn how you can effectively respond to and recover from Amazon EKS–specific incidents, and gain valuable insights into incident handling within cloud environments. Don’t miss this opportunity to enhance your incident response capabilities and learn how to more effectively safeguard your AWS infrastructure.

TDR444 | Code talk | Identity forensics in the realm of short-term credentials
AWS Security Token Service (AWS STS) is a common way for users to access AWS services and allows you to utilize role chaining for navigating AWS accounts. When investigating security incidents, understanding the history and potential impact is crucial. Examining a single session is often insufficient because the initial abused credential may be different than the one that precipitated the investigation, and other tokens might be generated. Also, a single session investigation may not encompass all permissions that the adversary controls, due to trust relationships between the roles. In this code talk, learn how you can construct identity forensics capabilities using Amazon Detective and create a custom graph database using Amazon Neptune.

TDR371-R | Workshop | Threat detection and response on AWS
Join AWS experts for an immersive threat detection and response workshop using Amazon GuardDuty, Amazon Inspector, AWS Security Hub, and Amazon Detective. This workshop simulates security events for different types of resources and behaviors and illustrates both manual and automated responses with AWS Lambda. Dive in and learn how to improve your security posture by operationalizing threat detection and response on AWS.

TDR372-R | Workshop | Container threat detection and response with AWS security services
Join AWS experts for an immersive container security workshop using AWS threat detection and response services. This workshop simulates scenarios and security events that may arise while using Amazon ECS and Amazon EKS. The workshop also demonstrates how to use different AWS security services to detect and respond to potential security threats, as well as suggesting how you can improve your security practices. Dive in and learn how to improve your security posture when running workloads on AWS container orchestration services.

TDR373-R | Workshop | Vulnerability management with Amazon Inspector and Jenkins
Join AWS experts for an immersive vulnerability management workshop using Amazon Inspector and Jenkins for continuous integration and continuous delivery (CI/CD). This workshop takes you through approaches to vulnerability management with Amazon Inspector for EC2 instances, container images residing in Amazon ECR and within CI/CD tools, and AWS Lambda functions. Explore the integration of Amazon Inspector with Jenkins, and learn how to operationalize vulnerability management on AWS.

Browse the full re:Inforce catalog to learn more about sessions in other tracks, plus gamified learning, innovation sessions, partner sessions, and labs.

Our comprehensive track content is designed to help arm you with the knowledge and skills needed to securely manage your workloads and applications on AWS. Don’t miss out on the opportunity to stay updated with the latest best practices in threat detection and incident response. Join us in Philadelphia for re:Inforce 2024 by registering today. We can’t wait to welcome you!

If you have feedback about this post, submit comments in the Comments section below. If you have questions about this post, contact AWS Support.

Nisha Amthul

Nisha Amthul

Nisha is a Senior Product Marketing Manager at AWS Security, specializing in detection and response solutions. She has a strong foundation in product management and product marketing within the domains of information security and data protection. When not at work, you’ll find her cake decorating, strength training, and chasing after her two energetic kiddos, embracing the joys of motherhood.

Investigating lateral movements with Amazon Detective investigation and Security Lake integration

Post Syndicated from Yue Zhu original https://aws.amazon.com/blogs/security/investigating-lateral-movements-with-amazon-detective-investigation-and-security-lake-integration/

According to the MITRE ATT&CK framework, lateral movement consists of techniques that threat actors use to enter and control remote systems on a network. In Amazon Web Services (AWS) environments, threat actors equipped with illegitimately obtained credentials could potentially use APIs to interact with infrastructures and services directly, and they might even be able to use APIs to evade defenses and gain direct access to Amazon Elastic Compute Cloud (Amazon EC2) instances. To help customers secure their AWS environments, AWS offers several security services, such as Amazon GuardDuty, a threat detection service that monitors for malicious activity and anomalous behavior, and Amazon Detective, an investigation service that helps you investigate, and respond to, security events in your AWS environment.

After the service is turned on, Amazon Detective automatically collects logs from your AWS environment to help you analyze and investigate security events in-depth. At re:Invent 2023, Detective released Detective Investigations, a one-click investigation feature that automatically investigates AWS Identity and Access Management (IAM) users and roles for indicators of compromise (IoC), and Security Lake integration, which enables customers to retrieve log data from Amazon Security Lake to use as original evidence for deeper analysis with access to more detailed parameters.

In this post, you will learn about the use cases behind these features, how to run an investigation using the Detective Investigation feature, and how to interpret the contents of investigation reports. In addition, you will also learn how to use the Security Lake integration to retrieve raw logs to get more details of the impacted resources.

Triage a suspicious activity

As a security analyst, one of the common workflows in your daily job is to respond to suspicious activities raised by security event detection systems. The process might start when you get a ticket about a GuardDuty finding in your daily operations queue, alerting you that suspicious or malicious activity has been detected in your environment. To view more details of the finding, one of the options is to use the GuardDuty console.

In the GuardDuty console, you will find more details about the finding, such as the account and AWS resources that are in scope, the activity that caused the finding, the IP address that caused the finding and information about its possible geographic location, and times of the first and last occurrences of the event. To triage the finding, you might need more information to help you determine if it is a false positive.

Every GuardDuty finding has a link labeled Investigate with Detective in the details pane. This link allows you to pivot to the Detective console based on aspects of the finding you are investigating to their respective entity profiles. The finding Recon:IAMUser/MaliciousIPCaller.Custom that’s shown in Figure 1 results from an API call made by an IP address that’s on the custom threat list, and GuardDuty observed it made API calls that were commonly used in reconnaissance activity, which commonly occurs prior to attempts at compromise. To investigate this finding, because it involves an IAM role, you can select the Role session link and it will take you to the role session’s profile in the Detective console.

Figure 1: Example finding in the GuardDuty console, with Investigate with Detective pop-up window

Figure 1: Example finding in the GuardDuty console, with Investigate with Detective pop-up window

Within the AWS Role session profile page, you will find security findings from GuardDuty and AWS Security Hub that are associated with the AWS role session, API calls the AWS role session made, and most importantly, new behaviors. Behaviors that deviate from expectations can be used as indicators of compromises to give you more information to determine if the AWS resource might be compromised. Detective highlights new behaviors first observed during the scope time of the events related to the finding that weren’t observed during the Detective baseline time window of 45 days.

If you switch to the New behavior tab within the AWS role session profile, you will find the Newly observed geolocations panel (Figure 2). This panel highlights geolocations of IP addresses where API calls were made from that weren’t observed in the baseline profile. Detective determines the location of requests using MaxMind GeoIP databases based on the IP address that was used to issue requests.

Figure 2: Detective’s Newly observed geolocations panel

Figure 2: Detective’s Newly observed geolocations panel

If you choose Details on the right side of each row, the row will expand and provide details of the API calls made from the same locations from different AWS resources, and you can drill down and get to the API calls made by the AWS resource from a specific geolocation (Figure 3). When analyzing these newly observed geolocations, a question you might consider is why this specific AWS role session made API calls from Bellevue, US. You’re pretty sure that your company doesn’t have a satellite office there, nor do your coworkers who have access to this role work from there. You also reviewed the AWS CloudTrail management events of this AWS role session, and you found some unusual API calls for services such as IAM.

Figure 3: Detective’s Newly observed geolocations panel expanded on details

Figure 3: Detective’s Newly observed geolocations panel expanded on details

You decide that you need to investigate further, because this role session’s anomalous behavior from a new geolocation is sufficiently unexpected, and it made unusual API calls that you would like to know the purpose of. You want to gather anomalous behaviors and high-risk API methods that can be used by threat actors to make impacts. Because you’re investigating an AWS role session rather than investigating a single role session, you decide you want to know what happened in other role sessions associated with the AWS role in case threat actors spread their activities across multiple sessions. To help you examine multiple role sessions automatically with additional analytics and threat intelligence, Detective introduced the Detective Investigation feature at re:Invent 2023.

Run an IAM investigation

Amazon Detective Investigation uses machine learning (ML) models and AWS threat intelligence to automatically analyze resources in your AWS environment to identify potential security events. It identifies tactics, techniques, and procedures (TTPs) used in a potential security event. The MITRE ATT&CK framework is used to classify the TTPs. You can use this feature to help you speed up the investigation and identify indicators of compromise and other TTPs quickly.

To continue with your investigation, you should investigate the role and its usage history as a whole to cover all involved role sessions at once. This addresses the potential case where threat actors assumed the same role under different session names. In the AWS role session profile page that’s shown in Figure 4, you can quickly identify and pivot to the corresponding AWS role profile page under the Assumed role field.

Figure 4: Detective’s AWS role session profile page

Figure 4: Detective’s AWS role session profile page

After you pivot to the AWS role profile page (Figure 5), you can run the automated investigations by choosing Run investigation.

Figure 5: Role profile page, from which an investigation can be run

Figure 5: Role profile page, from which an investigation can be run

The first thing to do in a new investigation is to choose the time scope you want to run the investigation for. Then, choose Confirm (Figure 6).

Figure 6: Setting investigation scope time

Figure 6: Setting investigation scope time

Next, you will be directed to the Investigations page (Figure 7), where you will be able to see the status of your investigation. Once the investigation is done, you can choose the hyperlinked investigation ID to access the investigation report.

Figure 7: Investigations page, with new report

Figure 7: Investigations page, with new report

Another way to run an investigation is to choose Investigations on the left menu panel in the Detective console, and then choose Run investigation. You will then be taken to the page where you will specify the AWS role Amazon Resource Number (ARN) you’re investigating, and the scope time (Figure 8). Then you can choose Run investigation to commence an investigation.

Figure 8: Configuring a new investigation from scratch rather than from an existing finding

Figure 8: Configuring a new investigation from scratch rather than from an existing finding

Detective also offers StartInvestigation and GetInvestigation APIs for running Detective Investigations and retrieving investigation reports programmatically.

Interpret the investigation report

The investigation report (Figure 9) includes information on anomalous behaviors, potential TTP mappings of observed CloudTrail events, and indicators of compromises of the resource (in this example, an IAM principal) that was investigated.

At the top of the report, you will find a severity level computed based on the observed behaviors during the scope window, as well as a summary statement to give you a quick understanding of what was found. In Figure 9, the AWS role that was investigated engaged in the following unusual behaviors:

  • Seven tactics showing that the API calls made by this AWS role were mapped to seven tactics of the MITRE ATT&CK framework.
  • Eleven cases of impossible travel representing API calls made from two geolocations that are too far apart for the same user to have physically travelled between them to make the calls from both, within the time span involved.
  • Zero flagged IP addresses. Detective would flag IP addresses that are considered suspicious according to its threat intelligence sources.
  • Two new Autonomous System Organizations (ASOs) which are entities with assigned Autonomous System Numbers (ASNs) as used in Border Gateway Protocol (BGP) routing.
  • Nine new user agents were used to make API calls that weren’t observed in the 45 days prior to the events being investigated.

These indicators of compromise represent unusual behaviors that have either not been observed before in the AWS account involved or that are intrinsically considered high risk. The following summary panel includes the report that shows a detailed breakdown of the investigation results.

Unusual activities are important factors that you should look for during investigations, and sudden behavior change can be a sign of compromise. When you’re investigating an AWS role that can be assumed by different users from different AWS Regions, you are likely to need to examine activity at the granularity of the specific AWS role session that made the APIs calls. Within the report, you can do this by choosing the hyperlinked role name in the summary panel, and it will take you to the AWS role profile page.

Figure 9: Investigation report summary page

Figure 9: Investigation report summary page

Further down on the investigation report is the TTP Mapping from CloudTrail Management Events panel. Detective Investigations maps CloudTrail events to the MITRE ATT&CK framework to help you understand how an API can be used by threat actors. For each mapped API, you can see the tactics, techniques, and procedures it can be used for. In Figure 10, at the top there is a summary of TTPs with different severity levels. At the bottom is a breakdown of potential TTP mappings of observed CloudTrail management events during the investigation scope time.

When you select one of the cards, a side panel appears on the right to give you more details about the APIs. It includes information such as the IP address that made the API call, the details of the TTP the API call was mapped to, and if the API call succeeded or failed. This information can help you understand how these APIs can potentially be used by threat actors to modify your environment, and whether or not the API call succeeded tells you if it might have affected the security of your AWS resources. In the example that’s shown in Figure 10, the IAM role successfully made API calls that are mapped to Lateral Movement in the ATT&CK framework.

Figure 10: Investigation report page with event ATT CK mapping

Figure 10: Investigation report page with event ATT CK mapping

The report also includes additional indicators of compromise (Figure 11). You can find these if you select the Indicators tab next to Overview. Within this tab, you can find the indicators identified during the scope time, and if you select one indicator, details for that indicator will appear on the right. In the example in Figure 11, the IAM role made API calls with a user agent that wasn’t used by this IAM role or other IAM principals in this account, and indicators like this one show sudden behavior change of your IAM principal. You should review them and identify the ones that aren’t expected. To learn more about indicators of compromise in Detective Investigation, see the Amazon Detective User Guide.

Figure 11: Indicators of compromise identified during scope time

Figure 11: Indicators of compromise identified during scope time

At this point, you’ve analyzed the new and unusual behaviors the IAM role made and learned that the IAM role made API calls using new user agents and from new ASOs. In addition, you went through the API calls that were mapped to the MITRE ATT&CK framework. Among the TTPs, there were three API calls that are classified as lateral movements. These should attract attention for the following reasons: first, the purpose of these API calls is to gain access to the EC2 instance involved; and second, ec2-instance-connect:SendSSHPublicKey was run successfully.

Based on the procedure description in the report, this API would grant threat actors temporary SSH access to the target EC2 instance. To gather original evidence, examine the raw logs stored in Security Lake. Security Lake is a fully managed security data lake service that automatically centralizes security data from AWS environments, SaaS providers, on-premises sources, and other sources into a purpose-built data lake stored in your account.

Retrieve raw logs

You can use Security Lake integration to retrieve raw logs from your Security Lake tables within the Detective console as original evidence. If you haven’t enabled the integration yet, you can follow the Integration with Amazon Security Lake guide to enable it. In the context of the example investigation earlier, these logs include details of which EC2 instance was associated with the ec2-instance-connect:SendSSHPublicKey API call. Within the AWS role profile page investigated earlier, if you scroll down to the bottom of the page, you will find the Overall API call volume panel (Figure 12). You can search for the specific API call using the Service and API method filters. Next, choose the magnifier icon, which will initiate a Security Lake query to retrieve the raw logs of the specific CloudTrail event.

Figure 12: Finding the CloudTrail record for a specific API call held in Security Lake

Figure 12: Finding the CloudTrail record for a specific API call held in Security Lake

You can identify the target EC2 instance the API was issued against from the query results (Figure 13). To determine whether threat actors actually made an SSH connection to the target EC2 instance as a result of the API call, you should examine the EC2 instance’s profile page:

Figure 13: Reviewing a CloudTrail log record from Security Lake

Figure 13: Reviewing a CloudTrail log record from Security Lake

From the profile page of the EC2 instance in the Detective console, you can go to the Overall VPC flow volume panel and filter the Amazon Virtual Private Cloud (Amazon VPC) flow logs using the attributes related to the threat actor identified as having made the SSH API call. In Figure 14, you can see the IP address that tried to connect to 22/tcp, which is the SSH port of the target instance. It’s common for threat actors to change their IP address in an attempt to evade detection, and you can remove the IP address filter to see inbound connections to port 22/tcp of your EC2 instance.

Figure 14: Examining SSH connections to the target instance in the Detective profile page

Figure 14: Examining SSH connections to the target instance in the Detective profile page

Iterate the investigation

At this point, you’ve made progress with the help of Detective Investigations and Security Lake integration. You started with a GuardDuty finding, and you got to the point where you were able to identify some of the intent of the threat actors and uncover the specific EC2 instance they were targeting. Your investigation shouldn’t stop here because you’ve successfully identified the EC2 instance, which is the next target to investigate.

You can reuse this whole workflow by starting with the EC2 instance’s New behavior panel, run Detective Investigations on the IAM role attached to the EC2 instance and other IAM principals you think are worth taking a closer look at, then use the Security Lake integration to gather raw logs of the APIs made by the EC2 instance to identify the specific actions taken and their potential consequences.

Conclusion

In this post, you’ve seen how you can use the Amazon Detective Investigation feature to investigate IAM user and role activity and use the Security Lake integration to determine the specific EC2 instances a threat actor appeared to be targeting.

The Detective Investigation feature is automatically enabled for both existing and new customers in AWS Regions that support Detective where Detective has been activated. The Security Lake integration feature can be enabled in your Detective console. If you don’t currently use Detective, you can start a free 30-day trial. For more information on Detective Investigation and Security Lake integration, see Investigating IAM resources using Detective investigations and Security Lake integration.

 
If you have feedback about this post, submit comments in the Comments section below. If you have questions about this post, contact AWS Support.

Want more AWS Security news? Follow us on X.

Yue Zhu

Yue Zhu

Yue is a security engineer at AWS. Before AWS, he worked as a security engineer focused on threat detection, incident response, vulnerability management, and security tooling development. Outside of work, Yue enjoys reading, cooking, and cycling.

How Amazon Security Lake is helping customers simplify security data management for proactive threat analysis

Post Syndicated from Nisha Amthul original https://aws.amazon.com/blogs/security/how-amazon-security-lake-is-helping-customers-simplify-security-data-management-for-proactive-threat-analysis/

In this post, we explore how Amazon Web Services (AWS) customers can use Amazon Security Lake to efficiently collect, query, and centralize logs on AWS. We also discuss new use cases for Security Lake, such as applying generative AI to Security Lake data for threat hunting and incident response, and we share the latest service enhancements and developments from our growing landscape. Security Lake centralizes security data from AWS environments, software as a service (SaaS) providers, and on-premises and cloud sources into a purpose-built data lake that is stored in your AWS account. Using Open Cybersecurity Schema Framework (OCSF) support, Security Lake normalizes and combines security data from AWS and a broad range of third-party data sources. This helps provide your security team with the ability to investigate and respond to security events and analyze possible threats within your environment, which can facilitate timely responses and help to improve your security across multicloud and hybrid environments.

One year ago, AWS embarked on a mission driven by the growing customer need to revolutionize how security professionals centralize, optimize, normalize, and analyze their security data. As we celebrate the one-year general availability milestone of Amazon Security Lake, we’re excited to reflect on the journey and showcase how customers are using the service, yielding both productivity and cost benefits, while maintaining ownership of their data.

Figure 1 shows how Security Lake works, step by step. For more details, see What is Amazon Security Lake?

Figure 1: How Security Lake works

Figure 1: How Security Lake works

Customer use cases

In this section, we highlight how some of our customers have found the most value with Security Lake and how you can use Security Lake in your organization.

Simplify the centralization of security data management across hybrid environments to enhance security analytics

Many customers use Security Lake to gather and analyze security data from various sources, including AWS, multicloud, and on-premises systems. By centralizing this data in a single location, organizations can streamline data collection and analysis, help eliminate data silos, and improve cross-environment analysis. This enhanced visibility and efficiency allows security teams to respond more effectively to security events. With Security Lake, customers simplify data gathering and reduce the burden of data retention and extract, transform, and load (ETL) processes with key AWS data sources.

For example, Interpublic Group (IPG), an advertising company, uses Security Lake to gain a comprehensive, organization-wide grasp of their security posture across hybrid environments. Watch this video from re:Inforce 2023 to understand how IPG streamlined their security operations.

Before adopting Security Lake, the IPG team had to work through the challenge of managing diverse log data sources. This involved translating and transforming the data, as well as reconciling complex elements like IP addresses. However, with the implementation of Security Lake, IPG was able to access previously unavailable log sources. This enabled them to consolidate and effectively analyze security-related data. The use of Security Lake has empowered IPG to gain comprehensive insight into their security landscape, resulting in a significant improvement in their overall security posture.

“We can achieve a more complete, organization-wide understanding of our security posture across hybrid environments. We could quickly create a security data lake that centralized security-related data from AWS and third-party sources,” — Troy Wilkinson, Global CISO at Interpublic Group

Streamline incident investigation and reduce mean time to respond

As organizations expand their cloud presence, they need to gather information from diverse sources. Security Lake automates the centralization of security data from AWS environments and third-party logging sources, including firewall logs, storage security, and threat intelligence signals. This removes the need for custom, one-off security consolidation pipelines. The centralized data in Security Lake streamlines security investigations, making security management and investigations simpler. Whether you’re in operations or a security analyst, dealing with multiple applications and scattered data can be tough. Security Lake makes it simpler by centralizing the data, reducing the need for scattered systems. Plus, with data stored in your Amazon Simple Storage Service (Amazon S3) account, Security Lake lets you store a lot of historical data, which helps when looking back for patterns or anomalies indicative of security issues.

For example, SEEK, an Australian online employment marketplace, uses Security Lake to streamline incident investigations and reduce mean time to respond (MTTR). Watch this video from re:Invent 2023 to understand how SEEK improved its incident response. Prior to using Security Lake, SEEK had to rely on a legacy VPC Flow Logs system to identify possible indicators of compromise, which took a long time. With Security Lake, the company was able to more quickly identify a host in one of their accounts that was communicating with a malicious IP. Now, Security Lake has provided SEEK with swift access to comprehensive data across diverse environments, facilitating forensic investigations and enabling them scale their security operations better.

Optimize your log retention strategy

Security Lake simplifies data management for customers who need to store large volumes of security logs to meet compliance requirements. It provides customizable retention settings and automated storage tiering to optimize storage costs and security analytics. It automatically partitions and converts incoming security data into a storage and query-efficient Apache Parquet format. Security Lake uses the Apache Iceberg open table format to enhance query performance for your security analytics. Customers can now choose which logs to keep for compliance reasons, which logs to send to their analytics solutions for further analysis, and which logs to query in place for incident investigation use cases. Security Lake helps customers to retain logs that were previously unfeasible to store and to extend storage beyond their typical retention policy, within their security information and event management (SIEM) system.

Figure 2 shows a section of the Security Lake activation page, which presents users with options to set rollup AWS Regions and storage classes.

Figure 2: Security Lake activation page with options to select a roll-up Region and set storage classes

Figure 2: Security Lake activation page with options to select a roll-up Region and set storage classes

For example, Carrier, an intelligent climate and energy solutions company, relies on Security Lake to strengthen its security and governance practices. By using Security Lake, Carrier can adhere to compliance with industry standards and regulations, safeguarding its operations and optimizing its log retention.

“Amazon Security Lake simplifies the process of ingesting and analyzing all our security-related log and findings data into a single data lake, strengthening our enterprise-level security and governance practices. This streamlined approach has enhanced our ability to identify and address potential issues within our environment more effectively, enabling us to proactively implement mitigations based on insights derived from the service,” — Justin McDowell, Associate Director for Enterprise Cloud Services at Carrier

Proactive threat and vulnerability detection

Security Lake helps customers identify potential threats and vulnerabilities earlier in the development process by facilitating the correlation of security events across different data sources, allowing security analysts to identify complex attack patterns more effectively. This proactive approach shifts the responsibility for maintaining secure coding and infrastructure to earlier phases, enhancing overall security posture. Security Lake can also optimize security operations by automating safeguard protocols and involving engineering teams in decision-making, validation, and remediation processes. Also, by seamlessly integrating with security orchestration tools, Security Lake can help expedite responses to security incidents and preemptively help mitigate vulnerabilities before exploitation occurs.

For example, SPH Media, a Singapore media company, uses Security Lake to get better visibility into security activity across their organization, enabling proactive identification of potential threats and vulnerabilities.

Security Lake and generative AI for threat hunting and incident response practices

Centralizing security-related data allows organizations to efficiently analyze behaviors from systems and users across their environments, providing deeper insight into potential risks. With Security Lake, customers can centralize their security logs and have them stored in a standardized format using OCSF. OCSF implements a well-documented schema maintained at schema.ocsf.io, which generative AI can use to contextualize the structured data within Security Lake tables. Security personnel can then ask questions of the data using familiar security investigation terminology rather than needing data analytics skills to translate an otherwise simple question into complex SQL (Structured Query Language) queries. Building upon the previous processes, Amazon Bedrock then takes an organization’s natural language incident response playbooks and converts them into a sequence of queries capable of automating what would otherwise be manual investigation tasks.

“Organizations can benefit from using Amazon Security Lake to centralize and manage security data with the OCSF and Apache Parquet format. It simplifies the integration of disparate security log sources and findings, reducing complexity and cost. By applying generative AI to Security Lake data, SecOps can streamline security investigations, facilitate timely responses, and enhance their overall security,” — Phil Bues, Research Manager, Cloud Security at IDC

Enhance incident response workflow with contextual alerts

Incident responders commonly deal with a high volume of automatically generated alerts from their IT environment. Initially, the response team members sift through numerous log sources to uncover relevant details about affected resources and the causes of alerts, which adds time to the remediation process. This manual process also consumes valuable analyst time, particularly if the alert turns out to be a false positive.

To reduce this burden on incident responders, customers can use generative AI to perform initial investigations and generate human-readable context from alerts. Amazon QuickSight Q is a generative AI–powered assistant that can answer questions, provide summaries, generate content, and securely complete tasks based on data and information in your enterprise systems. Incident responders can now combine these capabilities with data in Amazon Security Lake to begin their investigation and build detailed dashboards in minutes. This allows them to visually identify resources and activities that could potentially trigger alerts, giving incident responders a head start in their response efforts. The approach can also be used to validate alert information against alternative sources, enabling faster identification of false positives and allowing responders to focus on genuine security incidents.

As natural language processing (NLP) models evolve they can also interpret incident response playbooks, often written in a human-readable, step-by-step format. Amazon Q Apps will enable the incident responder to use natural language to quickly and securely build their own generative AI playbooks to automate their tasks. This automation can streamline incident response tasks such as creating tickets in the relevant ticketing system, logging bugs in the version control system that hosts application code, and tagging resources as non-compliant if they fail to adhere to the organization’s IT security policy.

Incident investigation with automatic dashboard generation

By using Amazon QuickSight Q and data in Security Lake, incident responders can now generate customized visuals based on the specific characteristics and context of the incident they are investigating. The incident response team can start with a generic investigative question and automatically produce dashboards without writing SQL queries or learning the complexities of how to build a dashboard.

After building a topic in Amazon QuickSight Q. The investigator can either ask their own question or utilize the AI generated questions that Q has provided. In the example shown in Figure 3, the incident responder suspects a potential security incident and is seeking more information about Create or Update API calls in their environment, by asking ” I’m looking for what accounts ran an update or create api call in the last week, can you display the API Operation?

Figure 3: AI Generated visual to begin the investigation

Figure 3: AI Generated visual to begin the investigation

This automatically generated dashboard can be saved for later and from this dashboard the investigator can just focus on one account with a simple right click and get more information about the API calls performed by a single account. as shown in Figure 4.

Figure 4: Investigating API calls for a single account

Figure 4: Investigating API calls for a single account

Using the centralized security data in Amazon Security Lake and Amazon QuickSight Q, incident responders can jump-start investigations and rapidly validate potential threats without having to write complex queries or manually construct dashboards.

Updates since GA launch

Security Lake makes it simpler to analyze security data, gain a more comprehensive understanding of security across your entire organization, and improve the protection of your workloads, applications, and data. Since the general availability release in 2023, we have made various updates to the service. It’s now available in 17 AWS Regions globally. To assist you in evaluating your current and future Security Lake usage and cost estimates, we’ve introduced a new usage page. If you’re currently in a 15-day free trial, your trial usage can serve as a reference for estimating post-trial costs. Accessing Security Lake usage and projected costs is as simple as logging into the Security Lake console.

We have released an integration with Amazon Detective that enables querying and retrieving logs stored in Security Lake. Detective begins pulling raw logs from Security Lake related to AWS CloudTrail management events and Amazon VPC Flow Logs. Security Lake enhances analytics performance with support for OCSF 1.1.0 and Apache Iceberg. Also, Security Lake has integrated several OCSF mapping enhancements, including OCSF Observables, and has adopted the latest version of the OCSF datetime profile for improved usability. Security Lake seamlessly centralizes and normalizes Amazon Elastic Kubernetes Service (Amazon EKS) audit logs, simplifying monitoring and investigation of potential suspicious activities in your Amazon EKS clusters, without requiring additional setup or affecting existing configurations.

Developments in Partner integrations

Over 100 sources of data are available in Security Lake from AWS and third-party sources. Customers can ingest logs into Security Lake directly from their sources. Security findings from over 50 partners are available through AWS Security Hub, and software as a service (SaaS) application logs from popular platforms such as Salesforce, Slack, and Smartsheet can be sent into Security Lake through AWS AppFabric. Since the GA launch, Security Lake has added 18 partner integrations, and we now offer over 70 direct partner integrations. New source integrations include AIShield by Bosch, Contrast Security, DataBahn, Monad, SailPoint, Sysdig, and Talon. New subscribers who have built integrations include Cyber Security Cloud, Devo, Elastic, Palo Alto Networks, Panther, Query.AI, Securonix, and Tego Cyber and new service partner offerings from Accenture, CMD Solutions, part of Mantel Group, Deloitte, Eviden, HOOP Cyber, Kyndryl, Kudelski Security, Infosys, Leidos, Megazone, PwC and Wipro.

Developments in the Open Cybersecurity Schema Framework

The OCSF community has grown over the last year to almost 200 participants across security-focused independent software vendors (ISVs), government agencies, educational institutions, and enterprises. Leading cybersecurity organizations have contributed to the OCSF schema, such as Tanium and Cisco Duo. Many existing Security Lake partners are adding support for OCSF version 1.1, including Confluent, Cribl, CyberArk, DataBahn, Datadog, Elastic, IBM, Netskope, Orca Security, Palo Alto Networks, Panther, Ripjar, Securonix, SentinelOne, SOC Prime, Sumo Logic, Splunk, Tanium, Tego Cyber, Torq, Trellix, Stellar Cyber, Query.AI, Swimlane, and more. Members of the OCSF community who want to validate their OCSF schema for Security Lake have access to a validation script on GitHub.

Get help from AWS Professional Services

The global team of experts in the AWS Professional Services organization can help customers realize their desired business outcomes with AWS. Our teams of data architects and security engineers collaborate with customer security, IT, and business leaders to develop enterprise solutions.

The AWS ProServe Amazon Security Lake Assessment offering is a complimentary workshop for customers. It entails a two-week interactive assessment, delving deep into customer use cases and creating a program roadmap to implement Security Lake alongside a suite of analytics solutions. Through a series of technical and strategic discussions, the AWS ProServe team analyzes use cases for data storage, security, search, visualization, analytics, AI/ML, and generative AI. The team then recommends a target future state architecture to achieve the customer’s security operations goals. At the end of the workshop, customers receive a draft architecture and implementation plan, along with infrastructure cost estimates, training, and other technical recommendations.

Summary

In this post, we showcased how customers use Security Lake to collect, query, and centralize logs on AWS. We discussed new applications for Security Lake and generative AI for threat hunting and incident response. We invite you to discover the benefits of using Security Lake through our 15-day free trial and share your feedback. To help you in getting started and building your first security data lake, we offer a range of resources including an infographic, eBook, demo videos, and webinars. There are many different use cases for Security Lake that can be tailored to suit your AWS environment. Join us at AWS re:Inforce 2024, our annual cloud security event, for more insights and firsthand experiences of how Security Lake can help you centralize, normalize, and optimize your security data.

 
If you have feedback about this post, submit comments in the Comments section below. If you have questions about this post, contact AWS Support.

Want more AWS Security news? Follow us on X.

Nisha Amthul

Nisha Amthul

Nisha is a Senior Product Marketing Manager at AWS Security, specializing in detection and response solutions. She has a strong foundation in product management and product marketing within the domains of information security and data protection. When not at work, you’ll find her cake decorating, strength training, and chasing after her two energetic kiddos, embracing the joys of motherhood.

Author

Ross Warren

Ross is a Senior Product SA at AWS for Amazon Security Lake based in Northern Virginia. Prior to his work at AWS, Ross’ areas of focus included cyber threat hunting and security operations. Outside of work, he likes to spend time with his family, bake bread, make sawdust and enjoy time outside.

Jonathan Garzon

Jonathan Garzon

Jonathan is a Principal Product Manager at AWS with a passion for building products with delightful customer experiences and solving complex problems. He has launched and managed products in various domains, including networking, cybersecurity, and data analytics. Outside of work, Jonathan enjoys spending time with friends and family, playing soccer, mountain biking, hiking, and playing the guitar.

How to develop an Amazon Security Lake POC

Post Syndicated from Anna McAbee original https://aws.amazon.com/blogs/security/how-to-develop-an-amazon-security-lake-poc/

You can use Amazon Security Lake to simplify log data collection and retention for Amazon Web Services (AWS) and non-AWS data sources. To make sure that you get the most out of your implementation requires proper planning.

In this post, we will show you how to plan and implement a proof of concept (POC) for Security Lake to help you determine the functionality and value of Security Lake in your environment, so that your team can confidently design and implement in production. We will walk you through the following steps:

  1. Understand the functionality and value of Security Lake
  2. Determine success criteria for the POC
  3. Define your Security Lake configuration
  4. Prepare for deployment
  5. Enable Security Lake
  6. Validate deployment

Understand the functionality of Security Lake

Figure 1 summarizes the main features of Security Lake and the context of how to use it:

Figure 1: Overview of Security Lake functionality

Figure 1: Overview of Security Lake functionality

As shown in the figure, Security Lake ingests and normalizes logs from data sources such as AWS services, AWS Partner sources, and custom sources. Security Lake also manages the lifecycle, orchestration, and subscribers. Subscribers can be AWS services, such as Amazon Athena, or AWS Partner subscribers.

There are four primary functions that Security Lake provides:

  • Centralize visibility to your data from AWS environments, SaaS providers, on-premises, and other cloud data sources — You can collect log sources from AWS services such as AWS CloudTrail management events, Amazon Simple Storage Service (Amazon S3) data events, AWS Lambda data events, Amazon Route 53 Resolver logs, VPC Flow Logs, and AWS Security Hub findings, in addition to log sources from on-premises, other cloud services, SaaS applications, and custom sources. Security Lake automatically aggregates the security data across AWS Regions and accounts.
  • Normalize your security data to an open standard — Security Lake normalizes log sources in a common schema, the Open Security Schema Framework (OCSF), and stores them in compressed parquet files.
  • Use your preferred analytics tools to analyze your security data — You can use AWS tools, such as Athena and Amazon OpenSearch Service, or you can utilize external security tools to analyze the data in Security Lake.
  • Optimize and manage your security data for more efficient storage and query — Security Lake manages the lifecycle of your data with customizable retention settings with automated storage tiering to help provide more cost-effective storage.

Determine success criteria

By establishing success criteria, you can assess whether Security Lake has helped address the challenges that you are facing. Some example success criteria include:

  • I need to centrally set up and store AWS logs across my organization in AWS Organizations for multiple log sources.
  • I need to more efficiently collect VPC Flow Logs in my organization and analyze them in my security information and event management (SIEM) solution.
  • I want to use OpenSearch Service to replace my on-premises SIEM.
  • I want to collect AWS log sources and custom sources for machine learning with Amazon Sagemaker.
  • I need to establish a dashboard in Amazon QuickSight to visualize my Security Hub findings and a custom log source data.

Review your success criteria to make sure that your goals are realistic given your timeframe and potential constraints that are specific to your organization. For example, do you have full control over the creation of AWS services that are deployed in an organization? Do you have resources that can dedicate time to implement and test? Is this time convenient for relevant stakeholders to evaluate the service?

The timeframe of your POC will depend on your answers to these questions.

Important: Security Lake has a 15-day free trial per account that you use from the time that you enable Security Lake. This is the best way to estimate the costs for each Region throughout the trial, which is an important consideration when you configure your POC.

Define your Security Lake configuration

After you establish your success criteria, you should define your desired Security Lake configuration. Some important decisions include the following:

  • Determine AWS log sources — Decide which AWS log sources to collect. For information about the available options, see Collecting data from AWS services.
  • Determine third-party log sources — Decide if you want to include non-AWS service logs as sources in your POC. For more information about your options, see Third-party integrations with Security Lake; the integrations listed as “Source” can send logs to Security Lake.

    Note: You can add third-party integrations after the POC or in a second phase of the POC. Pre-planning will be required to make sure that you can get these set up during the 15-day free trial. Third-party integrations usually take more time to set up than AWS service logs.

  • Select a delegated administrator – Identify which account will serve as the delegated administrator. Make sure that you have the appropriate permissions from the organization admin account to identify and enable the account that will be your Security Lake delegated administrator. This account will be the location for the S3 buckets with your security data and where you centrally configure Security Lake. The AWS Security Reference Architecture (AWS SRA) recommends that you use the AWS logging account for this purpose. In addition, make sure to review Important considerations for delegated Security Lake administrators.
  • Select accounts in scope — Define which accounts to collect data from. To get the most realistic estimate of the cost of Security Lake, enable all accounts across your organization during the free trial.
  • Determine analytics tool — Determine if you want to use native AWS analytics tools, such as Athena and OpenSearch Service, or an existing SIEM, where the SIEM is a subscriber to Security Lake.
  • Define log retention and Regions — Define your log retention requirements and Regional restrictions or considerations.

Prepare for deployment

After you determine your success criteria and your Security Lake configuration, you should have an idea of your stakeholders, desired state, and timeframe. Now you need to prepare for deployment. In this step, you should complete as much as possible before you deploy Security Lake. The following are some steps to take:

  • Create a project plan and timeline so that everyone involved understands what success look like and what the scope and timeline is.
  • Define the relevant stakeholders and consumers of the Security Lake data. Some common stakeholders include security operations center (SOC) analysts, incident responders, security engineers, cloud engineers, finance, and others.
  • Define who is responsible, accountable, consulted, and informed during the deployment. Make sure that team members understand their roles.
  • Make sure that you have access in your management account to delegate and administrator. For further details, see IAM permissions required to designate the delegated administrator.
  • Consider other technical prerequisites that you need to accomplish. For example, if you need roles in addition to what Security Lake creates for custom extract, transform, and load (ETL) pipelines for custom sources, can you work with the team in charge of that process before the POC?

Enable Security Lake

The next step is to enable Security Lake in your environment and configure your sources and subscribers.

  1. Deploy Security Lake across the Regions, accounts, and AWS log sources that you previously defined.
  2. Configure custom sources that are in scope for your POC.
  3. Configure analytics tools in scope for your POC.

Validate deployment

The final step is to confirm that you have configured Security Lake and additional components, validate that everything is working as intended, and evaluate the solution against your success criteria.

  • Validate log collection — Verify that you are collecting the log sources that you configured. To do this, check the S3 buckets in the delegated administrator account for the logs.
  • Validate analytics tool — Verify that you can analyze the log sources in your analytics tool of choice. If you don’t want to configure additional analytics tooling, you can use Athena, which is configured when you set up Security Lake. For sample Athena queries, see Amazon Security Lake Example Queries on GitHub and Security Lake queries in the documentation.
  • Obtain a cost estimate — In the Security Lake console, you can review a usage page to verify that the cost of Security Lake in your environment aligns with your expectations and budgets.
  • Assess success criteria — Determine if you achieved the success criteria that you defined at the beginning of the project.

Next steps

Next steps will largely depend on whether you decide to move forward with Security Lake.

  • Determine if you have the approval and budget to use Security Lake.
  • Expand to other data sources that can help you provide more security outcomes for your business.
  • Configure S3 lifecycle policies to efficiently store logs long term based on your requirements.
  • Let other teams know that they can subscribe to Security Lake to use the log data for their own purposes. For example, a development team that gets access to CloudTrail through Security Lake can analyze the logs to understand the permissions needed for an application.

Conclusion

In this blog post, we showed you how to plan and implement a Security Lake POC. You learned how to do so through phases, including defining success criteria, configuring Security Lake, and validating that Security Lake meets your business needs.

As a customer, this guide will help you run a successful proof of value (POV) with Security Lake. It guides you in assessing the value and factors to consider when deciding to implement the current features.

Further resources

 
If you have feedback about this post, submit comments in the Comments section below. If you have questions about this post, contact AWS Support.

Anna McAbee

Anna McAbee

Anna is a Security Specialist Solutions Architect focused on threat detection and incident response at AWS. Before AWS, she worked as an AWS customer in financial services on both the offensive and defensive sides of security. Outside of work, Anna enjoys cheering on the Florida Gators football team, wine tasting, and traveling the world.

Author

Marshall Jones

Marshall is a Worldwide Security Specialist Solutions Architect at AWS. His background is in AWS consulting and security architecture, focused on a variety of security domains including edge, threat detection, and compliance. Today, he is focused on helping enterprise AWS customers adopt and operationalize AWS security services to increase security effectiveness and reduce risk.

Marc Luescher

Marc Luescher

Marc is a Senior Solutions Architect helping enterprise customers be successful, focusing strongly on threat detection, incident response, and data protection. His background is in networking, security, and observability. Previously, he worked in technical architecture and security hands-on positions within the healthcare sector as an AWS customer. Outside of work, Marc enjoys his 3 dogs, 4 cats, and 20+ chickens.

Building a security-first mindset: three key themes from AWS re:Invent 2023

Post Syndicated from Clarke Rodgers original https://aws.amazon.com/blogs/security/building-a-security-first-mindset-three-key-themes-from-aws-reinvent-2023/

Amazon CSO Stephen Schmidt

Amazon CSO Stephen Schmidt

AWS re:Invent drew 52,000 attendees from across the globe to Las Vegas, Nevada, November 27 to December 1, 2023.

Now in its 12th year, the conference featured 5 keynotes, 17 innovation talks, and over 2,250 sessions and hands-on labs offering immersive learning and networking opportunities.

With dozens of service and feature announcements—and innumerable best practices shared by AWS executives, customers, and partners—the air of excitement was palpable. We were on site to experience all of the innovations and insights, but summarizing highlights isn’t easy. This post details three key security themes that caught our attention.

Security culture

When we think about cybersecurity, it’s natural to focus on technical security measures that help protect the business. But organizations are made up of people—not technology. The best way to protect ourselves is to foster a proactive, resilient culture of cybersecurity that supports effective risk mitigation, incident detection and response, and continuous collaboration.

In Sustainable security culture: Empower builders for success, AWS Global Services Security Vice President Hart Rossman and AWS Global Services Security Organizational Excellence Leader Sarah Currey presented practical strategies for building a sustainable security culture.

Rossman noted that many customers who meet with AWS about security challenges are attempting to manage security as a project, a program, or a side workstream. To strengthen your security posture, he said, you have to embed security into your business.

“You’ve got to understand early on that security can’t be effective if you’re running it like a project or a program. You really have to run it as an operational imperative—a core function of the business. That’s when magic can happen.” — Hart Rossman, Global Services Security Vice President at AWS

Three best practices can help:

  1. Be consistently persistent. Routinely and emphatically thank employees for raising security issues. It might feel repetitive, but treating security events and escalations as learning opportunities helps create a positive culture—and it’s a practice that can spread to other teams. An empathetic leadership approach encourages your employees to see security as everyone’s responsibility, share their experiences, and feel like collaborators.
  2. Brief the board. Engage executive leadership in regular, business-focused meetings. By providing operational metrics that tie your security culture to the impact that it has on customers, crisply connecting data to business outcomes, and providing an opportunity to ask questions, you can help build the support of executive leadership, and advance your efforts to establish a sustainable proactive security posture.
  3. Have a mental model for creating a good security culture. Rossman presented a diagram (Figure 1) that highlights three elements of security culture he has observed at AWS: a student, a steward, and a builder. If you want to be a good steward of security culture, you should be a student who is constantly learning, experimenting, and passing along best practices. As your stewardship grows, you can become a builder, and progress the culture in new directions.
Figure 1: Sample mental model for building security culture

Figure 1: Sample mental model for building security culture

Thoughtful investment in the principles of inclusivity, empathy, and psychological safety can help your team members to confidently speak up, take risks, and express ideas or concerns. This supports an escalation-friendly culture that can reduce employee burnout, and empower your teams to champion security at scale.

In Shipping securely: How strong security can be your strategic advantage, AWS Enterprise Strategy Director Clarke Rodgers reiterated the importance of security culture to building a security-first mindset.

Rodgers highlighted three pillars of progression (Figure 2)—aware, bolted-on, and embedded—that are based on meetings with more than 800 customers. As organizations mature from a reactive security posture to a proactive, security-first approach, he noted, security culture becomes a true business enabler.

“When organizations have a strong security culture and everyone sees security as their responsibility, they can move faster and achieve quicker and more secure product and service releases.” — Clarke Rodgers, Director of Enterprise Strategy at AWS
Figure 2: Shipping with a security-first mindset

Figure 2: Shipping with a security-first mindset

Human-centric AI

CISOs and security stakeholders are increasingly pivoting to a human-centric focus to establish effective cybersecurity, and ease the burden on employees.

According to Gartner, by 2027, 50% of large enterprise CISOs will have adopted human-centric security design practices to minimize cybersecurity-induced friction and maximize control adoption.

As Amazon CSO Stephen Schmidt noted in Move fast, stay secure: Strategies for the future of security, focusing on technology first is fundamentally wrong. Security is a people challenge for threat actors, and for defenders. To keep up with evolving changes and securely support the businesses we serve, we need to focus on dynamic problems that software can’t solve.

Maintaining that focus means providing security and development teams with the tools they need to automate and scale some of their work.

“People are our most constrained and most valuable resource. They have an impact on every layer of security. It’s important that we provide the tools and the processes to help our people be as effective as possible.” — Stephen Schmidt, CSO at Amazon

Organizations can use artificial intelligence (AI) to impact all layers of security—but AI doesn’t replace skilled engineers. When used in coordination with other tools, and with appropriate human review, it can help make your security controls more effective.

Schmidt highlighted the internal use of AI at Amazon to accelerate our software development process, as well as new generative AI-powered Amazon Inspector, Amazon Detective, AWS Config, and Amazon CodeWhisperer features that complement the human skillset by helping people make better security decisions, using a broader collection of knowledge. This pattern of combining sophisticated tooling with skilled engineers is highly effective, because it positions people to make the nuanced decisions required for effective security that AI can’t make on its own.

In How security teams can strengthen security using generative AI, AWS Senior Security Specialist Solutions Architects Anna McAbee and Marshall Jones, and Principal Consultant Fritz Kunstler featured a virtual security assistant (chatbot) that can address common security questions and use cases based on your internal knowledge bases, and trusted public sources.

Figure 3: Generative AI-powered chatbot architecture

Figure 3: Generative AI-powered chatbot architecture

The generative AI-powered solution depicted in Figure 3—which includes Retrieval Augmented Generation (RAG) with Amazon Kendra, Amazon Security Lake, and Amazon Bedrock—can help you automate mundane tasks, expedite security decisions, and increase your focus on novel security problems.

It’s available on Github with ready-to-use code, so you can start experimenting with a variety of large and multimodal language models, settings, and prompts in your own AWS account.

Secure collaboration

Collaboration is key to cybersecurity success, but evolving threats, flexible work models, and a growing patchwork of data protection and privacy regulations have made maintaining secure and compliant messaging a challenge.

An estimated 3.09 billion mobile phone users access messaging apps to communicate, and this figure is projected to grow to 3.51 billion users in 2025.

The use of consumer messaging apps for business-related communications makes it more difficult for organizations to verify that data is being adequately protected and retained. This can lead to increased risk, particularly in industries with unique recordkeeping requirements.

In How the U.S. Army uses AWS Wickr to deliver lifesaving telemedicine, Matt Quinn, Senior Director at The U.S. Army Telemedicine & Advanced Technology Research Center (TATRC), Laura Baker, Senior Manager at Deloitte, and Arvind Muthukrishnan, AWS Wickr Head of Product highlighted how The TATRC National Emergency Tele-Critical Care Network (NETCCN) was integrated with AWS Wickr—a HIPAA-eligible secure messaging and collaboration service—and AWS Private 5G, a managed service for deploying and scaling private cellular networks.

During the session, Quinn, Baker, and Muthukrishnan described how TATRC achieved a low-resource, cloud-enabled, virtual health solution that facilitates secure collaboration between onsite and remote medical teams for real-time patient care in austere environments. Using Wickr, medics on the ground were able to treat injuries that exceeded their previous training (Figure 4) with the help of end-to-end encrypted video calls, messaging, and file sharing with medical professionals, and securely retain communications in accordance with organizational requirements.

“Incorporating Wickr into Military Emergency Tele-Critical Care Platform (METTC-P) not only provides the security and privacy of end-to-end encrypted communications, it gives combat medics and other frontline caregivers the ability to gain instant insight from medical experts around the world—capabilities that will be needed to address the simultaneous challenges of prolonged care, and the care of large numbers of casualties on the multi-domain operations (MDO) battlefield.” — Matt Quinn, Senior Director at TATRC
Figure 4: Telemedicine workflows using AWS Wickr

Figure 4: Telemedicine workflows using AWS Wickr

In a separate Chalk Talk titled Bolstering Incident Response with AWS Wickr and Amazon EventBridge, Senior AWS Wickr Solutions Architects Wes Wood and Charles Chowdhury-Hanscombe demonstrated how to integrate Wickr with Amazon EventBridge and Amazon GuardDuty to strengthen incident response capabilities with an integrated workflow (Figure 5) that connects your AWS resources to Wickr bots. Using this approach, you can quickly alert appropriate stakeholders to critical findings through a secure communication channel, even on a potentially compromised network.

Figure 5: AWS Wickr integration for incident response communications

Figure 5: AWS Wickr integration for incident response communications

Security is our top priority

AWS re:Invent featured many more highlights on a variety of topics, including adaptive access control with Zero Trust, AWS cyber insurance partners, Amazon CTO Dr. Werner Vogels’ popular keynote, and the security partnerships showcased on the Expo floor. It was a whirlwind experience, but one thing is clear: AWS is working hard to help you build a security-first mindset, so that you can meaningfully improve both technical and business outcomes.

To watch on-demand conference sessions, visit the AWS re:Invent Security, Identity, and Compliance playlist on YouTube.

If you have feedback about this post, submit comments in the Comments section below.

Want more AWS Security news? Follow us on Twitter.

Clarke Rodgers

Clarke Rodgers

Clarke is a Director of Enterprise Security at AWS. Clarke has more than 25 years of experience in the security industry, and works with enterprise security, risk, and compliance-focused executives to strengthen their security posture, and understand the security capabilities of the cloud. Prior to AWS, Clarke was a CISO for the North American operations of a multinational insurance company.

Anne Grahn

Anne Grahn

Anne is a Senior Worldwide Security GTM Specialist at AWS, based in Chicago. She has more than 13 years of experience in the security industry, and focuses on effectively communicating cybersecurity risk. She maintains a Certified Information Systems Security Professional (CISSP) certification.

Generate AI powered insights for Amazon Security Lake using Amazon SageMaker Studio and Amazon Bedrock

Post Syndicated from Jonathan Nguyen original https://aws.amazon.com/blogs/security/generate-ai-powered-insights-for-amazon-security-lake-using-amazon-sagemaker-studio-and-amazon-bedrock/

In part 1, we discussed how to use Amazon SageMaker Studio to analyze time-series data in Amazon Security Lake to identify critical areas and prioritize efforts to help increase your security posture. Security Lake provides additional visibility into your environment by consolidating and normalizing security data from both AWS and non-AWS sources. Security teams can use Amazon Athena to query data in Security Lake to aid in a security event investigation or proactive threat analysis. Reducing the security team’s mean time to respond to or detect a security event can decrease your organization’s security vulnerabilities and risks, minimize data breaches, and reduce operational disruptions. Even if your security team is already familiar with AWS security logs and is using SQL queries to sift through data, determining appropriate log sources to review and crafting customized SQL queries can add time to an investigation. Furthermore, when security analysts conduct their analysis using SQL queries, the results are point-in-time and don’t automatically factor results from previous queries.

In this blog post, we show you how to extend the capabilities of SageMaker Studio by using Amazon Bedrock, a fully-managed generative artificial intelligence (AI) service natively offering high-performing foundation models (FMs) from leading AI companies with a single API. By using Amazon Bedrock, security analysts can accelerate security investigations by using a natural language companion to automatically generate SQL queries, focus on relevant data sources within Security Lake, and use previous SQL query results to enhance the results from future queries. We walk through a threat analysis exercise to show how your security analysts can use natural language processing to answer questions such as which AWS account has the most AWS Security Hub findings, irregular network activity from AWS resources, or which AWS Identity and Access Management (IAM) principals invoked highly suspicious activity. By identifying possible vulnerabilities or misconfigurations, you can minimize mean time to detect and pinpoint specific resources to assess overall impact. We also discuss methods to customize Amazon Bedrock integration with data from your Security Lake. While large language models (LLMs) are useful conversational partners, it’s important to note that LLM responses can include hallucinations, which might not reflect truth or reality. We discuss some mechanisms to validate LLM responses and mitigate hallucinations. This blog post is best suited for technologists who have an in-depth understanding of generative artificial intelligence concepts and the AWS services used in the example solution.

Solution overview

Figure 1 depicts the architecture of the sample solution.

Figure 1: Security Lake generative AI solution architecture

Figure 1: Security Lake generative AI solution architecture

Before you deploy the sample solution, complete the following prerequisites:

  1. Enable Security Lake in your organization in AWS Organizations and specify a delegated administrator account to manage the Security Lake configuration for all member accounts in your organization. Configure Security Lake with the appropriate log sources: Amazon Virtual Private Cloud (VPC) Flow Logs, AWS Security Hub, AWS CloudTrail, and Amazon Route53.
  2. Create subscriber query access from the source Security Lake AWS account to the subscriber AWS account.
  3. Accept a resource share request in the subscriber AWS account in AWS Resource Access Manager (AWS RAM).
  4. Create a database link in AWS Lake Formation in the subscriber AWS account and grant access for the Athena tables in the Security Lake AWS account.
  5. Grant Claude v2 model access for Amazon Bedrock LLM Claude v2 in the AWS subscriber account where you will deploy the solution. If you try to use a model before you enable it in your AWS account, you will get an error message.

After you set up the prerequisites, the sample solution architecture provisions the following resources:

  1. A VPC is provisioned for SageMaker with an internet gateway, a NAT gateway, and VPC endpoints for all AWS services within the solution. An internet gateway or NAT gateway is required to install external open-source packages.
  2. A SageMaker Studio domain is created in VPCOnly mode with a single SageMaker user-profile that’s tied to an IAM role. As part of the SageMaker deployment, an Amazon Elastic File System (Amazon EFS) is provisioned for the SageMaker domain.
  3. A dedicated IAM role is created to restrict access to create or access the SageMaker domain’s presigned URL from a specific Classless Inter-Domain Routing (CIDR) for accessing the SageMaker notebook.
  4. An AWS CodeCommit repository containing Python notebooks used for the artificial intelligence and machine learning (AI/ML) workflow by the SageMaker user profile.
  5. An Athena workgroup is created for Security Lake queries with a S3 bucket for output location (access logging is configured for the output bucket).

Cost

Before deploying the sample solution and walking through this post, it’s important to understand the cost factors for the main AWS services being used. The cost will largely depend on the amount of data you interact with in Security Lake and the duration of running resources in SageMaker Studio.

  1. A SageMaker Studio domain is deployed and configured with default setting of a ml.t3.medium instance type. For a more detailed breakdown, see SageMaker Studio pricing. It’s important to shut down applications when they’re not in use because you’re billed for the number of hours an application is running. See the AWS samples repository for an automated shutdown extension.
  2. Amazon Bedrock on-demand pricing is based on the selected LLM and the number of input and output tokens. A token is comprised of a few characters and refers to the basic unit of text that a model learns to understand the user input and prompts. For a more detailed breakdown, see Amazon Bedrock pricing.
  3. The SQL queries generated by Amazon Bedrock are invoked using Athena. Athena cost is based on the amount of data scanned within Security Lake for that query. For a more detailed breakdown, see Athena pricing.

Deploy the sample solution

You can deploy the sample solution by using either the AWS Management Console or the AWS Cloud Development Kit (AWS CDK). For instructions and more information on using the AWS CDK, see Get Started with AWS CDK.

Option 1: Deploy using AWS CloudFormation using the console

Use the console to sign in to your subscriber AWS account and then choose the Launch Stack button to open the AWS CloudFormation console that’s pre-loaded with the template for this solution. It takes approximately 10 minutes for the CloudFormation stack to complete.

Select the Launch Stack button to launch the template

Option 2: Deploy using AWS CDK

  1. Clone the Security Lake generative AI sample repository.
  2. Navigate to the project’s source folder (…/amazon-security-lake-generative-ai/source).
  3. Install project dependencies using the following commands:
    npm install -g aws-cdk-lib
    npm install
    

  4. On deployment, you must provide the following required parameters:
    • IAMroleassumptionforsagemakerpresignedurl – this is the existing IAM role you want to use to access the AWS console to create presigned URLs for SageMaker Studio domain.
    • securitylakeawsaccount – this is the AWS account ID where Security Lake is deployed.
  5. Run the following commands in your terminal while signed in to your subscriber AWS account. Replace <INSERT_AWS_ACCOUNT> with your account number and replace <INSERT_REGION> with the AWS Region that you want the solution deployed to.
    cdk bootstrap aws://<INSERT_AWS_ACCOUNT>/<INSERT_REGION>
    
    cdk deploy --parameters IAMroleassumptionforsagemakerpresignedurl=arn:aws:iam::<INSERT_AWS_ACCOUNT>:role/<INSERT_IAM_ROLE_NAME> --parameters securitylakeawsaccount=<INSERT_SECURITY_LAKE_AWS_ACCOUNT_ID>
    

Post-deployment configuration steps

Now that you’ve deployed the solution, you must add permissions to allow SageMaker and Amazon Bedrock to interact with your Security Lake data.

Grant permission to the Security Lake database

  1. Copy the SageMaker user profile Amazon Resource Name (ARN)
    arn:aws:iam::<account-id>:role/sagemaker-user-profile-for-security-lake
    

  2. Go to the Lake Formation console.
  3. Select the amazon_security_lake_glue_db_<YOUR-REGION> database. For example, if your Security Lake is in us-east-1, the value would be amazon_security_lake_glue_db_us_east_1
  4. For Actions, select Grant.
  5. In Grant Data Permissions, select SAML Users and Groups.
  6. Paste the SageMaker user profile ARN from Step 1.
  7. In Database Permissions, select Describe, and then Grant.

Grant permission to Security Lake tables

You must repeat these steps for each source configured within Security Lake. For example, if you have four sources configured within Security Lake, you must grant permissions for the SageMaker user profile to four tables. If you have multiple sources that are in separate Regions and you don’t have a rollup Region configured in Security Lake, you must repeat the steps for each source in each Region.

The following example grants permissions to the Security Hub table within Security Lake. For more information about granting table permissions, see the AWS LakeFormation user-guide.

  1. Copy the SageMaker user-profile ARN arn:aws:iam:<account-id>:role/sagemaker-user-profile-for-security-lake.
  2. Go to the Lake Formation console.
  3. Select the amazon_security_lake_glue_db_<YOUR-REGION> database.
    For example, if your Security Lake database is in us-east-1 the value would be amazon_security_lake_glue_db_us_east_1
  4. Choose View Tables.
  5. Select the amazon_security_lake_table_<YOUR-REGION>_sh_findings_1_0 table.
    For example, if your Security Lake table is in us-east-1 the value would be amazon_security_lake_table_us_east_1_sh_findings_1_0

    Note: Each table must be granted access individually. Selecting All Tables won’t grant the access needed to query Security Lake.

  6. For Actions, select Grant.
  7. In Grant Data Permissions, select SAML Users and Groups.
  8. Paste the SageMaker user profile ARN from Step 1.
  9. In Table Permissions, select Describe, and then Grant.

Launch your SageMaker Studio application

Now that you’ve granted permissions for a SageMaker user profile, you can move on to launching the SageMaker application associated to that user profile.

  1. Navigate to the SageMaker Studio domain in the console.
  2. Select the SageMaker domain security-lake-gen-ai-<subscriber-account-id>.
  3. Select the SageMaker user profile sagemaker-user-profile-for-security-lake.
  4. For Launch, select Studio.
Figure 2: SageMaker Studio domain view

Figure 2: SageMaker Studio domain view

Clone the Python notebook

As part of the solution deployment, we’ve created a foundational Python notebook in CodeCommit to use within your SageMaker app.

  1. Navigate to CloudFormation in the console.
  2. In the Stacks section, select the SageMakerDomainStack.
  3. Select the Outputs tab.
  4. Copy the value for the SageMaker notebook generative AI repository URL. (For example: https://git-codecommit.us-east-1.amazonaws.com/v1/repos/sagemaker_gen_ai_repo)
  5. Go back to your SageMaker app.
  6. In SageMaker Studio, in the left sidebar, choose the Git icon (a diamond with two branches), then choose Clone a Repository.
    Figure 3: SageMaker Studio clone repository option

    Figure 3: SageMaker Studio clone repository option

  7. Paste the CodeCommit repository link from Step 4 under the Git repository URL (git). After you paste the URL, select Clone “https://git-codecommit.us-east-1.amazonaws.com/v1/repos/sagemaker_gen_ai_repo”, then select Clone.

Note: If you don’t select from the auto-populated list, SageMaker won’t be able to clone the repository and will return a message that the URL is invalid.

Figure 4: SageMaker Studio clone HTTPS repository URL

Figure 4: SageMaker Studio clone HTTPS repository URL

Configure your notebook to use generative AI

In the next section, we walk through how we configured the notebook and why we used specific LLMs, agents, tools, and additional configurations so you can extend and customize this solution to your use case.

The notebook we created uses the LangChain framework. LangChain is a framework for developing applications powered by language models and processes natural language inputs from the user, generates SQL queries, and runs those queries on your Security Lake data. For our use case, we’re using LangChain with Anthropic’s Claude 2 model on Amazon Bedrock.

Set up the notebook environment

  1. After you’re in the generative_ai_security_lake.ipynb notebook, you can set up your notebook environment. Keep the default settings and choose Select.
    Figure 5: SageMaker Studio notebook start-up configuration

    Figure 5: SageMaker Studio notebook start-up configuration

  2. Run the first cell to install the requirements listed in the requirements.txt file.

Connect to the Security Lake database using SQLAlchemy

The example solution uses a pre-populated Security Lake database with metadata in the AWS Glue Data Catalog. The inferred schema enables the LLM to generate SQL queries in response to the questions being asked.

LangChain uses SQLAlchemy, which is a Python SQL toolkit and object relational mapper, to access databases. To connect to a database, first import SQLAlchemy and create an engine object by specifying the following:

  • SCHEMA_NAME
  • S3_STAGING_DIR
  • AWS_REGION
  • ATHENA REST API details

You can use the following configuration code to establish database connections and start querying.

import os
ACCOUNT_ID = os.environ["AWS_ACCOUNT_ID"]
REGION_NAME = os.environ.get('REGION_NAME', 'us-east-1')
REGION_FMT = REGION_NAME.replace("-","_")

from langchain import SQLDatabase
from sqlalchemy import create_engine

#Amazon Security Lake Database
SCHEMA_NAME = f"amazon_security_lake_glue_db_{REGION_FMT}"

#S3 Staging location for Athena query output results and this will be created by deploying the Cloud Formation stack
S3_STAGING_DIR = f's3://athena-gen-ai-bucket-results-{ACCOUNT_ID}/output/'

engine_athena = create_engine(
    "awsathena+rest://@athena.{}.amazonaws.com:443/{}?s3_staging_dir={}".
    format(REGION_NAME, SCHEMA_NAME, S3_STAGING_DIR)
)

athena_db = SQLDatabase(engine_athena)
db = athena_db

Initialize the LLM and Amazon Bedrock endpoint URL

Amazon Bedrock provides a list of Region-specific endpoints for making inference requests for models hosted in Amazon Bedrock. In this post, we’ve defined the model ID as Claude v2 and the Amazon Bedrock endpoint as us-east-1. You can change this to other LLMs and endpoints as needed for your use case.

Obtain a model ID from the AWS console

  1. Go to the Amazon Bedrock console.
  2. In the navigation pane, under Foundation models, select Providers.
  3. Select the Anthropic tab from the top menu and then select Claude v2.
  4. In the model API request note the model ID value in the JSON payload.

Note: Alternatively, you can use the AWS Command Line Interface (AWS CLI) to run the list-foundation-models command in a SageMaker notebook cell or a CLI terminal to the get the model ID. For AWS SDK, you can use the ListFoundationModels operation to retrieve information about base models for a specific provider.

Figure 6: Amazon Bedrock Claude v2 model ID

Figure 6: Amazon Bedrock Claude v2 model ID

Set the model parameters

After the LLM and Amazon Bedrock endpoints are configured, you can use the model_kwargs dictionary to set model parameters. Depending on your use case, you might use different parameters or values. In this example, the following values are already configured in the notebook and passed to the model.

  1. temperature: Set to 0. Temperature controls the degree of randomness in responses from the LLM. By adjusting the temperature, users can control the balance between having predictable, consistent responses (value closer to 0) compared to more creative, novel responses (value closer to 1).

    Note: Instead of using the temperature parameter, you can set top_p, which defines a cutoff based on the sum of probabilities of the potential choices. If you set Top P below 1.0, the model considers the most probable options and ignores less probable ones. According to Anthropic’s user guide, “you should either alter temperature or top_p, but not both.”

  2. top_k: Set to 0. While temperature controls the probability distribution of potential tokens, top_k limits the sample size for each subsequent token. For example, if top_k=50, the model selects from the 50 most probable tokens that could be next in a sequence. When you lower the top_k value, you remove the long tail of low probability tokens to select from in a sequence.
  3. max_tokens_to_sample: Set to 4096. For Anthropic models, the default is 256 and the max is 4096. This value denotes the absolute maximum number of tokens to predict before the generation stops. Anthropic models can stop before reaching this maximum.
Figure 7: Notebook configuration for Amazon Bedrock

Figure 7: Notebook configuration for Amazon Bedrock

Create and configure the LangChain agent

An agent uses a LLM and tools to reason and determine what actions to take and in which order. For this use case, we used a Conversational ReAct agent to remember conversational history and results to be used in a ReAct loop (Question → Thought → Action → Action Input → Observation ↔ repeat → Answer). This way, you don’t have to remember how to incorporate previous results in the subsequent question or query. Depending on your use case, you can configure a different type of agent.

Create a list of tools

Tools are functions used by an agent to interact with the available dataset. The agent’s tools are used by an action agent. We import both SQL and Python REPL tools:

  1. List the available log source tables in the Security Lake database
  2. Extract the schema and sample rows from the log source tables
  3. Create SQL queries to invoke in Athena
  4. Validate and rewrite the queries in case of syntax errors
  5. Invoke the query to get results from the appropriate log source tables
Figure 8: Notebook LangChain agent tools

Figure 8: Notebook LangChain agent tools

Here’s a breakdown for the tools used and the respective prompts:

  • QuerySQLDataBaseTool: This tool accepts detailed and correct SQL queries as input and returns results from the database. If the query is incorrect, you receive an error message. If there’s an error, rewrite and recheck the query, and try again. If you encounter an error such as Unknown column xxxx in field list, use the sql_db_schema to verify the correct table fields.
  • InfoSQLDatabaseTool: This tool accepts a comma-separated list of tables as input and returns the schema and sample rows for those tables. Verify that the tables exist by invoking the sql_db_list_tables first. The input format is: table1, table2, table3
  • ListSQLDatabaseTool: The input is an empty string, the output is a comma separated list of tables in the database
  • QuerySQLCheckerTool: Use this tool to check if your query is correct before running it. Always use this tool before running a query with sql_db_query
  • PythonREPLTool: A Python shell. Use this to run python commands. The input should be a valid python command. If you want to see the output of a value, you should print it out with print(…).

Note: If a native tool doesn’t meet your needs, you can create custom tools. Throughout our testing, we found some of the native tools provided most of what we needed but required minor tweaks for our use case. We changed the default behavior for the tools for use with Security Lake data.

Create an output parser

Output parsers are used to instruct the LLM to respond in the desired output format. Although the output parser is optional, it makes sure the LLM response is formatted in a way that can be quickly consumed and is actionable by the user.

Figure 9: LangChain output parser setting

Figure 9: LangChain output parser setting

Adding conversation buffer memory

To make things simpler for the user, previous results should be stored for use in subsequent queries by the Conversational ReAct agent. ConversationBufferMemory provides the capability to maintain state from past conversations and enables the user to ask follow-up questions in the same chat context. For example, if you asked an agent for a list of AWS accounts to focus on, you want your subsequent questions to focus on that same list of AWS accounts instead of writing the values down somewhere and keeping track of it in the next set of questions. There are many other types of memory that can be used to optimize your use cases.

Figure 10: LangChain conversation buffer memory setting

Figure 10: LangChain conversation buffer memory setting

Initialize the agent

At this point, all the appropriate configurations are set and it’s time to load an agent executor by providing a set of tools and a LLM.

  1. tools: List of tools the agent will have access to.
  2. llm: LLM the agent will use.
  3. agent: Agent type to use. If there is no value provided and agent_path is set, the agent used will default to AgentType.ZERO_SHOT_REACT_DESCRIPTION.
  4. agent_kwargs: Additional keyword arguments to pass to the agent.
Figure 11: LangChain agent initialization

Figure 11: LangChain agent initialization

Note: For this post, we set verbose=True to view the agent’s intermediate ReAct steps, while answering questions. If you’re only interested in the output, set verbose=False.

You can also set return_direct=True to have the tool output returned to the user and closing the agent loop. Since we want to maintain the results of the query and used by the LLM, we left the default value of return_direct=False.

Provide instructions to the agent on using the tools

In addition to providing the agent with a list of tools, you would also give instructions to the agent on how and when to use these tools for your use case. This is optional but provides the agent with more context and can lead to better results.

Figure 12: LangChain agent instructions

Figure 12: LangChain agent instructions

Start your threat analysis journey with the generative AI-powered agent

Now that you’ve walked through the same set up process we used to create and initialize the agent, we can demonstrate how to analyze Security Lake data using natural language input questions that a security researcher might ask. The following examples focus on how you can use the solution to identify security vulnerabilities, risks, and threats and prioritize mitigating them. For this post, we’re using native AWS sources, but the agent can analyze any custom log sources configured in Security Lake. You can also use this solution to assist with investigations of possible security events in your environment.

For each of the questions that follow, you would enter the question in the free-form cell after it has run, similar to Figure 13.

Note: Because the field is free form, you can change the questions. Depending on the changes, you might see different results than are shown in this post. To end the conversation, enter exit and press the Enter key.

Figure 13: LangChain agent conversation input

Figure 13: LangChain agent conversation input

Question 1: What data sources are available in Security Lake?

In addition to the native AWS sources that Security Lake automatically ingests, your security team can incorporate additional custom log sources. It’s important to know what data is available to you to determine what and where to investigate. As shown in Figure 14, the Security Lake database contains the following log sources as tables:

If there are additional custom sources configured, they will also show up here. From here, you can focus on a smaller subset of AWS accounts that might have a larger number of security-related findings.

Figure 14: LangChain agent output for Security Lake tables

Figure 14: LangChain agent output for Security Lake tables

Question 2: What are the top five AWS accounts that have the most Security Hub findings?

Security Hub is a cloud security posture management service that not only aggregates findings from other AWS security services—such as Amazon GuardDuty, Amazon Macie, AWS Firewall Manager, and Amazon Inspector—but also from a number of AWS partner security solutions. Additionally, Security Hub has its own security best practices checks to help identify any vulnerabilities within your AWS environment. Depending on your environment, this might be a good starting place to look for specific AWS accounts to focus on.

Figure 15: LangChain output for AWS accounts with Security Hub findings

Figure 15: LangChain output for AWS accounts with Security Hub findings

Question 3: Within those AWS accounts, were any of the following actions found in (CreateUser, AttachUserPolicy, CreateAccessKey, CreateLoginProfile, DeleteTrail, DeleteMembers, UpdateIPSet, AuthorizeSecurityGroupIngress) in CloudTrail?

With the list of AWS accounts to look at narrowed down, you might be interested in mutable changes in your AWS account that you would deem suspicious. It’s important to note that every AWS environment is different, and some actions might be suspicious for one environment but normal in another. You can tailor this list to actions that shouldn’t happen in your environment. For example, if your organization normally doesn’t use IAM users, you can change the list to look at a list of actions for IAM, such as CreateAccessKey, CreateLoginProfile, CreateUser, UpdateAccessKey, UpdateLoginProfile, and UpdateUser.

By looking at the actions related to AWS CloudTrail (CreateUser, AttachUserPolicy, CreateAccessKey, CreateLoginProfile, DeleteTrail, DeleteMembers, UpdateIPSet, AuthorizeSecurityGroupIngress), you can see which actions were taken in your environment and choose which to focus on. Because the agent has access to previous chat history and results, you can ask follow-up questions on the SQL results without having to specify the AWS account IDs or event names.

Figure 16: LangChain agent output for CloudTrail actions taken in AWS Organization

Figure 16: LangChain agent output for CloudTrail actions taken in AWS Organization

Question 4: Which IAM principals took those actions?

The previous question narrowed down the list to mutable actions that shouldn’t occur. The next logical step is to determine which IAM principals took those actions. This helps correlate an actor to the actions that are either unexpected or are reserved for only authorized principals. For example, if you have an IAM principal tied to a continuous integration and delivery (CI/CD) pipeline, that could be less suspicious. Alternatively, if you see an IAM principal that you don’t recognize, you could focus on all actions taken by that IAM principal, including how it was provisioned in the first place.

Figure 17: LangChain agent output for CloudTrail IAM principals that invoked events from the previous query

Figure 17: LangChain agent output for CloudTrail IAM principals that invoked events from the previous query

Question 5: Within those AWS accounts, were there any connections made to “3.0.0.0/8”?

If you don’t find anything useful related to mutable changes to CloudTrail, you can pivot to see if there were any network connections established from a specific Classless Inter-Domain Routing (CIDR) range. For example, if an organization primarily interacts with AWS resources within your AWS Organizations from your corporate-owned CIDR range, anything outside of that might be suspicious. Additionally, if you have threat lists or suspicious IP ranges, you can add them to the query to see if there are any network connections established from those ranges. The agent knows that the query is network related and to look in VPC flow logs and is focusing on only the AWS accounts from Question 2.

Figure 18: LangChain agent output for VPC flow log matches to specific CIDR

Figure 18: LangChain agent output for VPC flow log matches to specific CIDR

Question 6: As a security analyst, what other evidence or logs should I look for to determine if there are any indicators of compromise in my AWS environment?

If you haven’t found what you’re looking for and want some inspiration from the agent, you can ask the agent what other areas you should look at within your AWS environment. This might help you create a threat analysis thesis or use case as a starting point. You can also refer to the MITRE ATT&CK Cloud Matrix for more areas to focus on when setting up questions for your agent.

Figure 19: LangChain agent output for additional scenarios and questions to investigate

Figure 19: LangChain agent output for additional scenarios and questions to investigate

Based on the answers given, you can start a new investigation to identify possible vulnerabilities and threats:

  • Is there any unusual API activity in my organization that could be an indicator of compromise?
  • Have there been any AWS console logins that don’t match normal geographic patterns?
  • Have there been any spikes in network traffic for my AWS resources?

Agent running custom SQL queries

If you want to use a previously generated or customized SQL query, the agent can run the query as shown in Figure 20 that follows. In the previous questions, a SQL query is generated in the agent’s Action Input field. You can use that SQL query as a baseline, edit the SQL query manually to fit your use case, and then run the modified query through the agent. The modified query results are stored in memory and can be used for subsequent natural language questions to the agent. Even if your security analysts already have SQL experience, having the agent give a recommendation or template SQL query can shorten your investigation.

Figure 20: LangChain agent output for invoking custom SQL queries

Figure 20: LangChain agent output for invoking custom SQL queries

Agent assistance to automatically generate visualizations

You can get help from the agent to create visualizations by using the PythonREPL tool to generate code and plot SQL query results. As shown in Figure 21, you can ask the agent to get results from a SQL query and generate code to create a visualization based on those results. You can then take the generated code and put it into the next cell to create the visualization.

Figure 21: LangChain agent output to generate code to visualize SQL results in a plot

Figure 21: LangChain agent output to generate code to visualize SQL results in a plot

The agent returns example code after To plot the results. You can copy the code between ‘‘‘python and ’’’ and input that code in the next cell. After you run that cell, a visual based on the SQL results is created similar to Figure 22 that follows. This can be helpful to share the notebook output as part of an investigation to either create a custom detection to monitor or determine how a vulnerability can be mitigated.

Figure 22: Notebook Python code output from code generated by LangChain agent

Figure 22: Notebook Python code output from code generated by LangChain agent

Tailoring your agent to your data

As previously discussed, use cases and data vary between organizations. It’s important to understand the foundational components in terms of how you can configure and tailor the LLM, agents, tools, and configuration to your environment. The notebook in the solution was the result of experiments to determine and display what’s possible. Along the way, you might encounter challenges or issues depending on changes you make in the notebook or by adding additional data sources. Below are some tips to help you create and tailor the notebook to your use case.

  • If the agent pauses in the intermediate steps or asks for guidance to answer the original question, you can guide the agent with prompt engineering techniques, using commands such as execute or continue to move the process along.
  • If the agent is hallucinating or providing data that isn’t accurate, see Anthropic’s user guide for mechanisms to reduce hallucinations. An example of a hallucination would be the response having generic information such as an AWS account that is 1234567890 or the resulting count of a query being repeated for multiple rows.

    Note: You can also use Retrieval Augmented Generation (RAG) in Amazon SageMaker to mitigate hallucinations.

SageMaker Studio and Amazon Bedrock provide native integration to use a variety of generative AI tools with your Security Lake data to help increase your organization’s security posture. Some other use cases you can try include:

  • Investigating impact and root cause for a suspected compromise of an Amazon Elastic Compute Cloud (Amazon EC2) instance from a GuardDuty finding.
  • Determining if network ACL or firewall changes in your environment affected the number of AWS resources communicating with public endpoints.
  • Checking if any S3 buckets with possibly confidential or sensitive data were accessed by non-authorized IAM principals.
  • Identify if an EC2 instance that might be compromised made any internal or external connections to other AWS resources and then if those resources were impacted.

Conclusion

This solution demonstrates how you can use the generative AI capabilities of Amazon Bedrock and natural language input in SageMaker Studio to analyze data in Security Lake and work towards reducing your organization’s risk and increase your security posture. The Python notebook is primarily meant to serve as a starting point to walk through an example scenario to identify potential vulnerabilities and threats.

Security Lake is continually working on integrating native AWS sources, but there are also custom data sources outside of AWS that you might want to import for your agent to analyze. We also showed you how we configured the notebook to use agents and LLMs, and how you can tune each component within a notebook to your specific use case.

By enabling your security team to analyze and interact with data in Security Lake using natural language input, you can reduce the amount of time needed to conduct an investigation by automatically identifying the appropriate data sources, generating and invoking SQL queries, and visualizing data from your investigation. This post focuses on Security Lake, which normalizes data into Open Cybersecurity Schema Framework (OCSF), but as long as the database data schema is normalized, the solution can be applied to other data stores.

If you have feedback about this post, submit comments in the Comments section below. If you have questions about this post, start a new thread on the Generative AI on AWS re:Post or contact AWS Support.

Author

Jonathan Nguyen

Jonathan is a Principal Security Architect at AWS. His background is in AWS security with a focus on threat detection and incident response. He helps enterprise customers develop a comprehensive AWS security strategy and deploy security solutions at scale, and trains customers on AWS security best practices.

Madhunika-Reddy-Mikkili

Madhunika Reddy Mikkili

Madhunika is a Data and Machine Learning Engineer with the AWS Professional Services Shared Delivery Team. She is passionate about helping customers achieve their goals through the use of data and machine learning insights. Outside of work, she loves traveling and spending time with family and friends.

Harsh Asnani

Harsh Asnani

Harsh is a Machine Learning Engineer at AWS. His Background is in applied Data Science with a focus on operationalizing Machine Learning workloads in the cloud at scale.

Kartik Kannapur

Kartik Kannapur

Kartik is a Senior Data Scientist with AWS Professional Services. His background is in Applied Mathematics and Statistics. He works with enterprise customers, helping them use machine learning to solve their business problems.

How to share security telemetry per OU using Amazon Security Lake and AWS Lake Formation

Post Syndicated from Chris Lamont-Smith original https://aws.amazon.com/blogs/security/how-to-share-security-telemetry-per-ou-using-amazon-security-lake-and-aws-lake-formation/

This is the final part of a three-part series on visualizing security data using Amazon Security Lake and Amazon QuickSight. In part 1, Aggregating, searching, and visualizing log data from distributed sources with Amazon Athena and Amazon QuickSight, you learned how you can visualize metrics and logs centrally with QuickSight and AWS Lake Formation irrespective of the service or tool generating them. In part 2, How to visualize Amazon Security Lake findings with Amazon QuickSight (LINK NOT LIVE YET), you learned how to integrate Amazon Athena with Security Lake and create visualizations with QuickSight of the data and events captured by Security Lake.

For companies where security administration and ownership are distributed across a single organization in AWS Organizations, it’s important to have a mechanism for securely sharing and visualizing security data. This can be achieved by enriching data within Security Lake with organizational unit (OU) structure and account tags and using AWS Lake Formation to securely share data across your organization on a per-OU basis. Users can then analyze and visualize security data of only those AWS accounts in the OU that they have been granted access to. Enriching the data enables users to effectively filter information using business-specific criteria, minimizing distractions and enabling them to concentrate on key priorities.

Distributed security ownership

It’s not unusual to find security ownership distributed across an organization in AWS Organizations. Take for example a parent company with legal entities operating under it, which are responsible for the security posture of the AWS accounts within their lines of business. Not only is each entity accountable for managing and reporting on security within its area, it must not be able to view the security data of other entities within the same organization.

In this post, we discuss a common example of distributing dashboards on a per-OU basis for visualizing security posture measured by the AWS Foundational Security Best Practices (FSBP) standard as part of AWS Security Hub. In this post, you learn how to use a simple tool published on AWS Samples to extract OU and account tags from your organization and automatically create row-level security policies to share Security Lake data to AWS accounts you specify. At the end, you will have an aggregated dataset of Security Hub findings enriched with AWS account metadata that you can use as a basis for building QuickSight dashboards.

Although this post focuses on sharing Security Hub data through Security Lake, the same steps can be performed to share any data—including Security Hub findings in Amazon S3—according to OU. You need to ensure any tables you want to share contain an AWS account ID column and that the tables are managed by Lake Formation.

Prerequisites

This solution assumes you have:

  • Followed the previous posts in this series and understand how Security Lake, Lake Formation, and QuickSight work together.
  • Enabled Security Lake across your organization and have set up a delegated administrator account.
  • Configured Security Hub across your organization and have enabled the AWS FSBP standard.

Example organization

AnyCorp Inc, a fictional organization, wants to provide security compliance dashboards to its two subsidiaries, ExampleCorpEast and ExampleCorpWest, so that each only has access to data for their respective companies.

Each subsidiary has an OU under AnyCorp’s organization as well as multiple nested OUs for each line of business they operate. ExampleCorpEast and ExampleCorpWest have their own security teams and each operates a security tooling AWS account and uses QuickSight for visibility of security compliance data. AnyCorp has implemented Security Lake to centralize the collection and availability of security data across their organization and has enabled Security Hub and the AWS FSBP standard across every AWS account.

Figure 1 – Overview of AnyCorp Inc OU structure and AWS accounts

Figure 1: Overview of AnyCorp Inc OU structure and AWS accounts


Note: Although this post describes a fictional OU structure to demonstrate the grouping and distribution of security data, you can substitute your specific OU and AWS account details and achieve the same results.

Logical architecture

Figure 2 – Logical overview of solution components

Figure 2: Logical overview of solution components

The solution includes the following core components:

  • An AWS Lambda function is deployed into the Security Lake delegated administrator account (Account A) and extracts AWS account metadata for grouping Security Lake data and manages secure sharing through Lake Formation.
  • Lake Formation implements row-level security using data filters to restrict access to Security Lake data to only records from AWS accounts in a particular OU. Lake Formation also manages the grants that allow consumer AWS accounts access to the filtered data.
  • An Amazon Simple Storage Service (Amazon S3) bucket is used to store metadata tables that the solution uses. Apache Iceberg tables are used to allow record-level updates in S3.
  • QuickSight is configured within each data consumer AWS account (Account B) and is used to visualize the data for the AWS accounts within an OU.

Deploy the solution

You can deploy the solution through either the AWS Management Console or the AWS Cloud Development Kit (AWS CDK).

To deploy the solution using the AWS Management Console, follow these steps:

  1. Download the CloudFormation template.
  2. In your Amazon Security Lake delegated administrator account (Account A), navigate to create a new AWS CloudFormation stack.
  3. Under Specify a template, choose Upload a template file and upload the file downloaded in the previous step. Then choose Next.
  4. Enter RowLevelSecurityLakeStack as the stack name.

    The table names used by Security Lake include AWS Region identifiers that you might need to change depending on the Region you’re using Security Lake in. Edit the following parameters if required and then choose Next.

    • MetadataDatabase: the name you want to give the metadata database.
      • Default: aws_account_metadata_db
    • SecurityLakeDB: the Security Lake database as registered by Security Lake.
      • Default: amazon_security_lake_glue_db_ap_southeast_2
    • SecurityLakeTable: the Security Lake table you want to share.
      • Default: amazon_security_lake_table_ap_southeast_2_sh_findings_1_0
  5. On the Configure stack options screen, leave all other values as default and choose Next.
  6. On the next screen, navigate to the bottom of the page and select the checkbox next to I acknowledge that AWS CloudFormation might create IAM resources. Choose Submit.

The solution takes about 5 minutes to deploy.

To deploy the solution using the AWS CDK, follow these steps:

  1. Download the code from the row-level-security-lake GitHub repository, where you can also contribute to the sample code. The CDK initializes your environment and uploads the Lambda assets to Amazon S3. Then, deploy the solution to your account.
  2. For a CDK deployment, you can edit the same Region identifier parameters discussed in the CloudFormation deployment option by editing the cdk.context.json file and changing the metadata_database, security_lake_db, and security_lake_table values if required.
  3. While you’re authenticated in the Security Lake delegated administrator account, you can bootstrap the account and deploy the solution by running the following commands:
  4. cdk bootstrap
    cdk deploy

Configuring the solution in the Security Lake delegated administrator account

After the solution has been successfully deployed, you can review the OUs discovered within your organization and specify which consumer AWS accounts (Account B) you want to share OU data with.

To specify AWS accounts to share OU security data with, follow these steps:

  1. While in the Security Lake delegated administrator account (Account A), go to the Lake Formation console.
  2. To view and update the metadata discovered by the Lambda function, you first must grant yourself access to the tables where it’s stored. Select the radio button for aws_account_metadata_db. Then, under the Action dropdown menu, select Grant.
  3. Figure 3: Creating a grant for your IAM role

    Figure 3: Creating a grant for your IAM role

  4. On the Grant data permissions page, under Principals, select the IAM users and roles dropdown and select the IAM role that you are currently logged in as.
  5. Under LF-Tags or catalog resources, select the Tables dropdown and select All tables.
  6. Figure 4: Choosing All Tables for the grant

    Figure 4: Choosing All Tables for the grant

  7. Under Table permissions, select Select, Insert, and Alter. These permissions let you view and update the data in the tables.
  8. Leave all other options as default and choose Grant.
  9. Now go to the AWS Athena console.
  10. Note: To use Athena for queries you must configure an S3 bucket to store query results. If this is the first time Athena is being used in your account, you will receive a message saying that you need to configure an S3 bucket. To do this, select the Edit settings button in the blue information notice and follow the instructions.

  11. On the left side, select aws_account_metadata_db> as the Database. You will see aws_account_metadata and ou_groups >as tables within the database.
  12. Figure 5: List of tables under the aws_accounts_metadata_db database

    Figure 5: List of tables under the aws_accounts_metadata_db database

  13. To view the OUs available within your organization, paste the following query into the Athena query editor window and choose Run.
  14. SELECT * FROM "aws_account_metadata_db"."ou_groups"
    

  15. Next, you must specify an AWS account you want to share an OU’s data with. Run the following SQL query in Athena and replace <AWS account Id> and <OU to assign> with values from your organization:
  16. UPDATE "aws_account_metadata_db"."ou_groups"
    SET consumer_aws_account_id = '<AWS account Id>'
    WHERE ou = '<OU to assign>' 

    In the example organization, all ExampleCorpWest security data is shared with AWS account 123456789012 (Account B) using the following SQL query:

    UPDATE "aws_account_metadata_db"."ou_groups"
    SET consumer_aws_account_id = '123456789012'
    WHERE ou = 'OU=root,OU=ExampleCorpWest'

    Note: You must specify the full OU path beginning with OU=root.

  17. Repeat this process for each OU you want to assign different AWS accounts to.
  18. Note: You can only assign one AWS account ID to each OU group

  19. You can confirm that changes have been applied by running the Athena query from Step 3 again.
  20. SELECT * FROM "aws_account_metadata_db"."ou_groups"

You should see the AWS account ID you specified next to your OU.

Figure 6 – Consumer AWS account listed against ExampleCorpWest OU

Figure 6: Consumer AWS account listed against ExampleCorpWest OU

Invoke the Lambda function manually

By default, the Lambda function is scheduled to run hourly to monitor for changes to AWS account metadata and to update Lake Formation sharing permissions (grants) if needed. To perform the remaining steps in this post without having to wait for the hourly run, you must manually invoke the Lambda function.

To invoke the Lambda function manually, follow these steps:

  1. Open the AWS Lambda console.
  2. Select the RowLevelSecurityLakeStack-* Lambda function.
  3. Under Code source, choose Test.
  4. The Lambda function doesn’t take any parameters. Enter rl-sec-lake-test as the Event name and leave all other options as the default. Choose Save.
  5. Choose Test again. The Lambda function will take approximately 5 minutes to complete in an environment with less than 100 AWS accounts.

After the Lambda function has finished, you can review the data cell filters and grants that have been created in Lake Formation to securely share Security Lake data with your consumer AWS account (Account B).

To review the data filters and grants, follow these steps:

  1. Open the Lake Formation console.
  2. In the navigation pane, select Data filters under Data catalog to see a list of data cells filters that have been created for each OU that you assigned a consumer AWS account to. One filter is created per table. Each consumer AWS account is granted restricted access to the aws_account_metadata table and the aggregated Security Lake table.
  3. Figure 7 – Viewing data filters in Lake Formation

    Figure 7: Viewing data filters in Lake Formation

  4. Select one of the filters in the list and choose Edit. Edit data filter displays information about the filter such as the database and table it’s applied to, as well as the Row filter expression that enforces row-level security to only return rows where the AWS account ID is in the OU it applies to. Choose Cancel to close the window.
  5. Figure 8 – Details of a data filter showing row filter expression

    Figure 8: Details of a data filter showing row filter expression

  6. To see how the filters are used to grant restricted access to your tables, select Data lake permission under Permissions from navigation pane. In the search bar under Data permissions, enter the AWS account ID for your consumer AWS account (Account B) and press Enter. You will see a list of all the grants applied to that AWS account. Scroll to the right to see a column titled Resource that lists the names of the data cell filters you saw in the previous step.
  7. Figure 9 – Grants to the data consumer account for data filters

    Figure 9: Grants to the data consumer account for data filters

You can now move on to setting up the consumer AWS account.

Configuring QuickSight in the consumer AWS account (Account B)

Now that you’ve configured everything in the Security Lake delegated administrator account (Account A), you can configure QuickSight in the consumer account (Account B).

To confirm you can access shared tables, follow these steps:

  1. Sign in to your consumer AWS account (also known  as Account B).
  2. Follow the same steps as outlined in this previous post (NEEDS 2ND POST IN SERIES LINK WHEN LIVE) to accept the AWS Resource Access Manager invitation, create a new database, and create resource links for the aws_account_metadata and amazon_security_lake_table_<region>_sh_findings_1_0 tables that have been shared with your consumer AWS account. Make sure you create resource links for both tables shared with the account. When done, return to this post and continue with step 3.
  3. [Optional] After the resource links have been created, test that you’re able to query the data by selecting the radio button next to the aws_account_metadata resource link, select Actions, and then select View data under Table. This takes you to the Athena query editor where you can now run queries on the shared tables.
  4. Figure 10 – Selecting View data in Lake Formation to open Athena

    Figure 10: Selecting View data in Lake Formation to open Athena

    Note: To use Athena for queries you must configure an S3 bucket to store query results. If this is the first time using Athena in your account, you will receive a message saying that you need to configure an S3 bucket. To do this, choose Edit settings in the blue information notice and follow the instructions.

  5. In the Editor configuration, select AwsDataCatalog from the Data source options. The Database should be the database you created in the previous steps, for example security_lake_visualization. After selecting the database, copy the SQL query that follows and paste it into your Athena query editor, and choose Run. You will only see rows of account information from the OU you previously shared.
  6. SELECT * FROM "security_lake_visualization"."aws_account_metadata"

  7. Next, to enrich your Security Lake data with the AWS account metadata you need to create an Athena View that will join the datasets and filter the results to only return findings from the AWS Foundational Security Best Practices Standard. You can do this by copying the below query and running it in the Athena query editor.
  8. CREATE OR REPLACE VIEW "security_hub_fsbps_joined_view" AS 
    WITH
      security_hub AS (
       SELECT *
       FROM
         "security_lake_visualization"."amazon_security_lake_table_ap_southeast_2_sh_findings_1_0"
       WHERE (metadata.product.feature.uid LIKE 'aws-foundational-security-best-practices%')
    ) 
    SELECT
      amm.*
    , security_hub.*
    FROM
      (security_hub
    INNER JOIN "security_lake_visualization"."aws_account_metadata" amm ON (security_hub.cloud.account_uid = amm.id))

The SQL above performs a subquery to find only those findings in the Security Lake table that are from the AWS FSBP standard and then joins those rows with the aws_account_metadata table based on the AWS account ID. You can see it has created a new view listed under Views containing enriched security data that you can import as a dataset in QuickSight.

Figure 11 – Additional view added to the security_lake_visualization database

Figure 11: Additional view added to the security_lake_visualization database

Configuring QuickSight

To perform the initial steps to set up QuickSight in the consumer AWS account, you can follow the steps listed in the second post in this series. You must also provide the following grants to your QuickSight user:

Type Resource Permissions
GRANT security_hub_fsbps_joined_view SELECT
GRANT aws_metadata_db (resource link) DESCRIBE
GRANT amazon_security_lake_table_<region>_sh_findings_1_0 (resource link) DESCRIBE
GRANT ON TARGET aws_metadata_db (resource link) SELECT
GRANT ON TARGET amazon_security_lake_table_<region>_sh_findings_1_0 (resource link) SELECT

To create a new dataset in QuickSight, follow these steps:

  1. After your QuickSight user has the necessary permissions, open the QuickSight console and verify that you’re in same Region where Lake Formation is sharing the data.
  2. Add your data by choosing Datasets from the navigation pane and then selecting New dataset. To create a new dataset from new data sources, select Athena.
  3. Enter a data source name, for example security_lake_visualization, leave the Athena workgroup as [ primary ]. Then choose Create data source.
  4. The next step is to select the tables to build your dashboards. On the Choose your table prompt, for Catalog, select AwsDataCatalog. For Database, select the database you created in the previous steps, for example security_lake_visualization. For Table, select the security_hub_fsbps_joined_view you created previously and choose Edit/Preview data.
  5. Figure 12: Choosing the joined dataset in QuickSight

    Figure 12 – Choosing the joined dataset in QuickSight

  6. You will be taken to a screen where you can preview the data in your dataset.
  7. Figure 13: Previewing data in QuickSight

    Figure 13: Previewing data in QuickSight

  8. After you confirm you’re able to preview the data from the view, select the SPICE radio button in the bottom left of the screen and then choose PUBLISH & VISUALIZE.
  9. You can now create analyses and dashboards from Security Hub AWS FSBP standard findings per OU and filter data based on business dimensions available to you through OU structure and account tags.
  10. Figure 14 – QuickSight dashboard showing only ExampleCorpWest OU data and incorporating business dimensions

    Figure 14: QuickSight dashboard showing only ExampleCorpWest OU data and incorporating business dimensions

Clean up the resources

To clean up the resources that you created for this example:

  1. Sign in to the Security Lake delegated admin account and delete the CloudFormation stack by either:
    • Using the CloudFormation console to delete the stack, or
    • Using the AWS CDK to run cdk destroy in your terminal. Follow the instructions and enter y when prompted to delete the stack.
  2. Remove any data filters you created by navigating to data filters within Lake Formation, selecting each one and choosing Delete.

Conclusion

In this final post of the series on visualizing Security Lake data with QuickSight, we introduced you to using a tool—available from AWS Samples—to extract OU structure and account metadata from your organization and use it to securely share Security Lake data on a per-OU basis across your organization. You learned how to enrich Security Lake data with account metadata and use it to create row-level security controls in Lake Formation. You were then able to address a common example of distributing security posture measured by the AWS Foundational Security Best Practices standard as part of AWS Security Hub.

If you have feedback about this post, submit comments in the Comments section below. If you have questions about this post, contact AWS Support.

Chris Lamont-Smith

Chris Lamont-Smith

Chris is a Senior Security Consultant working in the Security, Risk and Compliance team for AWS ProServe based out of Perth, Australia. He enjoys working in the area where security and data analytics intersect, and is passionate about helping customers gain actionable insights from their security data. When Chris isn’t working, he is out camping or off-roading with his family in the Australian bush.

How to visualize Amazon Security Lake findings with Amazon QuickSight

Post Syndicated from Mark Keating original https://aws.amazon.com/blogs/security/how-to-visualize-amazon-security-lake-findings-with-amazon-quicksight/

In this post, we expand on the earlier blog post Ingest, transform, and deliver events published by Amazon Security Lake to Amazon OpenSearch Service, and show you how to query and visualize data from Amazon Security Lake using Amazon Athena and Amazon QuickSight. We also provide examples that you can use in your own environment to visualize your data. This post is the second in a multi-part blog series on visualizing data in QuickSight and provides an introduction to visualizing Security Lake data using QuickSight. The first post in the series is Aggregating, searching, and visualizing log data from distributed sources with Amazon Athena and Amazon QuickSight.

With the launch of Amazon Security Lake, it’s now simpler and more convenient to access security-related data in a single place. Security Lake automatically centralizes security data from cloud, on-premises, and custom sources into a purpose-built data lake stored in your account, and removes the overhead related to building and scaling your infrastructure as your data volumes increase. With Security Lake, you can get a more complete understanding of your security data across your entire organization. You can also improve the protection of your workloads, applications, and data.

Security Lake has adopted the Open Cybersecurity Schema Framework (OCSF), an open standard. With OCSF support, the service can normalize and combine security data from AWS and a broad range of enterprise security data sources. Using the native ingestion capabilities of the service to pull in AWS CloudTrail, Amazon Route 53, VPC Flow Logs, or AWS Security Hub findings, ingesting supported third-party partner findings, or ingesting your own security-related logs, Security Lake provides an environment in which you can correlate events and findings by using a broad range of tools from the AWS and APN partner community.

Many customers have already deployed and maintain a centralized logging solution using services such as Amazon OpenSearch Service or a third-party security information and event management (SIEM) tool, and often use business intelligence (BI) tools such as Amazon QuickSight to gain insights into their data. With Security Lake, you have the freedom to choose how you analyze this data. In some cases, it may be from a centralized team using OpenSearch or a SIEM tool, and in other cases it may be that you want the ability to give your teams access to QuickSight dashboards or provide specific teams access to a single data source with Amazon Athena.

Before you get started

To follow along with this post, you must have:

  • A basic understanding of Security Lake, Athena, and QuickSight
  • Security Lake already deployed and accepting data sources
  • An existing QuickSight deployment that can be used to visualize Security Lake data, or an account where you can sign up for QuickSight to create visualizations

Accessing data

Security Lake uses the concept of data subscribers when it comes to accessing your data. A subscriber consumes logs and events from Security Lake, and supports two types of access:

  • Data access — Subscribers can directly access Amazon Simple Storage Service (Amazon S3) objects and receive notifications of new objects through a subscription endpoint or by polling an Amazon Simple Queue Service (Amazon SQS) queue. This is the architecture typically used by tools such as OpenSearch Service and partner SIEM solutions.
  • Query access — Subscribers with query access can directly query AWS Lake Formation tables in your S3 bucket by using services like Athena. Although the primary query engine for Security Lake is Athena, you can also use other services that integrate with AWS Glue, such as Amazon Redshift Spectrum and Spark SQL.

In the sections that follow, we walk through how to configure cross-account sharing from Security Lake to visualize your data with QuickSight, and the associated Athena queries that are used. It’s a best practice to isolate log data from visualization workloads, and we recommend using a separate AWS account for QuickSight visualizations. A high-level overview of the architecture is shown in Figure 1.

Figure 1: Security Lake visualization architecture overview

Figure 1: Security Lake visualization architecture overview

In Figure 1, Security Lake data is being cataloged by AWS Glue in account A. This catalog is then shared to account B by using AWS Resource Access Manager. Users in account B are then able to directly query the cataloged Security Lake data using Athena, or get visualizations by accessing QuickSight dashboards that use Athena to query the data.

Configure a Security Lake subscriber

The following steps guide you through configuring a Security Lake subscriber using the delegated administrator account.

To configure a Security Lake subscriber

  1. Sign in to the AWS Management Console and navigate to the Amazon Security Lake console in the Security Lake delegated administrator account. In this post, we’ll call this Account A.
  2. Go to Subscribers and choose Create subscriber.
  3. On the Subscriber details page, enter a Subscriber name. For example, cross-account-visualization.
  4. For Log and event sources, select All log and event sources. For Data access method, select Lake Formation.
  5. Add the Account ID for the AWS account that you’ll use for visualizations. In this post, we’ll call this Account B.
  6. Add an External ID to configure secure cross-account access. For more information, see How to use an external ID when granting access to your AWS resources to a third party.
  7. Choose Create.

Security Lake creates a resource share in your visualizations account using AWS Resource Access Manager (AWS RAM). You can view the configuration of the subscriber from Security Lake by selecting the subscriber you just created from the main Subscribers page. It should look like Figure 2.

Figure 2: Subscriber configuration

Figure 2: Subscriber configuration

Note: your configuration might be slightly different, based on what you’ve named your subscriber, the AWS Region you’re using, the logs being ingested, and the external ID that you created.

Configure Athena to visualize your data

Now that the subscriber is configured, you can move on to the next stage, where you configure Athena and QuickSight to visualize your data.

Note: In the following example, queries will be against Security Hub findings, using the Security Lake table in the ap-southeast-2 Region. If necessary, change the table name in your queries to match the Security Lake Region you use in the following configuration steps.

To configure Athena

  1. Sign in to your QuickSight visualization account (Account B).
  2. Navigate to the AWS Resource Access Manager (AWS RAM) console. You’ll see a Resource share invitation under Shared with me in the menu on the left-hand side of the screen. Choose Resource shares to go to the invitation.
    Figure 3: RAM menu

    Figure 3: RAM menu

  3. On the Resource shares page, select the name of the resource share starting with LakeFormation-V3, and then choose Accept resource share. The Security Lake Glue catalog is now available to Account B to query.
  4. For cross-account access, you should create a database to link the shared tables. Navigate to Lake Formation, and then under the Data catalog menu option, select Databases, then select Create database.
  5. Enter a name, for example security_lake_visualization, and keep the defaults for all other settings. Choose Create database.
    Figure 4: Create database

    Figure 4: Create database

  6. After you’ve created the database, you need to create resource links from the shared tables into the database. Select Tables under the Data catalog menu option. Select one of the tables shared by Security Lake by selecting the table’s name. You can identify the shared tables by looking for the ones that start with amazon_security_lake_table_.
  7. From the Actions dropdown list, select Create resource link.
    Figure 5: Creating a resource link

    Figure 5: Creating a resource link

  8. Enter the name for the resource link, for example amazon_security_lake_table_ap_southeast_2_sh_findings_1_0, and then select the security_lake_visualization database created in the previous steps.
  9. Choose Create. After the links have been created, the names of the resource links will appear in italics in the list of tables.
  10. You can now select the radio button next to the resource link, select Actions, and then select View data under Table. This takes you to the Athena query editor, where you can now run queries on the shared Security Lake tables.
    Figure 6: Viewing data to query

    Figure 6: Viewing data to query

    To use Athena for queries, you must configure an S3 bucket to store query results. If this is the first time Athena is being used in your account, you’ll receive a message saying that you need to configure an S3 bucket. To do this, choose Edit settings in the information notice and follow the instructions.

  11. In the Editor configuration, select AwsDataCatalog from the Data source options. The Database should be the database you created in the previous steps, for example security_lake_visualization.
  12. After selecting the database, copy the query that follows and paste it into your Athena query editor, and then choose Run. This runs your first query to list 10 Security Hub findings:
    Figure 7: Athena data query editor

    Figure 7: Athena data query editor

    SELECT * FROM 
    "AwsDataCatalog"."security_lake_visualization"."amazon_security_lake_table_ap_southeast_2_sh_findings_1_0" limit 10;

    This queries Security Hub data in Security Lake from the Region you specified, and outputs the results in the Query results section on the page. For a list of example Security Lake specific queries, see the AWS Security Analytics Bootstrap project, where you can find example queries specific to each of the Security Lake natively ingested data sources.

  13. To build advanced dashboards, you can create views using Athena. The following is an example of a view that lists 100 findings with failed checks sorted by created_time of the findings.
    CREATE VIEW security_hub_new_failed_findings_by_created_time AS
    SELECT
    finding.title, cloud.account_uid, compliance.status, metadata.product.name
    FROM "security_lake_visualization"."amazon_security_lake_table_ap_southeast_2_sh_findings_1_0"
    WHERE compliance.status = 'FAILED'
    ORDER BY finding.created_time
    limit 100;

  14. You can now query the view to list the first 10 rows using the following query.
    SELECT * FROM 
    "security_lake_visualization"."security_hub_new_failed_findings_by_created_time" limit 10;

Create a QuickSight dataset

Now that you’ve done a sample query and created a view, you can use Athena as the data source to create a dataset in QuickSight.

To create a QuickSight dataset

  1. Sign in to your QuickSight visualization account (also known as Account B), and open the QuickSight console.
  2. If this is the first time you’re using QuickSight, you need to sign up for a QuickSight subscription.
  3. Although there are multiple ways to sign in to QuickSight, we used AWS Identity and Access Management (IAM) based access to build the dashboards. To use QuickSight with Athena and Lake Formation, you first need to authorize connections through Lake Formation.
  4. When using cross-account configuration with AWS Glue Catalog, you also need to configure permissions on tables that are shared through Lake Formation. For a detailed deep dive, see Use Amazon Athena and Amazon QuickSight in a cross-account environment. For the use case highlighted in this post, use the following steps to grant access on the cross-account tables in the Glue Catalog.
    1. In the AWS Lake Formation console, navigate to the Tables section and select the resource link for the table, for example amazon_security_lake_table_ap_southeast_2_sh_findings_1_0.
    2. Select Actions. Under Permissions, select Grant on target.
    3. For Principals, select SAML users and groups, and then add the QuickSight user’s ARN captured in step 2 of the topic Authorize connections through Lake Formation.
    4. For the LF-Tags or catalog resources section, use the default settings.
    5. For Table permissions, choose Select for both Table Permissions and Grantable Permissions.
    6. Choose Grant.
    Figure 8: Granting permissions in Lake Formation

    Figure 8: Granting permissions in Lake Formation

  5. After permissions are in place, you can create datasets. You should also verify that you’re using QuickSight in the same Region where Lake Formation is sharing the data. The simplest way to determine your Region is to check the QuickSight URL in your web browser. The Region will be at the beginning of the URL. To change the Region, select the settings icon in the top right of the QuickSight screen and select the correct Region from the list of available Regions in the drop-down menu.
  6. Select Datasets, and then select New dataset. Select Athena from the list of available data sources.
  7. Enter a Data source name, for example security_lake_visualizations, and leave the Athena workgroup as [primary]. Then select Create data source.
  8. Select the tables to build your dashboards. On the Choose your table prompt, for Catalog, select AwsDataCatalog. For Database, select the database you created in the previous steps, for example security_lake_visualization. For Table, select the table with the name starting with amazon_security_lake_table_. Choose Select.
    Figure 9: Selecting the table for a new dataset

    Figure 9: Selecting the table for a new dataset

  9. On the Finish dataset creation prompt, select Import to SPICE for quicker analytics. Choose Visualize.
  10. In the left-hand menu in QuickSight, you can choose attributes from the data set to add analytics and widgets.

After you’re familiar with how to use QuickSight to visualize data from Security Lake, you can create additional datasets and add other widgets to create dashboards that are specific to your needs.

AWS pre-built QuickSight dashboards

So far, you’ve seen how to use Athena manually to query your data and how to use QuickSight to visualize it. AWS Professional Services is excited to announce the publication of the Data Visualization framework to help customers quickly visualize their data using QuickSight. The repository contains a combination of CDK tools and scripts that can be used to create the required AWS objects and deploy basic data sources, datasets, analysis, dashboards, and the required user groups to QuickSight with respect to Security Lake. The framework includes three pre-built dashboards based on the following personas.

Persona Role description Challenges Goals
CISO/Executive Stakeholder Owns and operates, with their support staff, all security-related activities within a business; total financial and risk accountability
  • Difficult to assess organizational aggregated security risk
  • Burdened by license costs of security tooling
  • Less agility in security programs due to mounting cost and complexity
  • Reduce risk
  • Reduce cost
  • Improve metrics (MTTD/MTTR and others)
Security Data Custodian Aggregates all security-related data sources while managing cost, access, and compliance
  • Writes new custom extract, transform, and load (ETL) every time a new data source shows up; difficult to maintain
  • Manually provisions access for users to view security data
  • Constrained by cost and performance limitations in tools depending on licenses and hardware
  • Reduce overhead to integrate new data
  • Improve data governance
  • Streamline access
Security Operator/Analyst Uses security tooling to monitor, assess, and respond to security-related events. Might perform incident response (IR), threat hunting, and other activities.
  • Moves between many security tools to answer questions about data
  • Lacks substantive automated analytics; manually processing and analyzing data
  • Can’t look historically due to limitations in tools (licensing, storage, scalability)
  • Reduce total number of tools
  • Increase observability
  • Decrease time to detect and respond
  • Decrease “alert fatigue”

After deploying through the CDK, you will have three pre-built dashboards configured and available to view. Once deployed, each of these dashboards can be customized according to your requirements. The Data Lake Executive dashboard provides a high-level overview of security findings, as shown in Figure 10.

Figure 10: Example QuickSight dashboard showing an overview of findings in Security Lake

Figure 10: Example QuickSight dashboard showing an overview of findings in Security Lake

The Security Lake custodian role will have visibility of security related data sources, as shown in Figure 11.

Figure 11: Security Lake custodian dashboard

Figure 11: Security Lake custodian dashboard

And the Security Lake operator will have a view of security related events, as shown in Figure 12.

Figure 12: Security Operator dashboard

Figure 12: Security Operator dashboard

Conclusion

In this post, you learned about Security Lake, and how you can use Athena to query your data and QuickSight to gain visibility of your security findings stored within Security Lake. When using QuickSight to visualize your data, it’s important to remember that the data remains in your S3 bucket within your own environment. However, if you have other use cases or wish to use other analytics tools such as OpenSearch, Security Lake gives you the freedom to choose how you want to interact with your data.

We also introduced the Data Visualization framework that was created by AWS Professional Services. The framework uses the CDK to deploy a set of pre-built dashboards to help get you up and running quickly.

With the announcement of AWS AppFabric, we’re making it even simpler to ingest data directly into Security Lake from leading SaaS applications without building and managing custom code or point-to-point integrations, enabling quick visualization of your data from a single place, in a common format.

For additional information on using Athena to query Security Lake, have a look at the AWS Security Analytics Bootstrap project, where you can find queries specific to each of the Security Lake natively ingested data sources. If you want to learn more about how to configure and use QuickSight to visualize findings, we have hands-on QuickSight workshops to help you configure and build QuickSight dashboards for visualizing your data.

 
If you have feedback about this post, submit comments in the Comments section below. If you have questions about this post, contact AWS Support.

Want more AWS Security news? Follow us on Twitter.

Mark Keating

Mark Keating

Mark is an AWS Security Solutions Architect based out of the U.K. who works with Global Healthcare & Life Sciences and Automotive customers to solve their security and compliance challenges and help them reduce risk. He has over 20 years of experience working with technology, within in operations, solution, and enterprise architecture roles.

Pratima Singh

Pratima Singh

Pratima is a Security Specialist Solutions Architect with Amazon Web Services based out of Sydney, Australia. She is a security enthusiast who enjoys helping customers find innovative solutions to complex business challenges. Outside of work, Pratima enjoys going on long drives and spending time with her family at the beach.

David Hoang

David Hoang

David is a Shared Delivery Team Senior Security Consultant at AWS. His background is in AWS security, with a focus on automation. David designs, builds, and implements scalable enterprise solutions with security guardrails that use AWS services.

Ajay Rawat

Ajay Rawat

Ajay is a Security Consultant in a shared delivery team at AWS. He is a technology enthusiast who enjoys working with customers to solve their technical challenges and to improve their security posture in the cloud.

Generate machine learning insights for Amazon Security Lake data using Amazon SageMaker

Post Syndicated from Jonathan Nguyen original https://aws.amazon.com/blogs/security/generate-machine-learning-insights-for-amazon-security-lake-data-using-amazon-sagemaker/

Amazon Security Lake automatically centralizes the collection of security-related logs and events from integrated AWS and third-party services. With the increasing amount of security data available, it can be challenging knowing what data to focus on and which tools to use. You can use native AWS services such as Amazon QuickSight, Amazon OpenSearch, and Amazon SageMaker Studio to visualize, analyze, and interactively identify different areas of interest to focus on, and prioritize efforts to increase your AWS security posture.

In this post, we go over how to generate machine learning insights for Security Lake using SageMaker Studio. SageMaker Studio is a web integrated development environment (IDE) for machine learning that provides tools for data scientists to prepare, build, train, and deploy machine learning models. With this solution, you can quickly deploy a base set of Python notebooks focusing on AWS Security Hub findings in Security Lake, which can also be expanded to incorporate other AWS sources or custom data sources in Security Lake. After you’ve run the notebooks, you can use the results to help you identify and focus on areas of interest related to security within your AWS environment. As a result, you might implement additional guardrails or create custom detectors to alert on suspicious activity.

Prerequisites

  1. Specify a delegated administrator account to manage the Security Lake configuration for all member accounts within your organization.
  2. Security Lake has been enabled in the delegated administrator AWS account.
  3. As part of the solution in this post, we focus on Security Hub as a data source. AWS Security Hub must be enabled for your AWS Organizations. When enabling Security Lake, select All log and event sources to include AWS Security Hub findings.
  4. Configure subscriber query access to Security Lake. Security Lake uses AWS Lake Formation cross-account table sharing to support subscriber query access. Accept the resource share request in the subscriber AWS account in AWS Resource Access Manager (AWS RAM). Subscribers with query access can query the data that Security Lake collects. These subscribers query Lake Formation tables in an Amazon Simple Storage Service (Amazon S3) bucket with Security Lake data using services such as Amazon Athena.

Solution overview

Figure 1 that follows depicts the architecture of the solution.

Figure 1 SageMaker machine learning insights architecture for Security Lake

Figure 1 SageMaker machine learning insights architecture for Security Lake

The deployment builds the architecture by completing the following steps:

  1. A Security Lake is set up in an AWS account with supported log sources — such as Amazon VPC Flow Logs, AWS Security Hub, AWS CloudTrail, and Amazon Route53 — configured.
  2. Subscriber query access is created from the Security Lake AWS account to a subscriber AWS account.

    Note: See Prerequisite #4 for more information.

  3. The AWS RAM resource share request must be accepted in the subscriber AWS account where this solution is deployed.

    Note: See Prerequisite #4 for more information.

  4. A resource link database in Lake Formation is created in the subscriber AWS account and grants access for the Athena tables in the Security Lake AWS account.
  5. VPC is provisioned for SageMaker with IGW, NAT GW, and VPC endpoints for the AWS services used in the solution. IGW and NAT are required to install external open-source packages.
  6. A SageMaker Domain for SageMaker Studio is created in VPCOnly mode with a single SageMaker user profile that is tied to a dedicated AWS Identity and Access Management (IAM) role.
  7. A dedicated IAM role is created to restrict access to create and access the presigned URL for the SageMaker Domain from a specific CIDR for accessing the SageMaker notebook.
  8. An AWS CodeCommit repository containing Python notebooks is used for the AI and ML workflow by the SageMaker user-profile.
  9. An Athena workgroup is created for the Security Lake queries with an S3 bucket for output location (access logging configured for the output bucket).

Deploy the solution

You can deploy the SageMaker solution by using either the AWS Management Console or the AWS Cloud Development Kit (AWS CDK).

Option 1: Deploy the solution with AWS CloudFormation using the console

Use the console to sign in to your subscriber AWS account and then choose the Launch Stack button to open the AWS CloudFormation console pre-loaded with the template for this solution. It takes approximately 10 minutes for the CloudFormation stack to complete.

Select this image to open a link that starts building the CloudFormation stack

Option 2: Deploy the solution by using the AWS CDK

You can find the latest code for the SageMaker solution in the SageMaker machine learning insights GitHub repository, where you can also contribute to the sample code. For instructions and more information on using the AWS CDK, see Get Started with AWS CDK.

To deploy the solution by using the AWS CDK

  1. To build the app when navigating to the project’s root folder, use the following commands:
    npm install -g aws-cdk-lib
    npm install

  2. Update IAM_role_assumption_for_sagemaker_presigned_url and security_lake_aws_account default values in source/lib/sagemaker_domain.ts with their respective appropriate values.
  3. Run the following commands in your terminal while authenticated in your subscriber AWS account. Be sure to replace <INSERT_AWS_ACCOUNT> with your account number and replace <INSERT_REGION> with the AWS Region that you want the solution deployed to.
    cdk bootstrap aws://<INSERT_AWS_ACCOUNT>/<INSERT_REGION>
    cdk deploy

Post deployment steps

Now that you’ve deployed the SageMaker solution, you must grant the SageMaker user profile in the subscriber AWS account query access to your Security Lake. You can Grant permission for the SageMaker user profile to Security Lake in Lake Formation in the subscriber AWS account.

Grant permission to the Security Lake database

  1. Copy the SageMaker user-profile Amazon resource name (ARN) arn:aws:iam::<account-id>:role/sagemaker-user-profile-for-security-lake
  2. Go to Lake Formation in the console.
  3. Select the amazon_security_lake_glue_db_us_east_1 database.
  4. From the Actions Dropdown, select Grant.
  5. In Grant Data Permissions, select SAML Users and Groups.
  6. Paste the SageMaker user profile ARN from Step 1.
  7. In Database Permissions, select Describe and then Grant.

Grant permission to Security Lake – Security Hub table

  1. Copy the SageMaker user-profile ARN arn:aws:iam:<account-id>:role/sagemaker-user-profile-for-security-lake
  2. Go to Lake Formation in the console.
  3. Select the amazon_security_lake_glue_db_us_east_1 database.
  4. Choose View Tables.
  5. Select the amazon_security_lake_table_us_east_1_sh_findings_1_0 table.
  6. From Actions Dropdown, select Grant.
  7. In Grant Data Permissions, select SAML Users and Groups.
  8. Paste the SageMaker user-profile ARN from Step 1.
  9. In Table Permissions, select Describe and then Grant.

Launch your SageMaker Studio application

Now that you have granted permissions for a SageMaker user-profile, we can move on to launching the SageMaker application associated to that user-profile.

  1. Navigate to the SageMaker Studio domain in the console.
  2. Select the SageMaker domain security-lake-ml-insights-<account-id>.
  3. Select the SageMaker user profile sagemaker-user-profile-for-security-lake.
  4. Select the Launch drop-down and select Studio
    Figure 2 SageMaker domain user-profile AWS console screen

    Figure 2: SageMaker domain user-profile AWS console screen

Clone Python notebooks

You’ll work primarily in the SageMaker user profile to create a data-science app to work in. As part of the solution deployment, we’ve created Python notebooks in CodeCommit that you will need to clone.

To clone the Python notebooks

  1. Navigate to CloudFormation in the console.
  2. In the Stacks section, select the SageMakerDomainStack.
  3. Select to the Outputs tab/
  4. Copy the value for sagemakernotebookmlinsightsrepositoryURL. (For example: https://git-codecommit.us-east-1.amazonaws.com/v1/repos/sagemaker_ml_insights_repo)
  5. Go back to your SageMaker app.
  6. In Studio, in the left sidebar, choose the Git icon (identified by a diamond with two branches), then choose Clone a Repository.
    Figure 3 SageMaker clone CodeCommit repository

    Figure 3: SageMaker clone CodeCommit repository

  7. Paste the CodeCommit repository link from Step 4 under the Git repository URL (git). After you paste the URL, select Clone “https://git-codecommit.us-east-1.amazonaws.com/v1/repos/sagemaker_ml_insights_repo”, then select Clone.

    NOTE: If you don’t select from the auto-populated drop-down, SageMaker won’t be able to clone the repository.

    Figure 4 SageMaker clone CodeCommit URL

    Figure 4: SageMaker clone CodeCommit URL

Generating machine learning insights using SageMaker Studio

You’ve successfully pulled the base set of Python notebooks into your SageMaker app and they can be accessed at sagemaker_ml_insights_repo/notebooks/tsat/. The notebooks provide you with a starting point for running machine learning analysis using Security Lake data. These notebooks can be expanded to existing native or custom data sources being sent to Security Lake.

Figure 5: SageMaker cloned Python notebooks

Figure 5: SageMaker cloned Python notebooks

Notebook #1 – Environment setup

The 0.0-tsat-environ-setup notebook handles the installation of the required libraries and dependencies needed for the subsequent notebooks within this blog. For our notebooks, we use an open-source Python library called Kats, which is a lightweight, generalizable framework to perform time series analysis.

  1. Select the 0.0-tsat-environ-setup.ipynb notebook for the environment setup.

    Note: If you have already provisioned a kernel, you can skip steps 2 and 3.

  2. In the right-hand corner, select No Kernel
  3. In the Set up notebook environment pop-up, leave the defaults and choose Select.
    Figure 6 SageMaker application environment settings

    Figure 6: SageMaker application environment settings

  4. After the kernel has successfully started, choose the Terminal icon to open the image terminal.
    Figure 7: SageMaker application terminal

    Figure 7: SageMaker application terminal

  5. To install open-source packages from https instead of http, you must update the sources.list file. After the terminal opens, send the following commands:
    cd /etc/apt
    sed -i 's/http:/https:/g' sources.list

  6. Go back to the 0.0-tsat-environ-setup.ipynb notebook and select the Run drop-down and select Run All Cells. Alternatively, you can run each cell independently, but it’s not required. Grab a coffee! This step will take about 10 minutes.

    IMPORTANT: If you complete the installation out of order or update the requirements.txt file, you might not be able to successfully install Kats and you will need to rebuild your environment by using a net-new SageMaker user profile.

  7. After installing all the prerequisites, check the Kats version to determine if it was successfully installed.
    Figure 8: Kats installation verification

    Figure 8: Kats installation verification

  8. Install PyAthena (Python DB API client for Amazon Athena) which is used to query your data in Security Lake.

You’ve successfully set up the SageMaker app environment! You can now load the appropriate dataset and create a time series.

Notebook #2 – Load data

The 0.1-load-data notebook establishes the Athena connection to query data in Security Lake and creates the resulting time series dataset. The time series dataset will be used for subsequent notebooks to identify trends, outliers, and change points.

  1. Select the 0.1-load-data.ipynb notebook.
  2. If you deployed the solution outside of us-east-1, update the con details to the appropriate Region. In this example, we’re focusing on Security Hub data within Security Lake. If you want to change the underlying data source, you can update the TABLE value.
    Figure 9: SageMaker notebook load Security Lake data settings

    Figure 9: SageMaker notebook load Security Lake data settings

  3. In the Query section, there’s an Athena query to pull specific data from Security Hub, this can be expanded as needed to a subset or can include all products within Security Hub. The query below pulls Security Hub information after 01:00:00 1/1/2022 from the products listed in productname.
    Figure 10: SageMaker notebook Athena query

    Figure 10: SageMaker notebook Athena query

  4. After the values have been updated, you can create your time series dataset. For this notebook, we recommend running each cell individually instead of running all cells at once so you can get a bit more familiar with the process. Select the first cell and choose the Run icon.
    Figure 11: SageMaker run Python notebook code

    Figure 11: SageMaker run Python notebook code

  5. Follow the same process as Step 4 for the subsequent cells.

    Note: If you encounter any issues with querying the table, make sure you completed the post-deployment step for Grant permission to Security Lake – Security Hub table.

You’ve successfully loaded your data and created a timeseries! You can now move on to generating machine learning insights from your timeseries.

Notebook #3 – Trend detector

The 1.1-trend-detector.ipynb notebook handles trend detection in your data. Trend represents a directional change in the level of a time series. This directional change can be either upward (increase in level) or downward (decrease in level). Trend detection helps detect a change while ignoring the noise from natural variability. Each environment is different, and trends help us identify where to look more closely to determine why a trend is positive or negative.

  1. Select 1.1-trend-detector.ipynb notebook for trend detection.
  2. Slopes are created to identify the relationship between x (time) and y (counts).
    Figure 12: SageMaker notebook slope view

    Figure 12: SageMaker notebook slope view

  3. If the counts are increasing with time, then it’s considered a positive slope and the reverse is considered a negative slope. A positive slope isn’t necessarily a good thing because in an ideal state we would expect counts of a finding type to come down with time.
    Figure 13: SageMaker notebook trend view

    Figure 13: SageMaker notebook trend view

  4. Now you can plot the top five positive and negative trends to identify the top movers.
    Figure 14: SageMaker notebook trend results view

    Figure 14: SageMaker notebook trend results view

Notebook #4 – Outlier detection

The 1.2-outlier-detection.ipynb notebook handles outlier detection. This notebook does a seasonal decomposition of the input time series, with additive or multiplicative decomposition as specified (default is additive). It uses a residual time series by either removing only trend or both trend and seasonality if the seasonality is strong. The intent is to discover useful, abnormal, and irregular patterns within data sets, allowing you to pinpoint areas of interest.

  1. To start, it detects points in the residual that are over 5 times the inter-quartile range.
  2. Inter-quartile range (IQR) is the difference between the seventy-fifth and twenty-fifth percentiles of residuals or the spread of data within the middle two quartiles of the entire dataset. IQR is useful in detecting the presence of outliers by looking at values that might lie outside of the middle two quartiles.
  3. The IQR multiplier controls the sensitivity of the range and decision of identifying outliers. By using a larger value for the iqr_mult_thresh parameter in OutlierDetector, outliers would be considered data points, while a smaller value would identify data points as outliers.

    Note: If you don’t have enough data, decrease iqr_mult_thresh to a lower value (for example iqr_mult_thresh=3).

    Figure 15: SageMaker notebook outlier setting

    Figure 15: SageMaker notebook outlier setting

  4. Along with outlier detection plots, investigation SQL will be displayed as well, which can help with further investigation of the outliers.

    In the diagram that follows, you can see that there are several outliers in the number of findings, related to failed AWS Firewall Manager policies, which have been identified by the vertical red lines within the line graph. These are outliers because they deviate from the normal behavior and number of findings on a day-to-day basis. When you see outliers, you can look at the resources that might have caused an unusual increase in Firewall Manager policy findings. Depending on the findings, it could be related to an overly permissive or noncompliant security group or a misconfigured AWS WAF rule group.

    Figure 16: SageMaker notebook outlier results view

    Figure 16: SageMaker notebook outlier results view

Notebook #5 – Change point detection

The 1.3-changepoint-detector.ipynb notebook handles the change point detection. Change point detection is a method to detect changes in a time series that persist over time, such as a change in the mean value. To detect a baseline to identify when several changes might have occurred from that point. Change points occur when there’s an increase or decrease to the average number of findings within a data set.

  1. Along with identifying change points within the data set, the investigation SQL is generated to further investigate the specific change point if applicable.

    In the following diagram, you can see there’s a change point decrease after July 27, 2022, with confidence of 99.9 percent. It’s important to note that change points differ from outliers, which are sudden changes in the data set observed. This diagram means there was some change in the environment that resulted in an overall decrease in the number of findings for S3 buckets with block public access being disabled. The change could be the result of an update to the CI/CD pipelines provisioning S3 buckets or automation to enable all S3 buckets to block public access. Conversely, if you saw a change point that resulted in an increase, it could mean that there was a change that resulted in a larger number of S3 buckets with a block public access configuration consistently being disabled.

    Figure 17: SageMaker changepoint detector view

    Figure 17: SageMaker changepoint detector view

By now, you should be familiar with the set up and deployment for SageMaker Studio and how you can use Python notebooks to generate machine learning insights for your Security Lake data. You can take what you’ve learned and start to curate specific datasets and data sources within Security Lake, create a time series, detect trends, and identify outliers and change points. By doing so, you can answer a variety of security-related questions such as:

  • CloudTrail

    Is there a large volume of Amazon S3 download or copy commands to an external resource? Are you seeing a large volume of S3 delete object commands? Is it possible there’s a ransomware event going on?

  • VPC Flow Logs

    Is there an increase in the number of requests from your VPC to external IPs? Is there an increase in the number of requests from your VPC to your on-premises CIDR? Is there a possibility of internal or external data exfiltration occurring?

  • Route53

    Which resources are making DNS requests that they haven’t typically made within the last 30–45 days? When did it start? Is there a potential command and control session occurring on an Amazon Elastic Compute Cloud (Amazon EC2) instance?

It’s important to note that this isn’t a solution to replace Amazon GuardDuty, which uses foundational data sources to detect communication with known malicious domains and IP addresses and identify anomalous behavior, or Amazon Detective, which provides customers with prebuilt data aggregations, summaries, and visualizations to help security teams conduct faster and more effective investigations. One of the main benefits of using Security Lake and SageMaker Studio is the ability to interactively create and tailor machine learning insights specific to your AWS environment and workloads.

Clean up

If you deployed the SageMaker machine learning insights solution by using the Launch Stack button in the AWS Management Console or the CloudFormation template sagemaker_ml_insights_cfn, do the following to clean up:

  1. In the CloudFormation console for the account and Region where you deployed the solution, choose the SageMakerML stack.
  2. Choose the option to Delete the stack.

If you deployed the solution by using the AWS CDK, run the command cdk destroy.

Conclusion

Amazon Security Lake gives you the ability to normalize and centrally store your security data from various log sources to help you analyze, visualize, and correlate appropriate security logs. You can then use this data to increase your overall security posture by implementing additional security guardrails or take appropriate remediation actions within your AWS environment.

In this blog post, you learned how you can use SageMaker to generate machine learning insights for your Security Hub findings in Security Lake. Although the example solution focuses on a single data source within Security Lake, you can expand the notebooks to incorporate other native or custom data sources in Security Lake.

There are many different use-cases for Security Lake that can be tailored to fit your AWS environment. Take a look at this blog post to learn how you can ingest, transform and deliver Security Lake data to Amazon OpenSearch to help your security operations team quickly analyze security data within your AWS environment. In supported Regions, new Security Lake account holders can try the service free for 15 days and gain access to its features.

 
If you have feedback about this post, submit comments in the Comments section below. If you have questions about this post, contact AWS Support.

Want more AWS Security news? Follow us on Twitter.

Jonathan Nguyen

Jonathan Nguyen

Jonathan is a Principal Security Architect at AWS. His background is in AWS security, with a focus on threat detection and incident response. He helps enterprise customers develop a comprehensive AWS security strategy, deploy security solutions at scale, and train customers on AWS security best practices.

Madhunika Reddy Mikkili

Madhunika Reddy Mikkili

Madhunika is a Data and Machine Learning Engineer with the AWS Professional Services Shared Delivery Team. She is passionate about helping customers achieve their goals through the use of data and machine learning insights. Outside of work, she loves traveling and spending time with family and friends.

Generate security insights from Amazon Security Lake data using Amazon OpenSearch Ingestion

Post Syndicated from Muthu Pitchaimani original https://aws.amazon.com/blogs/big-data/generate-security-insights-from-amazon-security-lake-data-using-amazon-opensearch-ingestion/

Amazon Security Lake centralizes access and management of your security data by aggregating security event logs from AWS environments, other cloud providers, on premise infrastructure, and other software as a service (SaaS) solutions. By converting logs and events using Open Cybersecurity Schema Framework, an open standard for storing security events in a common and shareable format, Security Lake optimizes and normalizes your security data for analysis using your preferred analytics tool.

Amazon OpenSearch Service continues to be a tool of choice by many enterprises for searching and analyzing large volume of security data. In this post, we show you how to ingest and query Amazon Security Lake data with Amazon OpenSearch Ingestion, a serverless, fully managed data collector with configurable ingestion pipelines. Using OpenSearch Ingestion to ingest data into your OpenSearch Service cluster, you can derive insights quicker for time sensitive security investigations. You can respond swiftly to security incidents, helping you protect your business critical data and systems.

Solution overview

The following architecture outlines the flow of data from Security Lake to OpenSearch Service.

The workflow contains the following steps:

  1. Security Lake persists OCSF schema normalized data in an Amazon Simple Storage Service (Amazon S3) bucket determined by the administrator.
  2. Security Lake notifies subscribers through the chosen subscription method, in this case Amazon Simple Queue Service (Amazon SQS).
  3. OpenSearch Ingestion registers as a subscriber to get the necessary context information.
  4. OpenSearch Ingestion reads Parquet formatted security data from the Security Lake managed Amazon S3 bucket and transforms the security logs into JSON documents.
  5. OpenSearch Ingestion ingests this OCSF compliant data into OpenSearch Service.
  6. Download and import provided dashboards to analyze and gain quick insights into the security data.

OpenSearch Ingestion provides a serverless ingestion framework to easily ingest Security Lake data into OpenSearch Service with just a few clicks.

Prerequisites

Complete the following prerequisite steps:

  1. Create an Amazon OpenSearch Service domain. For instructions, refer to Creating and managing Amazon OpenSearch Service domains.
  2. You must have access to the AWS account in which you wish to set up this solution.

Set up Amazon Security Lake

In this section, we present the steps to set up Amazon Security Lake, which includes enabling the service and creating a subscriber.

Enable Amazon Security Lake

Identify the account in which you want to activate Amazon Security Lake. Note that for accounts that are part of organizations, you have to designate a delegated Security Lake administrator from your management account. For instructions, refer to Managing multiple accounts with AWS Organizations.

  1. Sign in to the AWS Management Console using the credentials of the delegated account.
  2. On the Amazon Security Lake console, choose your preferred Region, then choose Get started.

Amazon Security Lake collects log and event data from a variety of sources and across your AWS accounts and Regions.

Now you’re ready to enable Amazon Security Lake.

  1. You can either select All log and event sources or choose specific logs by selecting Specific log and event sources.
  2. Data is ingested from all Regions. The recommendation is to select All supported regions so activities are logged for accounts that you might not frequently use as well. However, you also have the option to select Specific Regions.
  3. For Select accounts, you can select the accounts in which you want Amazon Security Lake enabled. For this post, we select All accounts.

  1. You’re prompted to either create a new AWS Identity and Access Management (IAM) role or use an existing IAM role. This gives required permissions to Amazon Security Lake to collect the logs and events. Choose the option appropriate for your situation.
  2. Choose Next.
  3. Optionally, specify the Amazon S3 storage class for the data in Amazon Security Lake. For more information, refer to Lifecycle management in Security Lake.
  4. Choose Next.
  5. Review the details and create the data lake.

Create an Amazon Security Lake subscriber

To access and consume data in your Security Lake managed Amazon S3 buckets, you must set up a subscriber.

Complete the following steps to create your subscriber:

  1. On the Amazon Security Lake console, choose Summary in the navigation pane.

Here, you can see the number of Regions selected.

  1. Choose Create subscriber.

A subscriber consumes logs and events from Amazon Security Lake. In this case, the subscriber is OpenSearch Ingestion, which consumes security data and ingests it into OpenSearch Service.

  1. For Subscriber name, enter OpenSearchIngestion.
  2. Enter a description.
  3. Region is automatically populated based on the current selected Region.
  4. For Log and event sources, select whether the subscriber is authorized to consume all log and event sources or specific log and event sources.
  5. For Data access method, select S3.
  6. For Subscriber credentials, enter the subscriber’s <AWS account ID> and OpenSearchIngestion-<AWS account ID>.
  7. For Notification details, select SQS queue.

This prompts Amazon Security Lake to create an SQS queue that the subscriber can poll for object notifications.

  1. Choose Create.

Install templates and dashboards for Amazon Security Lake data

Your subscriber for OpenSearch Ingestion is now ready. Before you configure OpenSearch Ingestion to process the security data, let’s configure an OpenSearch sink (destination to write data) with index templates and dashboards.

Index templates are predefined mappings for security data that selects the correct OpenSearch field types for corresponding Open Cybersecurity Schema Framework (OCSF) schema definition. In addition, index templates also contain index-specific settings for a particular index patterns. OCSF classifies security data into different categories such as system activity, findings, identity and access management, network activity, application activity and discovery.

Amazon Security Lake publishes events from four different AWS sources: AWS CloudTrail with subsets for AWS Lambda and Amazon Simple Storage Service (Amazon S3), Amazon Virtual Private Cloud(Amazon VPC) Flow Logs, Amazon Route 53, and AWS Security Hub. The following table details the event sources and their corresponding OCSF categories and OpenSearch index templates.

Amazon Security Lake Source OCSF Category ID OpenSearch Index Pattern
CloudTrail (Lambda and Amazon S3 API subsets) 3005 ocsf-3005*
VPC Flow Logs 4001 ocsf-4001*
Route 53 4003 ocsf-4003*
Security Hub 2001 ocsf-2001*

To easily identify OpenSearch indices containing Security Lake data, we recommend following a structured index naming pattern that includes the log category and its OCSF defined class in the name of the index. An example is provided below

ocsf-cuid-${/class_uid}-${/metadata/product/name}-${/class_name}-%{yyyy.MM.dd}

Complete the following steps to install the index templates and dashboards for your data:

  1. Download the component_templates.zip and index_templates.zip files and unzip them on your local device.

Component templates are composable modules with settings, mappings, and aliases that can be shared and used by index templates.

  1. Upload the component templates before the index templates. For example, the following Linux command line shows how to use the OpenSearch _component_template API to upload to your OpenSearch Service domain (change the domain URL and the credentials to appropriate values for your environment):
    ls component_templates | awk -F'_body' '{print $1}' | xargs -I{} curl  -u adminuser:password -X PUT -H 'Content-Type: application/json' -d @component_templates/{}_body.json https://my-opensearch-domain.es.amazonaws.com/_component_template/{}

  2. Once the component templates are successfully uploaded, proceed to upload the index templates:
    ls index_templates | awk -F'_body' '{print $1}' | xargs -I{} curl  -uadminuser:password -X PUT -H 'Content-Type: application/json' -d @index_templates/{}_body.json https://my-opensearch-domain.es.amazonaws.com/_index_template/{}

  3. Verify whether the index templates and component templates are uploaded successfully, by navigating to OpenSearch Dashboards, choose the hamburger menu, then choose Index Management.

  1. In the navigation pane, choose Templates to see all the OCSF index templates.

  1. Choose Component templates to verify the OCSF component templates.

  1. After successfully uploading the templates, download the pre-built dashboards and other components required to visualize the Security Lake data in OpenSearch indices.
  2. To upload these to OpenSearch Dashboards, choose the hamburger menu, and under Management, choose Stack Management.
  3. In the navigation pane, choose Saved Objects.

  1. Choose Import.

  1. Choose Import, navigate to the downloaded file, then choose Import.

  1. Confirm the dashboard objects are imported correctly, then choose Done.

All the necessary index and component templates, index patterns, visualizations, and dashboards are now successfully installed.

Configure OpenSearch Ingestion

Each OpenSearch Ingestion pipeline will have a single data source with one or more sub-pipelines, processors, and sink. In our solution, Security Lake managed Amazon S3 is the source and your OpenSearch Service cluster is the sink. Before setting up OpenSearch Ingestion, you need to create the following IAM roles and set up the required permissions:

  • Pipeline role – Defines permissions to read from Amazon Security Lake and write to the OpenSearch Service domain
  • Management role – Defines permission to allow the user to create, update, delete, validate the pipeline and perform other management operations

The following figure shows the permissions and roles you need and how they interact with the solution services.

Before you create an OpenSearch Ingestion pipeline, the principal or the user creating the pipeline must have permissions to perform management actions on a pipeline (create, update, list, and validate). Additionally, the principal must have permission to pass the pipeline role to OpenSearch Ingestion. If you are performing these operations as a non-administrator, add the following permissions to the user creating the pipelines:

{
	"Version": "2012-10-17",
	"Statement": [
		{
			"Effect": "Allow",
			"Resource": "*",
			"Action": [
				"osis:CreatePipeline",
				"osis:ListPipelineBlueprints",
				"osis:ValidatePipeline",
				"osis:UpdatePipeline"
			]
		},
		{
			"_comment": "Replace {your-account-id} with your AWS account ID",
			"Resource": [
				"arn:aws:iam::{your-account-id}:role/pipeline-role"
			],
			"Effect": "Allow",
			"Action": [
				"iam:PassRole"
			]
		}
	]
}

Configure a read policy for the pipeline role

Security Lake subscribers only have access to the source data in the Region you selected when you created the subscriber. To give a subscriber access to data from multiple Regions, refer to Managing multiple Regions. To create a policy for read permissions, you need the name of the Amazon S3 bucket and the Amazon SQS queue created by Security Lake.

Complete the following steps to configure a read policy for the pipeline role:

  1. On the Security Lake console, choose Regions in the navigation pane.
  2. Choose the S3 location corresponding to the Region of the subscriber you created.

  1. Make a note of this Amazon S3 bucket name.

  1. Choose Subscribers in the navigation pane.
  2. Choose the subscriber OpenSearchIngestion that you created earlier.

  1. Take note of the Amazon SQS queue ARN under Subscription endpoint.

  1. On the IAM console, choose Policies in the navigation pane.
  2. Choose Create policy.
  3. In the Specify permissions section, choose JSON to open the policy editor.
  4. Remove the default policy and enter the following code (replace the S3 bucket and SQS queue ARN with the corresponding values):
    {
    	"Version": "2012-10-17",
    	"Statement": [
    		{
    			"Sid": "ReadFromS3",
    			"Effect": "Allow",
    			"Action": "s3:GetObject",
    			"Resource": "arn:aws:s3:::{bucket-name}/*"
    		},
    		{
    			"Sid": "ReceiveAndDeleteSqsMessages",
    			"Effect": "Allow",
    			"Action": [
    				"sqs:DeleteMessage",
    				"sqs:ReceiveMessage"
    			],
    			"_comment": "Replace {your-account-id} with your AWS account ID",
    			"Resource": "arn:aws:sqs:{region}:{your-account-id}:{sqs-queue-name}"
    		}
    	]
    }

  5. Choose Next.
  6. For policy name, enter read-from-securitylake.
  7. Choose Create policy.

You have successfully created the policy to read data from Security Lake and receive and delete messages from the Amazon SQS queue.

The complete process is shown below.

Configure a write policy for the pipeline role

We recommend using fine-grained access control (FGAC) with OpenSearch Service. When you use FGAC, you don’t have to use a domain access policy; you can skip the rest of this section and proceed to creating your pipeline role with the necessary permissions. If you use a domain access policy, you need to create a second policy (for this post, we call it write-to-opensearch) as an added step to the steps in the previous section. Use the following policy code:

{
	"Version": "2012-10-17",
	"Statement": [
		{
			"Effect": "Allow",
			"Action": "es:DescribeDomain",
			"Resource": "arn:aws:es:*:{your-account-id}:domain/*"
		},
		{
			"Effect": "Allow",
			"Action": "es:ESHttp*",
			"Resource": "arn:aws:es:*:{your-account-id}:domain/{domain-name}/*"
		}
	]
}

If the configured role has permissions to access Amazon S3 and Amazon SQS across accounts, OpenSearch Ingestion can ingest data across accounts.

Create the pipeline role with necessary permissions

Now that you have created the policies, you can create the pipeline role. Complete the following steps:

  1. On the IAM console, choose Roles in the navigation pane.
  2. Choose Create role.
  3. For Use cases for other AWS services, select OpenSearch Ingestion pipelines.
  4. Choose Next.
  5. Search for and select the policy read-from-securitylake.
  6. Search for and select the policy write-to-opensearch (if you’re using a domain access policy).
  7. Choose Next.
  8. For Role Name, enter pipeline-role.
  9. Choose Create.

Keep note of the role name; you will be using it while configuring opensearch-pipeline.

Now you can map the pipeline role to an OpenSearch backend role if you’re using FGAC. You can map the ingestion role to one of predefined roles or create your own with necessary permissions. For example, all_access is a built-in role that grants administrative permission to all OpenSearch functions. When deploying to a production environment, make sure to use a role with just enough permissions to write to your Amazon OpenSearch Service domain.

Create the OpenSearch Ingestion pipeline

In this section, you use the pipeline role you created to create an OpenSearch Ingestion pipeline. Complete the following steps:

  1. On the OpenSearch Service console, choose OpenSearch Ingestion in the navigation pane.
  2. Choose Create pipeline.
  3. For Pipeline name, enter a name, such as security-lake-osi.
  4. In the Pipeline configuration section, choose Configuration blueprints and choose AWS-SecurityLakeS3ParquetOCSFPipeline.

  1. Under source, update the following information:
    1. Update the queue_url in the sqs section. (This is the SQS queue that Amazon Security Lake created when you created a subscriber. To get the URL, navigate to the Amazon SQS console and look for the queue ARN created with the format AmazonSecurityLake-abcde-Main-Queue.)
    2. Enter the Region to use for aws credentials.

  1. Under sink, update the following information:
    1. Replace the hosts value in the OpenSearch section with the Amazon OpenSearch Service domain endpoint.
    2. For sts_role_arn, enter the ARN of pipeline-role.
    3. Set region as us-east-1.
    4. For index, enter the index name that was defined in the template created in the previous section ("ocsf-cuid-${/class_uid}-${/metadata/product/name}-${/class_name}-%{yyyy.MM.dd}").
  2. Choose Validate pipeline to verify the pipeline configuration.

If the configuration is valid, a successful validation message appears; you can now proceed to the next steps.

  1. Under Network, select Public for this post. Our recommendation is to select VPC access for an inherent layer of security.
  2. Choose Next.
  3. Review the details and create the pipeline.

When the pipeline is active, you should see the security data ingested into your Amazon OpenSearch Service domain.

Visualize the security data

After OpenSearch Ingestion starts writing your data into your OpenSearch Service domain, you should be able to visualize the data using the pre-built dashboards you imported earlier. Navigate to dashboards and choose any one of the installed dashboards.

For example, choosing DNS Activity will give you dashboards of all DNS activity published in Amazon Security Lake.

This dashboard shows the top DNS queries by account and hostname. It also shows the number of queries per account. OpenSearch Dashboards are flexible; you can add, delete, or update any of these visualizations to suit your organization and business needs.

Clean up

To avoid unwanted charges, delete the OpenSearch Service domain and OpenSearch Ingestion pipeline, and disable Amazon Security Lake.

Conclusion

In this post, you successfully configured Amazon Security Lake to send security data from different sources to OpenSearch Service through serverless OpenSearch Ingestion. You installed pre-built templates and dashboards to quickly get insights from the security data. Refer to Amazon OpenSearch Ingestion to find additional sources from which you can ingest data. For additional use cases, refer to Use cases for Amazon OpenSearch Ingestion.


About the authors

Muthu Pitchaimani is a Search Specialist with Amazon OpenSearch Service. He builds large-scale search applications and solutions. Muthu is interested in the topics of networking and security, and is based out of Austin, Texas.

Aish Gunasekar is a Specialist Solutions architect with a focus on Amazon OpenSearch Service. Her passion at AWS is to help customers design highly scalable architectures and help them in their cloud adoption journey. Outside of work, she enjoys hiking and baking.

Jimish Shah is a Senior Product Manager at AWS with 15+ years of experience bringing products to market in log analytics, cybersecurity, and IP video streaming. He’s passionate about launching products that offer delightful customer experiences, and solve complex customer problems. In his free time, he enjoys exploring cafes, hiking, and taking long walks.

Three ways to accelerate incident response in the cloud: insights from re:Inforce 2023

Post Syndicated from Anne Grahn original https://aws.amazon.com/blogs/security/three-ways-to-accelerate-incident-response-in-the-cloud-insights-from-reinforce-2023/

AWS re:Inforce took place in Anaheim, California, on June 13–14, 2023. AWS customers, partners, and industry peers participated in hundreds of technical and non-technical security-focused sessions across six tracks, an Expo featuring AWS experts and AWS Security Competency Partners, and keynote and leadership sessions.

The threat detection and incident response track showcased how AWS customers can get the visibility they need to help improve their security posture, identify issues before they impact business, and investigate and respond quickly to security incidents across their environment.

With dozens of service and feature announcements—and innumerable best practices shared by AWS experts, customers, and partners—distilling highlights is a challenge. From an incident response perspective, three key themes emerged.

Proactively detect, contextualize, and visualize security events

When it comes to effectively responding to security events, rapid detection is key. Among the launches announced during the keynote was the expansion of Amazon Detective finding groups to include Amazon Inspector findings in addition to Amazon GuardDuty findings.

Detective, GuardDuty, and Inspector are part of a broad set of fully managed AWS security services that help you identify potential security risks, so that you can respond quickly and confidently.

Using machine learning, Detective finding groups can help you conduct faster investigations, identify the root cause of events, and map to the MITRE ATT&CK framework to quickly run security issues to ground. The finding group visualization panel shown in the following figure displays findings and entities involved in a finding group. This interactive visualization can help you analyze, understand, and triage the impact of finding groups.

Figure 1: Detective finding groups visualization panel

Figure 1: Detective finding groups visualization panel

With the expanded threat and vulnerability findings announced at re:Inforce, you can prioritize where to focus your time by answering questions such as “was this EC2 instance compromised because of a software vulnerability?” or “did this GuardDuty finding occur because of unintended network exposure?”

In the session Streamline security analysis with Amazon Detective, AWS Principal Product Manager Rich Vorwaller, AWS Senior Security Engineer Rima Tanash, and AWS Program Manager Jordan Kramer demonstrated how to use graph analysis techniques and machine learning in Detective to identify related findings and resources, and investigate them together to accelerate incident analysis.

In addition to Detective, you can also use Amazon Security Lake to contextualize and visualize security events. Security Lake became generally available on May 30, 2023, and several re:Inforce sessions focused on how you can use this new service to assist with investigations and incident response.

As detailed in the following figure, Security Lake automatically centralizes security data from AWS environments, SaaS providers, on-premises environments, and cloud sources into a purpose-built data lake stored in your account. Security Lake makes it simpler to analyze security data, gain a more comprehensive understanding of security across an entire organization, and improve the protection of workloads, applications, and data. Security Lake automates the collection and management of security data from multiple accounts and AWS Regions, so you can use your preferred analytics tools while retaining complete control and ownership over your security data. Security Lake has adopted the Open Cybersecurity Schema Framework (OCSF), an open standard. With OCSF support, the service normalizes and combines security data from AWS and a broad range of enterprise security data sources.

Figure 2: How Security Lake works

Figure 2: How Security Lake works

To date, 57 AWS security partners have announced integrations with Security Lake, and we now have more than 70 third-party sources, 16 analytics subscribers, and 13 service partners.

In Gaining insights from Amazon Security Lake, AWS Principal Solutions Architect Mark Keating and AWS Security Engineering Manager Keith Gilbert detailed how to get the most out of Security Lake. Addressing questions such as, “How do I get access to the data?” and “What tools can I use?,” they demonstrated how analytics services and security information and event management (SIEM) solutions can connect to and use data stored within Security Lake to investigate security events and identify trends across an organization. They emphasized how bringing together logs in multiple formats and normalizing them into a single format empowers security teams to gain valuable context from security data, and more effectively respond to events. Data can be queried with Amazon Athena, or pulled by Amazon OpenSearch Service or your SIEM system directly from Security Lake.

Build your security data lake with Amazon Security Lake featured AWS Product Manager Jonathan Garzon, AWS Product Solutions Architect Ross Warren, and Global CISO of Interpublic Group (IPG) Troy Wilkinson demonstrating how Security Lake helps address common challenges associated with analyzing enterprise security data, and detailing how IPG is using the service. Wilkinson noted that IPG’s objective is to bring security data together in one place, improve searches, and gain insights from their data that they haven’t been able to before.

“With Security Lake, we found that it was super simple to bring data in. Not just the third-party data and Amazon data, but also our on-premises data from custom apps that we built.” — Troy Wilkinson, global CISO, Interpublic Group

Use automation and machine learning to reduce mean time to response

Incident response automation can help free security analysts from repetitive tasks, so they can spend their time identifying and addressing high-priority security issues.

In How LLA reduces incident response time with AWS Systems Manager, telecommunications provider Liberty Latin America (LLA) detailed how they implemented a security framework to detect security issues and automate incident response in more than 180 AWS accounts accessed by internal stakeholders and third-party partners by using AWS Systems Manager Incident Manager, AWS Organizations, Amazon GuardDuty, and AWS Security Hub.

LLA operates in over 20 countries across Latin America and the Caribbean. After completing multiple acquisitions, LLA needed a centralized security operations team to handle incidents and notify the teams responsible for each AWS account. They used GuardDuty, Security Hub, and Systems Manager Incident Manager to automate and streamline detection and response, and they configured the services to initiate alerts whenever there was an issue requiring attention.

Speaking alongside AWS Principal Solutions Architect Jesus Federico and AWS Principal Product Manager Sarah Holberg, LLA Senior Manager of Cloud Services Joaquin Cameselle noted that when GuardDuty identifies a critical issue, it generates a new finding in Security Hub. This finding is then forwarded to Systems Manager Incident Manager through an Amazon EventBridge rule. This configuration helps ensure the involvement of the appropriate individuals associated with each account.

“We have deployed a security framework in Liberty Latin America to identify security issues and streamline incident response across over 180 AWS accounts. The framework that leverages AWS Systems Manager Incident Manager, Amazon GuardDuty, and AWS Security Hub enabled us to detect and respond to incidents with greater efficiency. As a result, we have reduced our reaction time by 90%, ensuring prompt engagement of the appropriate teams for each AWS account and facilitating visibility of issues for the central security team.” — Joaquin Cameselle, senior manager, cloud services, Liberty Latin America

How Citibank (Citi) advanced their containment capabilities through automation outlined how the National Institute of Standards and Technology (NIST) Incident Response framework is applied to AWS services, and highlighted Citi’s implementation of a highly scalable cloud incident response framework designed to support the 28 AWS services in their cloud environment.

After describing the four phases of the incident response process — preparation and prevention; detection and analysis; containment, eradication, and recovery; and post-incident activity—AWS ProServe Global Financial Services Senior Engagement Manager Harikumar Subramonion noted that, to fully benefit from the cloud, you need to embrace automation. Automation benefits the third phase of the incident response process by speeding up containment, and reducing mean time to response.

Citibank Head of Cloud Security Operations Elvis Velez and Vice President of Cloud Security Damien Burks described how Citi built the Cloud Containment Automation Framework (CCAF) from the ground up by using AWS Step Functions and AWS Lambda, enabling them to respond to events 24/7 without human error, and reduce the time it takes to contain resources from 4 hours to 15 minutes. Velez described how Citi uses adversary emulation exercises that use the MITRE ATT&CK Cloud Matrix to simulate realistic attacks on AWS environments, and continuously validate their ability to effectively contain incidents.

Innovate and do more with less

Security operations teams are often understaffed, making it difficult to keep up with alerts. According to data from CyberSeek, there are currently 69 workers available for every 100 cybersecurity job openings.

Effectively evaluating security and compliance posture is critical, despite resource constraints. In Centralizing security at scale with Security Hub and Intuit’s experience, AWS Senior Solutions Architect Craig Simon, AWS Senior Security Hub Product Manager Dora Karali, and Intuit Principal Software Engineer Matt Gravlin discussed how to ease security management with Security Hub. Fortune 500 financial software provider Intuit has approximately 2,000 AWS accounts, 10 million AWS resources, and receives 20 million findings a day from AWS services through Security Hub. Gravlin detailed Intuit’s Automated Compliance Platform (ACP), which combines Security Hub and AWS Config with an internal compliance solution to help Intuit reduce audit timelines, effectively manage remediation, and make compliance more consistent.

“By using Security Hub, we leveraged AWS expertise with their regulatory controls and best practice controls. It helped us keep up to date as new controls are released on a regular basis. We like Security Hub’s aggregation features that consolidate findings from other AWS services and third-party providers. I personally call it the super aggregator. A key component is the Security Hub to Amazon EventBridge integration. This allowed us to stream millions of findings on a daily basis to be inserted into our ACP database.” — Matt Gravlin, principal software engineer, Intuit

At AWS re:Inforce, we launched a new Security Hub capability for automating actions to update findings. You can now use rules to automatically update various fields in findings that match defined criteria. This allows you to automatically suppress findings, update the severity of findings according to organizational policies, change the workflow status of findings, and add notes. With automation rules, Security Hub provides you a simplified way to build automations directly from the Security Hub console and API. This reduces repetitive work for cloud security and DevOps engineers and can reduce mean time to response.

In Continuous innovation in AWS detection and response services, AWS Worldwide Security Specialist Senior Manager Himanshu Verma and GuardDuty Senior Manager Ryan Holland highlighted new features that can help you gain actionable insights that you can use to enhance your overall security posture. After mapping AWS security capabilities to the core functions of the NIST Cybersecurity Framework, Verma and Holland provided an overview of AWS threat detection and response services that included a technical demonstration.

Bolstering incident response with AWS Wickr enterprise integrations highlighted how incident responders can collaborate securely during a security event, even on a compromised network. AWS Senior Security Specialist Solutions Architect Wes Wood demonstrated an innovative approach to incident response communications by detailing how you can integrate the end-to-end encrypted collaboration service AWS Wickr Enterprise with GuardDuty and AWS WAF. Using Wickr Bots, you can build integrated workflows that incorporate GuardDuty and third-party findings into a more secure, out-of-band communication channel for dedicated teams.

Evolve your incident response maturity

AWS re:Inforce featured many more highlights on incident response, including How to run security incident response in your Amazon EKS environment and Investigating incidents with Amazon Security Lake and Jupyter notebooks code talks, as well as the announcement of our Cyber Insurance Partners program. Content presented throughout the conference made one thing clear: AWS is working harder than ever to help you gain the insights that you need to strengthen your organization’s security posture, and accelerate incident response in the cloud.

To watch AWS re:Inforce sessions on demand, see the AWS re:Inforce playlists on YouTube.

 
If you have feedback about this post, submit comments in the Comments section below. If you have questions about this post, contact AWS Support.

Want more AWS Security news? Follow us on Twitter.

Anne Grahn

Anne Grahn

Anne is a Senior Worldwide Security GTM Specialist at AWS based in Chicago. She has more than a decade of experience in the security industry, and focuses on effectively communicating cybersecurity risk. She maintains a Certified Information Systems Security Professional (CISSP) certification.

Author

Himanshu Verma

Himanshu is a Worldwide Specialist for AWS Security Services. In this role, he leads the go-to-market creation and execution for AWS Security Services, field enablement, and strategic customer advisement. Prior to AWS, he held several leadership roles in Product Management, engineering and development, working on various identity, information security, and data protection technologies. He obsesses brainstorming disruptive ideas, venturing outdoors, photography, and trying various “hole in the wall” food and drinking establishments around the globe.

Jesus Federico

Jesus Federico

Jesus is a Principal Solutions Architect for AWS in the telecommunications vertical, working to provide guidance and technical assistance to communication service providers on their cloud journey. He supports CSPs in designing and implementing secure, resilient, scalable, and high-performance applications in the cloud.

Ingest, transform, and deliver events published by Amazon Security Lake to Amazon OpenSearch Service

Post Syndicated from Kevin Fallis original https://aws.amazon.com/blogs/big-data/ingest-transform-and-deliver-events-published-by-amazon-security-lake-to-amazon-opensearch-service/

With the recent introduction of Amazon Security Lake, it has never been simpler to access all your security-related data in one place. Whether it’s findings from AWS Security Hub, DNS query data from Amazon Route 53, network events such as VPC Flow Logs, or third-party integrations provided by partners such as Barracuda Email Protection, Cisco Firepower Management Center, or Okta identity logs, you now have a centralized environment in which you can correlate events and findings using a broad range of tools in the AWS and partner ecosystem.

Security Lake automatically centralizes security data from cloud, on-premises, and custom sources into a purpose-built data lake stored in your account. With Security Lake, you can get a more complete understanding of your security data across your entire organization. You can also improve the protection of your workloads, applications, and data. Security Lake has adopted the Open Cybersecurity Schema Framework (OCSF), an open standard. With OCSF support, the service can normalize and combine security data from AWS and a broad range of enterprise security data sources.

When it comes to near-real-time analysis of data as it arrives in Security Lake and responding to security events your company cares about, Amazon OpenSearch Service provides the necessary tooling to help you make sense of the data found in Security Lake.

OpenSearch Service is a fully managed and scalable log analytics framework that is used by customers to ingest, store, and visualize data. Customers use OpenSearch Service for a diverse set of data workloads, including healthcare data, financial transactions information, application performance data, observability data, and much more. Additionally, customers use the managed service for its ingest performance, scalability, low query latency, and ability to analyze large datasets.

This post shows you how to ingest, transform, and deliver Security Lake data to OpenSearch Service for use by your SecOps teams. We also walk you through how to use a series of prebuilt visualizations to view events across multiple AWS data sources provided by Security Lake.

Understanding the event data found in Security Lake

Security Lake stores the normalized OCSF security events in Apache Parquet format—an optimized columnar data storage format with efficient data compression and enhanced performance to handle complex data in bulk. Parquet format is a foundational format in the Apache Hadoop ecosystem and is integrated into AWS services such as Amazon Redshift Spectrum, AWS Glue, Amazon Athena, and Amazon EMR. It’s a portable columnar format, future proofed to support additional encodings as technology develops, and it has library support across a broad set of languages like Python, Java, and Go. And the best part is that Apache Parquet is open source!

The intent of OCSF is to provide a common language for data scientists and analysts that work with threat detection and investigation. With a diverse set of sources, you can build a complete view of your security posture on AWS using Security Lake and OpenSearch Service.

Understanding the event architecture for Security Lake

Security Lake provides a subscriber framework to provide access to the data stored in Amazon S3. Services such as Amazon Athena and Amazon SageMaker use query access. The solution, in this post, uses data access to respond to events generated by Security Lake.

When you subscribe for data access, events arrive via Amazon Simple Queue Service (Amazon SQS). Each SQS event contains a notification object that has a “pointer” via data used to create a URL to the Parquet object on Amazon S3. Your subscriber processes the event, parses the data found in the object, and transforms it to whatever format makes sense for your implementation.

The solution we provide in this post uses a subscriber for data access. Let’s drill down into what the implementation looks like so that you understand how it works.

Solution overview

The high-level architecture for integrating Security Lake with OpenSearch Service is as follows.

The workflow contains the following steps:

  1. Security Lake persists Parquet formatted data into an S3 bucket as determined by the administrator of Security Lake.
  2. A notification is placed in Amazon SQS that describes the key to get access to the object.
  3. Java code in an AWS Lambda function reads the SQS notification and prepares to read the object described in the notification.
  4. Java code uses Hadoop, Parquet, and Avro libraries to retrieve the object from Amazon S3 and transform the records in the Parquet object into JSON documents for indexing in your OpenSearch Service domain.
  5. The documents are gathered and then sent to your OpenSearch Service domain, where index templates map the structure into a schema optimized for Security Lake logs in OCSF format.

Steps 1–2 are managed by Security Lake; steps 3–5 are managed by the customer. The shaded components are your responsibility. The subscriber implementation for this solution uses Lambda and OpenSearch Service, and these resources are managed by you.

If you are evaluating this as solution for your business, remember that Lambda has a 15-minute maximum execution time at the time of this writing. Security Lake can produce up to 256MB object sizes and this solution may not be effective for your company’s needs at large scale. Various levers in Lambda have impacts on the cost of the solution for log delivery. Make cost conscious decisions when evaluating sample solutions. This implementation using Lambda is suitable for smaller companies where to volume of logs for CloudTrail and VPC flow logs are more suitable for a Lambda based approach where the cost to transform and deliver logs to Amazon OpenSearch Service are more budget friendly.

Now that you have some context, let’s start building the implementation for OpenSearch Service!

Prerequisites

Creation of Security Lake for your AWS accounts is a prerequisite for building this solution. Security Lake integrates with an AWS Organizations account to enable the offering for selected accounts in the organization. For a single AWS account that doesn’t use Organizations, you can enable Security Lake without the need for Organizations. You must have administrative access to perform these operations. For multiple accounts, it’s suggested that you delegate the Security Lake activities to another account in your organization. For more information about enabling Security Lake in your accounts, review Getting started.

Additionally, you may need to take the provided template and adjust it to your specific environment. The sample solution relies on access to a public S3 bucket hosted for this blog so egress rules and permissions modifications may be required if you use S3 endpoints.

This solution assumes that you’re using a domain deployed in a VPC. Additionally, it assumes that you have fine-grained access controls enabled on the domain to prevent unauthorized access to data you store as part of the integration with Security Lake. VPC-deployed domains are privately routable and have no access to the public internet by design. If you want to access your domain in a more public setting, you need to create a NGINX proxy to broker a request between public and private settings.

The remaining sections in this post are focused on how to create the integration with OpenSearch Service.

Create the subscriber

To create your subscriber, complete the following steps:

  1. On the Security Lake console, choose Subscribers in the navigation pane.
  2. Choose Create subscriber.
  3. Under Subscriber details, enter a meaningful name and description.
  4. Under Log and event sources, specify what the subscriber is authorized to ingest. For this post, we select All log and event sources.
  5. For Data access method, select S3.
  6. Under Subscriber credentials, provide the account ID and an external ID for which AWS account you want to provide access.
  7. For Notification details, select SQS queue.
  8. Choose Create when you are finished filling in the form.

It will take a minute or so to initialize the subscriber framework, such as the SQS integration and the permission generated so that you can access the data from another AWS account. When the status changes from Creating to Created, you have access to the subscriber endpoint on Amazon SQS.

  1. Save the following values found in the subscriber Details section:
    1. AWS role ID
    2. External ID
    3. Subscription endpoint

Use AWS CloudFormation to provision Lambda integration between the two services

An AWS CloudFormation template takes care of a large portion of the setup for the integration. It creates the necessary components to read the data from Security Lake, transform it into JSON, and then index it into your OpenSearch Service domain. The template also provides the necessary AWS Identity and Access Management (IAM) roles for integration, the tooling to create an S3 bucket for the Java JAR file used in the solution by Lambda, and a small Amazon Elastic Compute Cloud (Amazon EC2) instance to facilitate the provisioning of templates in your OpenSearch Service domain.

To deploy your resources, complete the following steps:

  1. On the AWS CloudFormation console, create a new stack.
  2. For Prepare template, select Template is ready.
  3. Specify your template source as Amazon S3 URL.

You can either save the template to your local drive or copy the link for use on the AWS CloudFormation console. In this example, we use the template URL that points to a template stored on Amazon S3. You can either use the URL on Amazon S3 or install it from your device.

  1. Choose Next.
  2. Enter a name for your stack. For this post, we name the stack blog-lambda. Start populating your parameters based on the values you copied from Security Lake and OpenSearch Service. Ensure that the endpoint for the OpenSearch domain has a forward slash / at the end of the URL that you copy from OpenSearch Service.
  3. Populate the parameters with values you have saved or copied from OpenSearch Service and Security Lake, then choose Next.
  4. Select Preserve successfully provisioned resources to preserve the resources in case the stack roles back so you can debug the issues.
  5. Scroll to bottom of page and choose Next.
  6. On the summary page, select the check box that acknowledges IAM resources will be created and used in this template.
  7. Choose Submit.

The stack will take a few minutes to deploy.

  1. After the stack has deployed, navigate to the Outputs tab for the stack you created.
  2. Save the CommandProxyInstanceID for executing scripts and save the two role ARNs to use in the role mappings step.

You need to associate the IAM roles for the tooling instance and the Lambda function with OpenSearch Service security roles so that the processes can work with the cluster and the resources within.

Provision role mappings for integrations with OpenSearch Service

With the template-generated IAM roles, you need to map the roles using role mapping to the predefined all_access role in your OpenSearch Service cluster. You should evaluate your specific use of any roles and ensure they are aligned with your company’s requirements.

  1. In OpenSearch Dashboards, choose Security in the navigation pane.
  2. Choose Roles in the navigation pane and look up the all_access role.
  3. On the role details page, on the Mapped users tab, choose Manage mapping.
  4. Add the two IAM roles found in the outputs of the CloudFormation template, then choose Map.

Provision the index templates used for OCSF format in OpenSearch Service

Index templates have been provided as part of the initial setup. These templates are crucial to the format of the data so that ingestion is efficient and tuned for aggregations and visualizations. Data that comes from Security Lake is transformed into a JSON format, and this format is based directly on the OCSF standard.

For example, each OCSF category has a common Base Event class that contains multiple objects that represent details like the cloud provider in a Cloud object, enrichment data using an Enrichment object that has a common structure across events but can have different values based on the event, and even more complex structures that have inner objects, which themselves have more inner objects such as the Metadata object, still part of the Base Event class. The Base Event class is the foundation for all categories in OCSF and helps you with the effort of correlating events written into Security Lake and analyzed in OpenSearch.

OpenSearch is technically schema-less. You don’t have to define a schema up front. The OpenSearch engine will try to guess the data types and the mappings found in the data coming from Security Lake. This is known as dynamic mapping. The OpenSearch engine also provides you with the option to predefine the data you are indexing. This is known as explicit mapping. Using explicit mappings to identifying your data source types and how they are stored at time of ingestion is key to getting high volume ingest performance for time-centric data indexed at heavy load.

In summary, the mapping templates use composable templates. In this construct, the solution establishes an efficient schema for the OCSF standard and gives you the capability to correlate events and specialize on specific categories in the OCSF standard.

You load the templates using the tools proxy created by your CloudFormation template.

  1. On the stack’s Outputs tab, find the parameter CommandProxyInstanceID.

We use that value to find the instance in AWS Systems Manager.

  1. On the Systems Manager console, choose Fleet manager in the navigation pane.
  2. Locate and select your managed node.
  3. On the Node actions menu, choose Start terminal session.
  4. When you’re connected to the instance, run the following commands:
    cd;pwd
    . /usr/share/es-scripts/es-commands.sh | grep -o '{\"acknowledged\":true}' | wc -l

You should see a final result of 42 occurrences of {“acknowledged”:true}, which demonstrates the commands being sent were successful. Ignore the warnings you see for migration. The warnings don’t affect the scripts and as of this writing can’t be muted.

  1. Navigate to Dev Tools in OpenSearch Dashboards and run the following command:
    GET _cat/templates

This confirms that the scripts were successful.

Install index patterns, visualizations, and dashboards for the solution

For this solution, we prepackaged a few visualizations so that you can make sense of your data. Download the visualizations to your local desktop, then complete the following steps:

  1. In OpenSearch Dashboards, navigate to Stack Management and Saved Objects.
  2. Choose Import.
  3. Choose the file from your local device, select your import options, and choose Import.

You will see numerous objects that you imported. You can use the visualizations after you start importing data.

Enable the Lambda function to start processing events into OpenSearch Service

The final step is to go into the configuration of the Lambda function and enable the triggers so that the data can be read from the subscriber framework in Security Lake. The trigger is currently disabled; you need to enable it and save the config. You will notice the function is throttled, which is by design. You need to have templates in the OpenSearch cluster so that the data indexes in the desired format.

  1. On the Lambda console, navigate to your function.
  2. On the Configurations tab, in the Triggers section, select your SQS trigger and choose Edit.
  3. Select Activate trigger and save the setting.
  4. Choose Edit concurrency.
  5. Configure your concurrency and choose Save.

Enable the function by setting the concurrency setting to 1. You can adjust the setting as needed for your environment.

You can review the Amazon CloudWatch logs on the CloudWatch console to confirm the function is working.

You should see startup messages and other event information that indicates logs are being processed. The provided JAR file is set for information level logging and if needed, to debug any concerns, there is a verbose debug version of the JAR file you can use. Your JAR file options are:

If you choose to deploy the debug version, the verbosity of the code will show some error-level details in the Hadoop libraries. To be clear, Hadoop code will display lots of exceptions in debug mode because it tests environment settings and looks for things that aren’t provisioned in your Lambda environment, like a Hadoop metrics collector. Most of these startup errors are not fatal and can be ignored.

Visualize the data

Now that you have data flowing into OpenSearch Service from Security Lake via Lambda, it’s time to put those imported visualizations to work. In OpenSearch Dashboards, navigate to the Dashboards page.

You will see four primary dashboards aligned around the OCSF category for which they support. The four supported visualization categories are for DNS activity, security findings, network activity, and AWS CloudTrail using the Cloud API.

Security findings

The findings dashboard is a series of high-level summary information that you use for visual inspection of AWS Security Hub findings in a time window specified by you in the dashboard filters. Many of the encapsulated visualizations give “filter on click” capabilities so you can narrow your discoveries. The following screenshot shows an example.

The Finding Velocity visualization shows findings over time based on severity. The Finding Severity visualization shows which “findings” have passed or failed, and the Findings table visualization is a tabular view with actual counts. Your goal is to be near zero in all the categories except informational findings.

Network activity

The network traffic dashboard provides an overview for all your accounts in the organization that are enabled for Security Lake. The following example is monitoring 260 AWS accounts, and this dashboard summarizes the top accounts with network activities. Aggregate traffic, top accounts generating traffic and top accounts with the most activity are found in the first section of the visualizations.

Additionally, the top accounts are summarized by allow and deny actions for connections. In the visualization below, there are fields that you can drill down into other visualizations. Some of these visualizations have links to third party website that may or may not be allowed in your company. You can edit the links in the Saved objects in the Stack Management plugin.

For drill downs, you can drill down by choosing the account ID to get a summary by account. The list of egress and ingress traffic within a single AWS account is sorted by the volume of bytes transferred between any given two IP addresses.

Finally, if you choose the IP addresses, you’ll be redirected to Project Honey Pot, where you can see if the IP address is a threat or not.

DNS activity

The DNS activity dashboard shows you the requestors for DNS queries in your AWS accounts. Again, this is a summary view of all the events in a time window.

The first visualization in the dashboard shows DNS activity in aggregate across the top five active accounts. Of the 260 accounts in this example, four are active. The next visualization breaks the resolves down by the requesting service or host, and the final visualization breaks out the requestors by account, VPC ID, and instance ID for those queries run by your solutions.

API Activity

The final dashboard gives an overview of API activity via CloudTrail across all your accounts. It summarizes things like API call velocity, operations by service, top operations, and other summary information.

If we look at the first visualization in the dashboard, you get an idea of which services are receiving the most requests. You sometimes need to understand where to focus the majority of your threat discovery efforts based on which services may be consumed differently over time. Next, there are heat maps that break down API activity by region and service and you get an idea of what type of API calls are most prevalent in your accounts you are monitoring.

As you scroll down on the form, more details present themselves such as top five services with API activity and the top API operations for the organization you are monitoring.

Conclusion

Security Lake integration with OpenSearch Service is easy to achieve by following the steps outlined in this post. Security Lake data is transformed from Parquet to JSON, making it readable and simple to query. Enable your SecOps teams to identify and investigate potential security threats by analyzing Security Lake data in OpenSearch Service. The provided visualizations and dashboards can help to navigate the data, identify trends and rapidly detect any potential security issues in your organization.

As next steps, we recommend to use the above framework and associated templates that provide you with easy steps to visualize your Security Lake data using OpenSearch Service.

In a series of follow-up posts, we will review the source code and walkthrough published examples of the Lambda ingestion framework in the AWS Samples GitHub repo. The framework can be modified for use in containers to help address companies that have longer processing times for large files published in Security Lake. Additionally, we will discuss how to detect and respond to security events using example implementations that use OpenSearch plugins such as Security Analytics, Alerting, and the Anomaly Detection available in Amazon OpenSearch Service.


About the authors

Kevin Fallis (@AWSCodeWarrior) is an Principal AWS Specialist Search Solutions Architect. His passion at AWS is to help customers leverage the correct mix of AWS services to achieve success for their business goals. His after-work activities include family, DIY projects, carpentry, playing drums, and all things music.

Jimish Shah is a Senior Product Manager at AWS with 15+ years of experience bringing products to market in log analytics, cybersecurity, and IP video streaming. He’s passionate about launching products that offer delightful customer experiences, and solve complex customer problems. In his free time, he enjoys exploring cafes, hiking, and taking long walks

Ross Warren is a Senior Product SA at AWS for Amazon Security Lake based in Northern Virginia. Prior to his work at AWS, Ross’ areas of focus included cyber threat hunting and security operations. When he is not talking about AWS he likes to spend time with his family, bake bread, make sawdust and enjoy time outside.

AWS Week in Review – Amazon Security Lake Now GA, New Actions on AWS Fault Injection Simulator, and More – June 5, 2023

Post Syndicated from Veliswa Boya original https://aws.amazon.com/blogs/aws/aws-week-in-review-amazon-security-lake-now-ga-new-actions-on-aws-fault-injection-simulator-and-more-june-5-2023/

Last Wednesday, I traveled to Cape Town to speak at the .Net Developer User Group. My colleague Francois Bouteruche also gave a talk but joined virtually. I enjoyed my time there—what an amazing community! Join the group in order to learn about upcoming events.

Now onto the AWS updates from last week. There was a lot of news related to AWS, and I have compiled a few announcements you need to know. Let’s get started!

Last Week’s Launches
Here are a few launches from last week that you might have missed:

Amazon Security Lake is now Generally Available – This service automatically centralizes security data from AWS environments, SaaS providers, on-premises environments, and cloud sources into a purpose-built data lake stored in your account, making it easier to analyze security data, gain a more comprehensive understanding of security across your entire organization, and improve the protection of your workloads, applications, and data. Read more in Channy’s post announcing the preview of Security Lake.

New AWS Direct Connect Location in Santiago, Chile – The AWS Direct Connect service lets you create a dedicated network connection to AWS. With this service, you can build hybrid networks by linking your AWS and on-premises networks to build applications that span environments without compromising performance. Last week we announced the opening of a new AWS Direct Connect location in Santiago, Chile. This new Santiago location offers dedicated 1 Gbps and 10 Gbps connections, with MACsec encryption available for 10 Gbps. For more information on over 115 Direct Connect locations worldwide, visit the locations section of the Direct Connect product detail pages.

New actions on AWS Fault Injection Simulator for Amazon EKS and Amazon ECS – Had it not been for Adrian Hornsby’s LinkedIn post I would have missed this announcement. We announced the expanded support of AWS Fault Injection Simulator (FIS) for Amazon Elastic Kubernetes Service (EKS) and Amazon Elastic Container Service (ECS). This expanded support adds additional AWS FIS actions for Amazon EKS and Amazon ECS. Learn more about Amazon ECS task actions here, and Amazon EKS pod actions here.

Other AWS News
A few more news items and blog posts you might have missed:

Autodesk Uses Sagemaker to Improve Observability – One of our customers, Autodesk, used AWS services including Amazon Sagemaker, Amazon Kinesis, and Amazon API Gateway to build a platform that enables development and deployment of near-real time personalization experiments by modeling and responding to user behavior data. All this delivered a dynamic, personalized experience for Autodesk’s customers. Read more about the story at AWS Customer Stories.

AWS DMS Serverless – We announced AWS DMS Serverless which lets you automatically provision and scale capacity for migration and data replication. Donnie wrote about this announcement here.

For AWS open-source news and updates, check out the latest newsletter curated by my colleague Ricardo Sueiras to bring you the most recent updates on open-source projects, posts, events, and more.

For a full list of AWS announcements, be sure to keep an eye on the What’s New at AWS page.

Upcoming AWS Events
We have the following upcoming events. These give you the opportunity to meet with other tech enthusiasts and learn:

AWS Silicon Innovation Day (June 21) – A one-day virtual event that will allow you to understand AWS Silicon and how you can use AWS’s unique silicon offerings to innovate. Learn more and register here.

AWS Global Summits – Sign up for the AWS Summit closest to where you live: London (June 7), Washington, DC (June 7–8), Toronto (June 14).

AWS Community Days – Join these community-led conferences where event logistics and content are planned, sourced, and delivered by community leaders: Chicago, Illinois (June 15), and Chile (July 1).

And with that, I end my very first Week in Review post, and this was such fun to write. Come back next Monday for another Week in Review!

Veliswa x

This post is part of our Week in Review series. Check back each week for a quick roundup of interesting news and announcements from AWS!

Get custom data into Amazon Security Lake through ingesting Azure activity logs

Post Syndicated from Adam Plotzker original https://aws.amazon.com/blogs/security/get-custom-data-into-amazon-security-lake-through-ingesting-azure-activity-logs/

Amazon Security Lake automatically centralizes security data from both cloud and on-premises sources into a purpose-built data lake stored on a particular AWS delegated administrator account for Amazon Security Lake.

In this blog post, I will show you how to configure your Amazon Security Lake solution with cloud activity data from Microsoft Azure Monitor activity log, which you can query alongside your existing AWS CloudTrail data. I will walk you through the required steps — from configuring the required AWS Identity and Access Management (IAM) permissions, AWS Glue jobs, and Amazon Kinesis Data Streams required on the AWS side to forwarding that data from within Azure.

When you turn on Amazon Security Lake, it begins to collect actionable security data from various AWS sources. However, many enterprises today have complex environments that include a mix of different cloud resources in addition to on-premises data centers.

Although the AWS data sources in Amazon Security Lake encompass a large amount of the necessary security data needed for analysis, you may miss the full picture if your infrastructure operates across multiple cloud venders (for example, AWS, Azure, and Google Cloud Platform) and on-premises at the same time. By querying data from across your entire infrastructure, you can increase the number of indicators of compromise (IOC) that you identify, and thus increase the likelihood that those indicators will lead to actionable outputs.

Solution architecture

Figure 1 shows how to configure data to travel from an Azure event hub to Amazon Security Lake.

Figure 1: Solution architecture

Figure 1: Solution architecture

As shown in Figure 1, the solution involves the following steps:

  1. An AWS user instantiates the required AWS services and features that enable the process to function, including AWS Identity and Access Management (IAM) permissions, Kinesis data streams, AWS Glue jobs, and Amazon Simple Storage Service (Amazon S3) buckets, either manually or through an AWS CloudFormation template, such as the one we will use in this post.
  2. In response to the custom source created from the CloudFormation template, a Security Lake table is generated in AWS Glue.
  3. From this point on, Azure activity logs in their native format are stored within an Azure cloud event hub within an Azure account. An Azure function is deployed to respond to new events within the Azure event hub and forward these logs over the internet to the Kinesis data stream that was created in the preceding step.
  4. The Kinesis data stream forwards the data to an AWS Glue streaming job fronted by the Kinesis data.
  5. The AWS Glue job then performs the extract, transfer, and load (ETL) mapping to the appropriate Open Cybersecurity Schema Framework (OCSF) (specified for API Activity events at OCSF API Activity Mappings).
  6. The Azure events are partitioned with respect to the required partitioning requirements in Amazon Security Lake tables and stored in S3.
  7. The user can query these tables by using Amazon Athena alongside the rest of their data inside Amazon Security Lake.

Prerequisites

Before you implement the solution, complete the following prerequisites:

  • Verify that you have enabled Amazon Security Lake in the AWS Regions that correspond to the Azure Activity logs that you will forward. For more information, see What is Amazon Security Lake?
  • Preconfigure the custom source logging for the source AZURE_ACTIVITY in your Region. To configure this custom source in Amazon Security Lake, open the Amazon Security Lake console, navigate to Create custom data source, and do the following, as shown in Figure 2:
    • For Data source name, enter AZURE_ACTIVITY.
    • For Event class, select API_ACTIVITY.
    • For Account Id, enter the ID of the account which is authorized to write data to your data lake.
    • For External Id, enter “AZURE_ACTIVITY-<YYYYMMDD>
    Figure 2:  Configure custom data source

    Figure 2: Configure custom data source

For more information on how to configure custom sources for Amazon Security Lake, see Collecting data from custom sources.

Step 1: Configure AWS services for Azure activity logging

The first step is to configure the AWS services for Azure activity logging.

  1. To configure Azure activity logging in Amazon Security Lake, first prepare the assets required in the target AWS account. You can automate this process by using the provided CloudFormation template — Security Lake CloudFormation — which will do the heavy lifting for this portion of the setup.

    Note: I have predefined these scripts to create the AWS assets required to ingest Azure activity logs, but you can generalize this process for other external log sources, as well.

    The CloudFormation template has the following components:

    • securitylakeGlueStreamingRole — includes the following managed policies:
      • AWSLambdaKinesisExecutionRole
      • AWSGlueServiceRole
    • securitylakeGlueStreamingPolicy — includes the following attributes:
      • “s3:GetObject”
      • “s3:PutObject”
    • securitylakeAzureActivityStream — This Kinesis data stream is the endpoint that acts as the connection point between Azure and AWS and the frontend of the AWS Glue stream that feeds Azure activity logs to Amazon Security Lake.
    • securitylakeAzureActivityJob — This is an AWS Glue streaming job that is used to take in feeds from the Kinesis data stream and map the Azure activity logs within that stream to OCSF.
    • securitylake-glue-assets S3 bucket — This is the S3 bucket that is used to store the ETL scripts used in the AWS Glue job to map Azure activity logs.

    Running the CloudFormation template will instantiate the aforementioned assets in your AWS delegated administrator account for Amazon Security Lake.

  2. The CloudFormation template creates a new S3 bucket with the following syntax: securityLake-glue-assets-<ACCOUNT-ID><REGION>. After the CloudFormation run is complete, navigate to this bucket within the S3 console.
  3. Within the S3 bucket, create a scripts and temporary folder in the S3 bucket, as shown in Figure 4.
    Figure 4: Glue assets bucket

    Figure 4: Glue assets bucket

  4. Update the Azure AWS Glue Pyspark script by replacing the following values in the file. You will attach this script to your AWS Glue job and use it to generate the AWS assets required for the implementation.
    • Replace <AWS_REGION_NAME> with the Region that you are operating in — for example, us-east-2.
    • Replace <AWS_ACCOUNT_ID> with the account ID of your delegated administrator account for Amazon Security Lake — for example, 111122223333.
    • Replace <SECURITYLAKE-AZURE-STREAM-ARN> with the Kinesis stream name created through the CloudFormation template. To find the stream name, open the Kinesis console, navigate to the Kinesis stream with the name securityLakeAzureActivityStream<STREAM-UID>, and copy the Amazon Resource Name (ARN), as shown in the following figure.

      Figure 5: Kinesis stream ARN

      Figure 5: Kinesis stream ARN

    • Replace <SECURITYLAKE-BUCKET-NAME> with the name of your data lake S3 bucket root name — for example, s3://aws-security-data-lake-DOC-EXAMPLE-BUCKET.

    After you replace these values, navigate within the scripts folder and upload the AWS Glue PySpark Python script named azure-activity-pyspark.py, as shown in Figure 6.

    Figure 6: AWS Glue script

    Figure 6: AWS Glue script

  5. Within your AWS Glue job, choose Job details and configure the job as follows:
    • For Type, select Spark Streaming.
    • For Language, select Python 3.
    • For Script path, select the S3 path that you created in the preceding step.
    • For Temporary path, select the S3 path that you created in the preceding step.
  6. Save the changes, and run the AWS Glue job by selecting Save and then Run.
  7. Choose the Runs tab, and make sure that the Run status of the job is Running.
    igure 7: AWS Glue job status

    Figure 7: AWS Glue job status

At this point, you have finished the configurations from AWS.

Step 2: Configure Azure services for Azure activity log forwarding

You will complete the next steps in the Azure Cloud console. You need to configure Azure to export activity logs to an Azure cloud event hub within your desired Azure account or organization. Additionally, you need to create an Azure function to respond to new events within the Azure event hub and forward those logs over the internet to the Kinesis data stream that the CloudFormation template created in the initial steps of this post.

For information about how to set up and configure Azure Functions to respond to event hubs, see Azure Event Hubs Trigger for Azure Functions in the Azure documentation.

Configure the following Python script — Azure Event Hub Function — in an Azure function app. This function is designed to respond to event hub events, create a connection to AWS, and forward those events to Kinesis as deserialized JSON blobs.

In the script, replace the following variables with your own information:

  • For <SECURITYLAKE-AZURE-STREAM-ARN>, enter the Kinesis data stream ARN.
  • For <SECURITYLAKE-AZURE-STREAM-NAME>, enter the Kinesis data stream name.
  • For <SECURITYLAKE-AZURE-STREAM-KEYID>, enter the AWS Key Management Service (AWS KMS) key ID created through the CloudFormation template.

The <SECURITYLAKE-AZURE-STREAM-ARN> and securityLakeAzureActivityStream<STREAM-UID> are the same variables that you obtained earlier in this post (see Figure 5).

You can find the AWS KMS key ID within the AWS KMS managed key policy associated with securityLakeAzureActivityStream. For example, in the key policy shown in Figure 8, the <SECURITYLAKE-AZURE-STREAM-KEYID> is shown in line 3.

Figure 8: Kinesis data stream inputs

Figure 8: Kinesis data stream inputs

Important: When you are working with KMS keys retrieved from the AWS console or AWS API keys within Azure, you should be extremely mindful of how you approach key management. Improper or poor handling of keys could result in the interception of data from the Kinesis stream or Azure function.

It’s a best security practice to use a trusted key management architecture that uses sufficient encryption and security protocols when working with keys that safeguard sensitive security information. Within Azure, consider using services such as the AWS Azure AD integration for seamless and ephemeral credential usage inside of the azure function. See – Azure AD Integration – for more information on how the Azure AD Integration works to safeguard and manage stored security keys and help make sure that no keys are accessible to unauthorized parties or stored as unencrypted text outside the AWS console.

Step 3: Validate the workflow and query Athena

After you complete the preceding steps, your logs should be flowing. To make sure that the process is working correctly, complete the following steps.

  1. In the Kinesis Data Streams console, verify that the logs are flowing to your data stream. Open the Kinesis stream that you created previously, choose the Data viewer tab, and then choose Get records, as shown in Figure 9.
    Figure 9: Kinesis data stream inputs

    Figure 9: Kinesis data stream inputs

  2. Verify that the logs are partitioned and stored within the correct Security Lake bucket associated with the configured Region. The log partitions within the Security Lake bucket should have the following syntax — “region=<region>/account_id=<account_id>/eventDay=<YYYYMMDD>/”, and they should be stored with the expected parquet compression.
     Figure 10: S3 bucket with object

    Figure 10: S3 bucket with object

  3. Assuming that CloudTrail logs exist within your Amazon Security Lake instance as well, you can now create a query in Athena that pulls data from the newly created Azure activity table and examine it alongside your existing CloudTrail logs by running queries such as the following:
    SELECT 
        api.operation,
        actor.user.uid,
        actor.user.name,
        src_endpoint.ip,
        time,
        severity,
        metadata.version,
        metadata.product.name,
        metadata.product.vendor_name,
        category_name,
        activity_name,
        type_uid,
    FROM {SECURITY-LAKE-DB}.{SECURITY-LAKE-AZURE-TABLE}
    UNION ALL
    SELECT 
        api.operation,
        actor.user.uid,
        actor.user.name,
        src_endpoint.ip,
        time,
        severity,
        metadata.version,
        metadata.product.name,
        metadata.product.vendor_name,
        category_name,
        activity_name,
        type_uid,
    FROM {SECURITY-LAKE-DB}.{SECURITY-LAKE-CLOUDTRAIL-TABLE}

    Figure 11:  Query Azure activity and CloudTrail together in Athena

    Figure 11: Query Azure activity and CloudTrail together in Athena

For additional guidance on how to configure access and query Amazon Security Lake in Athena, see the following resources:

Conclusion

In this blog post, you learned how to create and deploy the AWS and Microsoft Azure assets needed to bring your own data to Amazon Security Lake. By creating an AWS Glue streaming job that can transform Azure activity data streams and by fronting that AWS Glue job with a Kinesis stream, you can open Amazon Security Lake to intake from external Azure activity data streams.

You also learned how to configure Azure assets so that your Azure activity logs can stream to your Kinesis endpoint. The combination of these two creates a working, custom source solution for Azure activity logging.

To get started with Amazon Security Lake, see the Getting Started page, or if you already use Amazon Security Lake and want to read additional blog posts and articles about this service, see Blog posts and articles.

If you have feedback about this blog post, submit comments in the Comments section below. If you have questions about this blog post, start a new thread on Amazon Security Lake re:Post or contact AWS Support.

Want more AWS Security news? Follow us on Twitter.

Adam Plotzker

Adam Plotzker

Adam is currently a Security Engineer at AWS, working primarily on the Amazon Security Lake solution. One of the things he enjoys most about his work at AWS is his ability to be creative when exploring customer needs and coming up with unique solutions that meet those needs.

Amazon Security Lake is now generally available

Post Syndicated from Ross Warren original https://aws.amazon.com/blogs/security/amazon-security-lake-is-now-generally-available/

Today we are thrilled to announce the general availability of Amazon Security Lake, first announced in a preview release at 2022 re:Invent. Security Lake centralizes security data from Amazon Web Services (AWS) environments, software as a service (SaaS) providers, on-premises, and cloud sources into a purpose-built data lake that is stored in your AWS account. With Open Cybersecurity Schema Framework (OCSF) support, the service normalizes and combines security data from AWS and a broad range of security data sources. This helps provide your team of analysts and security engineers with broad visibility to investigate and respond to security events, which can facilitate timely responses and helps to improve your security across multicloud and hybrid environments.

Figure 1 shows how Security Lake works, step by step. In this post, we discuss these steps, highlight some of the most popular use cases for Security Lake, and share the latest enhancements and updates that we have made since the preview launch.

Figure 1: How Security Lake works

Figure 1: How Security Lake works

Target use cases

In this section, we showcase some of the use cases that customers have found to be most valuable while the service was in preview.

Facilitate your security investigations with elevated visibility

Amazon Security Lake helps to streamline security investigations by aggregating, normalizing, and optimizing data storage in a single security data lake. Security Lake automatically normalizes AWS logs and security findings to the OCSF schema. This includes AWS CloudTrail management events, Amazon Virtual Private Cloud (Amazon VPC) Flow Logs, Amazon Route 53 Resolver query logs, and AWS Security Hub security findings from Amazon security services, including Amazon GuardDuty, Amazon Inspector, and AWS IAM Access Analyzer, as well as security findings from over 50 partner solutions. By having security-related logs and findings in a centralized location, and in the same format, Security Operations teams can streamline their process and devote more time to investigating security issues. This centralization reduces the need to spend valuable time collecting and normalizing logs into a specific format.

Figure 2 shows the Security Lake activation page, which presents users with options to enable log sources, AWS Regions, and accounts.

Figure 2: Security Lake activation page with options to enable log sources, Regions, and accounts

Figure 2: Security Lake activation page with options to enable log sources, Regions, and accounts

Figure 3 shows another section of the Security Lake activation page, which presents users with options to set rollup Regions and storage classes.

Figure 3: Security Lake activation page with options to select a rollup Region and set storage classes

Figure 3: Security Lake activation page with options to select a rollup Region and set storage classes

Simplify your compliance monitoring and reporting

With Security Lake, customers can centralize security data into one or more rollup Regions, which can help teams to simplify their regional compliance and reporting obligations. Teams often face challenges when monitoring for compliance across multiple log sources, Regions, and accounts. By using Security Lake to collect and centralize this evidence, security teams can significantly reduce the time spent on log discovery and allocate more time towards compliance monitoring and reporting.

Analyze multiple years of security data quickly

Security Lake offers integration with third-party security services such as security information and event management (SIEM) and extended detection and response (XDR) tools, as well as popular data analytics services like Amazon Athena and Amazon OpenSearch Service to quickly analyze petabytes of data. This enables security teams to gain deep insights into their security data and take nimble measures to help protect their organization. Security Lake helps enforce least-privilege controls for teams across organizations by centralizing data and implementing robust access controls, automatically applying policies that are scoped to the required subscribers and sources. Data custodians can use the built-in features to create and enforce granular access controls, such as to restrict access to the data in the security lake to only those who require it.

Figure 4 depicts the process of creating a data access subscriber within Security Lake.

Figure 4: Creating a data access subscriber in Security Lake

Figure 4: Creating a data access subscriber in Security Lake

Unify security data management across hybrid environments

The centralized data repository in Security Lake provides a comprehensive view of security data across hybrid and multicloud environments, helping security teams to better understand and respond to threats. You can use Security Lake to store security-related logs and data from various sources, including cloud-based and on-premises systems, making it simpler to collect and analyze security data. Additionally, by using automation and machine learning solutions, security teams can help identify anomalies and potential security risks more efficiently. This can ultimately lead to better risk management and enhance the overall security posture for the organization. Figure 5 illustrates the process of querying AWS CloudTrail and Microsoft Azure audit logs simultaneously by using Amazon Athena.

Figure 5: Querying AWS CloudTrail and Microsoft Azure audit logs together in Amazon Athena

Figure 5: Querying AWS CloudTrail and Microsoft Azure audit logs together in Amazon Athena

Updates since preview launch

Security Lake automatically normalizes logs and events from natively supported AWS services to the OCSF schema. With the general availability release, Security Lake now supports the latest version of OCSF, which is version 1 rc2. CloudTrail management events are now normalized into three distinct OCSF event classes: Authentication, Account Change, and API Activity.

We made various improvements to resource names and schema mapping to enhance the usability of logs. Onboarding is made simpler with automated AWS Identity and Access Management (IAM) role creation from the console. Additionally, you have the flexibility to collect CloudTrail sources independently including management events, Amazon Simple Storage Service (Amazon S3) data events, and AWS Lambda events.

To enhance query performance, we made a transition from hourly to daily time partitioning in Amazon S3, resulting in faster and more efficient data retrieval. Also, we added Amazon CloudWatch metrics to enable proactive monitoring of your log ingestion process to facilitate the identification of collection gaps or surges.

New Security Lake account holders are eligible for a 15-day free trial in supported Regions. Security Lake is now generally available in the following AWS Regions: US East (Ohio), US East (N. Virginia), US West (Oregon), Asia Pacific (Singapore), Asia Pacific (Sydney), Asia Pacific (Tokyo), Europe (Frankfurt), Europe (Ireland), Europe (London), and South America (São Paolo).

Ecosystem integrations

We have expanded our support for third-party integrations and have added 23 new partners. This includes 10 source partners — Aqua Security, Claroty, Confluent, Darktrace, ExtraHop, Gigamon, Sentra, Torq, Trellix, and Uptycs — enabling them to send data directly to Security Lake. Additionally, we have integrated with nine new subscribing partners — ChaosSearch, New Relic, Ripjar, SOC Prime, Stellar Cyber, Swimlane, Tines, Torq, and Wazuh. We have also established six new services partners, including Booz Allen Hamilton, CMD Solutions, part of Mantel Group, Infosys, Insbuilt, Leidos, and Tata Consultancy Services.

In addition, Security Lake supports third-party sources that provide OCSF security data. Notable partners include Barracuda Networks, Cisco, Cribl, CrowdStrike, CyberArk, Lacework, Laminar, NETSCOUT, Netskope, Okta, Orca, Palo Alto Networks, Ping Identity, Tanium, The Falco Project, Trend Micro, Vectra AI, VMware, Wiz, and Zscaler. We have integrated with various third-party security, automation, and analytics tools. This includes Datadog, IBM, Rapid7, SentinelOne, Splunk, Sumo Logic, and Trellix. Lastly, we have partnered with service partners such as Accenture, Eviden , Deloitte, DXC Technology, Kyndryl, PwC, and Wipro, that can work with you and Security Lake to deliver comprehensive solutions.

Get help from AWS Professional Services

The AWS Professional Services organization is a global team of experts that can help customers realize their desired business outcomes when using AWS. Our teams of data architects and security engineers engage with customer Security, IT, and business leaders to develop enterprise solutions. We follow current recommendations to support customers in their journey to integrate data into Security Lake. We integrate ready-built data transformations, visualizations, and AI/machine learning (ML) workflows that help Security Operations teams rapidly realize value. If you are interested in learning more, reach out to your AWS Professional Services account representative.

Summary

We invite you to explore the benefits of using Amazon Security Lake by taking advantage of our 15-day free trial and providing your feedback on your experiences, use cases, and solutions. We have several resources to help you get started and build your first data lake, including comprehensive documentation, demo videos, and webinars. By giving Security Lake a try, you can experience firsthand how it helps you centralize, normalize, and optimize your security data, and ultimately streamline your organization’s security incident detection and response across multicloud and hybrid environments.

 
If you have feedback about this post, submit comments in the Comments section below. If you have questions about this post, contact AWS Support.

Want more AWS Security news? Follow us on Twitter.

Author

Ross Warren

Ross is a Senior Product SA at AWS for Amazon Security Lake based in Northern Virginia. Prior to his work at AWS, Ross’ areas of focus included cyber threat hunting and security operations. Outside of work, he likes to spend time with his family, bake bread, make sawdust and enjoy time outside.

Nisha Amthul

Nisha Amthul

Nisha is a Senior Product Marketing Manager at AWS Security, specializing in detection and response solutions. She has a strong foundation in product management and product marketing within the domains of information security and data protection. When not at work, you’ll find her cake decorating, strength training, and chasing after her two energetic kiddos, embracing the joys of motherhood.

Jonathan Garzon

Jonathan Garzon

Jonathan is a Senior Product Management leader at AWS with a passion for building products with delightful customer experiences and solving complex problems. He has launched and managed products in various domains, including networking, cybersecurity, and data analytics. Outside of work, Jonathan enjoys spending time with friends and family, playing soccer, mountain biking, hiking, and playing the guitar.

Three key security themes from AWS re:Invent 2022

Post Syndicated from Anne Grahn original https://aws.amazon.com/blogs/security/three-key-security-themes-from-aws-reinvent-2022/

AWS re:Invent returned to Las Vegas, Nevada, November 28 to December 2, 2022. After a virtual event in 2020 and a hybrid 2021 edition, spirits were high as over 51,000 in-person attendees returned to network and learn about the latest AWS innovations.

Now in its 11th year, the conference featured 5 keynotes, 22 leadership sessions, and more than 2,200 breakout sessions and hands-on labs at 6 venues over 5 days.

With well over 100 service and feature announcements—and innumerable best practices shared by AWS executives, customers, and partners—distilling highlights is a challenge. From a security perspective, three key themes emerged.

Turn data into actionable insights

Security teams are always looking for ways to increase visibility into their security posture and uncover patterns to make more informed decisions. However, as AWS Vice President of Data and Machine Learning, Swami Sivasubramanian, pointed out during his keynote, data often exists in silos; it isn’t always easy to analyze or visualize, which can make it hard to identify correlations that spark new ideas.

“Data is the genesis for modern invention.” – Swami Sivasubramanian, AWS VP of Data and Machine Learning

At AWS re:Invent, we launched new features and services that make it simpler for security teams to store and act on data. One such service is Amazon Security Lake, which brings together security data from cloud, on-premises, and custom sources in a purpose-built data lake stored in your account. The service, which is now in preview, automates the sourcing, aggregation, normalization, enrichment, and management of security-related data across an entire organization for more efficient storage and query performance. It empowers you to use the security analytics solutions of your choice, while retaining control and ownership of your security data.

Amazon Security Lake has adopted the Open Cybersecurity Schema Framework (OCSF), which AWS cofounded with a number of organizations in the cybersecurity industry. The OCSF helps standardize and combine security data from a wide range of security products and services, so that it can be shared and ingested by analytics tools. More than 37 AWS security partners have announced integrations with Amazon Security Lake, enhancing its ability to transform security data into a powerful engine that helps drive business decisions and reduce risk. With Amazon Security Lake, analysts and engineers can gain actionable insights from a broad range of security data and improve threat detection, investigation, and incident response processes.

Strengthen security programs

According to Gartner, by 2026, at least 50% of C-Level executives will have performance requirements related to cybersecurity risk built into their employment contracts. Security is top of mind for organizations across the globe, and as AWS CISO CJ Moses emphasized during his leadership session, we are continuously building new capabilities to help our customers meet security, risk, and compliance goals.

In addition to Amazon Security Lake, several new AWS services announced during the conference are designed to make it simpler for builders and security teams to improve their security posture in multiple areas.

Identity and networking

Authorization is a key component of applications. Amazon Verified Permissions is a scalable, fine-grained permissions management and authorization service for custom applications that simplifies policy-based access for developers and centralizes access governance. The new service gives developers a simple-to-use policy and schema management system to define and manage authorization models. The policy-based authorization system that Amazon Verified Permissions offers can shorten development cycles by months, provide a consistent user experience across applications, and facilitate integrated auditing to support stringent compliance and regulatory requirements.

Additional services that make it simpler to define authorization and service communication include Amazon VPC Lattice, an application-layer service that consistently connects, monitors, and secures communications between your services, and AWS Verified Access, which provides secure access to corporate applications without a virtual private network (VPN).

Threat detection and monitoring

Monitoring for malicious activity and anomalous behavior just got simpler. Amazon GuardDuty RDS Protection expands the threat detection capabilities of GuardDuty by using tailored machine learning (ML) models to detect suspicious logins to Amazon Aurora databases. You can enable the feature with a single click in the GuardDuty console, with no agents to manually deploy, no data sources to enable, and no permissions to configure. When RDS Protection detects a potentially suspicious or anomalous login attempt that indicates a threat to your database instance, GuardDuty generates a new finding with details about the potentially compromised database instance. You can view GuardDuty findings in AWS Security Hub, Amazon Detective (if enabled), and Amazon EventBridge, allowing for integration with existing security event management or workflow systems.

To bolster vulnerability management processes, Amazon Inspector now supports AWS Lambda functions, adding automated vulnerability assessments for serverless compute workloads. With this expanded capability, Amazon Inspector automatically discovers eligible Lambda functions and identifies software vulnerabilities in application package dependencies used in the Lambda function code. Actionable security findings are aggregated in the Amazon Inspector console, and pushed to Security Hub and EventBridge to automate workflows.

Data protection and privacy

The first step to protecting data is to find it. Amazon Macie now automatically discovers sensitive data, providing continual, cost-effective, organization-wide visibility into where sensitive data resides across your Amazon Simple Storage Service (Amazon S3) estate. With this new capability, Macie automatically and intelligently samples and analyzes objects across your S3 buckets, inspecting them for sensitive data such as personally identifiable information (PII), financial data, and AWS credentials. Macie then builds and maintains an interactive data map of your sensitive data in S3 across your accounts and Regions, and provides a sensitivity score for each bucket. This helps you identify and remediate data security risks without manual configuration and reduce monitoring and remediation costs.

Encryption is a critical tool for protecting data and building customer trust. The launch of the end-to-end encrypted enterprise communication service AWS Wickr offers advanced security and administrative controls that can help you protect sensitive messages and files from unauthorized access, while working to meet data retention requirements.

Management and governance

Maintaining compliance with regulatory, security, and operational best practices as you provision cloud resources is key. AWS Config rules, which evaluate the configuration of your resources, have now been extended to support proactive mode, so that they can be incorporated into infrastructure-as-code continuous integration and continuous delivery (CI/CD) pipelines to help identify noncompliant resources prior to provisioning. This can significantly reduce time spent on remediation.

Managing the controls needed to meet your security objectives and comply with frameworks and standards can be challenging. To make it simpler, we launched comprehensive controls management with AWS Control Tower. You can use it to apply managed preventative, detective, and proactive controls to accounts and organizational units (OUs) by service, control objective, or compliance framework. You can also use AWS Control Tower to turn on Security Hub detective controls across accounts in an OU. This new set of features reduces the time that it takes to define and manage the controls required to meet specific objectives, such as supporting the principle of least privilege, restricting network access, and enforcing data encryption.

Do more with less

As we work through macroeconomic conditions, security leaders are facing increased budgetary pressures. In his opening keynote, AWS CEO Adam Selipsky emphasized the effects of the pandemic, inflation, supply chain disruption, energy prices, and geopolitical events that continue to impact organizations.

Now more than ever, it is important to maintain your security posture despite resource constraints. Citing specific customer examples, Selipsky underscored how the AWS Cloud can help organizations move faster and more securely. By moving to the cloud, agricultural machinery manufacturer Agco reduced costs by 78% while increasing data retrieval speed, and multinational HVAC provider Carrier Global experienced a 40% reduction in the cost of running mission-critical ERP systems.
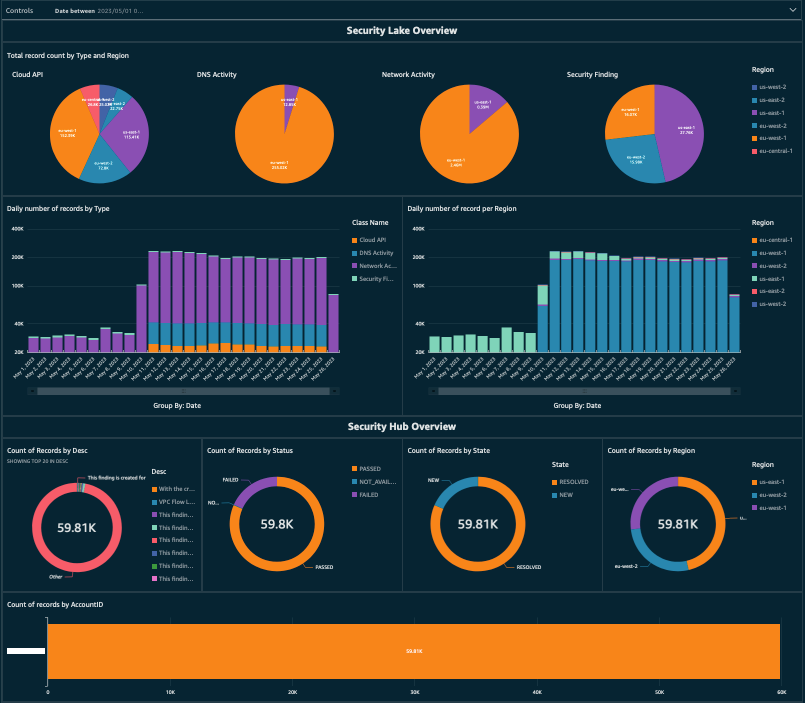
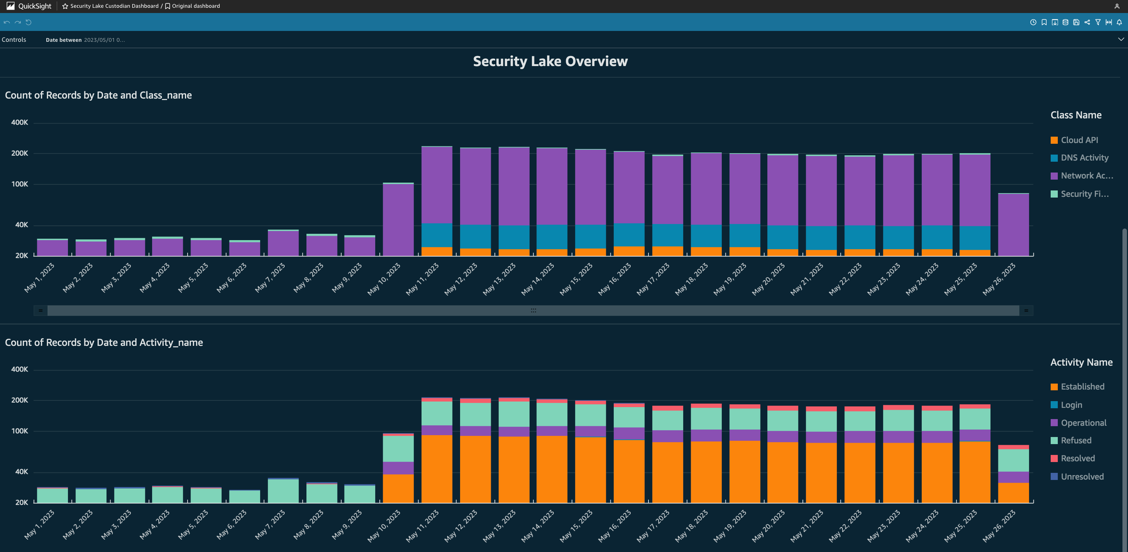
“If you’re looking to tighten your belt, the cloud is the place to do it.” – Adam Selipsky, AWS CEO

Security teams can do more with less by maximizing the value of existing controls, and bolstering security monitoring and analytics capabilities. Services and features announced during AWS re:Invent—including Amazon Security Lake, sensitive data discovery with Amazon Macie, support for Lambda functions in Amazon Inspector, Amazon GuardDuty RDS Protection, and more—can help you get more out of the cloud and address evolving challenges, no matter the economic climate.

Security is our top priority

AWS re:Invent featured many more highlights on a variety of topics, such as Amazon EventBridge Pipes and the pre-announcement of GuardDuty EKS Runtime protection, as well as Amazon CTO Dr. Werner Vogels’ keynote, and the security partnerships showcased on the Expo floor. It was a whirlwind week, but one thing is clear: AWS is working harder than ever to make our services better and to collaborate on solutions that ease the path to proactive security, so that you can focus on what matters most—your business.

For more security-related announcements and on-demand sessions, see A recap for security, identity, and compliance sessions at AWS re:Invent 2022 and the AWS re:Invent Security, Identity, and Compliance playlist on YouTube.

If you have feedback about this post, submit comments in the Comments section below.

Anne Grahn

Anne Grahn

Anne is a Senior Worldwide Security GTM Specialist at AWS based in Chicago. She has more than a decade of experience in the security industry, and has a strong focus on privacy risk management. She maintains a Certified Information Systems Security Professional (CISSP) certification.

Author

Paul Hawkins

Paul helps customers of all sizes understand how to think about cloud security so they can build the technology and culture where security is a business enabler. He takes an optimistic approach to security and believes that getting the foundations right is the key to improving your security posture.