All posts by Prashant Agrawal

An automated approach to perform an in-place engine upgrade in Amazon OpenSearch Service

Post Syndicated from Prashant Agrawal original https://aws.amazon.com/blogs/big-data/an-automated-approach-to-perform-an-in-place-engine-upgrade-in-amazon-opensearch-service/

Software upgrades bring new features and better performance, and keep you current with the software provider. However, upgrades for software services can be difficult to complete successfully, especially when you can’t tolerate downtime and when the new version’s APIs introduce breaking changes and deprecation that you must remediate. This post shows you how to upgrade from Elasticsearch engine to OpenSearch engine on Amazon OpenSearch Service without needing an intermediate upgrade to Elasticsearch 7.10.

OpenSearch Service supports OpenSearch as an engine, with versions in the 1.x through 2.x series. The service also supports legacy versions of Elasticsearch, versions 1.x through 7.10. Although OpenSearch brings many improvements over earlier engines, it can feel daunting to consider not only upgrading versions, but also changing engines in the process. The good news is that OpenSearch 1.0 is wire compatible with Elasticsearch 7.10, making engine changes straightforward. If you’re running a version of Elasticsearch in the 6.x or early 7.x series on OpenSearch Service, you might think you need to upgrade to Elasticsearch 7.10, and then upgrade to OpenSearch 1.3. However, you can easily upgrade your existing Elasticsearch engine running 6.8, 7.1, 7.2, 7.4, 7.9, and 7.10 in OpenSearch Service to the OpenSearch 1.3 engine.

OpenSearch Service runs a variety of checks before running an actual upgrade:

  • Validation before starting an upgrade
  • Preparing the setup configuration for the desired version
  • Provisioning new nodes with the same hardware configuration
  • Moving shards from old nodes to newly provisioned nodes
  • Removing older nodes and old node references from OpenSearch endpoints

During an upgrade, AWS takes care of the undifferentiated heavy lifting of provisioning, deploying, and moving the data to new domain. You are responsible to make sure there are no breaking changes that affect the data migration and movement to the newer version of the OpenSearch domain. In this post, we discuss the things you must modify and verify before and after running an upgrade from 6.8, 7.1, 7.2, 7.4, 7.9, and 7.10 version of Elasticsearch to 1.3 OpenSearch Service.

Pre-upgrade breaking changes

The following are pre-upgrade breaking changes:

  • Dependency check for language clients and libraries – If you’re using the open-source high-level language clients from Elastic, for example the Java, go, or Python client libraries, AWS recommends moving to the open-source, OpenSearch versions of these clients. (If you don’t use a high-level language client, you can skip this step.) The following are a few steps to perform a dependency check:
    • Determine the client library – Choose an appropriate client library compatible with your programing language. Refer to OpenSearch language clients for a list of all supported client libraries.
    • Add dependencies and resolve conflicts – Update your project’s dependency management system with the necessary dependencies specified by the client library. If your project already has dependencies that conflict with the OpenSearch client library dependencies, you may encounter dependency conflicts. In such cases, you need to resolve the conflicts manually.
    • Test and verify the client – Test the OpenSearch client functionality by establishing a connection, performing some basic operations (like indexing and searching), and verifying the results.
  • Removal of mapping types – Multiple types within an index were deprecated in Elasticsearch version 6.x, and completely removed in version 7.0 or later. OpenSearch indexes can only contain one mapping type. From OpenSearch version 2.x onward, the mapping _type must be _doc. You must check and fix the mapping before upgrading to OpenSearch 1.3.

Complete the following steps to identify and fix mapping issues:

  1. Navigate to dev tools and use the following GET <index> mapping API to fetch the mapping information for all the indexes:
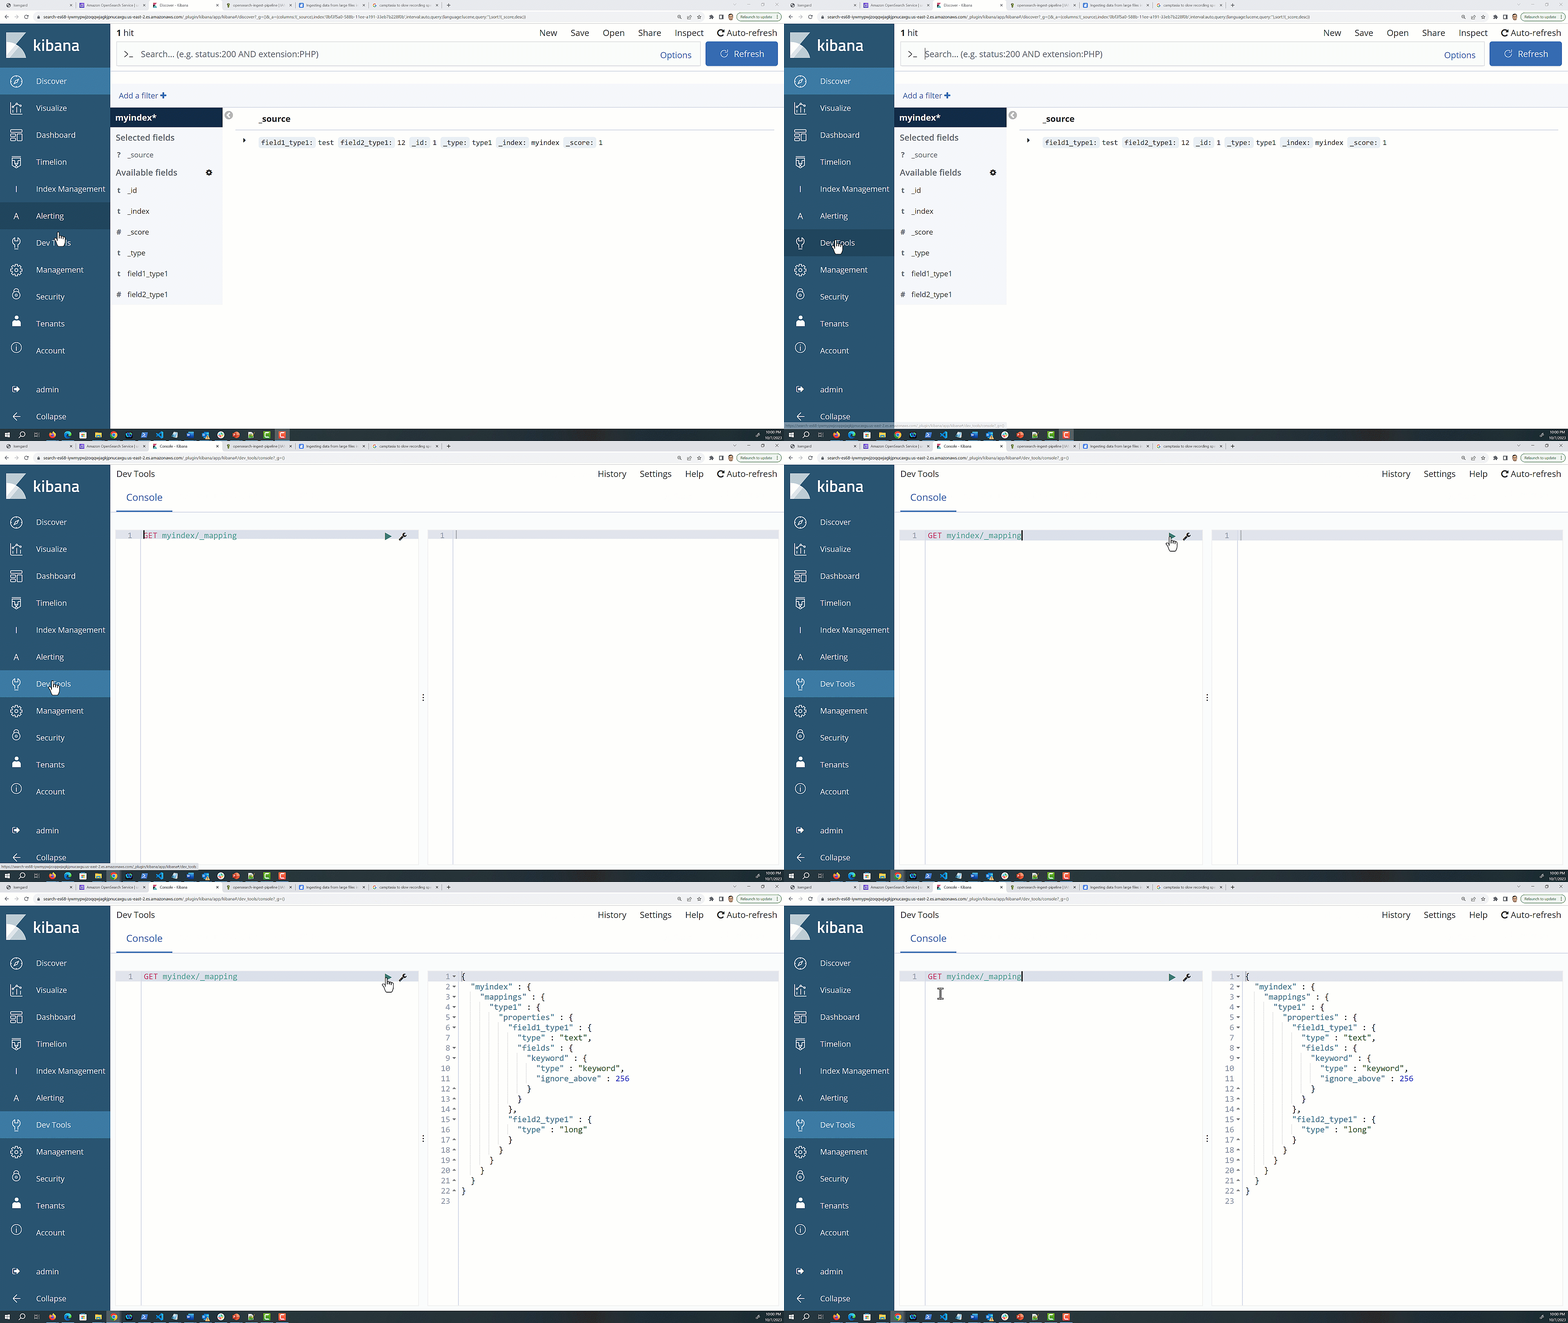
GET /index-name/_mapping

The mapping response will contain a JSON structure that represents the mapping for your index.

  1. Look for the top-level keys in the response JSON; each key represents a custom type within the index.

The _doc type is used for the default type in Elasticsearch 7.x and OpenSearch Service 1.x, but you may see additional types that you defined in earlier versions of Elasticsearch. The following is an example response for an index with two custom types, type1 and type2.

Note that indexes created in 5.x will continue to function in 6.x as they did in 5.x, but indexes created in 6.x only allow a single type per index.

{
  "myindex": {
    "mappings": {
      "type1": {
        "properties": {
          "field1_type1": {
            "type": "text"
          },
          "field2_type1": {
            "type": "integer"
          }
        }
      },
      "type2": {
        "properties": {
          "field1_type2": {
            "type": "keyword"
          },
          "field2_type2": {
            "type": "date"
          }
        }
      }
    }
  }
}

To fix the multiple mapping types in your existing domain, you need to reindex the data, where you can create one index for each mapping. This is a crucial step in the migration process because OpenSearch doesn’t support multiple types within a single index. In the next steps, we convert an index that has multiple mapping types into two separate indexes, each using the _doc type.

  1. You can unify the mapping by using your existing index name as a root and adding the type as a suffix. For example, the following code creates two indexes with myindex as the root name and type1 and type2 as the suffix:
    # Create an index for "type1"
    PUT /myindex_type1
    
    # Create an index for "type2"
    PUT /myindex_type2

  2. Use the _reindex API to reindex the data from the original index into the two new indexes. Alternately, you can reload the data from its source, if you’re keeping it in another system.
    POST _reindex
    {
      "source": {
        "index": "myindex",
        "type": "type1"  
      },
      "dest": {
        "index": "myindex_type1",
        "type": "_doc"  
      }
    }
    POST _reindex
    {
      "source": {
        "index": "myindex",
        "type": "type2"  
      },
      "dest": {
        "index": "myindex_type2",
        "type": "_doc"  
      }
    }

  3. If your application was previously querying the original index with multiple types, you’ll need to update your queries to specify the new indexes with _doc as the type. For example, if your client was querying using myindex, which has been reindexed to myindex_type1 and myindex_type2, then change your clients to point to myindex*, which will query across both indexes.
  4. After you have verified that the data is successfully reindexed and your application is working as expected with the new indexes, you should delete the original index before starting the upgrade, because it won’t be supported in the new version. Be cautious when deleting data and make sure you have backups if necessary.
  5. As part of this upgrade, Kibana will be replaced with OpenSearch Dashboards. When you’re done with the upgrade in the next step, you should advocate your users to use the new endpoint, which will be _dashboards. If you use a custom endpoint, be sure to update it to point to /_dashboards.
  6. We recommend that you update your AWS Identity and Access Management (IAM) policies to use the renamed API operations. However, OpenSearch Service will continue to respect existing policies by internally replicating the old API permissions. Service control policies (SCPs) introduce an additional layer of complexity compared to standard IAM. To prevent your SCP policies from breaking, you need to add both the old and the new API operations to each of your SCP policies.

Start the upgrade

The upgrade process is irreversible and can’t be paused or cancelled. You should make sure that everything will go smoothly by running a proof of concept (POC) check. By building a POC, you ensure data preservation, avoid compatibility issues, prevent unwanted bugs, and mitigate risks. You can run a POC with a small domain on the new version, and with a small subset of your data. Deploy and run any front-end code that communicates with OpenSearch Service via API against your test domain. Use your ingest pipeline to send data to your test domain as well, ensuring nothing breaks. Import or rebuild dashboards, alerts, anomaly detectors, and so on. This simple precaution can make your upgrade experience smoother and trouble-free while minimizing potential disruptions.

When OpenSearch Service starts the upgrade, it can take from 15 minutes to several hours to complete. OpenSearch Dashboards might be unavailable during some or all of the duration of the upgrade.

In this section, we show how you can start an upgrade using the AWS Management Console. You can also run the upgrade using the AWS Command Line Interface (AWS CLI) or AWS SDK. For more information, refer to Starting an upgrade (CLI) and Starting an upgrade (SDK).

  1. Take a manual snapshot of your domain.

This snapshot serves as a backup that you can restore on a new domain if you want to return to using the prior version.

  1. On the OpenSearch Service console, choose the domain that you want to upgrade.
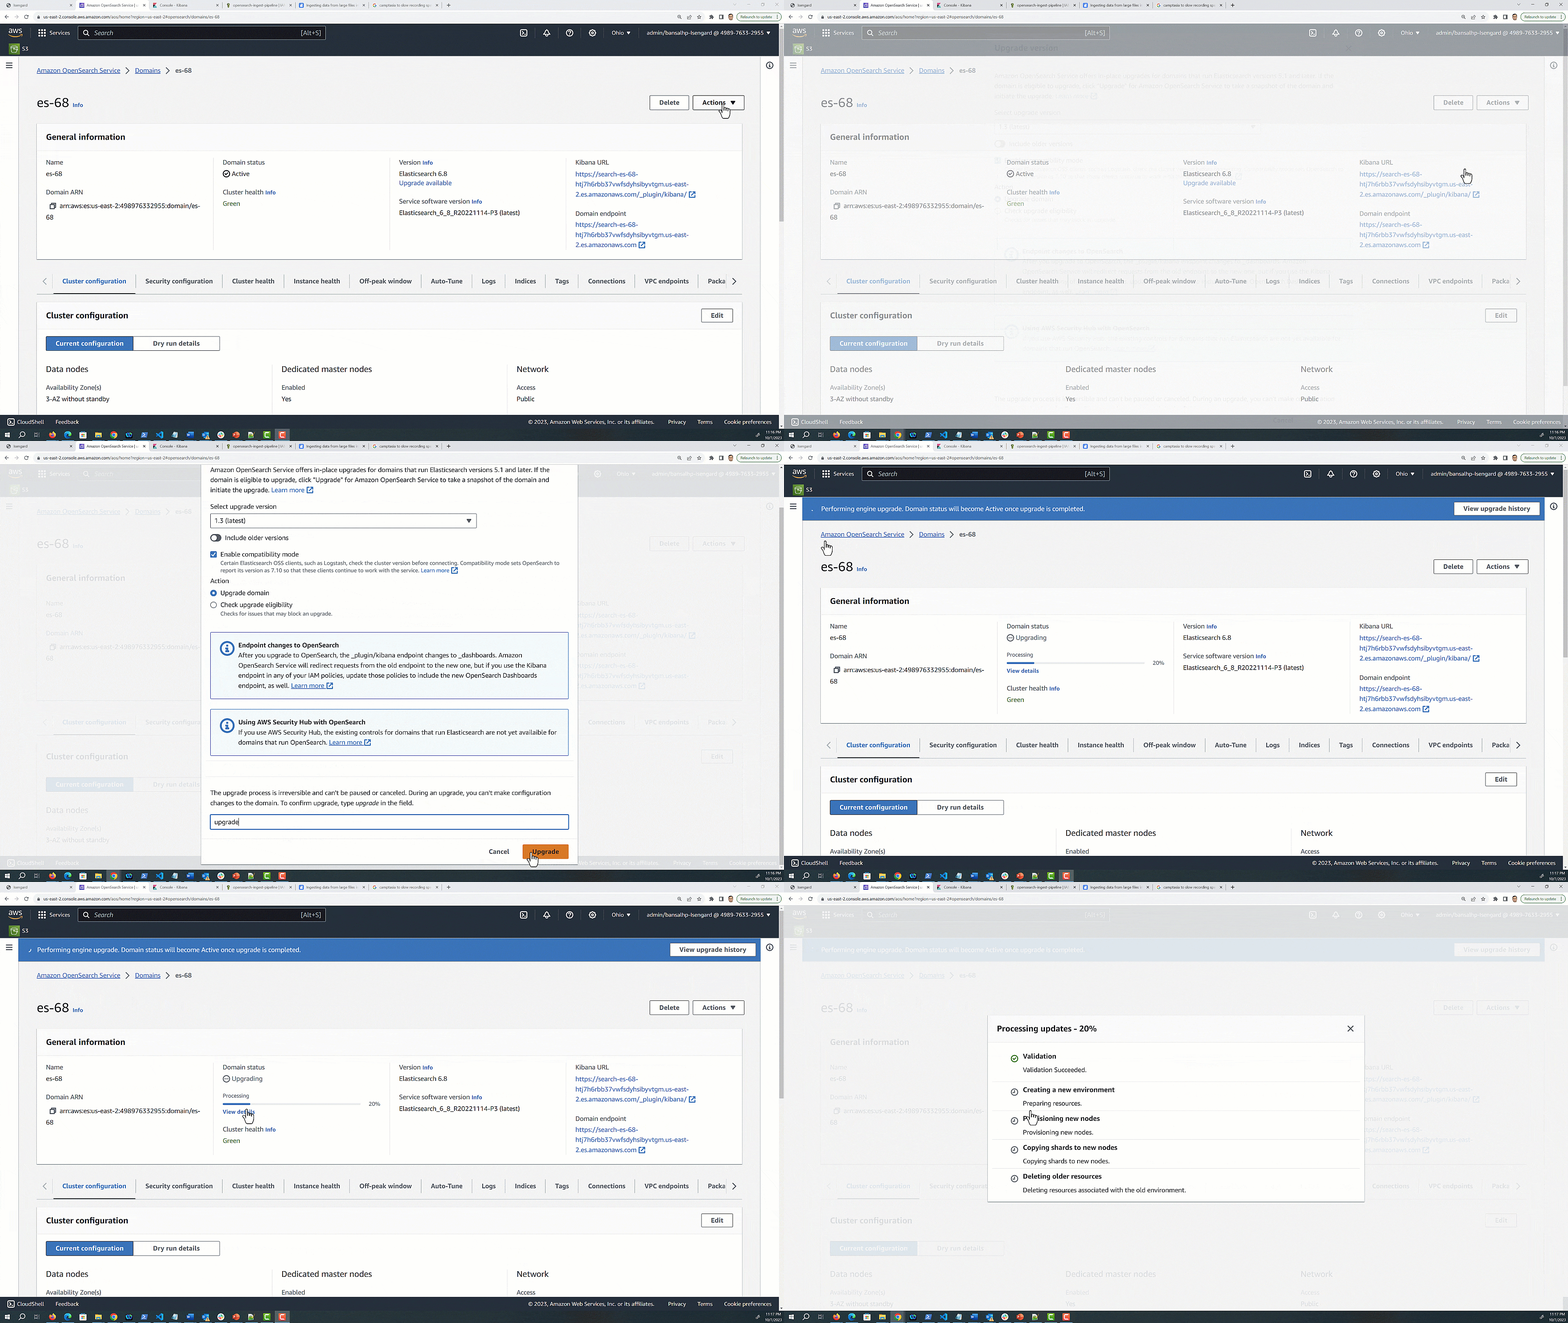
  2. On the Actions menu, choose Upgrade.
  3. Select the target version as OpenSearch 1.3. If you’re upgrading to an OpenSearch version, then you’ll be able to enable compatibility mode. If you enable this setting, OpenSearch reports its version as 7.10 to allow Elastic’s open-source clients and plugins like Logstash to continue working with your OpenSearch Service domain.
  4. Choose Check Upgrade Eligibility, which helps you identify if there are any breaking changes you still need to fix before running an upgrade.
  5. Choose Upgrade.
  6. Check the status on the domain dashboard to monitor the status of the upgrade.

The following graphic gives a quick demonstration of running and monitoring the upgrade via the preceding steps.
Post-upgrade changes and validations

Now that you have successfully upgraded your domain to OpenSearch Service 1.3, be sure to make the following changes:

  • Custom endpoint – A custom endpoint for your OpenSearch Service domain makes it straightforward for you to refer to your OpenSearch and OpenSearch Dashboards URLs. You can include your company’s branding or just use a shorter, easier-to-remember endpoint than the standard one. In OpenSearch Service, Kibana has been renamed to dashboards. After you upgrade a domain from the Elasticsearch engine to the OpenSearch engine, the /_plugin/kibana endpoint changes to /_dashboards. If you use the Kibana endpoint to set up a custom domain, you need to update it to include the new /_dashboards endpoint.
  • SAML authentication for OpenSearch Dashboards – After you upgrade your domain to OpenSearch Service, you need to change all Kibana URLs configured in your identity provider (IdP) from /_plugin/kibana to /_dashboards. The most common URLs are assertion consumer service (ACS) URLs and recipient URLs.

Conclusion

This post discussed what to consider when planning to upgrade your existing Elasticsearch engine in your OpenSearch Service domain to the OpenSearch engine. OpenSearch Service continues to support older engine versions, including open-source versions of Elasticsearch from 1.x through 7.10. By migrating forward to OpenSearch Service, you will be able to take advantage of bug fixes, performance improvements, new service features, and expanded instance types for your data nodes, like AWS Graviton 2 instances.

If you have feedback about this post, share it in the comments section. If you have questions about this post, start a new thread on the Amazon OpenSearch Service forum or contact AWS Support.


About the Authors

Prashant Agrawal is a Sr. Search Specialist Solutions Architect with Amazon OpenSearch Service. He works closely with customers to help them migrate their workloads to the cloud and helps existing customers fine-tune their clusters to achieve better performance and save on cost. Before joining AWS, he helped various customers use OpenSearch and Elasticsearch for their search and log analytics use cases. When not working, you can find him traveling and exploring new places. In short, he likes doing Eat → Travel → Repeat.

Harsh Bansal is a Solutions Architect at AWS with Analytics as his area of specialty.He has been building solutions to help organizations make data-driven decisions.

Unleash the power of Snapshot Management to take automated snapshots using Amazon OpenSearch Service

Post Syndicated from Prashant Agrawal original https://aws.amazon.com/blogs/big-data/unleash-the-power-of-snapshot-management-to-take-automated-snapshots-using-amazon-opensearch-service/

Data is the lifeblood of any organization, and the importance of protecting it cannot be overstated. Starting with OpenSearch v2.5 in Amazon OpenSearch Service, we introduced Snapshot Management, which automates the process of taking snapshots of your domain. Snapshot Management helps you create point-in-time backups of your domain using OpenSearch Dashboards, including both data and configuration settings (for visualizations and dashboards). You can use these snapshots to restore your cluster to a specific state, recover from potential failures, and even clone environments for testing or development purposes.

Before this release, to automate the process of taking snapshots, you needed to use the snapshot action of OpenSearch’s Index State Management (ISM) feature. With ISM, you could only back up a particular index. Automating backup for multiple indexes required you to write custom scripts or use external management tools. With Snapshot Management, you can automate snapshotting across multiple indexes to safeguard your data and ensure its durability and recoverability.

In this post, we share how to use Snapshot Management to take automated snapshots using OpenSearch Service.

Solution overview

We demonstrate the following high-level steps:

  1. Register a snapshot repository in OpenSearch Service (a one-time process).
  2. Configure a sample ISM policy to migrate the indexes from hot storage to the UltraWarm storage tier after the indexes meet a specific condition.
  3. Create a Snapshot Management policy to take an automated snapshot for all indexes present across different storage tiers within a domain.

As of this writing, Snapshot Management doesn’t support single snapshot creation for all indexes present across different storage tiers within OpenSearch Service. For example, if you try to create a snapshot on multiple indexes with * and some indexes are in the warm tier, the snapshot creation will fail.

To overcome this limitation, you can use index aliases, with one index alias for each type of storage tier. For example, every new index created in the cluster will belong to the hot alias. When the index is moved to the UltraWarm tier via ISM, the alias for the index will be modified to warm, and the index will be removed from the hot alias.

Register a manual snapshot repository

To register a manual snapshot repository, you must create and configure an Amazon Simple Storage Service (Amazon S3) bucket and AWS Identity and Access Management (IAM) roles. For more information, refer to Prerequisites. Complete the following steps:

  1. Create an S3 bucket to store snapshots for your OpenSearch Service domain.
  2. Create an IAM role called SnapshotRole with the following IAM policy to delegate permissions to OpenSearch Service (provide the name of your S3 bucket):
{
    "Version": "2012-10-17",
    "Statement": [{
        "Action": ["s3:ListBucket"],
        "Effect": "Allow",
        "Resource": ["arn:aws:s3:::<s3-bucket-name>"]
    }, {
        "Action": ["s3:GetObject", "s3:PutObject", "s3:DeleteObject"],
        "Effect": "Allow",
        "Resource": ["arn:aws:s3:::<s3-bucket-name>/*"]
    }]
}
  1. Set the trust relationship for SnapshotRole as follows:
{
    "Version": "2012-10-17",
    "Statement": [{
        "Sid": "",
        "Effect": "Allow",
        "Principal": {
            "Service": "es.amazonaws.com"
        },
        "Action": "sts:AssumeRole"
    }]
}
  1. Create a new IAM role called RegisterSnapshotRepo, which delegates iam:PassRole and es:ESHttpPut (provide your AWS account and domain name):
{
    "Version": "2012-10-17",
    "Statement": [{
        "Effect": "Allow",
        "Action": "iam:PassRole",
        "Resource": "arn:aws:iam::<aws account id>:role/SnapshotRole"
    }, {
        "Effect": "Allow",
        "Action": "es:ESHttpPut",
        "Resource": "arn:aws:es:region:<aws account id>:domain/<domain-name>/*"
    }]
}
  1. If you have enabled fine-grained access control for your domain, map the snapshot role manage_snapshots to your RegisterSnapshotRepo IAM role in OpenSearch Service.
  2. Now you can use Python code like the following example to register the S3 bucket you created as a snapshot repository for your domain. Provide your host name, Region, snapshot repo name, and S3 bucket. Replace "arn:aws:iam::123456789012:role/SnapshotRole" with the ARN of your SnapshotRole. The Boto3 session should use the RegisterSnapshotRepo IAM role.
import boto3
import requests
from requests_aws4auth import AWS4Auth
 
host = '<host>' # domain endpoint with trailing /
region = '<region>' # e.g. us-west-1
service = 'es'
credentials = boto3.Session().get_credentials()
awsauth = AWS4Auth(credentials.access_key, credentials.secret_key, region, service, session_token=credentials.token)
 
# To Register the repository

path = '_snapshot/<snapshot-repo-name>'
url = host + path
 
payload = {
  "type": "s3",
  "settings": {
    "bucket": "<s3-bucket-name>",
    "region": "<region>",
    "role_arn": "arn:aws:iam::123456789012:role/SnapshotRole"
  }
}
 
headers = {"Content-Type": "application/json"}
 
r = requests.put(url, auth=awsauth, json=payload, headers=headers, timeout=300)
 
print(r.status_code)
print(r.text)

The S3 bucket used as a repository must be in the same Region as your domain. You can run the preceding code in any compute instance that has connectivity to your OpenSearch Service domain, such as Amazon Elastic Compute Cloud (Amazon EC2), AWS Cloud9, or AWS Lambda. If your domain is within a VPC, then the compute instance should be running inside the same VPC or have connectivity to the VPC.

If you have to register the snapshot repository from a local machine, replace the following lines in the preceding code:

credentials = boto3.Session().get_credentials()
awsauth = AWS4Auth(credentials.access_key, credentials.secret_key, region, service, session_token=credentials.token)

Replace this code with the following and assume the RegisterSnapshotRepo role (make sure the IAM entity that you are using has appropriate permission to assume the RegisterSnapshotRepo role). Modify "arn:aws:iam::123456789012:role/RegisterSnapshotRepo" with the ARN of your RegisterSnapshotRepo role.

sts = boto3.Session().client("sts")
response = sts.assume_role(
    RoleArn="arn:aws:iam::123456789012:role/RegisterSnapshotRepo",
    RoleSessionName="Snapshot-Session"
)

awsauth = AWS4Auth(response['Credentials']['AccessKeyId'], response['Credentials']['SecretAccessKey'], region, service, session_token=response['Credentials']['SessionToken'])

Upon successfully running the sample code, you should receive output such as the following:

200
{"acknowledged":true}

You can also verify that you have successfully registered the snapshot repository by accessing OpenSearch Dashboards in your domain and navigating to Snapshots Managements, Repositories.

Create an index template

Index templates enable you to automatically assign configuration when new indexes are created that match a wildcard index pattern.

  1. Navigate to your domain’s OpenSearch Dashboards and choose the Dev Tools tab.
  2. Enter the following text in the left pane and choose the play icon to run it.

The index template applies to newly created indexes that match the pattern of "log*". These indexes are attached to the alias named hot and the replica count is set to 1.

PUT _index_template/snapshot_template
{
  "index_patterns" : ["log*"],
  "template": {
      "settings": {
      "number_of_replicas": 1
    },
    "aliases" : {
        "hot" : {}
    }
  }
}

Note that in the preceding example, you assign the template to indexes that match "log*". You can modify index_patterns for your use case.

Create an ISM policy

In this step, you create the ISM policy that updates the alias of an index before it is migrated to UltraWarm. The policy also performs hot to warm migration. This is to overcome the limitations where a snapshot can’t be taken across two storage tiers (hot and UltraWarm). Complete the following steps:

  1. Navigate to the Dev Tools page of OpenSearch Dashboards.
  2. Create the ISM policy using the following command (modify the values of index_patterns and min_index_age accordingly):
PUT /_plugins/_ism/policies/alias_policy
{
    "policy": {
        "policy_id": "alias_policy",
        "description": "Example Policy for changing the alias and performing the warm migration",
        "default_state": "hot_alias",
        "states": [{
            "name": "hot_alias",
            "actions": [],
            "transitions": [{
                "state_name": "warm",
                "conditions": {
                    "min_index_age": "30d"
                }
            }]
        }, {
            "name": "warm",
            "actions": [{
                "alias": {
                    "actions": [{
                        "remove": {
                            "aliases": ["hot"]
                        }
                    }, {
                        "add": {
                            "aliases": ["warm"]
                        }
                    }]
                }
            }, {
                "retry": {
                    "count": 5,
                    "backoff": "exponential",
                    "delay": "1h"
                },
                "warm_migration": {}
            }],
            "transitions": []
        }],
        "ism_template": [{
            "index_patterns": ["log*"],
            "priority": 100
        }]
    }
}

Create a snapshot policy

In this step, you create a snapshot policy, which takes a snapshot for all the indexes aliased as hot and stores them to your repository at the scheduled time in the cron expression (midnight UTC). Complete the following steps:

  1. Navigate to the Dev Tools page of OpenSearch Dashboards.
  2. Create the snapshot policy using the following command (modify the value of snapshot-repo-name to the name of the snapshot repository you registered previously):
POST _plugins/_sm/policies/daily-snapshot-for-manual-repo
{
    "description": "Policy for Daily Snapshot in the Manual repo",
    "creation": {
      "schedule": {
        "cron": {
          "expression": "0 0 * * *",
          "timezone": "UTC"
        }
      }
    },
    "deletion": {
      "schedule": {
        "cron": {
          "expression": "0 1 * * *",
          "timezone": "UTC"
        }
      },
      "condition": {
        "min_count": 1,
        "max_count": 40
      }
    },
    "snapshot_config": {
      "indices": "hot",
      "repository": "snapshot-repo-name"
    }
}

Clean up

Snapshots that you create incur cost in the S3 bucket used as the repository. With the new Snapshots Management feature, you can easily list and delete unwanted snapshots, and delete the ISM policy to stop taking manual snapshots directly from OpenSearch Dashboards.

Conclusion

With the new Snapshot Management capabilities of OpenSearch Service, you can create regular backups and ensure the availability of your data even in the event of unexpected events or disasters. In this post, we discussed essential concepts such as snapshot repositories, automated snapshot lifecycle policies, and Snapshot Management options, enabling you to make informed decisions when it comes to managing your data backups effectively. As you continue to explore and harness the potential of OpenSearch Service, incorporating Snapshot Management into your data protection strategy will undoubtedly provide you with the resilience and reliability needed to ensure business continuity.

If you have feedback about this post, share it in the comments section. If you have questions about this post, start a new thread on the Amazon OpenSearch Service forum or contact AWS Support.


About the authors

Prashant Agrawal is a Sr. Search Specialist Solutions Architect with Amazon OpenSearch Service. He works closely with customers to help them migrate their workloads to the cloud and helps existing customers fine-tune their clusters to achieve better performance and save on cost. Before joining AWS, he helped various customers use OpenSearch and Elasticsearch for their search and log analytics use cases. When not working, you can find him traveling and exploring new places. In short, he likes doing Eat → Travel → Repeat.

Hendy Wijaya is a Senior OpenSearch Specialist Solutions Architect at Amazon Web Services. Hendy enables customers to leverage AWS services to achieve their business objectives and gain competitive advantages. He is passionate in collaborating with customers in getting the best out of OpenSearch and Amazon OpenSearch

Utkarsh Agarwal is a Cloud Support Engineer in the Support Engineering team at Amazon Web Services. He specializes in Amazon OpenSearch Service. He provides guidance and technical assistance to customers thus enabling them to build scalable, highly available and secure solutions in AWS Cloud. In his free time, he enjoys watching movies, TV series and of course cricket! Lately, he his also attempting to master the art of cooking in his free time – The taste buds are excited, but the kitchen might disagree.

Achieve higher query throughput: Auto scaling in Amazon OpenSearch Serverless now supports shard replica scaling

Post Syndicated from Prashant Agrawal original https://aws.amazon.com/blogs/big-data/achieve-higher-query-throughput-auto-scaling-in-amazon-opensearch-serverless-now-supports-shard-replica-scaling/

Amazon OpenSearch Serverless is the serverless option for Amazon OpenSearch Service that makes it simple for you to run search and analytics workloads without having to think about infrastructure management. We recently announced new enhancements to autoscaling in OpenSearch Serverless that scales capacity automatically in response to your query loads.

At launch, OpenSearch Serverless supported increasing capacity automatically in response to growing data sizes. With the new shard replica scaling feature, OpenSearch Serverless automatically detects shards under duress due to sudden spikes in query rates and dynamically adds new shard replicas to handle the increased query throughput while maintaining fast response times. This approach proves to be more cost-efficient than simply adding new index replicas. With the expanded support for more replicas, OpenSearch Serverless can now handle thousands of query transactions per minute. OpenSearch Serverless will also seamlessly scale the shard replicas back to a minimum of two active replicas across the Availability Zones when the workload demand decreases.

Scaling overview

Consider an ecommerce website that uses OpenSearch Serverless as a backend search engine to host its product catalog.

In the following figure, an index has four shards to handle the product catalog. All four shards fit into one OpenSearch Capacity Unit (OCU). Because OpenSearch Serverless is designed to cater to production systems, it will automatically create an additional set of replicas for these four shards, which are hosted in a separate Availability Zone. Both sets of search replicas will actively respond to the incoming traffic load.
When new products are launched, they often generate more interest, resulting in increased traffic and search queries on the website in the days following the launch. In this scenario, the shards containing the data for the new product will receive significantly higher volume of search requests than other shards within the same index. OpenSearch Serverless will identify these shards as hot shards because they’re close to breaching the system thresholds.
To handle the spike in search requests, OpenSearch Serverless will vertically scale the OCUs and then move the hot shards to a new OCU if required to balance the high query rates. The following figure shows how the shards would be moved to a new OCU along with other normally loaded shards.
If OpenSearch Serverless keeps receiving additional search requests for shards, it will add new replicas for the shard until all shard replicas can effectively handle the incoming query rates without exceeding the system thresholds. Even after the traffic is successfully handled by OpenSearch Serverless, it continues to evaluate the shard state. When the load on the shards reduces, OpenSearch Serverless will scale down the shard replicas to maintain the minimum OCU and replicas required for the workload.

Search performance with replica scale-out

We ran a performance test on a search corpus representing a product catalog with 600,000 documents and approximately 500 MB. The queries were a mix of term, fuzzy, and aggregation queries. OpenSearch Serverless was able to handle 613 transactions per second (TPS) with P50 latency of 2.8 seconds, whereas with replica scaling, we saw the search throughput scale to 1423 TPS with a 100% increase in throughput and P50 latency of 690 milliseconds, leading to a 75% improvement in response times. The following table summarizes our results. Note that you can configure the max OCU limit to control your costs.

. Initial OCUs Scaled OCUs TPS P50 Latency Number of Replicas
With no replica scaling 2 26 613 2.8 secs 2
With replica scaling 2 100 1423 619ms Replica scaling scales the hot shards up to 8 replicas

The following graphs show that under the same load profile, the new autoscaling feature handled a higher number of queries in the period of 24 hours while consistently maintaining lower latency.

The first graph shows the system performance profile without auto scaling.

The second graph shows the system performance profile with replica scaling.

Conclusion

In this post, we showed how the OpenSearch Serverless new shard replica scale-out feature for auto scaling helps you achieve higher throughput while maintaining cost-efficiency for search and time series collections. It automatically scales the replicas for those shards under duress instead of adding replicas for the entire index.

If you have feedback about this post, share it in the comments section. If you have questions about this post, start a new thread on the Amazon OpenSearch Service forum or contact AWS Support.


About the Authors

Prashant Agrawal is a Sr. Search Specialist Solutions Architect with Amazon OpenSearch Service. He works closely with customers to help them migrate their workloads to the cloud and helps existing customers fine-tune their clusters to achieve better performance and save on cost. Before joining AWS, he helped various customers use OpenSearch and Elasticsearch for their search and log analytics use cases. When not working, you can find him traveling and exploring new places. In short, he likes doing Eat → Travel → Repeat.

Satish Nandi is a Senior Technical Product Manager for Amazon OpenSearch Service.

Pavani Baddepudi is a Principal Product Manager working in search services at AWS. Her interests include distributed systems, networking, and security.

Amazon OpenSearch Serverless expands support for larger workloads and collections

Post Syndicated from Prashant Agrawal original https://aws.amazon.com/blogs/big-data/amazon-opensearch-serverless-expands-support-for-larger-workloads-and-collections/

We recently announced new enhancements to Amazon OpenSearch Serverless that can scan and search source data sizes of up to 6 TB. At launch, OpenSearch Serverless supported searching one or more indexes within a collection, with the total combined size of up to 1 TB. With the support for 6 TB source data, you can now scale up your log analytics, machine learning applications, and ecommerce data more effectively. With OpenSearch Serverless, you can enjoy the benefits of these expanded limits without having to worry about sizing, monitoring your usage, or manually scaling an OpenSearch domain. If you are new to OpenSearch Serverless, refer to Log analytics the easy way with Amazon OpenSearch Serverless to get started.

The compute capacity in OpenSearch Serverless used for data ingestion and search and query is measured in OpenSearch Compute Units (OCUs). To support larger datasets, we have raised the OCU limit from 50 to 100 for indexing and search, including redundancy for Availability Zone outages and infrastructure failures. These OCUs are shared among various collections, each containing one or more indexes of varied sizes. You can configure maximum OCU limits on search and indexing independently using the AWS Command Line Interface (AWS CLI), SDK, or AWS Management Console to manage costs. Furthermore, you can have multiple 6 TB collections. If you wish to expand the OCU limits for indexes and collection sizes beyond 6 TB, reach out to us through AWS Support.

Set max OCU to 100

To get started, you must first change the OCU limits for indexing and search to 100. Note that you only pay for the resources consumed and not for the max OCU configuration.

Ingesting the data

You can use the load generation scripts shared in the following workshop or you can use your own application or data generator to create load. You can run multiple instances of these scripts to generate a burst in indexing requests. As seen in the following screenshot, in this test, we created six indexes approximating to 1 TB or more.

Auto scaling resources in OpenSearch Serverless

The highlighted points in the following figures show how OpenSearch Serverless responds to the increasing indexing traffic from 2,000 bulk request operations to 7,000 bulk requests per second by auto scaling the OCUs. Each bulk request includes 7,500 documents. OpenSearch Serverless uses various system signals to automatically scale out the OCUs based on your workload demand.

OpenSearch Serverless also scales down indexing OCUs when there is a decrease in your workload’s activity level. The highlighted points in the following figures show a gradual decrease in indexing traffic from 7,000 bulk ingest operations to less than 1,000 operations per second. OpenSearch Serverless reacts to the changes in load by reducing the number of OCUs.

Conclusion

We encourage you to take advantage of the 6 TB index support and put it to the test! Migrate your data, explore the improved throughput, and take advantage of the enhanced scaling capabilities. Our goal is to deliver a seamless and efficient experience that aligns with your requirements.

To get started, refer to Log analytics the easy way with Amazon OpenSearch Serverless. To get hands-on with OpenSearch Serverless, follow the Getting started with Amazon OpenSearch Serverless workshop, which has a step-by-step guide for configuring and setting up an OpenSearch Serverless collection.

If you have feedback about this post, share it in the comments section. If you have questions about this post, start a new thread on the Amazon OpenSearch Service forum or contact AWS Support.


About the author

Prashant Agrawal is a Sr. Search Specialist Solutions Architect with Amazon OpenSearch Service. He works closely with customers to help them migrate their workloads to the cloud and helps existing customers fine-tune their clusters to achieve better performance and save on cost. Before joining AWS, he helped various customers use OpenSearch and Elasticsearch for their search and log analytics use cases. When not working, you can find him traveling and exploring new places. In short, he likes doing Eat → Travel → Repeat.

Amazon OpenSearch Service now supports 99.99% availability using Multi-AZ with Standby

Post Syndicated from Prashant Agrawal original https://aws.amazon.com/blogs/big-data/amazon-opensearch-service-now-supports-99-99-availability-using-multi-az-with-standby/

Customers use Amazon OpenSearch Service for mission-critical applications and monitoring. But what happens when OpenSearch Service itself is unavailable? If your ecommerce search is down, for example, you’re losing revenue. If you’re monitoring your application with OpenSearch Service, and it becomes unavailable, your ability to detect, diagnose, and repair issues with your application is diminished. In these cases, you may suffer lost revenue, customer dissatisfaction, reduced productivity, or even damage to your organization’s reputation.

OpenSearch Service offers an SLA of three 9s (99.9%) availability when following best practices. However, following those practices is complicated, and can require knowledge of and experience with OpenSearch’s data deployment and management, along with an understanding of how OpenSearch Service interacts with AWS Availability Zones and networking, distributed systems, OpenSearch’s self-healing capabilities, and its recovery methods. Furthermore, when an issue arises, such as a node becoming unresponsive, OpenSearch Service recovers by recreating the missing shards (data), causing a potentially large movement of data in the domain. This data movement increases resource usage on the cluster, which can impact performance. If the cluster is not sized properly, it can experience degraded availability, which defeats the purpose of provisioning the cluster across three Availability Zones.

Today, AWS is announcing the new deployment option Multi-AZ with Standby for OpenSearch Service, which helps you offload some of that heavy lifting in terms of high frequency monitoring, fast failure detection, and quick recovery from failure, and keeps your domains available and performant even in the event of an infrastructure failure. With Multi-AZ with Standby, you get 99.99% availability with consistent performance for a domain.

In this post, we discuss the benefits of this new option and how to configure your OpenSearch cluster with Multi-AZ with Standby.

Solution overview

The OpenSearch Service team has incorporated years of experience running tens of thousands of domains for our customers into the Multi-AZ with Standby feature. When you adopt Multi-AZ with Standby, OpenSearch Service creates a cluster across three Availability Zones, with each Availability Zone containing a complete copy of data in the cluster. OpenSearch Service then puts one Availability Zone into standby mode, routing all queries to the other two Availability Zones. When it detects a hardware-related failure, OpenSearch Service promotes nodes from the standby pool to become active in less than a minute. When you use Multi-AZ with Standby, OpenSearch Service doesn’t need to redistribute or recreate data from missing nodes. As a result, cluster performance is unaffected, removing the risk of degraded availability.

Prerequisites

Multi-AZ with Standby requires the following prerequisites:

  • The domain needs to run on OpenSearch 1.3 or above
  • The domain is deployed across three Availability Zones
  • The domain has three (or a multiple of three) data notes
  • You must use three dedicated cluster manager (master) nodes

Refer to Sizing Amazon OpenSearch Service domains for guidance on sizing your domain and dedicated cluster manager nodes.

Configure your OpenSearch cluster using Multi-AZ with Standby

You can use Multi-AZ with Standby when you create a new domain, or you can add it to an existing domain. If you’re creating a new domain using the AWS Management Console, you can create it with Multi-AZ with Standby by either selecting the new Easy create option or the traditional Standard create option. You can update existing domains to use Multi-AZ with Standby by editing their domain configuration.

The Easy create option, as the name suggests, makes creating a domain easier by defaulting to best practice choices for most of the configuration (the majority of which can be altered later). The domain will be set up for high availability from the start and deployed as Multi-AZ with Standby.

While choosing the data nodes, you should choose three (or a multiple of three) data nodes so that they are equally distributed across each of the Availability Zones. The Data nodes table on the OpenSearch Service console provides a visual representation of the data notes, showing that one of the Availability Zones will be put on standby.

Similarly, while selecting the cluster manager (master) node, consider the number of data nodes, indexes, and shards that you plan to have before deciding the instance size.

After the domain is created, you can check its deployment type on the OpenSearch Service console under Cluster configuration, as shown in the following screenshot.

While creating an index, make sure that the number of copies (primary and replica) are multiples of three. If you don’t specify the number of replicas, the service will default to two. This is important so that there is at least one copy of the data in each Availability Zone. We recommend using an index template or similar for logs workloads.

OpenSearch Service distributes the nodes and data copies equally across the three Availability Zones. During normal operations, the standby nodes don’t receive any search requests. The two active Availability Zones respond to all the search requests. However, data is replicated to these standby nodes to ensure you have a full copy of the data in each Availability Zone at all times.

Response to infrastructure failure events

OpenSearch Service continuously monitors the domain for events like node failure, disk failure, or Availability Zone failure. In the event of an infrastructure failure like an Availability Zone failure, OpenSearch Services promotes the standby nodes to active while the impacted Availability Zone recovers. Impact (if any) is limited to the in-flight requests as traffic is weighed away from the impacted Availability Zone in less a minute.

You can check the status of the domain, data node metrics for both active and standby, and Availability Zone rotation metrics on the Cluster health tab. The following screenshots show the cluster health and metrics for data nodes such as CPU utilization, JVM memory pressure, and storage.

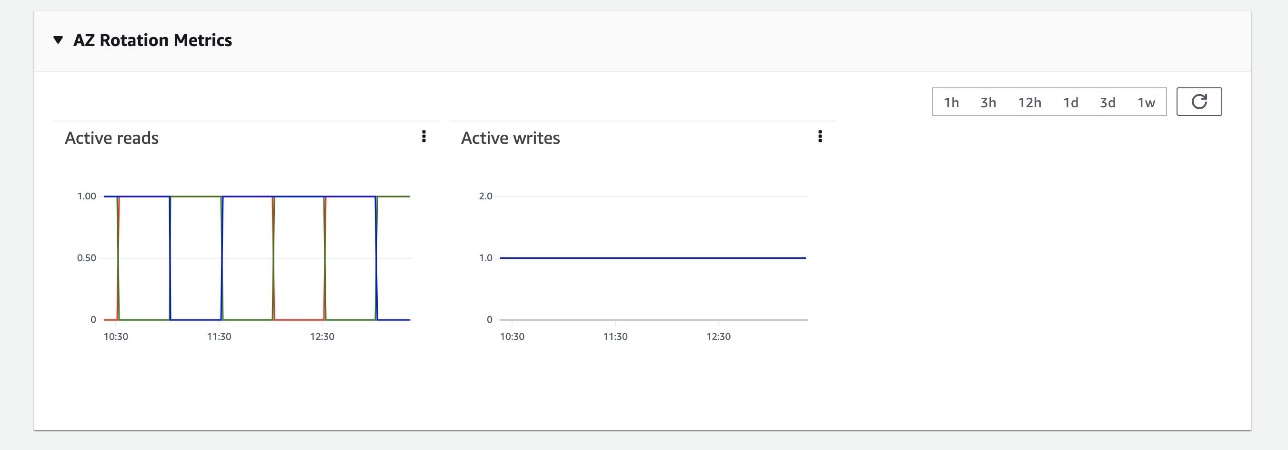
The following screenshot of the AZ Rotation Metrics section (you can find this under Cluster health tab) shows the read and write status of the Availability Zones. OpenSearch Service rotates the standby Availability Zone every 30 minutes to ensure the system is running and ready to respond to events. Availability Zones responding to traffic have a read value of 1, and the standby Availability Zone has a value of 0.

Considerations

Several improvements and guardrails have been made for this feature that offer higher availability and maintain performance. Some static limits have been applied that are specifically related to the number of shards per node, number of shards for a domain, and the size of a shard. OpenSearch Service also enables Auto-Tune by default. Multi-AZ with Standby restricts the storage to GP3- or SSD-backed instances for the most cost-effective and performant storage options. Additionally, we’re introducing an advanced traffic shaping mechanism that will detect rogue queries, which further enhances the reliability of the domain.

We recommend evaluating your domain infrastructure needs based on your workload to achieve high availability and performance.

Conclusion

Multi-AZ with Standby is now available on OpenSearch Service in all AWS Regions globally where OpenSearch service is available, except US West (N. California), and AWS GovCloud (US-Gov-East, US-Gov-West). Try it out and send your feedback to AWS re:Post for Amazon OpenSearch Service or through your usual AWS support contacts.


About the authors

Prashant Agrawal is a Sr. Search Specialist Solutions Architect with Amazon OpenSearch Service. He works closely with customers to help them migrate their workloads to the cloud and helps existing customers fine-tune their clusters to achieve better performance and save on cost. Before joining AWS, he helped various customers use OpenSearch and Elasticsearch for their search and log analytics use cases. When not working, you can find him traveling and exploring new places. In short, he likes doing Eat → Travel → Repeat.

Rohin Bhargava is a Sr. Product Manager with the Amazon OpenSearch Service team. His passion at AWS is to help customers find the correct mix of AWS services to achieve success for their business goals.

Migrate your indexes to Amazon OpenSearch Serverless with Logstash

Post Syndicated from Prashant Agrawal original https://aws.amazon.com/blogs/big-data/migrate-your-indexes-to-amazon-opensearch-serverless-with-logstash/

We recently announced the general availability of Amazon OpenSearch Serverless , a new option for Amazon OpenSearch Service that makes it easy run large-scale search and analytics workloads without having to configure, manage, or scale OpenSearch clusters. With OpenSearch Serverless, you get the same interactive millisecond response times as OpenSearch Service with the simplicity of a serverless environment.

In this post, you’ll learn how to migrate your existing indices from an OpenSearch Service managed cluster domain to a serverless collection using Logstash.

With OpenSearch domains, you get dedicated, secure clusters configured and optimized for your workloads in minutes. You have full control over the configuration of compute, memory, and storage resources in clusters to optimize cost and performance for your applications. OpenSearch Serverless provides an even simpler way to run search and analytics workloads—without ever having to think about clusters. You simply create a collection and a group of indexes, and can start ingesting and querying the data.

Solution overview

Logstash is open-source software that provides ETL (extract, transform, and load) for your data. You can configure Logstash to connect to a source and a destination via input and output plugins. In between, you configure filters that can transform your data. This post walks you through the steps you need to set up Logstash to connect an OpenSearch Service domain (input) to an OpenSearch Serverless collection (output).

You set the source and destination plugins in Logstash’s config file. The config file has sections for Input, Filter, and Output. Once configured, Logstash will send a request to the OpenSearch Service domain and read the data according to the query you put in the input section. After data is read from OpenSearch Service, you can optionally send it to the next stage Filter for transformations such as adding or removing a field from the input data or updating a field with different values. In this example, you won’t use the Filter plugin. Next is the Output plugin. The open-source version of Logstash (Logstash OSS) provides a convenient way to use the bulk API to upload data to your collections. OpenSearch Serverless supports the logstash-output-opensearch output plugin, which supports AWS Identity and Access Management (IAM) credentials for data access control.

The following diagram illustrates our solution workflow.

Prerequisites

Before getting started, make sure you have completed the following prerequisites:

  1. Note down your OpenSearch Service domain’s ARN, user name, and password.
  2. Create an OpenSearch Serverless collection. If you’re new to OpenSearch Serverless, refer to Log analytics the easy way with Amazon OpenSearch Serverless for details on how to set up your collection.

Set up Logstash and the input and output plugins for OpenSearch

Complete the following steps to set up Logstash and your plugins:

  1. Download logstash-oss-with-opensearch-output-plugin. (This example uses the distro for macos-x64. For other distros, refer to the artifacts.)
    wget https://artifacts.opensearch.org/logstash/logstash-oss-with-opensearch-output-plugin-8.4.0-macos-x64.tar.gz

  2. Extract the downloaded tarball:
    tar -zxvf logstash-oss-with-opensearch-output-plugin-8.4.0-macos-x64.tar.gz
    cd logstash-8.4.0/

  3. Update the logstash-output-opensearch plugin to the latest version:
    <path/to/your/logstash/root/directory>/bin/logstash-plugin update logstash-output-opensearch

  4. Install the logstash-input-opensearch plugin:
    <path/to/your/logstash/root/directory>/bin/logstash-plugin install logstash-input-opensearch

Test the plugin

Let’s get into action and see how the plugin works. The following config file retrieves data from the movies index in your OpenSearch Service domain and indexes that data in your OpenSearch Serverless collection with same index name, movies.

Create a new file and add the following content, then save the file as opensearch-serverless-migration.conf. Provide the values for the OpenSearch Service domain endpoint under HOST, USERNAME, and PASSWORD in the input section, and the OpenSearch Serverless collection endpoint details under HOST along with REGION, AWS_ACCESS_KEY_ID, and AWS_SECRET_ACCESS_KEY in the output section.

input {
    opensearch {
        hosts =>  ["https://<HOST>:443"]
        user  =>  "<USERNAME>"
        password  =>  "<PASSWORD>"
        index =>  "movies"
        query =>  '{ "query": { "match_all": {}} }'
    }
}
output {
    opensearch {
        ecs_compatibility => disabled
        index => "movies"
        hosts => "<HOST>:443"
        auth_type => {
            type => 'aws_iam'
            aws_access_key_id => '<AWS_ACCESS_KEY_ID>'
            aws_secret_access_key => '<AWS_SECRET_ACCESS_KEY>'
            region => '<REGION>'
            service_name => 'aoss'
            }
        legacy_template => false
        default_server_major_version => 2
    }
}

You can specify a query in the input section of the preceding config. The match_all query matches all data in the movies index. You can change the query if you want to select a subset of the data. You can also use the query to parallelize the data transfer by running multiple Logstash processes with configs that specify different data slices. You can also parallelize by running Logstash processes against multiple indexes if you have them.

Start Logstash

Use the following command to start Logstash:

<path/to/your/logstash/root/directory>/bin/logstash -f <path/to/your/config/file>

After you run the command, Logstash will retrieve the data from the source index from your OpenSearch Service domain, and write to the destination index in your OpenSearch Serverless collection. When the data transfer is complete, Logstash shuts down. See the following code:

[2023-01-24T20:14:28,965][INFO][logstash.agent] Successfully
started Logstash API endpoint {:port=>9600, :ssl_enabled=>false}
…
…
[2023-01-24T20:14:38,852][INFO][logstash.javapipeline][main] Pipeline terminated {"pipeline.id"=>"main"}
[2023-01-24T20:14:39,374][INFO][logstash.pipelinesregistry] Removed pipeline from registry successfully {:pipeline_id=>:main}
[2023-01-24T20:14:39,399][INFO][logstash.runner] Logstash shut down.

Verify the data in OpenSearch Serverless

You can verify that Logstash copied all your data by comparing the document count in your domain and your collection. Run the following query either from the Dev tools tab, or with curl, postman, or a similar HTTP client. The following query helps you search all documents from the movies index and returns the top documents along with the count. By default, OpenSearch will return the document count up to a maximum of 10,000. Adding the track_total_hits flag helps you get the exact count of documents if the document count exceeds 10,000.

GET movies/_search
{
  "query": {
    "match_all": {}
  },
  "track_total_hits" : true
}

Conclusion

In this post, you migrated data from your OpenSearch Service domain to your OpenSearch Serverless collection using Logstash’s OpenSearch input and output plugins.

Stay tuned for a series of posts focusing on the various options available for you to build effective log analytics and search solutions using OpenSearch Serverless. You can also refer the Getting started with Amazon OpenSearch Serverless workshop to know more about OpenSearch Serverless.

If you have feedback about this post, submit it in the comments section. If you have questions about this post, start a new thread on the Amazon OpenSearch Service forum or contact AWS Support.


About the authors

Prashant Agrawal is a Sr. Search Specialist Solutions Architect with Amazon OpenSearch Service. He works closely with customers to help them migrate their workloads to the cloud and helps existing customers fine-tune their clusters to achieve better performance and save on cost. Before joining AWS, he helped various customers use OpenSearch and Elasticsearch for their search and log analytics use cases. When not working, you can find him traveling and exploring new places. In short, he likes doing Eat → Travel → Repeat.

Jon Handler (@_searchgeek) is a Sr. Principal Solutions Architect at Amazon Web Services based in Palo Alto, CA. Jon works closely with the CloudSearch and Elasticsearch teams, providing help and guidance to a broad range of customers who have search workloads that they want to move to the AWS Cloud. Prior to joining AWS, Jon’s career as a software developer included four years of coding a large-scale, eCommerce search engine.
Log analytics the easy way with Amazon OpenSearch Serverless

Post Syndicated from Prashant Agrawal original https://aws.amazon.com/blogs/big-data/log-analytics-the-easy-way-with-amazon-opensearch-serverless/

We recently announced the preview release of Amazon OpenSearch Serverless, a new serverless option for Amazon OpenSearch Service, which makes it easy for you to run large-scale search and analytics workloads without having to configure, manage, or scale OpenSearch clusters. It automatically provisions and scales the underlying resources to deliver fast data ingestion and query responses for even the most demanding and unpredictable workloads.

OpenSearch Serverless supports two primary use cases:

  • Log analytics that focuses on analyzing large volumes of semi-structured, machine-generated time series data for operational, security, and user behavior insights
  • Full-text search that powers customer applications in their internal networks (content management systems, legal documents) and internet-facing applications such as ecommerce website catalog search and content search

This post focuses on building a simple log analytics pipeline with OpenSearch Serverless.

Solution overview

In the following sections, we walk through the steps to create and access a collection in OpenSearch Serverless, and demonstrate how to configure two different data ingestion pipelines to index data into the collection.

Create a collection

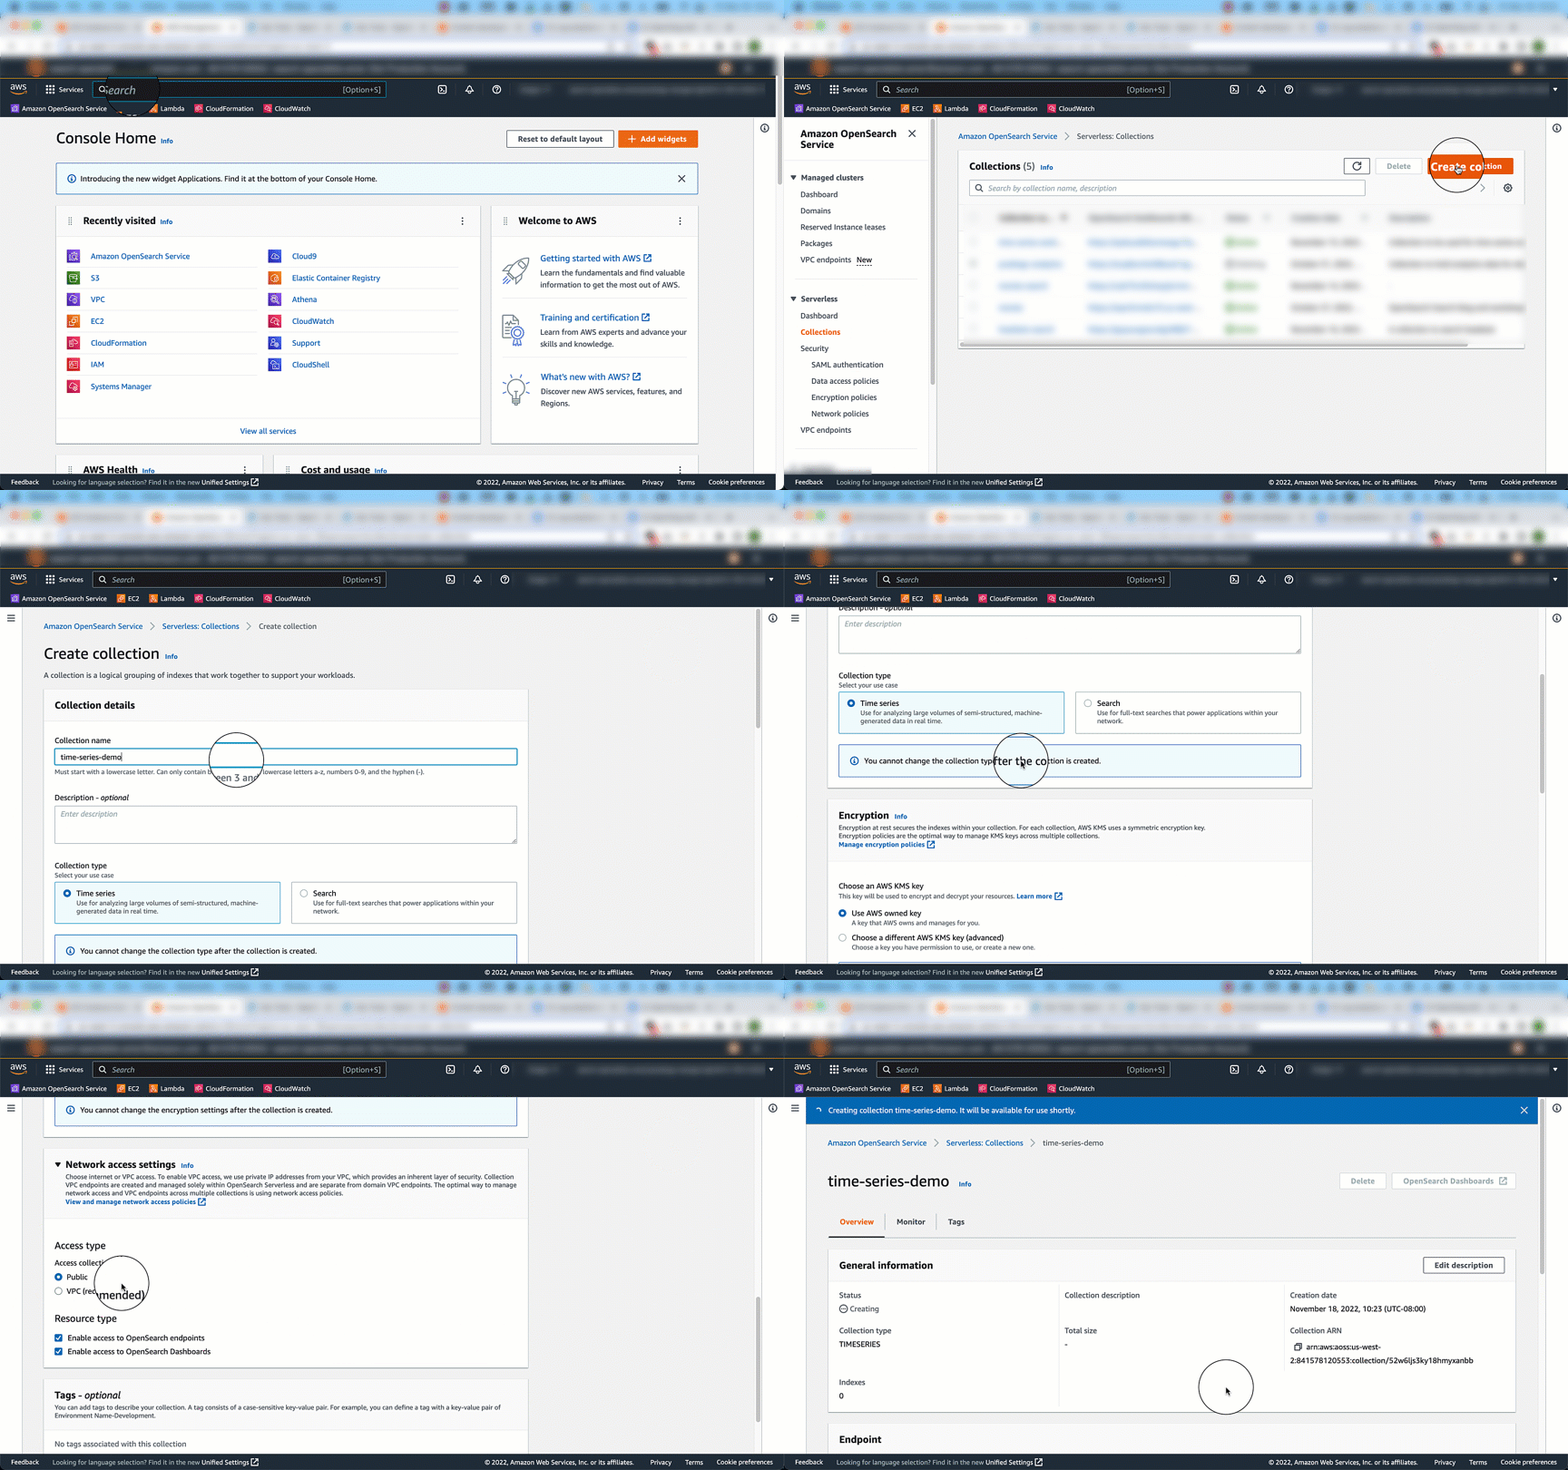
To get started with OpenSearch Serverless, you first create a collection. A collection in OpenSearch Serverless is a logical grouping of one or more indexes that represent an analytics workload.

The following graphic gives a quick navigation for creating a collection. Alternatively, refer to this blog post to learn more about how to create and configure a collection in OpenSearch Serverless.

Access the collection

You can use the AWS Identity and Access Management (IAM) credentials with a secret key and access key ID for your IAM users and roles to access your collection programmatically. Alternatively, you can set up SAML authentication for accessing the OpenSearch Dashboards. Note that SAML authentication is only available to access OpenSearch Dashboards; you require IAM credentials to perform any operations using the AWS Command Line Interface (AWS CLI), API, and OpenSearch clients for indexing and searching data. In this post, we use IAM credentials to access the collections.

Create a data ingestion pipeline

OpenSearch Serverless supports the same ingestion pipelines as the open-source OpenSearch and managed clusters. These clients include applications like Logstash and Amazon Kinesis Data Firehose, and language clients like Java Script, Python, Go, Java, and more. For more details on all the ingestion pipelines and supported clients, refer to ingesting data into OpenSearch Serverless collections.

Using Logstash

The open-source version of Logstash (Logstash OSS) provides a convenient way to use the bulk API to upload data into your collections. OpenSearch Serverless supports the logstash-output-opensearch output plugin, which supports IAM credentials for data access control. In this post, we show how to use the file input plugin to send data from your command line console to an OpenSearch Serverless collection. Complete the following steps:

  1. Download the logstash-oss-with-opensearch-output-plugin file (this example uses the distro for macos-x64; for other distros, refer to the artifacts):
    wget https://artifacts.opensearch.org/logstash/logstash-oss-with-opensearch-output-plugin-8.4.0-macos-x64.tar.gz

  2. Extract the downloaded tarball:
    tar -zxvf logstash-oss-with-opensearch-output-plugin-8.4.0-macos-x64.tar.gz
    cd logstash-8.4.0/

  3. Update the logstash-output-opensearch plugin to the latest version:
    ./bin/logstash-plugin update logstash-output-opensearch

    The OpenSearch output plugin for OpenSearch Serverless uses IAM credentials to authenticate. In this example, we show how to use the file input plugin to read data from a file and ingest into an OpenSearch Serverless collection.

  4. Create a log file with the following sample data and name it sample.log:
    {"deviceId":2823605996,"fleetRegNo":"IRV82MBYQ1","oilLevel":0.92,"milesTravelled":1.105,"totalFuelUsed":0.01,"carrier":"AOS Van Lines","temperature":14,"tripId":6741375582,"originODC":"ODC Las Vegas","originCountry":"United States","originCity":"Las Vegas","originState":"Nevada","originGeo":"36.16,-115.13","destinationODC":"ODC San Jose","destinationCountry":"United States","destinationCity":"San Jose","destinationState":"California","destinationGeo":"37.33,-121.89","speedInMiles":18,"distanceMiles":382.81,"milesToDestination":381.705,"@timestamp":"2022-11-17T17:11:25.855Z","traffic":"heavy","weather_category":"Cloudy","weather":"Cloudy"}
    {"deviceId":2823605996,"fleetRegNo":"IRV82MBYQ1","oilLevel":0.92,"milesTravelled":1.105,"totalFuelUsed":0.01,"carrier":"AOS Van Lines","temperature":14,"tripId":6741375582,"originODC":"ODC Las Vegas","originCountry":"United States","originCity":"Las Vegas","originState":"Nevada","originGeo":"36.16,-115.13","destinationODC":"ODC San Jose","destinationCountry":"United States","destinationCity":"San Jose","destinationState":"California","destinationGeo":"37.33,-121.89","speedInMiles":18,"distanceMiles":382.81,"milesToDestination":381.705,"@timestamp":"2022-11-17T17:11:26.155Z","traffic":"heavy","weather_category":"Cloudy","weather":"Heavy Fog"}
    {"deviceId":2823605996,"fleetRegNo":"IRV82MBYQ1","oilLevel":0.92,"milesTravelled":1.105,"totalFuelUsed":0.01,"carrier":"AOS Van Lines","temperature":14,"tripId":6741375582,"originODC":"ODC Las Vegas","originCountry":"United States","originCity":"Las Vegas","originState":"Nevada","originGeo":"36.16,-115.13","destinationODC":"ODC San Jose","destinationCountry":"United States","destinationCity":"San Jose","destinationState":"California","destinationGeo":"37.33,-121.89","speedInMiles":18,"distanceMiles":382.81,"milesToDestination":381.705,"@timestamp":"2022-11-17T17:11:26.255Z","traffic":"heavy","weather_category":"Cloudy","weather":"Cloudy"}
    {"deviceId":2823605996,"fleetRegNo":"IRV82MBYQ1","oilLevel":0.92,"milesTravelled":1.105,"totalFuelUsed":0.01,"carrier":"AOS Van Lines","temperature":14,"tripId":6741375582,"originODC":"ODC Las Vegas","originCountry":"United States","originCity":"Las Vegas","originState":"Nevada","originGeo":"36.16,-115.13","destinationODC":"ODC San Jose","destinationCountry":"United States","destinationCity":"San Jose","destinationState":"California","destinationGeo":"37.33,-121.89","speedInMiles":18,"distanceMiles":382.81,"milesToDestination":381.705,"@timestamp":"2022-11-17T17:11:26.556Z","traffic":"heavy","weather_category":"Cloudy","weather":"Heavy Fog"}
    {"deviceId":2823605996,"fleetRegNo":"IRV82MBYQ1","oilLevel":0.92,"milesTravelled":1.105,"totalFuelUsed":0.01,"carrier":"AOS Van Lines","temperature":14,"tripId":6741375582,"originODC":"ODC Las Vegas","originCountry":"United States","originCity":"Las Vegas","originState":"Nevada","originGeo":"36.16,-115.13","destinationODC":"ODC San Jose","destinationCountry":"United States","destinationCity":"San Jose","destinationState":"California","destinationGeo":"37.33,-121.89","speedInMiles":18,"distanceMiles":382.81,"milesToDestination":381.705,"@timestamp":"2022-11-17T17:11:26.756Z","traffic":"heavy","weather_category":"Cloudy","weather":"Cloudy"}

  5. Create a new file and add the following content, and save the file as logstash-output-opensearch.conf after providing the information about your file path, host, Region, access key, and secret access key:
    input {
       file {
         path => "<path/to/your/sample.log>"
         start_position => "beginning"
       }
    }
    output {
        opensearch {
            ecs_compatibility => disabled
            index => "logstash-sample"
            hosts => "<HOST>:443"
            auth_type => {
                type => 'aws_iam'
                aws_access_key_id => '<AWS_ACCESS_KEY_ID>'
                aws_secret_access_key => '<AWS_SECRET_ACCESS_KEY>'
                region => '<REGION>'
                service_name => 'aoss'
                }
            legacy_template => false
            default_server_major_version => 2
        }
    }

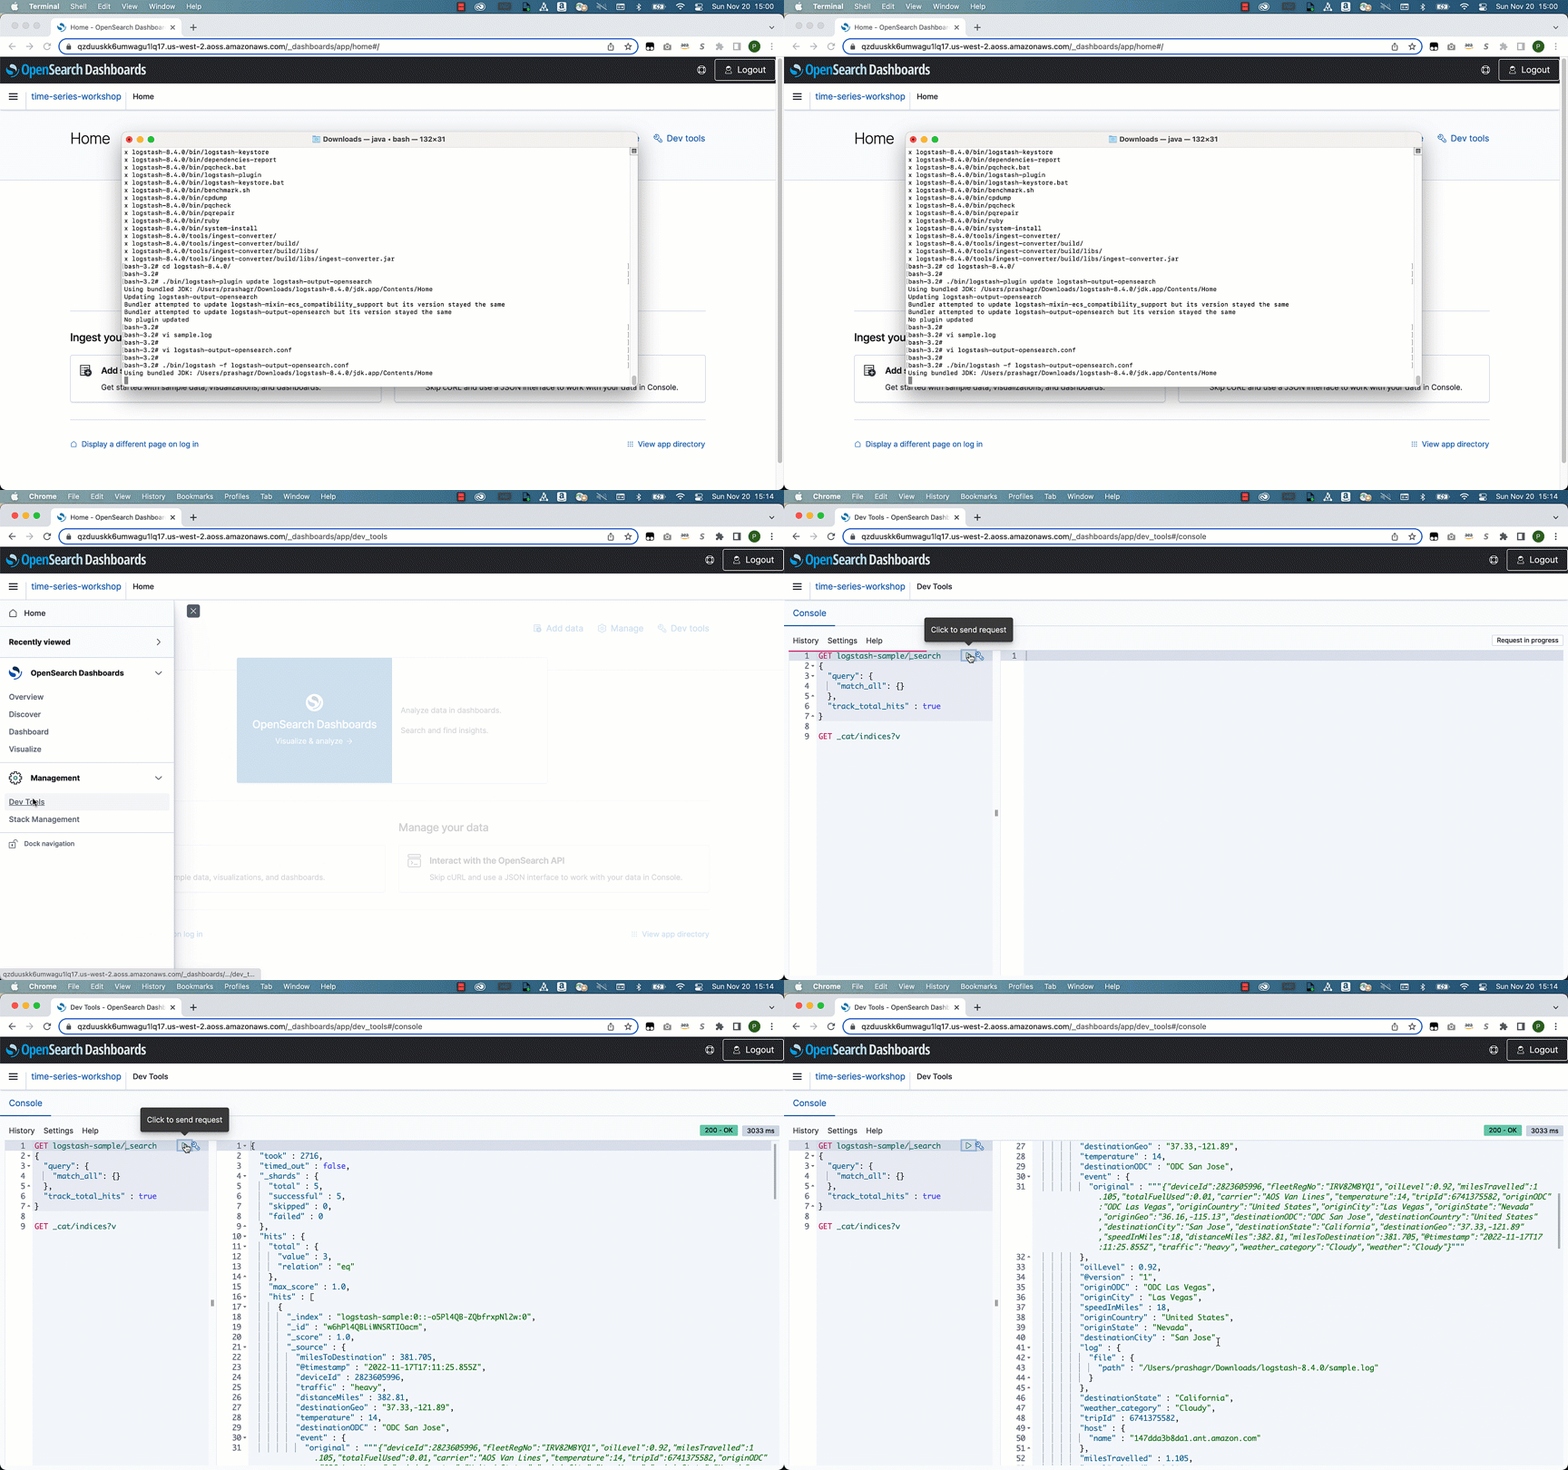
  6. Use the following command to start Logstash with the config file created in the previous step. This creates an index called logstash-sample and ingests the document added under the sample.log file:
    ./bin/logstash -f <path/to/your/config/file>

  7. Search using OpenSearch Dashboards by running the following query:
    GET logstash-sample/_search
    {
      "query": {
        "match_all": {}
      },
      "track_total_hits" : true
    }

In this step, you used a file input plugin from Logstash to send data to OpenSearch Serverless. You can replace the input plugin with any other plugin supported by Logstash, such as Amazon Simple Storage Service (Amazon S3), stdin, tcp, or others, to send data to the OpenSearch Serverless collection.

Using a Python client

OpenSearch provides high-level clients for several popular programming languages, which you can use to integrate with your application. With OpenSearch Serverless, you can continue to use your existing OpenSearch client to load and query your data in collections.

In this section, we show how to use the opensearch-py client for Python to establish a secure connection with your OpenSearch Serverless collection, create an index, send sample logs, and analyze those log data using OpenSearch Dashboards. In this example, we use a sample event generated from fleets carrying goods and packages. This data contains pertinent fields such as source, destination, weather, speed, and traffic. The following is a sample record:

"_source" : {
    "deviceId" : 2823605996,
    "fleetRegNo" : "IRV82MBYQ1",
    "carrier" : "AOS Van Lines",
    "temperature" : 14,
    "tripId" : 6741375582,
    "originODC" : "ODC Las Vegas",
    "originCountry" : "United States",
    "originCity" : "Las Vegas",
    "destinationCity" : "San Jose",
    "@timestamp" : "2022-11-17T17:11:25.855Z",
    "traffic" : "heavy",
    "weather" : "Cloudy"
    ...
    ...
}

To set up the Python client for OpenSearch, you must have the following prerequisites:

  • Python3 installed on your local machine or the server from where you are running this code
  • Package Installer for Python (PIP) installed
  • The AWS CLI configured; we use it to store the secret key and access key for credentials

Complete the following steps to set up the Python client:

  1. Add the OpenSearch Python client to your project and use Python’s virtual environment to set up the required packages:
    mkdir python-sample
    cd python-sample
    python3 -m venv .env
    source .env/bin/activate
    .env/bin/python3 -m pip install opensearch-py
    .env/bin/python3 -m pip install requests_aws4auth
    .env/bin/python3 -m pip install boto3
    .env/bin/python3 -m pip install geopy

  2. Save your frequently used configuration settings and credentials in files that are maintained by the AWS CLI (see Quick configuration with aws configure) by using the following commands and providing your access key, secret key, and Region:
    aws configure

  3. The following sample code uses the opensearch-py client for Python to establish a secure connection to the specified OpenSearch Serverless collection and index a sample document to index time series. You must provide values for region and host. Note that you must use aoss as the service name for OpenSearch Service. Copy the code and save in a file as sample_python.py:
    from opensearchpy import OpenSearch, RequestsHttpConnection
    from requests_aws4auth import AWS4Auth
    import boto3
    
    host = '<host>' # OpenSearch Serverless collection endpoint
    region = '<region>' # e.g. us-west-2
    
    service = 'aoss'
    credentials = boto3.Session().get_credentials()
    awsauth = AWS4Auth(credentials.access_key, credentials.secret_key, region, service,
    session_token=credentials.token)
    
    # Create an OpenSearch client
    client = OpenSearch(
        hosts = [{'host': host, 'port': 443}],
        http_auth = awsauth,
        use_ssl = True,
        verify_certs = True,
        connection_class = RequestsHttpConnection
    )
    # Specify index name
    index_name = 'octank-iot-logs-2022-11-19'
    
    # Prepare a document to index 
    document = {
        "deviceId" : 2823605996,
        "fleetRegNo" : "IRV82MBYQ1",
        "carrier" : "AOS Van Lines",
        "temperature" : 14,
        "tripId" : 6741375582,
        "originODC" : "ODC Las Vegas",
        "originCountry" : "United States",
        "originCity" : "Las Vegas",
        "destinationCity" : "San Jose",
        "@timestamp" : "2022-11-19T17:11:25.855Z",
        "traffic" : "heavy",
        "weather" : "Cloudy"
    }
    
    # Index Documents
    response = client.index(
        index = index_name,
        body = document
    )
    
    print('\n Document indexed with response:')
    print(response)
    
    
    # Search for the Documents
    q = 'heavy'
    query = {
        'size': 5,
            'query': {
            'multi_match': {
            'query': q,
            'fields': ['traffic']
            }
        }
    }
    
    response = client.search(
    body = query,
    index = index_name
    )
    print('\nSearch results:')
    print(response)

  4. Run the sample code:
    python3 sample_python.py

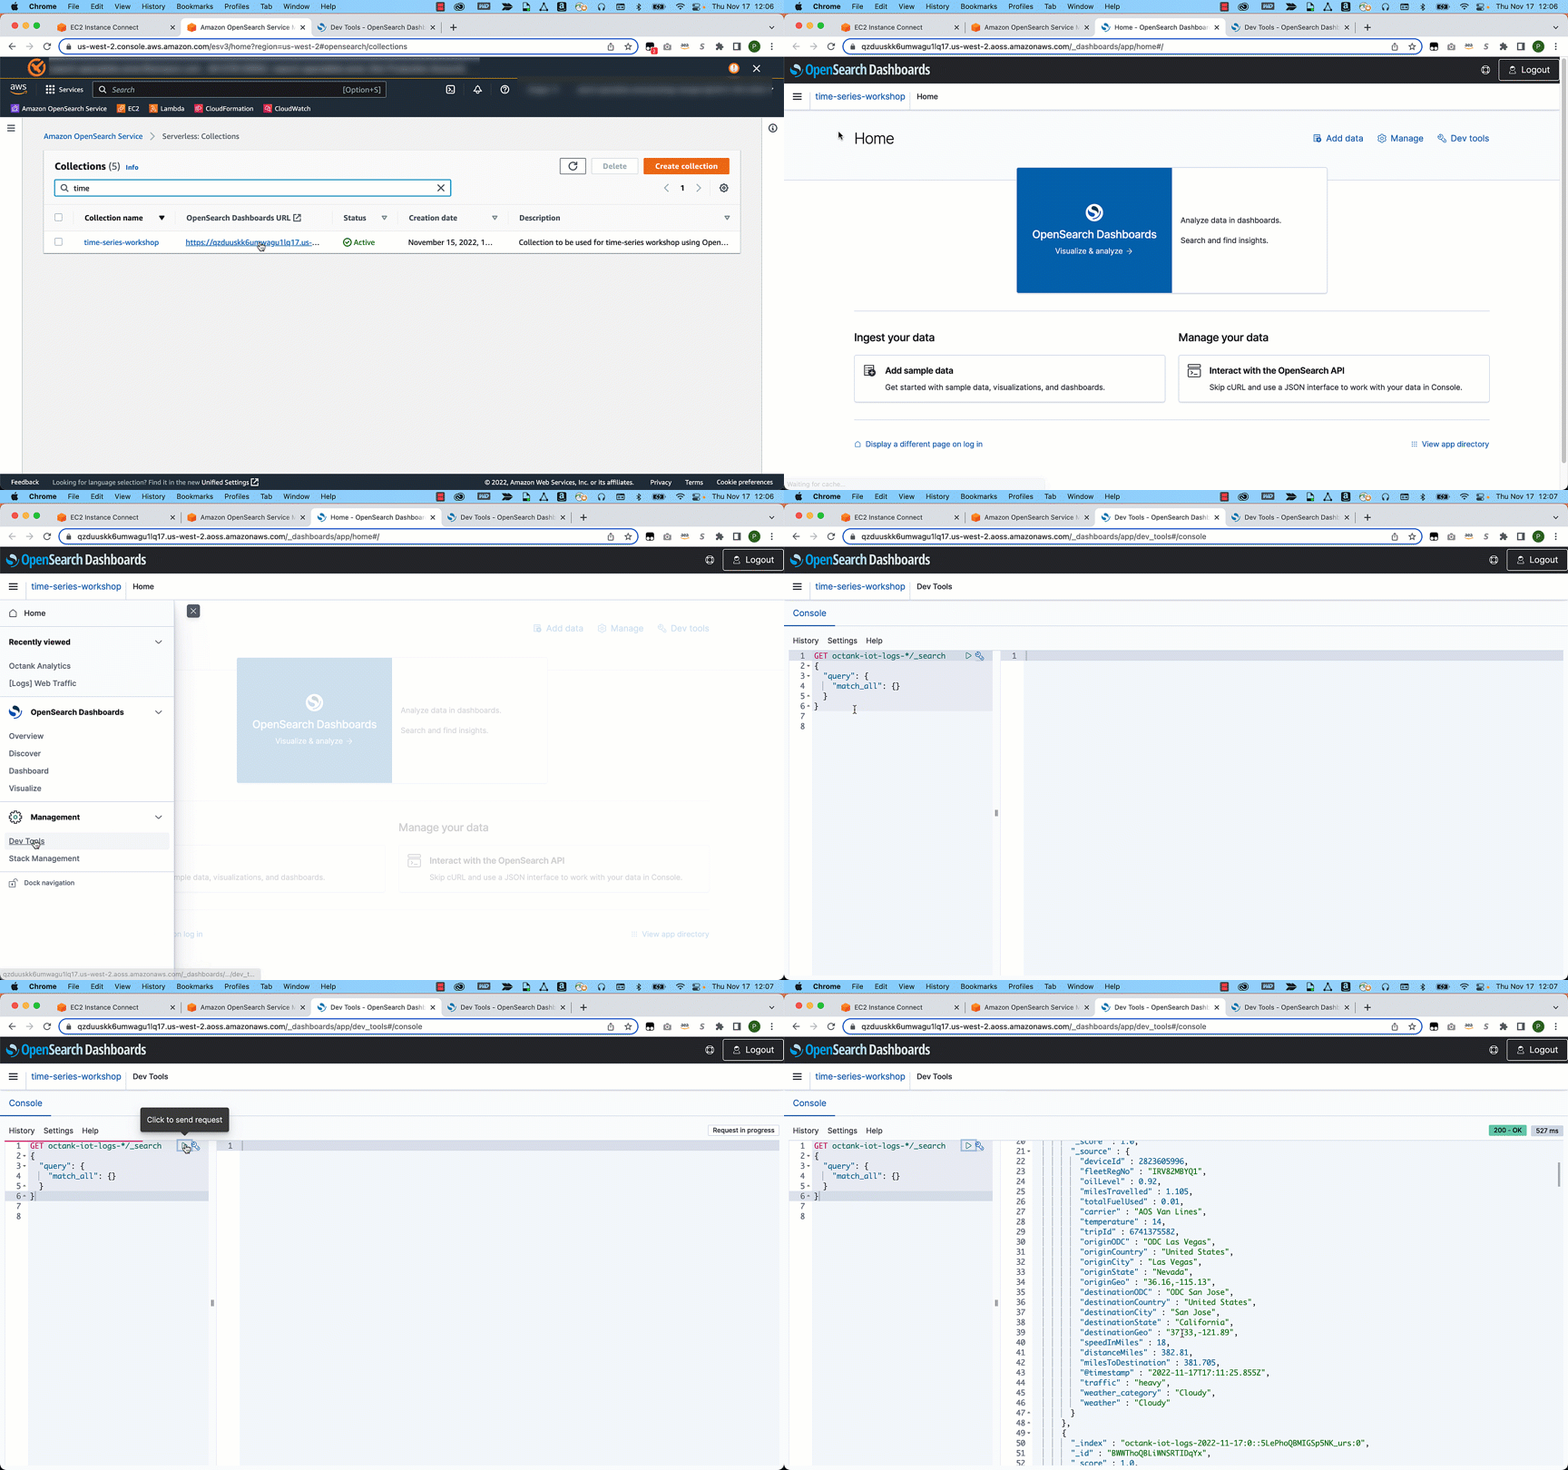
  5. On the OpenSearch Service console, select your collection.
  6. On OpenSearch Dashboards, choose Dev Tools.
  7. Run the following search query to retrieve documents:
    GET octank-iot-logs-*/_search
    {
      "query": {
        "match_all": {}
      }
    }

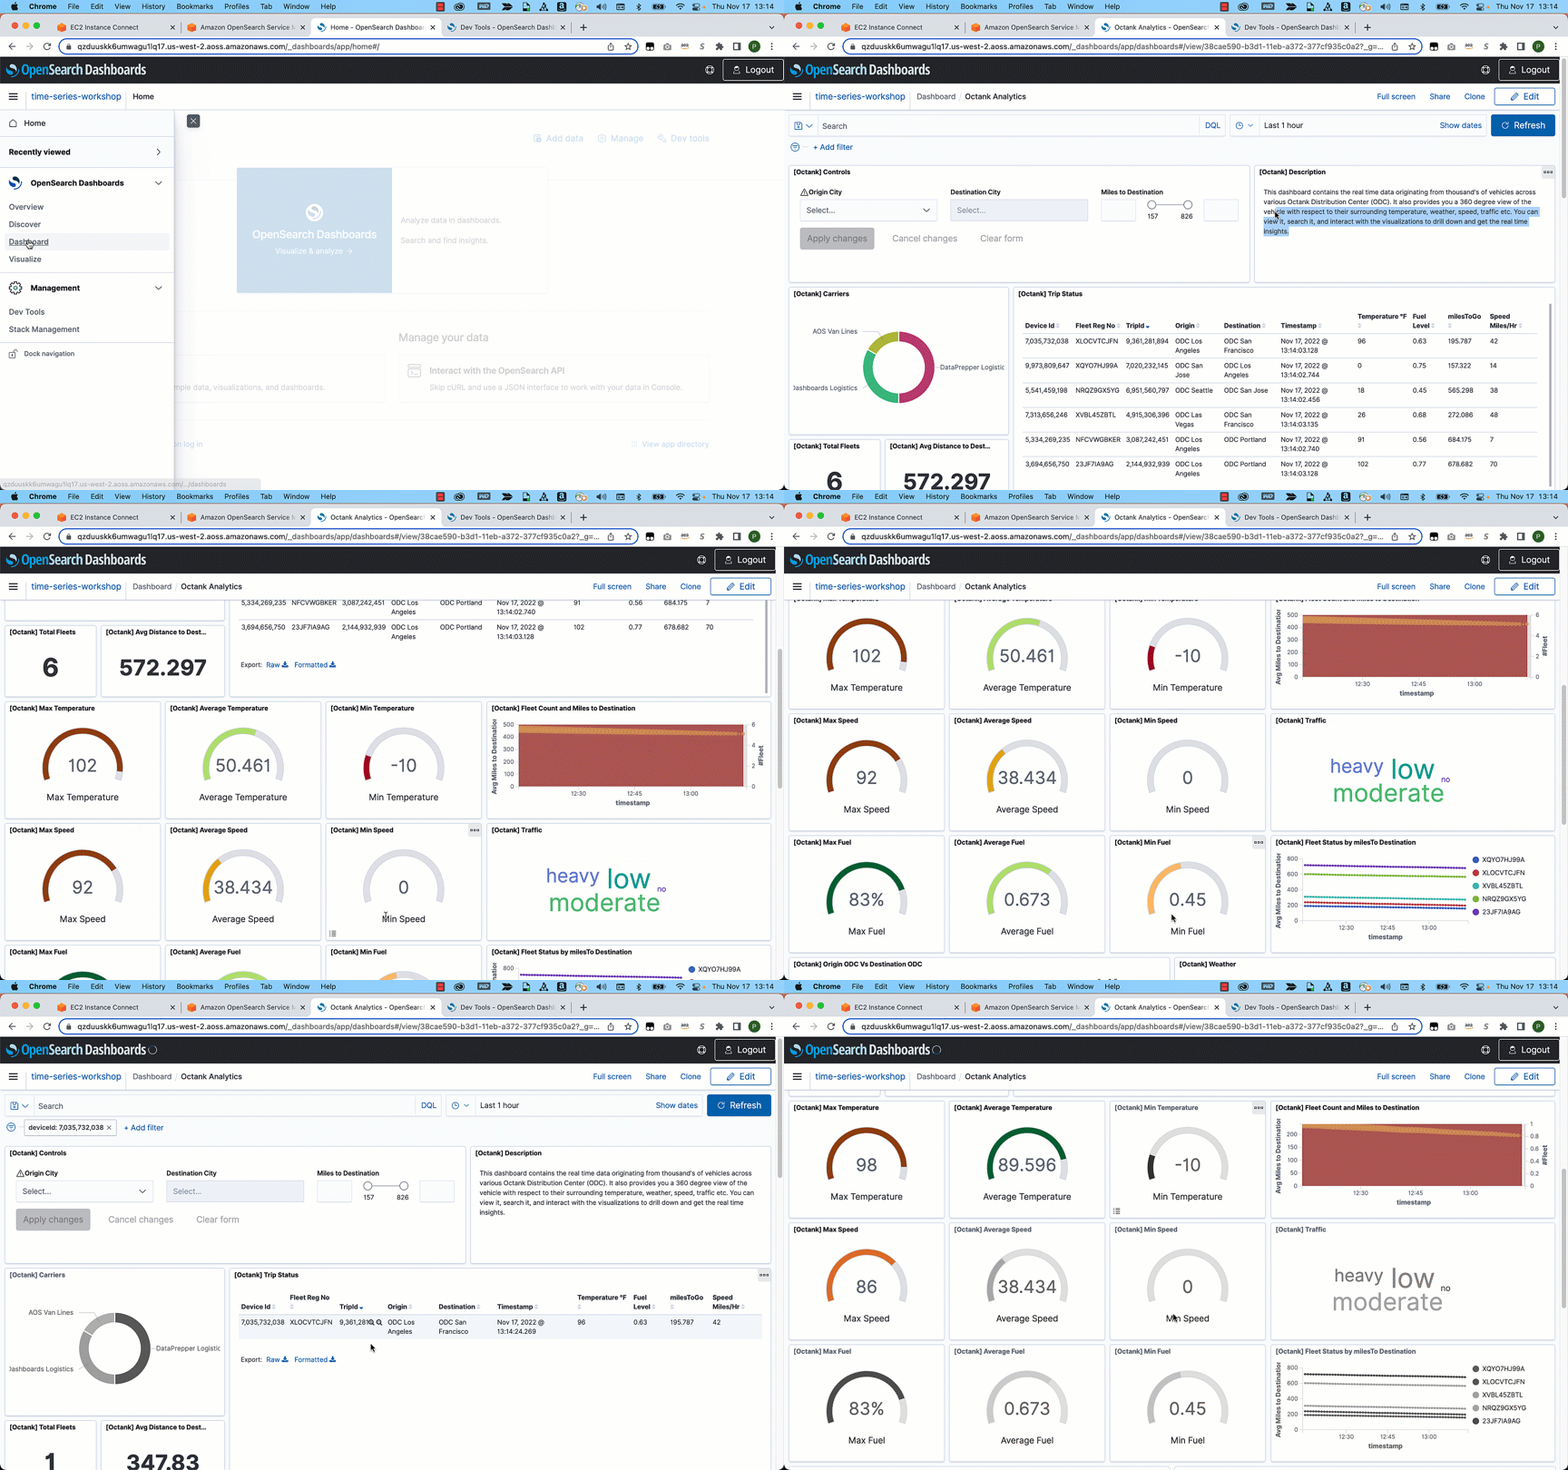
After you have ingested the data, you can use OpenSearch Dashboards to visualize your data. In the following example, we analyze data visually to gain insights on various dimensions such as average fuel consumed by a specific fleet, traffic conditions, distance traveled, and average mileage by the fleet.

Conclusion

In this post, you created a log analytics pipeline using OpenSearch Serverless, a new serverless option for OpenSearch Service. With OpenSearch Serverless, you can focus on building your application without having to worry about provisioning, tuning, and scaling the underlying infrastructure. OpenSearch Serverless supports the same ingestion pipelines and high-level clients as the open-source OpenSearch project. You can easily get started using the familiar OpenSearch indexing and query APIs to load and search your data and use OpenSearch Dashboards to visualize that data.

Stay tuned for a series of posts focusing on the various options available for you to build effective log analytics and search applications. Get hands-on with OpenSearch Serverless by taking the Getting Started with Amazon OpenSearch Serverless workshop and build a similar log analytics pipeline that was discussed in this post.


About the authors

Prashant Agrawal is a Sr. Search Specialist Solutions Architect with Amazon OpenSearch Service. He works closely with customers to help them migrate their workloads to the cloud and helps existing customers fine-tune their clusters to achieve better performance and save on cost. Before joining AWS, he helped various customers use OpenSearch and Elasticsearch for their search and log analytics use cases. When not working, you can find him traveling and exploring new places. In short, he likes doing Eat → Travel → Repeat.

Pavani Baddepudi is a senior product manager working in search services at AWS. Her interests include distributed systems, networking, and security.

Ensure availability of your data using cross-cluster replication with Amazon OpenSearch Service

Post Syndicated from Prashant Agrawal original https://aws.amazon.com/blogs/big-data/ensure-availability-of-your-data-using-cross-cluster-replication-with-amazon-opensearch-service/

Amazon OpenSearch Service is a fully managed service that you can use to deploy and operate OpenSearch and legacy Elasticsearch clusters, cost-effectively, at scale in the AWS Cloud. The service makes it easy for you to perform interactive log analytics, real-time application monitoring, website search, and more by offering the latest versions of OpenSearch, suppor300t for 19 versions of Elasticsearch (1.5 to 7.10 versions), and visualization capabilities powered by OpenSearch Dashboards and Kibana (1.5 to 7.10 versions).

OpenSearch Service announced the support of cross-cluster replication on October 5, 2021. With cross-cluster replication for OpenSearch Service, you can replicate indices at low latency from one domain to another in the same or different AWS Regions without needing additional technologies. Cross-cluster replication provides sequential consistency while continuously copying data from the leader index to the follower index. Sequential consistency ensures the leader and the follower return the same result set after operations are applied on the indices in the same order. Cross-cluster replication is designed to minimize delivery lag between the leader and the follower index. Typical delivery times are less than a minute. You can continuously monitor the replication status via APIs. Additionally, if you have indices that follow an index pattern, you can create automatic follow rules and they will be automatically replicated.

In this post, we show you how to use these features to ensure availability of your data using cross-cluster replication with OpenSearch Service.

Benefits of cross-cluster replication

Cross-cluster replication is helpful for use cases regarding data proximity, disaster recovery, and multi-cluster patterns.

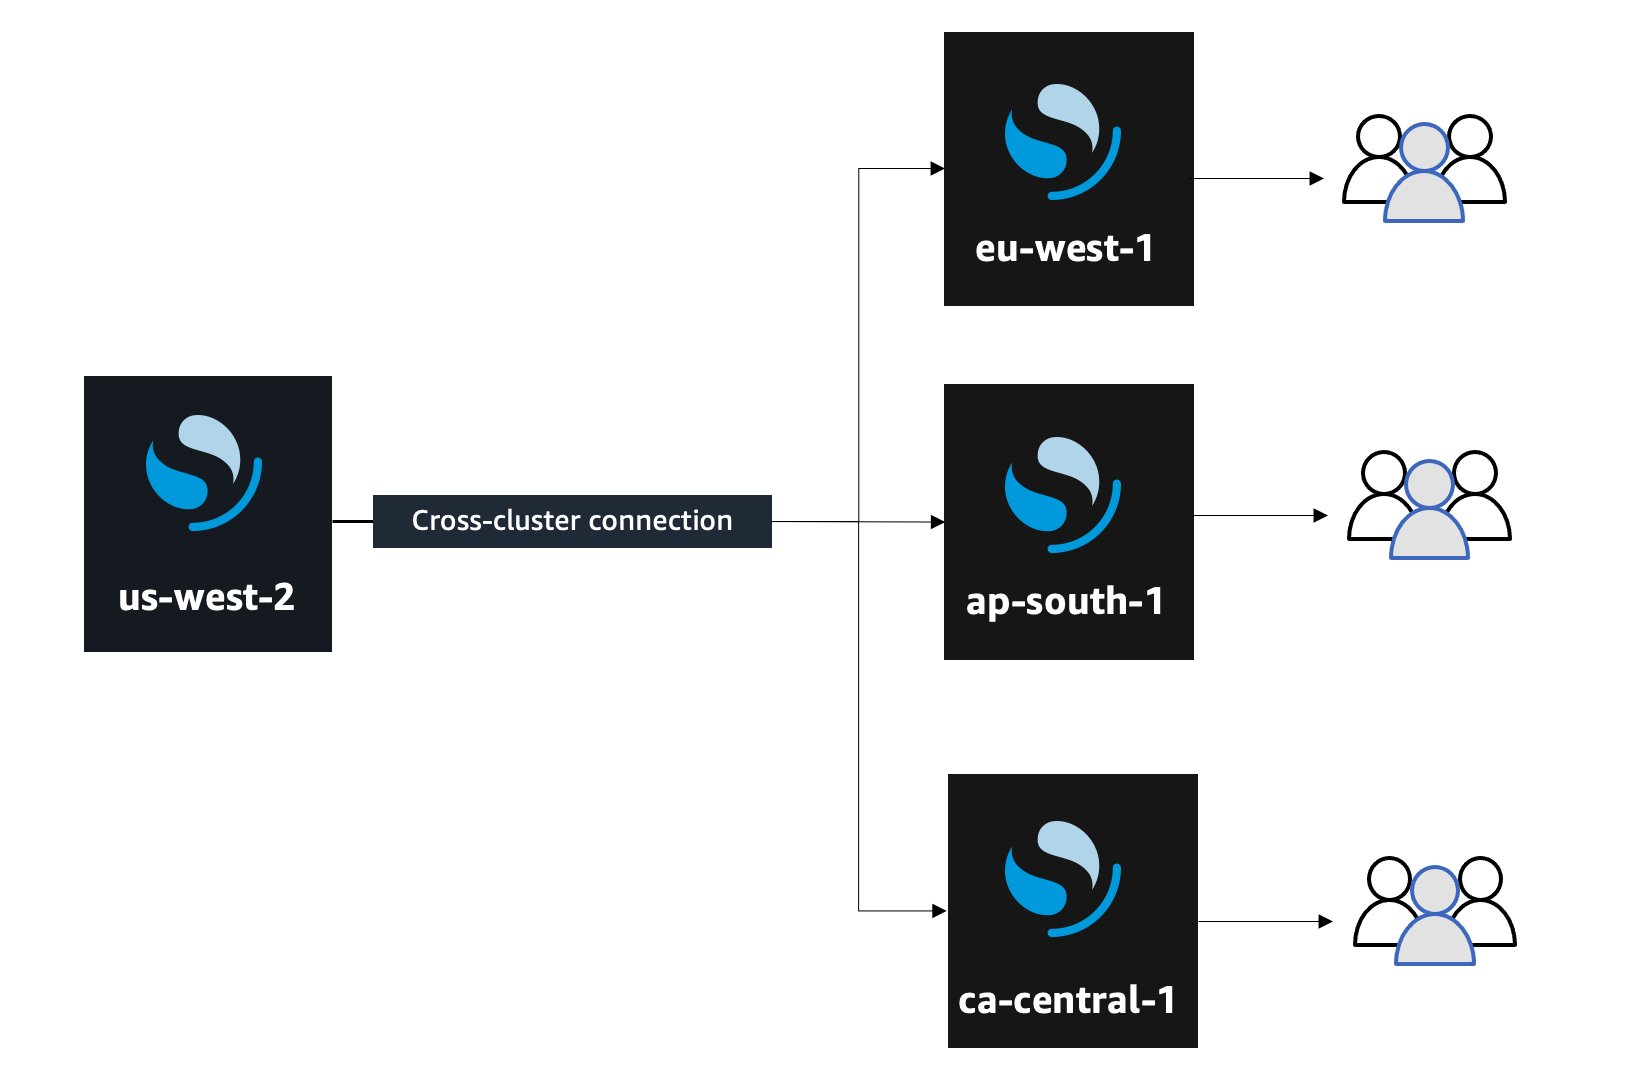
Data proximity helps reduce latency and response time by bringing the data closer to your user or application server. For example, you can replicate data from one Region, us-west-2 (leader), to multiple Regions across the globe acting as followers, eu-west-1, ap-south-1, ca-central-1, and so on, where the follower can poll the leader to sync new or updated data in the leader. In the following diagram, data is replicated from one production cluster in us-west-2 to multiple locally available clusters near the user or application.

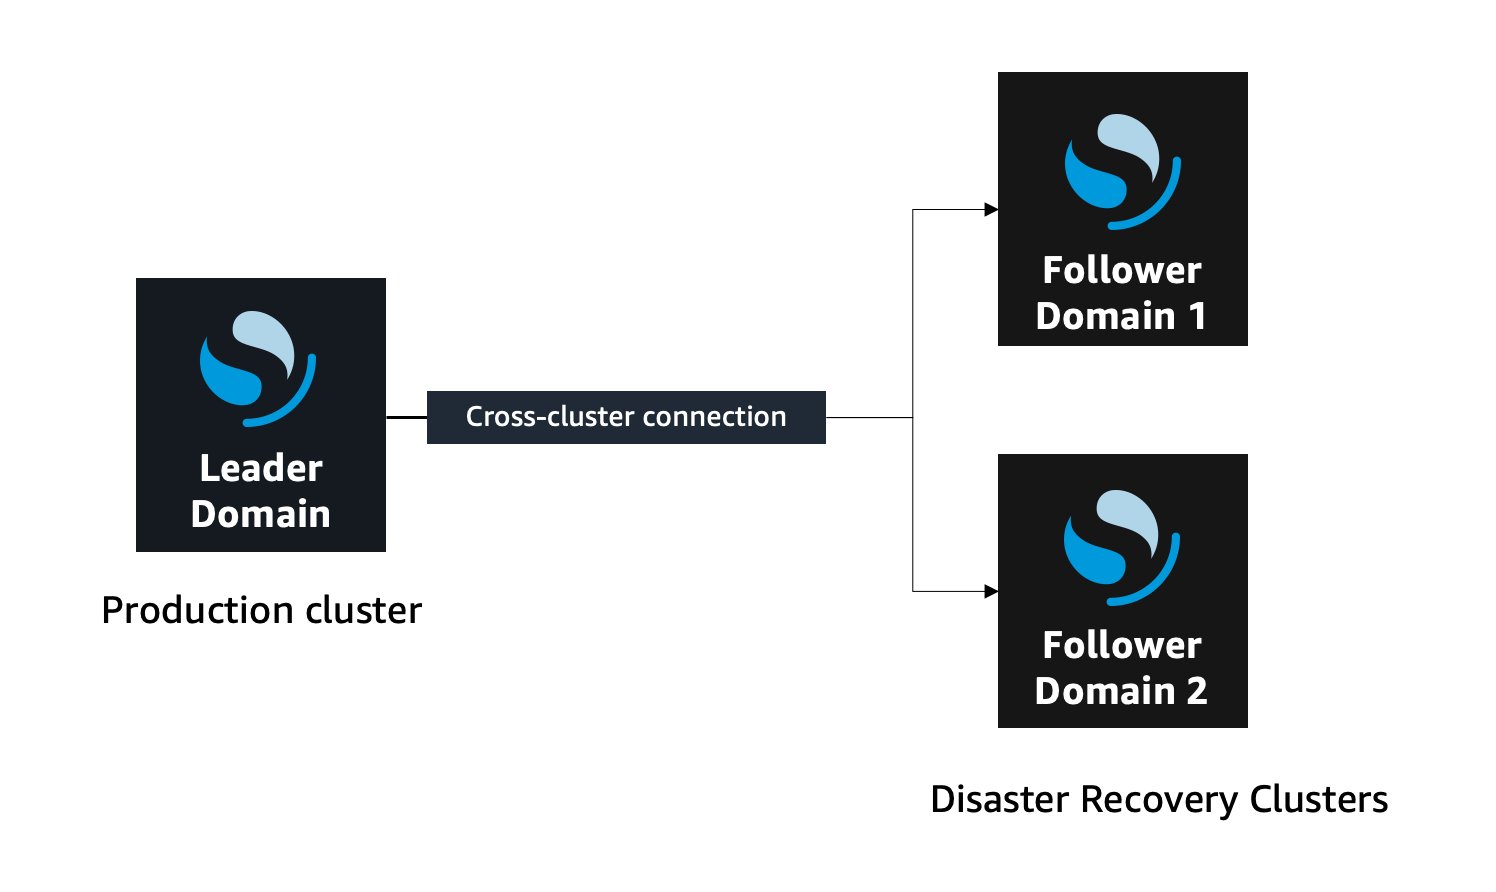
In the case of disaster recovery, you can have one or more follower clusters in the same Region or different Regions, and as long as you have one active cluster, you can serve read requests to the users. In the following diagram, data is replicated from one production cluster to two different disaster recovery clusters.

As of today, cross-cluster replication supports active/active read and active/passive write, as shown in the following diagram.

With this implementation, you can solve the problem of read if your leader goes down, but what about write? As of this writing, cross-cluster replication doesn’t support any kind of failover mechanism to make your follower the leader. In this scenario, you might need to do some extra housekeeping to make your follower domain become the leader and start accepting write requests. This post shows the steps to set up cross-cluster replication and minimize downtime by advancing your follower to be leader.

Set up cross-cluster replication

To set up cross-cluster replication, complete the following steps:

  1. Create two clusters across two Regions, for example leader-east (leader) and follower-west (follower).
    Cross-cluster replication works on a pull model, where the user creates an outbound connection at the follower domain, and the follower keeps polling the leader to sync with new or updated documents for an index.
  2. Go to the follower domain (follower-west) and create a request for an outbound connection. Specify the alias for this connection as follower-west.
  3. Go to the leader domain, locate the inbound connection, and approve the incoming connection from follower-west.
  4. Edit the security configuration and add the following access policy to allow ESCrossClusterGet in the leader domain, which is leader-east:
    {
          "Effect": "Allow",
          "Principal": {
            "AWS": "*"
          },
          "Action": "es:ESCrossClusterGet",
          "Resource": "arn:aws:es:us-east-2:xxx-accountidxx:domain/leader-east"
    }

  5. Create a leader index (on the leader domain), or ignore this step if you already have an index to replicate:
    PUT catalog

  6. Navigate to OpenSearch Dashboards for the follower-west domain.
  7. On the Dev Tools tab, run the following command (or use curl to connect directly):
    PUT _plugins/_replication/catalog-rep/_start
        {
           "leader_alias": "ccr-for-west",
           "leader_index": "catalog",
            "use_roles":{
              "leader_cluster_role": "cross_cluster_replication_leader_full_access",
              "follower_cluster_role": "cross_cluster_replication_follower_full_access"
           }
        }

  8. Confirm the replication:
    GET _plugins/_replication/catalog-rep/_status

  9. Index some documents in the leader index; the following command indexes documents to the catalog index with id:1:
    POST catalog/_doc
    {
      "id": "1"
    }

  10. Now go to follower domain and confirm the documents are replicated by running the following search query:
    Request:
    GET catalog/_search
    
    Response:
    {
    ...
       "hits" : [
          {
            "_index" : "catalog",
            "_type" : "_doc",
            "_id" : "hg3YsYIBcxKtCcyhNyp4",
            "_score" : 1.0,
            "_source" : {
              "id" : "1"
            }
          }
        ]
      }
    }

Pause and stop the replication

When your replication is running, you can use these steps to pause and stop the replication.

You can use the following API to pause the replication, for example, while you debug an issue or load on the leader. Make sure to add an empty body with the request.

POST _plugins/_replication/catalog-rep/_pause
    {}

If you pause the replication, you must resume it within 12 hours. If you fail to resume it within 12 hours, you must stop replication, delete the follower index, and restart replication of the leader.

Stopping the replication makes the follower index unfollow the leader and become a standard index. Use the following code to stop replication:

POST _plugins/_replication/catalog-rep/_stop
    {}    

Note that you can’t restart replication to this index after you stop it.

Auto-follow

You can define a set of replication rules against a single leader domain that automatically replicates indexes that match a specified pattern.

When an index on the leader domain matches one of the patterns (for example, logstash-*), a matching follower index is created on the follower domain. The following code is an example replication rule for auto-follow:

POST _plugins/_replication/_autofollow
    {
      "leader_alias" : "follower-west",
       "name": "rule-name",
       "pattern": "logstash-*",
      "use_roles":{
          "leader_cluster_role": "cross_cluster_replication_leader_full_access",
          "follower_cluster_role": "cross_cluster_replication_follower_full_access"
       }
    }

Delete the replication rule to stop replicating new indexes that match the pattern:

DELETE _plugins/_replication/_autofollow
    {
       "leader_alias" : "follower-west",
       "name": "rule-name"
    } 

Monitor cross-cluster replication metrics

OpenSearch Service provides metrics to monitor cross-cluster replication that can help you know the status of the replication along with its performance. For example, ReplicationRate can help you understand the average rate of replication operations per second, and ReplicationNumSyncingIndices can help you know the number of indexes with the replication status SYNCING. For more details about all the metrics provided by OpenSearch Service for cross-cluster replication, refer to Cross-cluster replication metrics.

Recovering from failure

At this point, we have two OpenSearch Service domains running in two different Regions. Let’s consider a scenario in which some disastrous event happens in the Region with your leader domain and the leader goes down. At this point, you can still serve read traffic from the follower domain, but no additional updates are applied because the follower can’t read from the leader. In this scenario, you can use the following steps to advance your follower to be leader:

  1. Go to your follower domain and stop replication:
    POST _plugins/_replication/catalog-rep/_stop
    {}

    After replication stops on the follower domain, your follower index acts as a normal index.

  2. At this point, you can start sending write traffic to the follower.

This way, you can advance your follower domain to become leader and route your write traffic to the follower, which helps avoid the data loss for new sets of changes and updates.

Keep in mind that there is a small lag (less than a minute) between the leader-follower sync. Additionally, there could be small amount of data loss in the follower domain that was indexed to the leader and not synced to the follower (especially when the leader went down and the follower didn’t have a chance to poll the changes and updates). For this scenario, you should have a mechanism in your ingest pipeline to replay the data to the follower when your leader goes down.

Now, what if the leader comes back online after a certain period of time. At this time, you can’t start the replication again from your follower to sync the delta to the leader. Even if you try to set up the replication from follower to leader, it will fail with an error. After you have used an index for a leader-follower connection, you can’t use same index again to create a new replication. So, what do you do now?

In this scenario, you can use the following steps to set up a leader-follower connection in the opposite direction:

  1. Delete the index from the old leader.
  2. Set up cross-Region replication in the opposite direction with your new leader (follower-west) and new follower (leader-east).
  3. Start the replication on the new follower (which was your old leader) and sync the data.

This runs the sync for all data again for that index, and may take time depending upon the size of the index because it will bootstrap the index and start the replication from scratch. Additionally, you will incur standard AWS data transfer costs for the data transferred with this replication. This way, you can advance your follower (follower-west) to be leader and make your leader (leader-east) the new follower.

Conclusion

In this post, we showed you how you can use cross-cluster replication to sync data between leader and follower indices. We also demonstrated how you can advance your follower to become leader in case your leader goes down. This can help you serve traffic in the event of any disaster scenarios.

If you have feedback about this post, submit your comments in the comments section. If you have questions about this post, start a new thread on the Amazon OpenSearch Service forum or contact AWS Support.


About the Author

Prashant Agrawal is a Search Specialist Solutions Architect with OpenSearch Service. He works closely with customers to help them migrate their workloads to the cloud and helps existing customers fine-tune their clusters to achieve better performance and save on cost. Before joining AWS, he helped various customers use OpenSearch and Elasticsearch for their search and log analytics use cases. When not working, you can find him traveling and exploring new places. In short, he likes doing Eat → Travel → Repeat.

Set advanced settings with the Amazon OpenSearch Service Dashboards API

Post Syndicated from Prashant Agrawal original https://aws.amazon.com/blogs/big-data/set-advanced-settings-with-the-amazon-opensearch-service-dashboards-api/

Amazon OpenSearch Service (successor to Amazon Elasticsearch Service) is a fully managed service that you can use to deploy and operate OpenSearch clusters cost-effectively at scale in the AWS Cloud. The service makes it easy for you to perform interactive log analytics, real-time application monitoring, website search, and more by offering the latest versions of OpenSearch, support for 19 versions of Elasticsearch (1.5 to 7.10 versions), and visualization capabilities powered by OpenSearch Dashboards and Kibana (1.5 to 7.10 versions).

A common use case of OpenSearch in multi-tenant environments is to use tenants in OpenSearch Dashboards and provide segregated index patterns, dashboards, and visualizations to different teams in the organization. Tenants in OpenSearch Dashboards aren’t the same as indexes, where OpenSearch organizes all data. You may still have multiple indexes for multi-tenancy and tenants for controlling access to OpenSearch Dashboards’ saved objects.

In this post, we focus on operationalizing advanced settings for OpenSearch Dashboards tenants with programmatic ways, in particular with the Dashboards Advanced Settings API. For a deeper insight into multi-tenancy in OpenSearch, refer to OpenSearch Dashboards multi-tenancy.

One example of advanced settings configurations is deploying time zone settings in an environment where each tenant is aligned to a different geographic area with specific time zone. We explain the time zone configuration with the UI and demonstrate configuring it with the OpenSearch Dashboards Advanced Settings API using curl. This post also provides guidance for other advanced settings you may wish to include in your deployment.

To follow along in this post, make sure you have an Amazon OpenSearch Service domain with access to OpenSearch Dashboards through a role with administrator privileges for the domain. For more information about enabling access control mechanisms for your domains, see Fine-grained access control in Amazon OpenSearch Service.

The following examples use Amazon OpenSearch Service version 1.0, which was the latest release at the time of writing.

Configure advanced settings in the OpenSearch Dashboards UI

To configure advanced settings via the OpenSearch Dashboards UI, complete the following steps:

  1. Log in to OpenSearch Dashboards.
  2. Choose your user icon and choose Switch Tenants to choose the tenant you want to change configuration for.

By default, all OpenSearch Dashboards users have access to two tenants: private and global. The global tenant is shared between every OpenSearch Dashboards user. The private tenant is exclusive to each user and used mostly for experimenting before publishing configuration to other tenants. Make sure to check your configurations in the private tenant before replicating in other tenants, including global.

  1. Choose Stack Management in the navigation pane, then choose Advanced Settings.
  2. In your desired tenant context, choose a value for Timezone for date formatting.

In this example, we change the time zone from the default selection Browser to US/Eastern.

  1. Choose Save changes.

Configure advanced settings with the OpenSearch Dashboards API

For environments where you prefer to perform operations programmatically, Amazon OpenSearch Service provides the ability to configure advanced settings with the OpenSearch Dashboards advanced settings API.

Let’s walk through configuring the time zone using curl.

  1. First, you need to authenticate to the API endpoint with your user name and password, and retrieve the authorization cookies into the file auth.txt:
curl -X POST  https://<domain_endpoint>/_dashboards/auth/login \
-H "osd-xsrf: true" \
-H "content-type:application/json" \
-d '{"username":"<username>", "password":"<password>"}' \
-c auth.txt

In this example, we configure OpenSearch Dashboards to use the internal user database, and the user inherits administrative permissions under the global tenant. In multi-tenant environments, the user is required to have relevant tenant permissions. You can see an example of this in the next section, where we illustrate a multi-tenant environment. Access control in OpenSearch Dashboards is a broad and important topic, and it would be unfair to try to squeeze all of it in this post. Therefore, we don’t cover access control in depth here. For additional information on access control in multi-tenant OpenSearch Dashboards, refer to OpenSearch Dashboards multi-tenancy.

The auth.txt file holds authorization cookies that you use to pass configuration changes to the API endpoint. The auth.txt file should look similar to the following code:

# Netscape HTTP Cookie File
# https://curl.haxx.se/docs/http-cookies.html
# This file was generated by libcurl! Edit at your own risk.

#HttpOnly_<domain_endpoint> FALSE   /_dashboards    TRUE    0       security_authentication Fe26.2**80fca234dd0974fb6dfe9427e6b8362ba1dd78fc5a71
e7f9803694f40980012b*k9QboTT5A24hs71_wN32Cw*9-RvY2UhS-Cmat4RZPHohTbczyGRjmHezlIlhwePG1gv_P2bgSuZhx9XBV9I-zzdxrZIbJTTpymy4mv1rAB_GRuXjt-6ITUfsG58GrI7TI7D3pWKaw8n6lrhamccGYqL9K_dQrE4kr_godwEDLydR1d_
Oc11jEG98yi_O0qhBTu1kDNzNAEqgXEoaLS--afnbwPS0zvqUc4MUgrfGQOTt7mUoWMC778Tpii4V4gxhAcRqe_KoYQG1LhUq-j9XTHCouzB4qTJ8gR3tlbVYMFwhA**f278b1c9f2c9e4f50924c47bfd1a992234400c6f11ee6f005beecc4201760998*3Aj8gQAIKKPoUR0PX-5doFgZ9zqxlcB3YbfDgJIBNLU
  1. Construct configuration changes within the curl body and submit them using an authorization cookie. In this example, we included a sample to modify the time zone to US/Eastern.
curl -X PUT https://<domain_endpoint>/_dashboards/api/saved_objects/config/1.0.0-SNAPSHOT \
-H "osd-xsrf:true" \
-H "content-type:application/json" \
-d '{"attributes":{"dateFormat:tz":"US/Eastern"}}' \
-b auth.txt

By default, the constructed API modifies the configuration in the private tenant, which is exclusive to each user, can’t be shared, and is ideal for testing. We provide instructions to modify configuration in multi-tenant environments later in the post.

Your API call should receive a response similar to the following code, indicating the changes you submitted:

{"id":"1.0.0-SNAPSHOT","type":"config","updated_at":"2021-09-06T19:59:42.425Z","version":"WzcsMV0=","namespaces":["default"],"attributes":{"dateFormat:tz":"US/Eastern"}}

If you prefer to make multiple changes, you can construct the API call as follows:

curl -X PUT https://<domain_endpoint>/_dashboards/api/saved_objects/config/1.0.0-SNAPSHOT \
-H "osd-xsrf:true" \
-H "content-type:application/json" \
-d \
'{
    "attributes":{
      "dateFormat:tz":"US/Eastern",
      "dateFormat:dow":"Monday"
    }
 }' \
-b auth.txt

To retrieve the latest configuration changes, construct a GET request as follows:

curl -X GET https://<domain_endpoint>/_dashboards/api/saved_objects/config/1.0.0-SNAPSHOT \
-H "osd-xsrf:true" \
-H "content-type:application/json" \
-b auth.txt

Configure advanced settings with the OpenSearch Dashboards API in multi-tenant environments

Tenants in OpenSearch Dashboards are commonly used to share custom index patterns, visualizations, dashboards, and other OpenSearch objects with different teams or organizations.

The OpenSearch Dashboards API provides the ability to modify advanced settings in different tenants. In the previous section, we covered making advanced configuration changes for a private tenant. We now walk through a similar scenario for multiple tenants.

  1. First, you need to authenticate to the API endpoint and retrieve the authorization cookies into the file auth.txt. You can construct this request in the same way you would in a single-tenant environment as described in the previous section.

In multi-tenant environments, make sure you configure the user’s role with relevant tenant permissions. One pattern is to associate the user to the kibana_user and a custom group that has tenant permissions. In our example, we associated the tenant admin user tenant-a_admin_user to the two roles as shown in the following code: the kibana_user system role and a custom tenant-a_admin_role that includes tenant permissions.

GET _plugins/_security/api/account
{
  "user_name" : "tenant-a_admin_user",
  "is_reserved" : false,
  "is_hidden" : false,
  "is_internal_user" : true,
  "user_requested_tenant" : "tenant-a",
  "backend_roles" : [
    ""
  ],
  "custom_attribute_names" : [ ],
  "tenants" : {
    "global_tenant" : true,
    "tenant-a_admin_user" : true,
    "tenant-a" : true
  },
  "roles" : [
    "tenant-a_admin_role",
    "kibana_user"
  ]
}


GET _plugins/_security/api/roles/tenant-a_admin_role
{
  "tenant-a_admin_role" : {
    "reserved" : false,
    "hidden" : false,
    "cluster_permissions" : [ ],
    "index_permissions" : [ ],
    "tenant_permissions" : [
      {
        "tenant_patterns" : [
          "tenant-a"
        ],
        "allowed_actions" : [
          "kibana_all_write"
        ]
      }
    ],
    "static" : false
  }
}

After authenticating to the OpenSearch Dashboards API, the auth.txt file holds authorization cookies that you use to pass configuration changes to the API endpoint. The content of the auth.txt file should be similar to the one we illustrated in the previous section.

  1. Construct the configuration changes by adding a securitytenant header. In this example, we modify the time zone and day of week in tenant-a:
curl -X PUT https://<domain_endpoint>/_dashboards/api/saved_objects/config/1.0.0-SNAPSHOT \
-H "osd-xsrf:true" \
-H "content-type:application/json" \
-H "securitytenant: tenant-a" \
-d \
'{
    "attributes":{
     "dateFormat:tz":"US/Eastern",
     "dateFormat:dow":"Monday"
    }
 }' \
-b auth.txt

The OpenSearch Dashboards API endpoint returns a response similar to the following:

{"id":"1.0.0-SNAPSHOT","type":"config","updated_at":"2021-10-10T17:41:47.249Z","version":"WzEsMV0=","namespaces":["default"],"attributes":{"dateFormat:tz":"US/Eastern","dateFormat:dow":"Monday"}}

You could also verify the configuration changes in the OpenSearch Dashboards UI, as shown in the following screenshot.

Conclusion

In this post, you used the Amazon OpenSearch Service Dashboards UI and API to configure advanced settings for a single-tenant and multi-tenant environment. Implementing OpenSearch Dashboards at scale in multi-tenant environments requires more efficient methods than simply using the UI. This is especially important in environments where you serve centralized logging and monitoring domains for different teams. You can use the OpenSearch Dashboards APIs we illustrated in this post and bake your advanced setting configurations into your infrastructure code to accelerate your deployments!

Let us know about your questions and other topics you’d like us to cover in the comment section.


About the Authors

Prashant Agrawal is a Specialist Solutions Architect at Amazon Web Services based in Seattle, WA.. Prashant works closely with Amazon OpenSearch team, helping customers migrate their workloads to the AWS Cloud. Before joining AWS, Prashant helped various customers use Elasticsearch for their search and analytics use cases.

Evren Sen is a Solutions Architect at AWS, focusing on strategic financial services customers. He helps his customers create Cloud Center of Excellence and design, and deploy solutions on the AWS Cloud. Outside of AWS, Evren enjoys spending time with family and friends, traveling, and cycling.

Masking field values with Amazon Elasticsearch Service

Post Syndicated from Prashant Agrawal original https://aws.amazon.com/blogs/security/masking-field-values-with-amazon-elasticsearch-service/

Amazon Elasticsearch Service (Amazon ES) is a fully managed service that you can use to deploy, secure, and run Elasticsearch cost-effectively at scale. The service provides support for open-source Elasticsearch APIs, managed Kibana, and integration with Logstash and other AWS services. Amazon ES provides a deep security model that spans many layers of interaction and supports fine-grained access control at the cluster, index, document, and field level, on a per-user basis. The service’s security plugin integrates with federated identity providers for Kibana login.

A common use case for Amazon ES is log analytics. Customers configure their applications to store log data to the Elasticsearch cluster, where the data can be queried for insights into the functionality and use of the applications over time. In many cases, users reviewing those insights should not have access to all the details from the log data. The log data for a web application, for example, might include the source IP addresses of incoming requests. Privacy rules in many countries require that those details be masked, wholly or in part. This post explains how to set up field masking within your Amazon ES domain.

Field masking is an alternative to field-level security that lets you anonymize the data in a field rather than remove it altogether. When creating a role, add a list of fields to mask. Field masking affects whether you can see the contents of a field when you search. You can use field masking to either perform a random hash or pattern-based substitution of sensitive information from users, who shouldn’t have access to that information.

When you use field masking, Amazon ES creates a hash of the actual field values before returning the search results. You can apply field masking on a per-role basis, supporting different levels of visibility depending on the identity of the user making the query. Currently, field masking is only available for string-based fields. A search result with a masked field (clientIP) looks like this:

{
  "_index": "web_logs",
  "_type": "_doc",
  "_id": "1",
  "_score": 1,
  "_source": {
    "agent": "Mozilla/5.0 (X11; Linux x86_64; rv:6.0a1) Gecko/20110421 Firefox/6.0a1",
    "bytes": 0,
    "clientIP": "7e4df8d4df7086ee9c05efe1e21cce8ff017a711ee9addf1155608ca45d38219",
    "host": "www.example.com",
    "extension": "txt",
    "geo": {
      "src": "EG",
      "dest": "CN",
      "coordinates": {
        "lat": 35.98531194,
        "lon": -85.80931806
      }
    },
    "machine": {
      "ram": 17179869184,
      "os": "win 7"
    }
  }
}

To follow along in this post, make sure you have an Amazon ES domain with Elasticsearch version 6.7 or higher, sample data loaded (this example uses the web logs data supplied by Kibana), and access to Kibana through a role with administrator privileges for the domain.

Configure field masking

Field masking is managed by defining specific access controls within the Kibana visualization system. You’ll need to create a new Kibana role, define the fine-grained access-control privileges for that role, specify which fields to mask, and apply that role to specific users.

You can use either the Kibana console or direct-to-API calls to set up field masking. In our first example, we’ll use the Kibana console.

To configure field masking in the Kibana console

  1. Log in to Kibana, choose the Security pane, and then choose Roles, as shown in Figure 1.

    Figure 1: Choose security roles

    Figure 1: Choose security roles

  2. Choose the plus sign (+) to create a new role, as shown in Figure 2.

    Figure 2: Create role

    Figure 2: Create role

  3. Choose the Index Permissions tab, and then choose Add index permissions, as shown in Figure 3.

    Figure 3: Set index permissions

    Figure 3: Set index permissions

  4. Add index patterns and appropriate permissions for data access. See the Amazon ES documentation for details on configuring fine-grained access control.
  5. Once you’ve set Index Patterns, Permissions: Action Groups, Document Level Security Query, and Include or exclude fields, you can use the Anonymize fields entry to mask the clientIP, as shown in Figure 4.

    Figure 4: Anonymize field

    Figure 4: Anonymize field

  6. Choose Save Role Definition.
  7. Next, you need to create one or more users and apply the role to the new users. Go back to the Security page and choose Internal User Database, as shown in Figure 5.

    Figure 5: Select Internal User Database

    Figure 5: Select Internal User Database

  8. Choose the plus sign (+) to create a new user, as shown in Figure 6.

    Figure 6: Create user

    Figure 6: Create user

  9. Add a username and password, and under Open Distro Security Roles, select the role es-mask-role, as shown in Figure 7.

    Figure 7: Select the username, password, and roles

    Figure 7: Select the username, password, and roles

  10. Choose Submit.

If you prefer, you can perform the same task by using the Amazon ES REST API using Kibana dev tools.

Use the following API to create a role as described in below snippet and shown in Figure 8.

PUT _opendistro/_security/api/roles/es-mask-role
{
  "cluster_permissions": [],
  "index_permissions": [
    {
      "index_patterns": [
        "web_logs"
      ],
      "dls": "",
      "fls": [],
      "masked_fields": [
        "clientIP"
      ],
      "allowed_actions": [
        "data_access"
      ]
    }
  ]
}

Sample response:

{
  "status": "CREATED",
  "message": "'es-mask-role' created."
}
Figure 8: API to create Role

Figure 8: API to create Role

Use the following API to create a user with the role as described in below snippet and shown in Figure 9.

PUT _opendistro/_security/api/internalusers/es-mask-user
{
  "password": "xxxxxxxxxxx",
  "opendistro_security_roles": [
    "es-mask-role"
  ]
}

Sample response:

{
  "status": "CREATED",
  "message": "'es-mask-user' created."
}
Figure 9: API to create User

Figure 9: API to create User

Verify field masking

You can verify field masking by running a simple search query using Kibana dev tools (GET web_logs/_search) and retrieving the data first by using the kibana_user (with no field masking), and then by using the es-mask-user (with field masking) you just created.

Query responses run by the kibana_user (all access) have the original values in all fields, as shown in Figure 10.

Figure 10: Retrieval of the full clientIP data with kibana_user

Figure 10: Retrieval of the full clientIP data with kibana_user

Figure 11, following, shows an example of what you would see if you logged in as the es-mask-user. In this case, the clientIP field is hidden due to the es-mask-role you created.

Figure 11: Retrieval of the masked clientIP data with es-mask-user

Figure 11: Retrieval of the masked clientIP data with es-mask-user

Use pattern-based field masking

Rather than creating a hash, you can use one or more regular expressions and replacement strings to mask a field. The syntax is <field>::/<regular-expression>/::<replacement-string>.

You can use either the Kibana console or direct-to-API calls to set up pattern-based field masking. In the following example, clientIP is masked in such a way that the last three parts of the IP address are masked by xxx using the pattern is clientIP::/[0-9]{1,3}.[0-9]{1,3}.[0-9]{1,3}$/::xxx.xxx.xxx>. You see only the first part of the IP address, as shown in Figure 12.

Figure 12: Anonymize the field with a pattern

Figure 12: Anonymize the field with a pattern

Run the search query to verify that the last three parts of clientIP are masked by custom characters and only the first part is shown to the requester, as shown in Figure 13.

Figure 13: Retrieval of the masked clientIP (according to the defined pattern) with es-mask-user

Figure 13: Retrieval of the masked clientIP (according to the defined pattern) with es-mask-user

Conclusion

Field level security should be the primary approach for ensuring data access security – however if there are specific business requirements that cannot be met with this approach, then field masking may offer a viable alternative. By using field masking, you can selectively allow or prevent your users from seeing private information such as personally identifying information (PII) or personal healthcare information (PHI). For more information about fine-grained access control, see the Amazon Elasticsearch Service Developer Guide.

If you have feedback about this post, submit comments in the Comments section below. If you have questions about this post, start a new thread on the Amazon Elasticsearch Service forum or contact AWS Support.

Want more AWS Security how-to content, news, and feature announcements? Follow us on Twitter.

Author

Prashant Agrawal

Prashant is a Search Specialist Solutions Architect with Amazon Elasticsearch Service. He works closely with team members to help customers migrate their workloads to the cloud. Before joining AWS, he helped various customers use Elasticsearch for their search and analytics use cases.