Post Syndicated from Prashant Agrawal original https://aws.amazon.com/blogs/security/masking-field-values-with-amazon-elasticsearch-service/
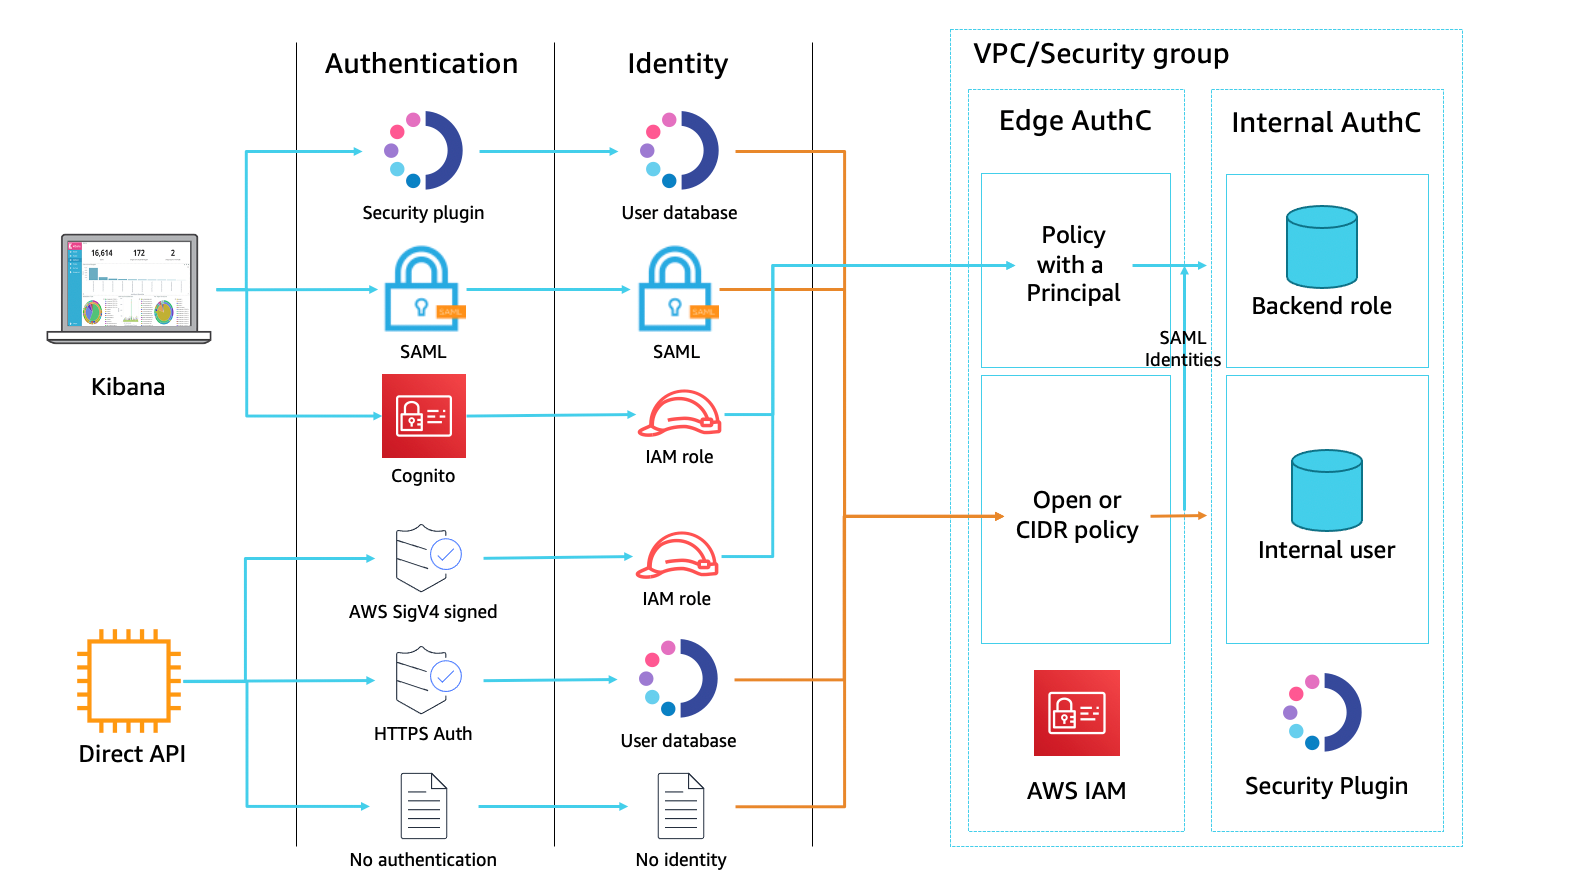
Amazon Elasticsearch Service (Amazon ES) is a fully managed service that you can use to deploy, secure, and run Elasticsearch cost-effectively at scale. The service provides support for open-source Elasticsearch APIs, managed Kibana, and integration with Logstash and other AWS services. Amazon ES provides a deep security model that spans many layers of interaction and supports fine-grained access control at the cluster, index, document, and field level, on a per-user basis. The service’s security plugin integrates with federated identity providers for Kibana login.
A common use case for Amazon ES is log analytics. Customers configure their applications to store log data to the Elasticsearch cluster, where the data can be queried for insights into the functionality and use of the applications over time. In many cases, users reviewing those insights should not have access to all the details from the log data. The log data for a web application, for example, might include the source IP addresses of incoming requests. Privacy rules in many countries require that those details be masked, wholly or in part. This post explains how to set up field masking within your Amazon ES domain.
Field masking is an alternative to field-level security that lets you anonymize the data in a field rather than remove it altogether. When creating a role, add a list of fields to mask. Field masking affects whether you can see the contents of a field when you search. You can use field masking to either perform a random hash or pattern-based substitution of sensitive information from users, who shouldn’t have access to that information.
When you use field masking, Amazon ES creates a hash of the actual field values before returning the search results. You can apply field masking on a per-role basis, supporting different levels of visibility depending on the identity of the user making the query. Currently, field masking is only available for string-based fields. A search result with a masked field (clientIP) looks like this:
To follow along in this post, make sure you have an Amazon ES domain with Elasticsearch version 6.7 or higher, sample data loaded (this example uses the web logs data supplied by Kibana), and access to Kibana through a role with administrator privileges for the domain.
Configure field masking
Field masking is managed by defining specific access controls within the Kibana visualization system. You’ll need to create a new Kibana role, define the fine-grained access-control privileges for that role, specify which fields to mask, and apply that role to specific users.
You can use either the Kibana console or direct-to-API calls to set up field masking. In our first example, we’ll use the Kibana console.
To configure field masking in the Kibana console
- Log in to Kibana, choose the Security pane, and then choose Roles, as shown in Figure 1.

Figure 1: Choose security roles
- Choose the plus sign (+) to create a new role, as shown in Figure 2.

Figure 2: Create role
- Choose the Index Permissions tab, and then choose Add index permissions, as shown in Figure 3.

Figure 3: Set index permissions
- Add index patterns and appropriate permissions for data access. See the Amazon ES documentation for details on configuring fine-grained access control.
- Once you’ve set Index Patterns, Permissions: Action Groups, Document Level Security Query, and Include or exclude fields, you can use the Anonymize fields entry to mask the clientIP, as shown in Figure 4.

Figure 4: Anonymize field
- Choose Save Role Definition.
- Next, you need to create one or more users and apply the role to the new users. Go back to the Security page and choose Internal User Database, as shown in Figure 5.

Figure 5: Select Internal User Database
- Choose the plus sign (+) to create a new user, as shown in Figure 6.

Figure 6: Create user
- Add a username and password, and under Open Distro Security Roles, select the role es-mask-role, as shown in Figure 7.

Figure 7: Select the username, password, and roles
- Choose Submit.


If you prefer, you can perform the same task by using the Amazon ES REST API using Kibana dev tools.
Use the following API to create a role as described in below snippet and shown in Figure 8.
Sample response:
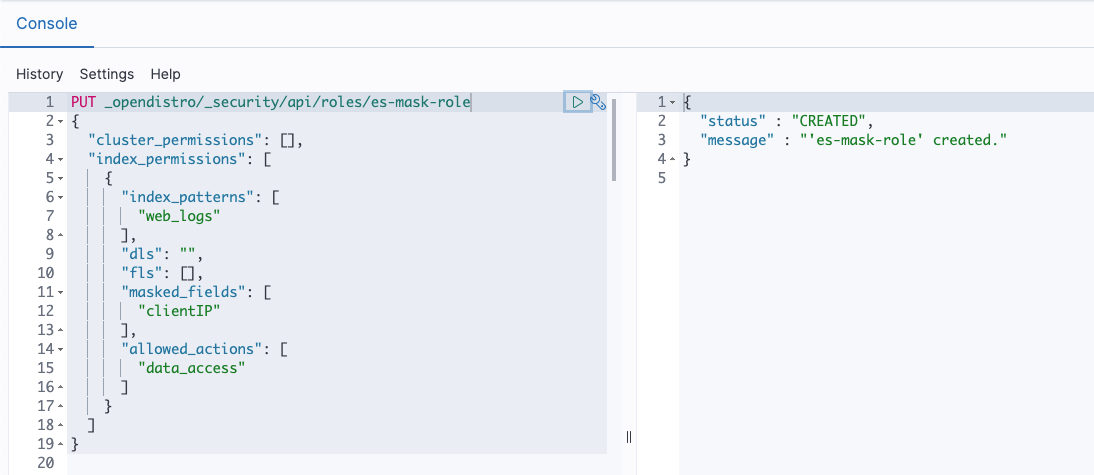
Figure 8: API to create Role
Use the following API to create a user with the role as described in below snippet and shown in Figure 9.
Sample response:
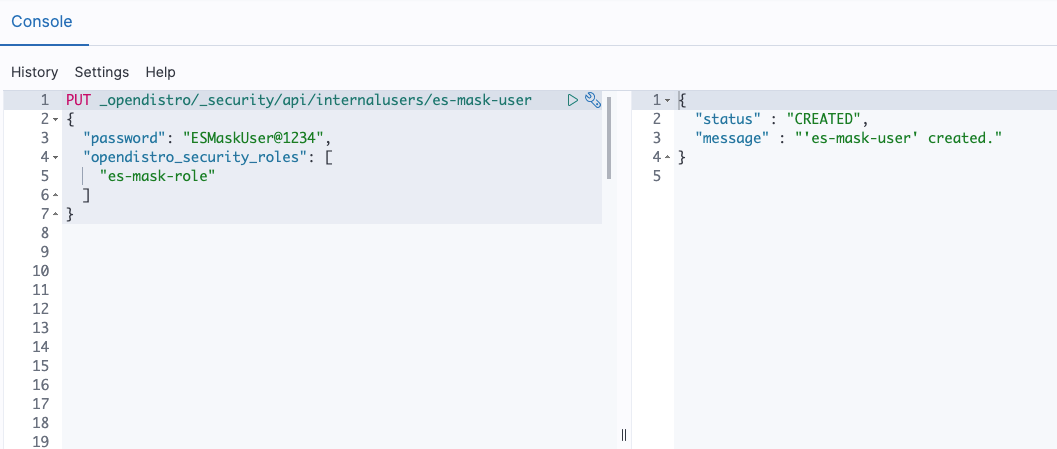
Figure 9: API to create User
Verify field masking
You can verify field masking by running a simple search query using Kibana dev tools (GET web_logs/_search) and retrieving the data first by using the kibana_user (with no field masking), and then by using the es-mask-user (with field masking) you just created.
Query responses run by the kibana_user (all access) have the original values in all fields, as shown in Figure 10.
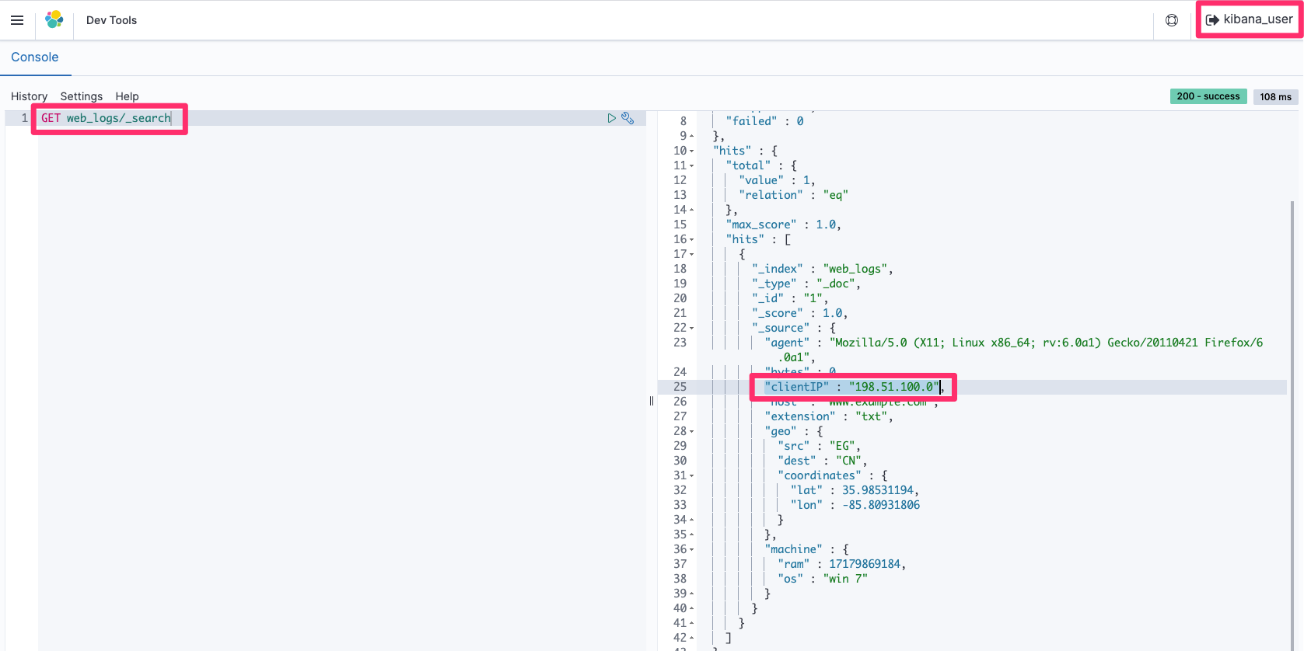
Figure 10: Retrieval of the full clientIP data with kibana_user
Figure 11, following, shows an example of what you would see if you logged in as the es-mask-user. In this case, the clientIP field is hidden due to the es-mask-role you created.
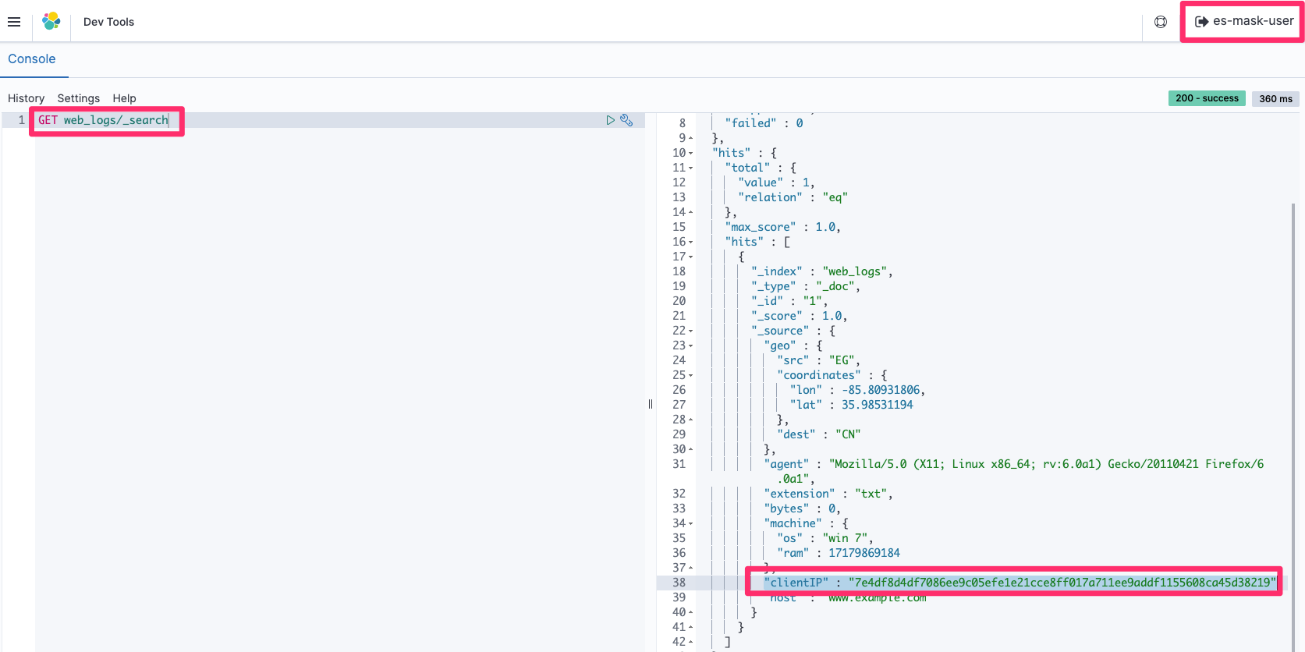
Figure 11: Retrieval of the masked clientIP data with es-mask-user
Use pattern-based field masking
Rather than creating a hash, you can use one or more regular expressions and replacement strings to mask a field. The syntax is <field>::/<regular-expression>/::<replacement-string>.
You can use either the Kibana console or direct-to-API calls to set up pattern-based field masking. In the following example, clientIP is masked in such a way that the last three parts of the IP address are masked by xxx using the pattern is clientIP::/[0-9]{1,3}.[0-9]{1,3}.[0-9]{1,3}$/::xxx.xxx.xxx>. You see only the first part of the IP address, as shown in Figure 12.
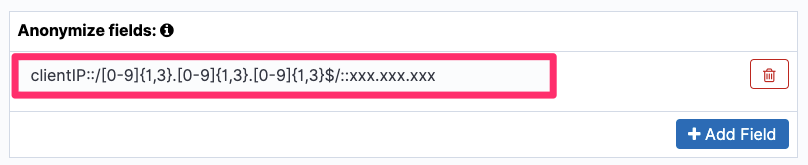
Figure 12: Anonymize the field with a pattern
Run the search query to verify that the last three parts of clientIP are masked by custom characters and only the first part is shown to the requester, as shown in Figure 13.
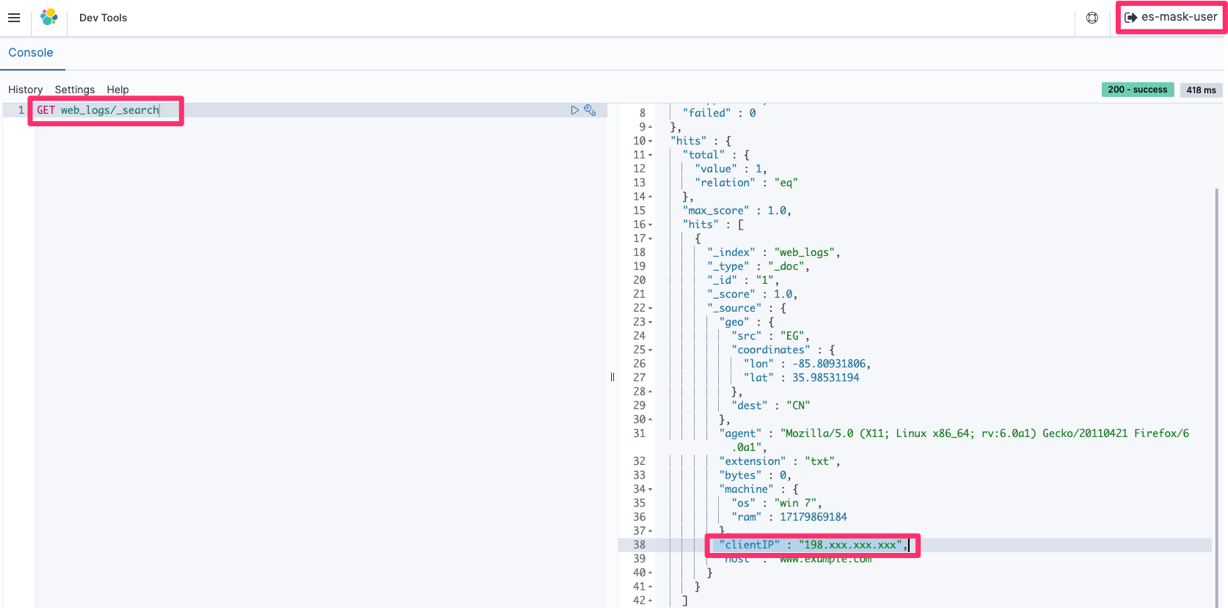
Figure 13: Retrieval of the masked clientIP (according to the defined pattern) with es-mask-user
Conclusion
Field level security should be the primary approach for ensuring data access security – however if there are specific business requirements that cannot be met with this approach, then field masking may offer a viable alternative. By using field masking, you can selectively allow or prevent your users from seeing private information such as personally identifying information (PII) or personal healthcare information (PHI). For more information about fine-grained access control, see the Amazon Elasticsearch Service Developer Guide.
If you have feedback about this post, submit comments in the Comments section below. If you have questions about this post, start a new thread on the Amazon Elasticsearch Service forum or contact AWS Support.
Want more AWS Security how-to content, news, and feature announcements? Follow us on Twitter.